
A Study of the CO Sensing Responses of Cu-, Pt- and Pd-Activated SnO2 Sensors: Effect of Precipitation Agents, Dopants and Doping Methods

 ,
,
Abstract
:
1. Introduction
2. Materials and Methods
2.1. Preparation of Former Pure SnO2 Powders Using Urea and Ammonia
2.2. Preparation of Chemical Doped SnO2 Powders
2.3. Preparation of Impregnated SnO2 Powders
2.4. Characterization
3. Results
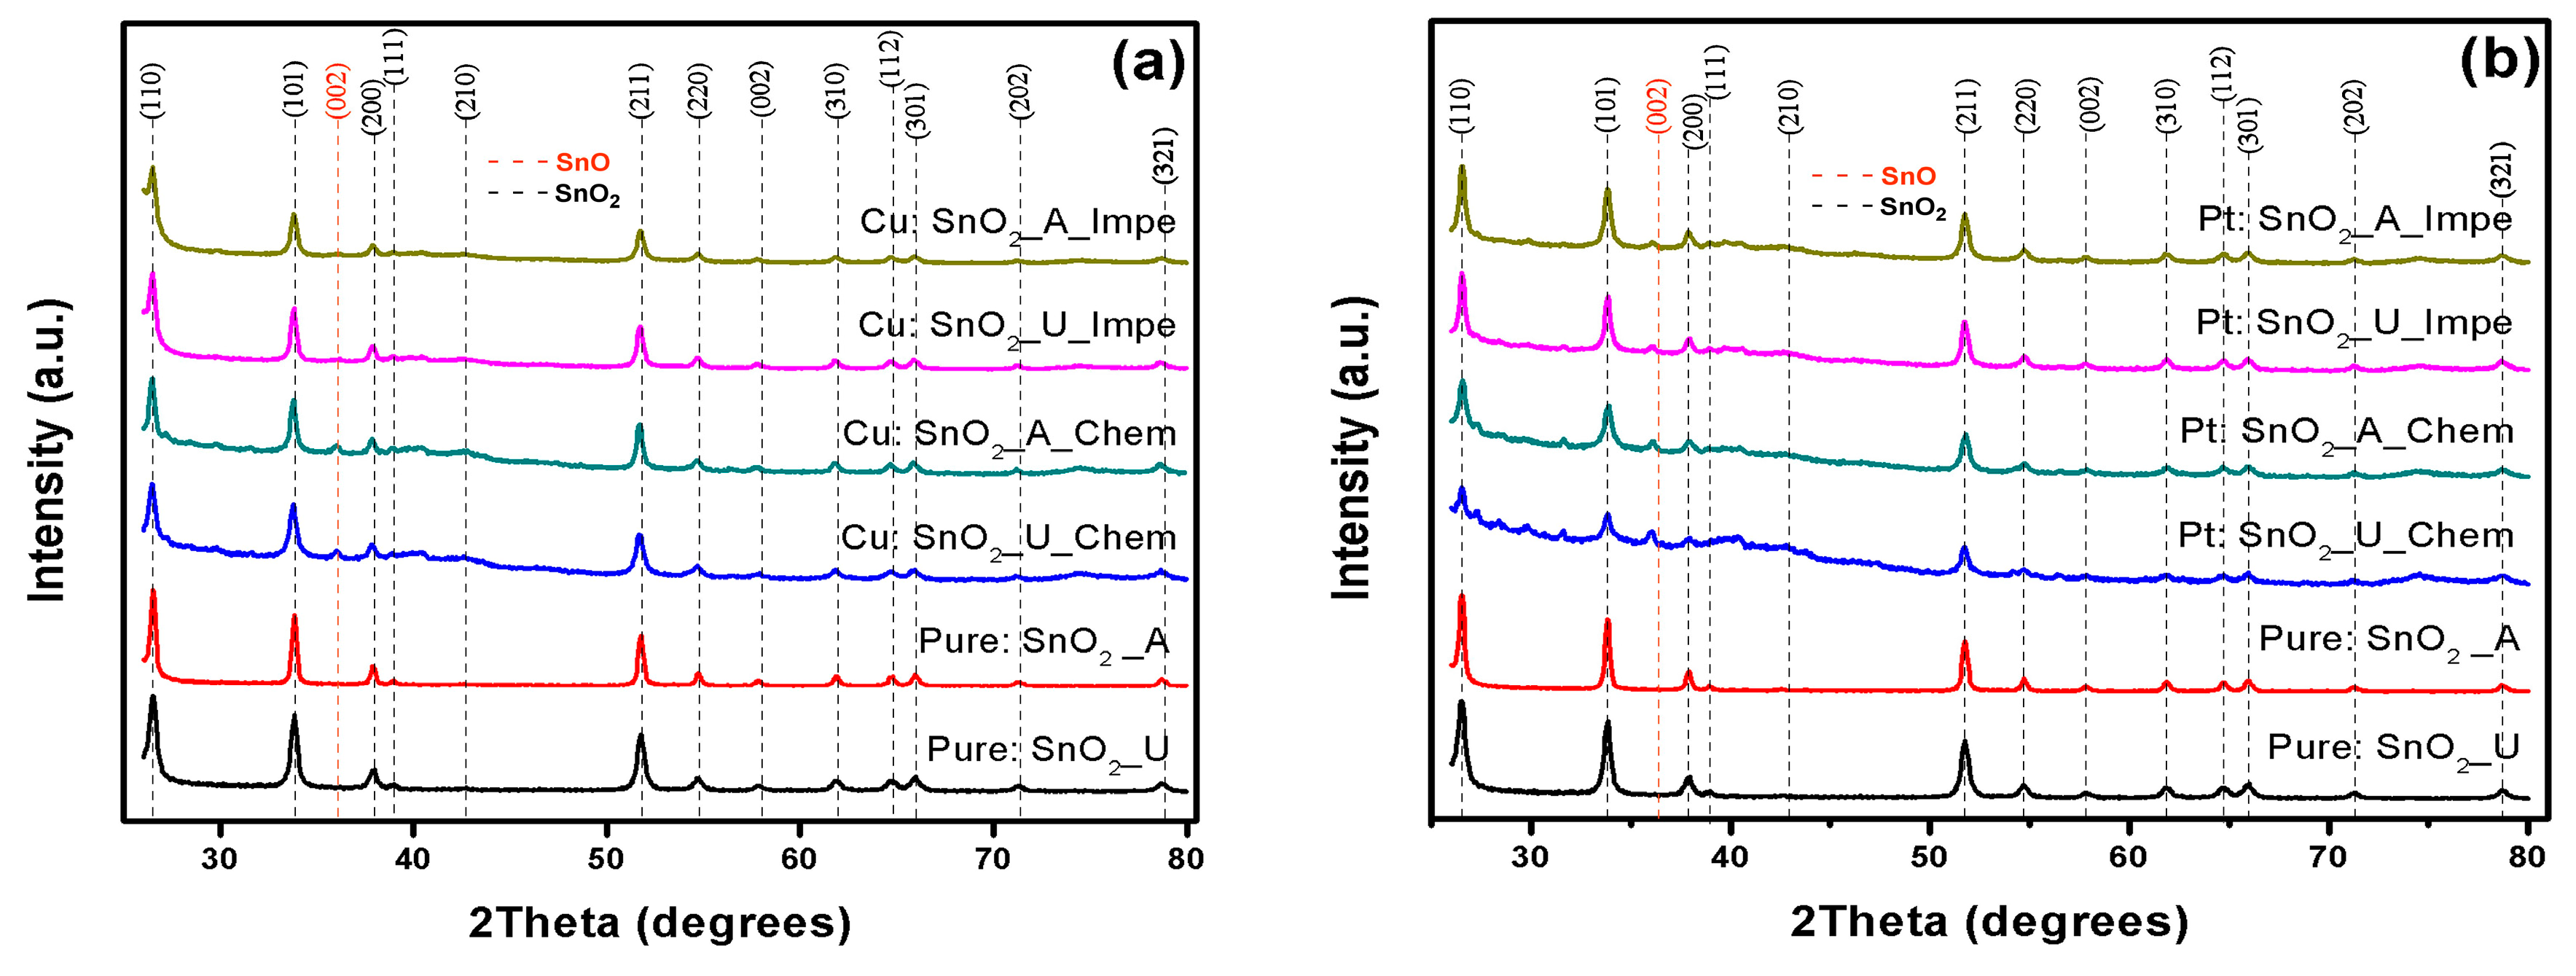
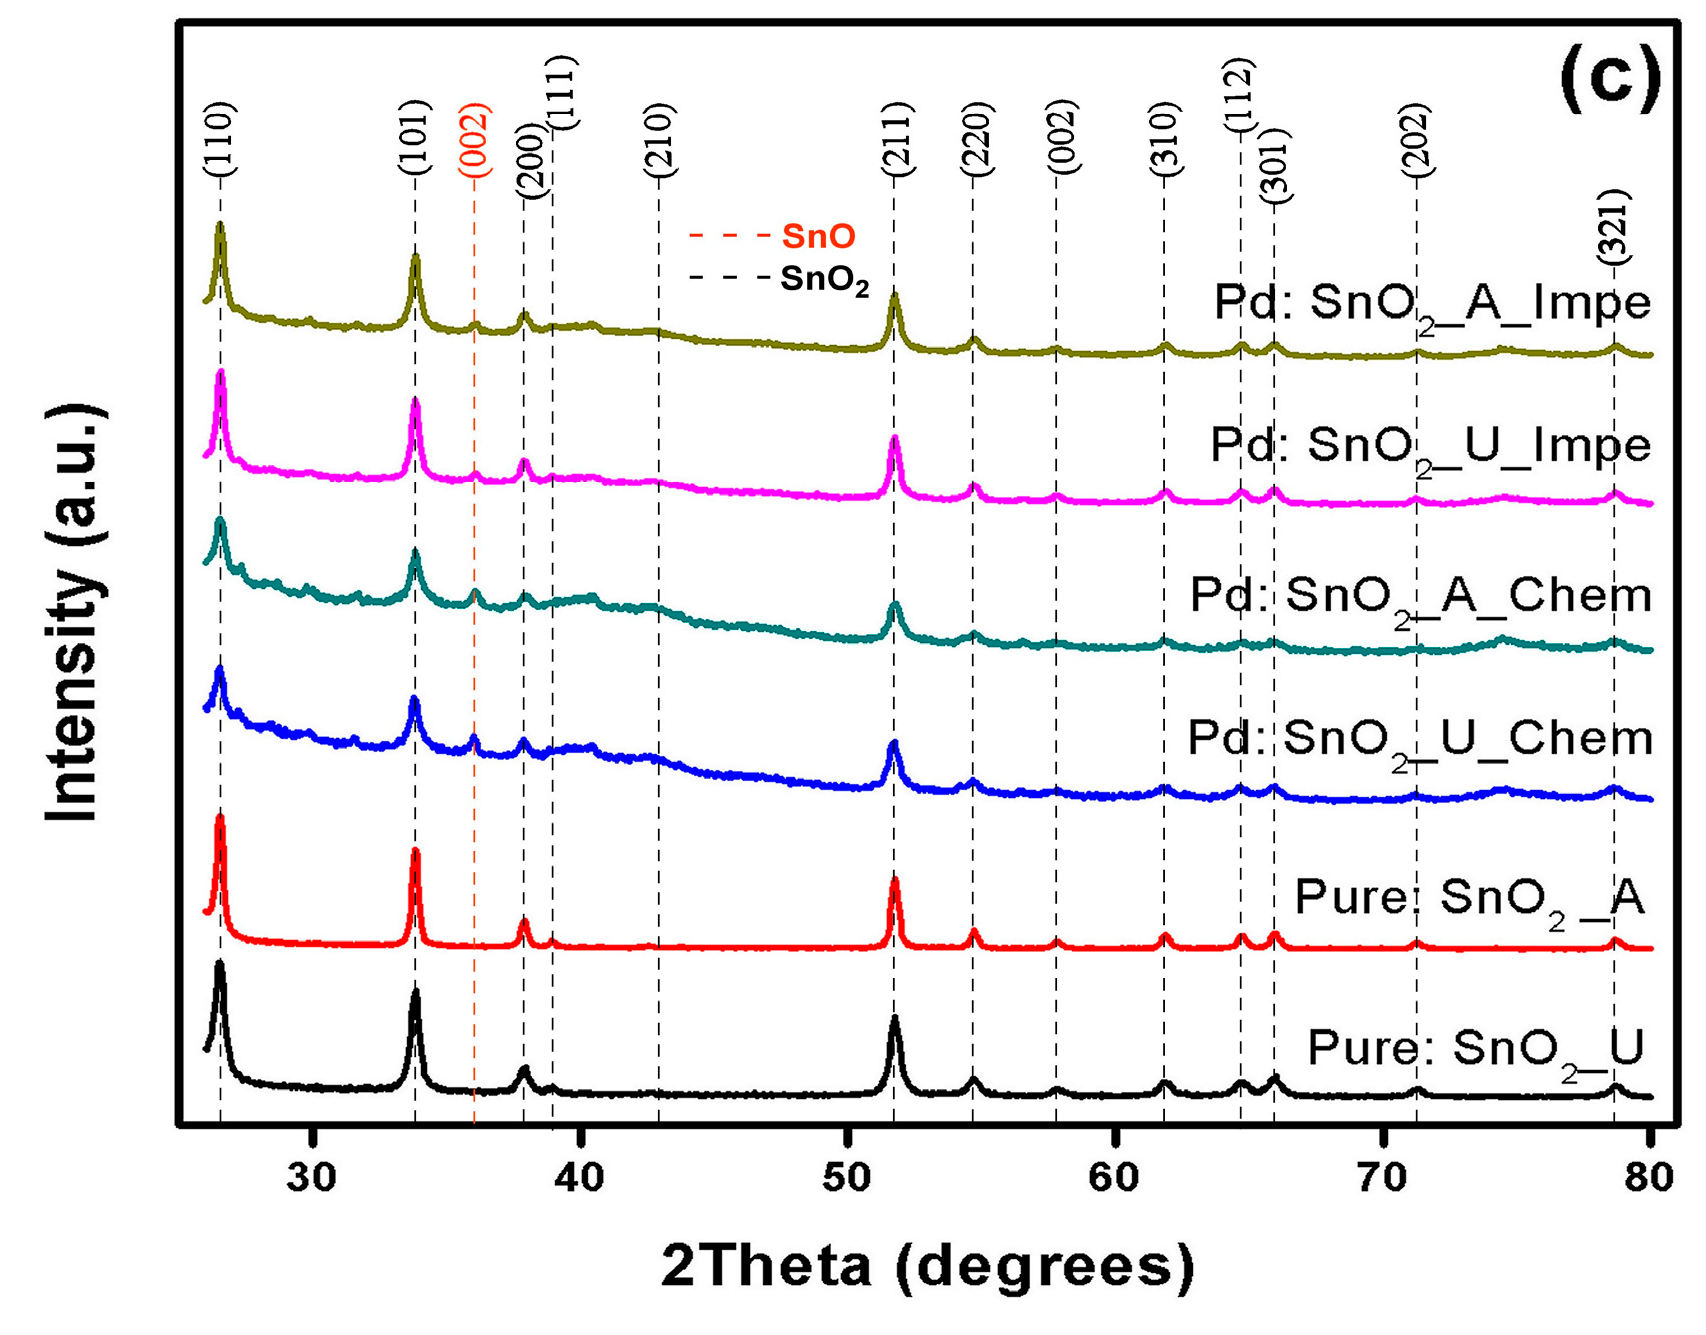
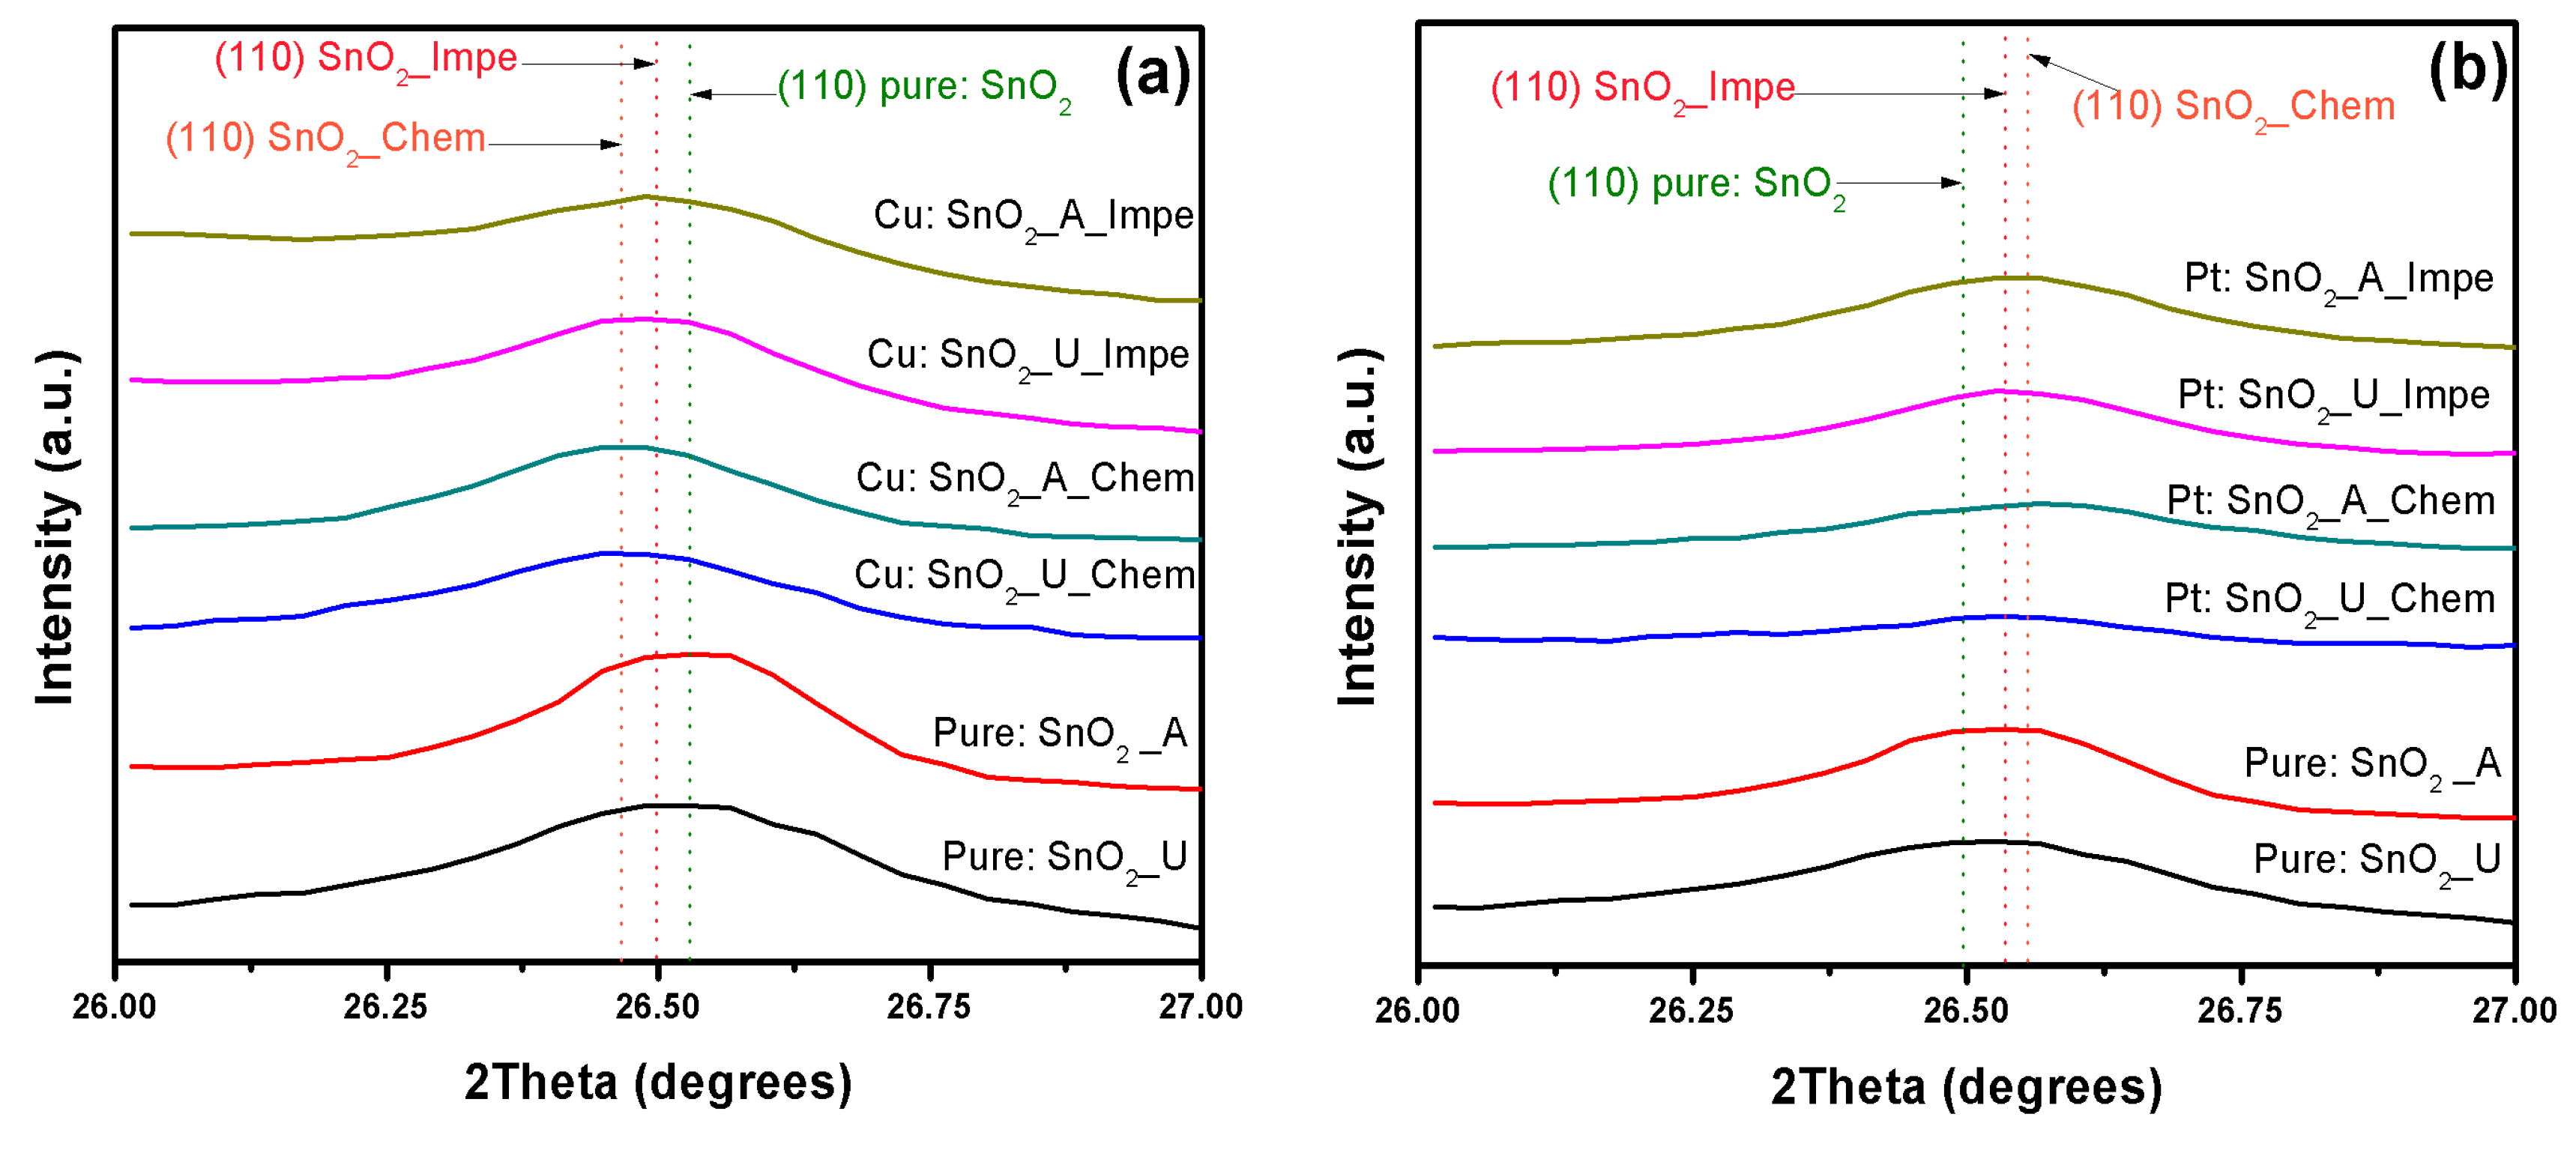
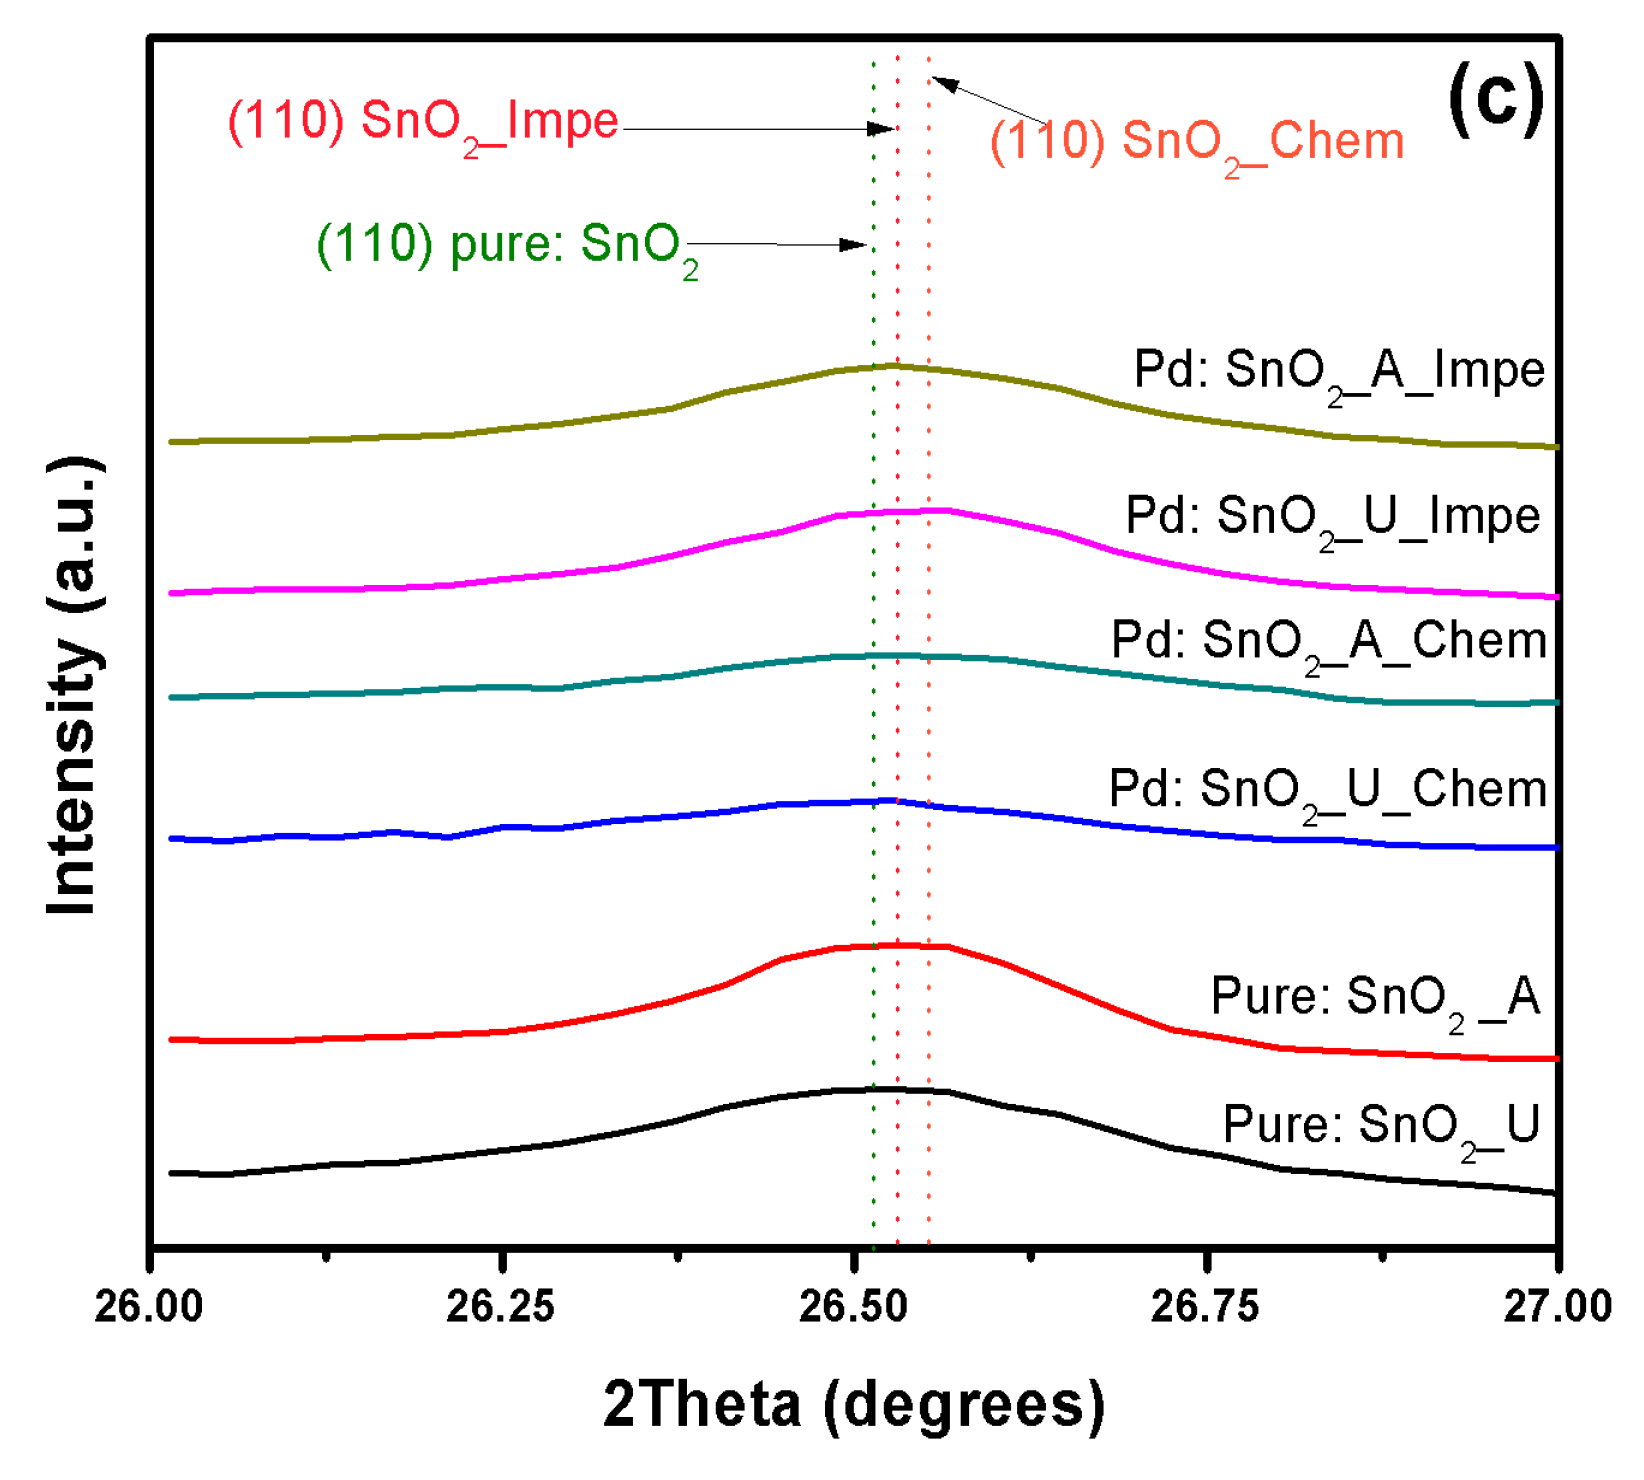
3.1. X-ray Diffraction Analysis
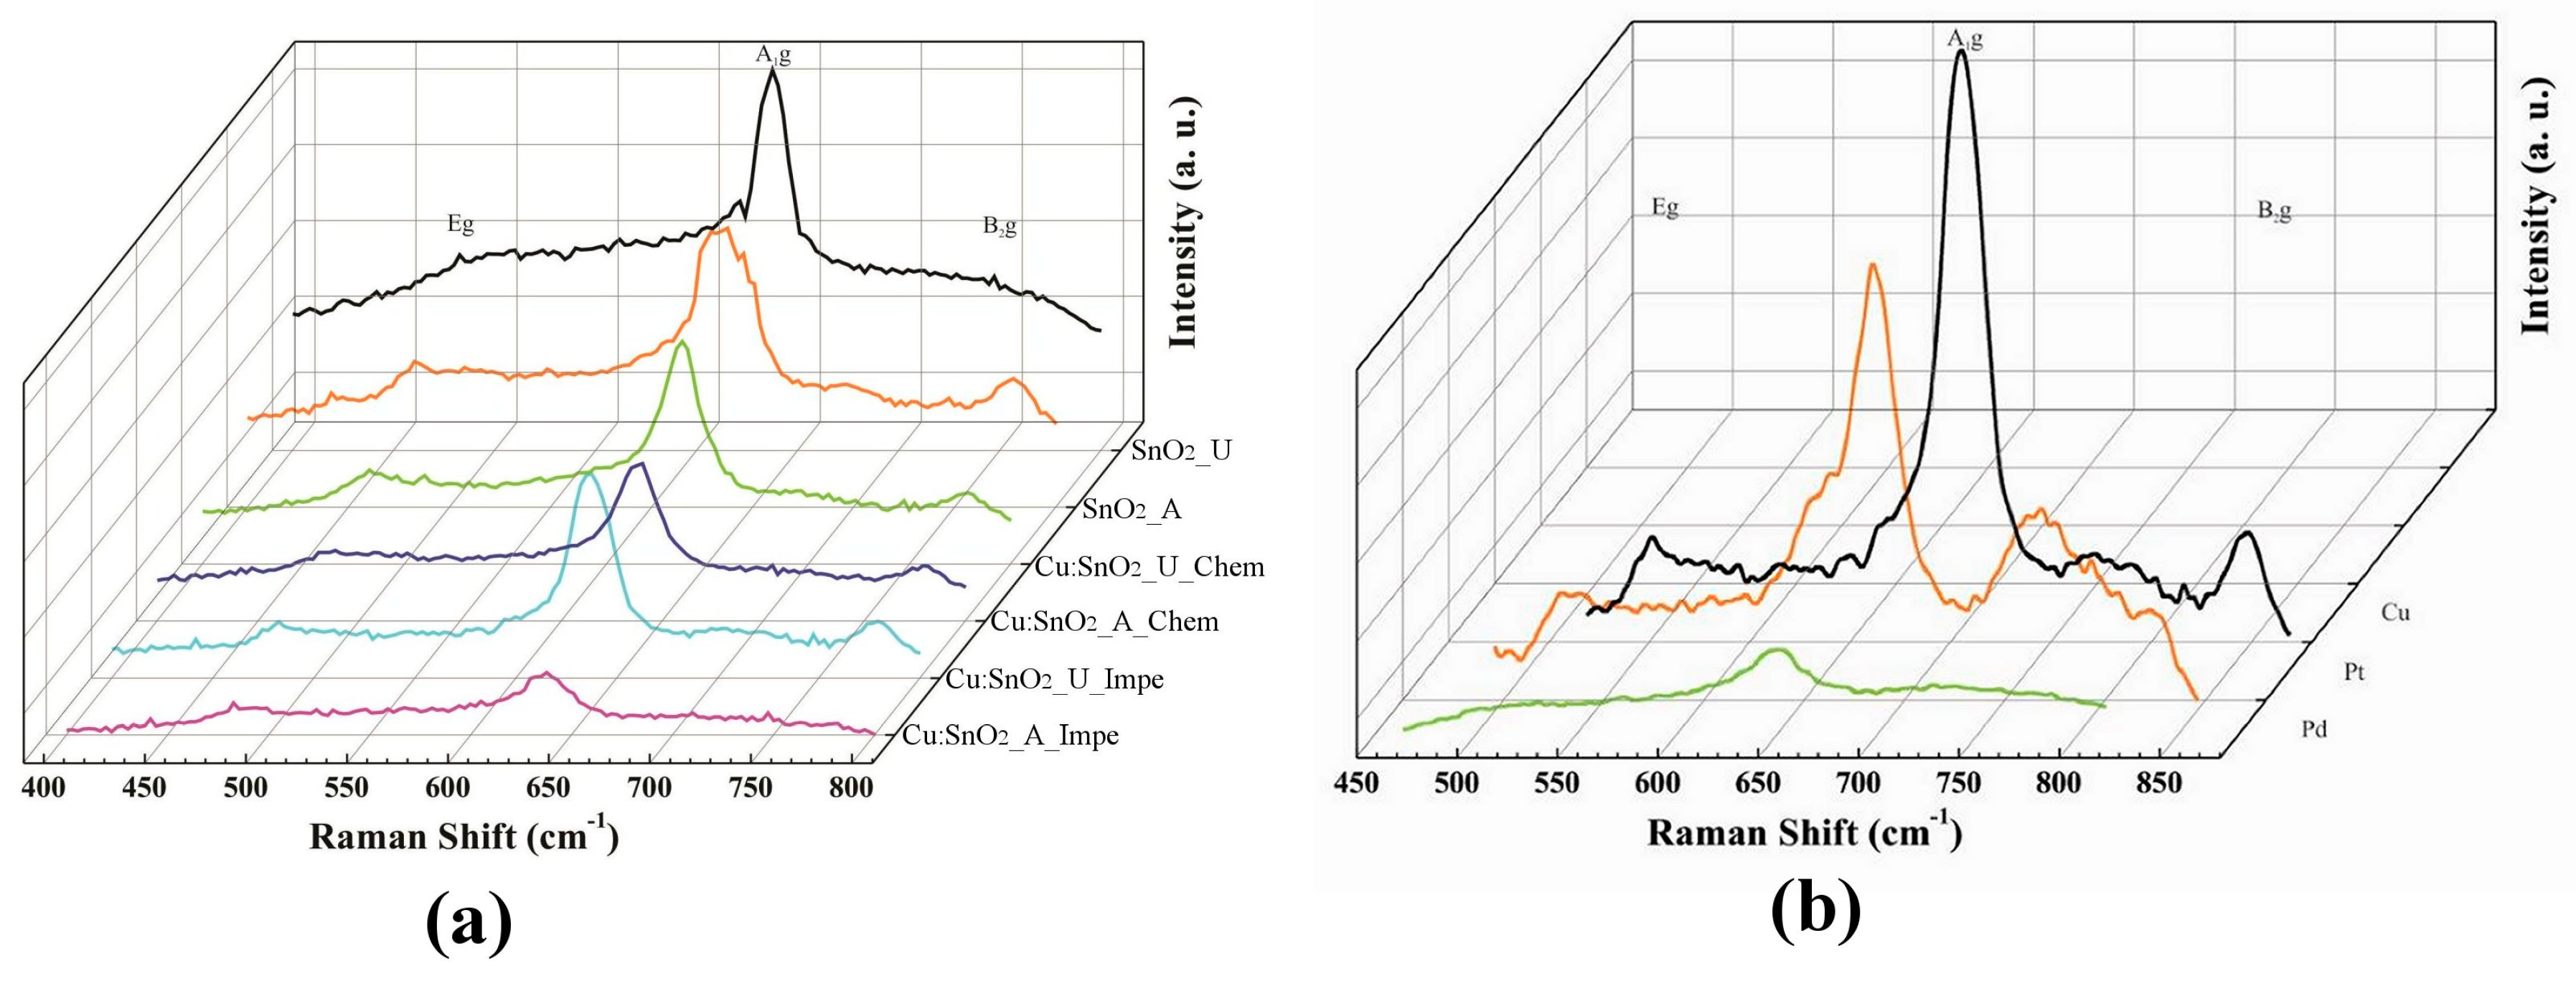
3.2. Raman Analysis
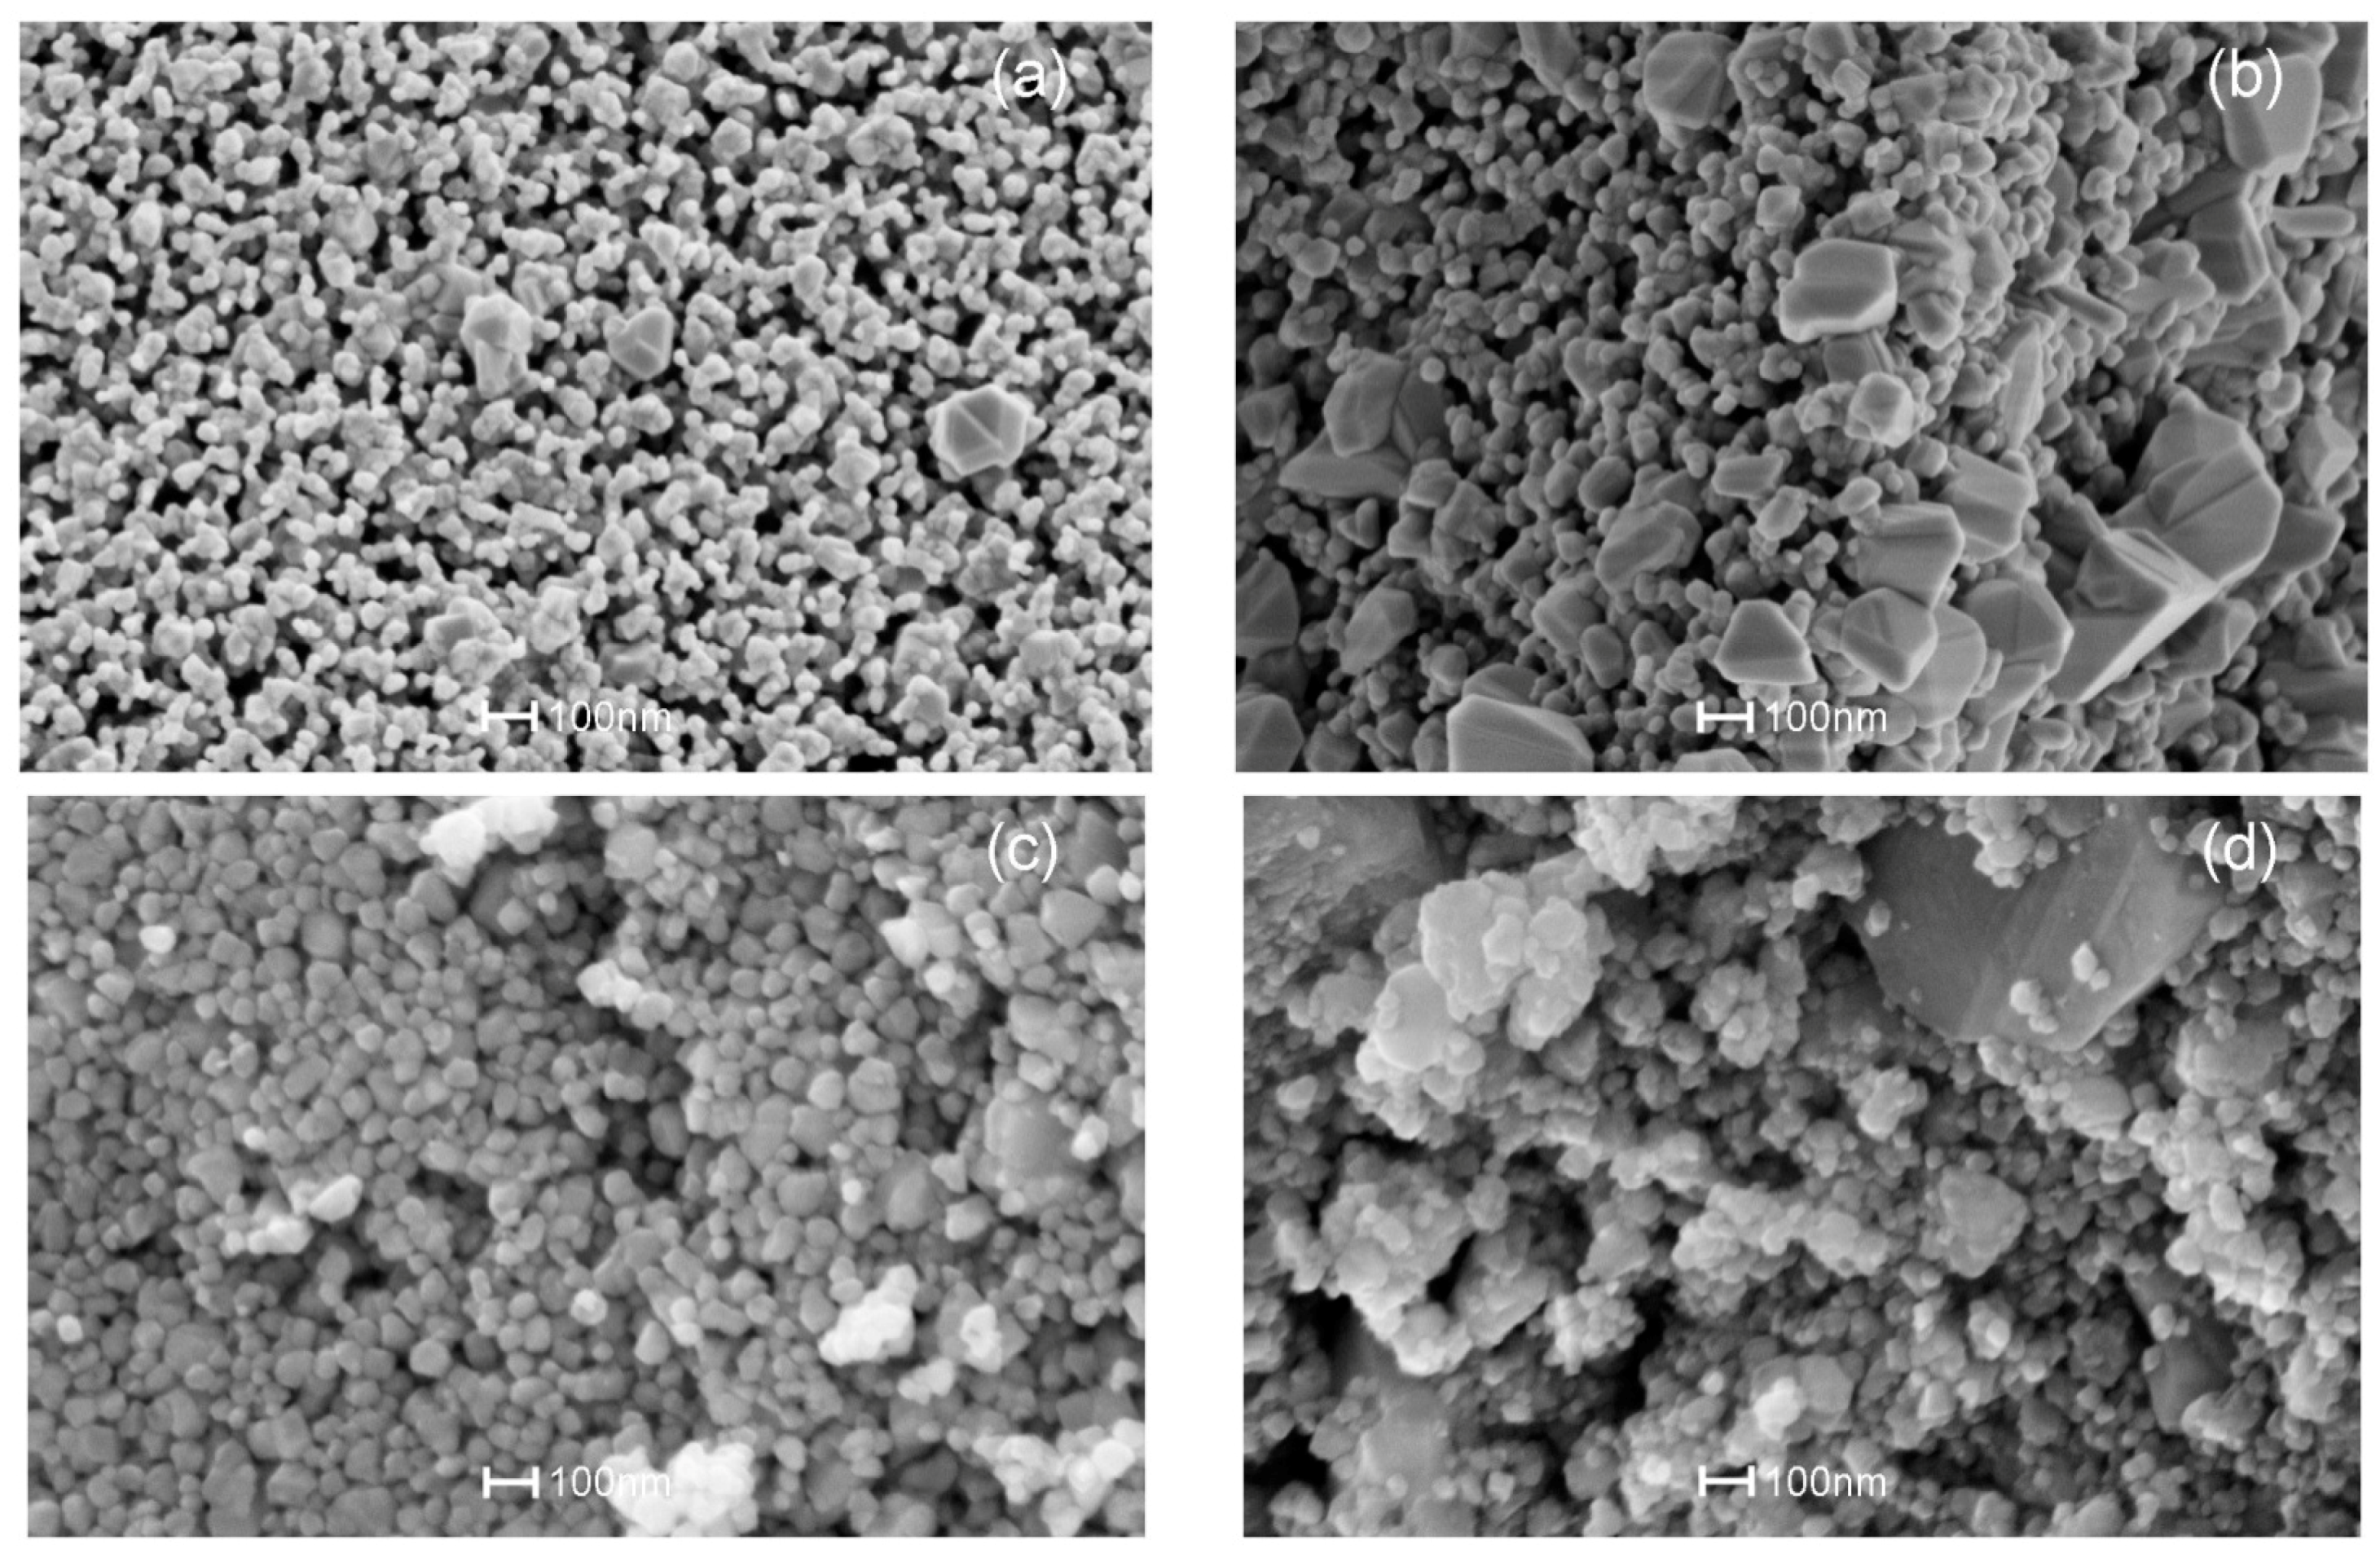
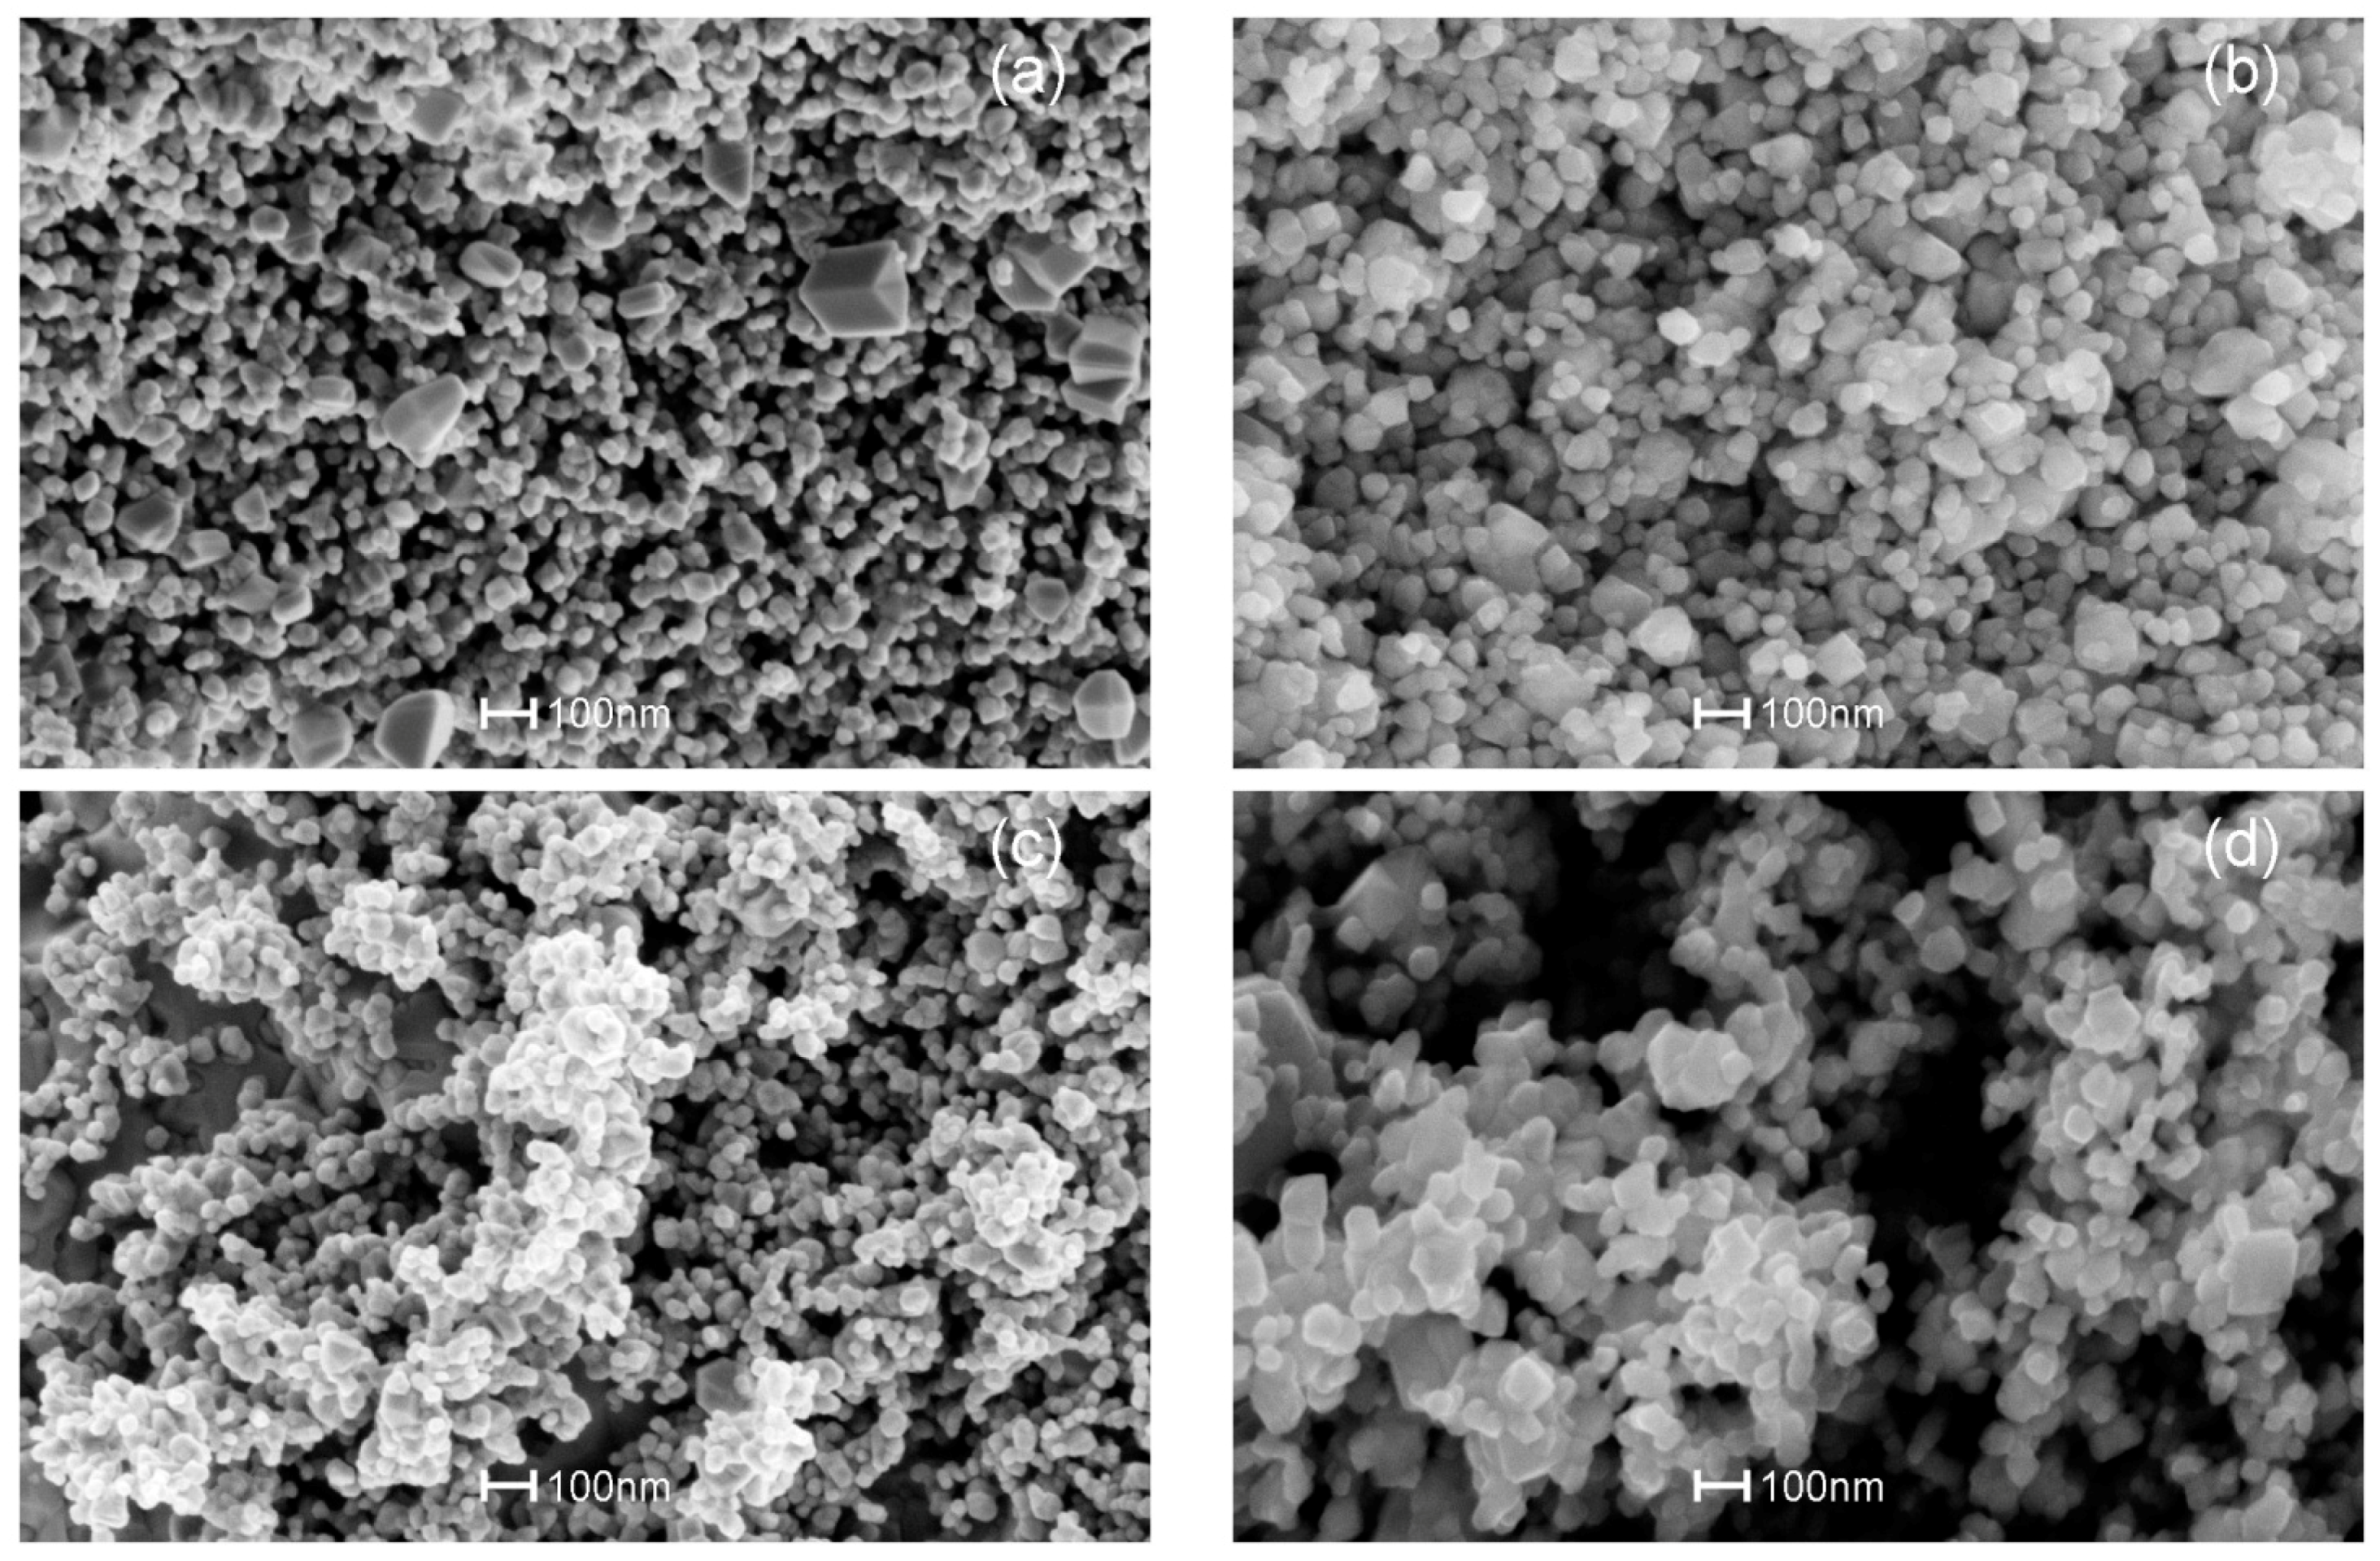
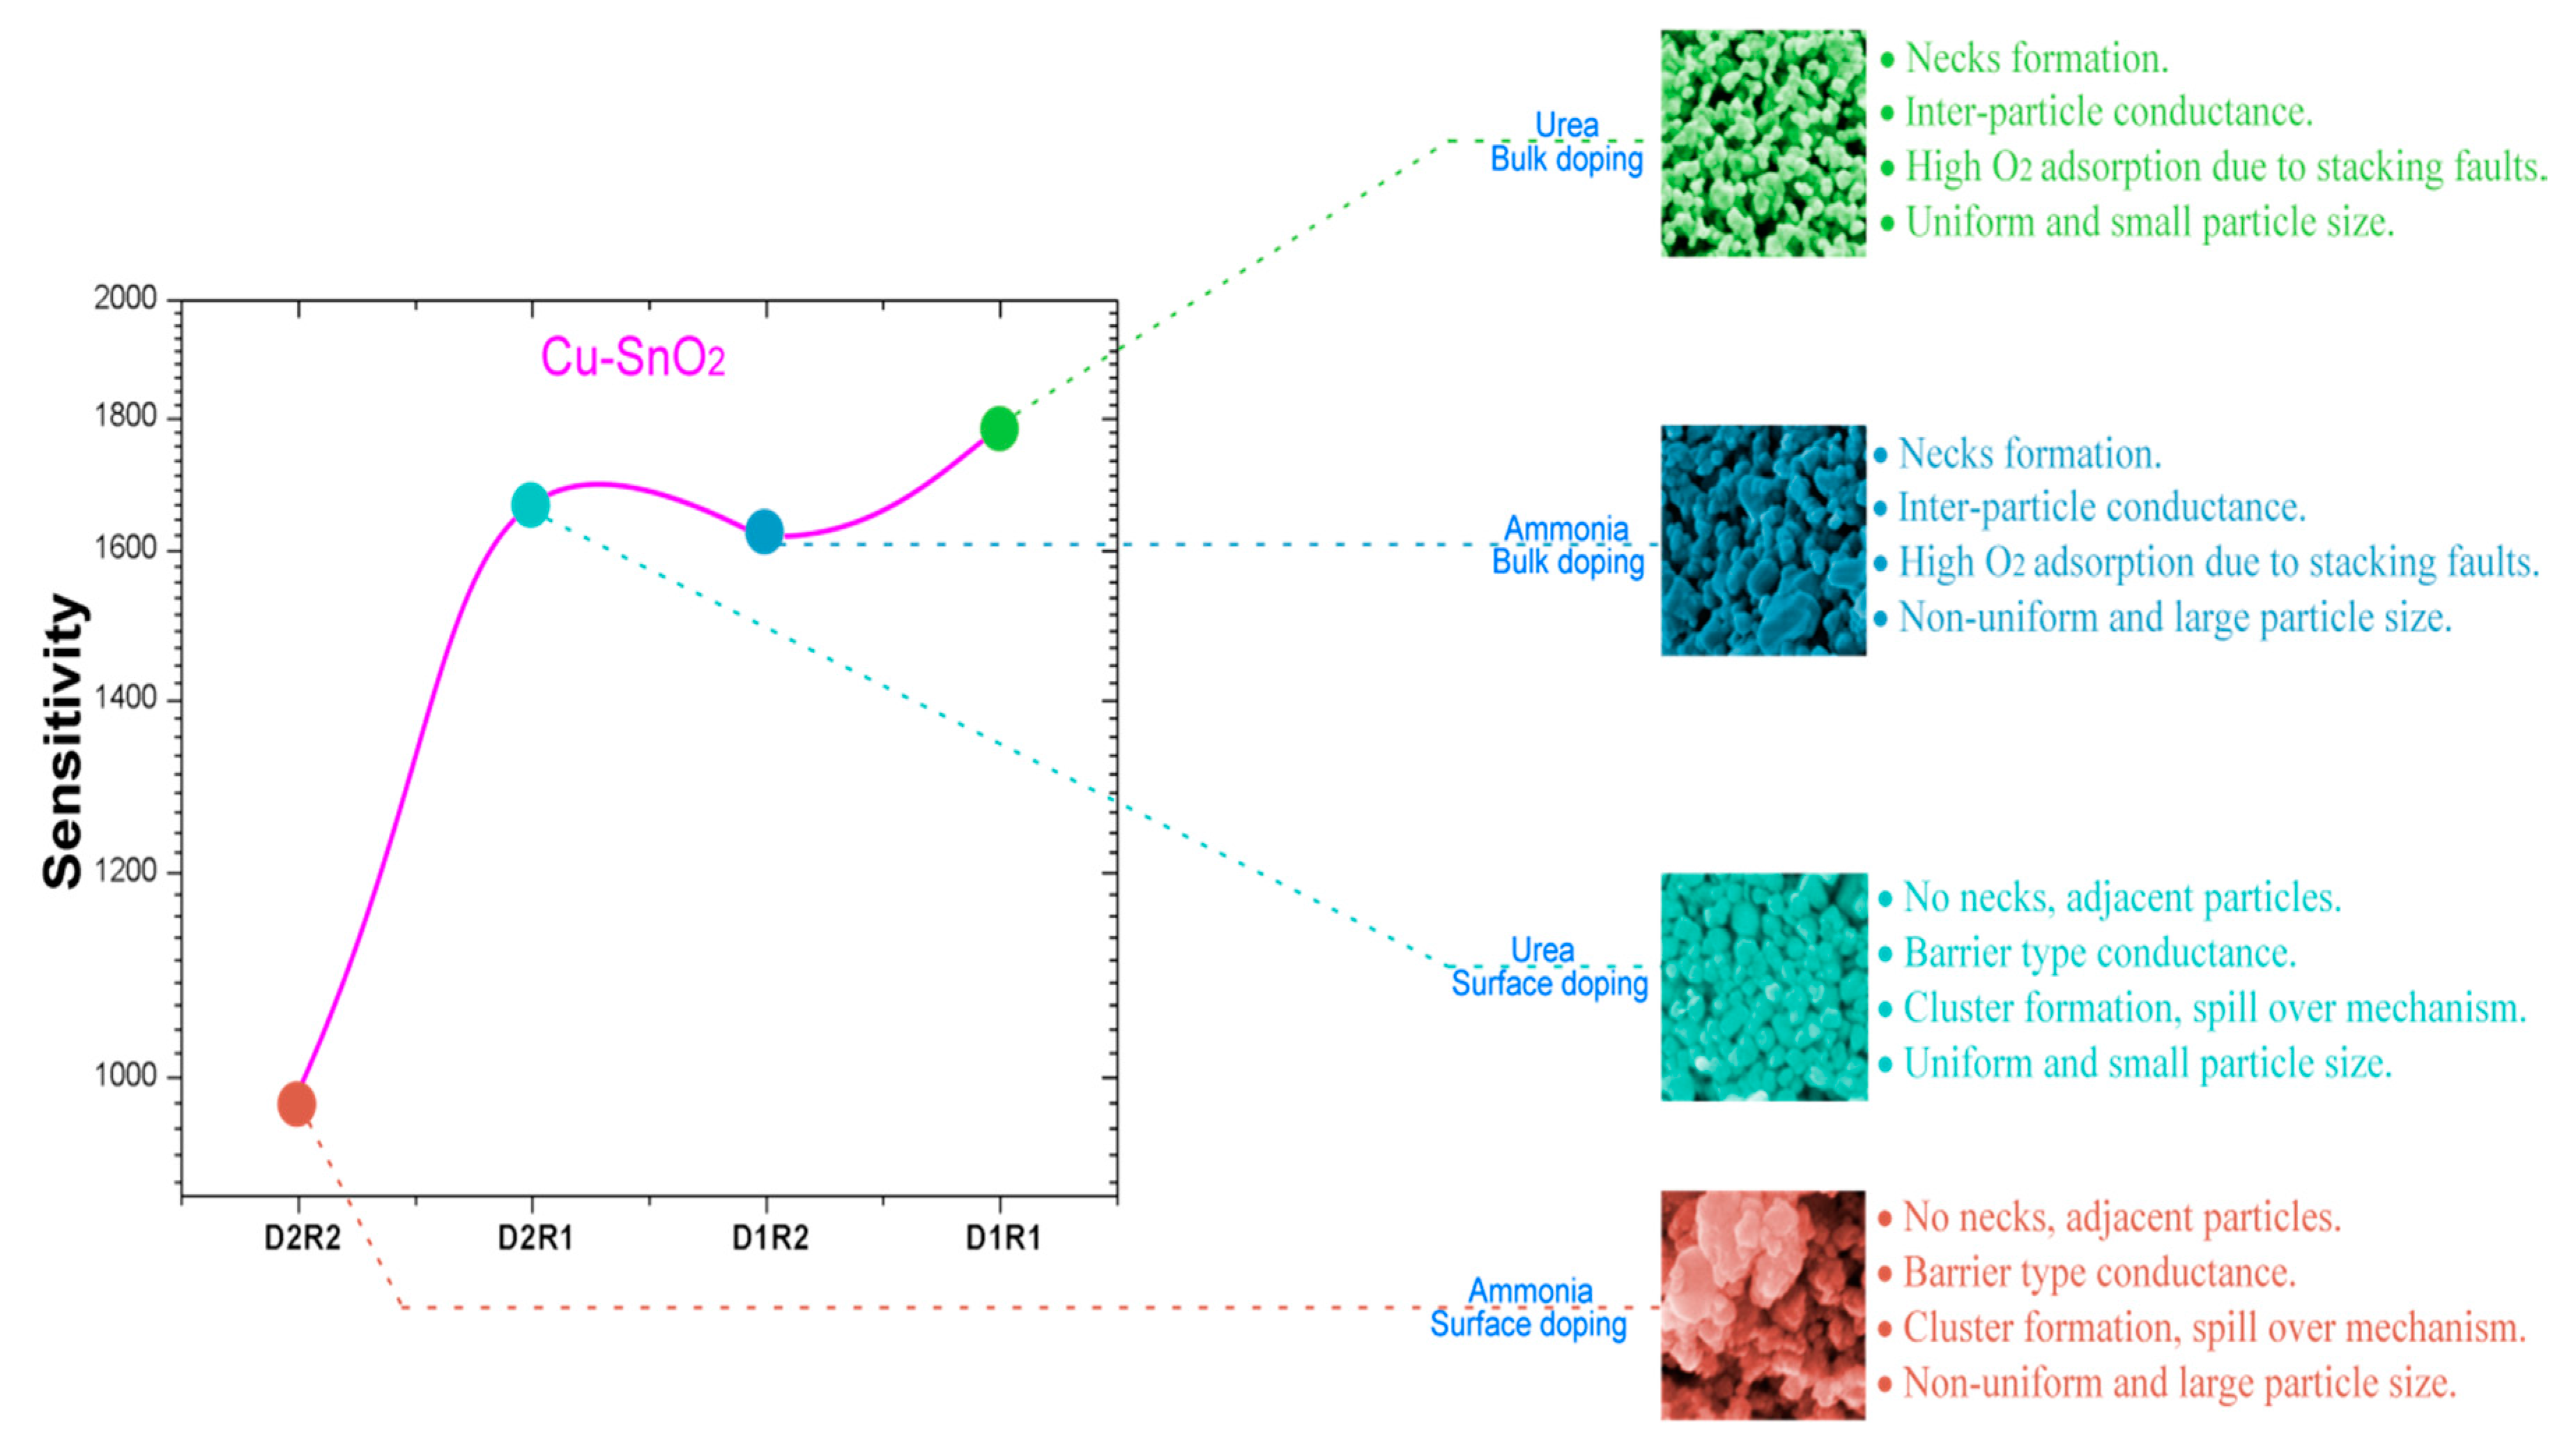
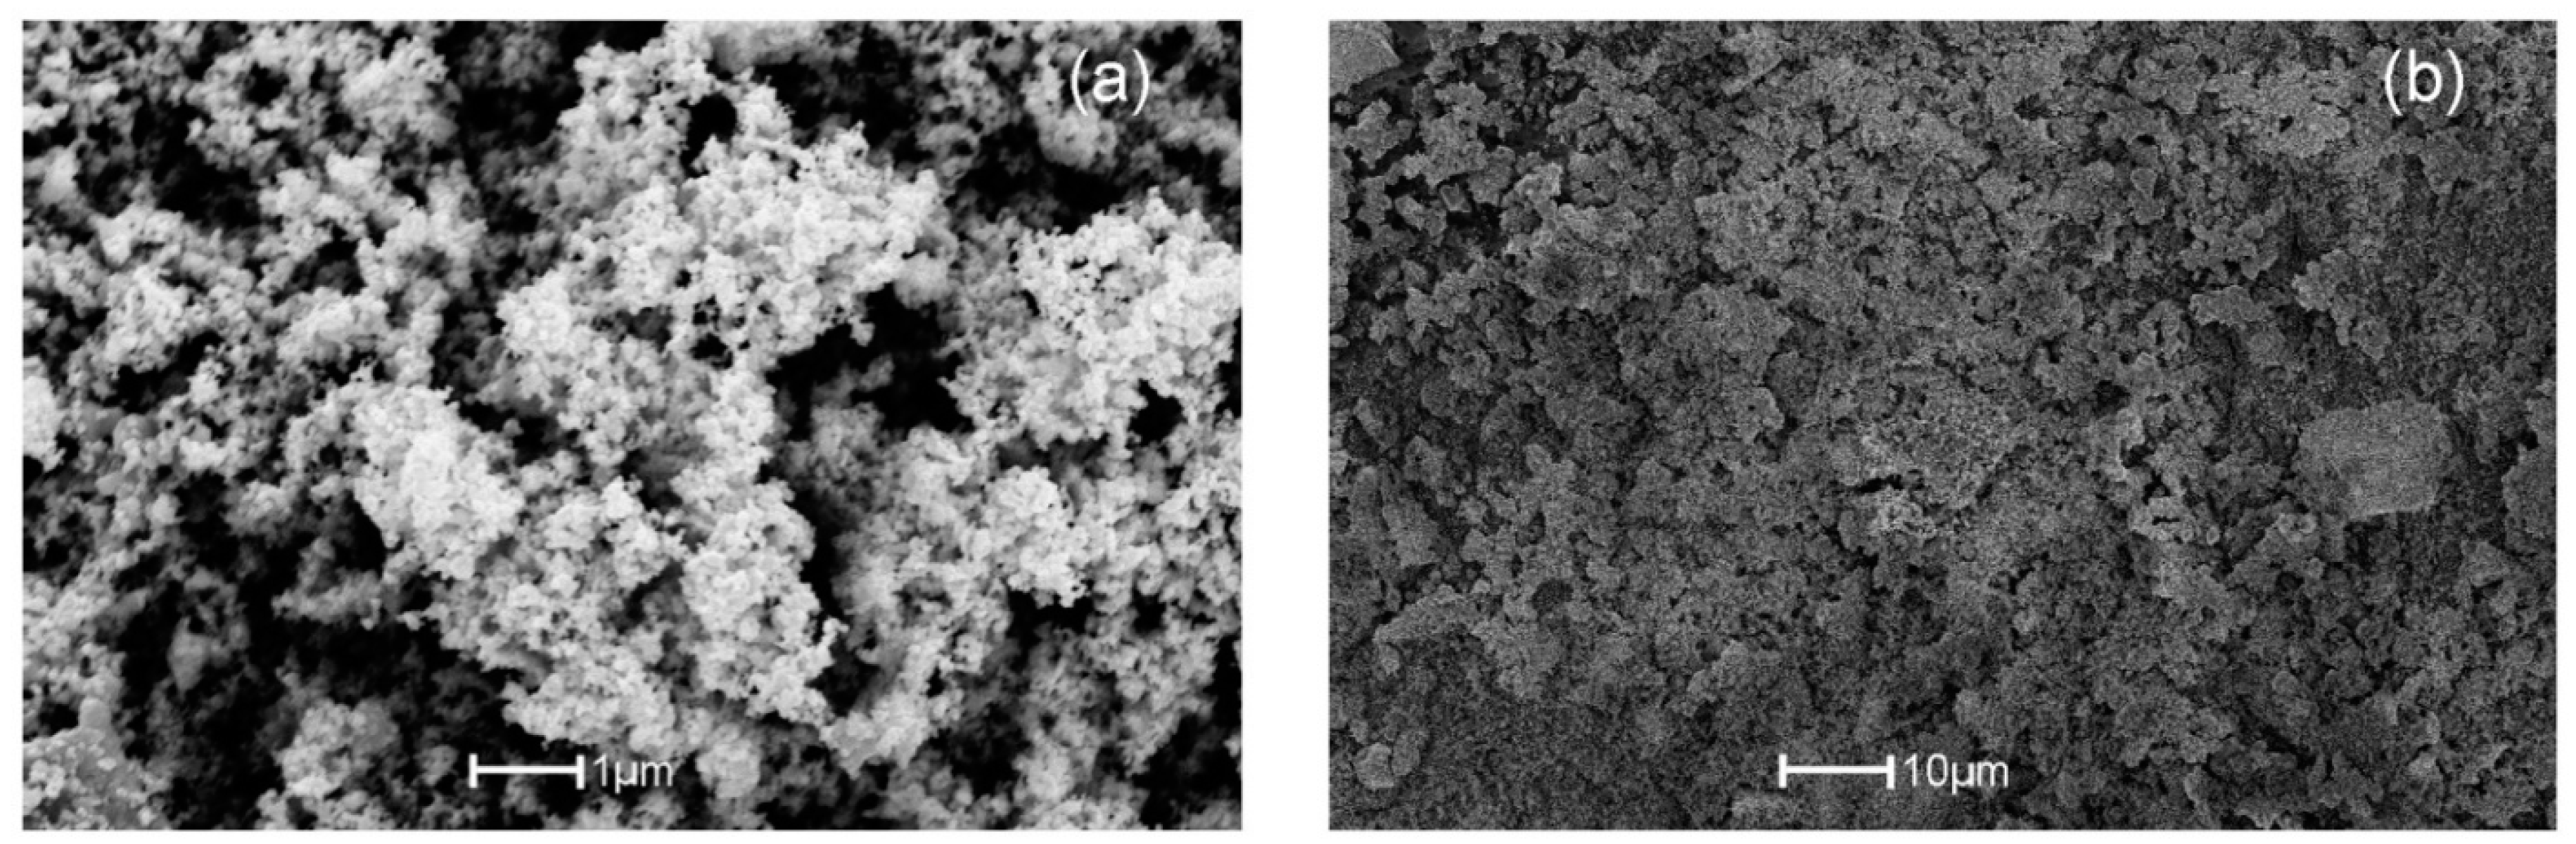
3.3. SEM Analysis
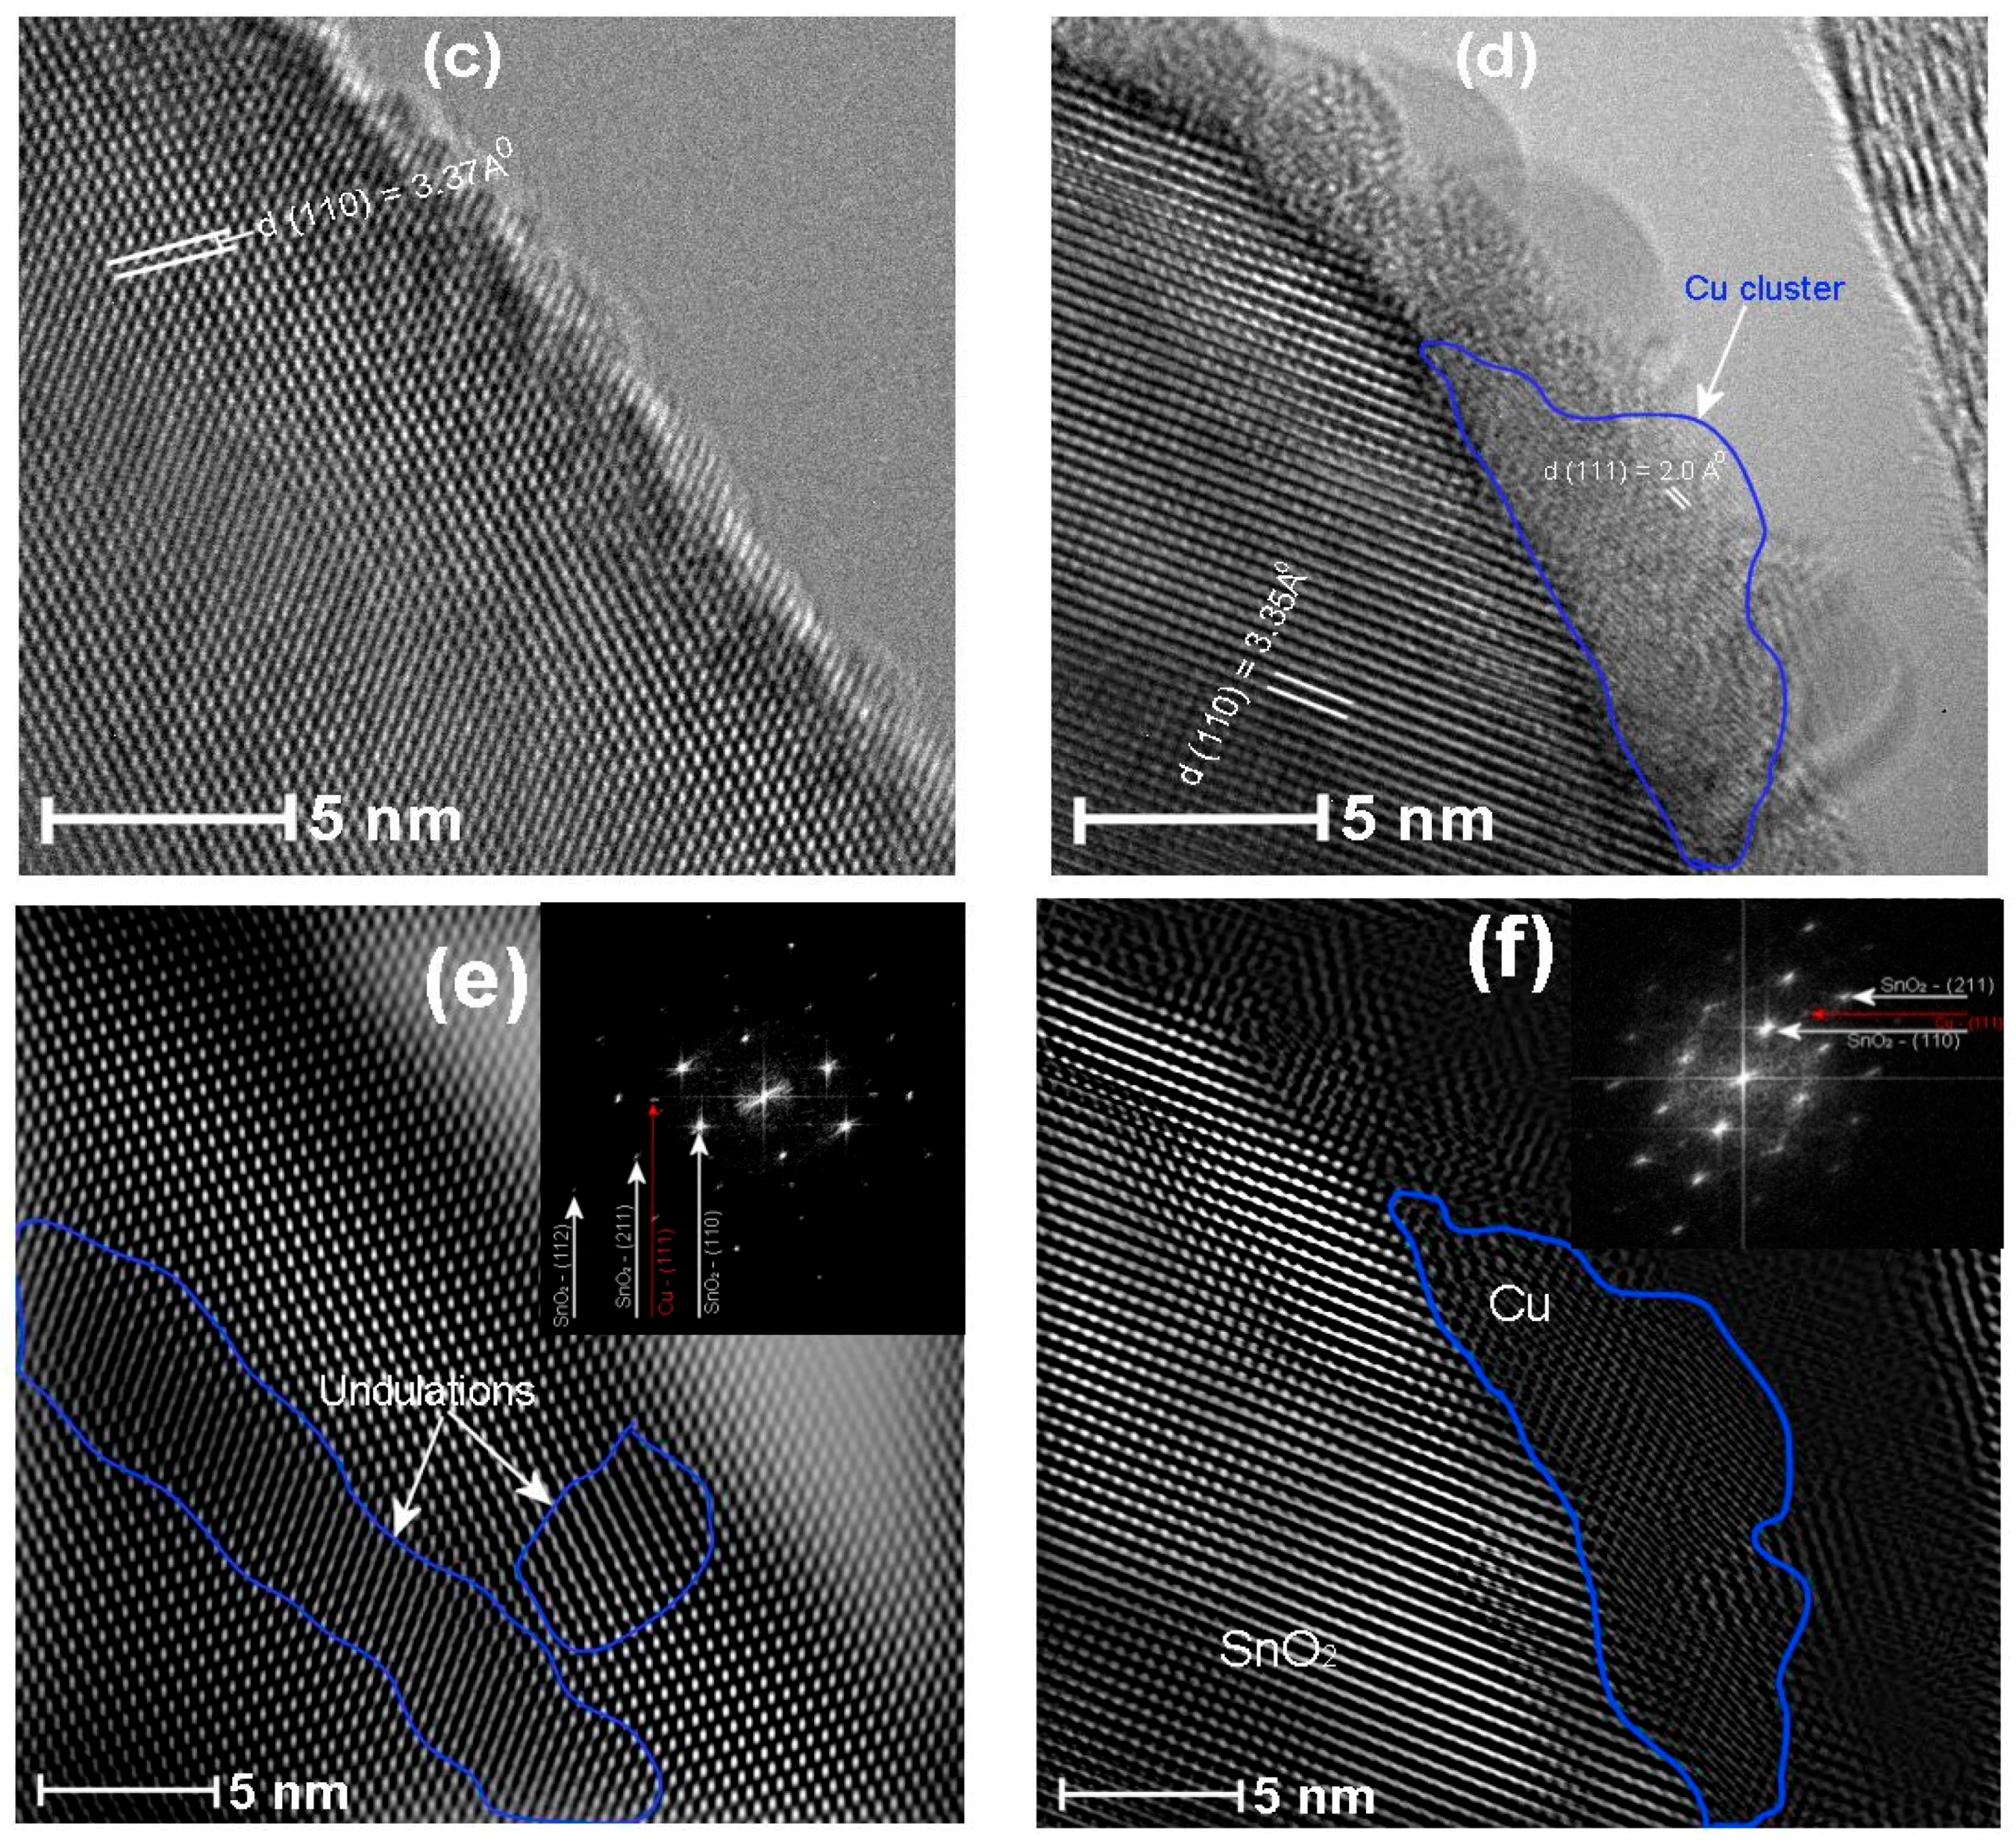
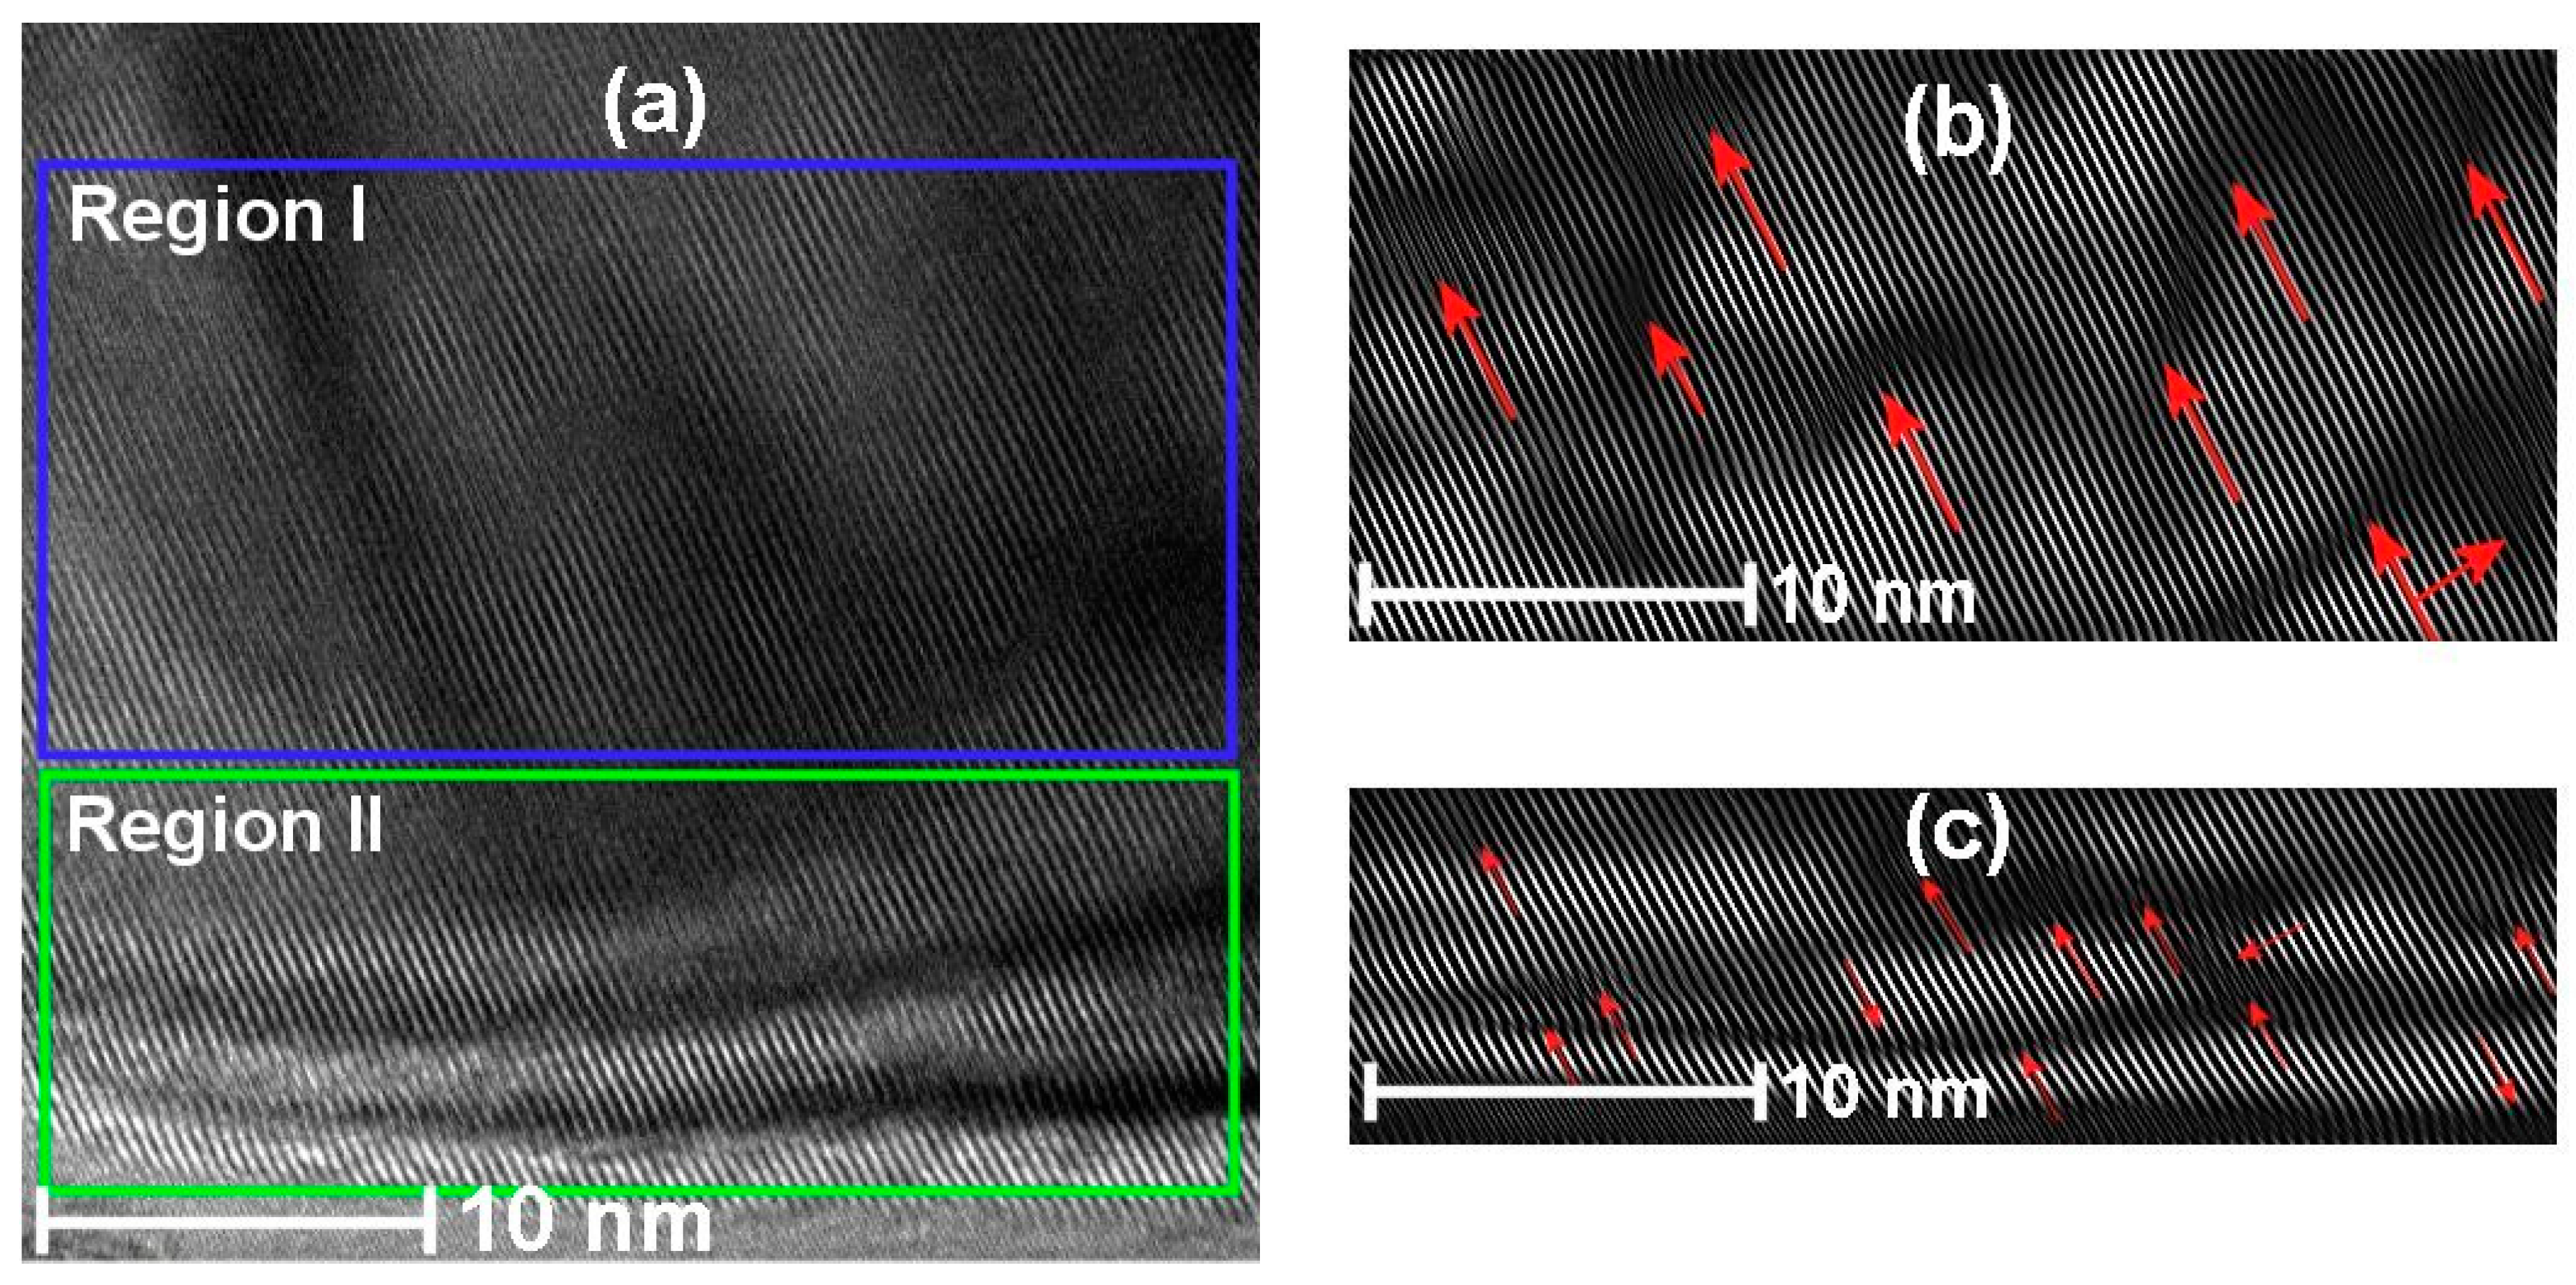
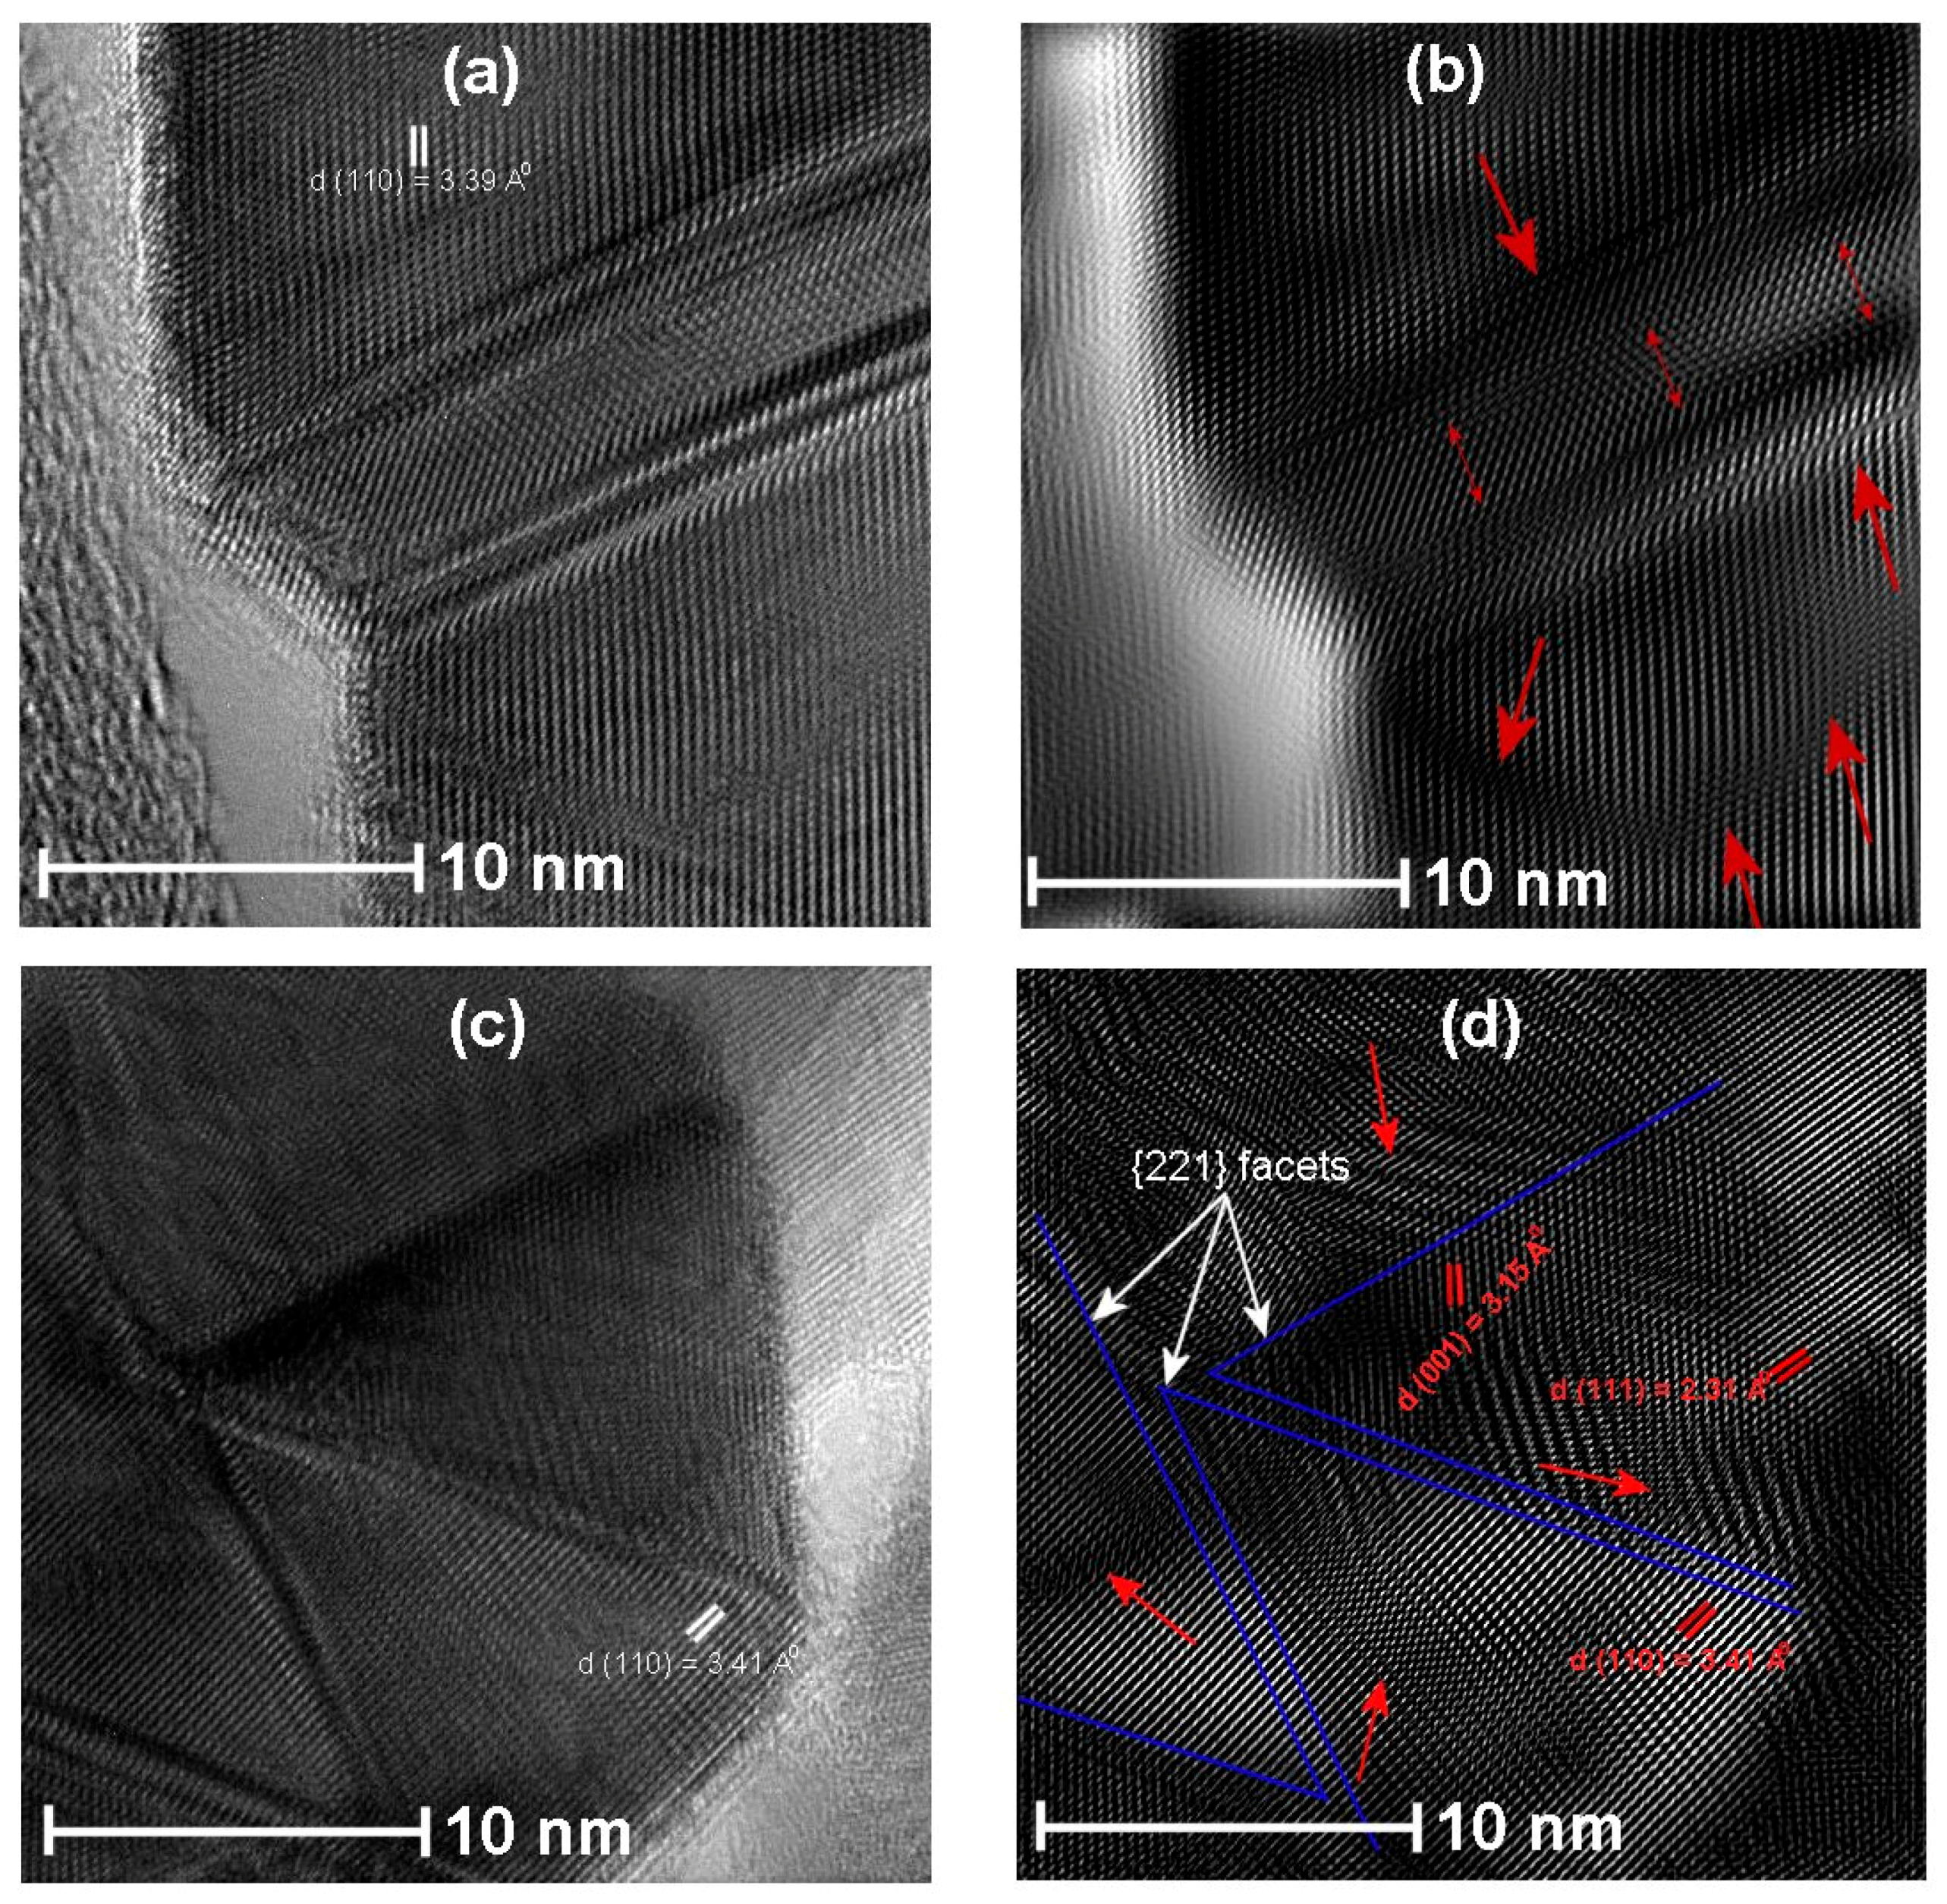
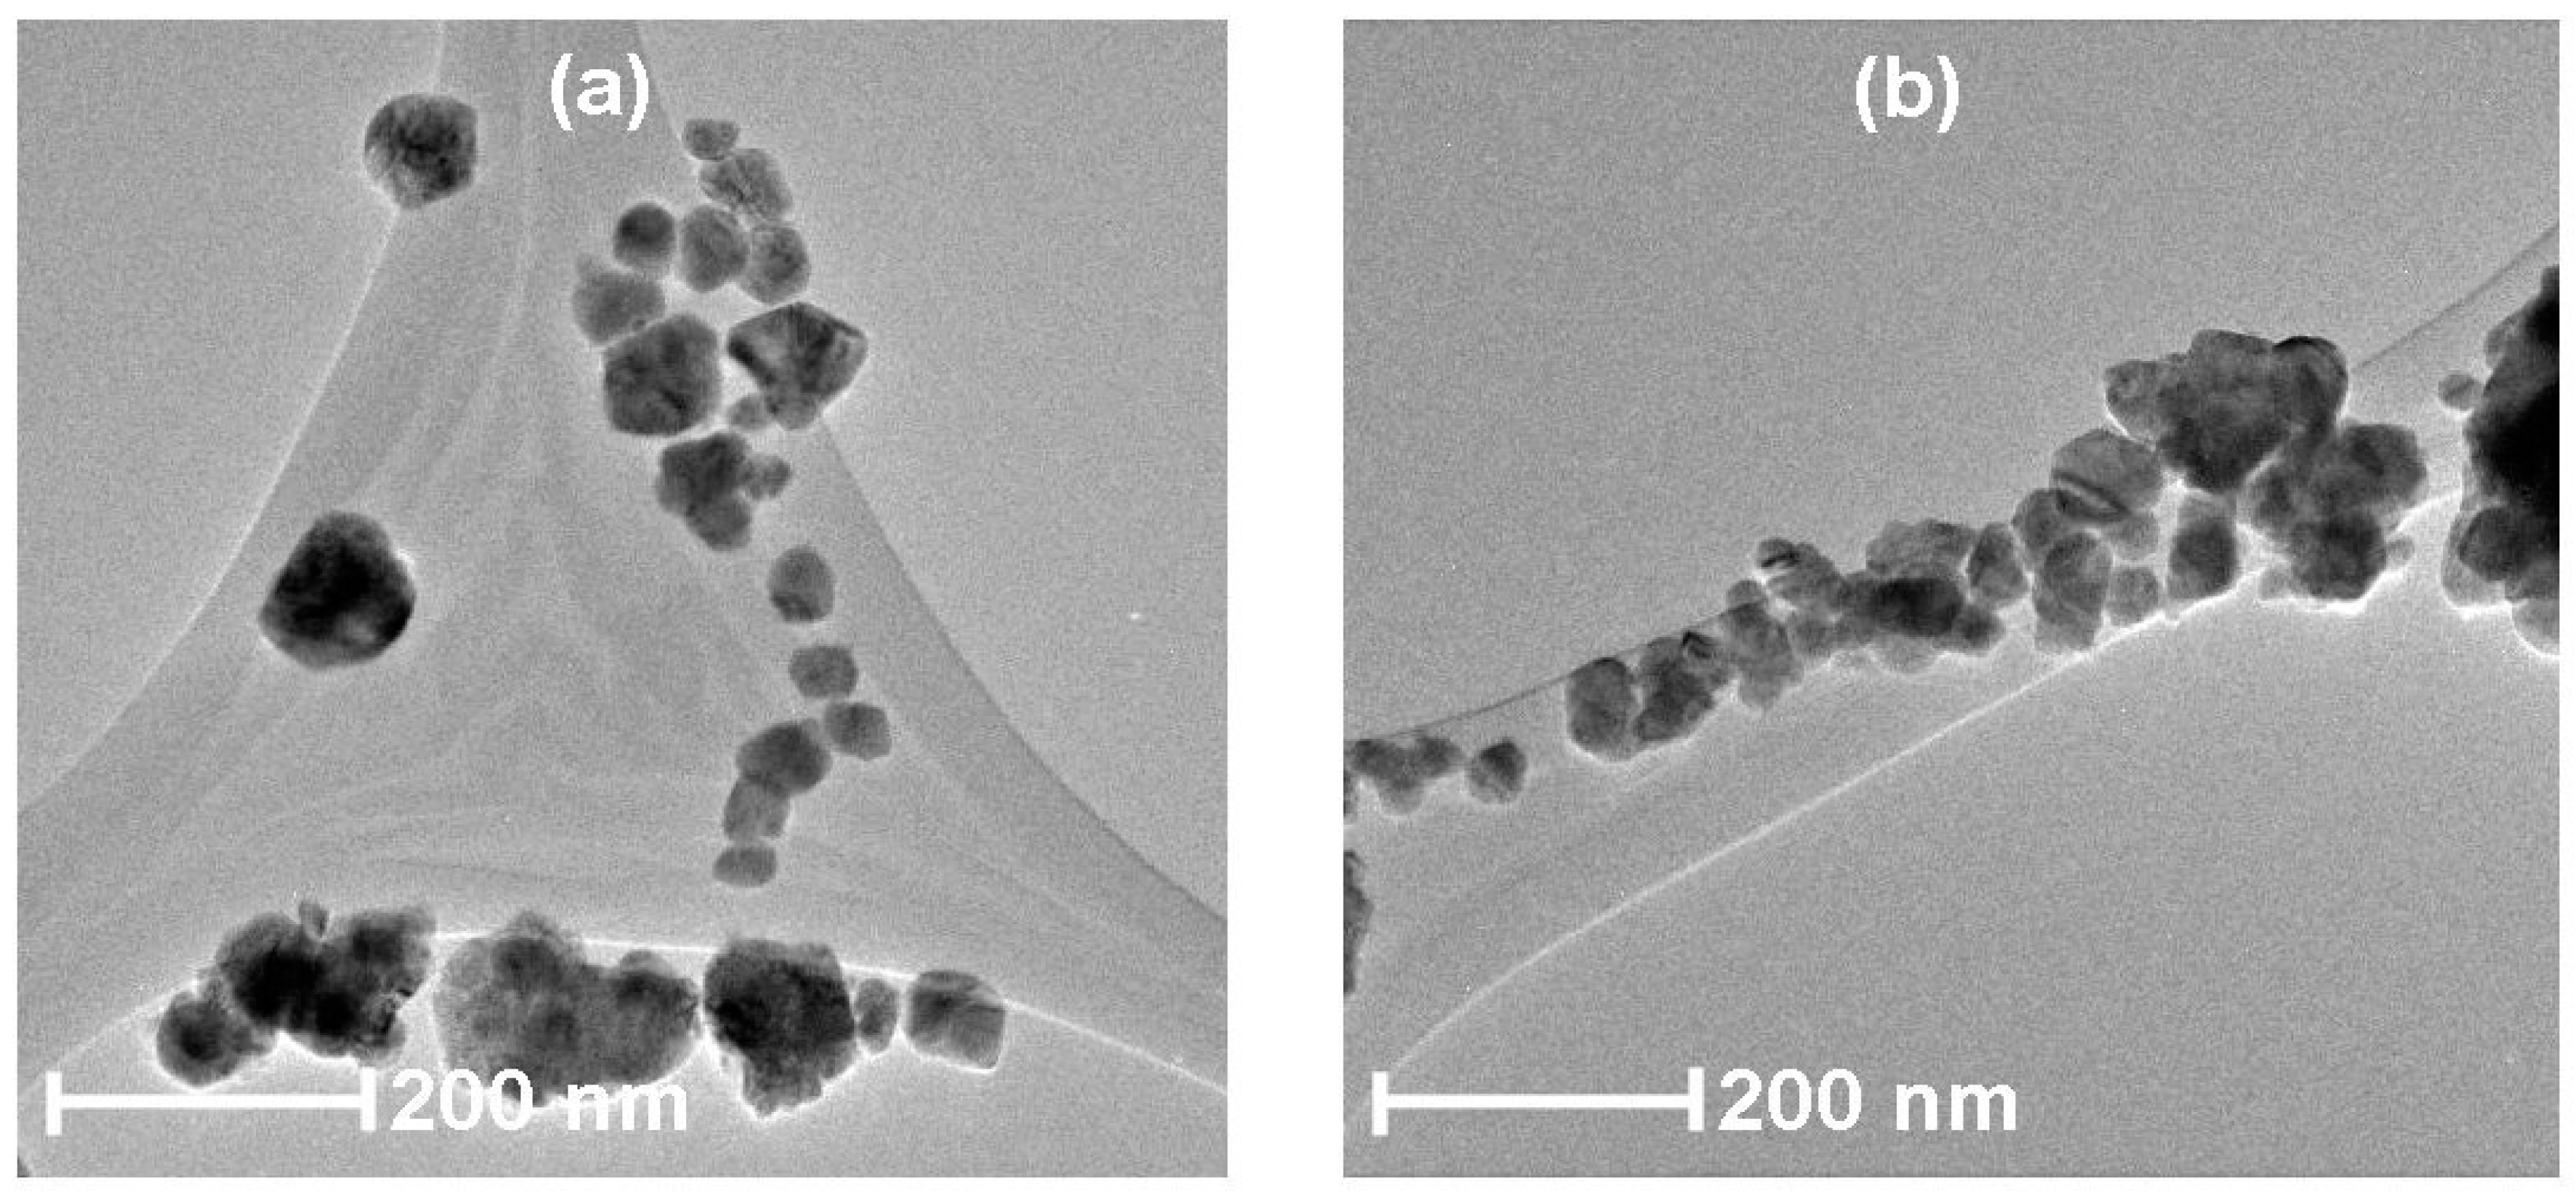
3.4. HRTEM Analysis
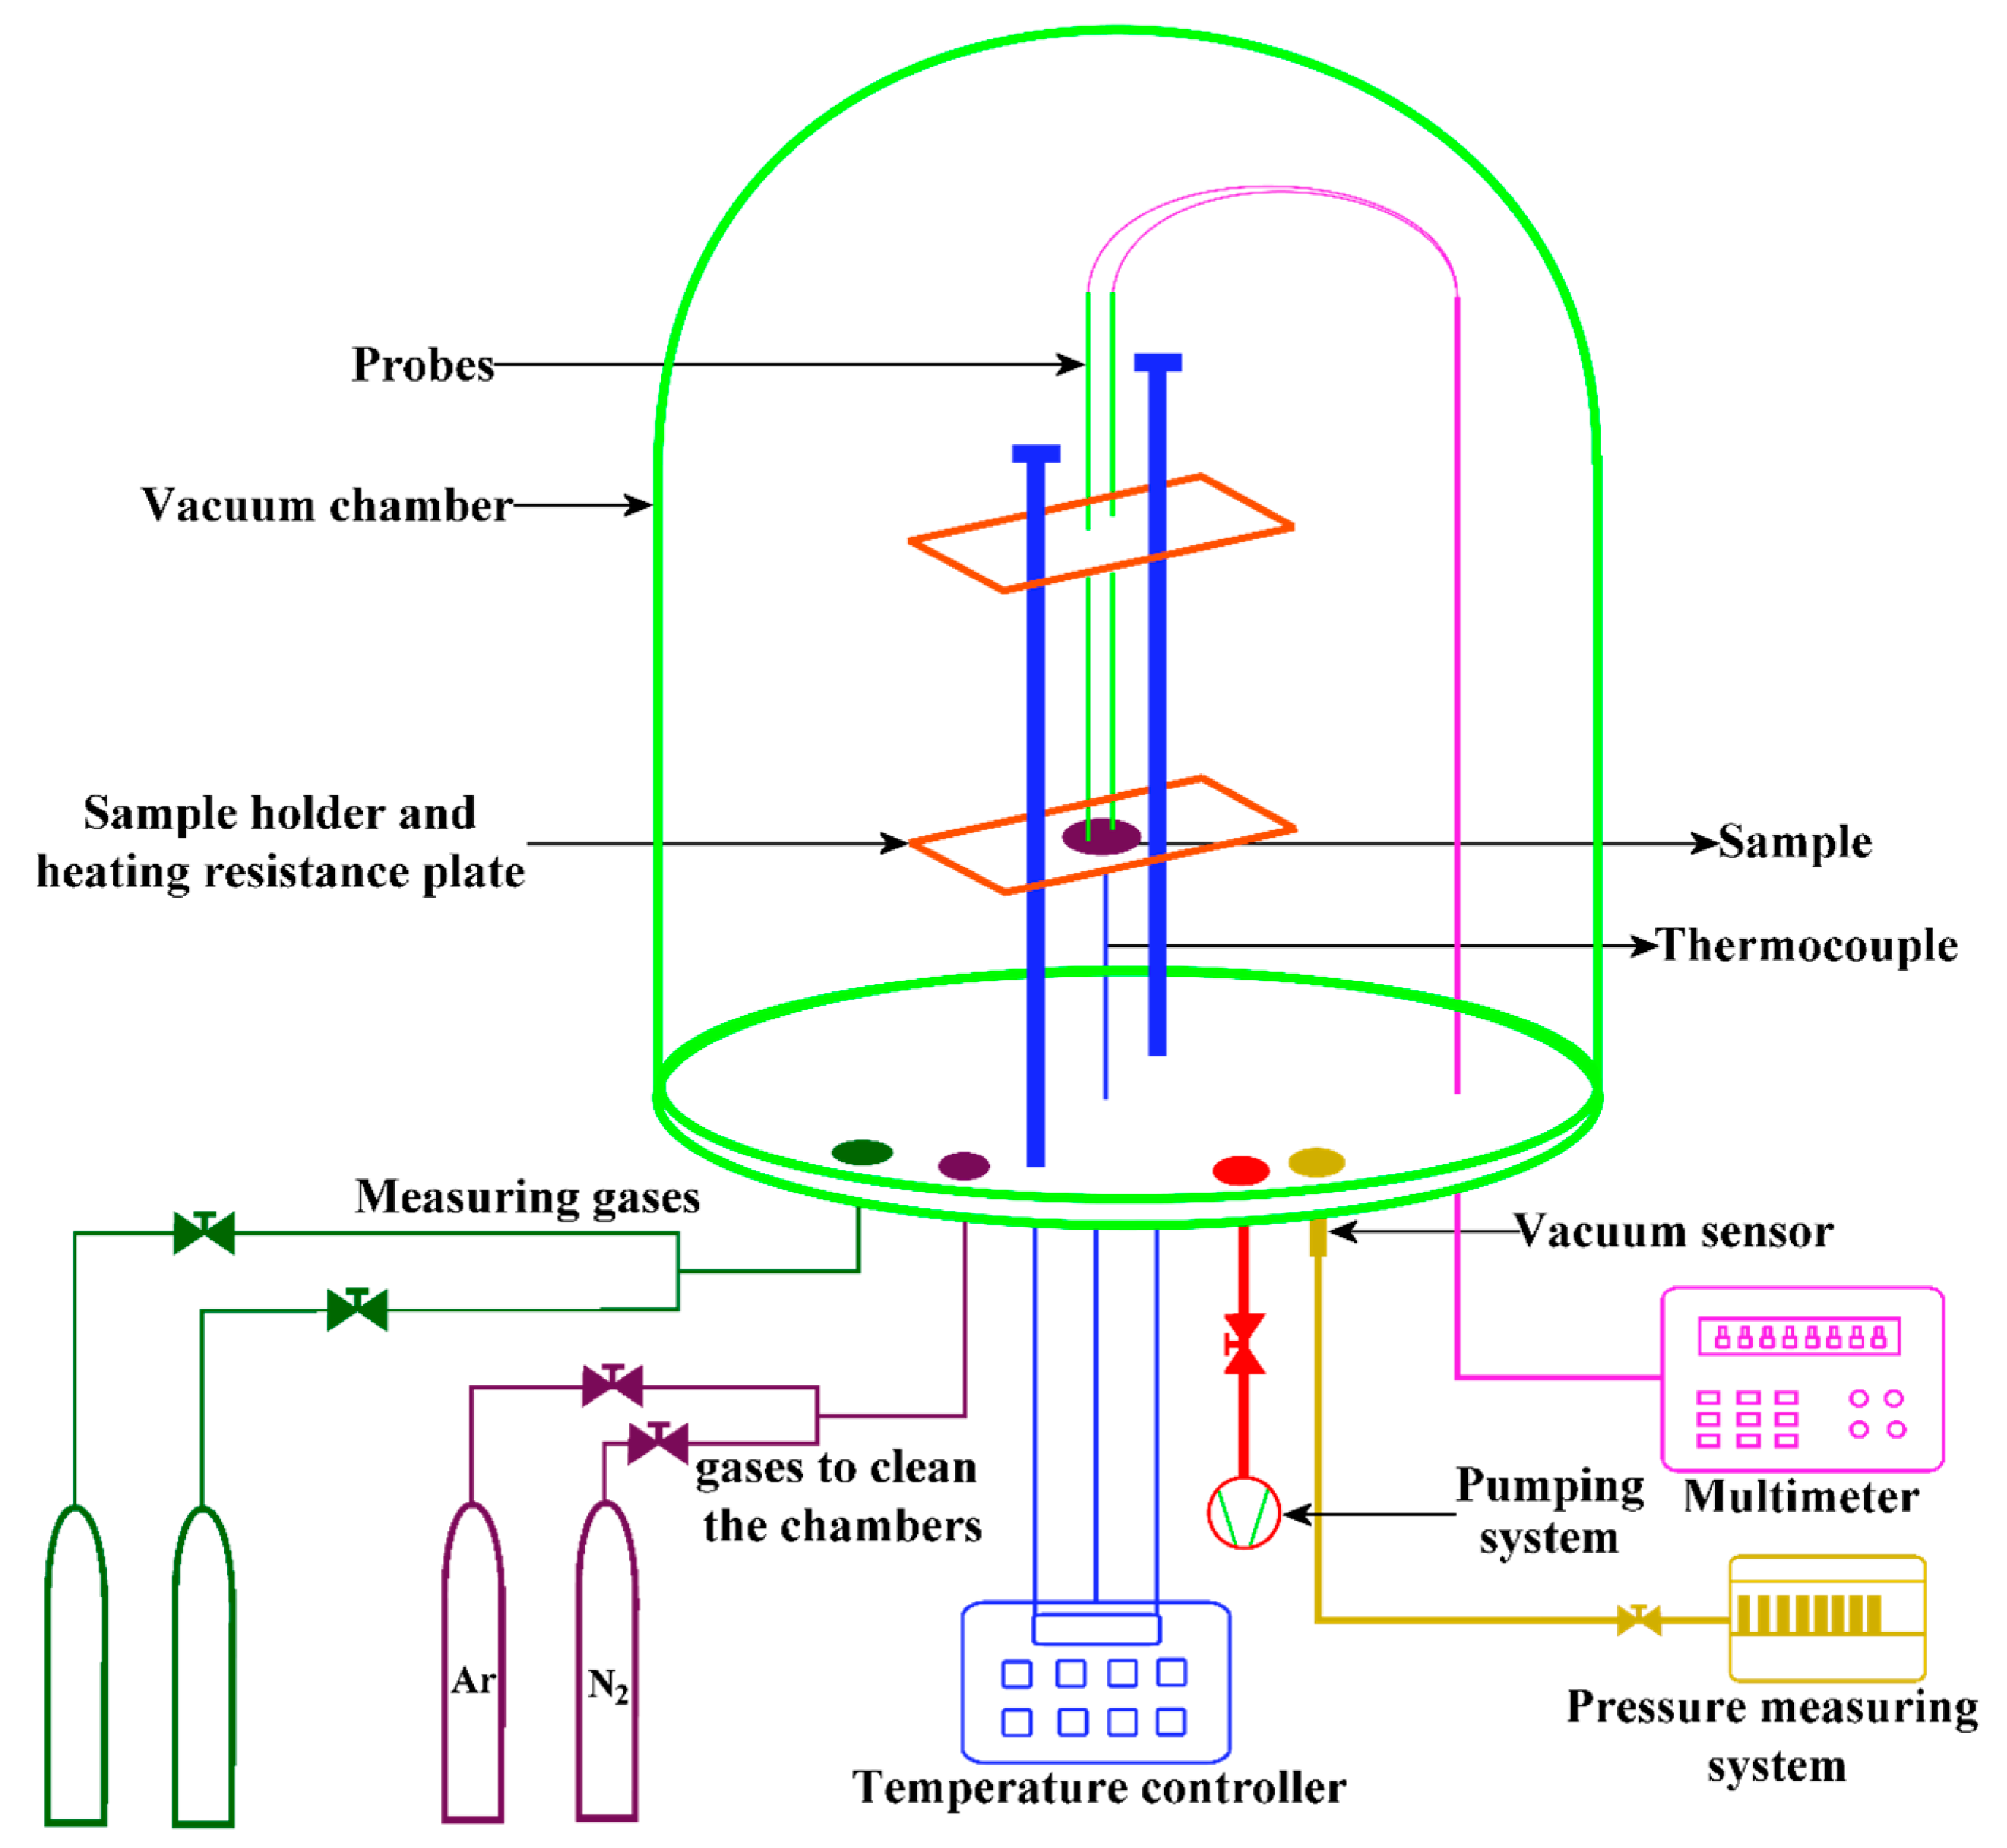
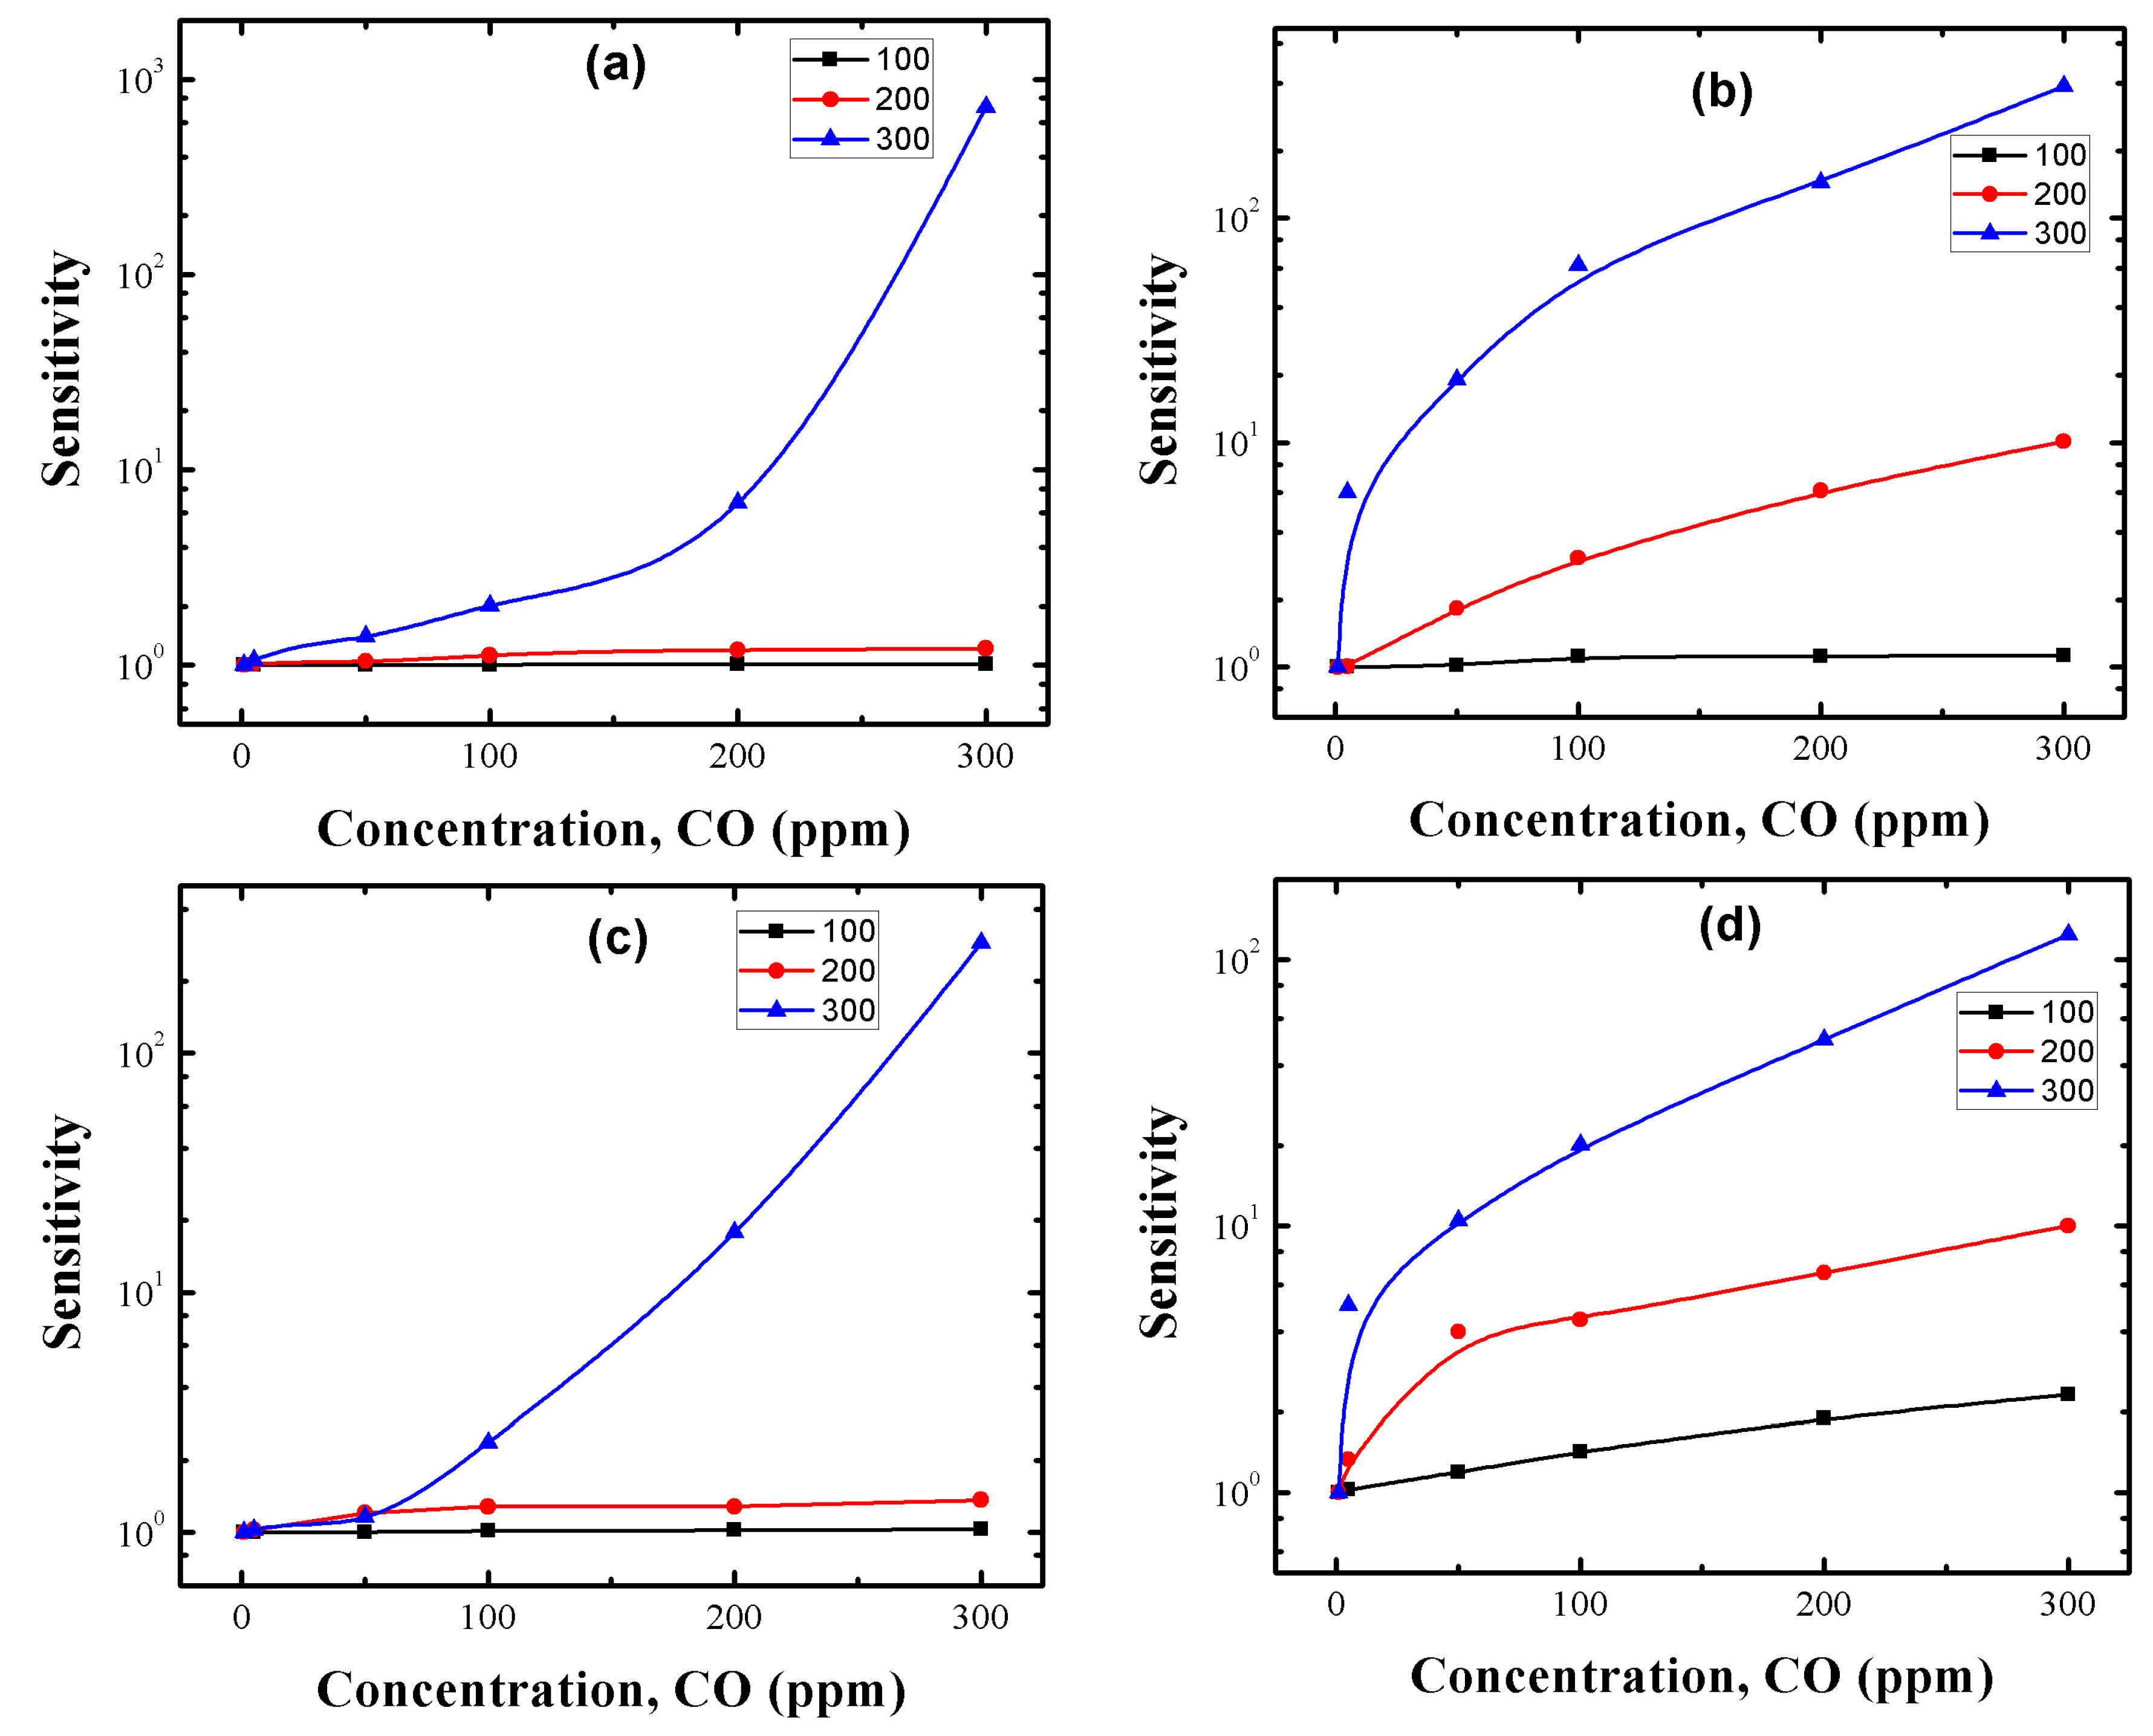
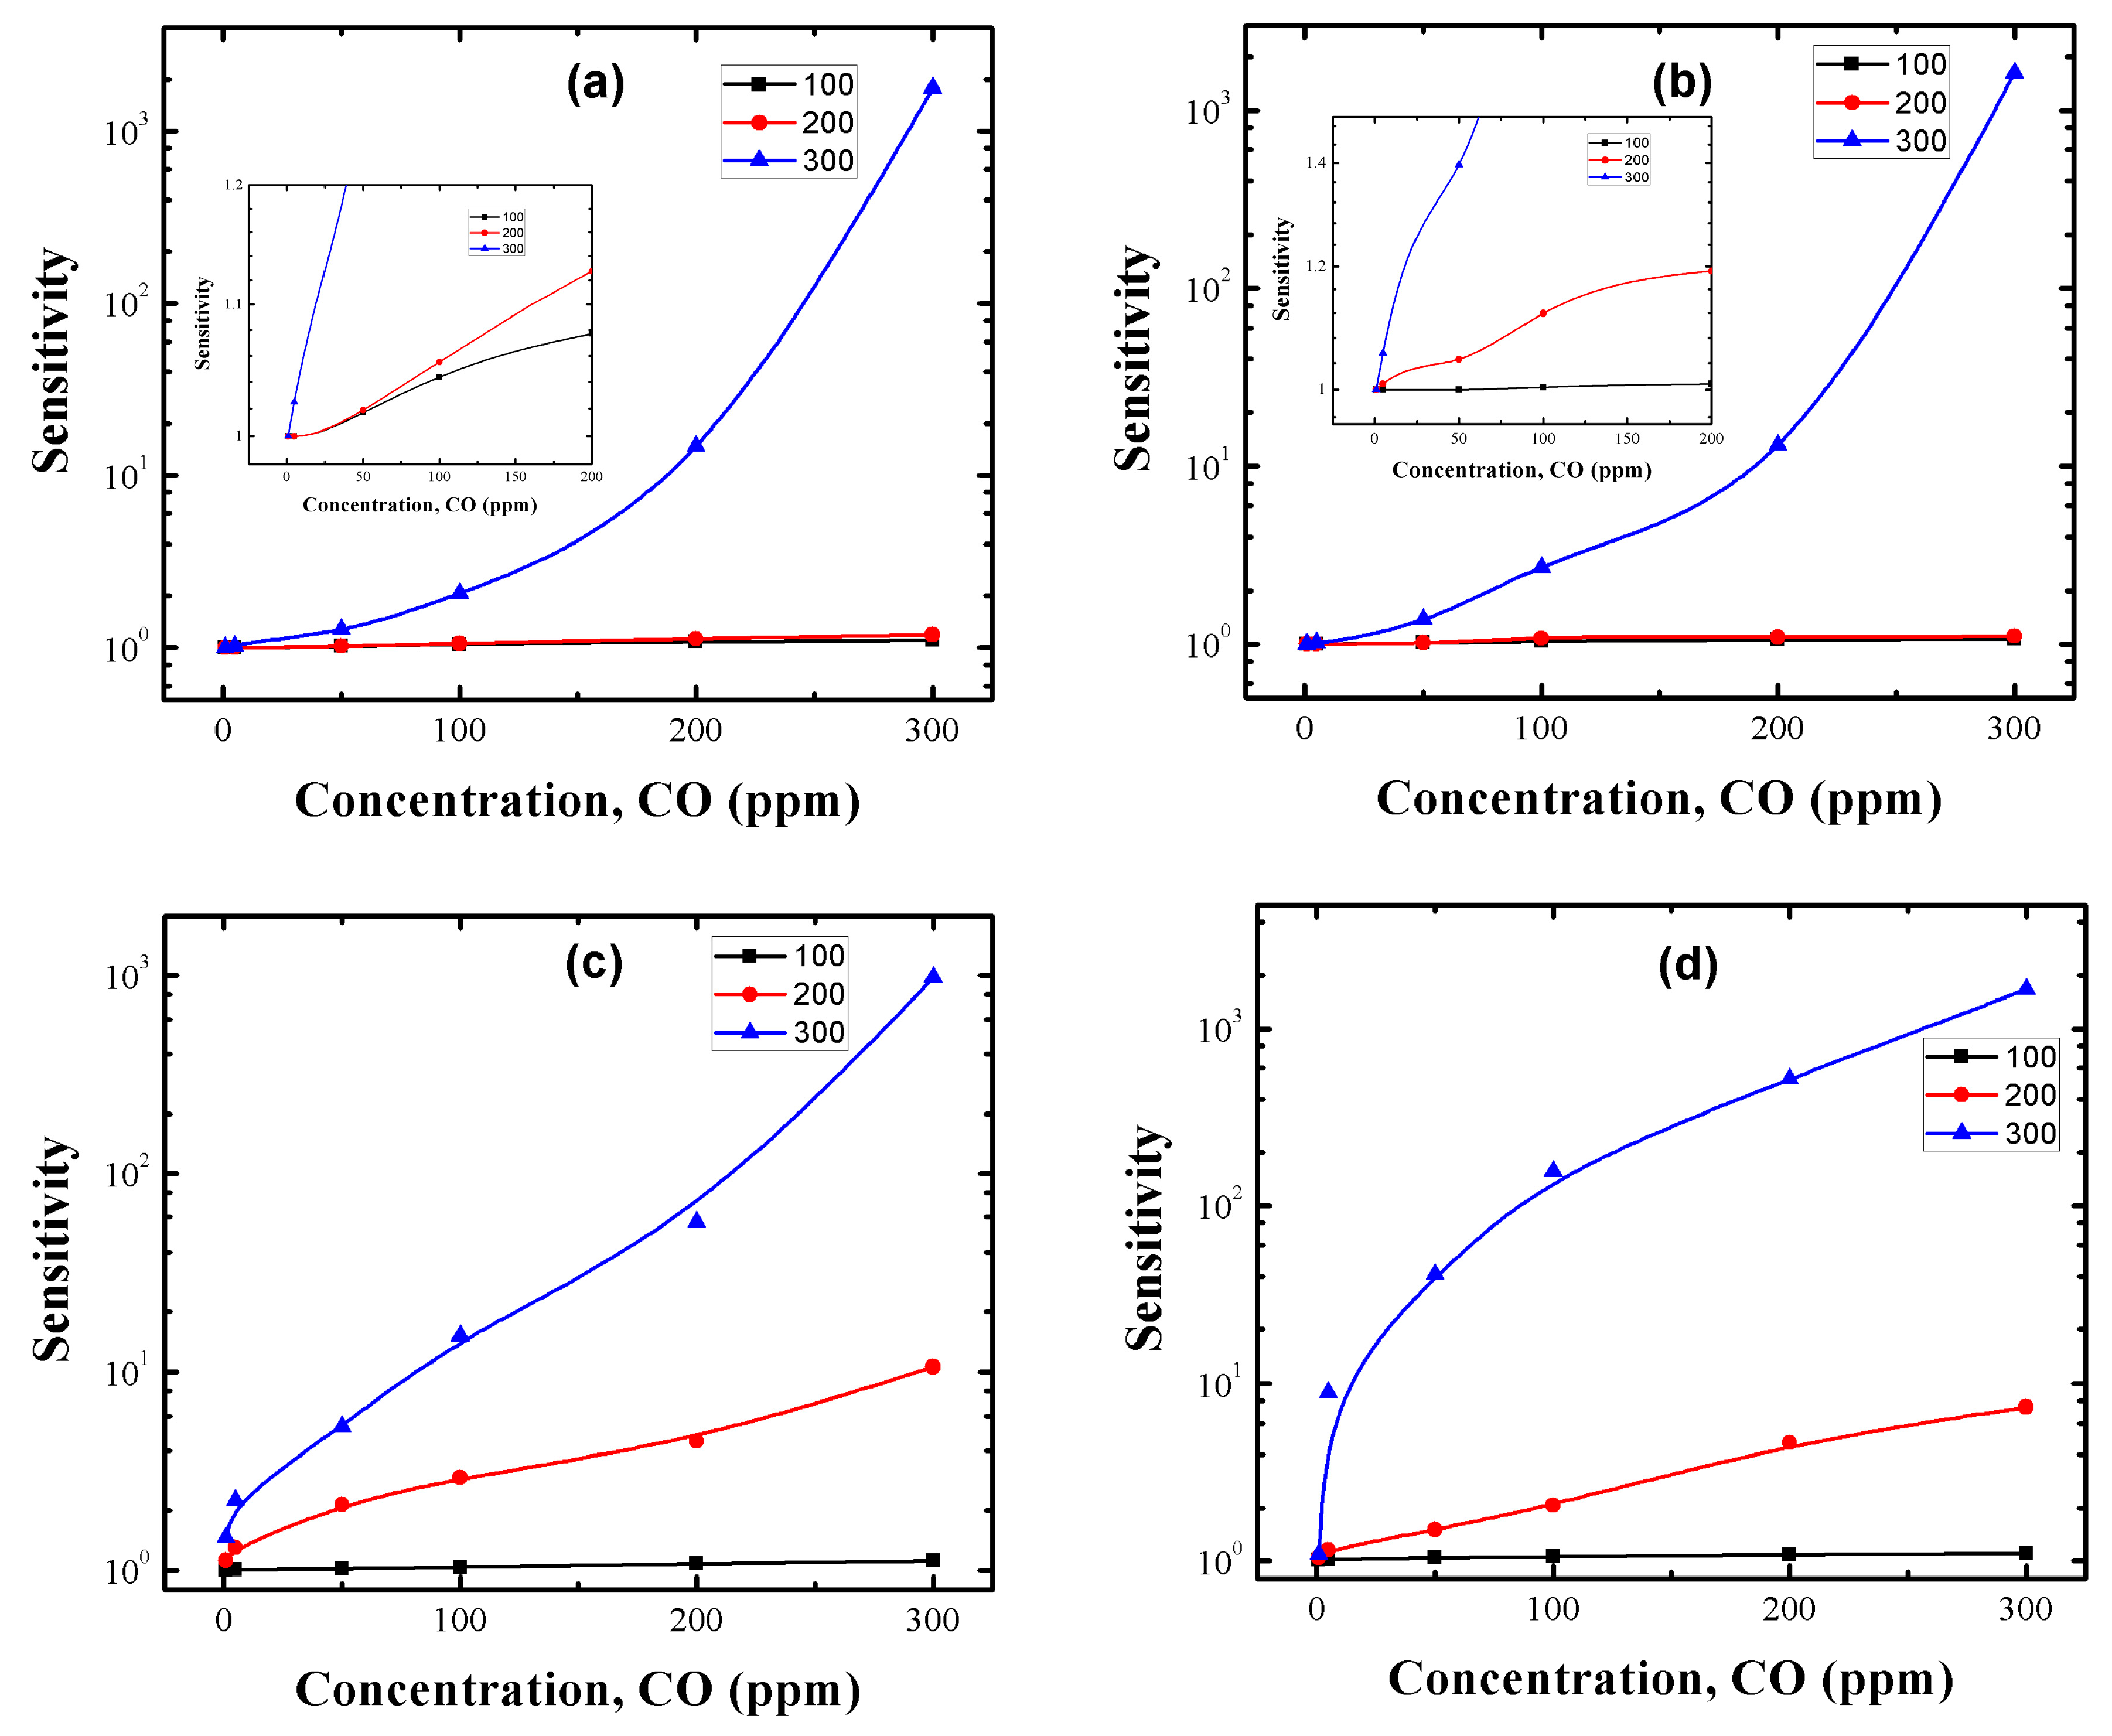
3.5. CO Sensing Properties
4. Discussion
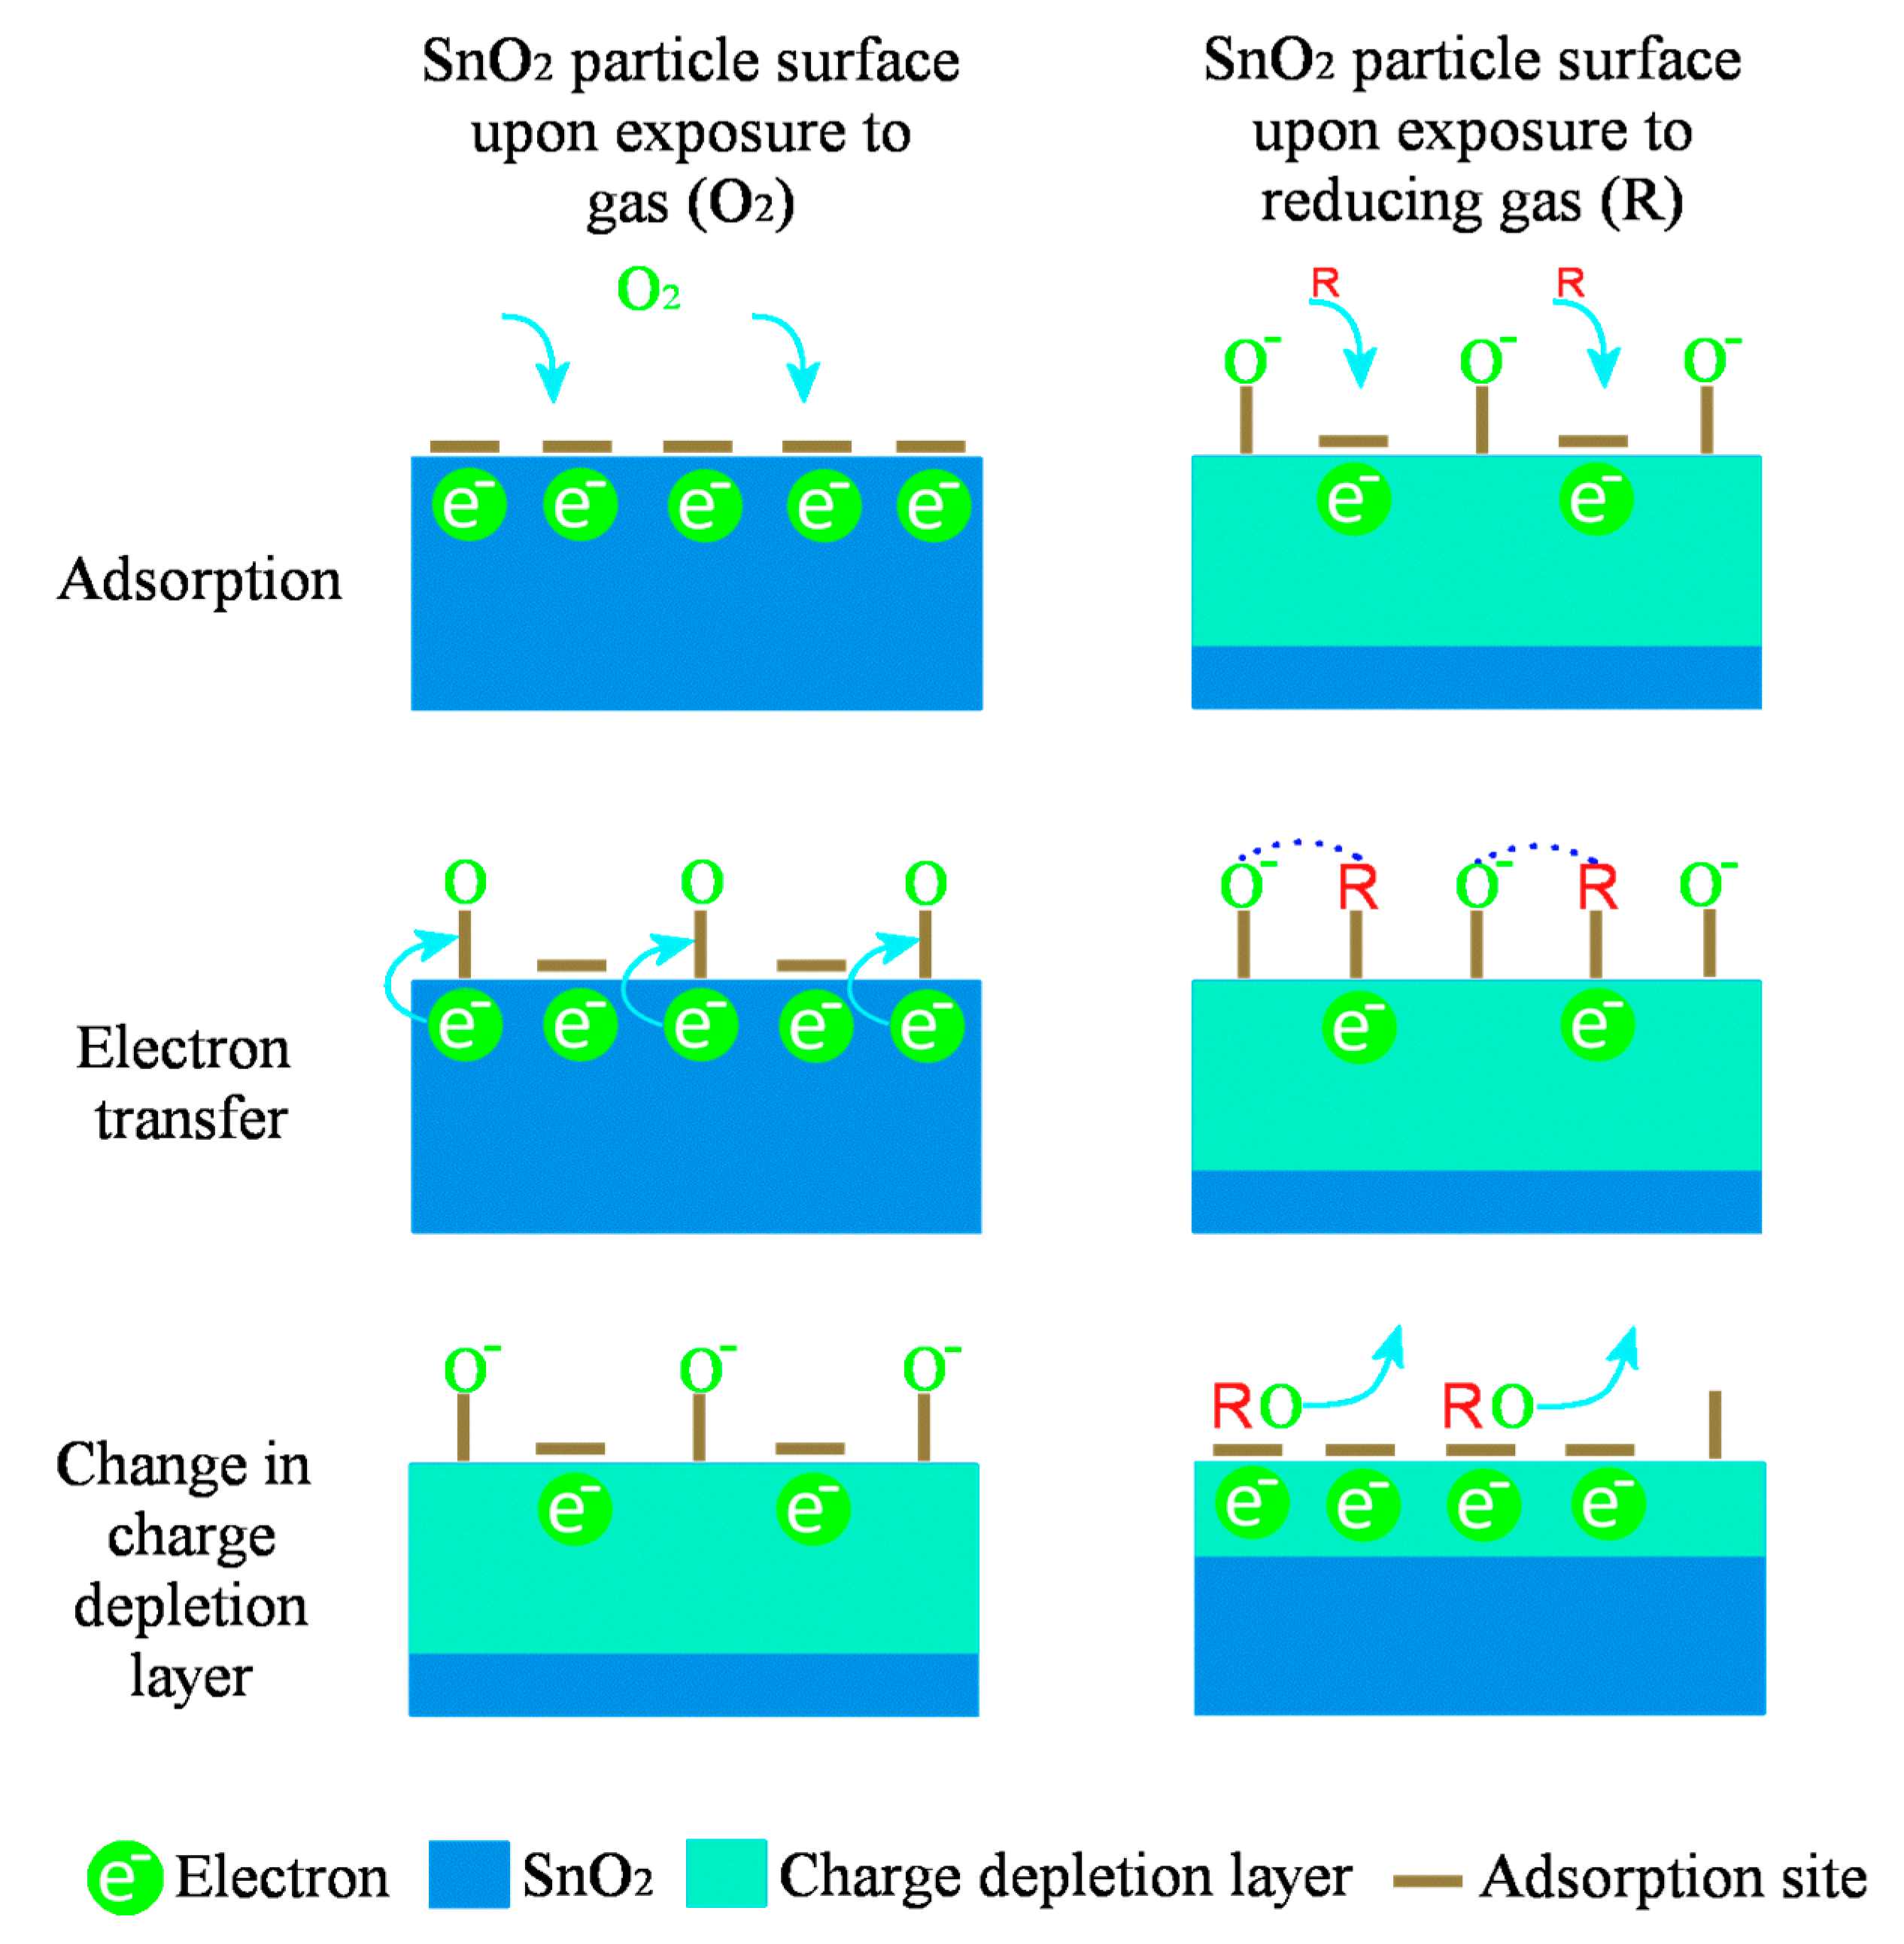
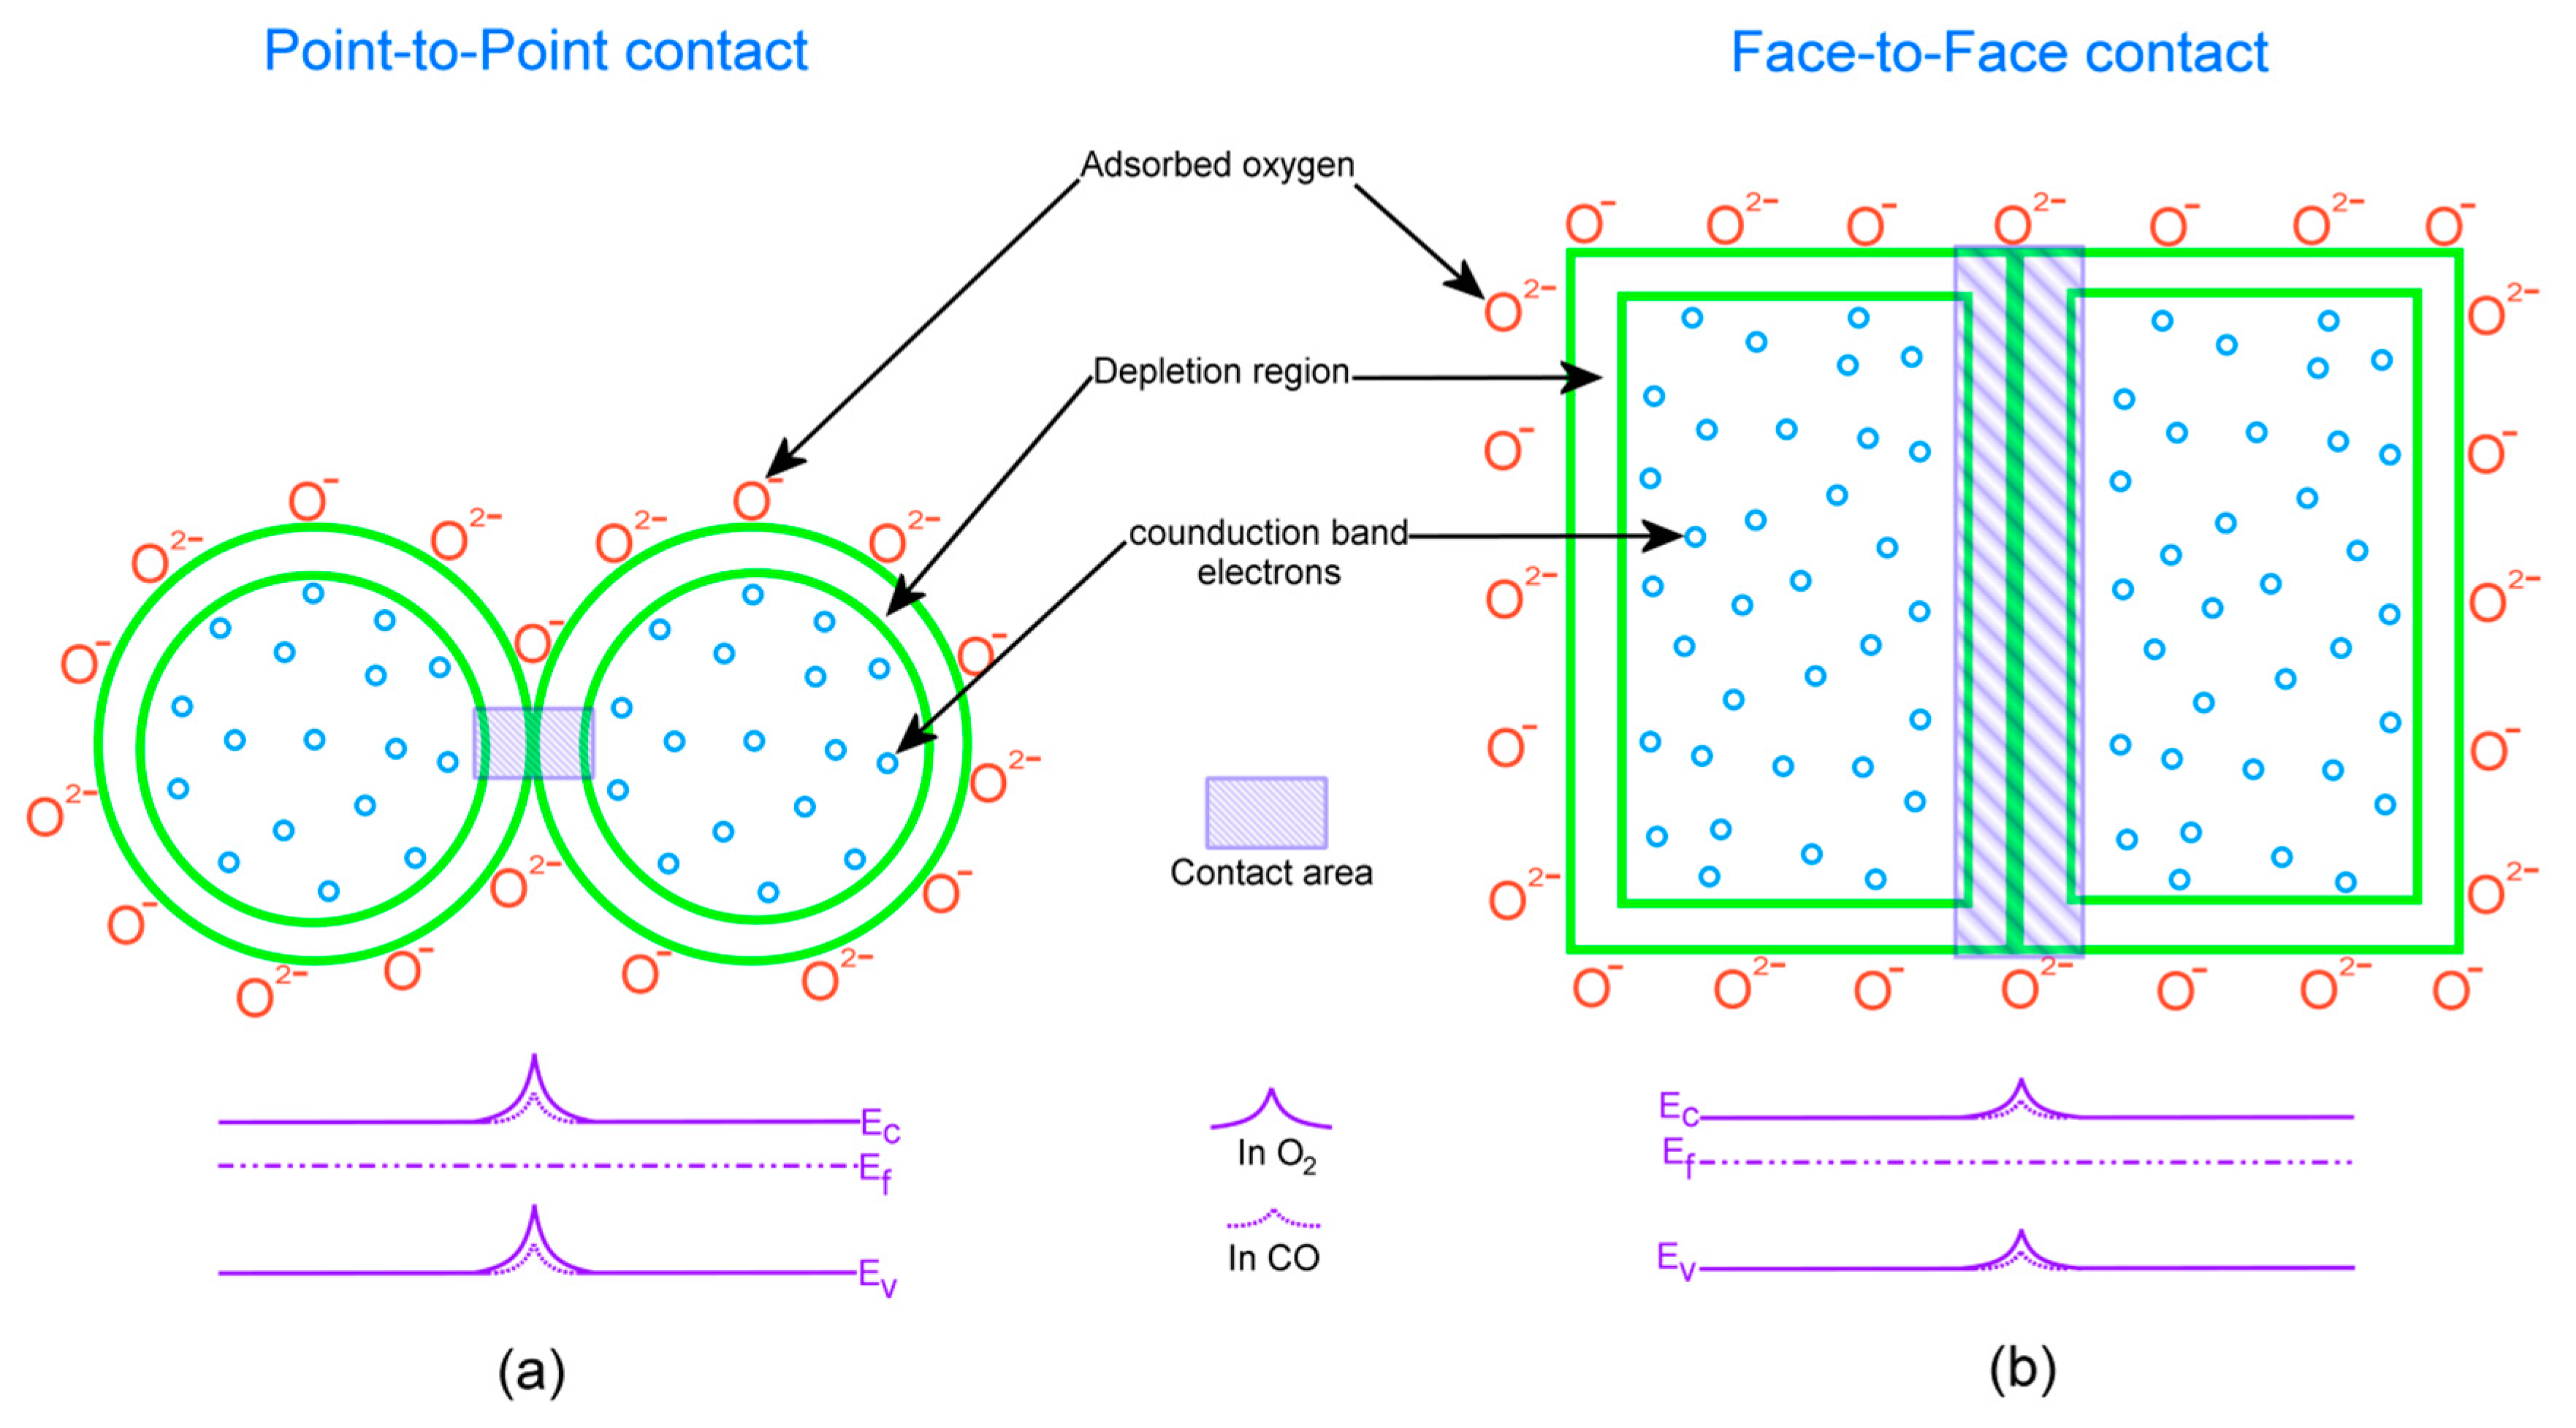
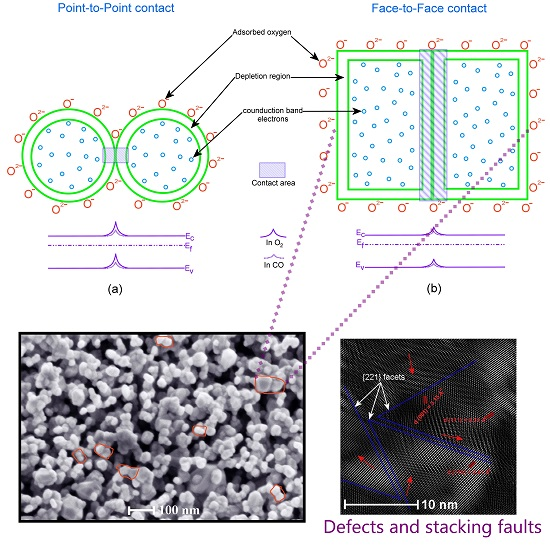
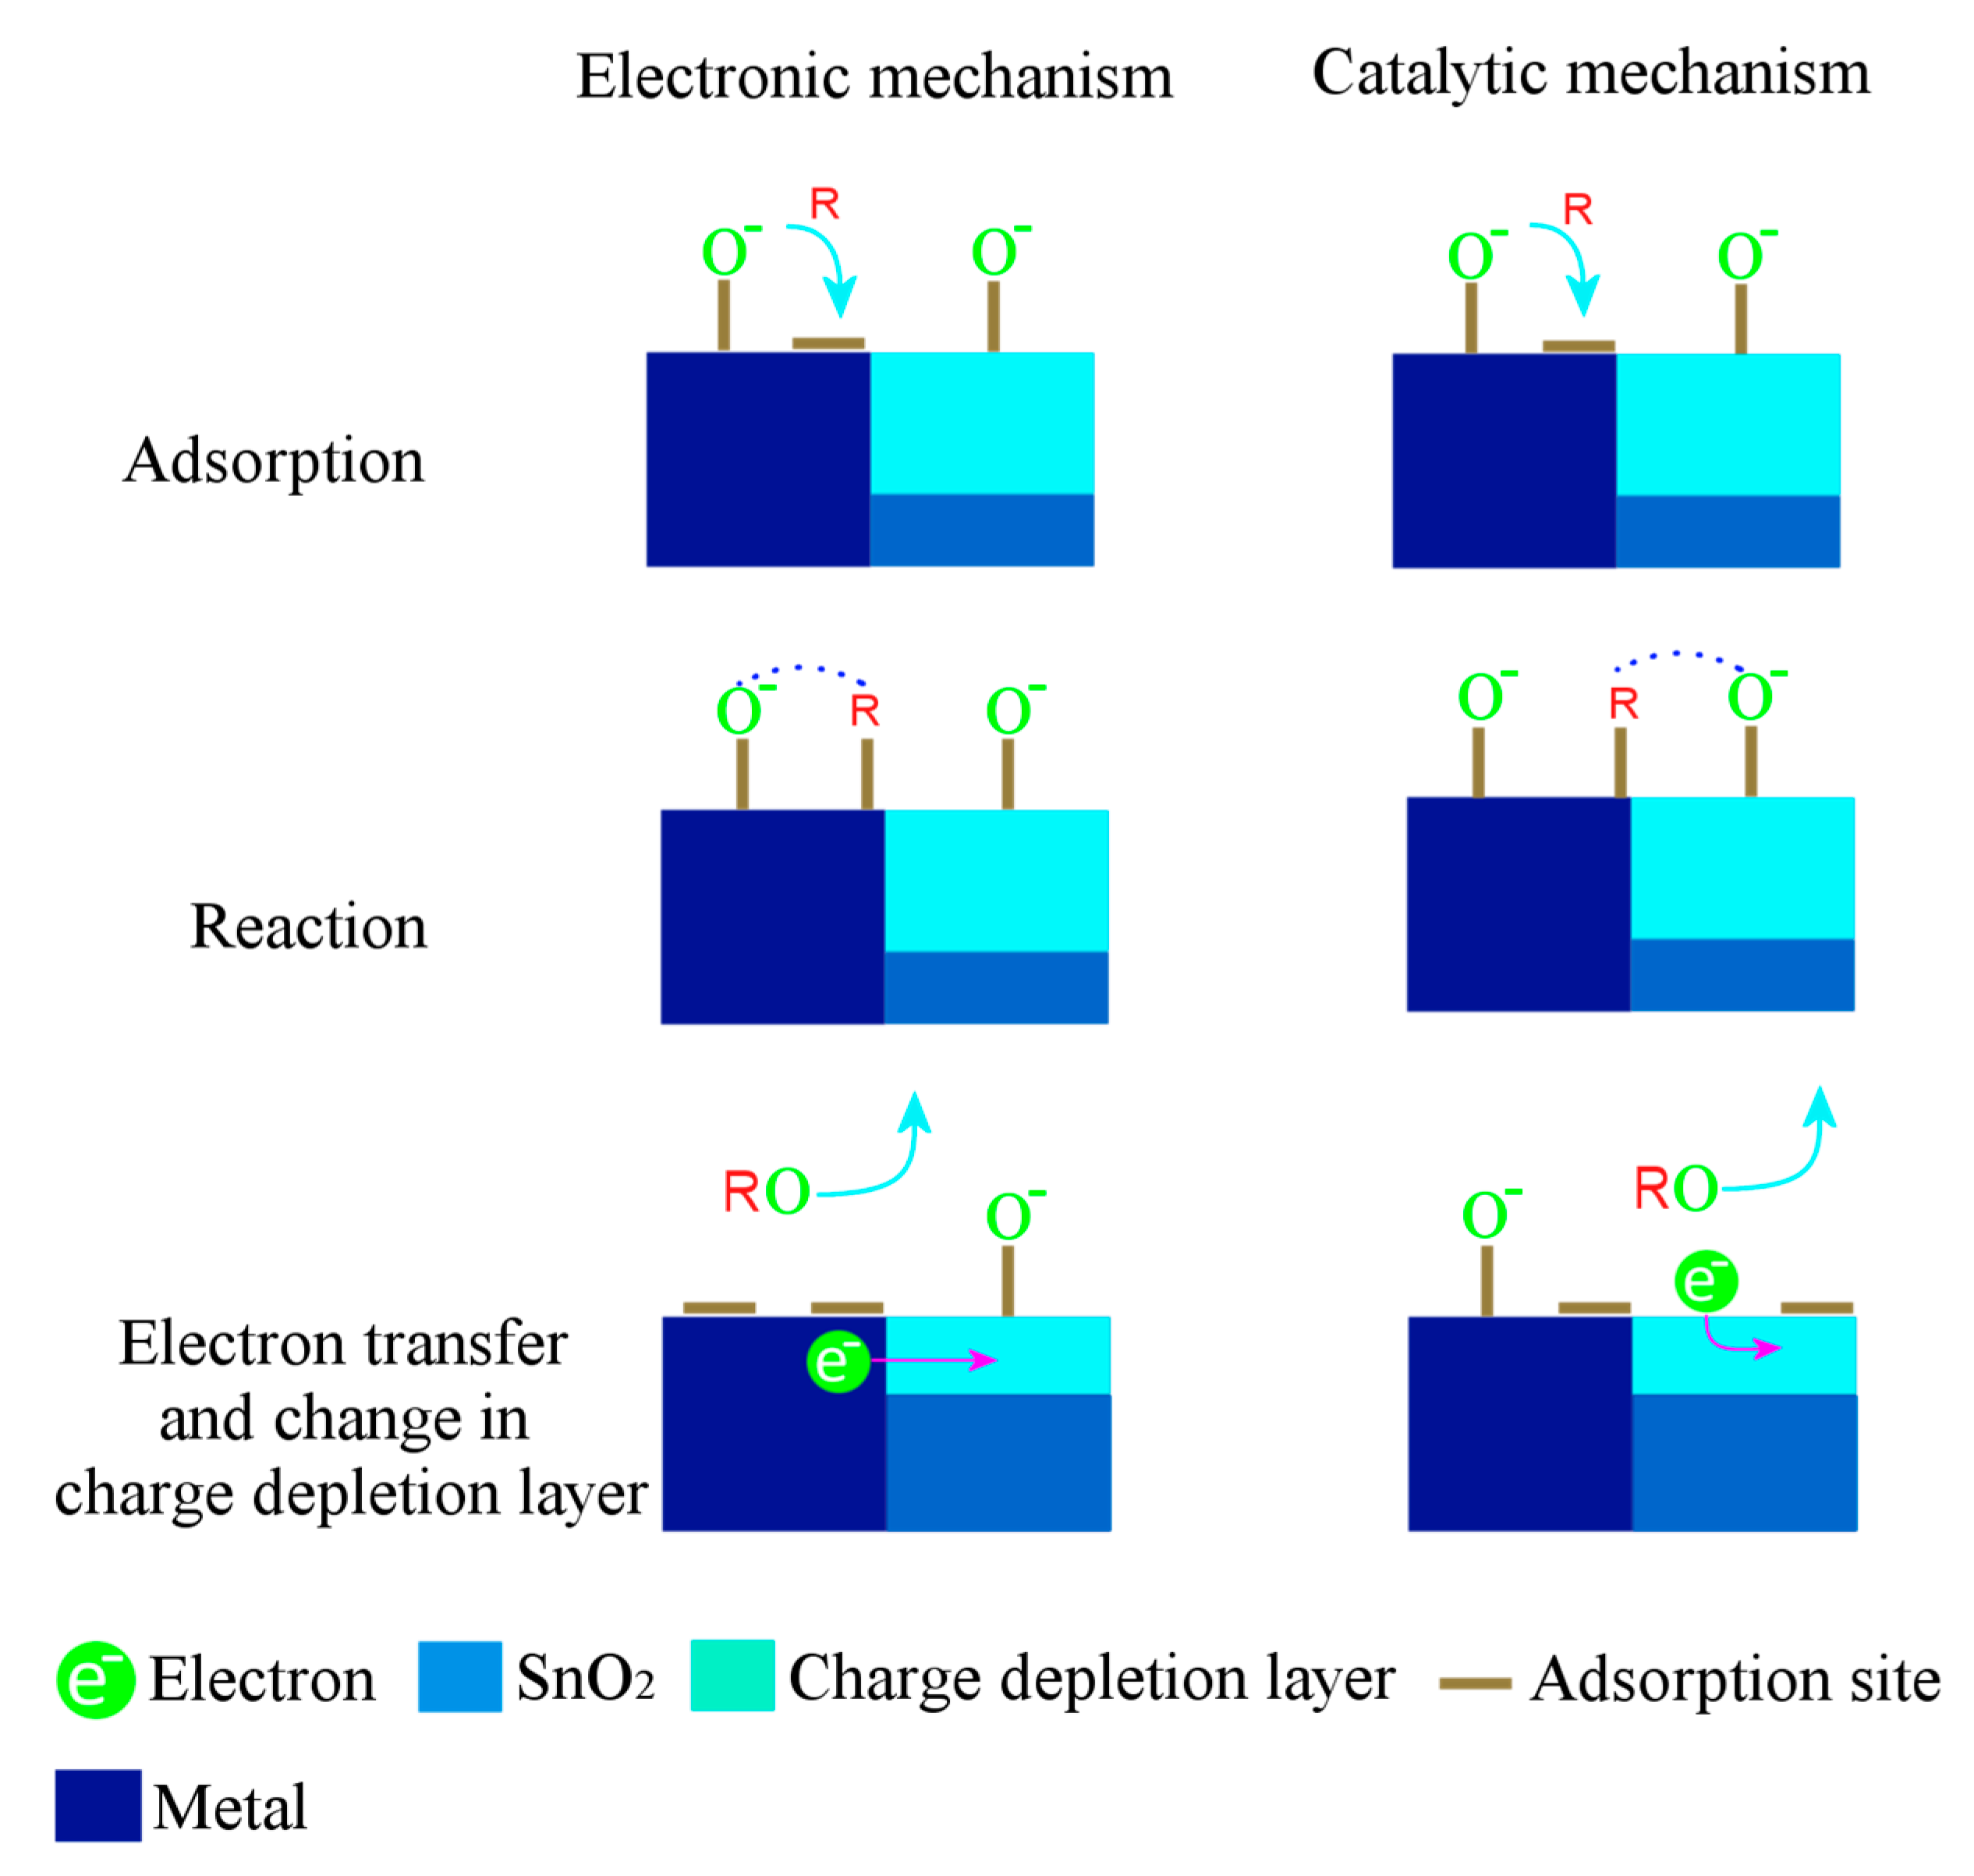
Gas-Sensing Mechanism
5. Conclusions
Acknowledgments
Author Contributions
Conflicts of Interest
References
- Orozco, L. Gas Detectors: Analog Dialogue: Analog Devices 2015. Available online: http://www.analog.com/en/analog-dialogue/articles/designing-low-power-toxic-gas-detector.html (accessed on 28 April 2017).
- Vetter, S.; Haffer, S.; Wagner, T.; Tiemann, M. Nanostructured Co3O4 as a CO gas sensor: Temperature-dependent behavior. Sens. Actuator B Chem. 2015, 206, 133–138. [Google Scholar] [CrossRef]
- Ciureanu, P.; Middelhoek, S. Thin Film Resistive Sensors, 1st ed.; Institute of Physics: Philadelphia, PA, USA, 1992; pp. 232–345. [Google Scholar]
- Marc, J.M.; Morrison, S.R. Chemical Sensing with Solid State Devices, 1st ed.; Harcourt Brace Jovanovich: London, UK, 2012; pp. 479–516. [Google Scholar]
- Yamazoe, N.; Fuchigami, J.; Kishikawa, M.; Seiyama, T. Interactions of tin oxide surface with O2, H2O and H2. Surf. Sci. 1979, 86, 335–344. [Google Scholar] [CrossRef]
- Heiland, G. Homogeneous semiconducting gas sensors. Sens. Actuator 1981, 2, 343–361. [Google Scholar] [CrossRef]
- Morrison, S.R. Semiconductor gas sensors. Sens. Actuator 1981, 2, 329–341. [Google Scholar] [CrossRef]
- Naoyoshi, T. Gas-Detecting Device. U.S. Patent 3,631,436, 28 December 1971. [Google Scholar]
- Wagner, C. Physical Chemistry of Ionic Crystals Involving Small Concentrations of Foreign Substances. J. Phys. Chem. 1953, 57, 738–742. [Google Scholar] [CrossRef]
- Barth, S.; Hernandez-Ramirez, F.; Holmes, J.D.; Romano-Rodriguez, A. Synthesis and applications of one-dimensional semiconductors. Prog. Mater. Sci. 2010, 55, 563–627. [Google Scholar] [CrossRef]
- Choi, K.J.; Jang, H.W. One-Dimensional Oxide Nanostructures as Gas-Sensing Materials: Review and Issues. Sensors 2010, 10, 4083–4099. [Google Scholar] [CrossRef] [PubMed]
- Huang, X.-J.; Choi, Y.-K. Chemical sensors based on nanostructured materials. Sens. Actuator B Chem. 2007, 122, 659–671. [Google Scholar] [CrossRef]
- Mathur, S.; Ganesan, R.; Grobelsek, I.; Shen, H.; Ruegamer, T.; Barth, S. Plasma-Assisted Modulation of Morphology and Composition in Tin Oxide Nanostructures for Sensing Applications. Adv. Eng. Mater. 2007, 9, 658–663. [Google Scholar] [CrossRef]
- Gas’kov, A.M.; Rumyantseva, M.N. Nature of Gas Sensitivity in Nanocrystalline Metal Oxides. Russ. J. Appl. Chem. 2001, 74, 440–444. [Google Scholar] [CrossRef]
- Zhang, S.; Sun, D.; Fu, Y.; Du, H. Recent advances of superhard nanocomposite coatings: A review. Surf. Coat. Technol. 2003, 167, 113–119. [Google Scholar] [CrossRef]
- Korotcenkov, G. Practical aspects in design of one-electrode semiconductor gas sensors: Status report. Sens. Actuator B Chem. 2007, 121, 664–678. [Google Scholar] [CrossRef]
- Korotcenkov, G. Gas response control through structural and chemical modification of metal oxide films: State of the art and approaches. Sens. Actuator B Chem. 2005, 107, 209–232. [Google Scholar] [CrossRef]
- Korotcenkov, G.; Cho, B.K. Thin film SnO2-based gas sensors: Film thickness influence. Sens. Actuator B Chem. 2009, 142, 321–330. [Google Scholar] [CrossRef]
- Yang, D. Nanocomposite Films for Gas Sensing. InTechOpen 2015, 1, 857–882. [Google Scholar]
- Camargo, P.H.C.; Satyanarayana, K.G.; Wypych, F. Nanocomposites: Synthesis, structure, properties and new application opportunities. Mater. Res. 2009, 12, 1–39. [Google Scholar] [CrossRef]
- Fang, H.; Miller, T.M.; Magruder, R.H.; Weller, R.A. The effect of strain on the resistivity of indium tin oxide films prepared by pulsed laser deposition. J. Appl. Phys. 2002, 91, 6194–6196. [Google Scholar] [CrossRef]
- Vaishnav, V.S.; Patel, P.D.; Patel, N.G. Indium Tin Oxide thin film gas sensors for detection of ethanol vapours. Thin Solid Films 2005, 490, 94–100. [Google Scholar] [CrossRef]
- Gorley, P.M.; Khomyak, V.V.; Bilichuk, S.V.; Orletsky, I.G.; Horley, P.P.; Grechko, V.O. SnO2 films: Formation, electrical and optical properties. Mater. Sci. Eng. B 2005, 118, 160–163. [Google Scholar] [CrossRef]
- Yoo, K.S.; Park, S.H.; Kang, J.H. Nano-grained thin-film indium tin oxide gas sensors for H2 detection. Sens. Actuator B Chem. 2005, 108, 159–164. [Google Scholar] [CrossRef]
- Vasu, V.; Subrahmanyan, A. Physical properties of sprayed SnO2 films. Thin Solid Films 1991, 202, 283–288. [Google Scholar] [CrossRef]
- Zhang, G.; Liu, M. Effect of particle size and dopant on properties of SnO2-based gas sensors. Sens. Actuator B Chem. 2000, 69, 144–152. [Google Scholar] [CrossRef]
- Korotcenkov, G.; Brinzari, V.; Boris, I. (Cu, Fe, Co, or Ni)-doped tin dioxide films deposited by spray pyrolysis: Doping influence on film morphology. J. Mater. Sci. 2008, 43, 2761–2770. [Google Scholar] [CrossRef]
- Mädler, L.; Sahm, T.; Gurlo, A.; Grunwaldt, J.-D.; Barsan, N.; Weimar, U.; Pratsinis, S.E. Sensing low concentrations of CO using flame-spray-made Pt/SnO2 nanoparticles. J. Mater. Sci. 2006, 8, 783–796. [Google Scholar] [CrossRef]
- Fang, G.; Liu, Z.; Zhang, Z.; Hu, Y.; Ashur, I.A.; Yao, K.L. Preparation of SnO2-CuO nanocrystalline powders in two different ways by the sol-gel method. Phys. Status Solidi 1996, 156, 15–22. [Google Scholar] [CrossRef]
- Cirera, A.; Vilà, A.; Diéguez, A.; Cabot, A.; Cornet, A.; Morante, J.R. Microwave processing for the low cost, mass production of undoped and in situ catalytic doped nanosized SnO2 gas sensor powders. Sens. Actuator B Chem. 2000, 64, 65–69. [Google Scholar] [CrossRef]
- Song, K.C.; Kang, Y. Preparation of high surface area tin oxide powders by a homogeneous precipitation method. Mater. Lett. 2000, 42, 283–289. [Google Scholar] [CrossRef]
- Déchamps, M.; Djuriçić, B.; Pickering, S. Structure of Zirconia Prepared by Homogeneous Precipitation. J. Am. Ceram. Soc. 1995, 78, 2873–2880. [Google Scholar] [CrossRef]
- Karthik, T.V.K.; Maldonado, A.; Olvera, M.D.L.L. Synthesis of tin oxide powders by homogeneous precipitation. Structural and morphological characterization. In Proceedings of the 10th International Conference on Electrical Engineering, Computing Science and Automatic Control (CCE), Mexico City, Mexico, 26–28 September 2012; pp. 1–8. [Google Scholar]
- Karthik, T.V.K.; Maldonado, A.; Olvera, M.D.L.L. Manufacturing of tin oxide pellets and their application for CO and C3H8 gas sensors. In Proceedings of the 2013 10th International Conference on Electrical Engineering, Computing Science and Automatic Control (CCE), Mexico City, Mexico, 30 September–4 October 2013; pp. 402–406. [Google Scholar]
- Haines, J.; Léger, J.M. X-ray diffraction study of the phase transitions and structural evolution of tin dioxide at high pressure: Relationships between structure types and implications for other rutile-type dioxides. Phys. Rev. B 1997, 55, 11144. [Google Scholar] [CrossRef]
- Giri, P.K.; Bhattacharyya, S.; Singh, D.K.; Kesavamoorthy, R.; Panigrahi, B.K.; Nair, K.G.M. Correlation between microstructure and optical properties of ZnO nanoparticles synthesized by ball milling. J. Appl. Phys. 2007, 102, 093515. [Google Scholar] [CrossRef]
- Patterson, A.L. The Diffraction of X-Rays by Small Crystalline Particles. Phys. Rev. 1939, 56, 972. [Google Scholar] [CrossRef]
- Cullity, B.D.; Stock, S.R. Elements of X-ray Diffraction, 3rd ed.; Pearson: San Francisco, CA, USA, 2001; Volume 3, pp. 294–366. [Google Scholar]
- Dar, M.A.; Batoo, K.M.; Verma, V.; Siddiqui, W.A.; Kotnala, R.K. Synthesis and characterization of nano-sized pure and Al-doped lithium ferrite having high value of dielectric constant. J. Alloys Compd. 2010, 493, 553–560. [Google Scholar] [CrossRef]
- Shannon, R.D. Revised effective ionic radii and systematic studies of interatomic distances in halides and chalcogenides. Acta Crystallogr. Sect. A Cryst. Phys. Diffr. Theor. Gen. Crystallogr. 1976, 32, 751–767. [Google Scholar] [CrossRef]
- Jarzebski, Z.M.; Marton, J.P. Physical Properties of SnO2 Materials: I. Preparation and Defect Structure. J. Electrochem. Soc. 1976, 123, 199–205. [Google Scholar] [CrossRef]
- Traylor, J.G.; Smith, H.G.; Nicklow, R.M.; Wilkinson, M.K. Lattice Dynamics of Rutile 2015. Phys. Rev. B 1971, 3, 3457. [Google Scholar] [CrossRef]
- Srinivas, K.; Vithal, M.; Sreedhar, B.; Raja, M.M.; Reddy, P.V. Structural, Optical, and Magnetic Properties of Nanocrystalline Co Doped SnO2 Based Diluted Magnetic Semiconductors. J. Phys. Chem. C 2009, 113, 3543–3552. [Google Scholar] [CrossRef]
- Katiyar, R.S. Dynamics of the rutile structure. I. Space group representations and the normal mode analysis. J. Phys. C Solid State Phys. 1970, 3, 1087–1096. [Google Scholar] [CrossRef]
- Wang, W.; Xu, C.; Wang, G.; Liu, Y.; Zheng, C. Synthesis and Raman scattering study of rutile SnO2 nanowires. J. Appl. Phys. 2002, 92, 2740–2742. [Google Scholar] [CrossRef]
- Azam, A.; Ahmed, A.S.; Habib, S.S.; Naqvi, A.H. Effect of Mn doping on the structural and optical properties of SnO2 nanoparticles. J. Alloys Compd. 2012, 523, 83–87. [Google Scholar] [CrossRef]
- Fliegel, W.; Behr, G.; Werner, J.; Krabbes, G. Preparation, development of microstructure, electrical and gas-sensitive properties of pure and doped SnO2 powders. Sens. Actuator B Chem. 1994, 19, 474–477. [Google Scholar] [CrossRef]
- Matsuura, Y.; Takahata, K. Stabilization of SnO2 sintered gas sensors. Sens. Actuator B Chem. 1991, 5, 205–209. [Google Scholar] [CrossRef]
- Lifshitz, I.M.; Slyozov, V.V. The kinetics of precipitation from supersaturated solid solutions. J. Phys. Chem. Solids 1961, 19, 35–50. [Google Scholar] [CrossRef]
- Korotcenkov, G.; Cornet, A.; Rossinyol, E.; Arbiol, J.; Brinzari, V.; Blinov, Y. Faceting characterization of tin dioxide nanocrystals deposited by spray pyrolysis from stannic chloride water solution. Thin Solid Films 2005, 471, 310–319. [Google Scholar] [CrossRef]
- Liu, Y.; Dong, J.; Liu, M. Well-Aligned “Nano-Box-Beams” of SnO2. Adv. Mater. 2004, 16, 353–356. [Google Scholar] [CrossRef]
- Zhong, Z.; Yin, Y.; Gates, B.; Xia, Y. Preparation of Mesoscale Hollow Spheres of TiO2 and SnO2 by Templating Against Crystalline Arrays of Polystyrene Beads. Adv. Mater. 2000, 12, 206–209. [Google Scholar] [CrossRef]
- McAleer, J.F.; Moseley, P.T.; Norris, J.O.W.; Williams, D.E. Tin dioxide gas sensors. Part 1.—Aspects of the surface chemistry revealed by electrical conductance variations. J. Chem. Soc. Faraday Trans. 1 1987, 83, 1323–1346. [Google Scholar] [CrossRef]
- Martinez, C.J.; Hockey, B.; Montgomery, C.B.; Semancik, S. Porous tin oxide nanostructured microspheres for sensor applications. Langmuir 2005, 21, 7937–7944. [Google Scholar] [CrossRef] [PubMed]
- Batzill, M.; Katsiev, K.; Diebold, U. Surface morphologies of SnO2. Surf. Sci. 2003, 529, 295–311. [Google Scholar] [CrossRef]
- Han, X.; Jin, M.; Xie, S.; Kuang, Q.; Jiang, Z.; Jiang, Y.; Xie, Z.; Zheng, L. Synthesis of Tin Dioxide Octahedral Nanoparticles with Exposed High-Energy {221} Facets and Enhanced Gas-Sensing Properties. Angew. Chem. 2009, 121, 9344–9347. [Google Scholar] [CrossRef]
- Alim, K.A.; Fonoberov, V.A.; Shamsa, M.; Balandin, A.A. Micro-Raman investigation of optical phonons in ZnO nanocrystals. J. Appl. Phys. 2005, 97, 124313. [Google Scholar] [CrossRef]
- Zheng, J.G. Dislocations in nanocrystalline SnO2 thin films. Philos. Mag. Lett. 1996, 73, 93–100. [Google Scholar] [CrossRef]
- Lee, J.-H. Gas sensors using hierarchical and hollow oxide nanostructures: Overview. Sens. Actuator B Chem. 2009, 140, 319–336. [Google Scholar] [CrossRef]
- Kim, H.-J.; Lee, J.-H. Highly sensitive and selective gas sensors using p-type oxide semiconductors: Overview. Sens. Actuators B Chem. 2014, 192, 607–627. [Google Scholar] [CrossRef]
- Choi, S.-W.; Katoch, A.; Sun, G.-J.; Kim, J.-H.; Kim, S.-H.; Kim, S.S. Dual Functional Sensing Mechanism in SnO2–ZnO Core–Shell Nanowires. ACS Appl. Mater. Interfaces 2014, 6, 8281–8287. [Google Scholar] [CrossRef] [PubMed]
- Wang, X.; Wang, Y.; Tian, F.; Liang, H.; Wang, K.; Zhao, X.; Lu, Z.; Jiang, K.; Yang, L.; Lou, X. From the Surface Reaction Control to Gas-Diffusion Control: The Synthesis of Hierarchical Porous SnO2 Microspheres and Their Gas-Sensing Mechanism. J. Phys. Chem. C 2015, 119, 15963–15976. [Google Scholar] [CrossRef]
- Ma, N.; Suematsu, K.; Yuasa, M.; Shimanoe, K. Pd Size Effect on the Gas Sensing Properties of Pd-Loaded SnO2 in Humid Atmosphere. ACS Appl. Mater. Interfaces 2015, 7, 15618–15625. [Google Scholar] [CrossRef] [PubMed]
- Kumar, M.; Kumar, A.; Abhyankar, A.C. Influence of Texture Coefficient on Surface Morphology and Sensing Properties of W-Doped Nanocrystalline Tin Oxide Thin Films. ACS Appl. Mater. Interfaces 2015, 7, 3571–3580. [Google Scholar] [CrossRef] [PubMed]
- Ma, N.; Suematsu, K.; Yuasa, M.; Kida, T.; Shimanoe, K. Effect of Water Vapor on Pd-Loaded SnO2 Nanoparticles Gas Sensor. ACS Appl. Mater. Interfaces 2015, 7, 5863–5869. [Google Scholar] [CrossRef] [PubMed]
- Sun, Z.P.; Liu, L.; Zhang, L.; Jia, D.Z. Rapid synthesis of ZnO nano-rods by one-step, room-temperature, solid-state reaction and their gas-sensing properties. Nanotechnology 2006, 17, 2266–2270. [Google Scholar] [CrossRef]
- Lian, Y.; Liu, S.; Hu, Q. Sensors for carbon monoxide based on Pd/SnO2/CNT nanocomposites. Phys. Status Solidi 2014, 211, 2729–2734. [Google Scholar]
- Chen, Y.; Ma, J.; Mei, L. Gas Sensing of SnO2 Nanocrystals Revisited: Developing Ultra-Sensitive Sensors for Detecting the H2S Leakage of Biogas. Sci. Rep. 2014, 4, 1–8. [Google Scholar]
- Korotcenkov, G. Metal oxides for solid-state gas sensors: What determines our choice? Mater. Sci. Eng. B 2007, 139, 1–23. [Google Scholar] [CrossRef]
- Wang, N.; Cai, Y.; Zhang, R.Q. Growth of nanowires. Mater. Sci. Eng. R Rep. 2008, 60, 1–51. [Google Scholar] [CrossRef]
- Gryaznov, V.G.; Trusov, L.I. Size effects in micromechanics of nanocrystals. Prog. Mater. Sci. 1993, 37, 289–401. [Google Scholar] [CrossRef]
- Mulla, I.S.; Ramgir, N.S.; Hwang, Y.K.; Chang, J.-S. Semiconductor Tin Oxide Gas Sensors: From Bulk to Thin Films. J. Ind. Eng. Chem. 2004, 10, 1242–1256. [Google Scholar]
- 7Brinzari, V.; Korotcenkov, G.; Schwank, J.; Boris, Y. Chemisorptional approach to kinetic analysis of SnO2: Pd-based thin film gas sensors. J. Optoelectron. Adv. Mater. 2002, 4, 147–150. [Google Scholar]
- Kolmakov, A.; Chen, X.; Moskovits, M. Functionalizing Nanowires with Catalytic Nanoparticles for Gas Sensing Application. J. Nanosci. Nanotechnol. 2008, 8, 111–121. [Google Scholar] [CrossRef] [PubMed]
- Matsushima, S.; Maekawa, T.; Tamaki, J.; Miura, N.; Yamazoe, N. New methods for supporting palladium on a tin oxide gas sensor. Sens. Actuator B Chem. 1992, 9, 71–78. [Google Scholar] [CrossRef]


| Name of the Sample | Doping Method | Precipitation Agent | Dopant |
|---|---|---|---|
| Cu:SnO2_U_Chem | Chemical doping | Urea | Cu |
| Cu:SnO2_A_Chem | Chemical doping | Ammonia | |
| Cu:SnO2_U_Impe | Impregnation | Urea | |
| Cu:SnO2_A_Impe | Impregnation | Ammonia | |
| Pt:SnO2_U_Chem | Chemical doping | Urea | Pt |
| Pt:SnO2_A_Chem | Chemical doping | Ammonia | |
| Pt:SnO2_U_Impe | Impregnation | Urea | |
| Pt:SnO2_A_Impe | Impregnation | Ammonia | |
| Pd:SnO2_U_Chem | Chemical doping | Urea | Pd |
| Pd:SnO2_A_Chem | Chemical doping | Ammonia | |
| Pd:SnO2_U_Impe | Impregnation | Urea | |
| Pd:SnO2_A_Impe | Impregnation | Ammonia |
| Sample Name | D (nm) | V (10−24 cm3) | P (%) |
|---|---|---|---|
| SnO2_U | 26.3 | 71.4 | 32.3 |
| SnO2_A | 30.0 | 71.6 | 32.4 |
| Cu:SnO2_U_Chem | 21.2 | 71.7 | 58.4 |
| Cu:SnO2_A_Chem | 21.0 | 71.7 | 58.5 |
| Cu:SnO2_U_Impe | 22.2 | 71.7 | 58.5 |
| Cu:SnO2_A_Impe | 22.0 | 71.8 | 58.7 |
| Pt:SnO2_U_Chem | 35.0 | 71.8 | 64.6 |
| Pt:SnO2_A_Chem | 35.0 | 71.8 | 64.7 |
| Pt:SnO2_U_Impe | 33.0 | 71.8 | 64.8 |
| Pt:SnO2_A_Impe | 33.0 | 71.9 | 64.8 |
| Pd:SnO2_U_Chem | 42.0 | 72.0 | 73.0 |
| Pd:SnO2_A_Chem | 42.0 | 72.0 | 73.0 |
| Pd:SnO2_U_Impe | 40.0 | 72.0 | 73.0 |
| Pd:SnO2_A_Impe | 40.0 | 72.2 | 73.2 |
| Modes | Notation | Direction of Vibration with Respect to c-Axis | Raman Shift (cm−1) |
|---|---|---|---|
| Raman active | A1g | Perpendicular | 638 |
| B1g | Perpendicular | 100 | |
| B2g | Perpendicular | 782 | |
| Eg | Parallel | 476 | |
| IR active | A2u | Parallel | 705 |
| Eu | Perpendicular | 244 | |
| Silent | A2g | Perpendicular | 398 |
| B1u | Parallel | 140 |
| Dopant | SnO2–d (110) in Å | |||||
|---|---|---|---|---|---|---|
| Urea | Ammonia | Chemically Doped | Impregnated Powders | |||
| Urea | Ammonia | Urea | Ammonia | |||
| Undoped | 3.35853 | 3.35492 | - | - | - | - |
| Cu | - | - | 3.3732 | 3.36927 | 3.3682 | 3.3927 |
| Pt | - | - | 3.39422 | 3.38839 | 3.3801 | 3.35427 |
| Pd | - | - | 3.41855 | 3.40501 | 3.40697 | 3.35706 |
| Undoped | Cu | Pt | Pd | |
|---|---|---|---|---|
| U_Chem | 12 | - | - | - |
| A_Chem | 10 | - | - | - |
| U_Chem | 1782.609 | 1200 | 502.5 | |
| A_Chem | 1625 | 721.519 | 287.6405 | |
| U_Impe | 1666.667 | 428.7234 | 245.4546 | |
| A_Impe | 975.7412 | 387.3333 | 224.1485 |
| SnO2 Synthesis Method | SnO2 Precursor | Crystallite Size (nm) | Sensing Response (Ra/Rg at Specified Operating Temperature and Mole Fraction of Target Gas) | Reference |
|---|---|---|---|---|
| Vapor−liquid−solid | Sn Powder | ~75–90 | ~ 80 at 300 °C and at 10 ppm of CO | [61] |
| Hydrothermal process | SnCl2·2H2O | ~10 | ~ 78 at 220 °C and at 100 ppm of acetone | [62] |
| Hydrolysis and Precipitation | SnCl4·5H2O | ~15 | ~80 at 350 °C and at 600 ppm of CO | [63] |
| Chemical spray pyrolysis | SnCl4·5H2O | ~10 | ~132 at 225 °C and at 400 ppm of NO2 | [64] |
| Precipitation | SnCl4·5H2O | ~14 | ~100 at 350 °C and at 600 ppm of CO | [65] |
| One-step Solvothermal route | SnCl4·5H2O | ~10 | ~22.69 at 260 °C and at 50 ppm of ethanol gas | [66] |
| Sol-Gel | SnCl4·5H2O | ~8–20 | ~1.95 at 100 °C and at 5 ppm of CO | [67] |
| Hydrothermal synthesis | SnCl4·5H2O | ~3.4 ± 0.8 nm | ~357 at 100 °C and at 5 ppm of H2S | [68] |
| Present work | SnCl4·5H2O | ~35 | ~1782 at 300 °C and at 300ppm | -- |
© 2017 by the authors. Licensee MDPI, Basel, Switzerland. This article is an open access article distributed under the terms and conditions of the Creative Commons Attribution (CC BY) license (http://creativecommons.org/licenses/by/4.0/).
Share and Cite
Tangirala, V.K.K.; Gómez-Pozos, H.; Rodríguez-Lugo, V.; Olvera, M.D.L.L. A Study of the CO Sensing Responses of Cu-, Pt- and Pd-Activated SnO2 Sensors: Effect of Precipitation Agents, Dopants and Doping Methods. Sensors 2017, 17, 1011. https://doi.org/10.3390/s17051011
Tangirala VKK, Gómez-Pozos H, Rodríguez-Lugo V, Olvera MDLL. A Study of the CO Sensing Responses of Cu-, Pt- and Pd-Activated SnO2 Sensors: Effect of Precipitation Agents, Dopants and Doping Methods. Sensors. 2017; 17(5):1011. https://doi.org/10.3390/s17051011
Chicago/Turabian StyleTangirala, Venkata Krishna Karthik, Heberto Gómez-Pozos, Ventura Rodríguez-Lugo, and María De La Luz Olvera. 2017. "A Study of the CO Sensing Responses of Cu-, Pt- and Pd-Activated SnO2 Sensors: Effect of Precipitation Agents, Dopants and Doping Methods" Sensors 17, no. 5: 1011. https://doi.org/10.3390/s17051011