Application of FBG Sensing Technology in Stability Analysis of Geogrid-Reinforced Slope

Abstract
:1. Introduction
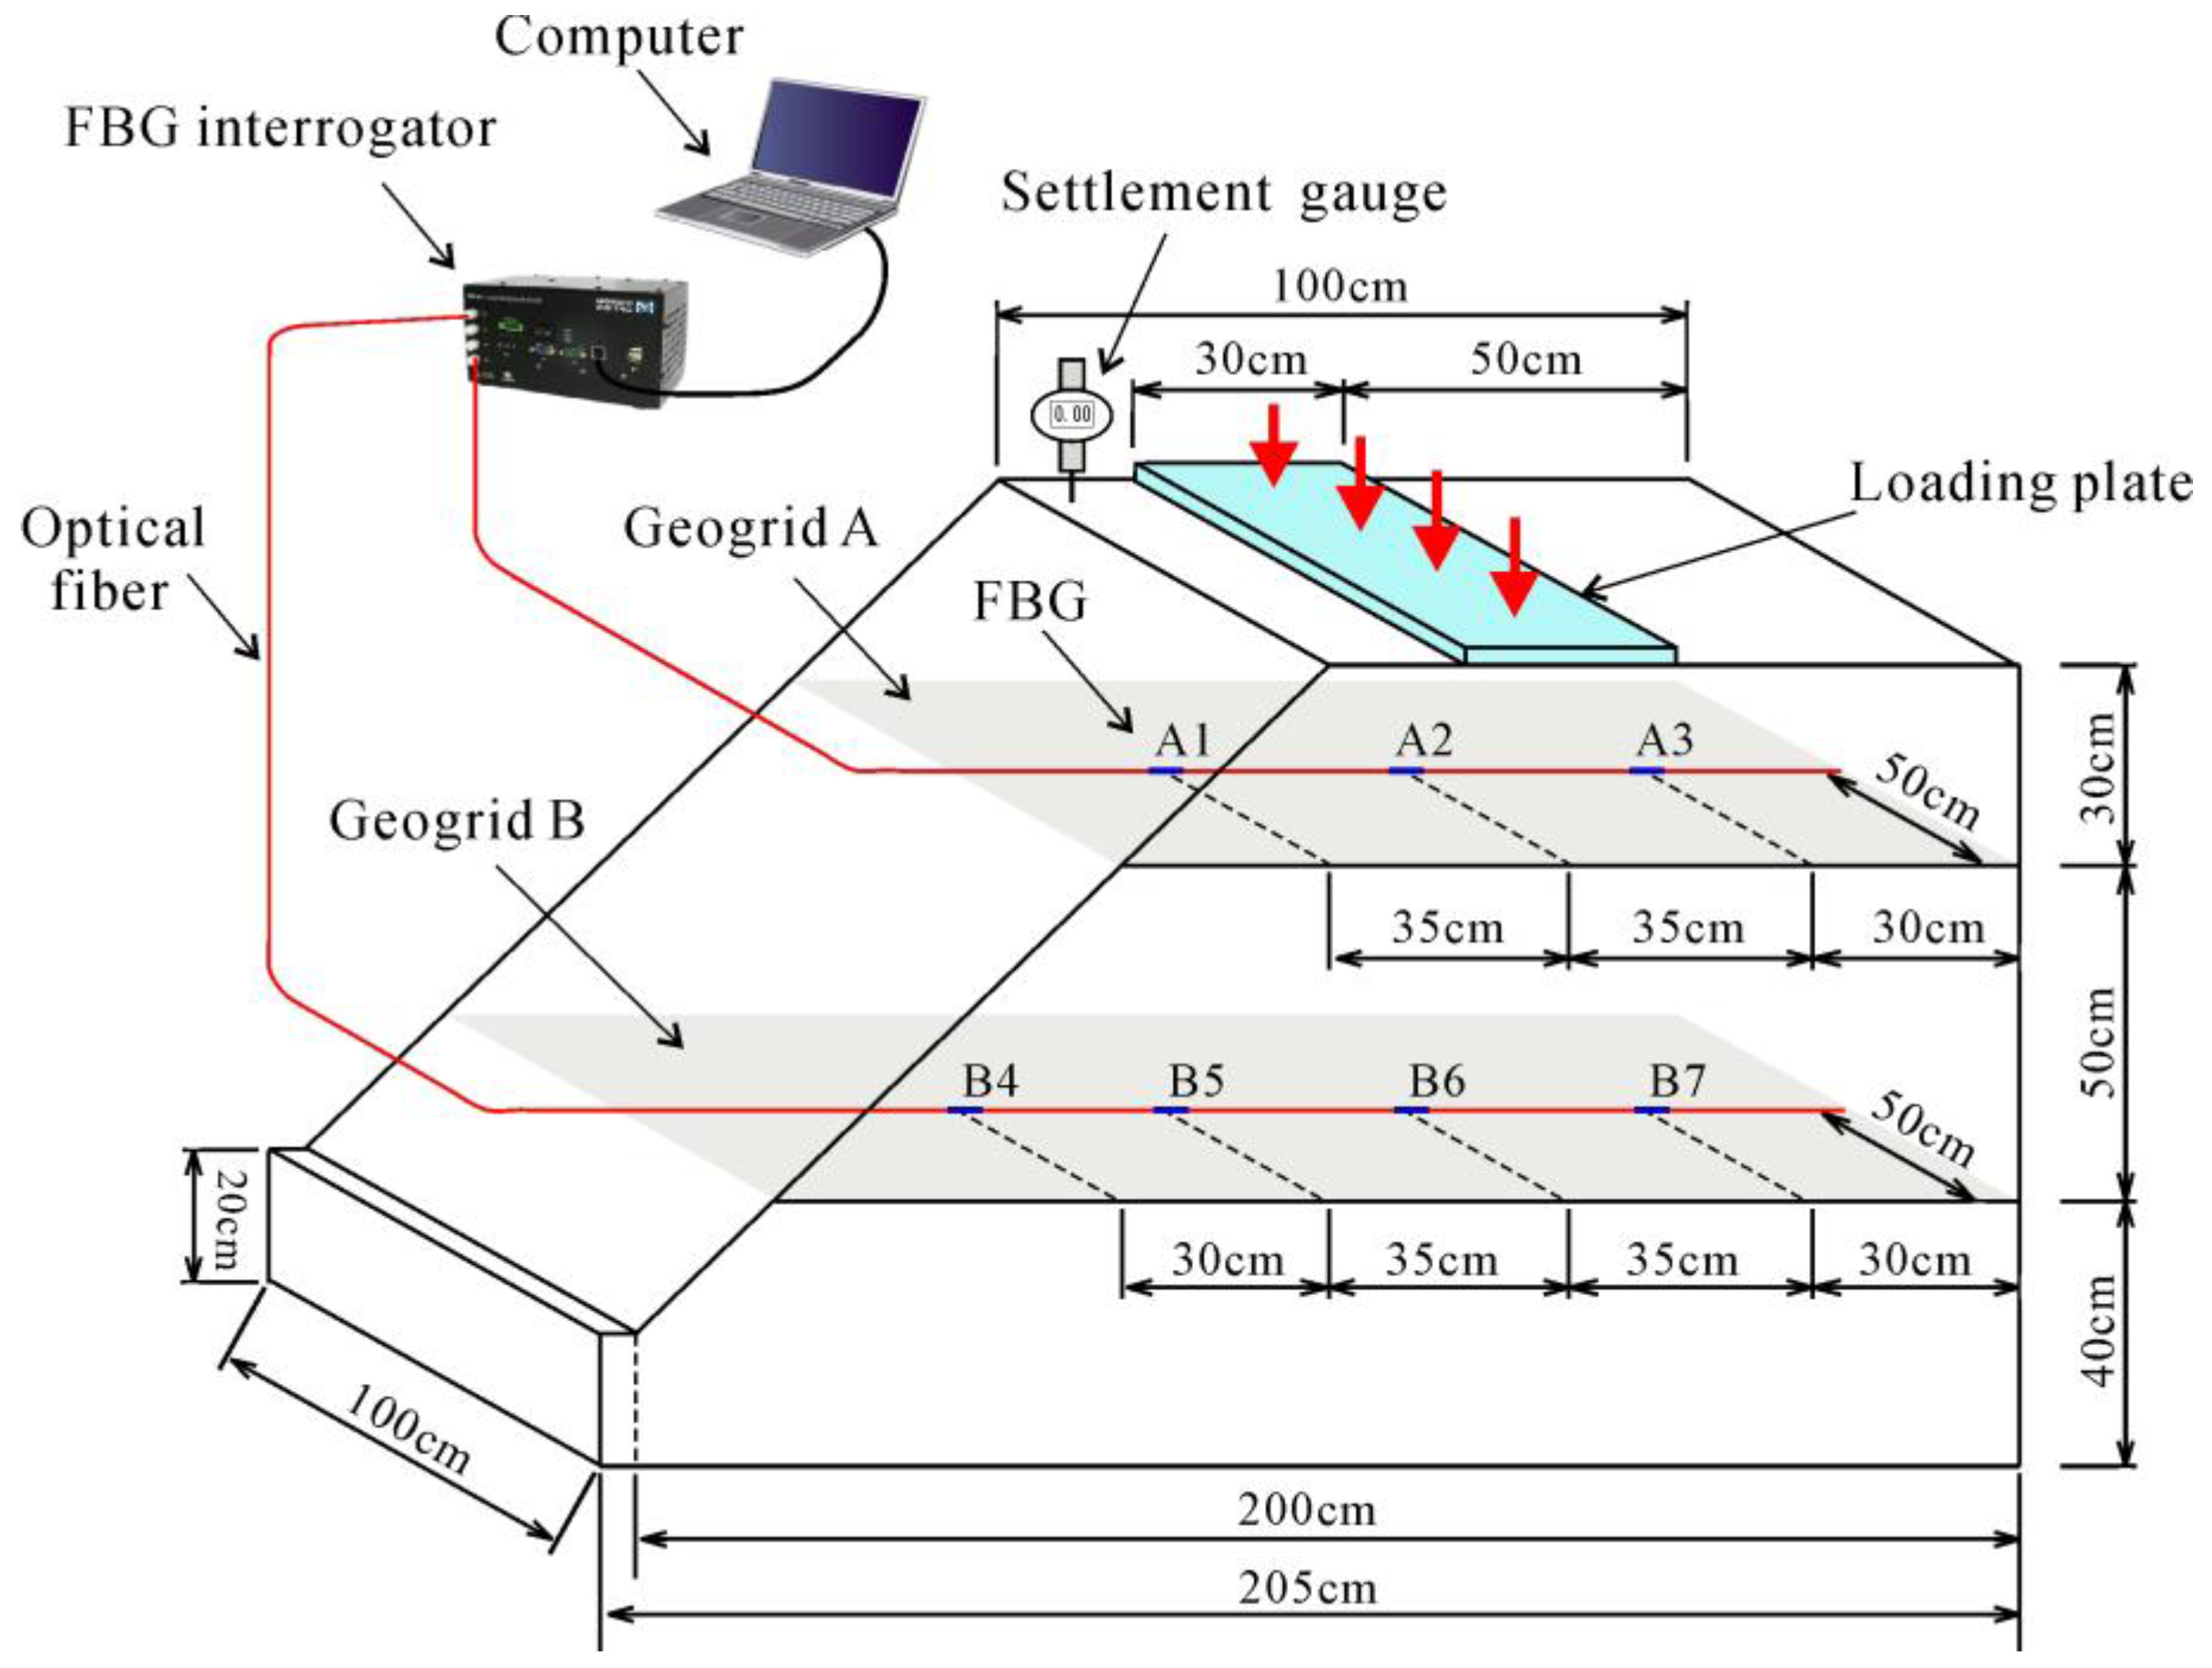
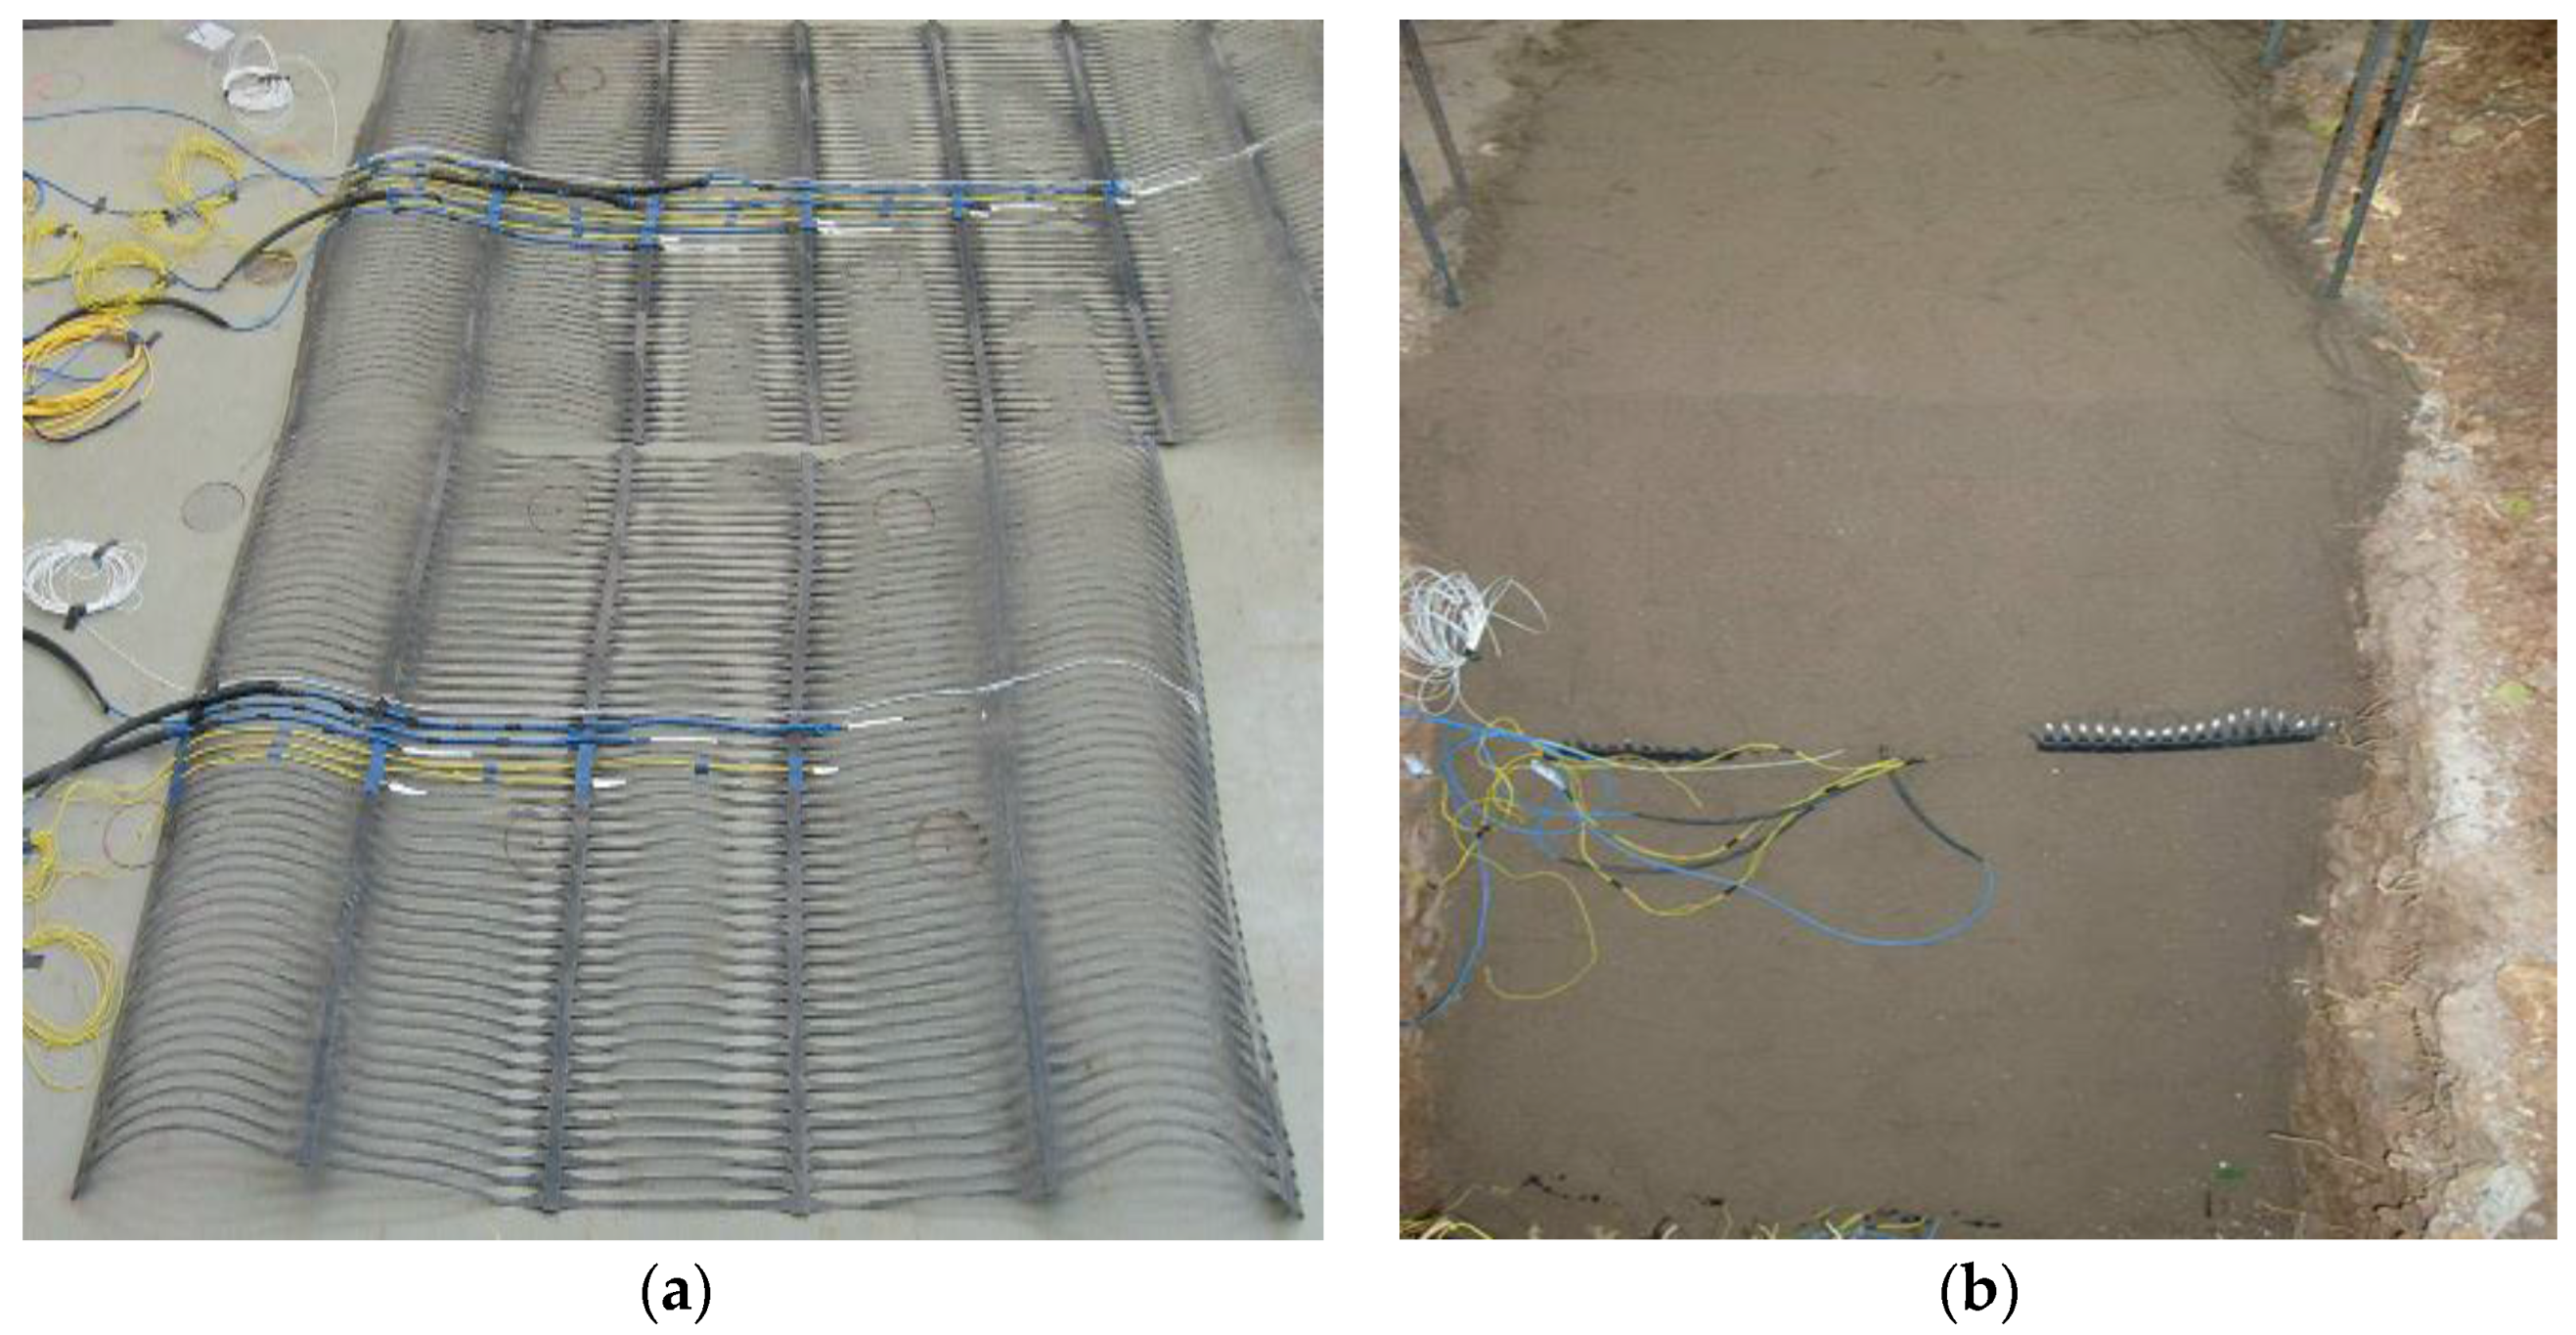
2. Model Test
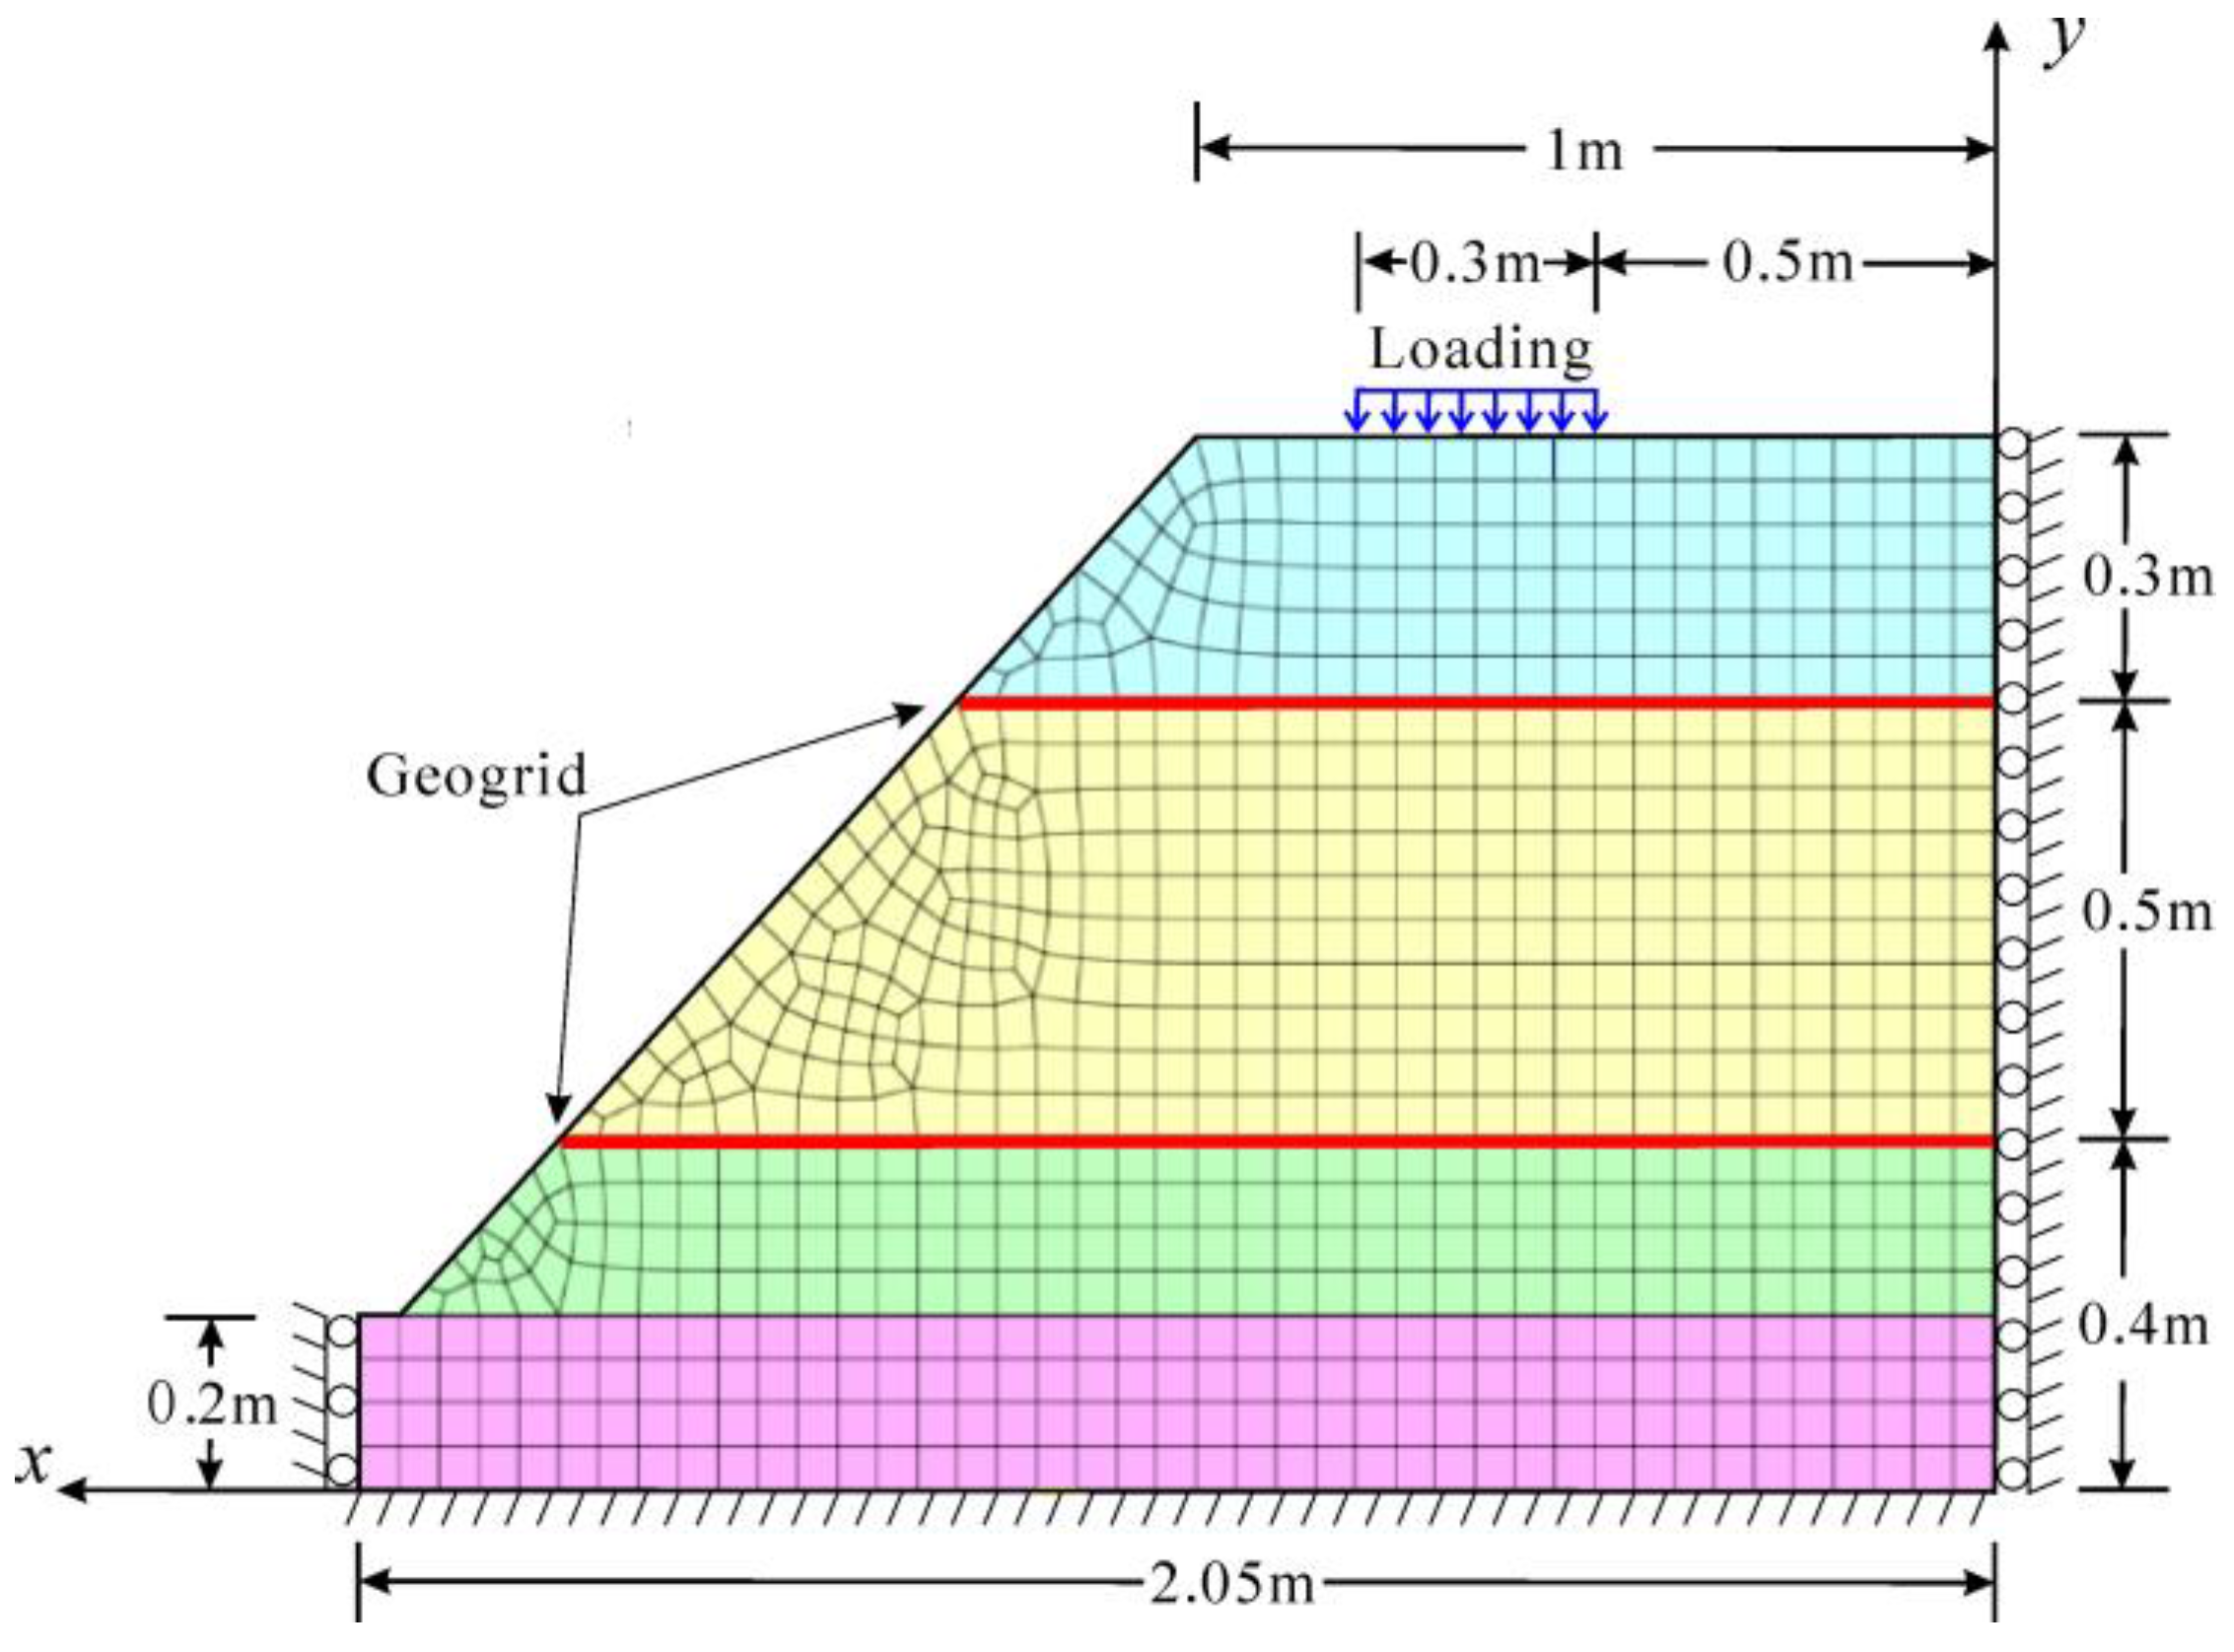
3. Numerical Simulation of Slope Model
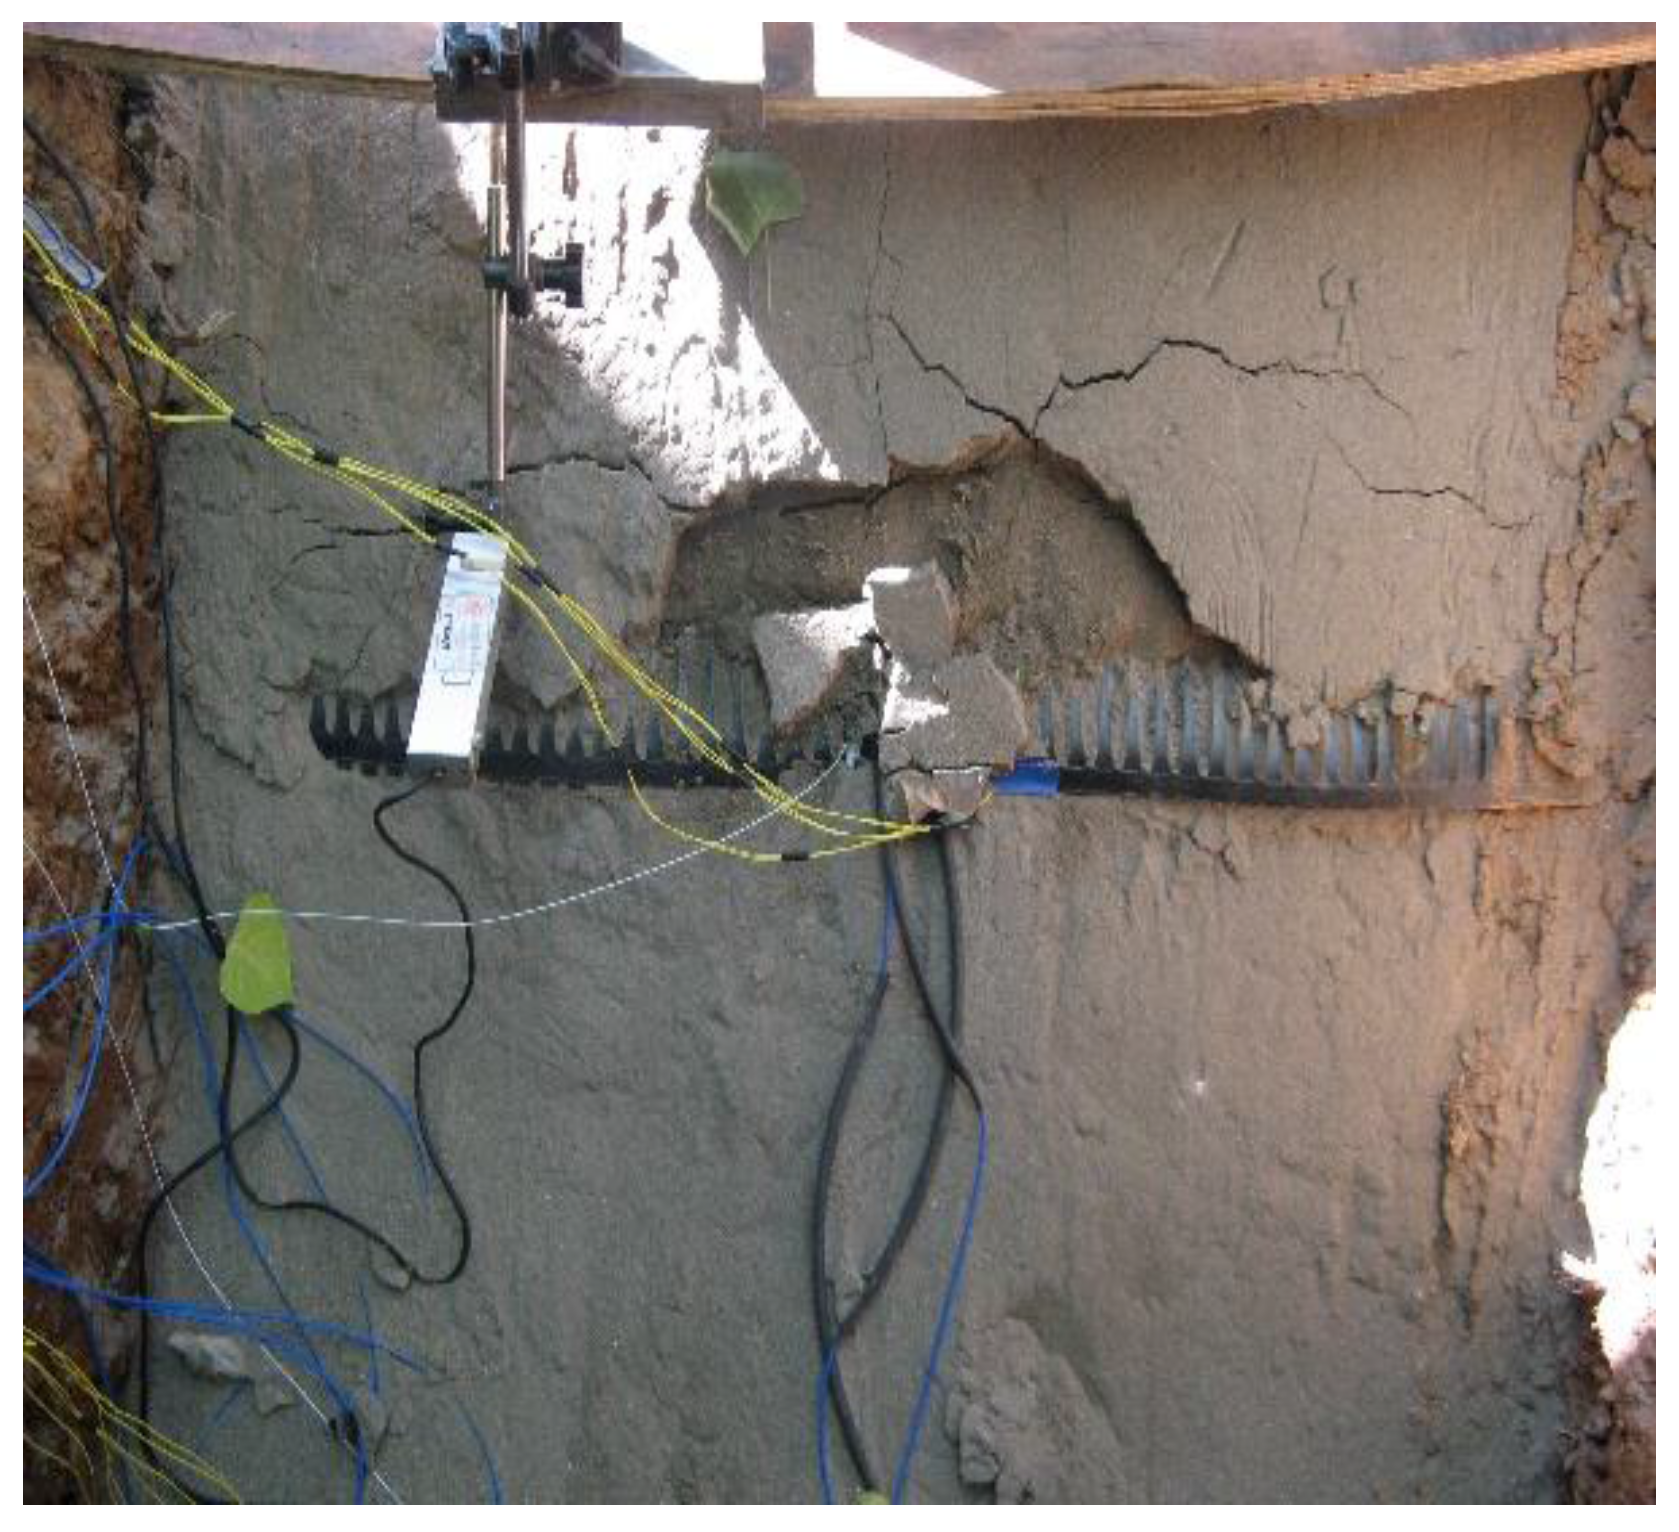
4. Test Results and Analysis
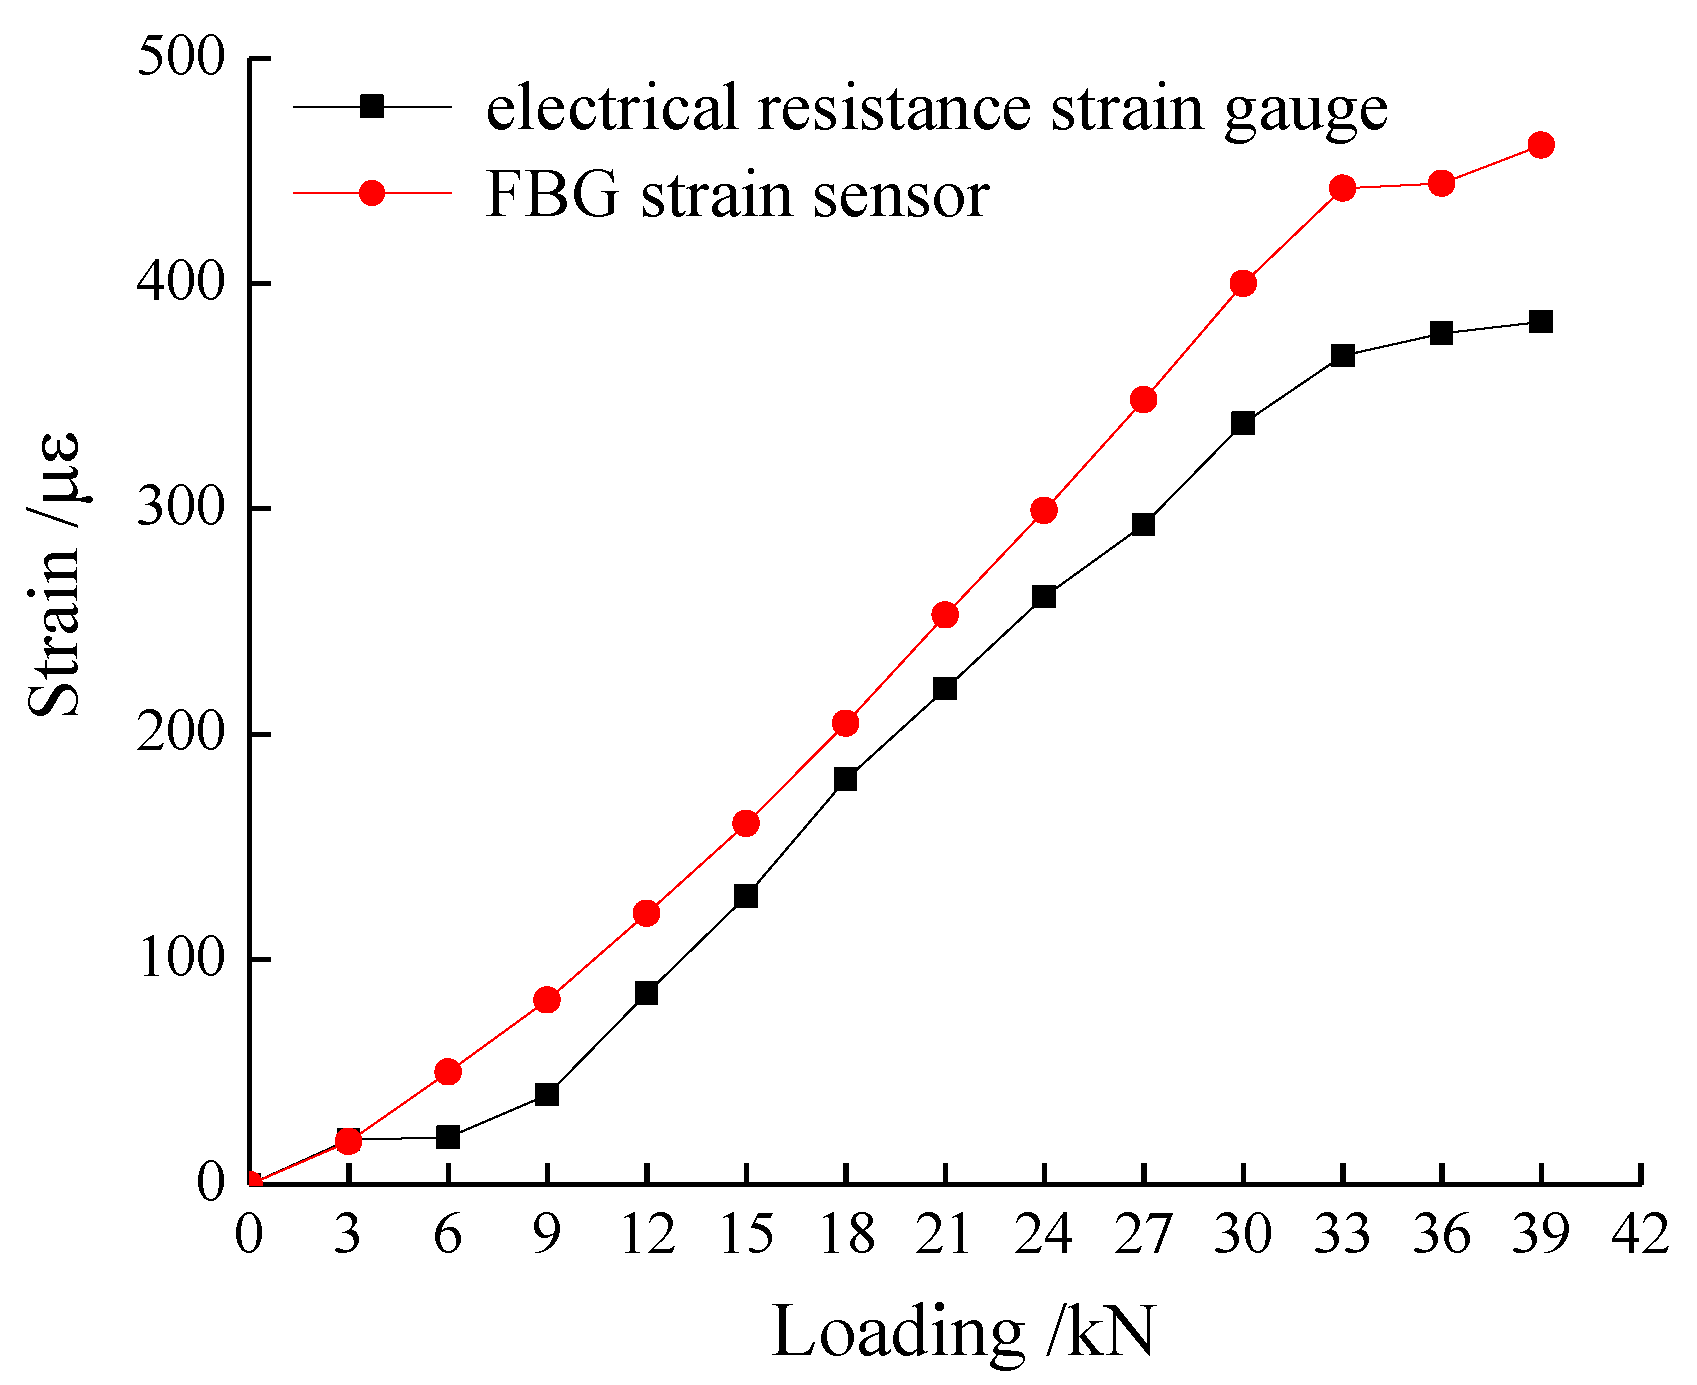
4.1. Strain Monitoring Results
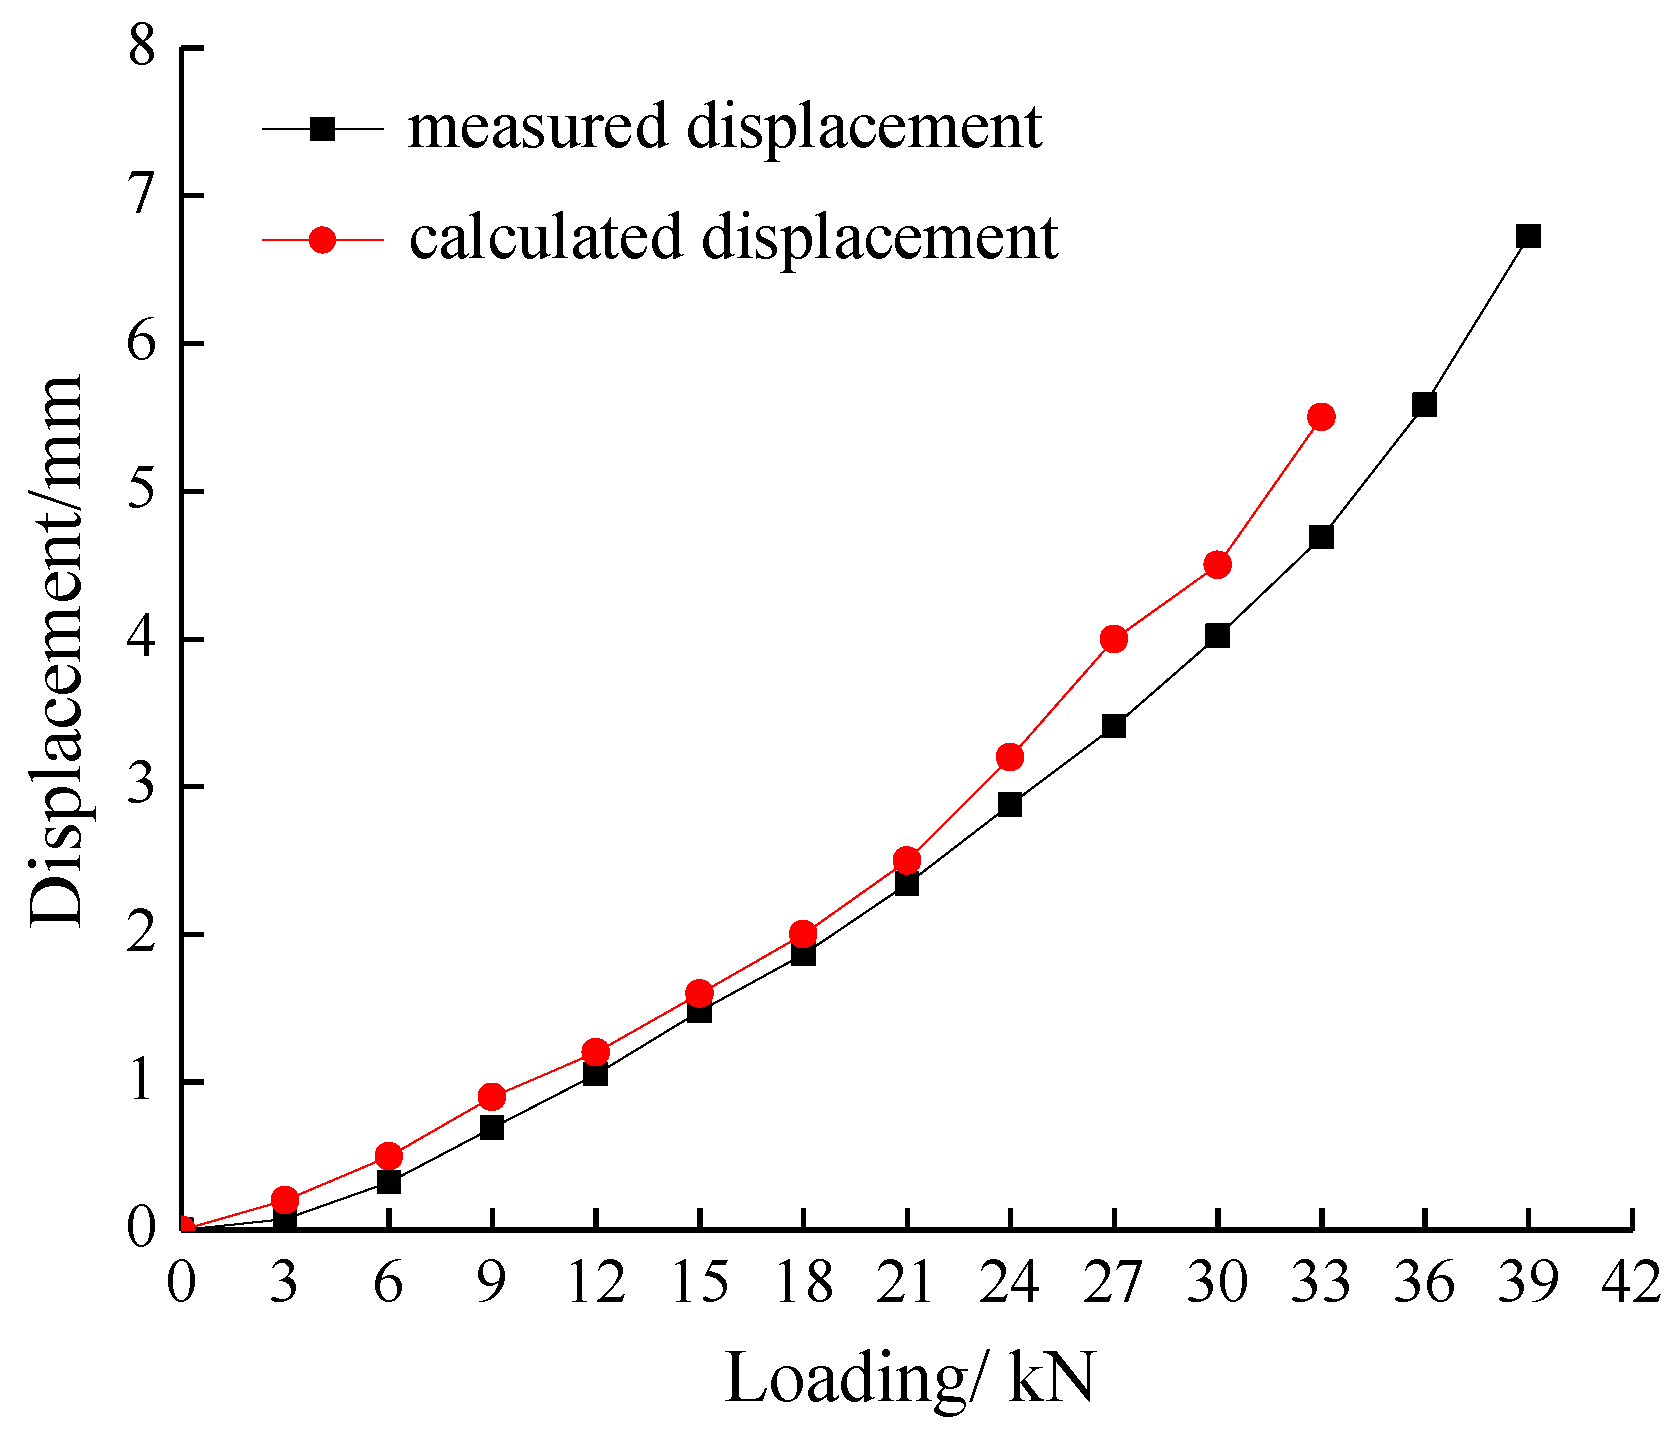
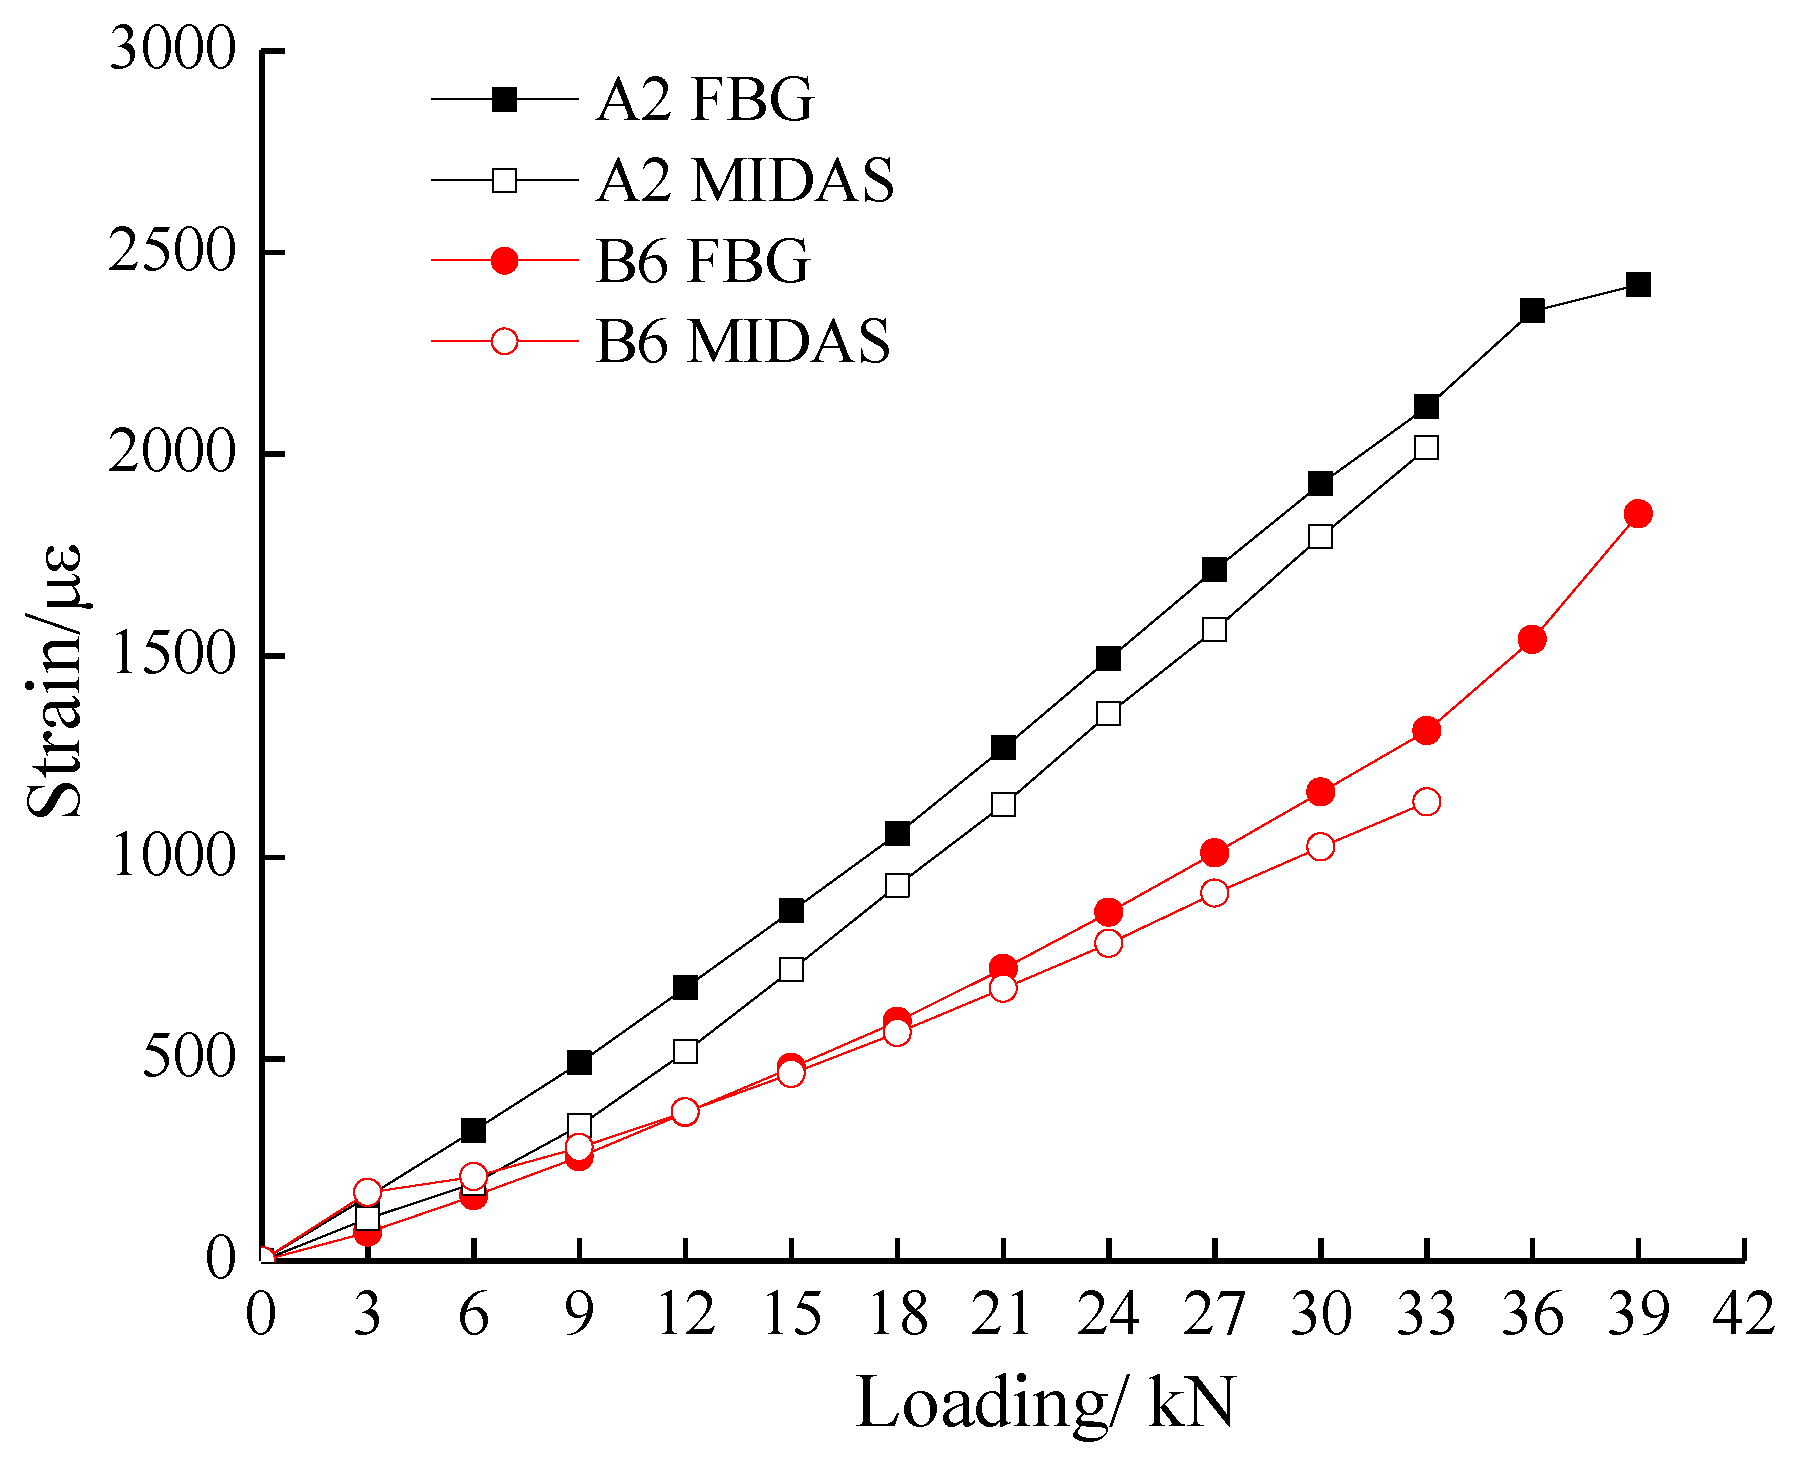
4.2. Comparison between the Test and the Numerical Simulation
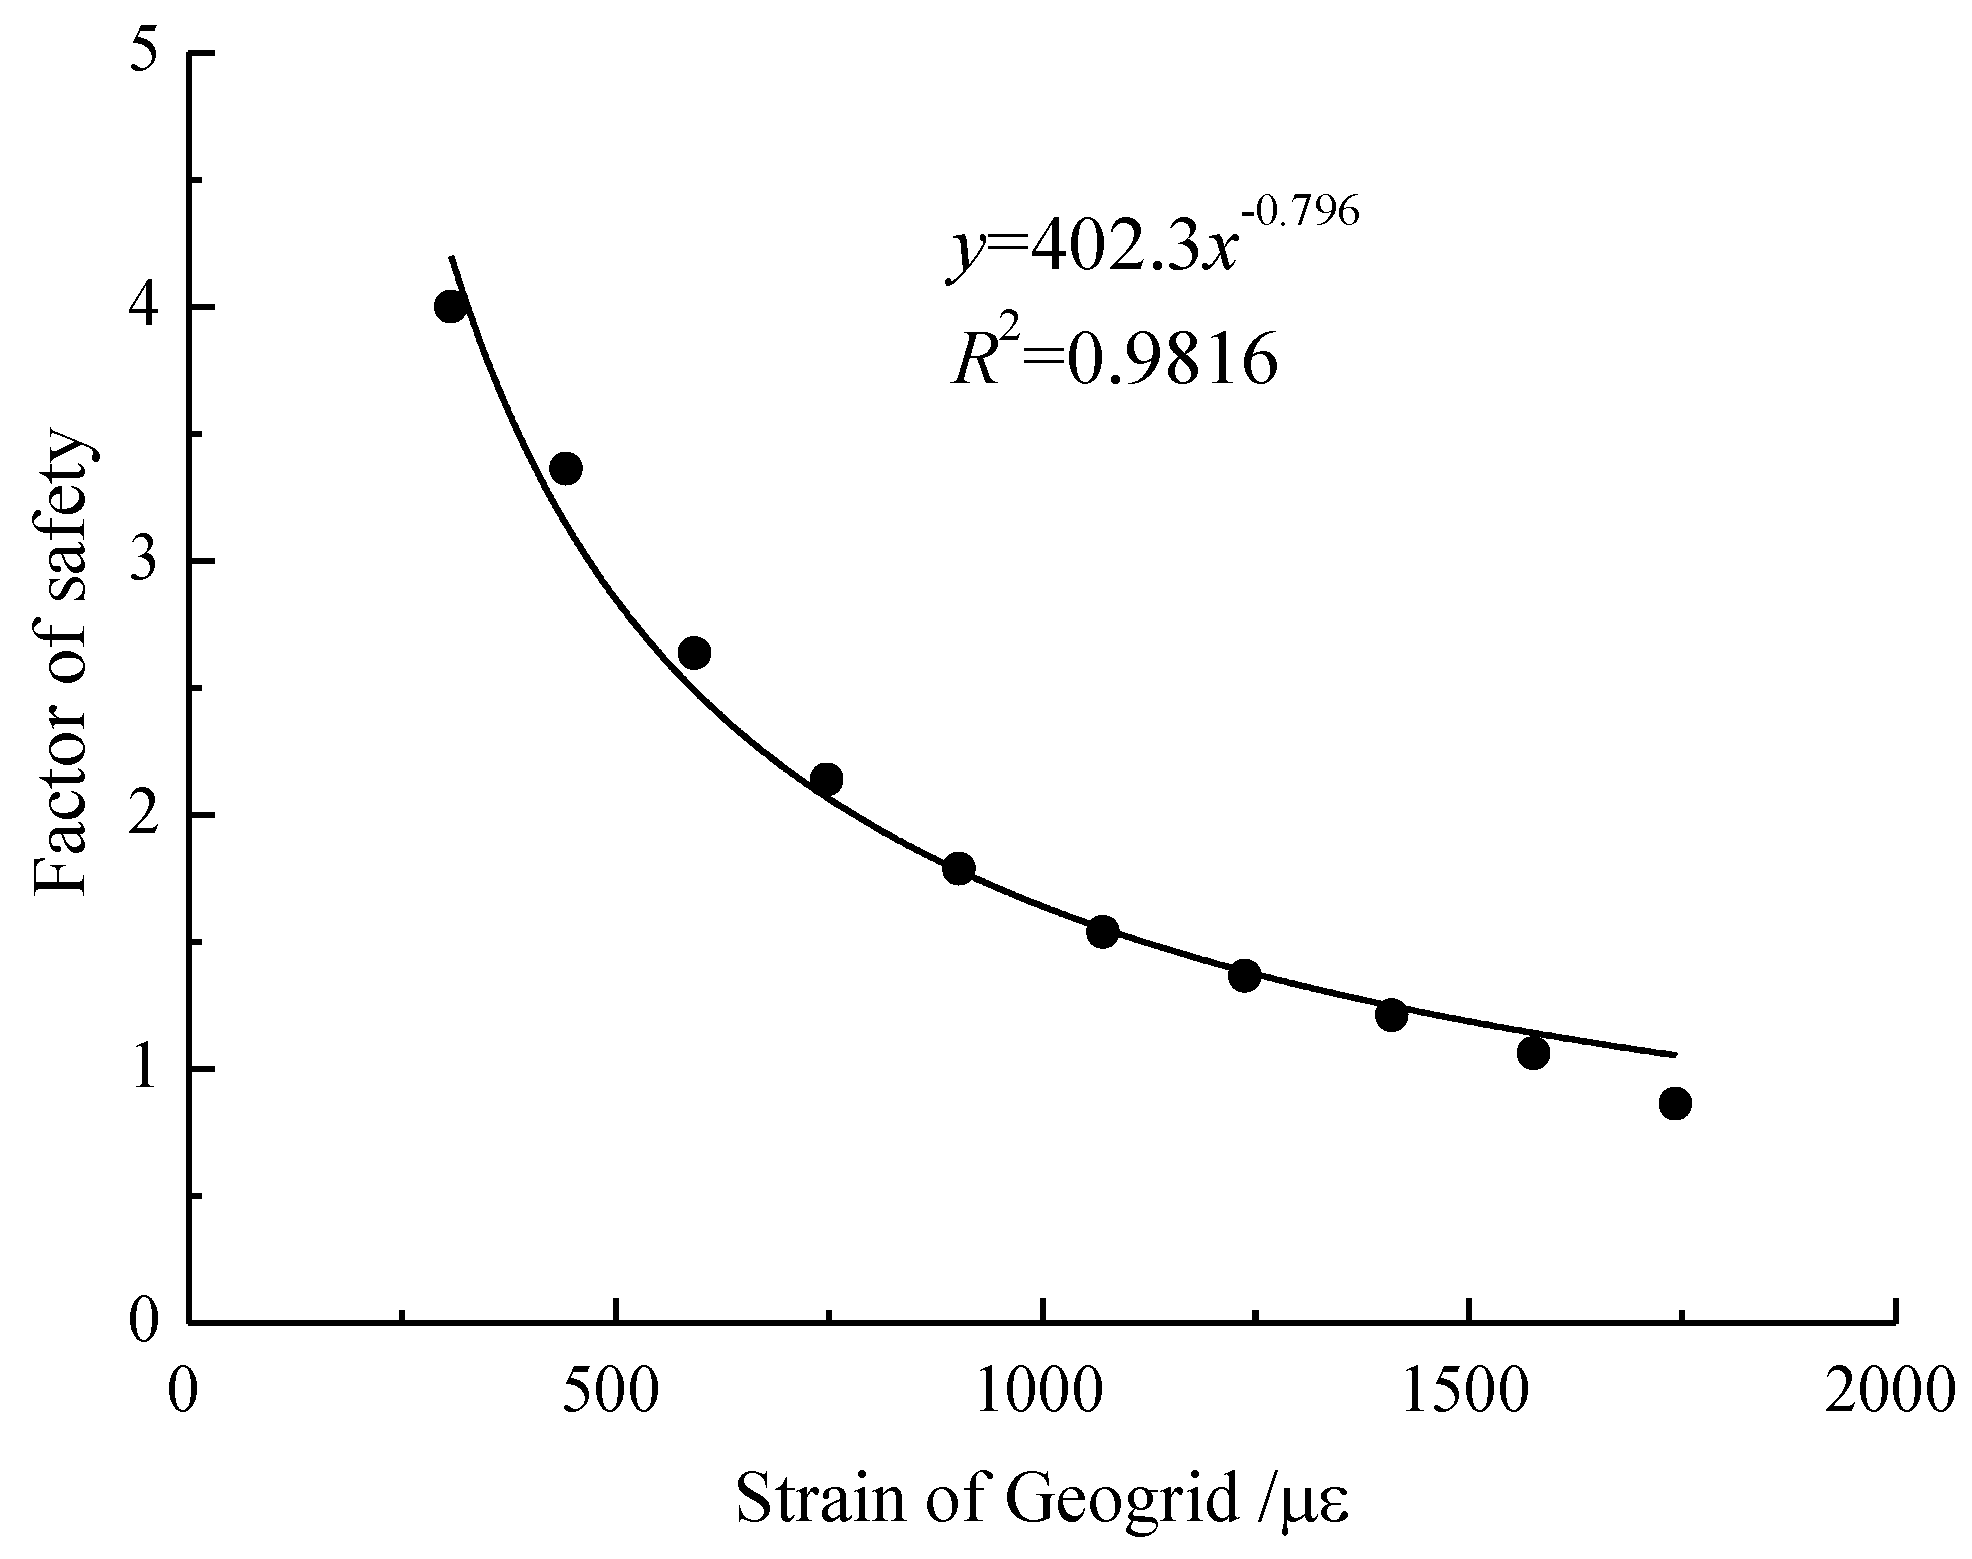
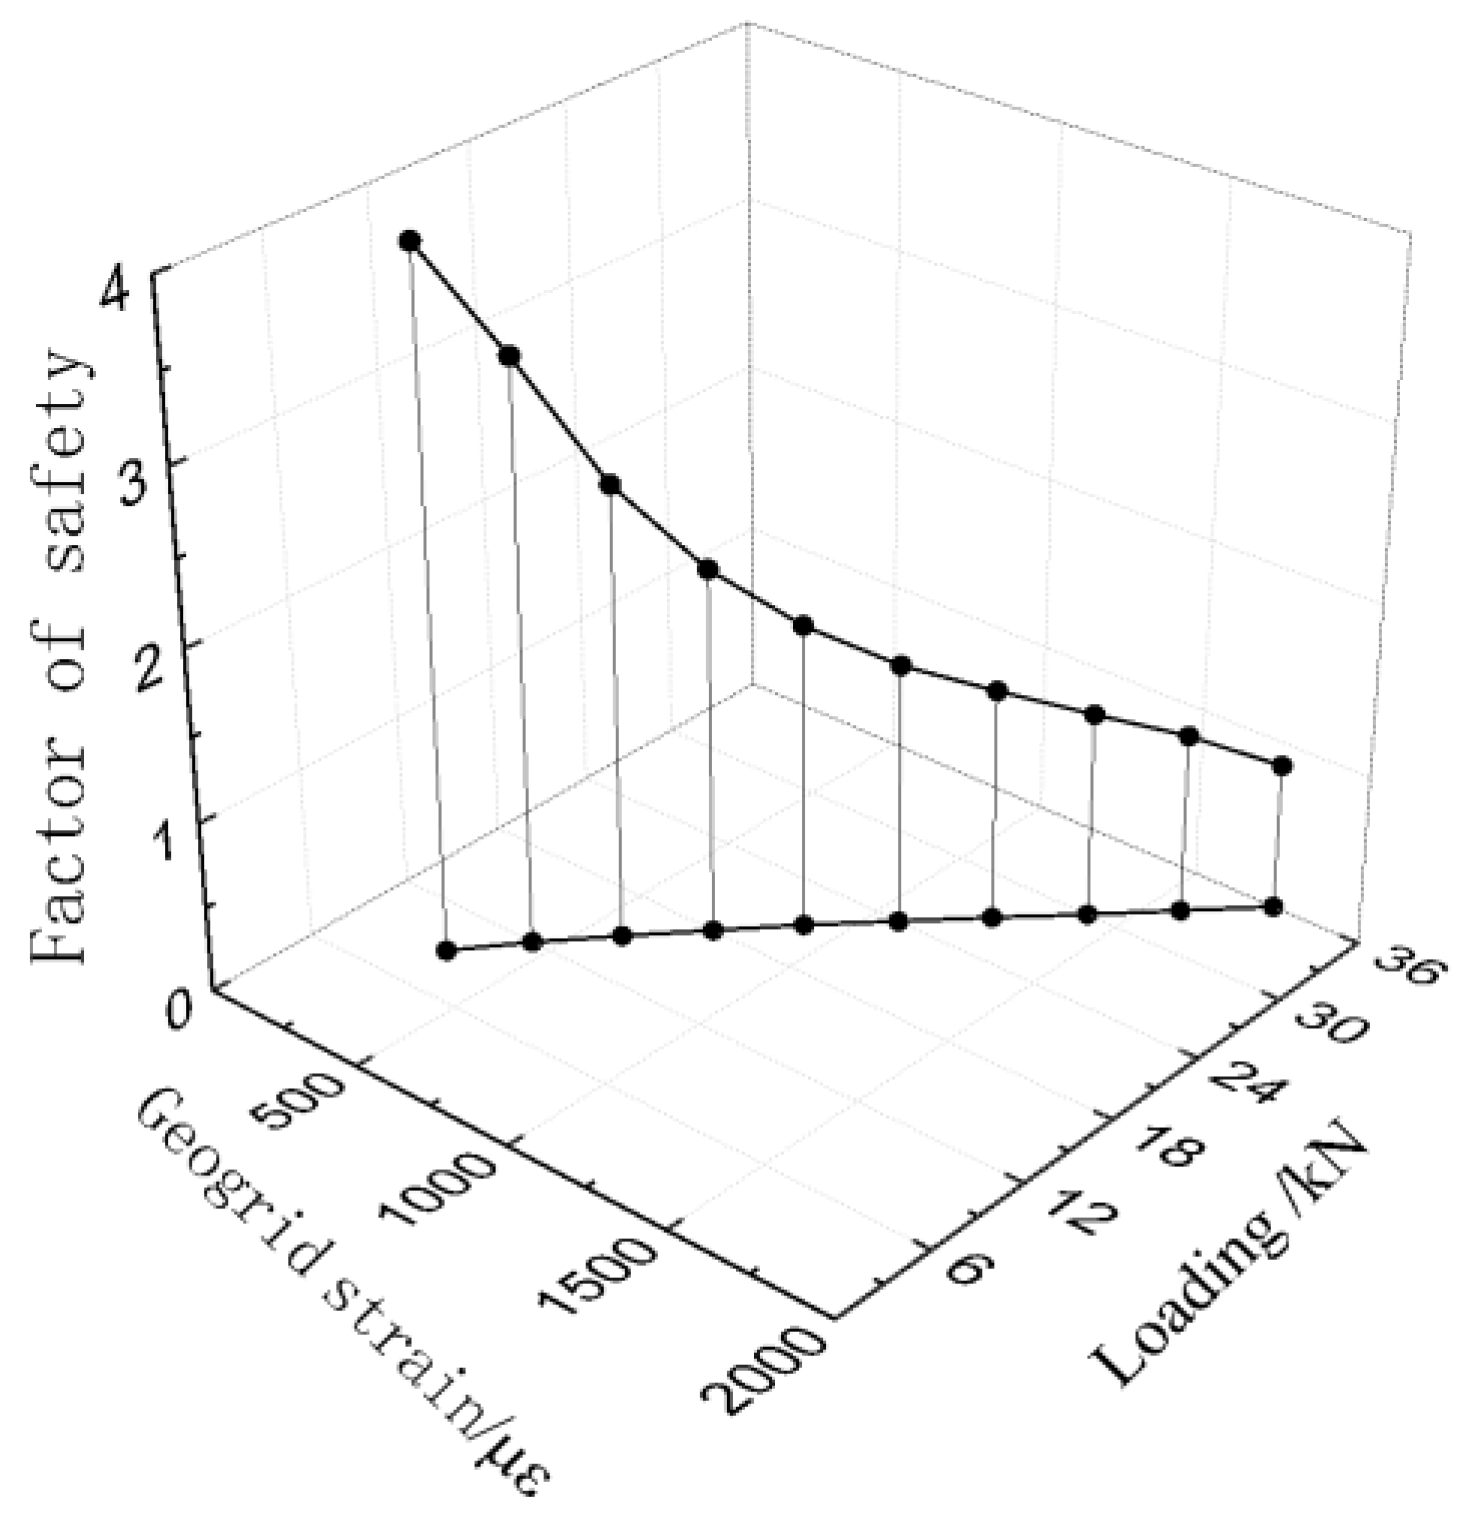
5. The Evaluation of Reinforced Sand Slope Stability
6. Conclusions
- The FBG sensors were employed to measure the strain distribution of the geogrid effectively.
- There was an empirical relationship between the geogrid strain and the factor of safety for the model slope. This result indicates that the geogrid strain can be applied to evaluate the stability of the slope.
Acknowledgments
Author Contributions
Conflicts of Interest
References
- Bathurst, R.J.; Blatz, J.A.; Burger, M.H. Performance of Instrumented large-scale unreinforced and reinforced embankments loaded by a strip footing to failure. Can. Geotech. J. 2003, 40, 1067–1083. [Google Scholar] [CrossRef]
- Balakrishnan, S.; Viswanadham, B.V.S. Evaluation of tensile load-strain characteristics of geogrids through in-soil tensile tests. Geotext. Geomembr. 2016, 45, 35–44. [Google Scholar] [CrossRef]
- Abdi, M.R.; Zandieh, A.R. Experimental and numerical analysis of large scale pull out tests conducted on clays reinforced with geogrids encapsulated with coarse material. Geotext. Geomembr. 2014, 42, 494–504. [Google Scholar] [CrossRef]
- Latha, G.M.; Murthy, V.S. Effects of reinforcement form on the behavior of geosynthetic reinforced sand. Geotext. Geomembr. 2007, 25, 23–32. [Google Scholar] [CrossRef]
- Gnanendran, C.T.; Selvadurai, A.P.S. Strain measurement and interpretation of stabilizing force in geogrid reinforced. Geotext. Geomembr. 2001, 19, 177–194. [Google Scholar] [CrossRef]
- Chen, R.P.; Wang, Y.W.; Ye, X.W.; Bian, X.C.; Dong, X.P. Tensile force of geogrids embedded in pile-supported reinforced embankment: A full-scale experimental study. Geotext. Geomembr. 2016, 44, 157–169. [Google Scholar] [CrossRef]
- Eekelen, S.; Bezuijen, A.; Lodder, H.J.; Tol, A.F. Model experiments on piled embankments. Part I. Geotext. Geomembr. 2012, 32, 69–81. [Google Scholar] [CrossRef]
- Yang, G.; Ding, J.; Zhou, Q.; Zhang, B. Field Behavior of a Geogrid Reinforced Soil Retaining Wall with a Wrap-Around Facing. Geotechn. Test. J. 2010, 33, 96–101. [Google Scholar]
- Pei, H.; Cui, P.; Yin, J.; Zhu, H.; Chen, X.; Pei, L.; Xu, D. Monitoring and Warning of Landslides and Debris Flows Using an Optical Fiber Sensor Technology. J. Mt. Sci. 2011, 8, 728–738. [Google Scholar] [CrossRef]
- Zhu, H.H.; Ho, A.N.L.; Yin, J.H.; Sun, H.W.; Pei, H.F.; Hong, C.Y. An optical fibre monitoring system for evaluating the performance of a soil nailed slope. Smart Struct. Syst. 2012, 9, 393–410. [Google Scholar] [CrossRef]
- Zamara, K.A.; Dixon, N.; Jones, D.R.; Fowmes, G. Monitoring of a landfill side slope lining system: Instrument selection, installation and performance. Geotext. Geomembr. 2012, 35, 1–13. [Google Scholar] [CrossRef]
- Blatz, J.A.; Bathurst, R.J. Limit equilibrium analysis of large-scale reinforced and unreinforced embankments loaded by a strip footing. Can. Geotech. J. 2003, 40, 1084–1092. [Google Scholar] [CrossRef]
- Tanchaisawat, T.; Bergado, D.T.; Voottipruex, P. Numerical simulation and sensitivity analyses of full-scale test embankment with reinforced lightweight geomaterials on soft Bangkok clay. Geotext. Geomembr. 2008, 26, 498–511. [Google Scholar] [CrossRef]
- Li, F.L.; Peng, F.L.; Tan, Y.; Kongkitkul, W.; Siddiquee, M.S.A. FE simulation of viscous behavior of geogrid-reinforced sand under laboratory-scale plane-strain-compression testing. Geotext. Geomembr. 2012, 31, 72–80. [Google Scholar] [CrossRef]
- Zhu, H.H.; Shi, B.; Zhang, J.; Yan, J.F.; Zhang, C.C. Distributed fiber optic monitoring and stability analysis of a model slope under surcharge loading. JMS 2014, 11, 979–989. [Google Scholar] [CrossRef]
- Zhu, H.H.; Wang, Z.Y.; Shi, B.; Wong, J.K.-W. Feasibility study of strain based stability evaluation of locally loaded slopes: Insights from physical and numerical modeling. Eng. Geol. 2016, 208, 39–50. [Google Scholar] [CrossRef]


| Bulk Density (kN/m3) | Density (kg/m3) | Elastic Modulus (MPa) | Poisson’s Ratio | Internal Friction Angle (°) |
|---|---|---|---|---|
| 20 | 1549 | 100 | 0.3 | 36 |
| Material | Ultimate Longitudinal Tensile Strength (kN/m) | Longitudinal Strain/MPa (%) |
|---|---|---|
| Polypropylene | 83.5 | 9.7 |
© 2017 by the authors. Licensee MDPI, Basel, Switzerland. This article is an open access article distributed under the terms and conditions of the Creative Commons Attribution (CC BY) license ( http://creativecommons.org/licenses/by/4.0/).
Share and Cite
Sun, Y.; Xu, H.; Gu, P.; Hu, W. Application of FBG Sensing Technology in Stability Analysis of Geogrid-Reinforced Slope. Sensors 2017, 17, 597. https://doi.org/10.3390/s17030597
Sun Y, Xu H, Gu P, Hu W. Application of FBG Sensing Technology in Stability Analysis of Geogrid-Reinforced Slope. Sensors. 2017; 17(3):597. https://doi.org/10.3390/s17030597
Chicago/Turabian StyleSun, Yijie, Hongzhong Xu, Peng Gu, and Wenjie Hu. 2017. "Application of FBG Sensing Technology in Stability Analysis of Geogrid-Reinforced Slope" Sensors 17, no. 3: 597. https://doi.org/10.3390/s17030597