
Supportive Noninvasive Tool for the Diagnosis of Breast Cancer Using a Thermographic Camera as Sensor

 ,
,
Abstract
:1. Introduction
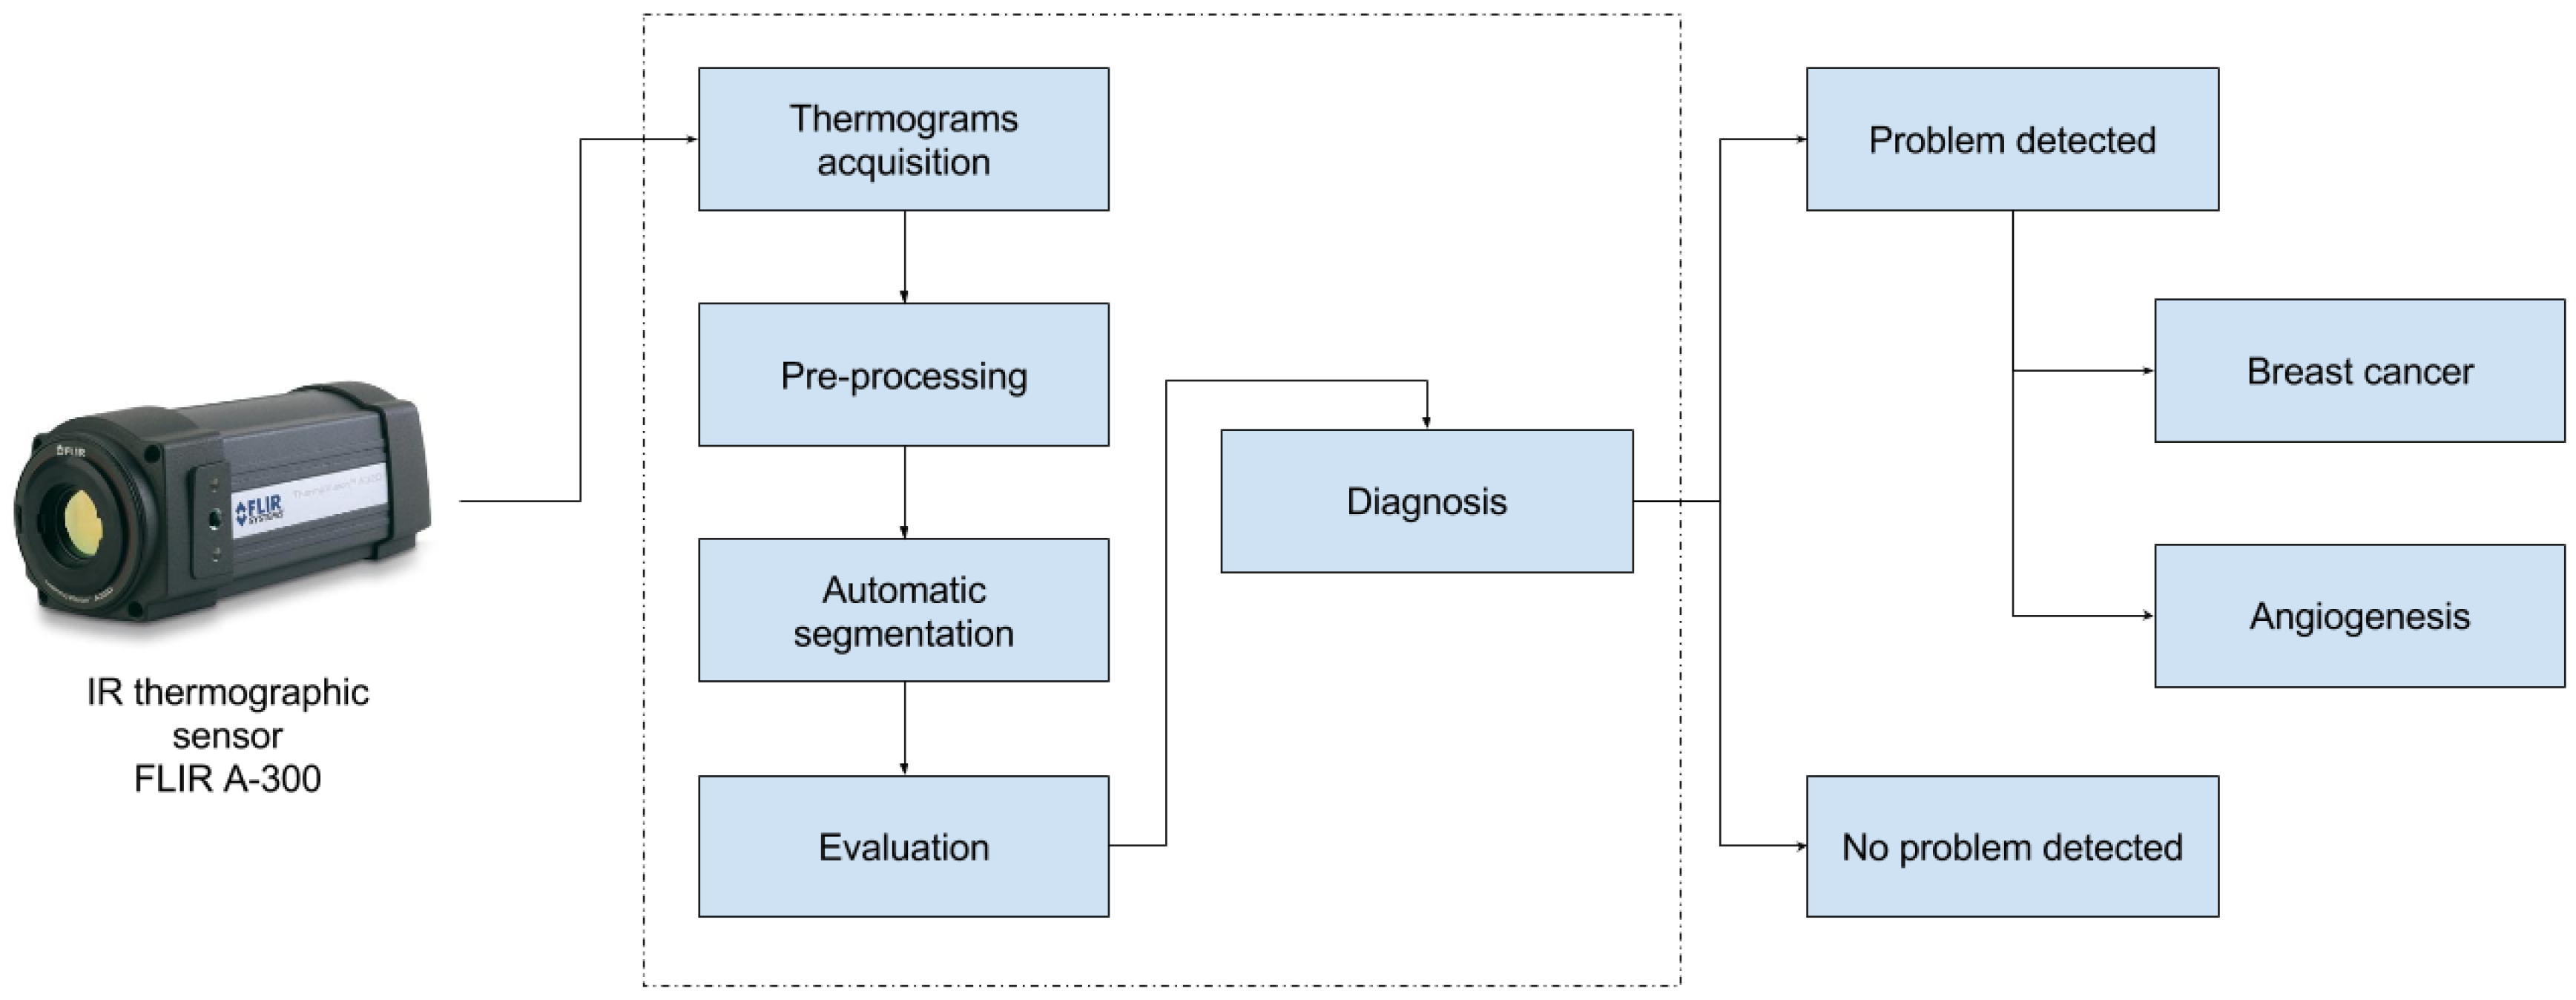
2. Materials and Methods
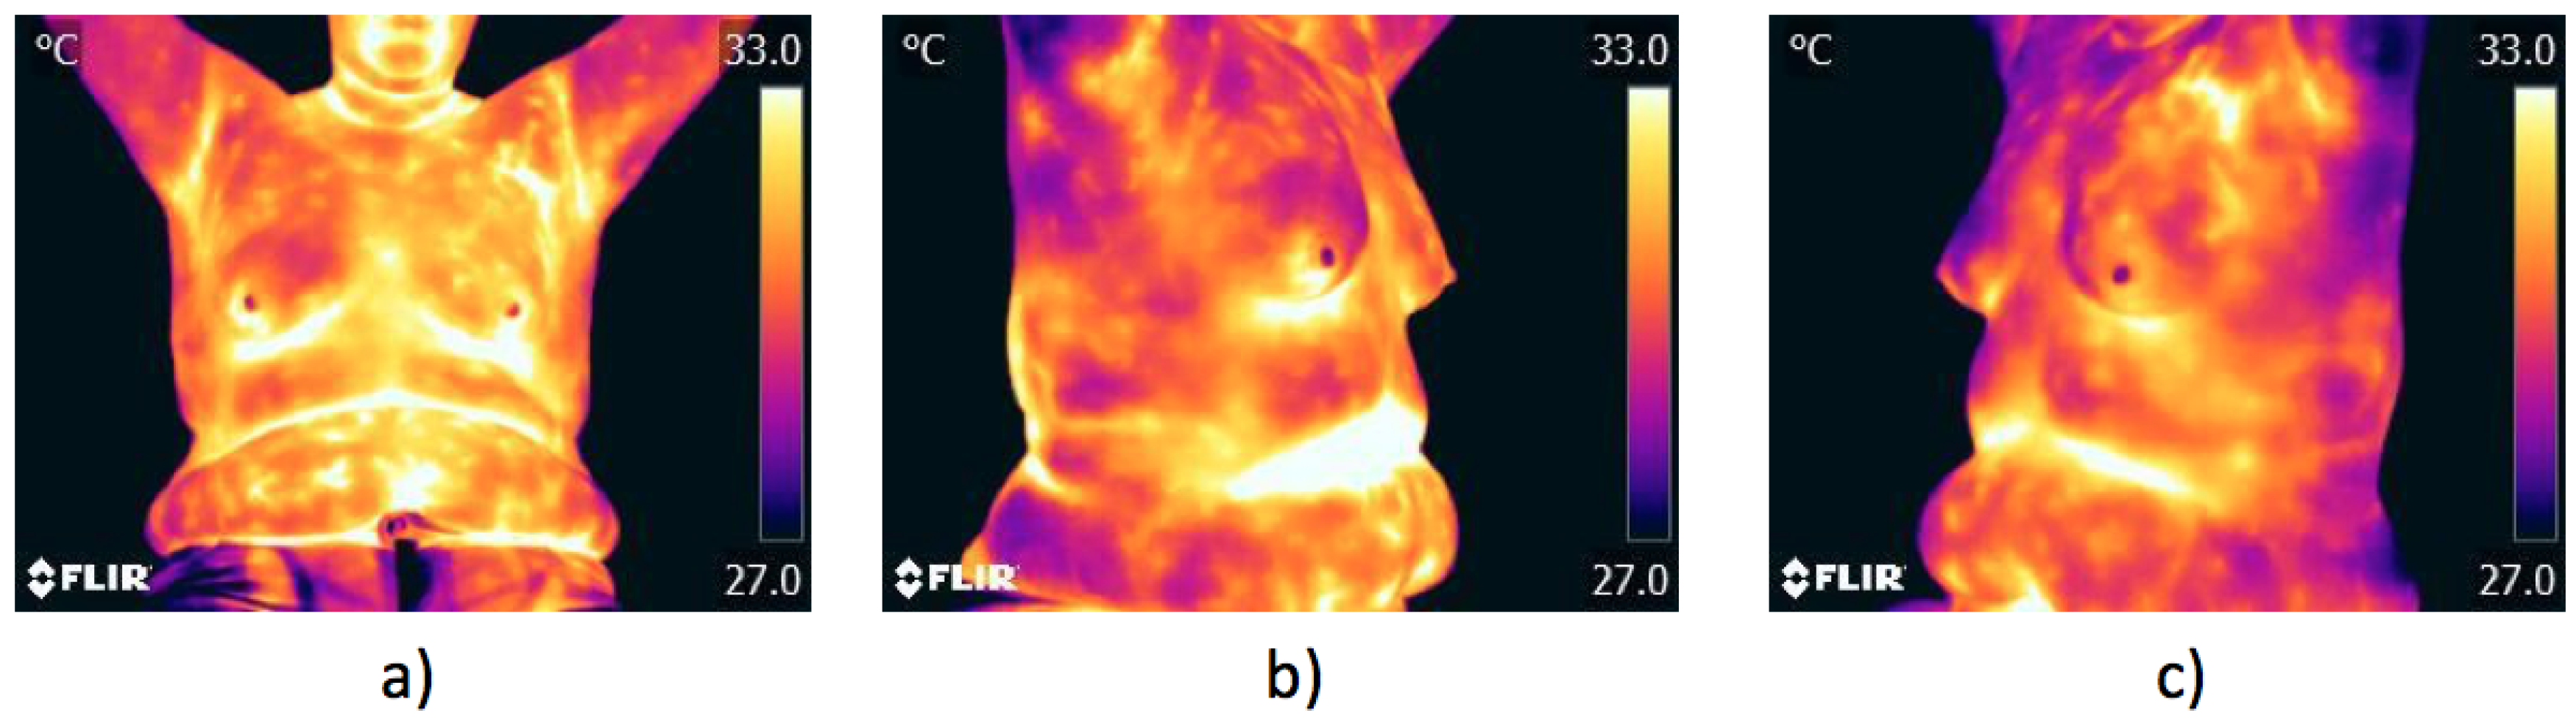
2.1. Thermograms’ Acquisition
2.1.1. Exclusion Criteria
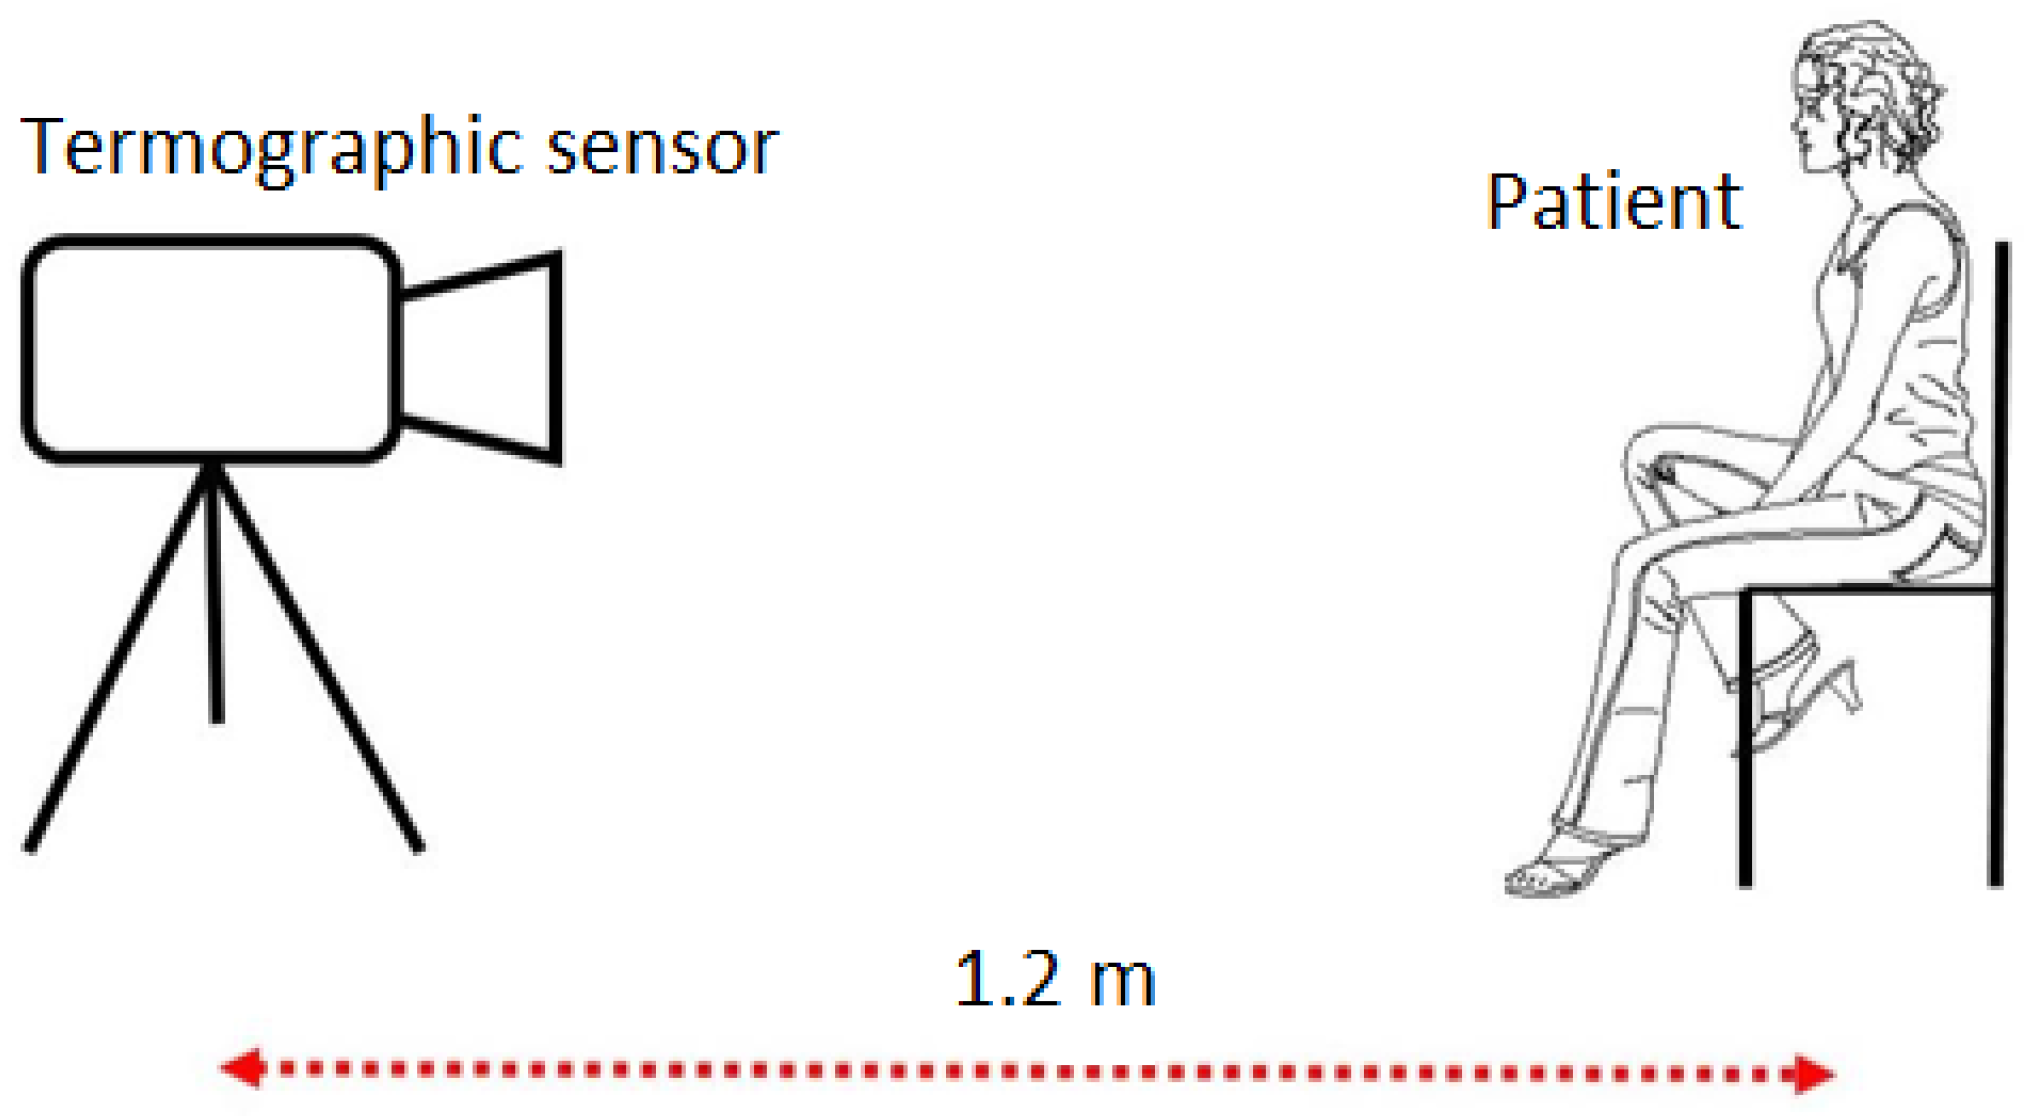
2.1.2. Acquisition Type and Patient Posture
2.1.3. Thermal Stability and Emissivity
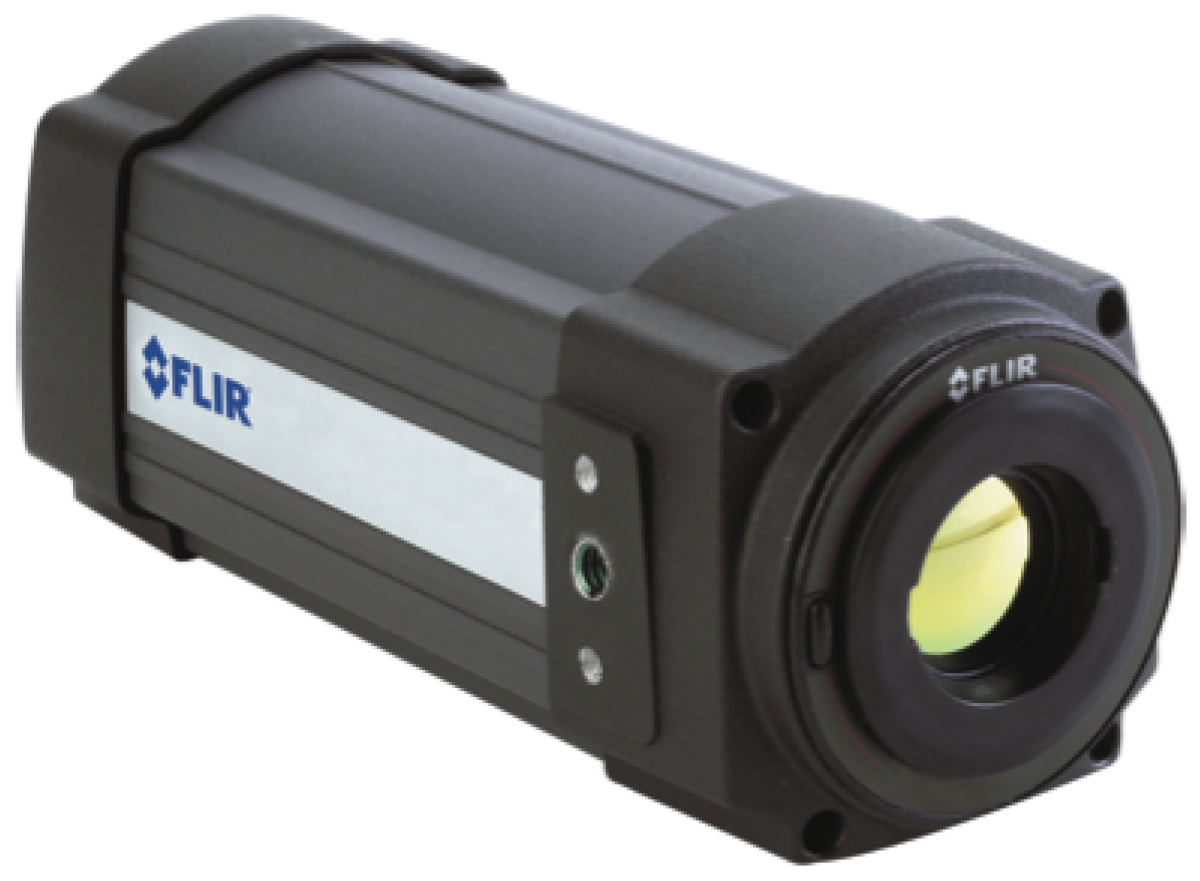
2.1.4. Sensor
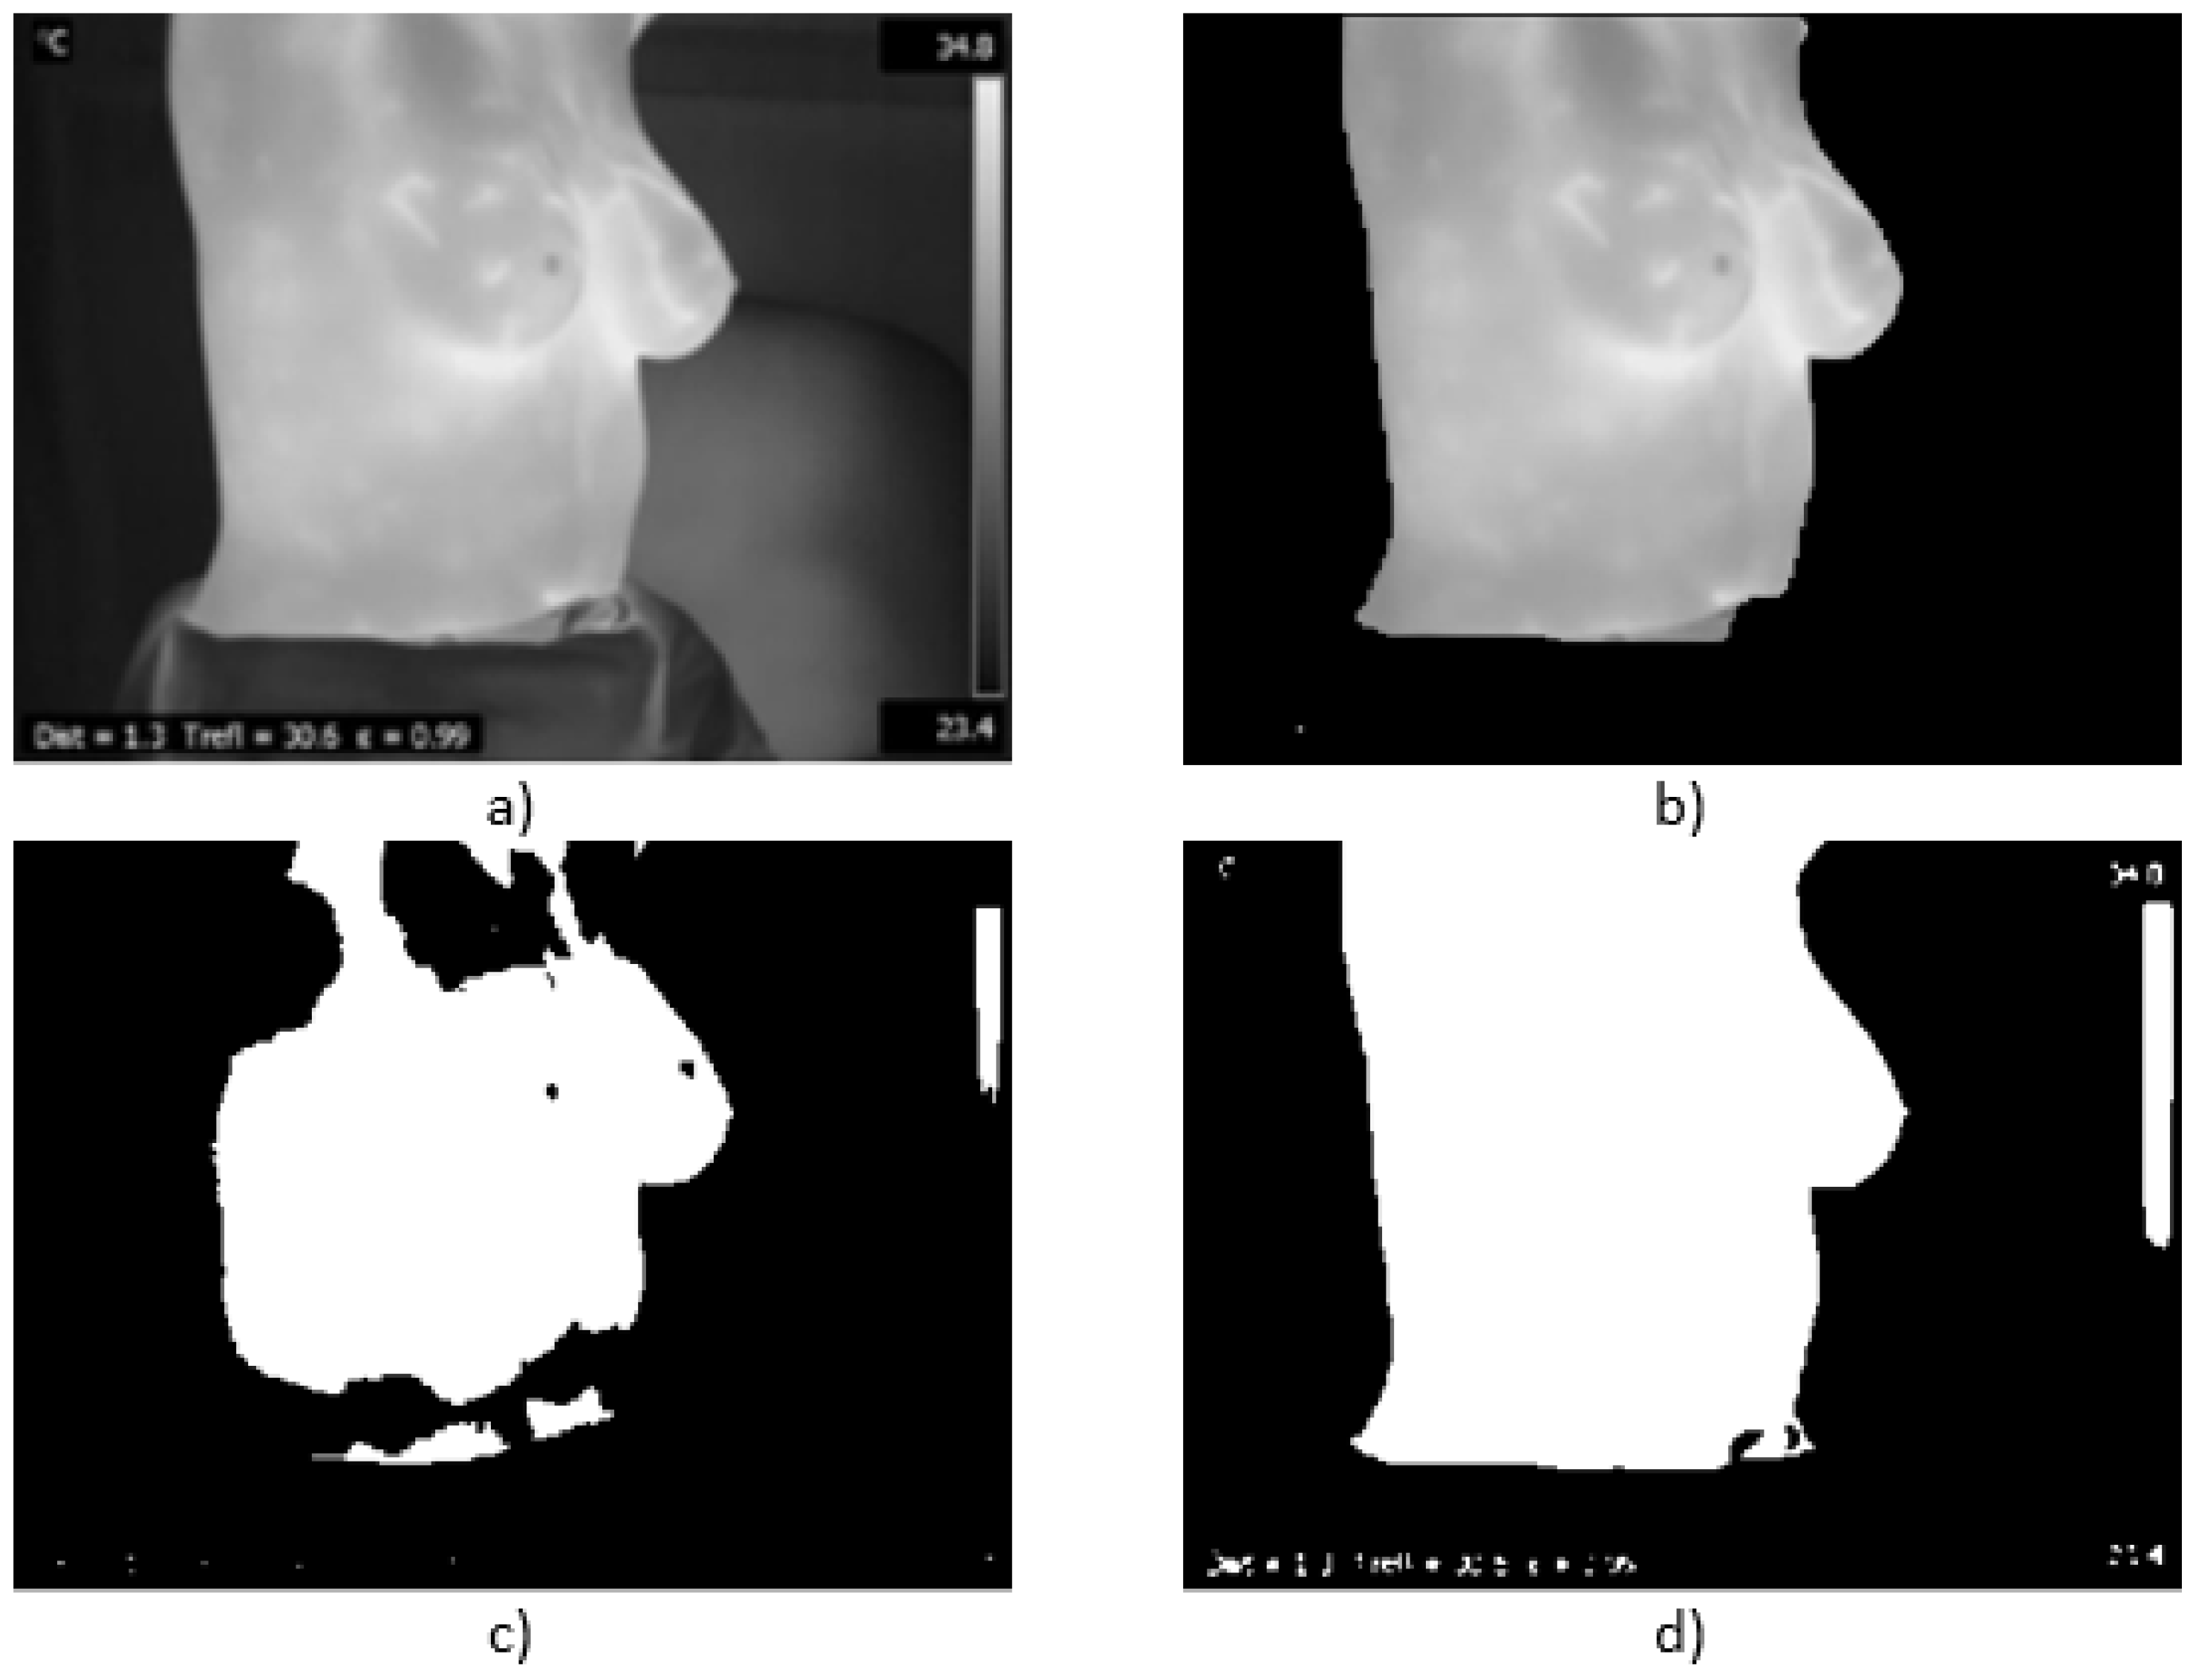
2.2. Pre-Processing
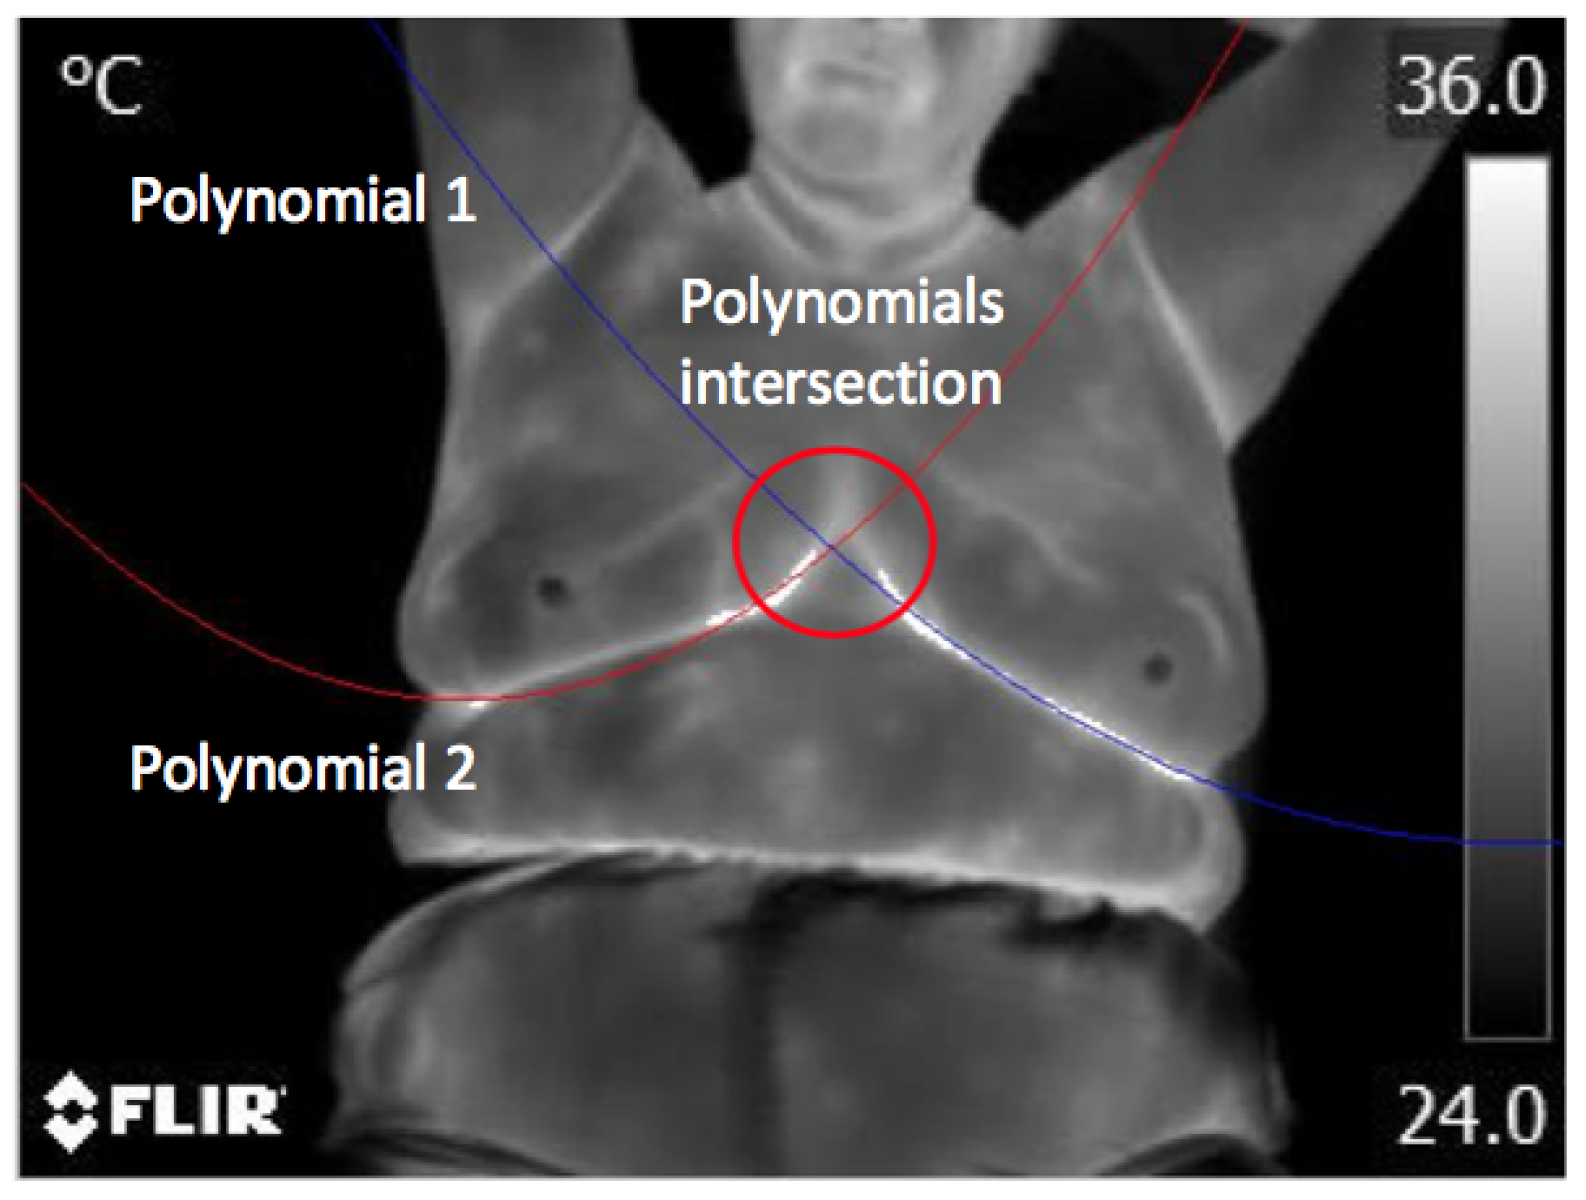
2.3. Automatic Segmentation
2.4. Evaluation
2.5. Diagnosis
2.6. Angiogenesis
2.7. Cancer
3. Results and Discussion
3.1. Validation
3.2. Test
3.3. Cases with No Problems Detected
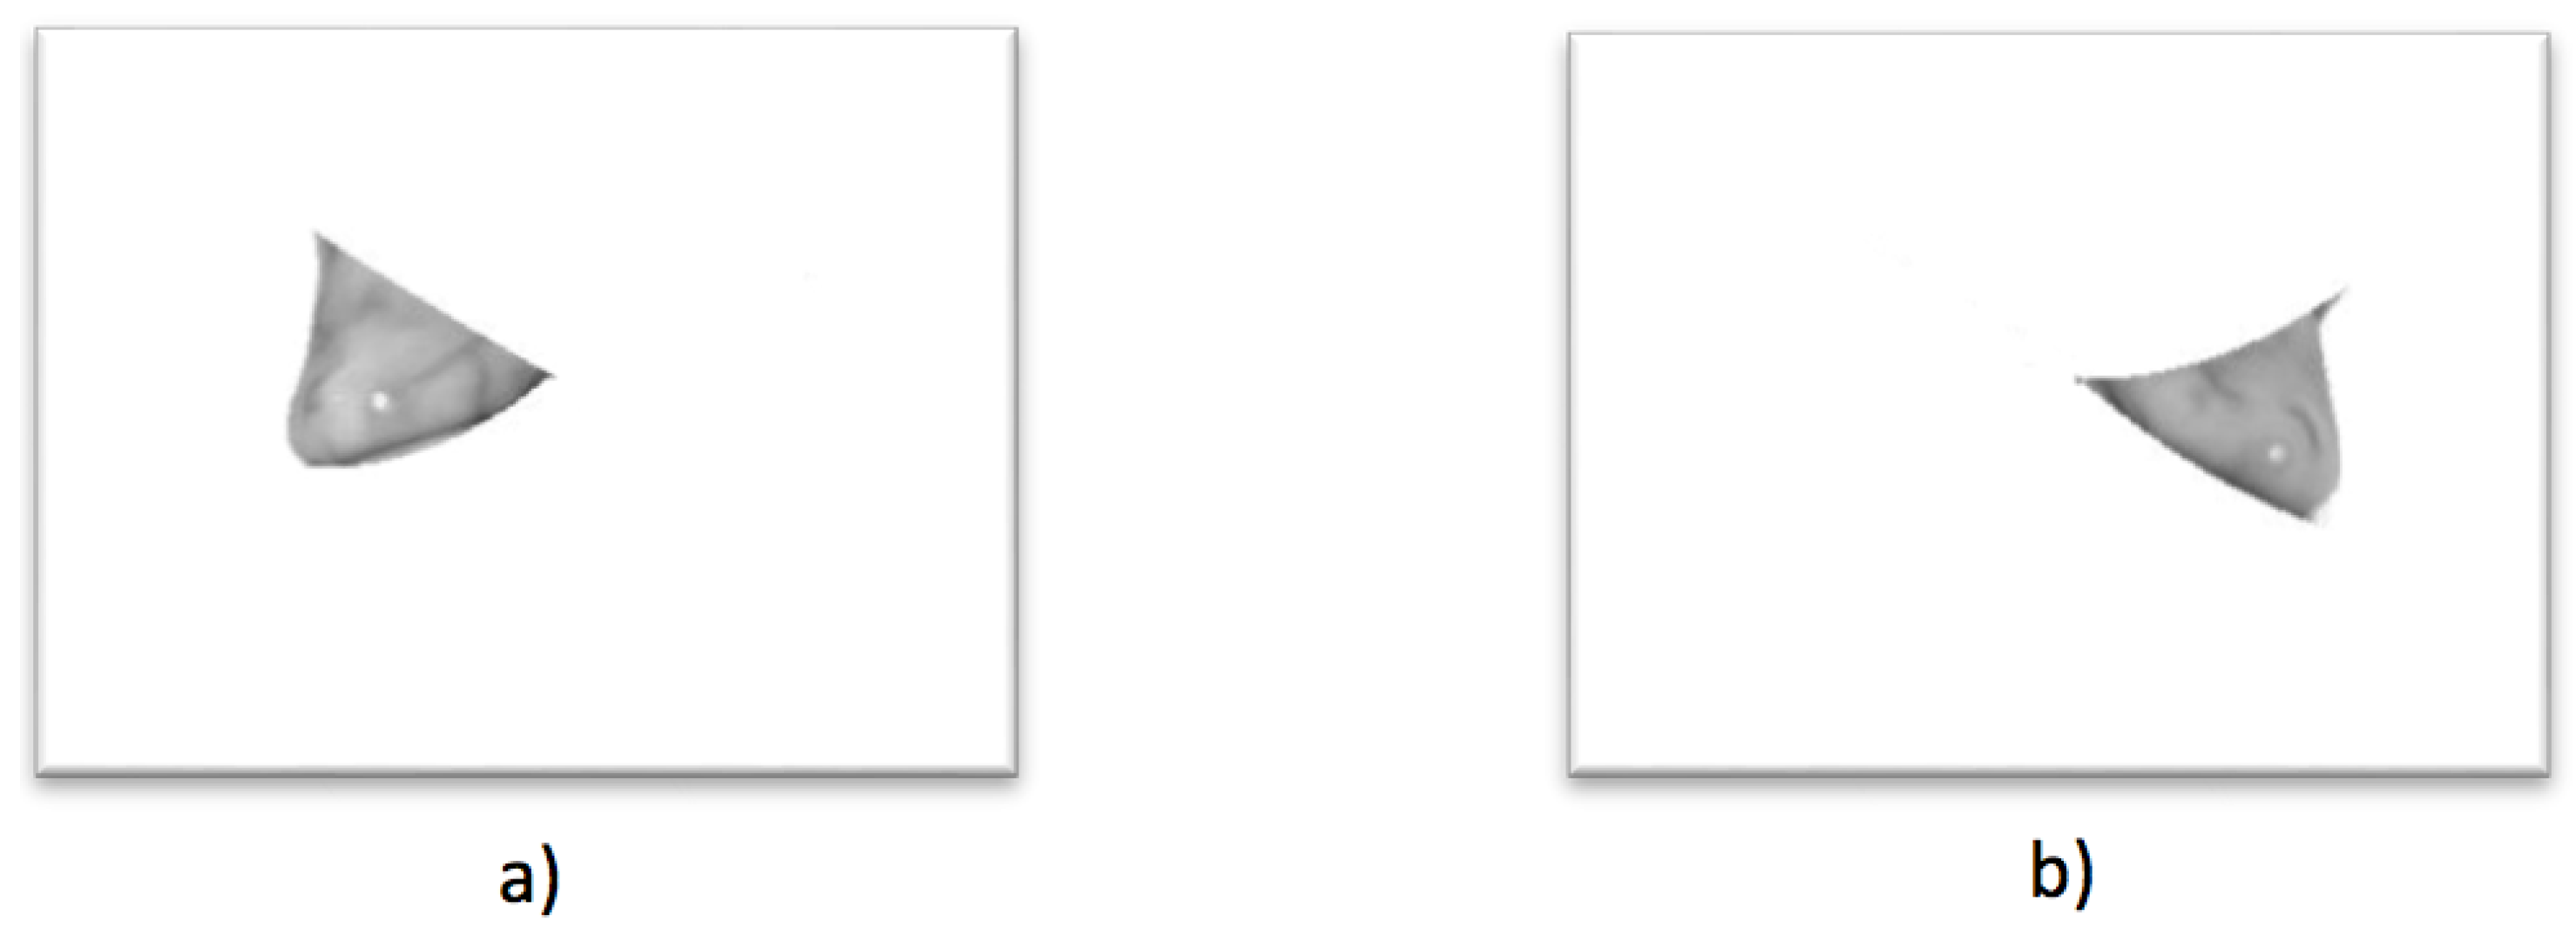
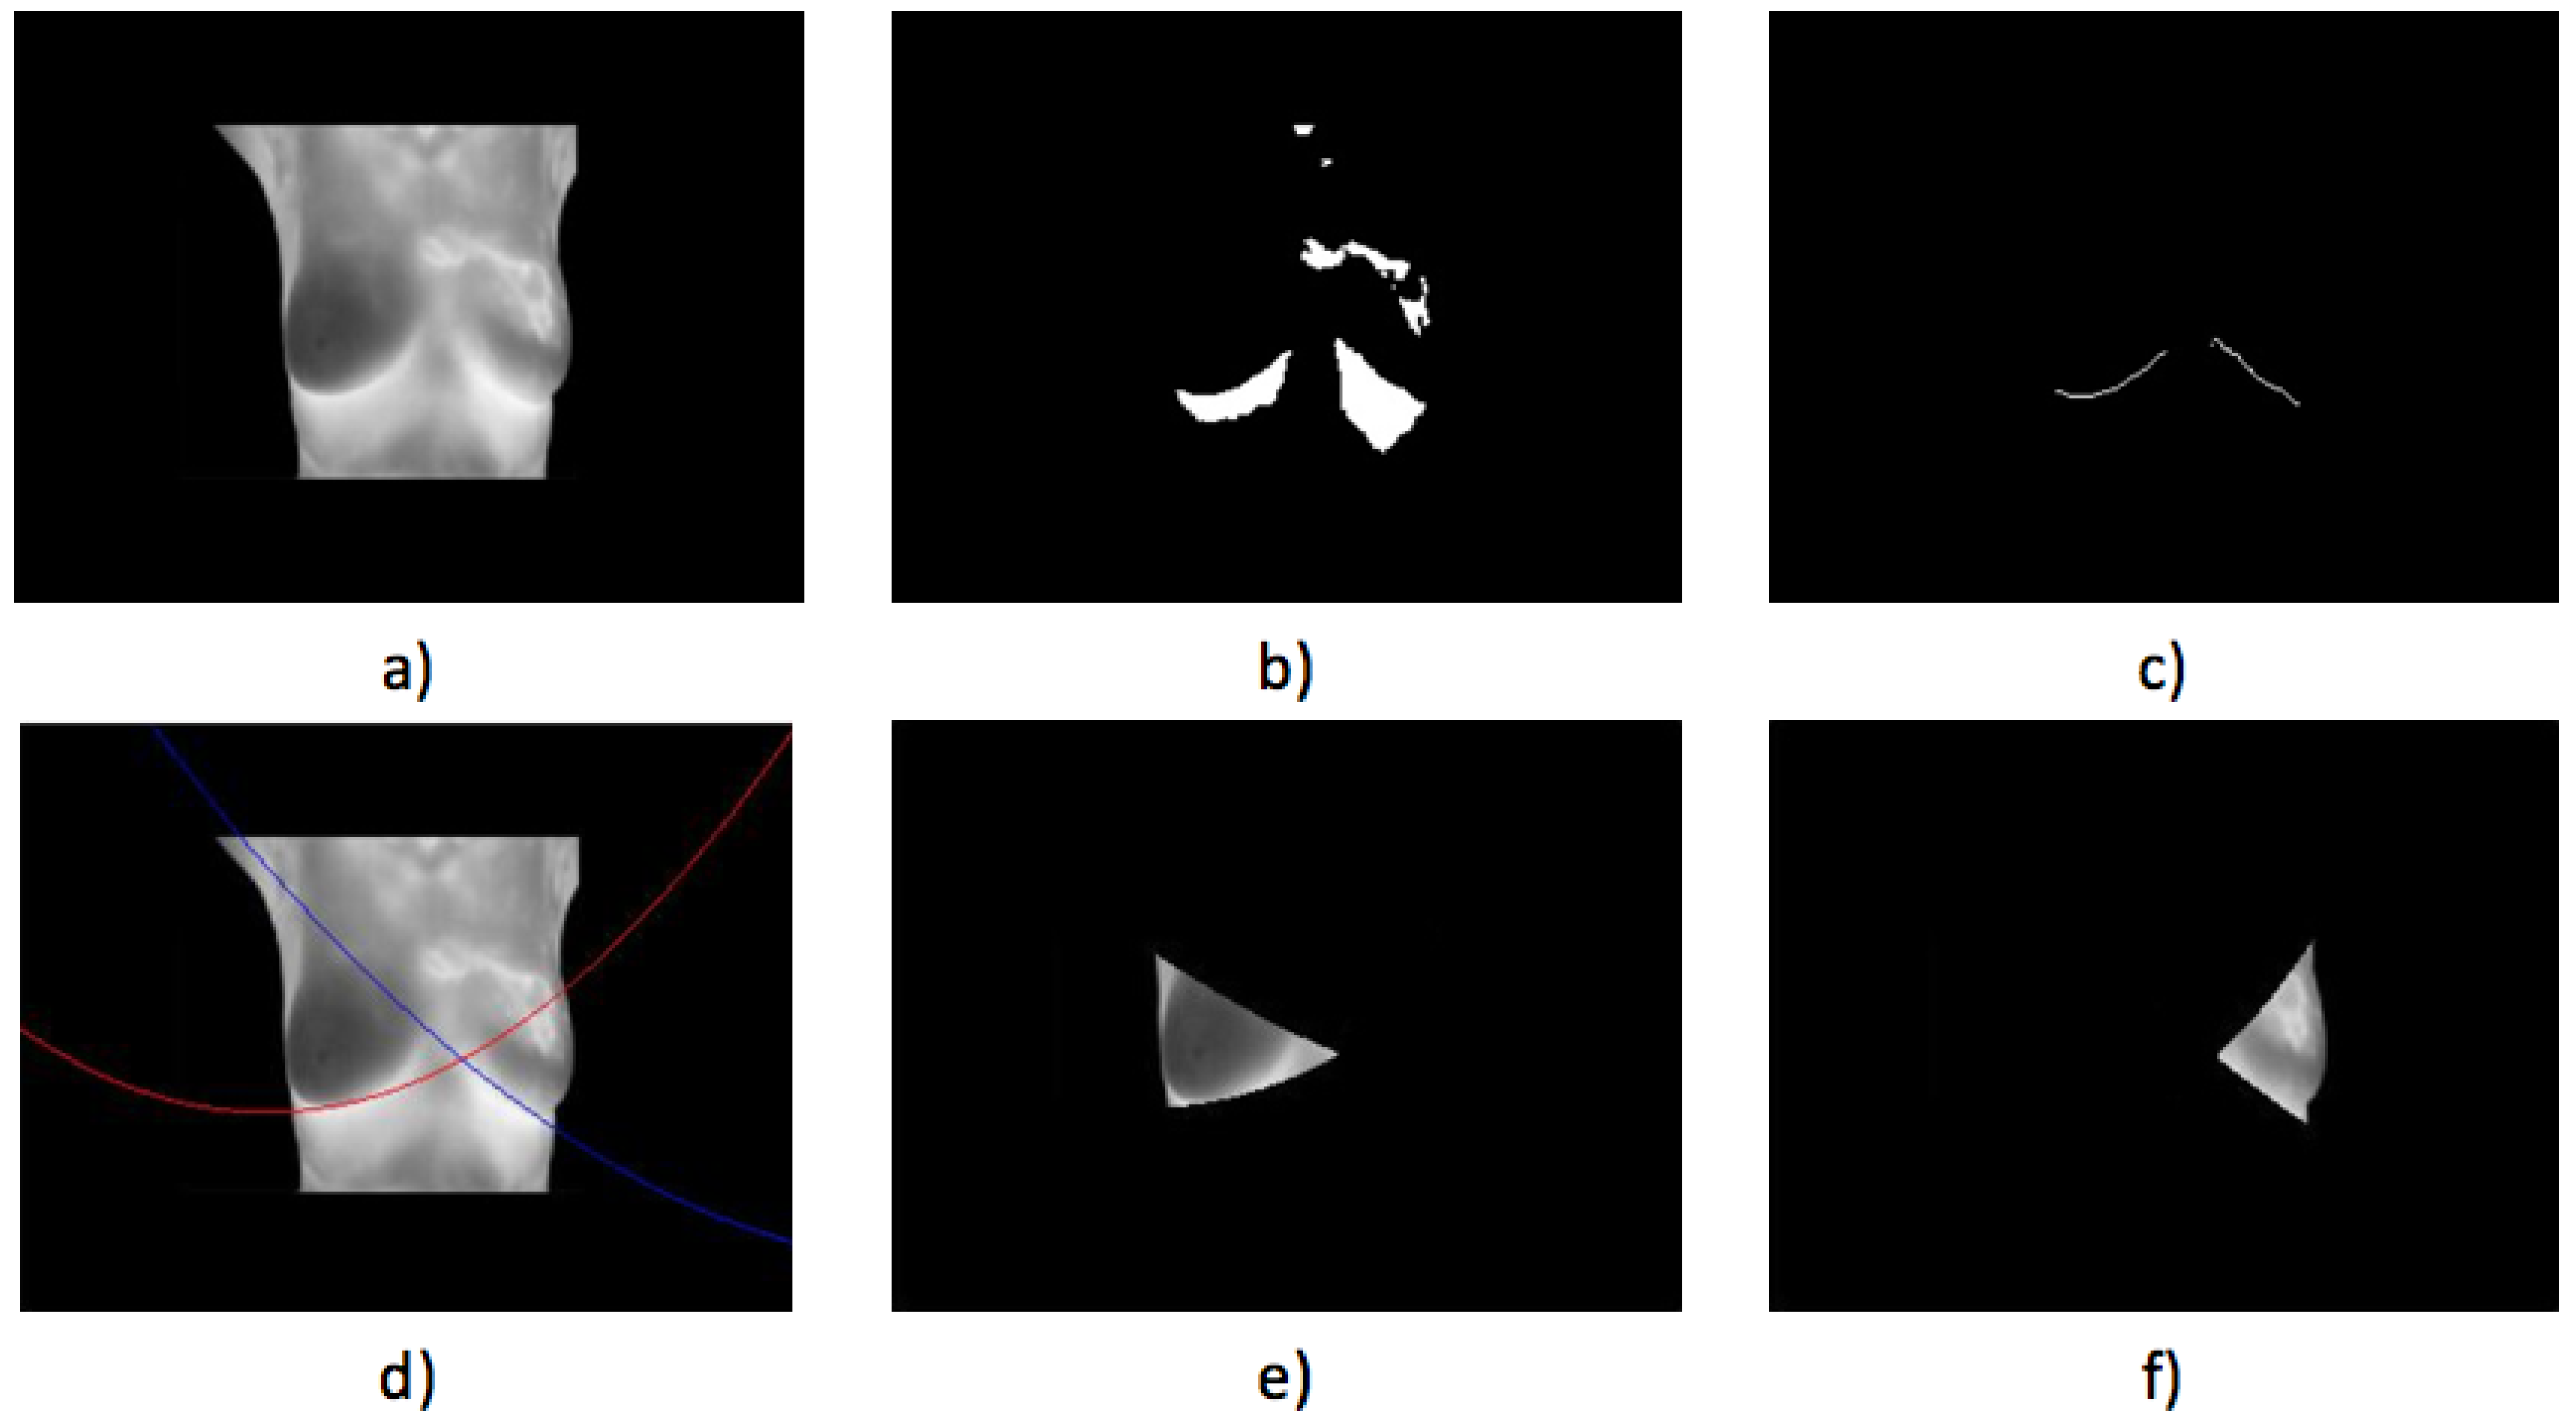
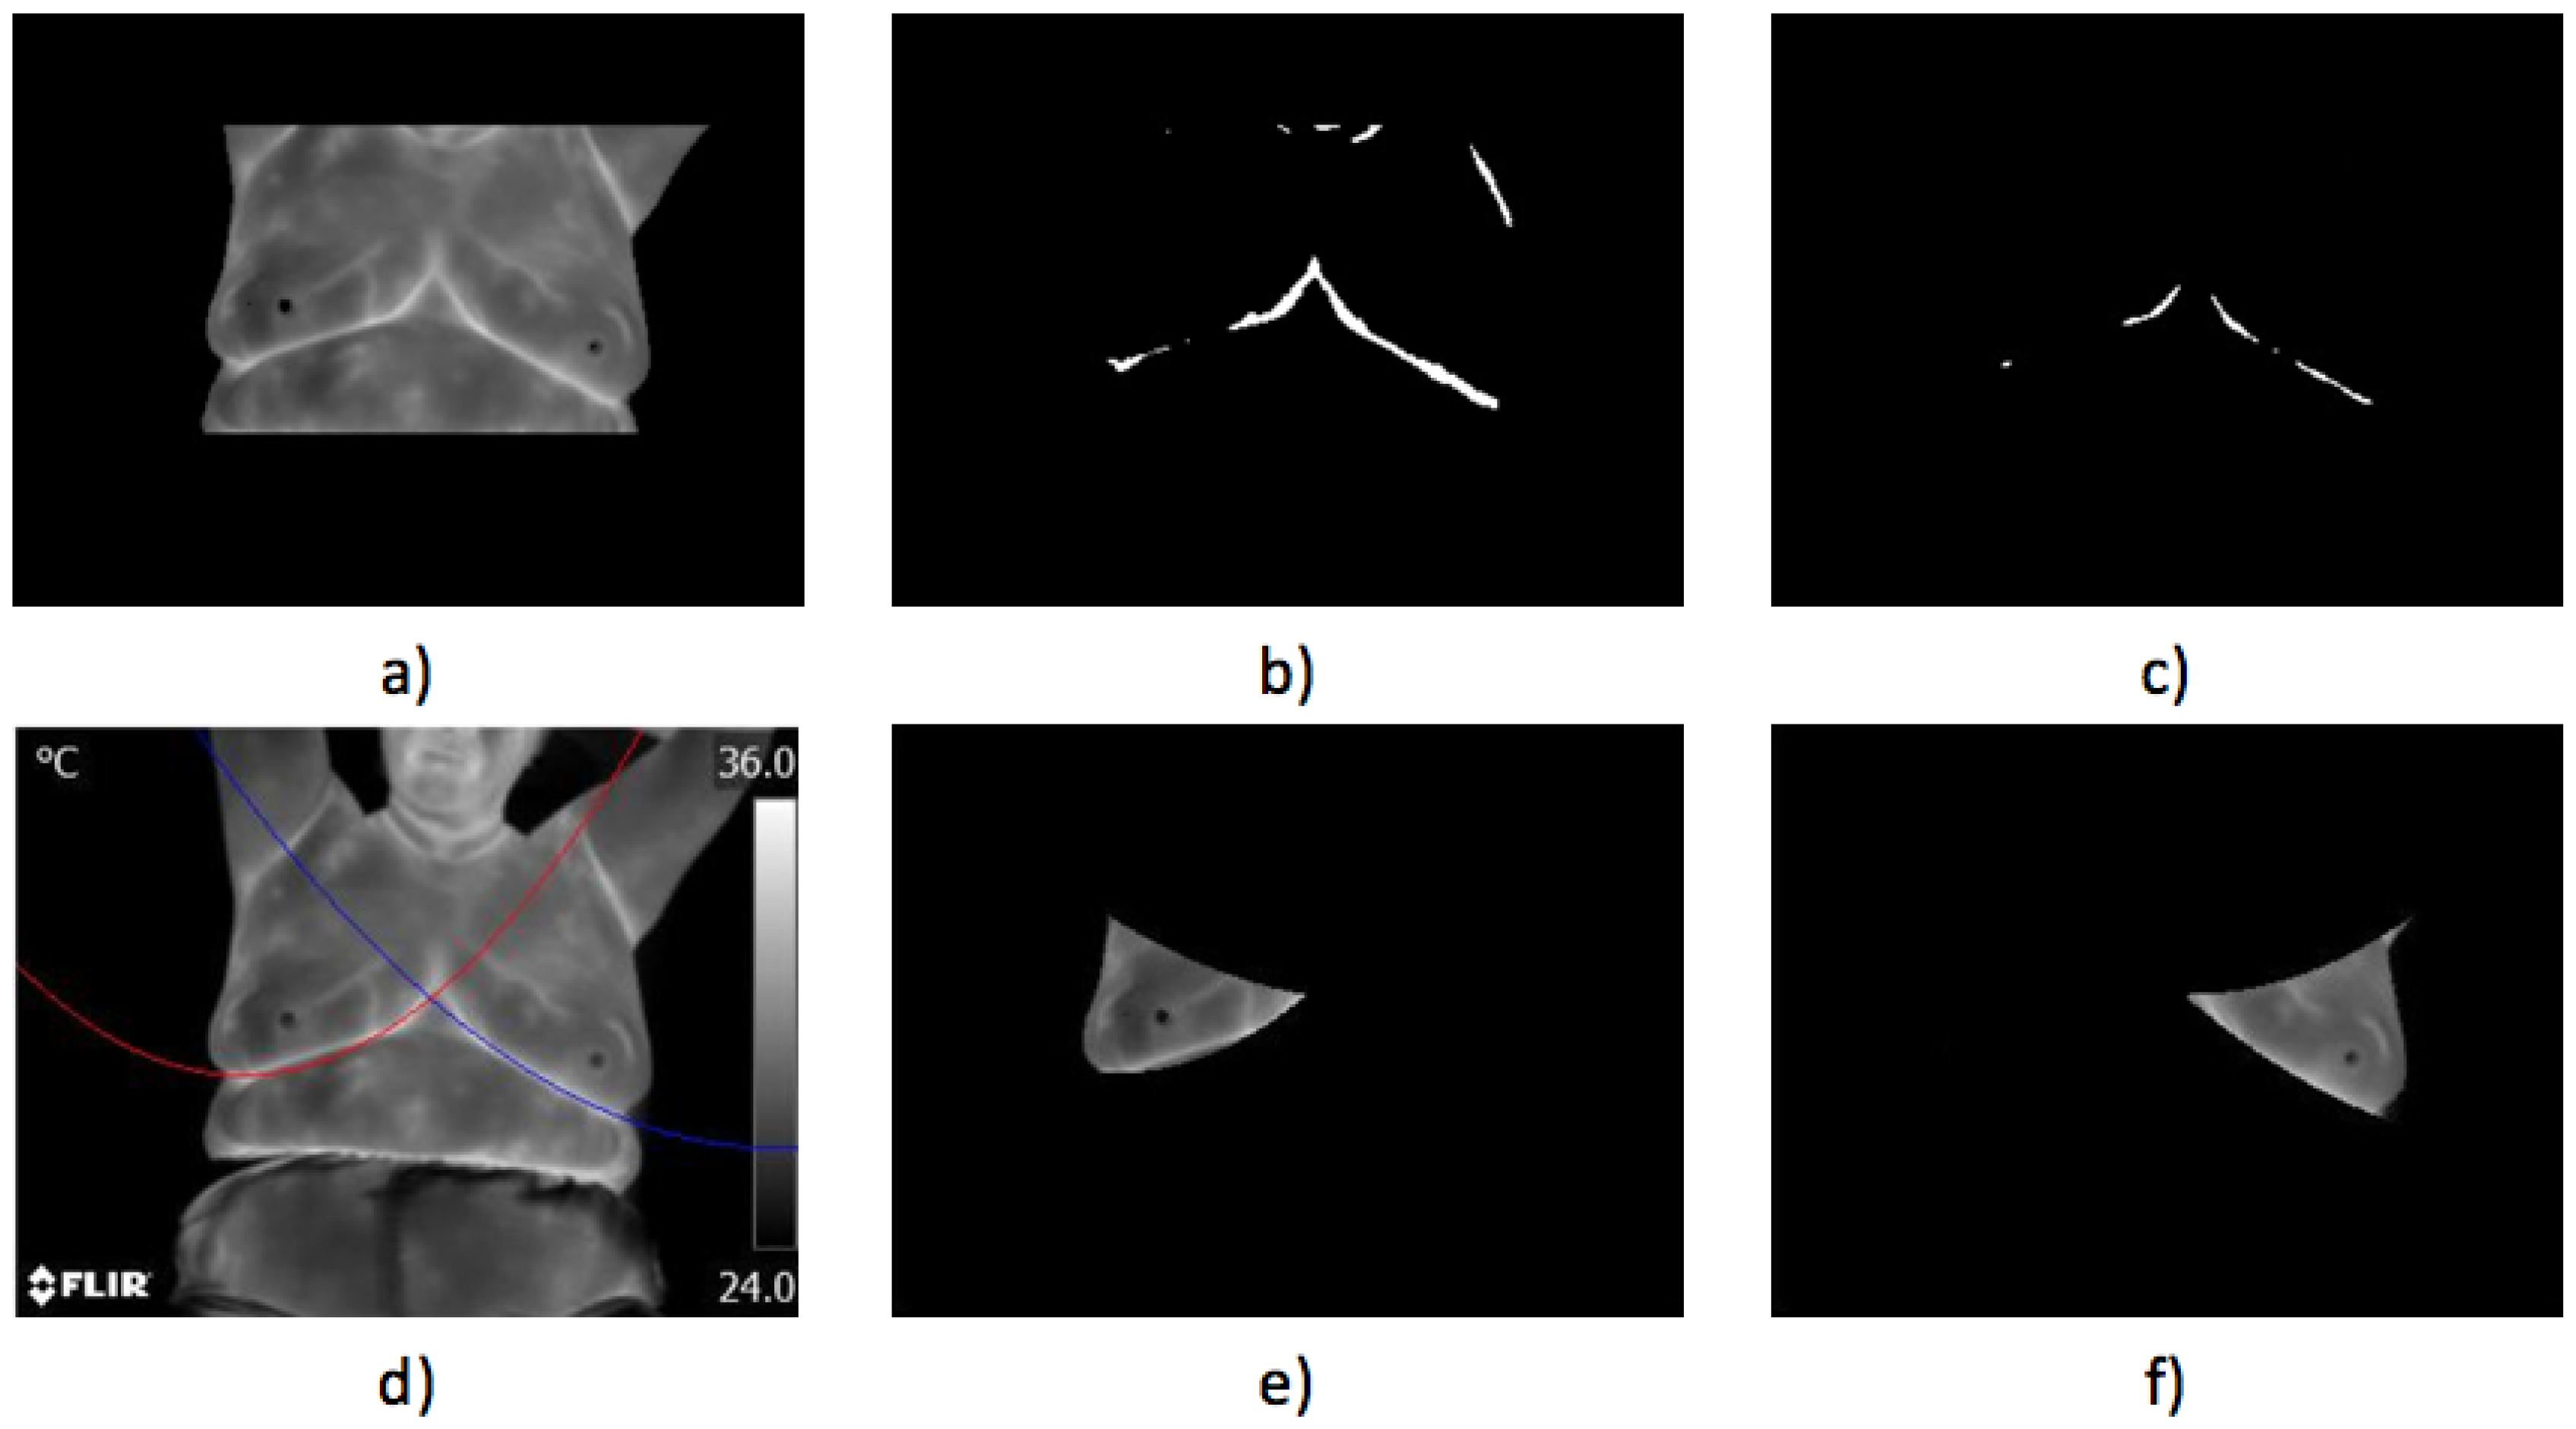
- Case 1, healthy:The first case illustrated in Figure 16 implies a woman with a robust constitution. The acquired thermogram can be seen in Figure 16a; the estimation of the inferior limits of the breast area can be seen in Figure 16b–d. The segmented right breast is shown in Figure 16e; meanwhile, the left is depicted in Figure 16f.The average temperatures of the segmented breast sides are shown in Table 4. The difference of temperatures is less than 1 °C, establishing that no problem was found. Maximum, minimum and standard deviation values are also depicted. The differences, in the three cases, also are less than 1 °C between the left and right sides.
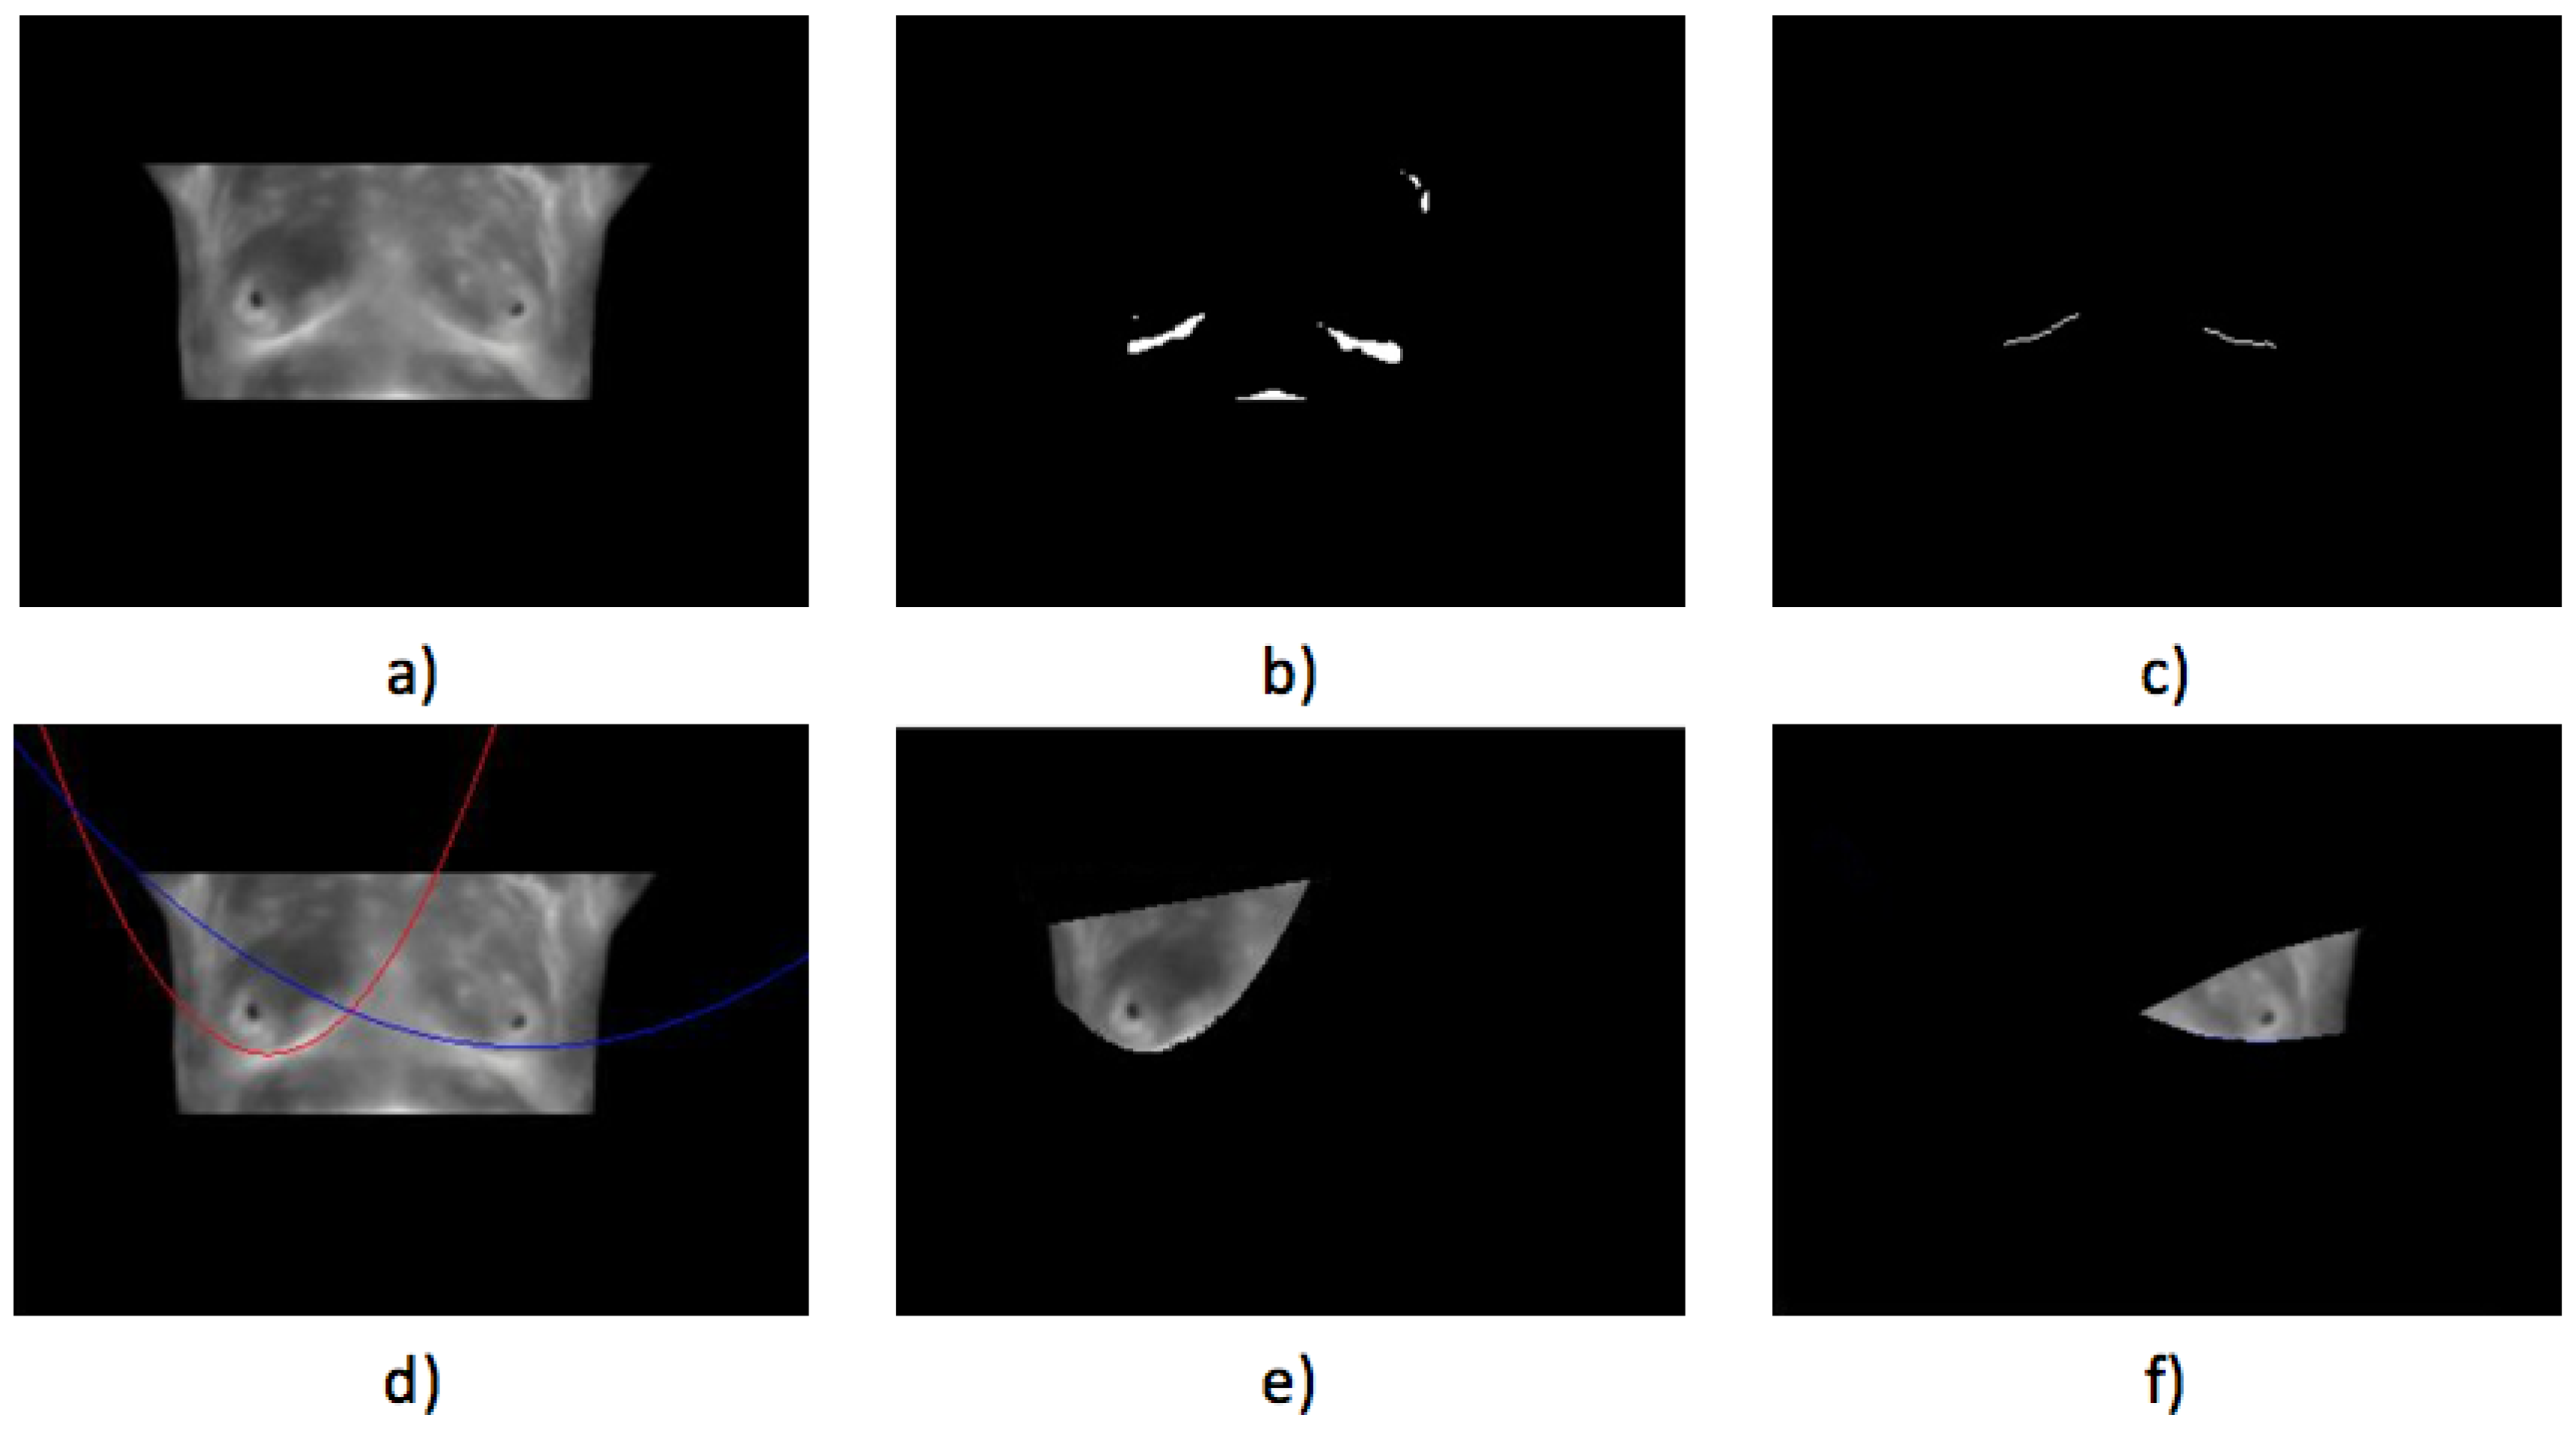
- Case 2, healthy,In Figure 17, the proposed methodology is applied to a woman with a thin constitution. In the acquired thermogram shown in Figure 17a, it is possible to see how a small region corresponding to the seat was segmented together with the patient body by Otsu’s method; however, this does not mean any problem for the finding of inferior limits exhibited in Figure 17a–d. Although at this time, the armpit slope is lighter than the previous case, the proposed segmentation results in being robust enough to separate the right and left breast zones, as can be seen in Figure 17e,f.Finally, the average temperatures present in the right and left breast side are shown in Table 5. Again, the difference of temperatures is less than 1 °C, with a result of no problem detected. This time, the difference between the maximum values is greater than 2 °C and could be associated with the segmentation result shown in Figure 17e, which also includes the side of the breast.
3.4. Cases with Problems Detected
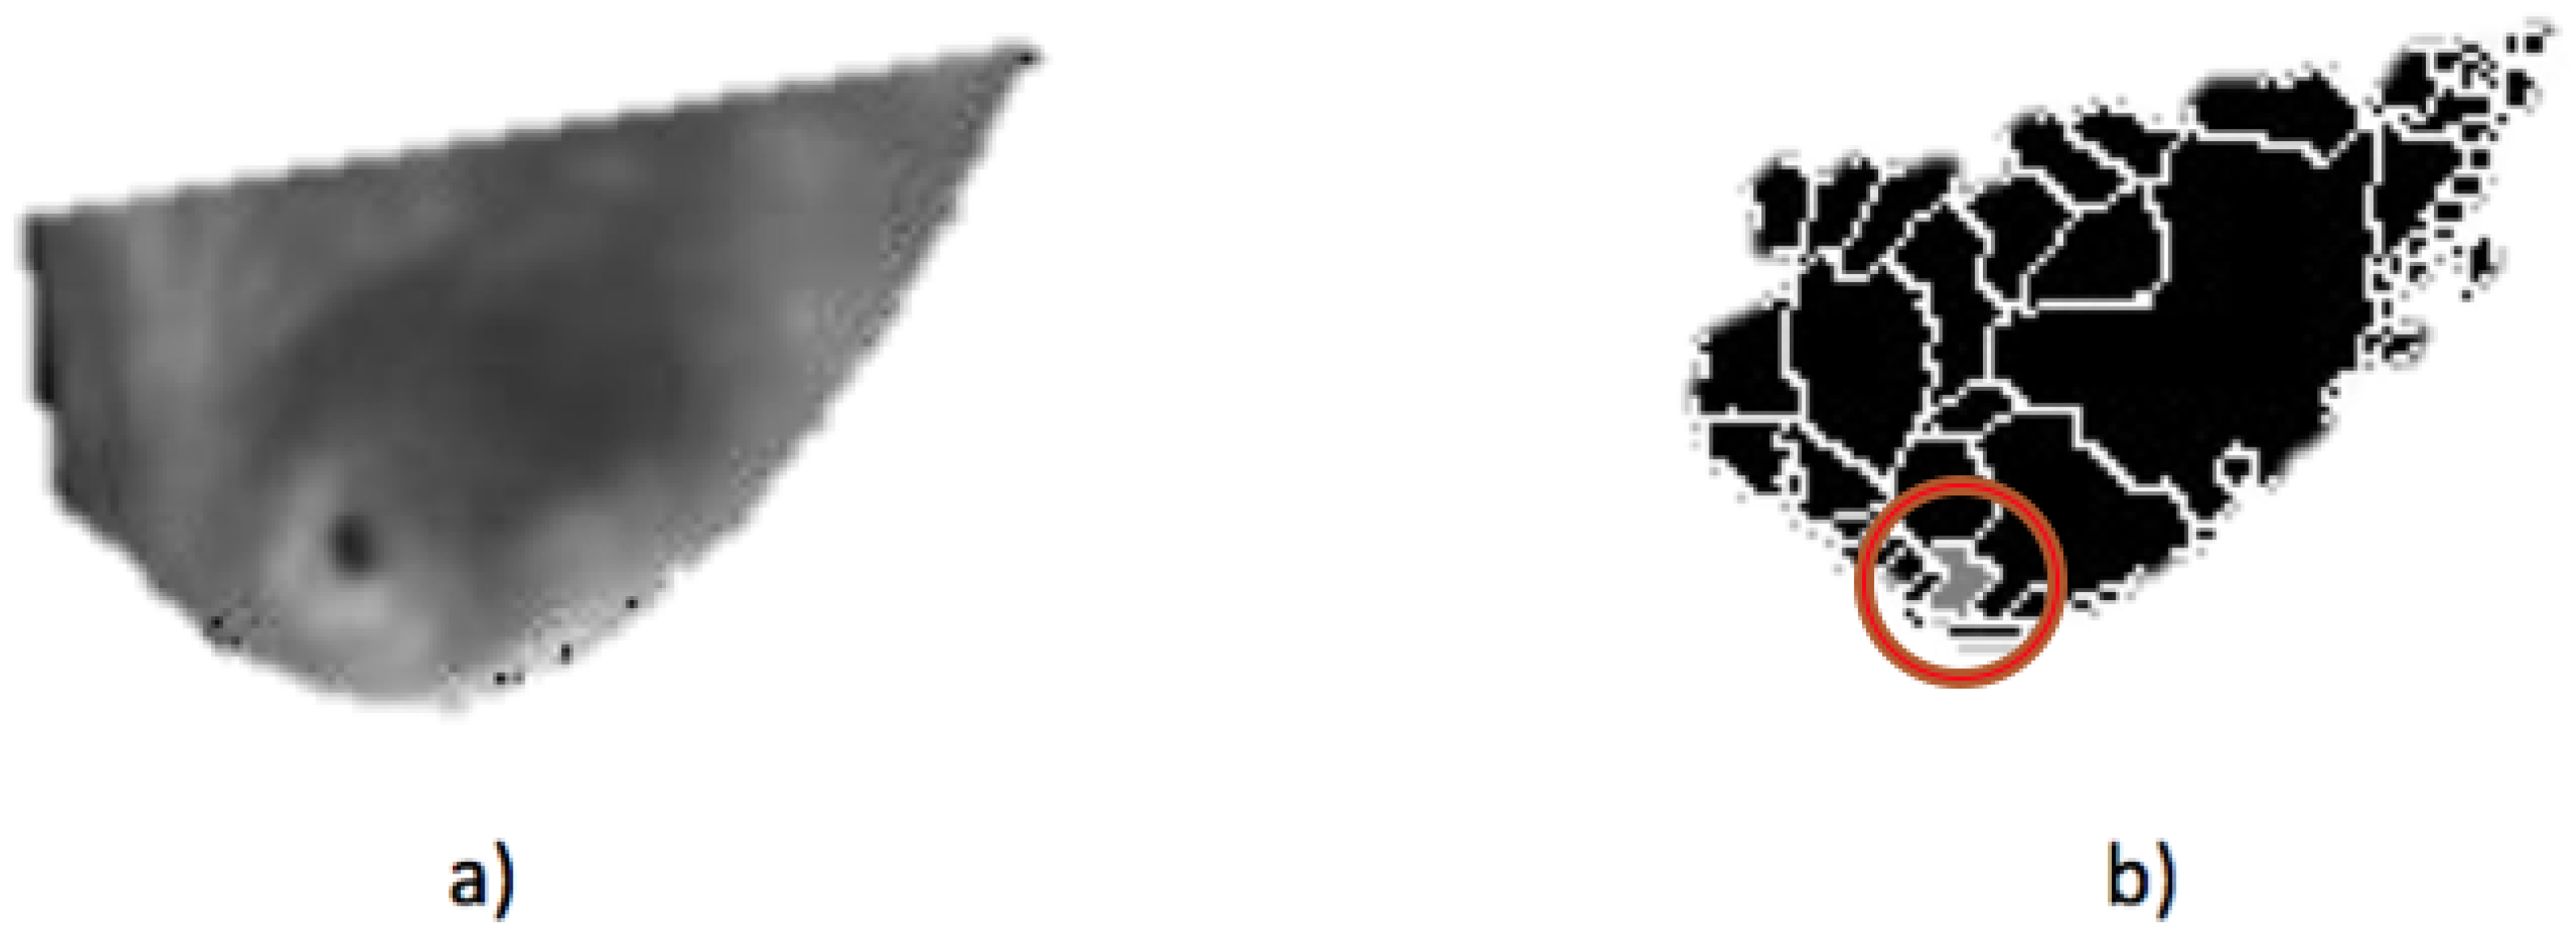
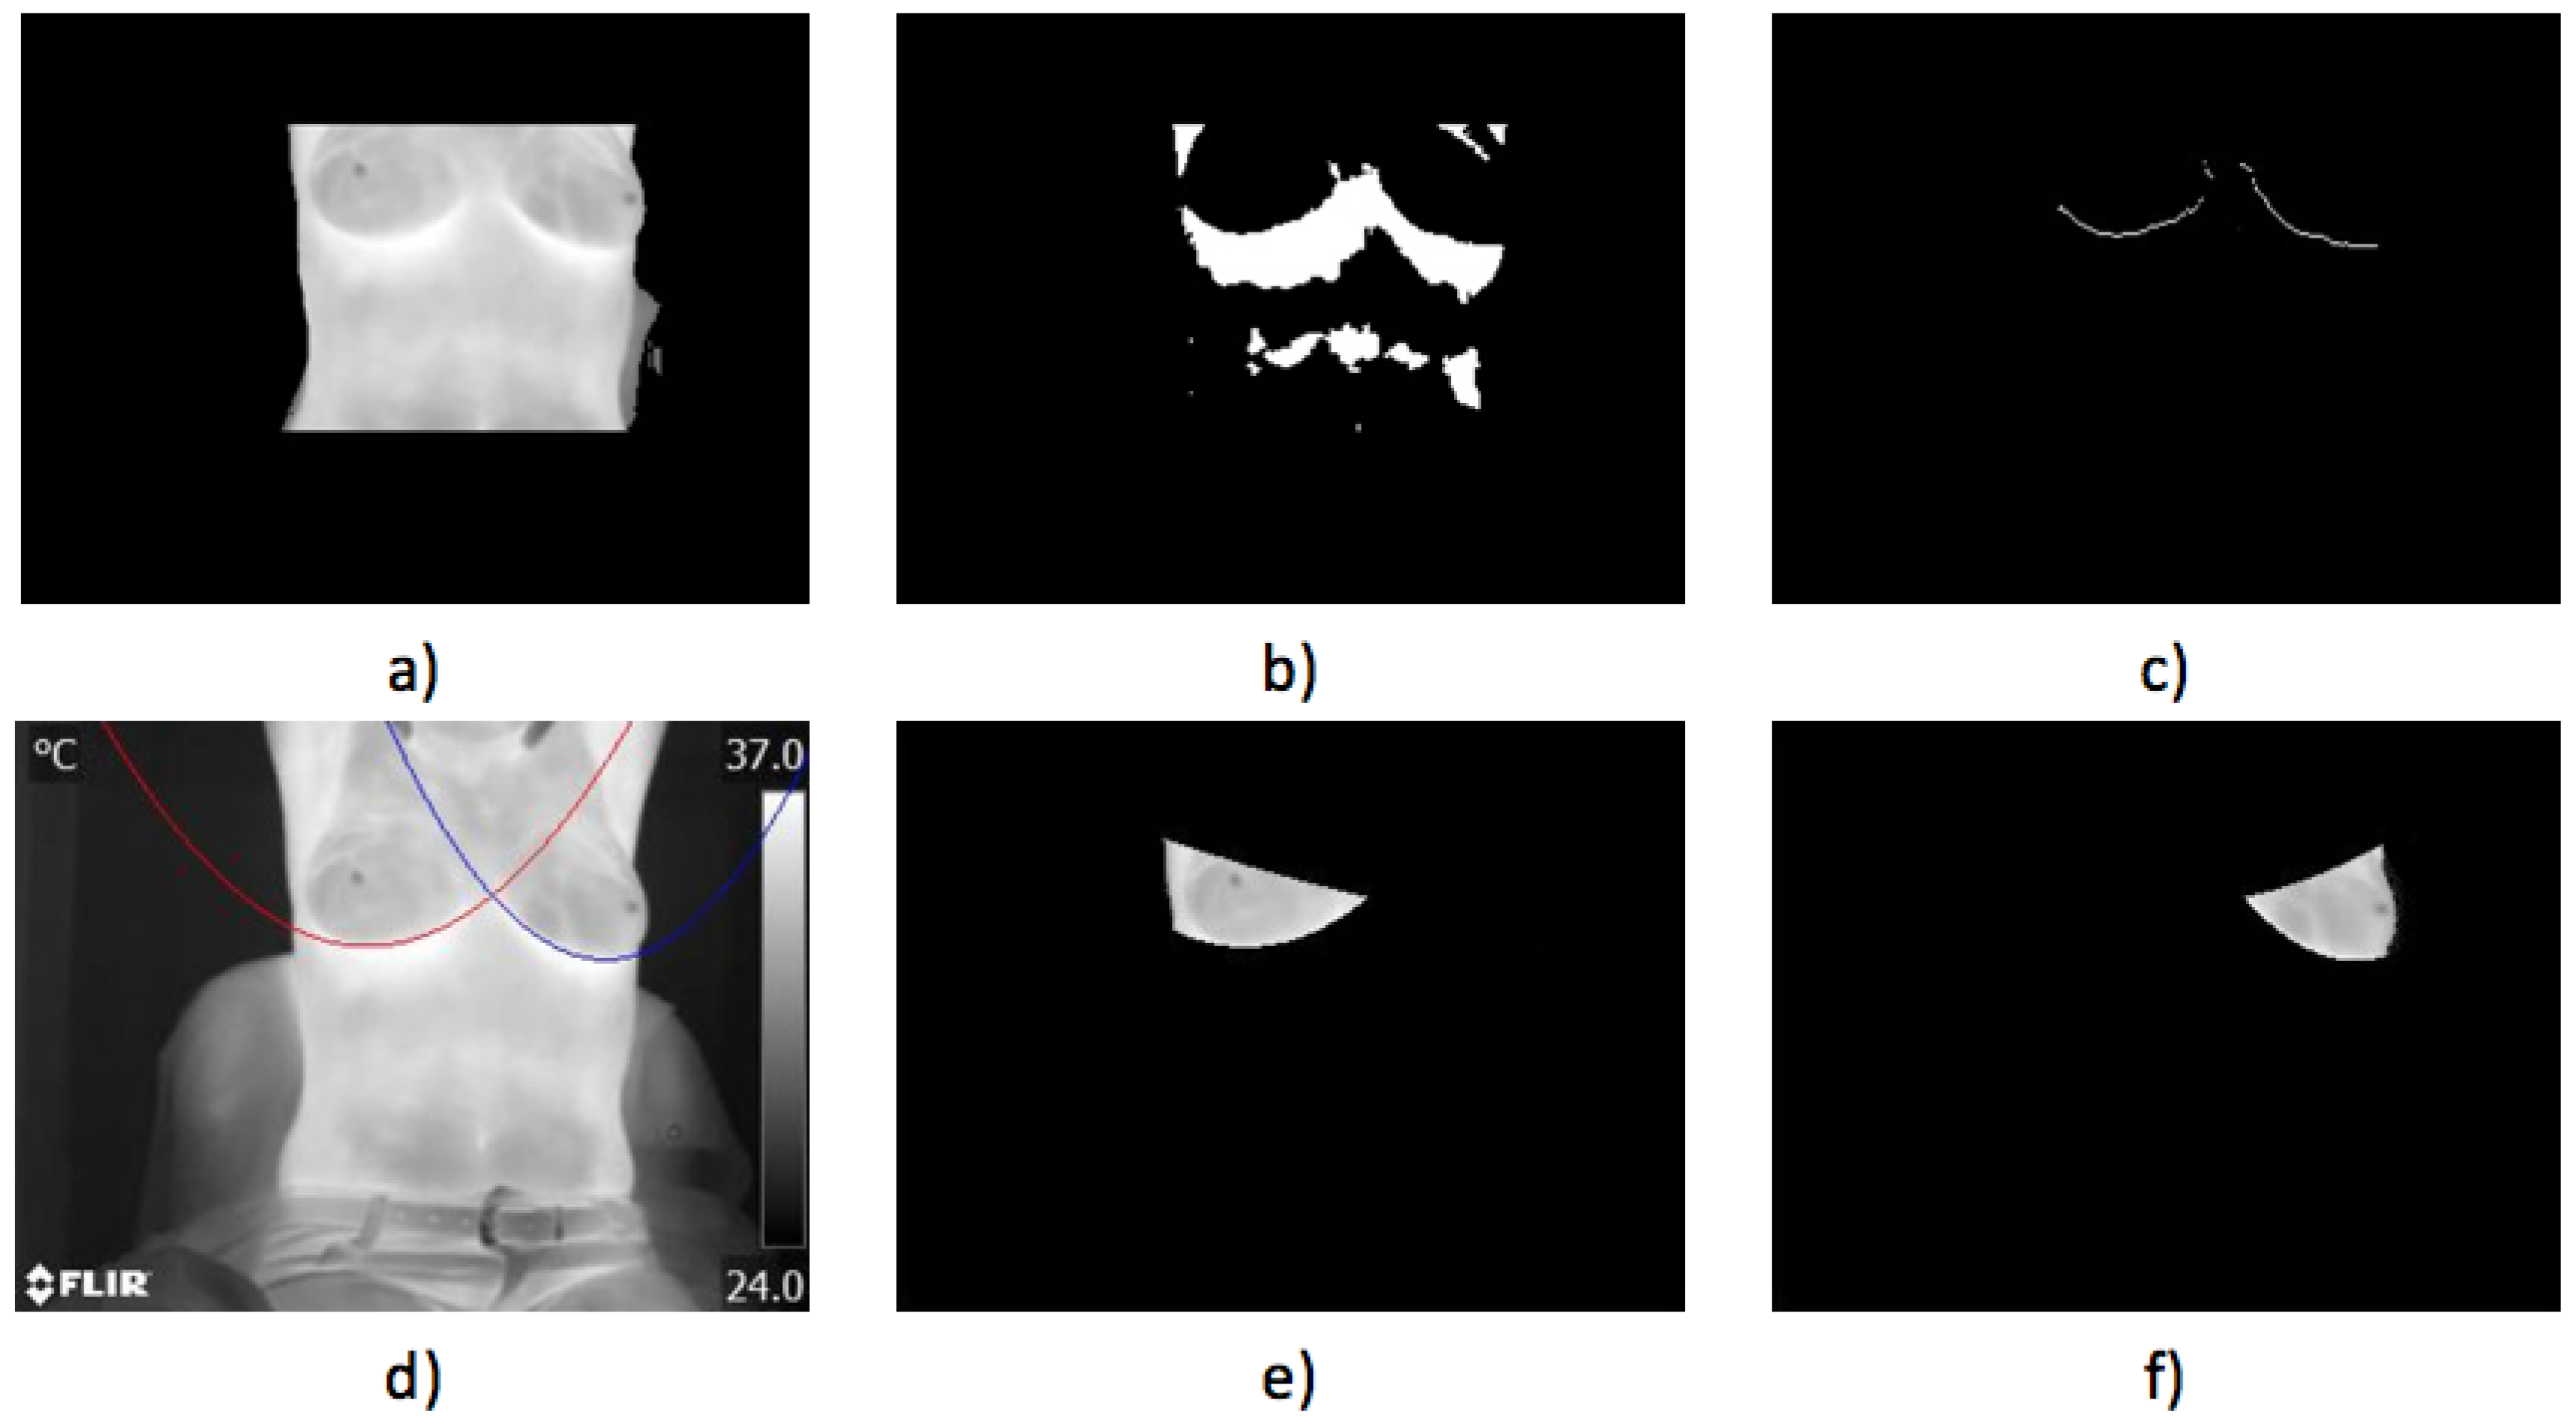
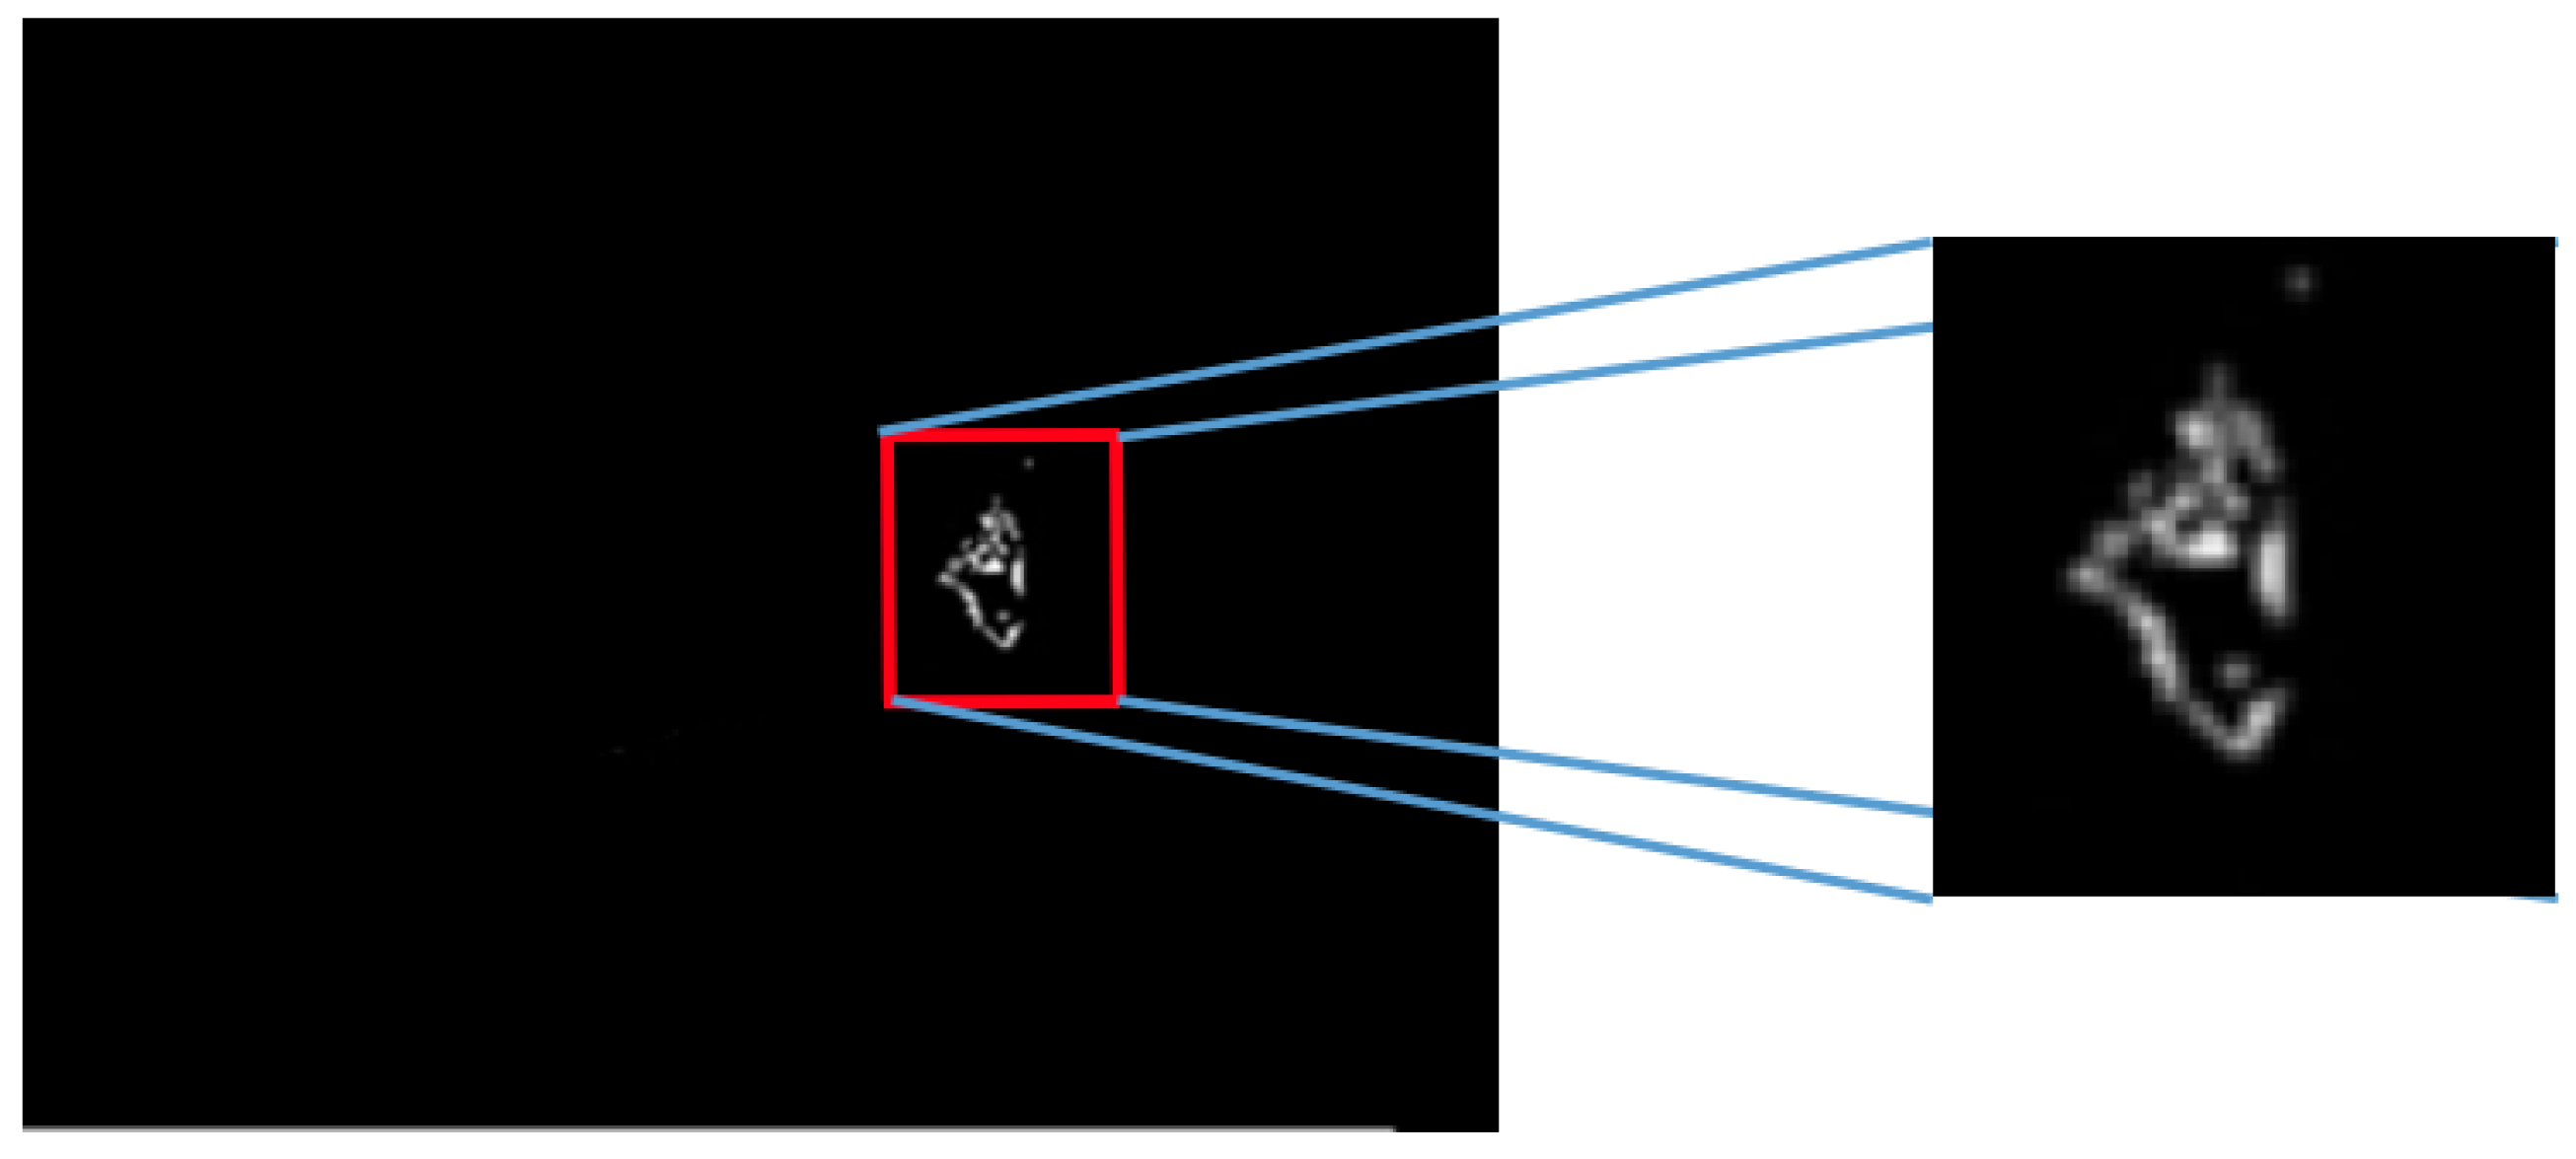
- Case 3, angiogenesis:The acquired histogram is shown in Figure 18a, and as in the previous cases, the pre-processing necessary to segment the breast regions can be followed step by step in Figure 18b–d. The segmented right and left breast are shown in Figure 18e,f, respectively. As in the previous case, a noticeable difference of temperatures can be seen in the thermogram in Figure 18a, with a lighter zone in the upper region of the left breast of the patient. This comparison is easier to achieve looking at Figure 18e,f.In Table 6 can be seen the estimation of the average difference of temperatures, which result in being 1.81 °C, with the left breast resulting in being hotter than the right breast, as expected. This is a clear indication of a detected problem, and now, the search for the hottest regions in the left breast is required. For this case, the difference of the maximum value and the standard deviation between the left and right sides is quite significant. In Figure 18, it is clear that one breast is lighter (or hotter) than the other.Watershed segmentation result can be seen in Figure 19. This time the hottest region is surrounding a cold zone and the resulting segmented shape can be associated with the one that blood vessels present resulting in an angiogenesis case. As mentioned earlier angiogenesis can be seen in early stages of breast cancer and subsequent medical exams are required, having the point of interest spotted in order to help the experts to correctly treat the patient.
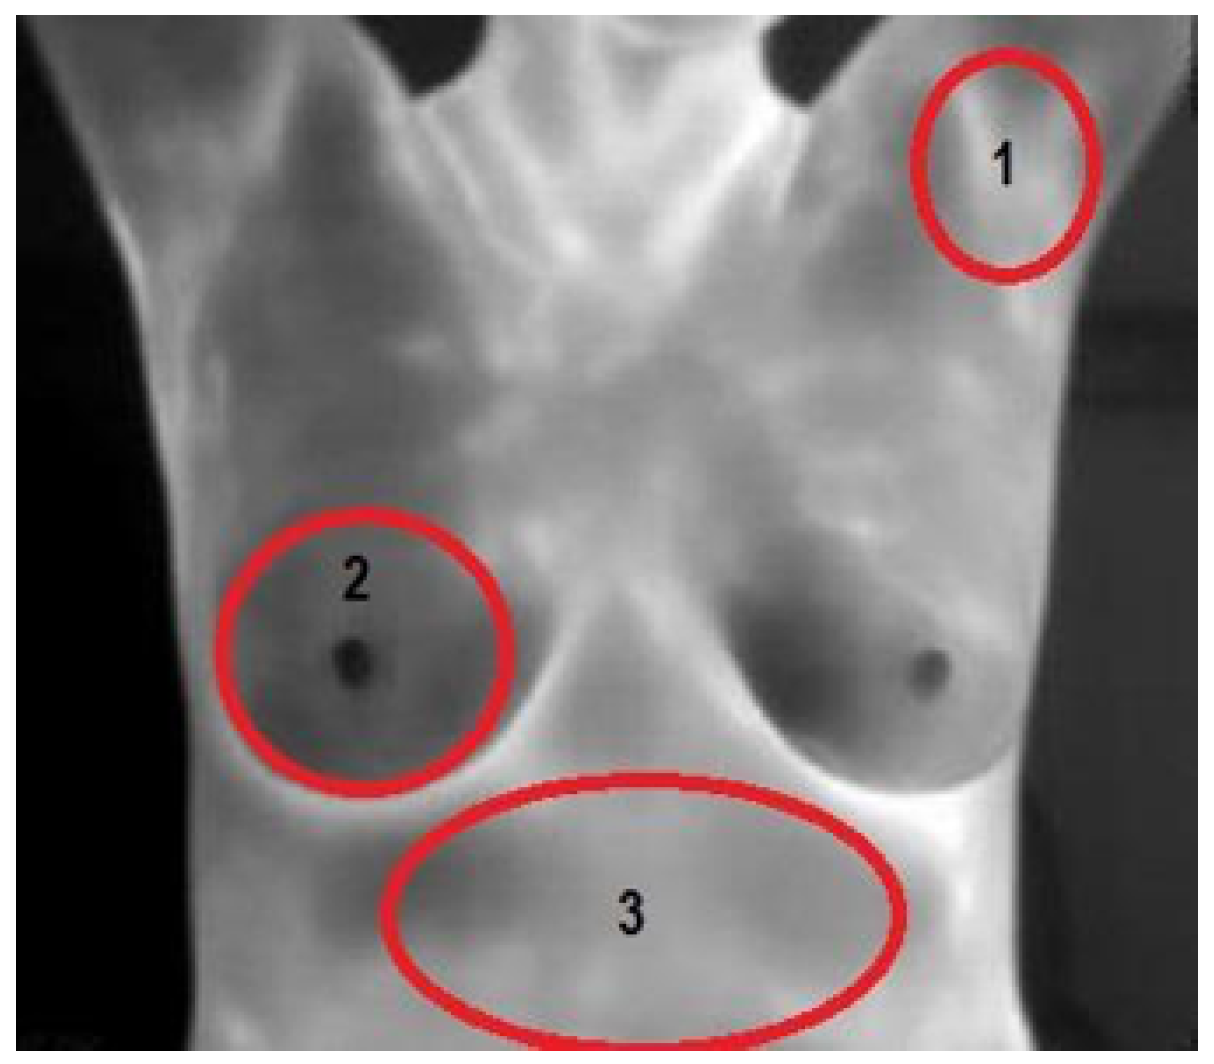
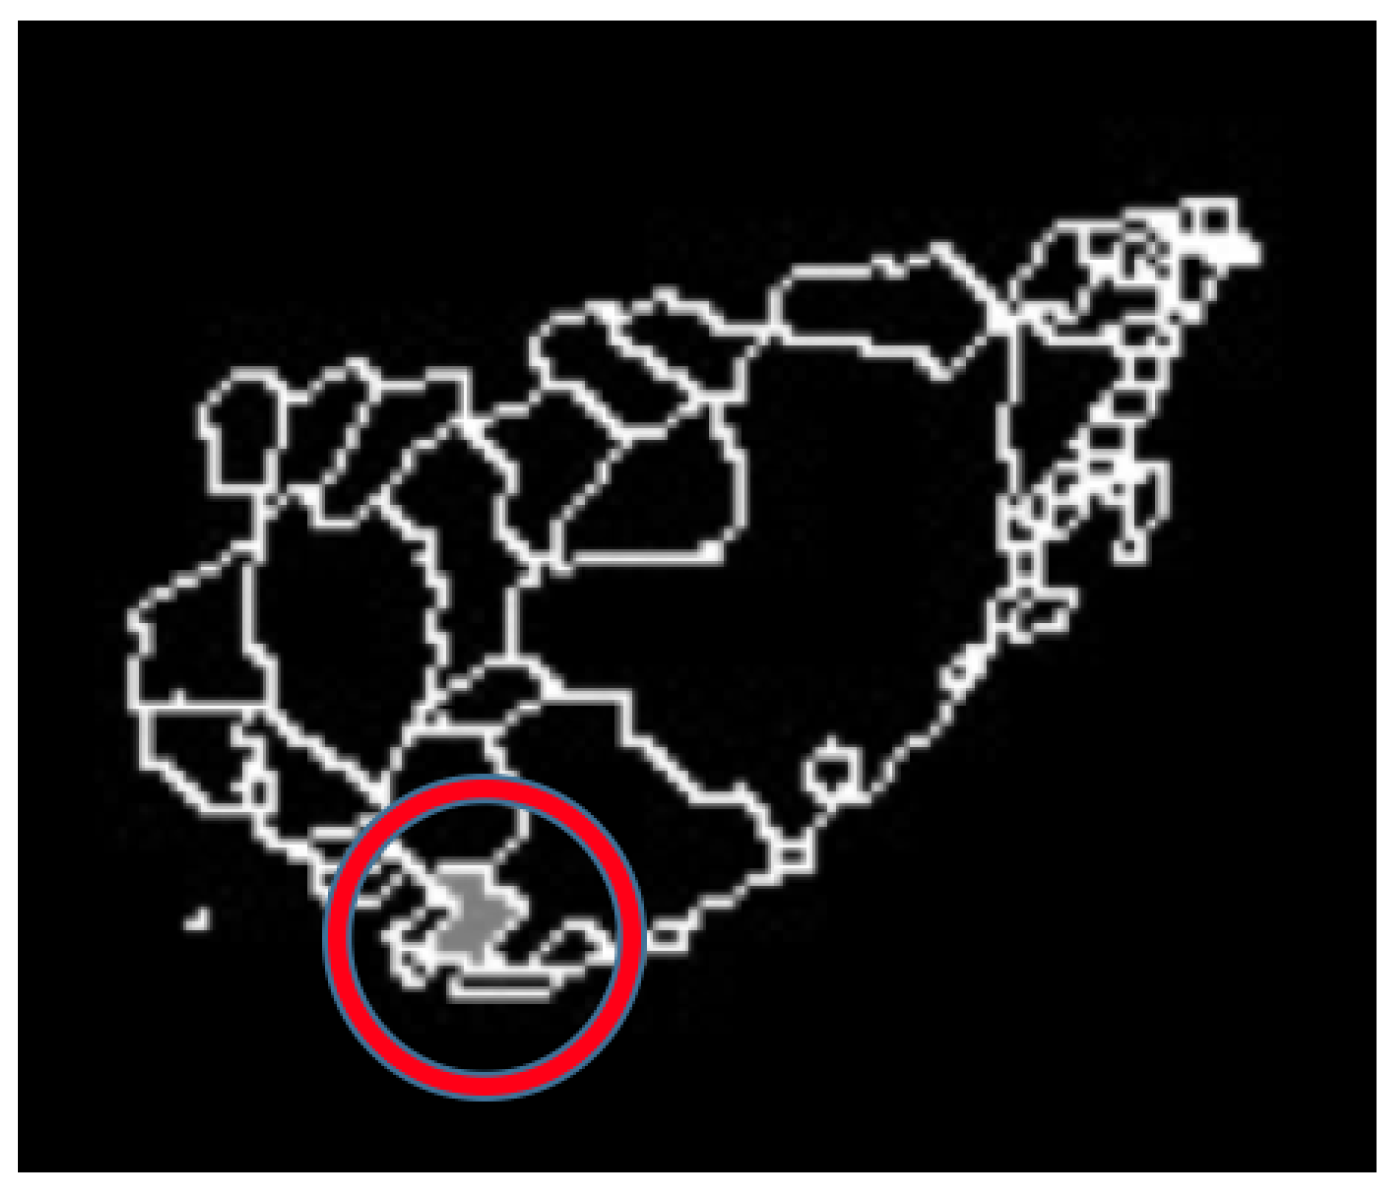
- Case 4, breast cancer:The last case can be seen in Figure 19. The acquired thermogram is shown in Figure 20a. The detection of the breast inferior limits can be seen in Figure 20b–d; meanwhile, the segmented right and left breast are depicted in Figure 20e,f. In the previous two cases, a more uniform temperature distribution was noticeable; in this case, however, multiple regions with high temperatures can be seen in Figure 20a in lighter shades of gray getting close to white. Although a qualitative analysis is not the objective of this paper, such information can be used to infer the existence of a problem that must be analyzed.Posterior to the breast segmentation, the evaluation process delivers the results shown in Table 7. As can be seen, the average temperature difference is 1.92 °C, which is slightly superior to that presented in Case 3. The maximum value and standard deviation present the highest difference of the four cases analyzed, reaching a value of 8.53 °C for the first one and 2.46 °C for the second one.With the numeric result establishing a difference of temperatures between right and left breast higher than 1 °C, the additional step, which implies spotting the location of the hottest region, is performed. Watershed segmentation applied to the right breast, which results in being the one with the highest temperature average, is shown in Figure 21, with the region with the highest temperature denoted in gray and indicated within a red circle; such a region is located in the lower zone of the breast, and the expert is recommended to be aware of it.
4. Conclusions
Acknowledgments
Author Contributions
Conflicts of Interest
References
- Peng, L.; Chen, W.; Zhou, W.; Li, F.; Yang, J.; Zhang, J. An immune-inspired semi-supervised algorithm for breast cancer diagnosis. Comput. Methods Programs Biomed. 2016, 134, 259–265. [Google Scholar] [CrossRef] [PubMed]
- Faust, O.; Acharya, U.R.; Ng, E.; Hong, T.J.; Yu, W. Application of infrared thermography in computer aided diagnosis. Infrared Phys. Technol. 2014, 66, 160–175. [Google Scholar] [CrossRef]
- EtehadTavakol, M.; Chandran, V.; Ng, E.; Kafieh, R. Breast cancer detection from thermal images using bispectral invariant features. Int. J. Therm. Sci. 2013, 69, 21–36. [Google Scholar] [CrossRef]
- Araújo, M.C.; Lima, R.C.; De Souza, R.M. Interval symbolic feature extraction for thermography breast cancer detection. Expert Syst. Appl. 2014, 41, 6728–6737. [Google Scholar] [CrossRef]
- Francis, S.V.; Sasikala, M.; Bharathi, G.B.; Jaipurkar, S.D. Breast cancer detection in rotational thermography images using texture features. Infrared Phys. Technol. 2014, 67, 490–496. [Google Scholar] [CrossRef]
- Gerasimova, E.; Audit, B.; Roux, S.G.; Khalil, A.; Gileva, O.; Argoul, F.; Naimark, O.; Arneodo, A. Wavelet-based multifractal analysis of dynamic infrared thermograms to assist in early breast cancer diagnosis. Front. Physiol. 2014, 5, 176. [Google Scholar] [CrossRef] [PubMed]
- U.S. Preventive Services Task Force. Screening for breast cancer: U.S. Preventive Services Task Force recommendation statement. Ann. Intern. Med. 2009, 151, 716–726. [Google Scholar]
- Mahmoudzadeh, E.; Montazeri, M.; Zekri, M.; Sadri, S. Extended hidden Markov model for optimized segmentation of breast thermography images. Infrared Phys. Technol. 2015, 72, 19–28. [Google Scholar] [CrossRef]
- Ogihara, H.; Hamamoto, Y.; Fujita, Y.; Goto, A.; Nishikawa, J.; Sakaida, I. Development of a Gastric Cancer Diagnostic Support System with a Pattern Recognition Method Using a Hyperspectral Camera. J. Sens. 2016, 2016. [Google Scholar] [CrossRef]
- Lehmann, T.; Tavakoli, M.; Usmani, N.; Sloboda, R. Force-sensor-based estimation of needle tip deflection in brachytherapy. J. Sens. 2013, 2013. [Google Scholar] [CrossRef]
- Tosi, D.; Macchi, E.G.; Cigada, A. Fiber-Optic Temperature and Pressure Sensors Applied to Radiofrequency Thermal Ablation in Liver Phantom: Methodology and Experimental Measurements. J. Sens. 2015, 2015. [Google Scholar] [CrossRef]
- Sharma, S.K.; Saini, P.; Samria, N. Experimental thermal analysis of diesel engine piston and cylinder wall. J. Eng. 2015, 2015. [Google Scholar] [CrossRef]
- Armellin, E.; Bovesecchi, G.; Coppa, P.; Pasquantonio, G.; Cerroni, L. LED Curing Lights and Temperature Changes in Different Tooth Sites. BioMed Res. Int. 2016, 2016. [Google Scholar] [CrossRef] [PubMed]
- Umayal Sundari, A.; Neelamegam, P.; Subramanian, C. An Experimental Study and Analysis on Solar Drying of Bitter Gourd Using an Evacuated Tube Air Collector in Thanjavur, Tamil Nadu, India. Conf. Pap. Sci. 2013, 2013. [Google Scholar] [CrossRef]
- Madakyaru, M.; Nounou, M.N.; Nounou, H.N. Integrated multiscale latent variable regression and application to distillation columns. Model. Simul. Eng. 2013, 2013. [Google Scholar] [CrossRef]
- Lee, Y.G.; Kim, J.H.; Kim, C.G. High temperature endurable fiber optic accelerometer. Shock Vib. 2014, 2014. [Google Scholar] [CrossRef]
- Molénat, G.; Durand, L.; Galy, J.; Couret, A. Temperature control in Spark Plasma sintering: An FEM approach. J. Metall. 2010, 2010. [Google Scholar] [CrossRef]
- Liu, S.; Liu, S.; Ren, T. Ultrasonic tomography based temperature distribution measurement method. Measurement 2016, 94, 671–679. [Google Scholar] [CrossRef]
- Shen, X.; Xiong, Q.; Shi, W.; Wang, K.; Lai, G. Temperature distribution monitoring using ultrasonic thermometry based on markov radial basis function approximation and singular values decomposition. Math. Probl. Eng. 2014, 2014. [Google Scholar] [CrossRef]
- Yu, Y.; Chow, W.K. Review on an advanced high-temperature measurement technology: The optical fiber thermometry. J. Thermodyn. 2010, 2009. [Google Scholar] [CrossRef]
- Cheng, L.; Tian, G.Y. Comparison of nondestructive testing methods on detection of delaminations in composites. J. Sens. 2012, 2012. [Google Scholar] [CrossRef]
- Chady, T.; Lopato, P.; Szymanik, B. Terahertz and thermal testing of glass-fiber reinforced composites with impact damages. J. Sens. 2012, 2012. [Google Scholar] [CrossRef]
- Chen, K.; Bai, L.; Chen, Y.; Cheng, Y.; Tian, S.; Zhu, P. Defect Automatic Identification of Eddy Current Pulsed Thermography. J. Sens. 2014, 2014. [Google Scholar] [CrossRef]
- Fernández-Cuevas, I.; Marins, J.C.B.; Lastras, J.A.; Carmona, P.M.G.; Cano, S.P.; García-Concepción, M.Á.; Sillero-Quintana, M. Classification of factors influencing the use of infrared thermography in humans: A review. Infrared Phys. Technol. 2015, 71, 28–55. [Google Scholar] [CrossRef]
- Ring, F. Thermal imaging today and its relevance to diabetes. J. Diabetes Sci. Technol. 2010, 4, 857–862. [Google Scholar] [CrossRef] [PubMed]
- Sun, G.; Saga, T.; Shimizu, T.; Hakozaki, Y.; Matsui, T. Fever screening of seasonal influenza patients using a cost-effective thermopile array with small pixels for close-range thermometry. Int. J. Infect. Dis. 2014, 25, 56–58. [Google Scholar] [CrossRef] [PubMed]
- Tan, J.H.; Ng, E.; Acharya, U.R.; Chee, C. Infrared thermography on ocular surface temperature: A review. Infrared Phys. Technol. 2009, 52, 97–108. [Google Scholar] [CrossRef]
- Jarrell, J.; Spanswick, C. Diagnostic use of infrared thermography in a patient with chronic pain following electrocution: A case report. J. Med. Case Rep. 2009, 3. [Google Scholar] [CrossRef]
- Lahiri, B.; Bagavathiappan, S.; Jayakumar, T.; Philip, J. Medical applications of infrared thermography: A review. Infrared Phys. Technol. 2012, 55, 221–235. [Google Scholar] [CrossRef]
- Lawson, R. Implications of surface temperatures in the diagnosis of breast cancer. Can. Med. Assoc. J. 1956, 75, 309–310. [Google Scholar] [PubMed]
- Shada, A.L.; Dengel, L.T.; Petroni, G.R.; Smolkin, M.E.; Acton, S.; Slingluff, C.L. Infrared thermography of cutaneous melanoma metastases. J. Surg. Res. 2013, 182, e9–e14. [Google Scholar] [CrossRef] [PubMed]
- Gautherie, M.; Gros, C.M. Breast thermography and cancer risk prediction. Cancer 1980, 45, 51–56. [Google Scholar] [CrossRef]
- Ng, E.; Chen, Y.; Ung, L. Computerized breast thermography: Study of image segmentation and temperature cyclic variations. J. Med. Eng. Technol. 2001, 25, 12–16. [Google Scholar] [PubMed]
- Bjurstam, N.; Hedberg, K.; Hultborn, K.; Johansson, N.; Johnsen, C. Diagnosis of breast carcinoma. In Progress in Surgery; Karger Publishers: London, UK, 1974; pp. 1–65. [Google Scholar]
- Lohbeck, H.U. Thermography Instead of Mammography? In Cancer Management in Man; Springer: New York, NY, USA, 1989; pp. 96–102. [Google Scholar]
- Herry, C.; Frize, M. Digital processing techniques for the assessment of pain with infrared thermal imaging. In Proceedings of the Second Joint EMBS-BMES Conference: 24th Annual Conference of the Engineering in Medicine and Biology and the Annual Fall Meeting of the Biomedical Engineering Society, Houston, TX, USA, 23–26 October 2002; Volume 2, pp. 1157–1158.
- Lipari, C.A.; Head, J.F. Advanced infrared image processing for breast cancer risk assessment. In Proceedings of the the 19th Annual International Conference of the IEEE Engineering in Medicine and Biology Society, Chicago, IL, USA, 30 October–2 November 1997; Volume 2, pp. 673–676.
- Schaefer, G.; Závišek, M.; Nakashima, T. Thermography based breast cancer analysis using statistical features and fuzzy classification. Pattern Recognit. 2009, 42, 1133–1137. [Google Scholar] [CrossRef] [Green Version]
- Prasad, K.; Rajagopal, K. Segmentation of Breast Thermogram Images for the Detection of Breast Cancer— A Projection Profile Approach. J. Image Graph. 2015, 3, 47–51. [Google Scholar]
- De Oliveira, J.; Conci, A.; Pérez, M.G.; Andaluz, V.H. Segmentation of infrared images: A new technology for early detection of breast diseases. In Proceedings of the 2015 IEEE International Conference on Industrial Technology (ICIT), Seville, Spain, 17–19 March 2015; pp. 1765–1771.
- Silva, L.; Saade, D.; Sequeiros, G.; Silva, A.; Paiva, A.; Bravo, R.; Conci, A. A new database for breast research with infrared image. J. Med. Imaging Health Inform. 2014, 4, 92–100. [Google Scholar] [CrossRef]
- Acharya, U.R.; Ng, E.; Tan, J.H.; Sree, S.V. Thermography based breast cancer detection using texture features and support vector machine. J. Med. Syst. 2012, 36, 1503–1510. [Google Scholar] [CrossRef] [PubMed]
- Prabha, S.; Sujatha, C.; Ramakrishnan, S. Asymmetry analysis of breast thermograms using BM3D technique and statistical texture features. In Proceedings of the 3rd International Conference on Informatics, Electronics & Vision (ICIEV), Dhaka, Bangladesh, 23–24 May 2014; pp. 1–4.
- Borchartt, T.B.; Conci, A.; Lima, R.C.; Resmini, R.; Sanchez, A. Breast thermography from an image processing viewpoint: A survey. Signal Process. 2013, 93, 2785–2803. [Google Scholar] [CrossRef]
- Agostini, V.; Knaflitz, M.; Molinari, F. Motion artifact reduction in breast dynamic infrared imaging. IEEE Trans. Biomed. Eng. 2009, 56, 903–906. [Google Scholar] [CrossRef] [PubMed]
- Kontos, M.; Wilson, R.; Fentiman, I. Digital infrared thermal imaging (DITI) of breast lesions: Sensitivity and specificity of detection of primary breast cancers. Clin. Radiol. 2011, 66, 536–539. [Google Scholar] [CrossRef] [PubMed]
- Krawczyk, B.; Schaefer, G. A hybrid classifier committee for analysing asymmetry features in breast thermograms. Appl. Soft Comput. 2014, 20, 112–118. [Google Scholar] [CrossRef]
- Togawa, T. Non-contact skin emissivity: Measurement from reflectance using step change in ambient radiation temperature. Clin. Phys. Physiol. Meas. 1989, 10, 39–48. [Google Scholar] [CrossRef] [PubMed]
- Baranski, M.; Polak, A. Thermographic diagnostic of electrical machines. In Proceedings of the XIX International Conference on Electrical Machines (ICEM), Rome, Italy, 6–8 September 2010.
- Harb, S.M.E.; Isa, N.A.M.; Salamah, S.A. Improved image magnification algorithm based on Otsu thresholding. Comput. Electr. Eng. 2015, 46, 338–355. [Google Scholar] [CrossRef]
- Rother, C.; Kolmogorov, V.; Blake, A. Grabcut: Interactive foreground extraction using iterated graph cuts. ACM Trans. Graph. (TOG) 2004, 23, 309–314. [Google Scholar] [CrossRef]
- Jadin, M.; Taib, S. Infrared image enhancement and segmentation for extracting the thermal anomalies in electrical equipment. Elektronika ir Elektrotechnika 2012, 120, 107–112. [Google Scholar] [CrossRef]
- Soille, P. Morphological Image Analysis: Principles and Applications; Springer Science & Business Media: New York, NY, USA, 2013. [Google Scholar]
- Najman, L.; Talbot, H. Mathematical Morphology; John Wiley & Sons, Inc.: New York, NY, USA, 2013. [Google Scholar]
- Sequeiros, G.O. Desenvolvimento de um Banco de Dados Acessiveis Via Web com Recuperação Baseado no Conteúdo. Master’s Thesis, Universidade Federal Fluminense, Niterói, Brazil, January 2013. [Google Scholar]
- Fawcett, T. An introduction to ROC analysis. Pattern Recognit. Lett. 2006, 27, 861–874. [Google Scholar] [CrossRef]


| Characteristic | Specification |
|---|---|
| Sensibility | 0.05 °C |
| Spatial resolution (IFOV) | 1.36 mrad |
| Thermogram resolution | 320 × 240 px |
| Sensor speed | 25 us |
| Thermogram format | JPEG |
| Communication | Ethernet |
| Emissivity correction | Yes, from 0.1 to 1.0 |
| Focus | Automatic |
| Zoom | Digital, up to 8× |
| Cases (Total) | Healthy | Sick | Unknown |
|---|---|---|---|
| Healthy (37) | 17 | 4 | 16 |
| Sick (42) | 5 | 18 | 19 |
| Total (79) | 22 | 22 | 35 |
| Cases (Total) | Healthy | Sick | Unknown |
|---|---|---|---|
| Healthy (414) | 364 | 43 | 7 |
| Sick (40) | 5 | 33 | 2 |
| Total (454) | 369 | 76 | 9 |
| Temperature | Left | Right | Difference |
|---|---|---|---|
| Average | 26.43 °C | 25.70 °C | 0.73 °C |
| Max | 35.56 °C | 36.5 °C | 0.94 °C |
| Min | 24.04 °C | 24.04 °C | 0 °C |
| SD | 3.34 °C | 3.61 °C | 0.27 °C |
| Temperature | Left | Right | Difference |
|---|---|---|---|
| Average | 29.07 °C | 29.65 °C | 0.58 °C |
| Max | 36.45 °C | 34.29 °C | 2.16 °C |
| Min | 24.04 °C | 24.04 °C | 0 °C |
| SD | 3.60 °C | 2.98 °C | 0.62 °C |
| Temperature | Left | Right | Difference |
|---|---|---|---|
| Average | 30.1 °C | 28.29 °C | 1.81 °C |
| Max | 36.45 °C | 33.60 °C | 2.85 °C |
| Min | 24.04 °C | 24.04 °C | 0 °C |
| SD | 3.60 °C | 2.78 °C | 0.82 °C |
| Temperature | Left | Right | Difference |
|---|---|---|---|
| Average | 26.91 °C | 28.84 °C | 1.92 °C |
| Max | 27.82 °C | 36.35 °C | 8.53 °C |
| Min | 24.04 °C | 24.04 °C | 0 °C |
| SD | 1.11 °C | 3.57 °C | 2.46 °C |
© 2017 by the authors. Licensee MDPI, Basel, Switzerland. This article is an open access article distributed under the terms and conditions of the Creative Commons Attribution (CC BY) license ( http://creativecommons.org/licenses/by/4.0/).
Share and Cite
Garduño-Ramón, M.A.; Vega-Mancilla, S.G.; Morales-Henández, L.A.; Osornio-Rios, R.A. Supportive Noninvasive Tool for the Diagnosis of Breast Cancer Using a Thermographic Camera as Sensor. Sensors 2017, 17, 497. https://doi.org/10.3390/s17030497
Garduño-Ramón MA, Vega-Mancilla SG, Morales-Henández LA, Osornio-Rios RA. Supportive Noninvasive Tool for the Diagnosis of Breast Cancer Using a Thermographic Camera as Sensor. Sensors. 2017; 17(3):497. https://doi.org/10.3390/s17030497
Chicago/Turabian StyleGarduño-Ramón, Marco Antonio, Sofia Giovanna Vega-Mancilla, Luis Alberto Morales-Henández, and Roque Alfredo Osornio-Rios. 2017. "Supportive Noninvasive Tool for the Diagnosis of Breast Cancer Using a Thermographic Camera as Sensor" Sensors 17, no. 3: 497. https://doi.org/10.3390/s17030497