
An Optical Fibre Depth (Pressure) Sensor for Remote Operated Vehicles in Underwater Applications

 , , ,
, , ,  ,
,  , , and
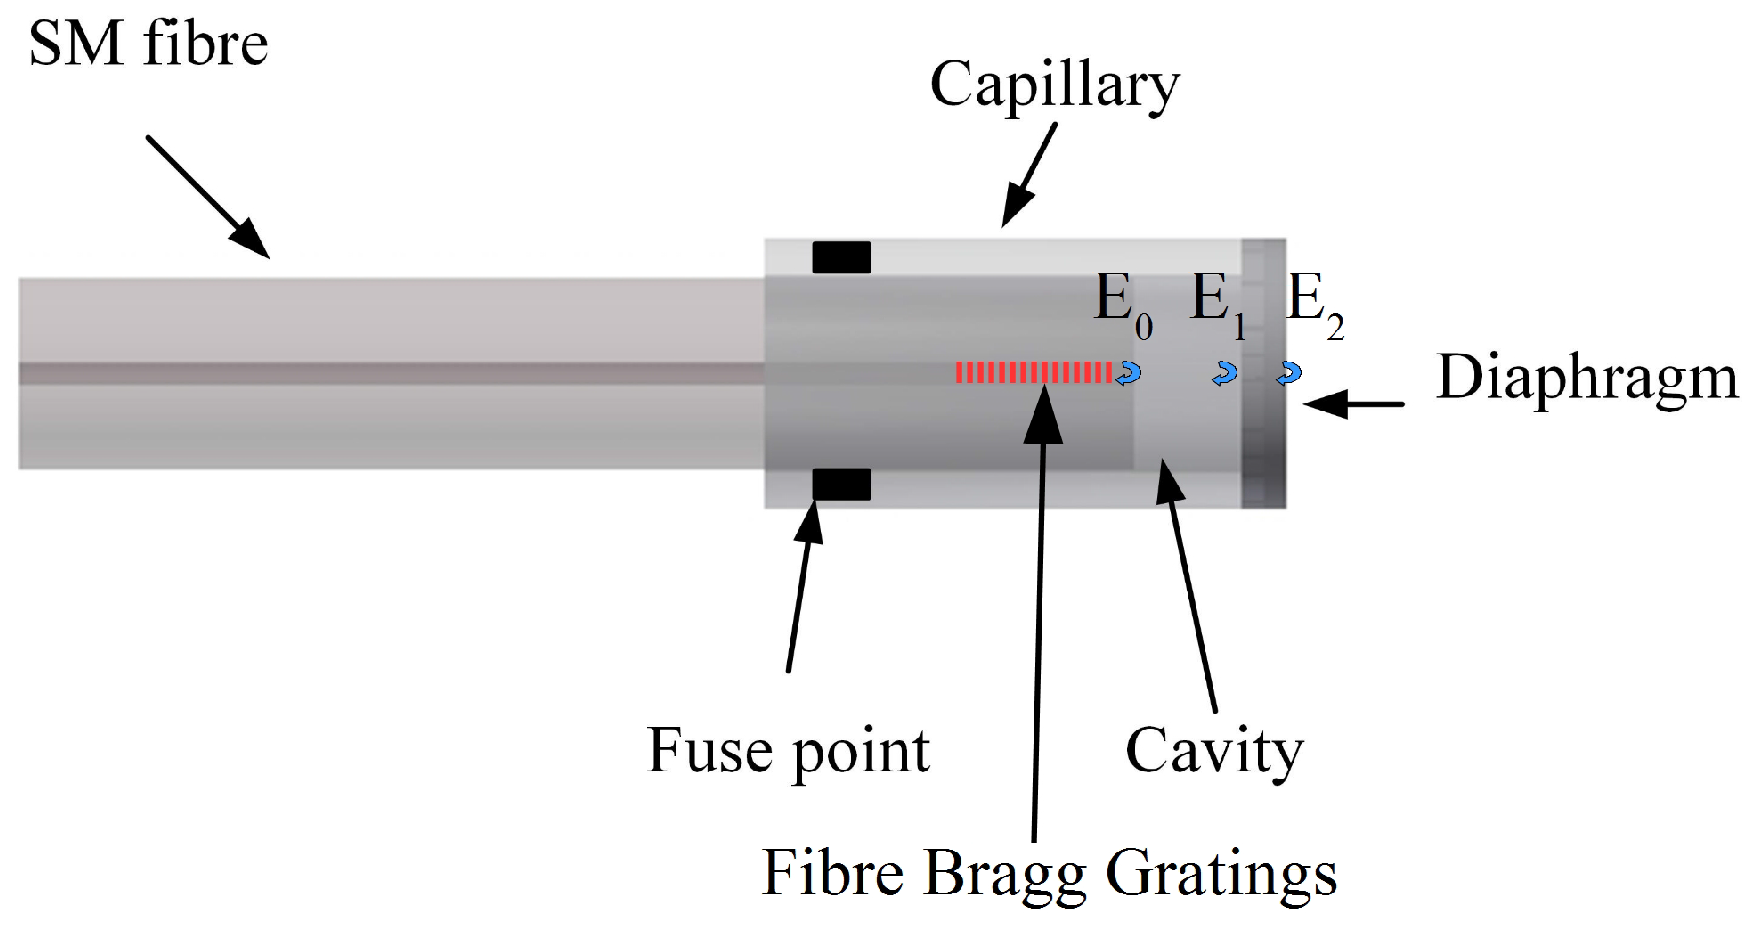
Abstract
:1. Introduction
2. Sensor Theory and Design
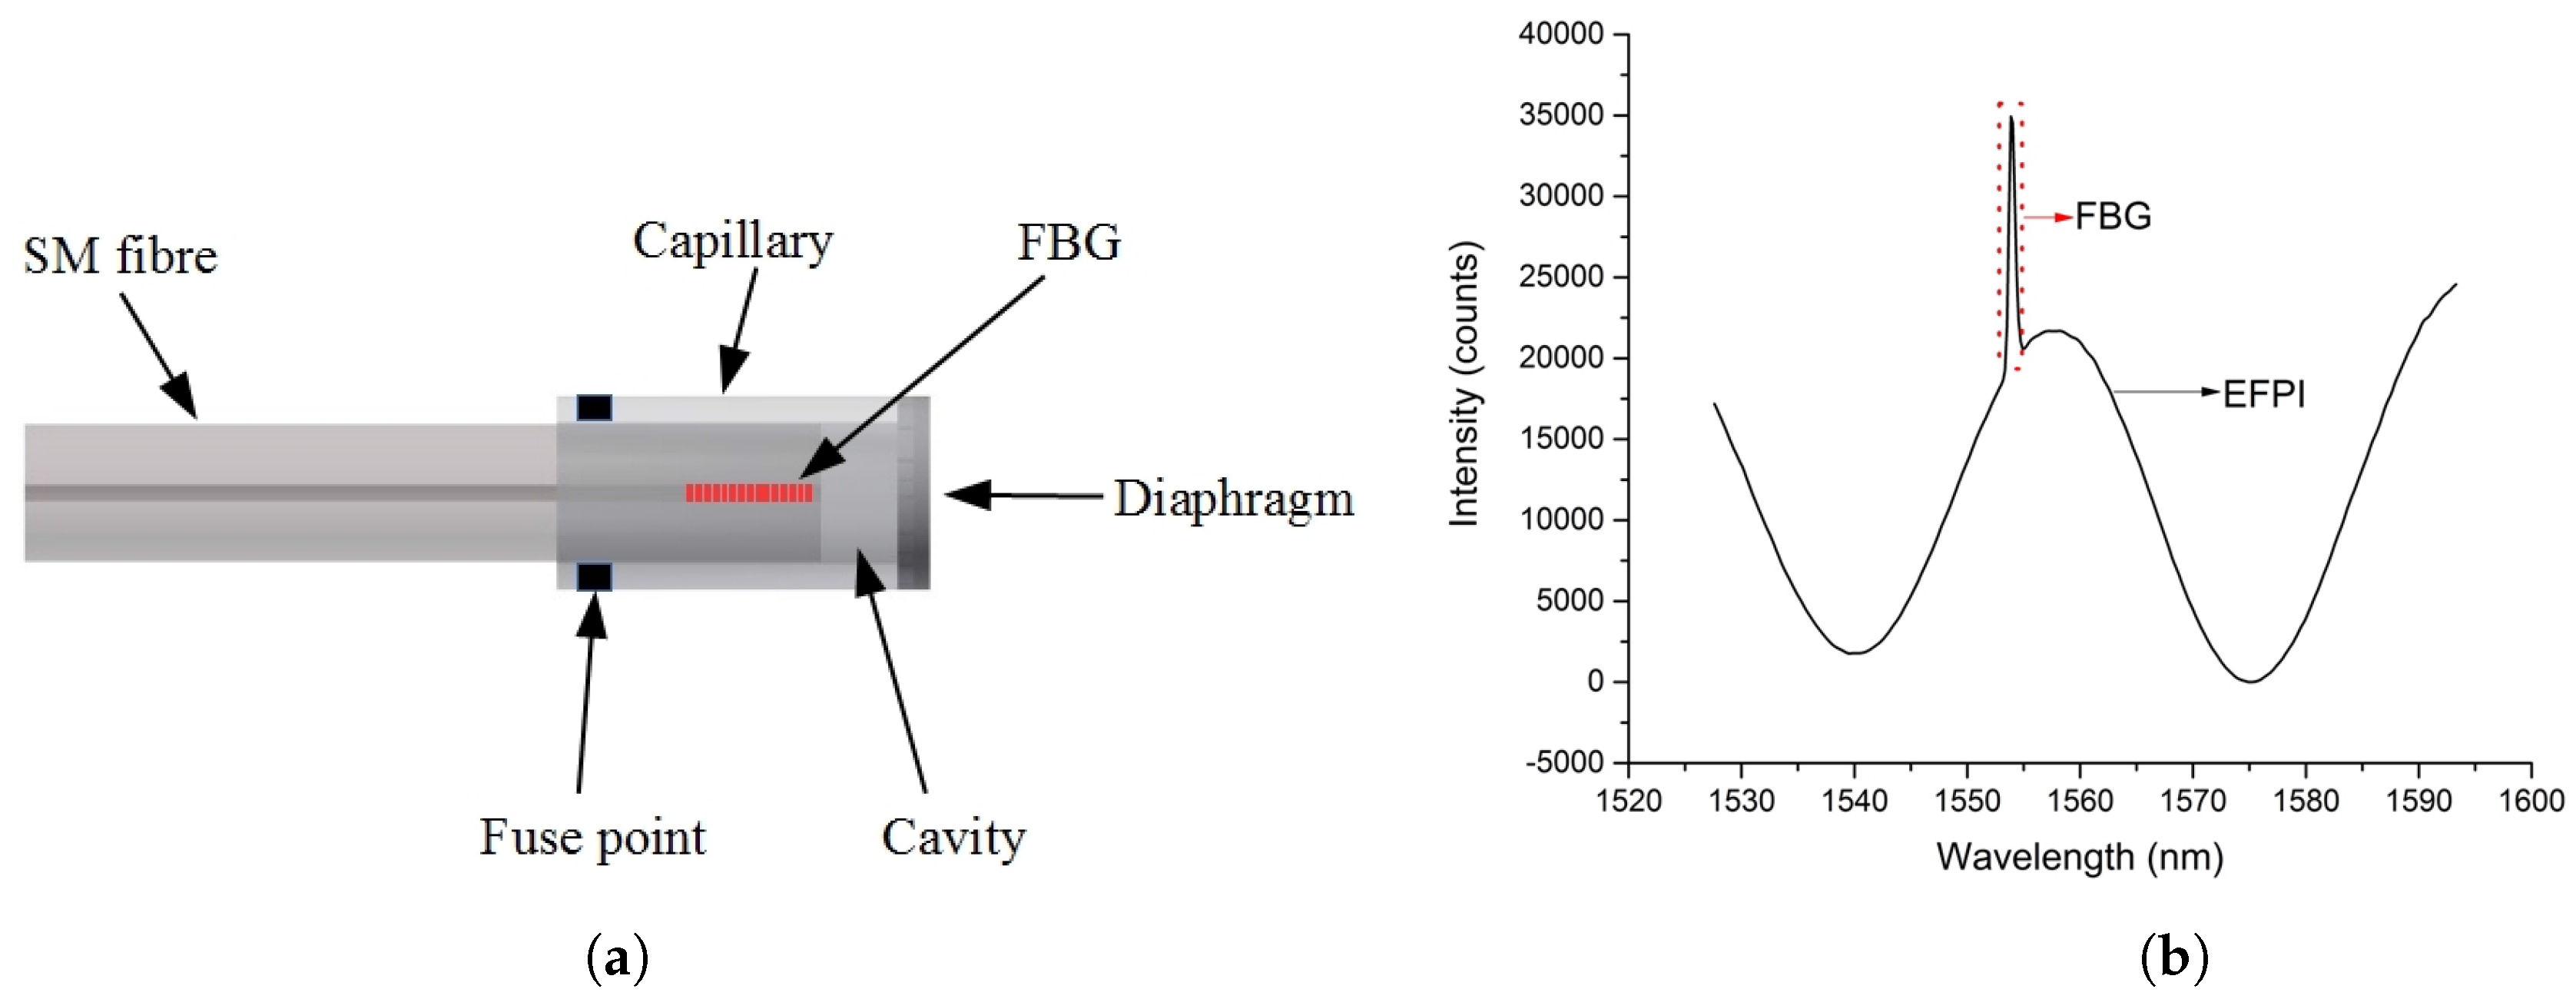
2.1. Operating Principle of EFPI and FBG
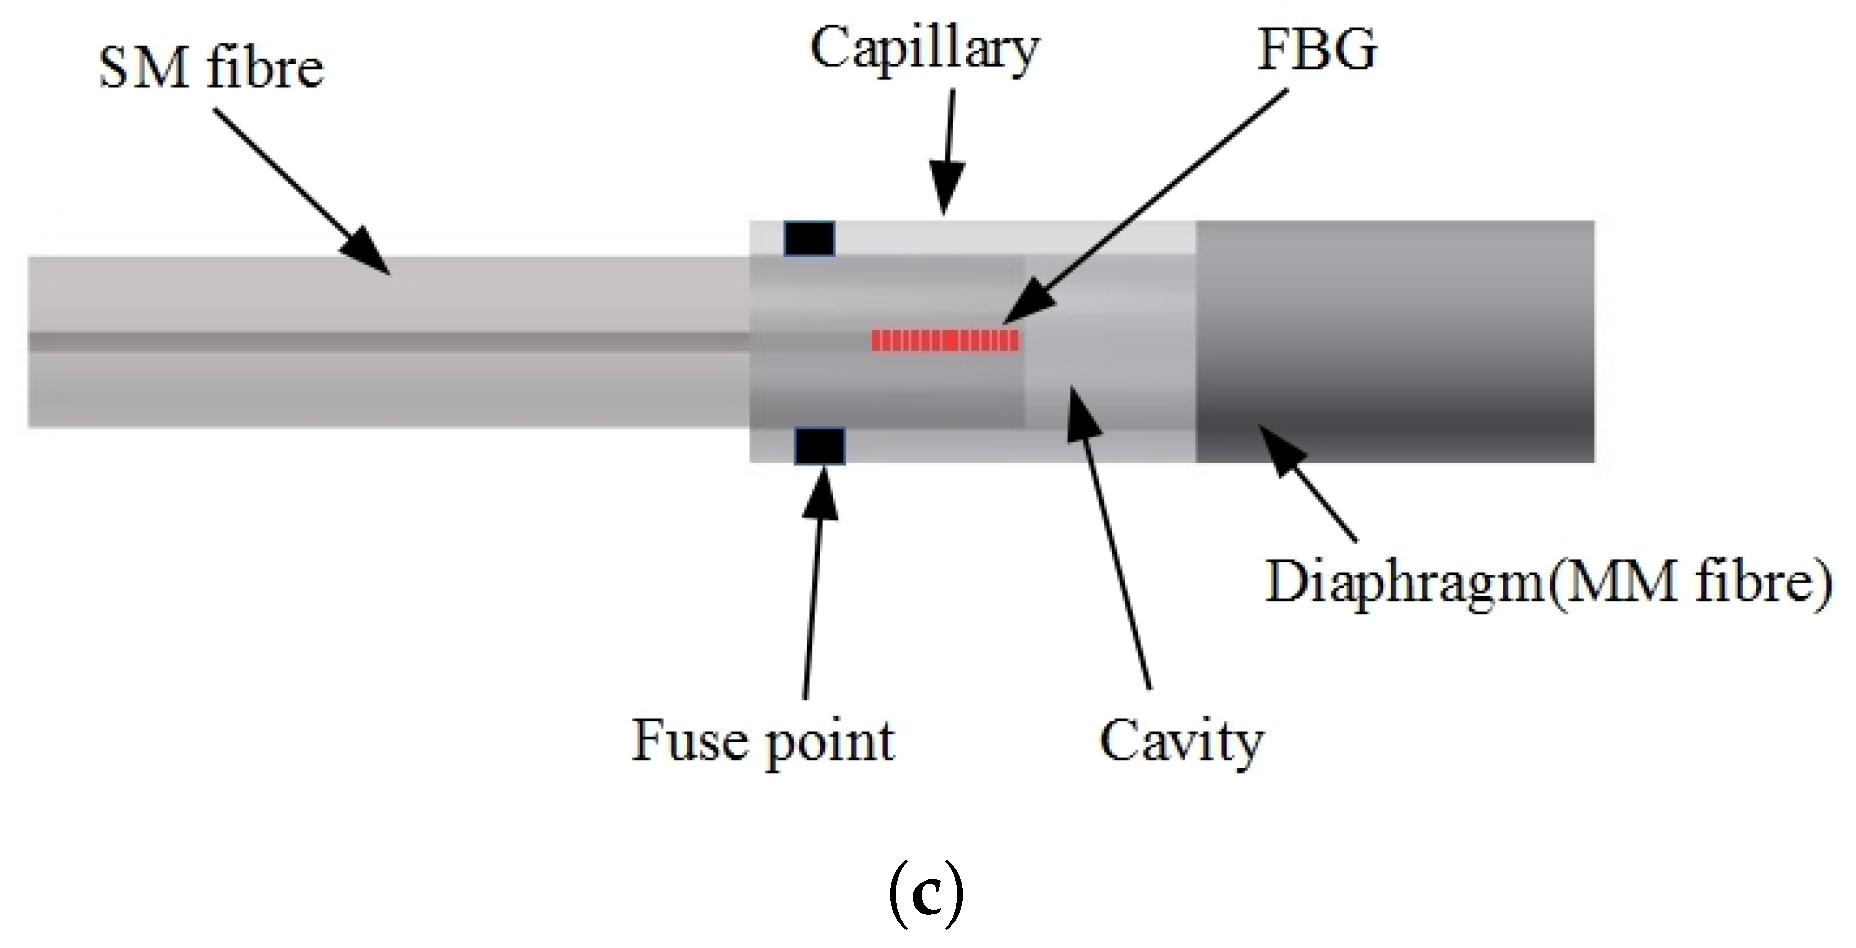
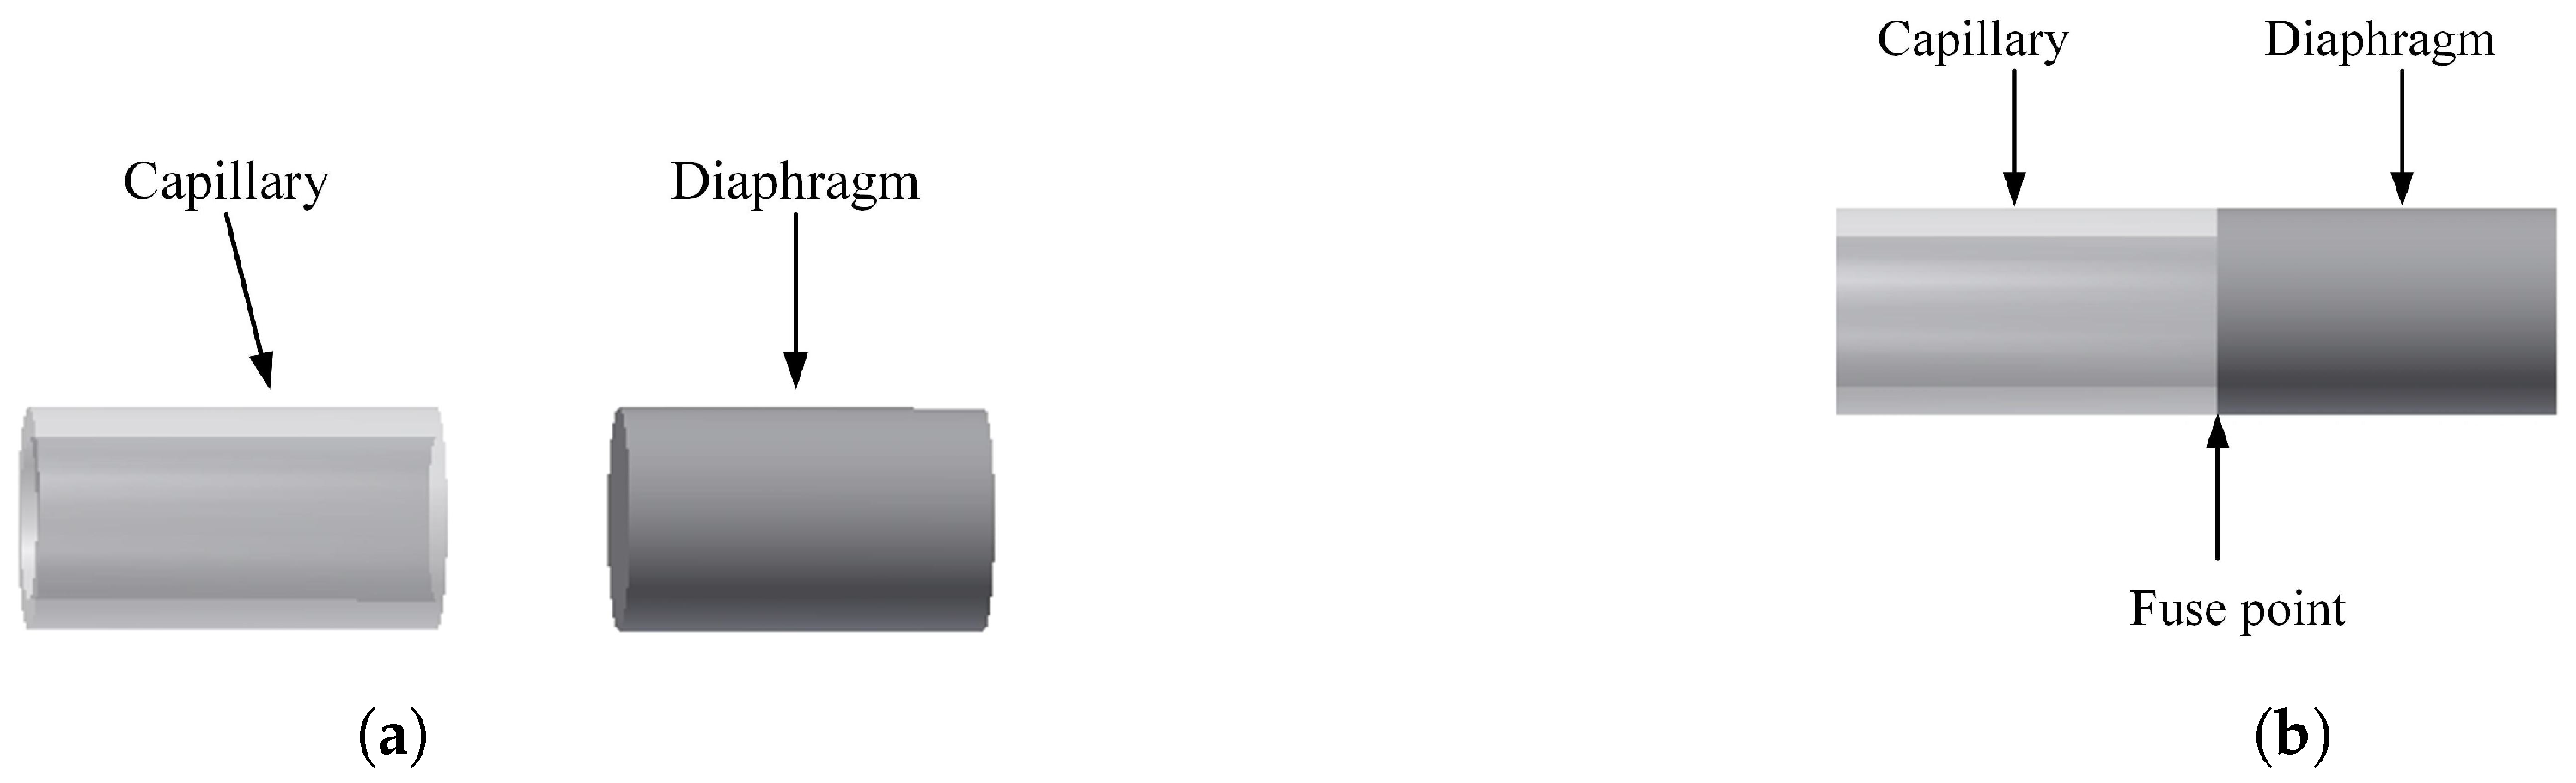
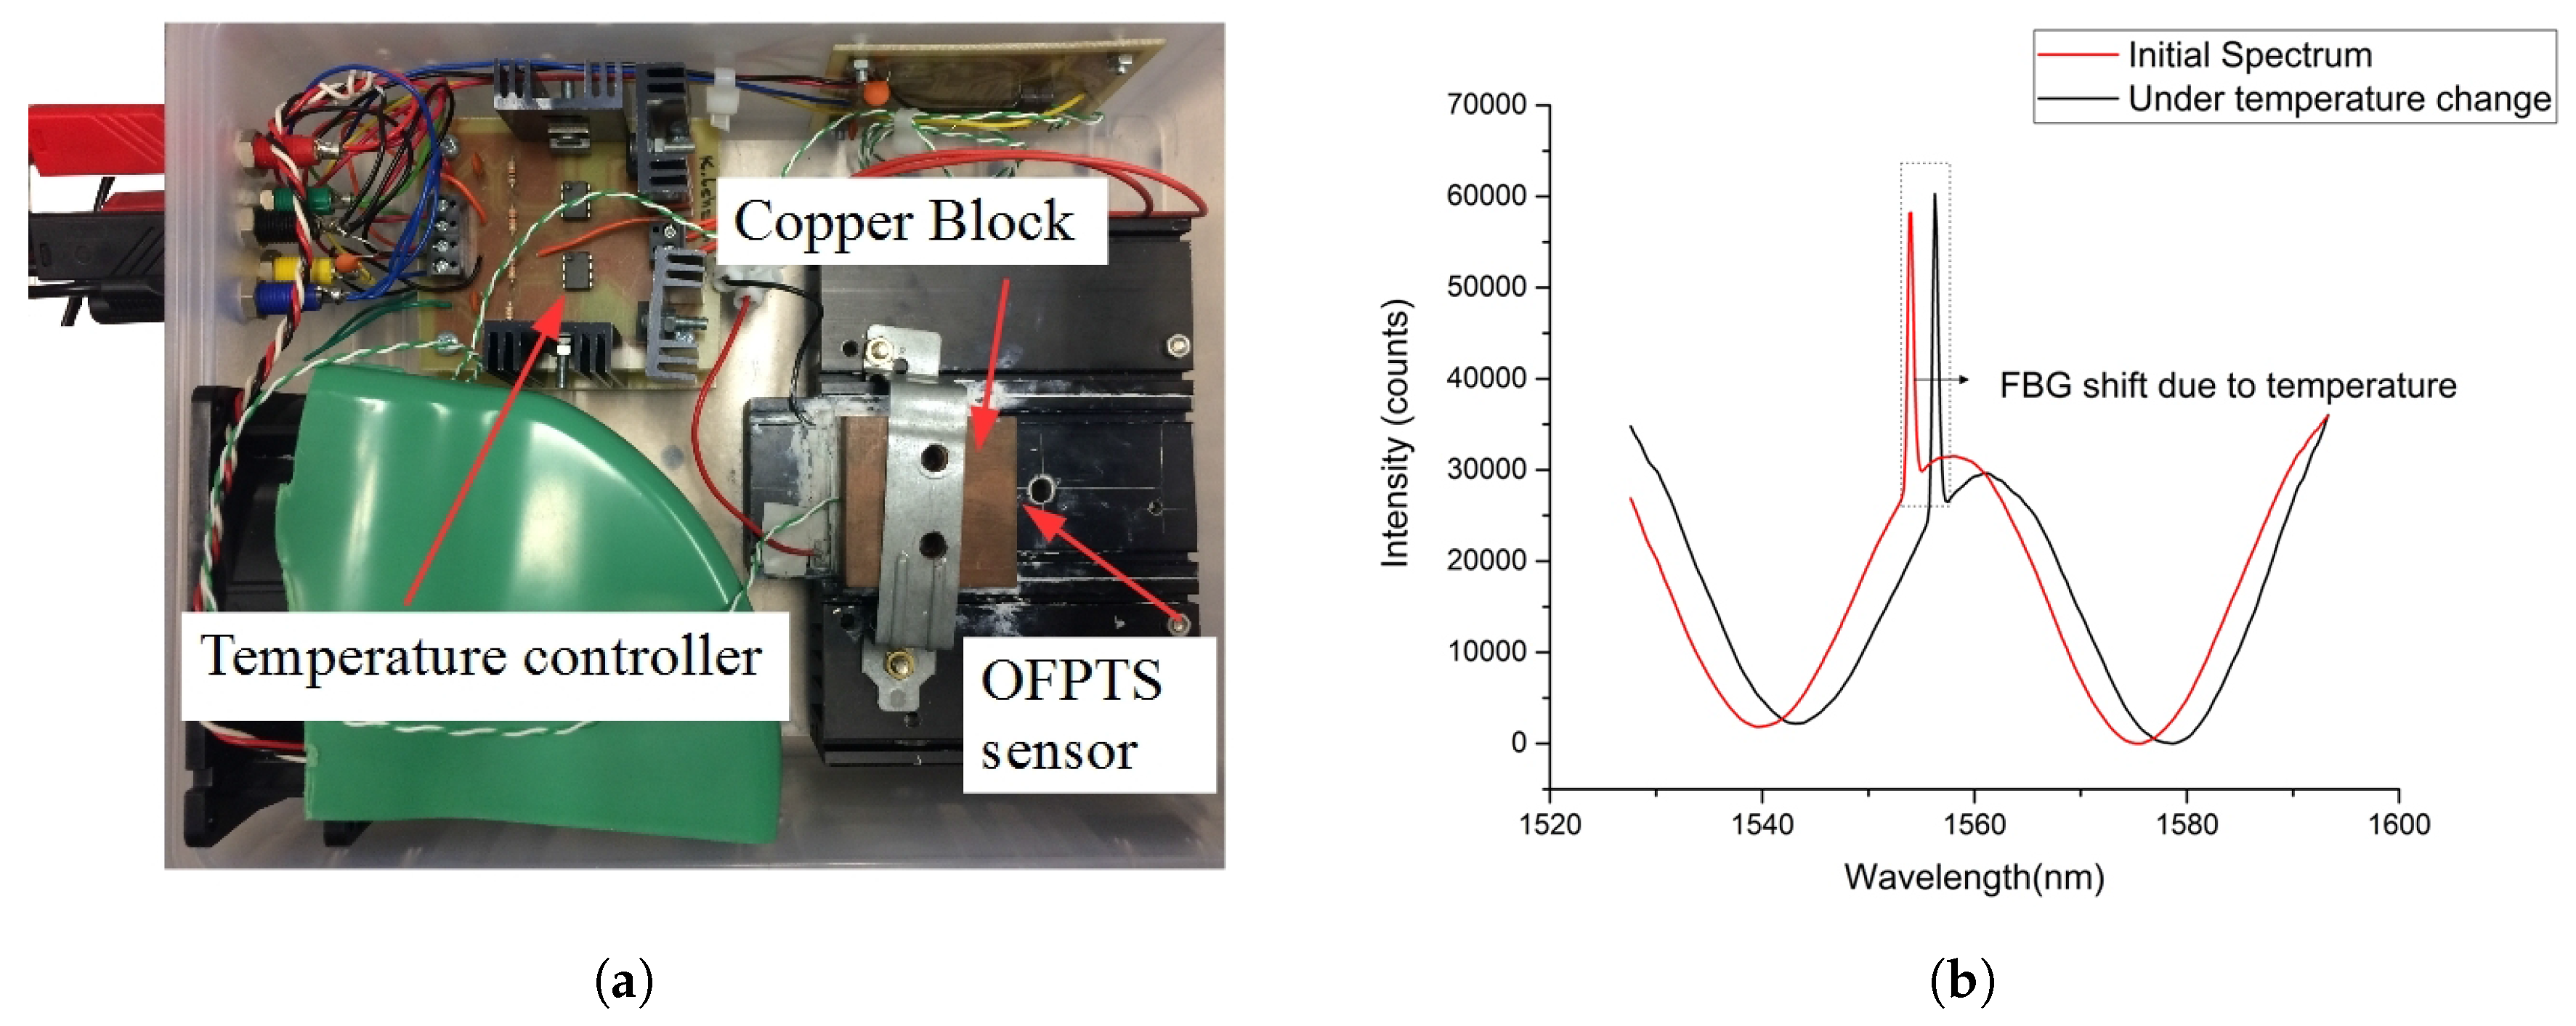
2.2. Fabrication of Optical Fibre Pressure and Temperature Sensor (OFPTS)
3. Setup for the Measurements
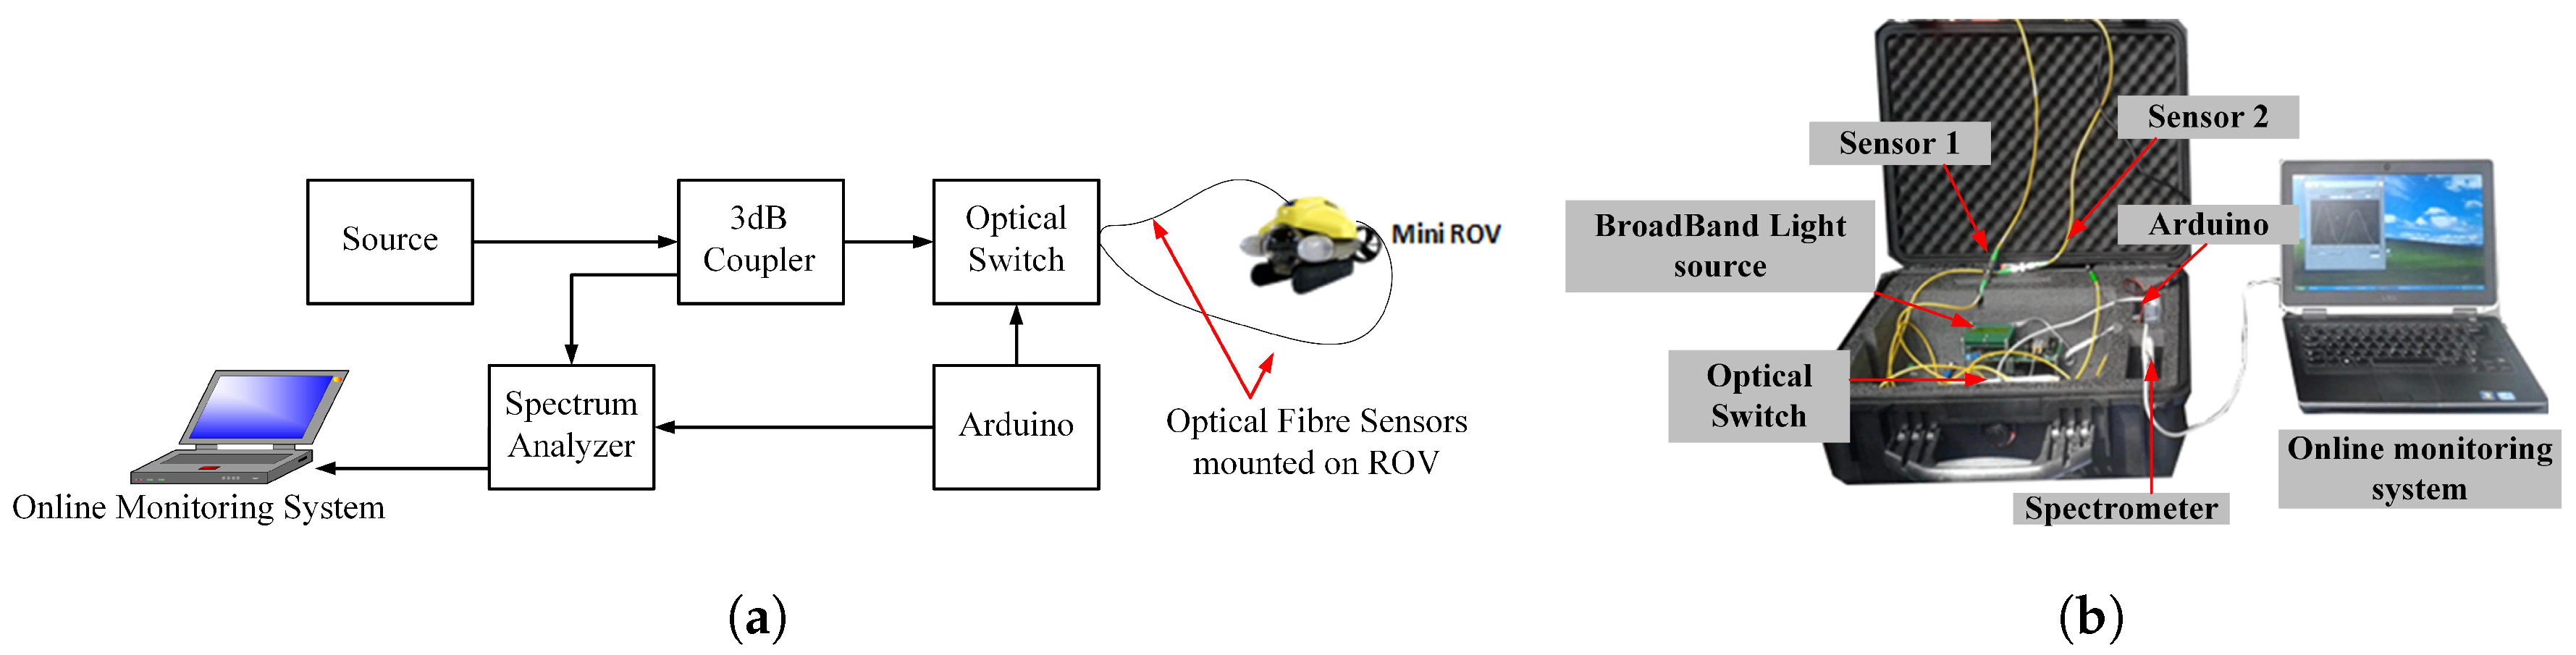
3.1. Optical System Setup
3.2. On-Board Measurement System Setup
4. Experimental Results
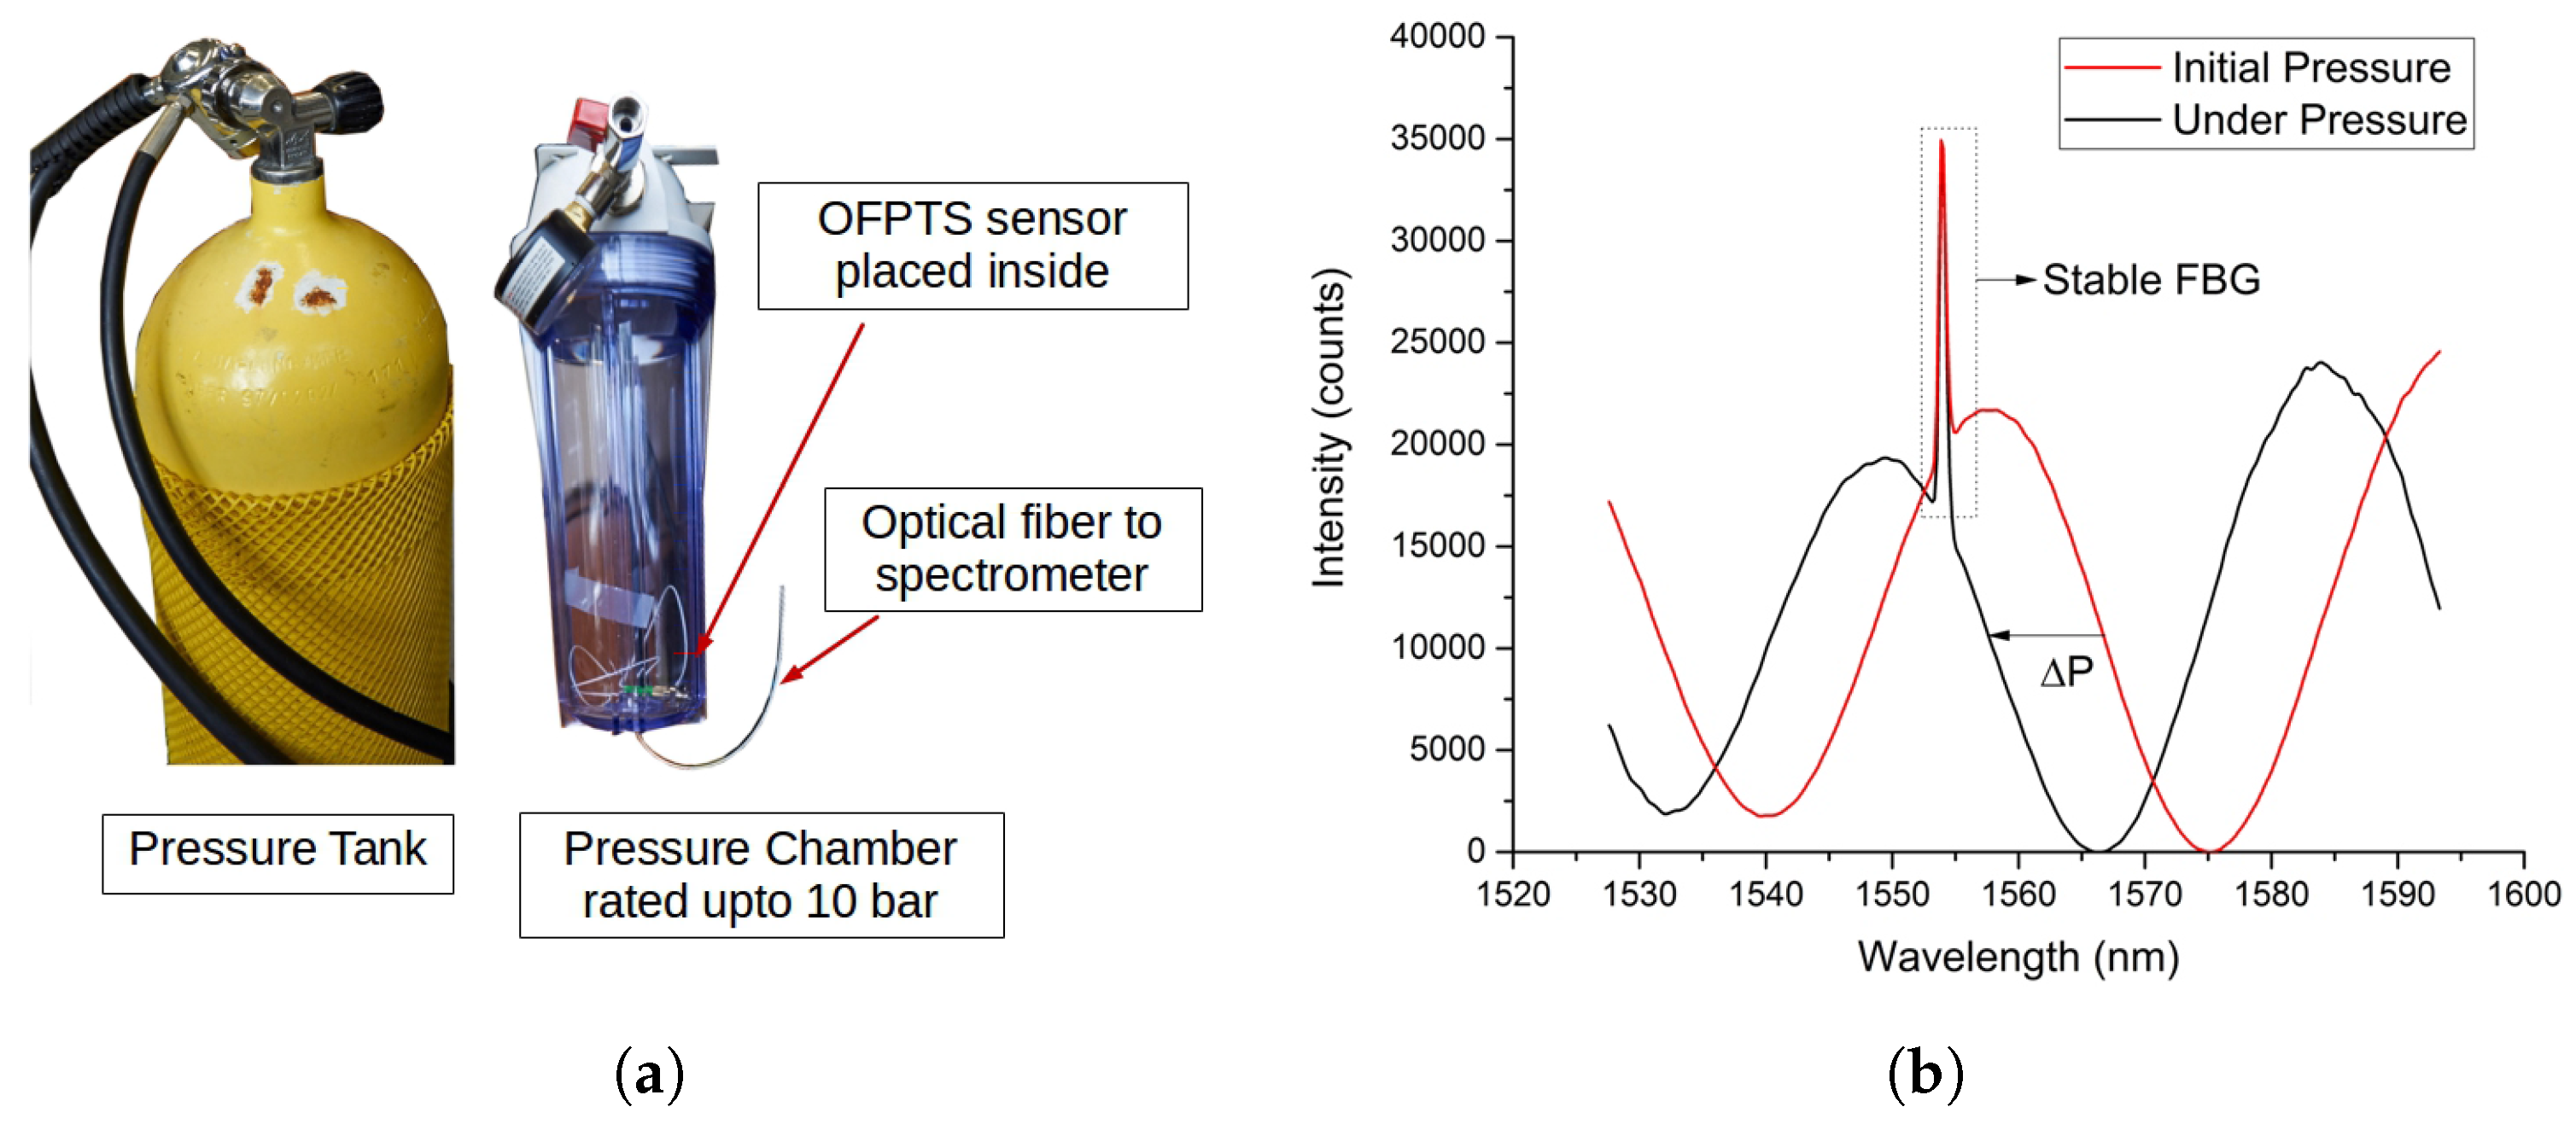
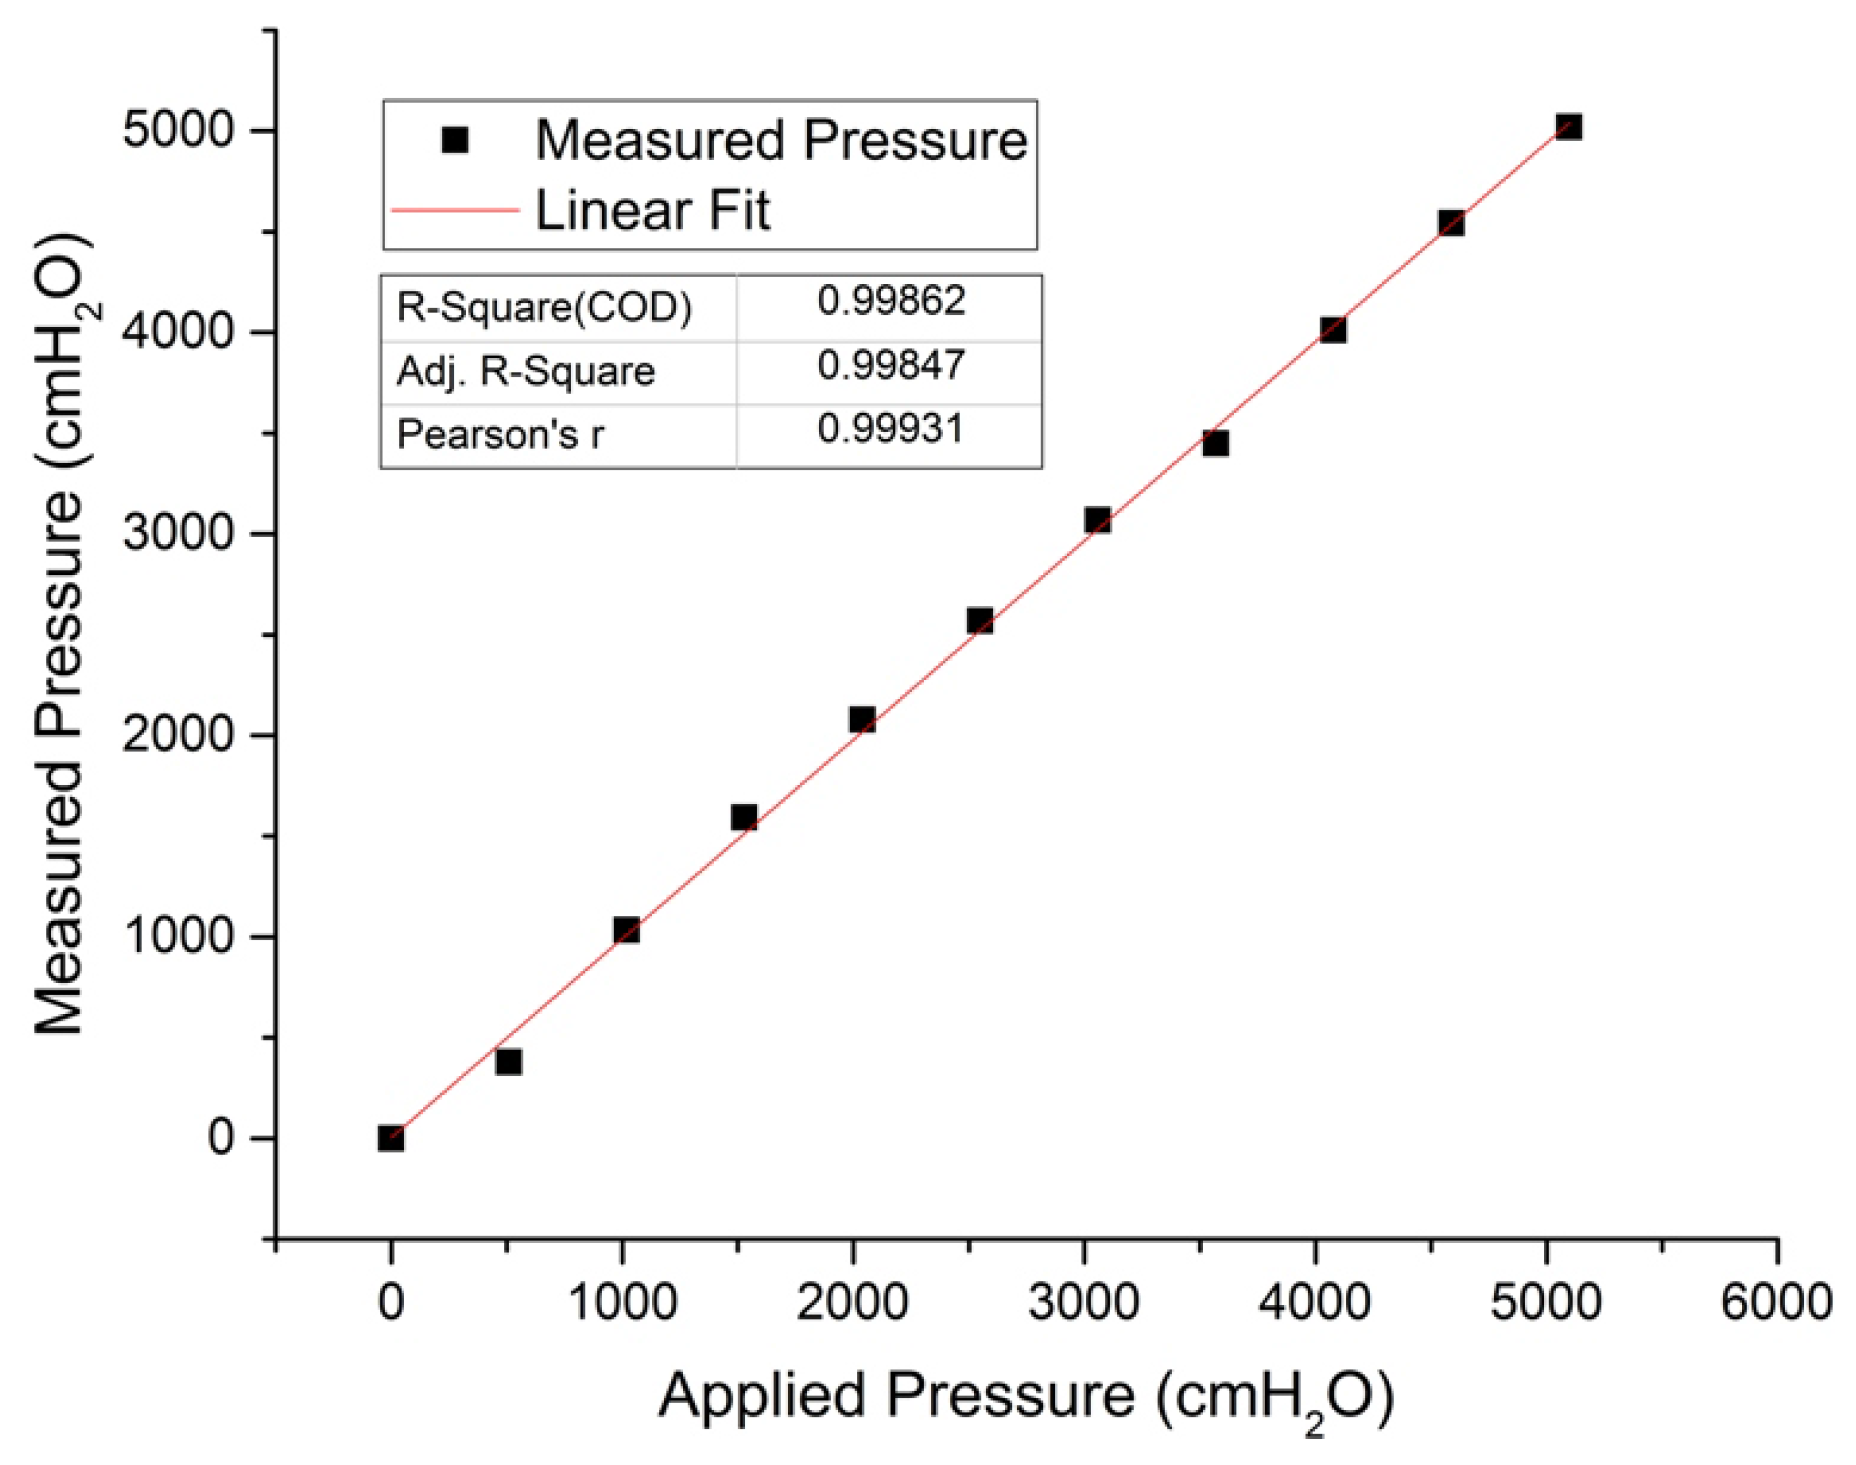
4.1. Calibration of Optical Pressure Sensors
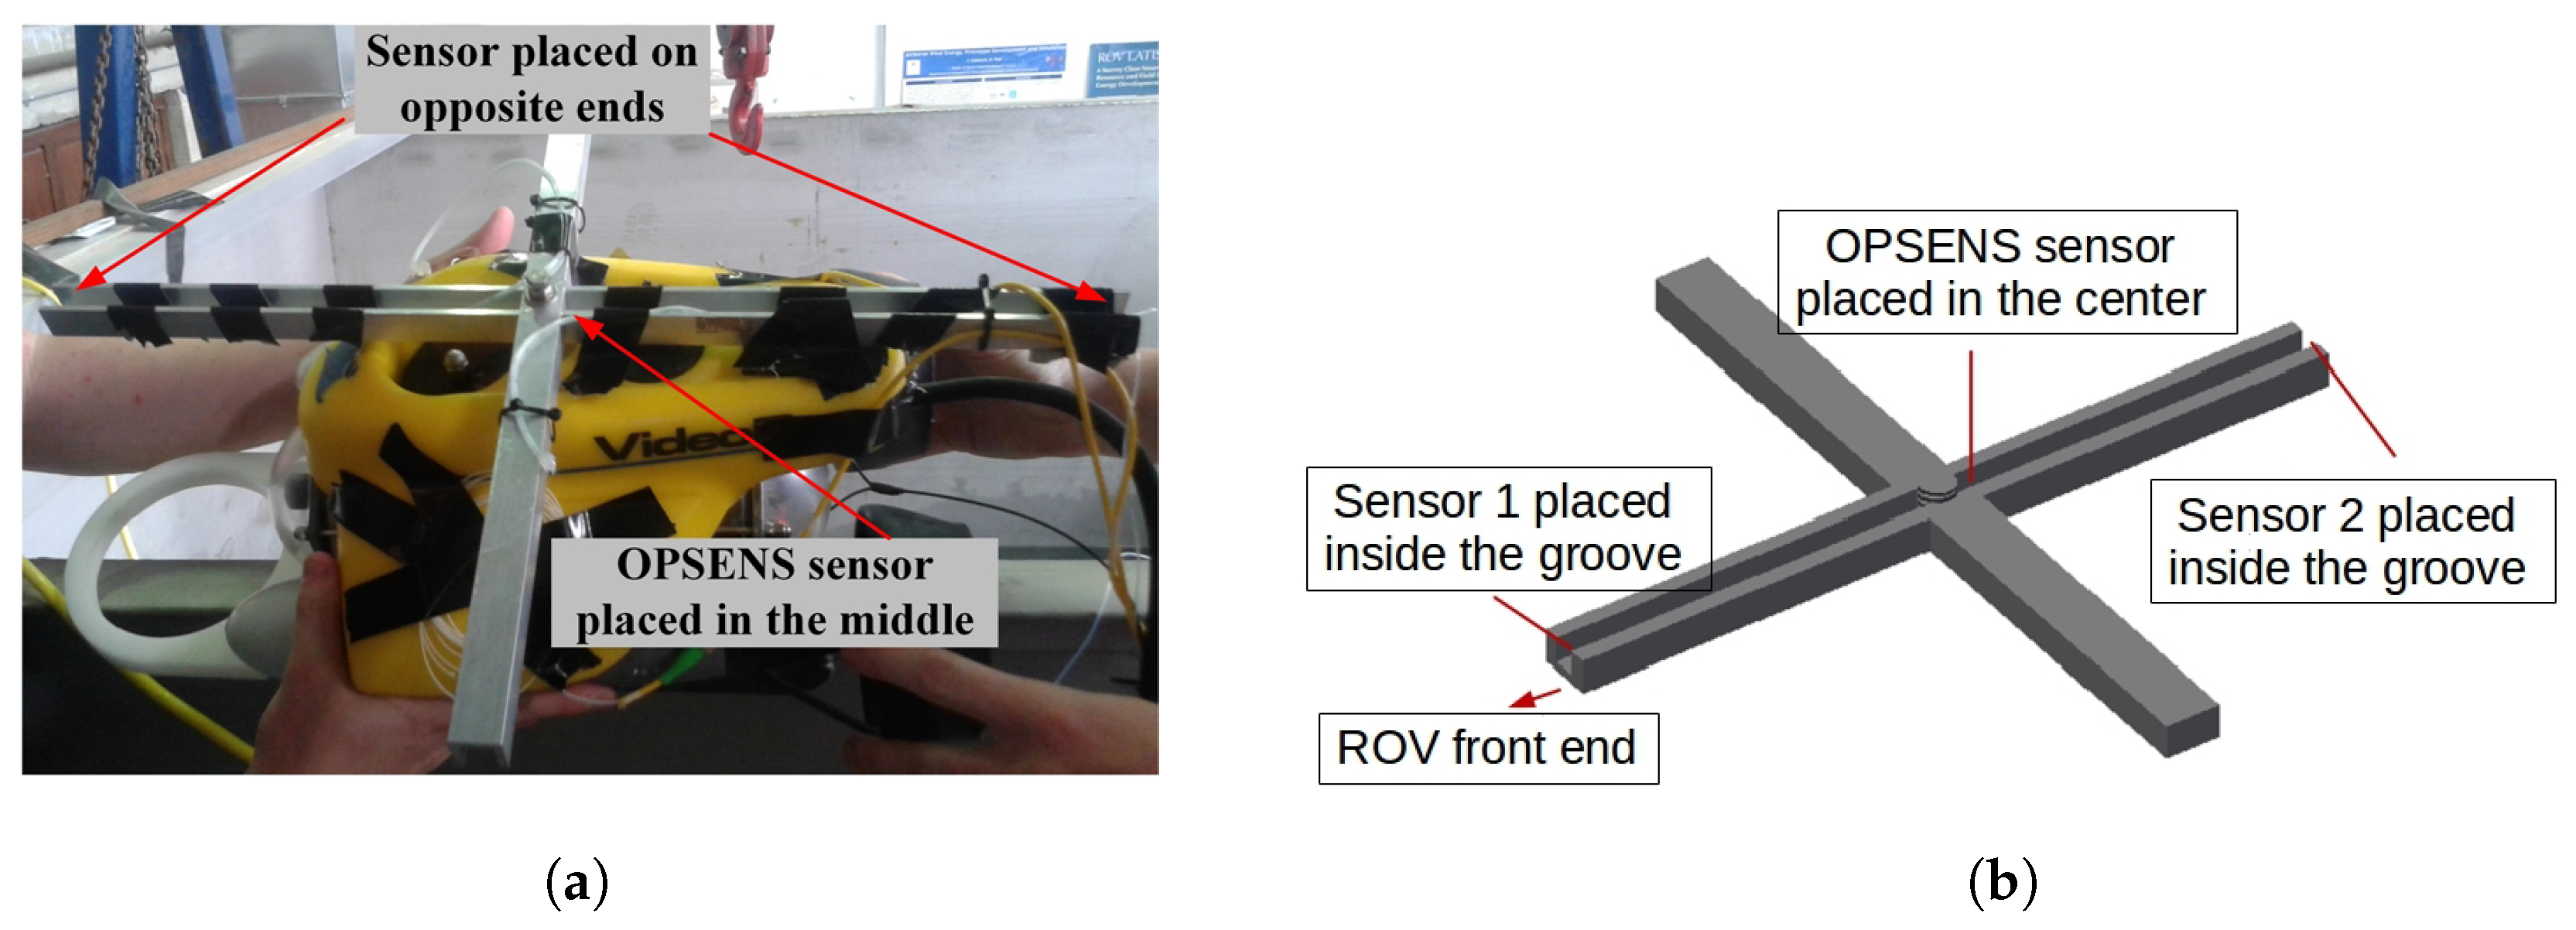
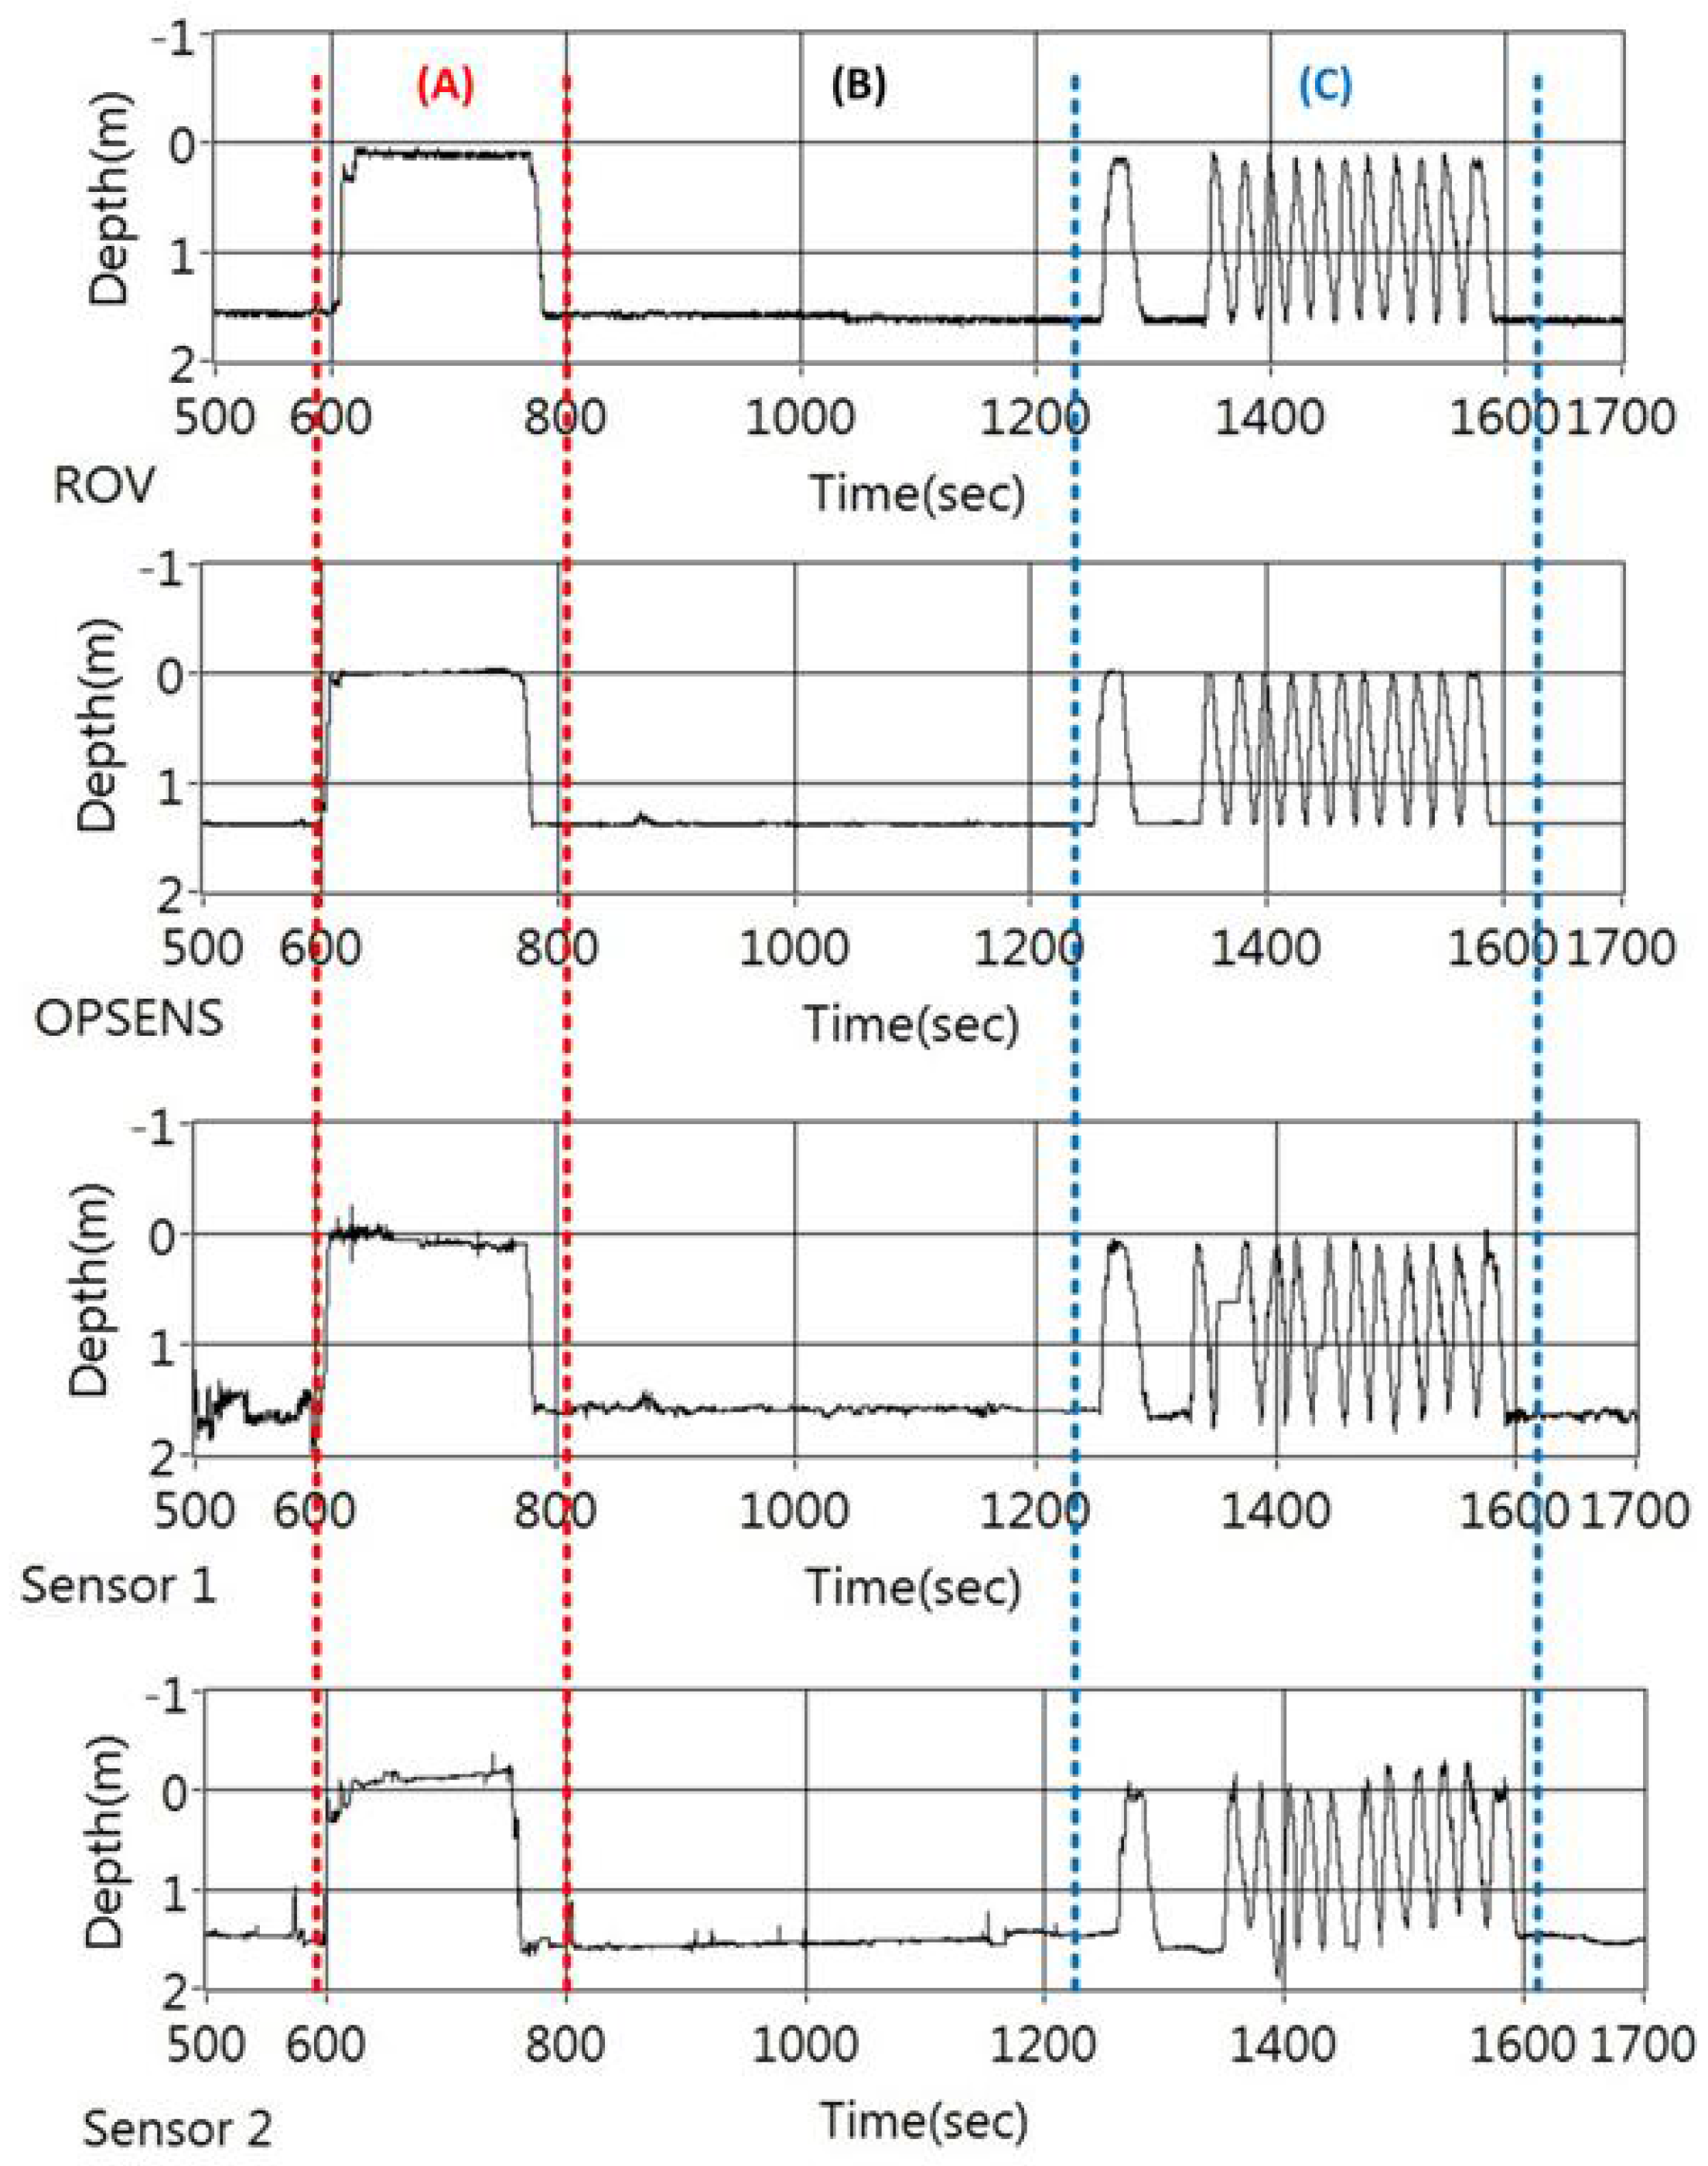
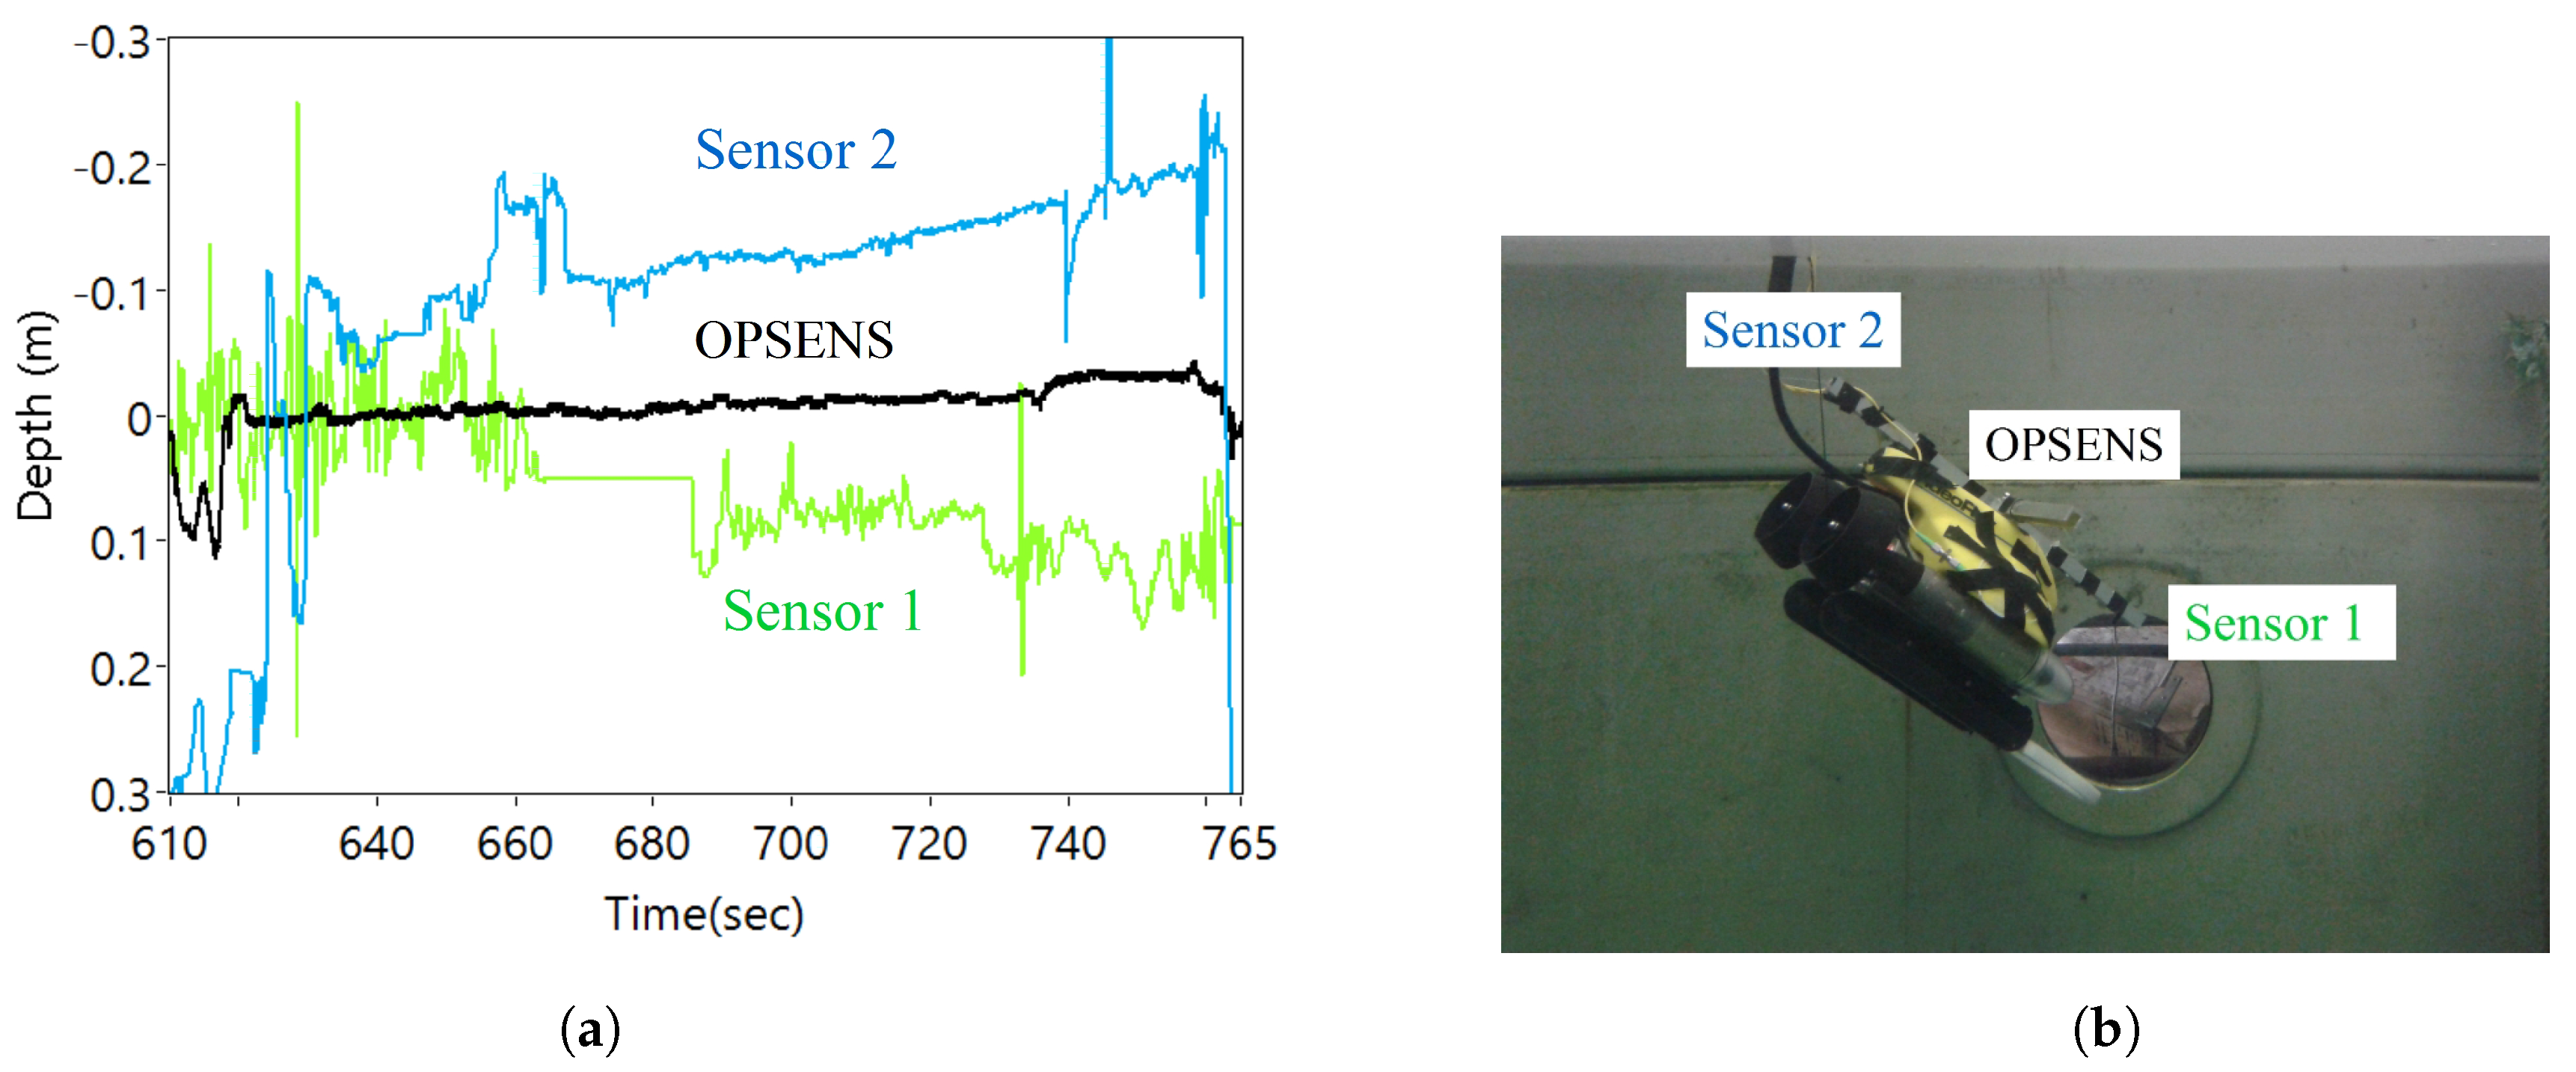
4.2. Measurement on ROV
5. Conclusions
Acknowledgments
Author Contributions
Conflicts of Interest
Abbreviations
| EFPI | Extrinsic Fabry-Perot Interferometer |
| FBG | Fibre Bragg Gratings |
| HF | HydroFluoric Acid |
| MM | Multi Mode |
| NI | National Instruments |
| OFPTS | Optical Fiber Pressure and Temperature Sensor |
| OSA | Optical Spectrum Analyzer |
| ROV | Remote Operated Vehicle |
| SM | Single Mode |
| UUV | Unmanned Underwater Vehicles |
References
- Kersey, A.D. A Review of Recent Developments in Fiber Optic Sensor Technology. Opt. Fiber Technol. 1996, 2, 291–317. [Google Scholar] [CrossRef]
- Bae, H.; Yu, M. Miniature Fabry-Perot pressure sensor created by using UV-molding process with an optical fiber based mold. Opt. Express 2012, 20, 14573–14583. [Google Scholar] [CrossRef] [PubMed]
- Ma, J.; Jin, W.; Ho, H.L.; Dai, J.Y. High-sensitivity fiber-tip pressure sensor with graphene diaphragm. Opt. Lett. 2012, 37, 2493. [Google Scholar] [CrossRef] [PubMed]
- Zhu, Y.; Cooper, K.; Pickrell, G.; Wang, A. High-temperature fiber-tip pressure sensor. J. Lightwave Technol. 2006, 24, 861–869. [Google Scholar]
- Huang, J.; Zhou, Z.; Wen, X.; Zhang, D. A diaphragm-type fiber Bragg grating pressure sensor with temperature compensation. Measurement 2013, 46, 1041–1046. [Google Scholar] [CrossRef]
- Wu, C.A.; Fu, H.Y.; Qureshi, K.K.; Guan, B.O.; Tam, H.Y. High-pressure and high-temperature characteristics of a Fabry-Perot interferometer based on photonic crystal fiber. Opt. Lett. 2011, 36, 412–414. [Google Scholar] [CrossRef] [PubMed]
- Lee, B. Review of the present status of optical fiber sensors. Opt. Fiber Technol. 2003, 9, 57–79. [Google Scholar] [CrossRef]
- Hjelme, D.; Bjerkan, L.; Neegard, S.; Rambech, J.; Aarsnes, J. Application of Bragg grating sensors in the characterization of scaled marine vehicle models. Appl. Opt. 1997, 36, 328–336. [Google Scholar] [CrossRef] [PubMed]
- Poeggel, S.; Duraibabu, D.; Tosi, D.; Leen, G.; Lewis, E.; McGrath, D.; Fusco, F.; Sannino, S.; Lupoli, L.; Ippolito, J.; et al. Differential in vivo urodynamic measurement in a single thin catheter based on two optical fiber pressure sensors. J. Biomed. Opt. 2015, 20, 037005. [Google Scholar] [CrossRef] [PubMed]
- Rao, Y.J.; Zhang, L.; Bennion, I.; Jackson, D. Strain sensing of modern composite materials with a spatial/wavelength-division multiplexed fiber grating network. Opt. Lett. 1996, 21, 683–685. [Google Scholar] [CrossRef] [PubMed]
- Bevenot, X.; Trouillet, A.; Veillas, C.; Gagnaire, H.; Clement, M. Hydrogen leak detection using an optical fibre sensor for aerospace applications. Sens. Actuators B Chem. 2000, 67, 57–67. [Google Scholar] [CrossRef]
- Ravichandran, M. In-Situ Ocean Observing System. In Operational Oceanography in the 21st Century; Schiller, A., Brassington, G.B., Eds.; Springer: Dordrecht, The Netherlands, 2011; pp. 55–90. [Google Scholar]
- Tomczak, M.; Godfrey, J.S. CHAPTER 2: Temperature, Salinity, Density and the Oceanic Pressure Field. In Regional Oceanography; Godfrey, J.S., Tomczak, M., Eds.; Pergamon: Oxford, England, 1994; pp. 15–28. [Google Scholar]
- Houston, M.H.; Paros, J.M. High accuracy pressure instrumentation for underwater applications. In Proceedings of the 1998 IEEE International Symposium on Underwater Technology, Tokyo, Japan, 17 April 1998; pp. 307–311.
- Sun, B.; Wang, Y.; Qu, J.; Liao, C.; Yin, G.; He, J.; Zhou, J.; Tang, J.; Liu, S.; Li, Z.; et al. Simultaneous measurement of pressure and temperature by employing Fabry–Perot interferometer based on pendant polymer droplet. Optics Express 2015, 23, 1906–1911. [Google Scholar] [CrossRef] [PubMed]
- Islam, M.R.; Ali, M.M.; Lai, M.H.; Lim, K.S.; Ahmad, H. Chronology of Fabry–Perot interferometer fiber-optic sensors and their applications: A review. Sensors 2014, 14, 7451–7488. [Google Scholar] [CrossRef] [PubMed]
- Wang, J.; Wang, M.; Xu, J.; Peng, L.; Yang, M.; Xia, M.; Jiang, D. Underwater blast wave pressure sensor based on polymer film fiber Fabry–Perot cavity. Appl. Opt. 2014, 53, 6494–6502. [Google Scholar] [CrossRef] [PubMed]
- Rao, Y.J. Recent progress in applications of in-fibre Bragg grating sensors. Opt. Lasers Eng. 1999, 31, 297–324. [Google Scholar] [CrossRef]
- Yu, Q.; Zhou, X. Pressure sensor based on the fiber-optic extrinsic Fabry-Perot interferometer. Photonic Sens. 2011, 1, 72–83. [Google Scholar] [CrossRef]
- Pevec, S.; Donlagic, D. Miniature all-fiber Fabry–Perot sensor for simultaneous measurement of pressure and temperature. Appl. Opt. 2012, 51, 4536–4541. [Google Scholar] [CrossRef] [PubMed]
- Giovanni, D. Flat and Corrugated Diaphragm Design Handbook; Marcel Dekker, Inc.: New York, NY, USA, 1982; Volume 11. [Google Scholar]
- Rao, Y.J. In-fibre Bragg grating sensors. Meas. Sci. Technol. 1997, 8, 355. [Google Scholar] [CrossRef]
- Kamikawachi, R.; Abe, I.; Paterno, A.; Kalinowski, H.; Muller, M.; Pinto, J.; Fabris, J. Determination of thermo-optic coefficient in liquids with fiber Bragg grating refractometer. Opt. Commun. 2008, 281, 621–625. [Google Scholar] [CrossRef]
- Bremer, K.; Lewis, E.; Moss, B.; Leen, G.; Lochmann, S.; Mueller, I. Conception and preliminary evaluation of an optical fibre sensor for simultaneous measurement of pressure and temperature. J. Phys. Conf. Ser. 2009, 178, 012016. [Google Scholar] [CrossRef]


© 2017 by the authors. Licensee MDPI, Basel, Switzerland. This article is an open access article distributed under the terms and conditions of the Creative Commons Attribution (CC BY) license ( http://creativecommons.org/licenses/by/4.0/).
Share and Cite
Duraibabu, D.B.; Poeggel, S.; Omerdic, E.; Capocci, R.; Lewis, E.; Newe, T.; Leen, G.; Toal, D.; Dooly, G. An Optical Fibre Depth (Pressure) Sensor for Remote Operated Vehicles in Underwater Applications. Sensors 2017, 17, 406. https://doi.org/10.3390/s17020406
Duraibabu DB, Poeggel S, Omerdic E, Capocci R, Lewis E, Newe T, Leen G, Toal D, Dooly G. An Optical Fibre Depth (Pressure) Sensor for Remote Operated Vehicles in Underwater Applications. Sensors. 2017; 17(2):406. https://doi.org/10.3390/s17020406
Chicago/Turabian StyleDuraibabu, Dinesh Babu, Sven Poeggel, Edin Omerdic, Romano Capocci, Elfed Lewis, Thomas Newe, Gabriel Leen, Daniel Toal, and Gerard Dooly. 2017. "An Optical Fibre Depth (Pressure) Sensor for Remote Operated Vehicles in Underwater Applications" Sensors 17, no. 2: 406. https://doi.org/10.3390/s17020406