
Remote Sensing of Urban Microclimate Change in L’Aquila City (Italy) after Post-Earthquake Depopulation in an Open Source GIS Environment


Abstract
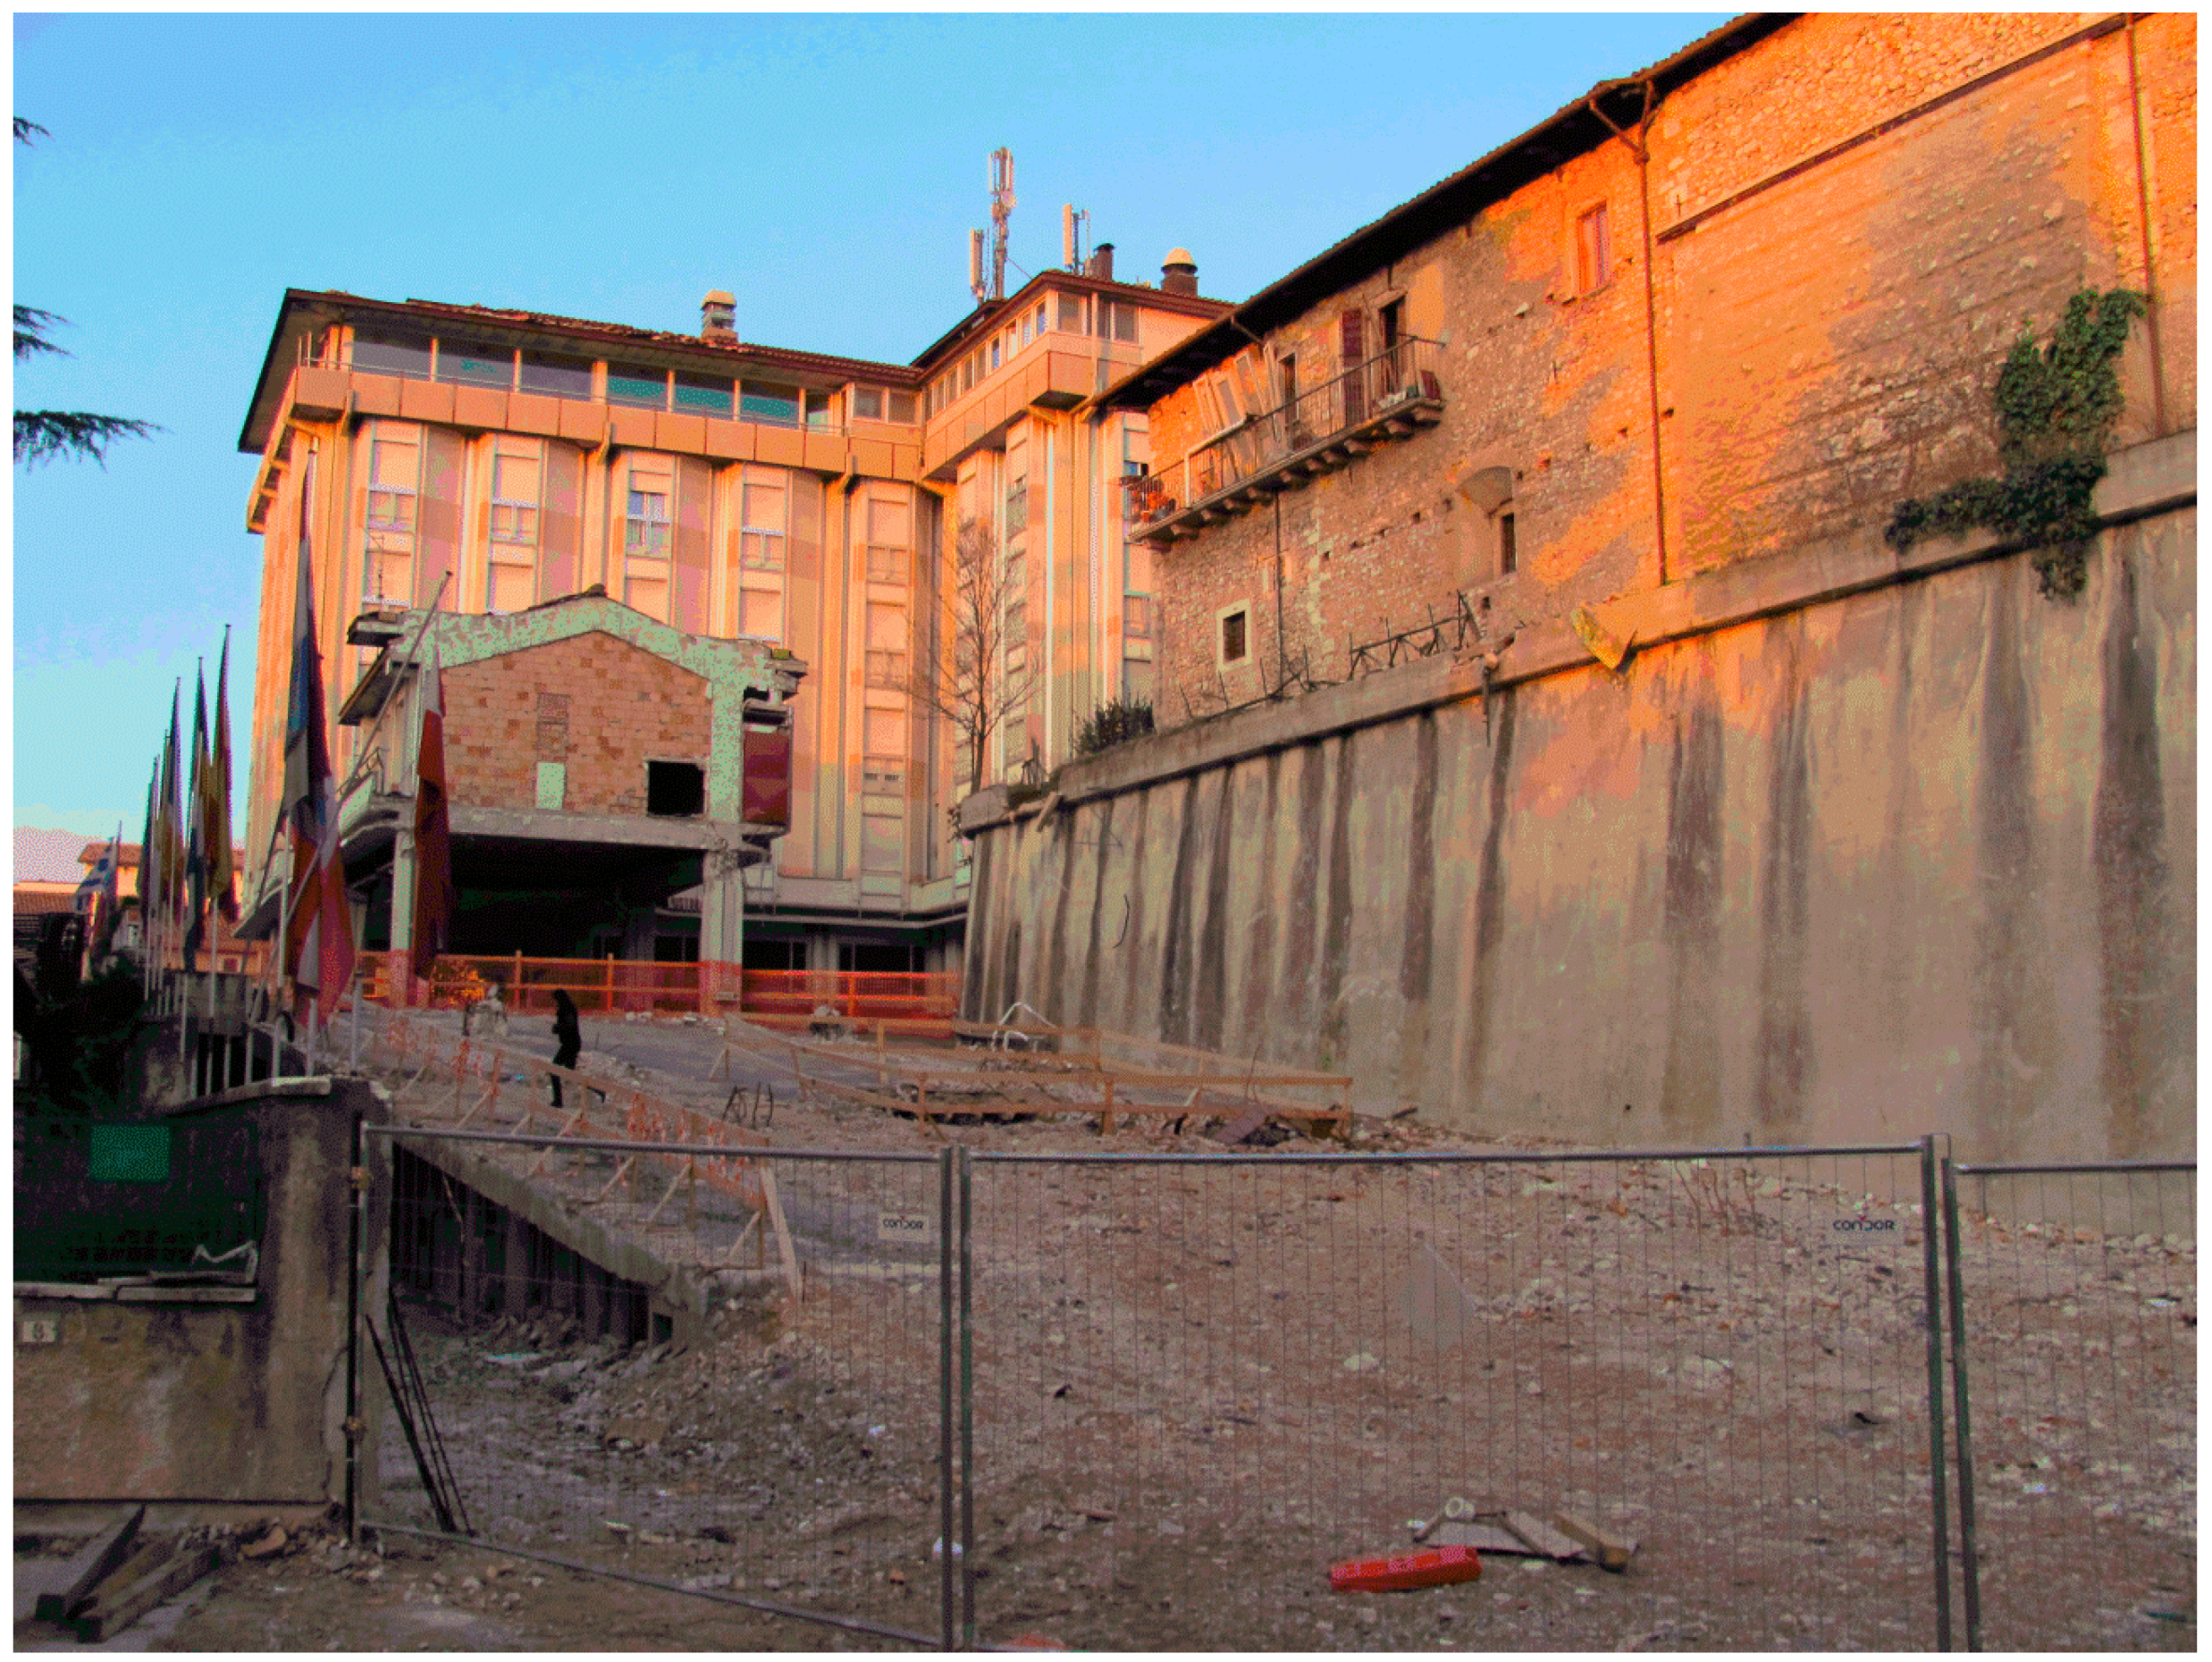
:1. Introduction
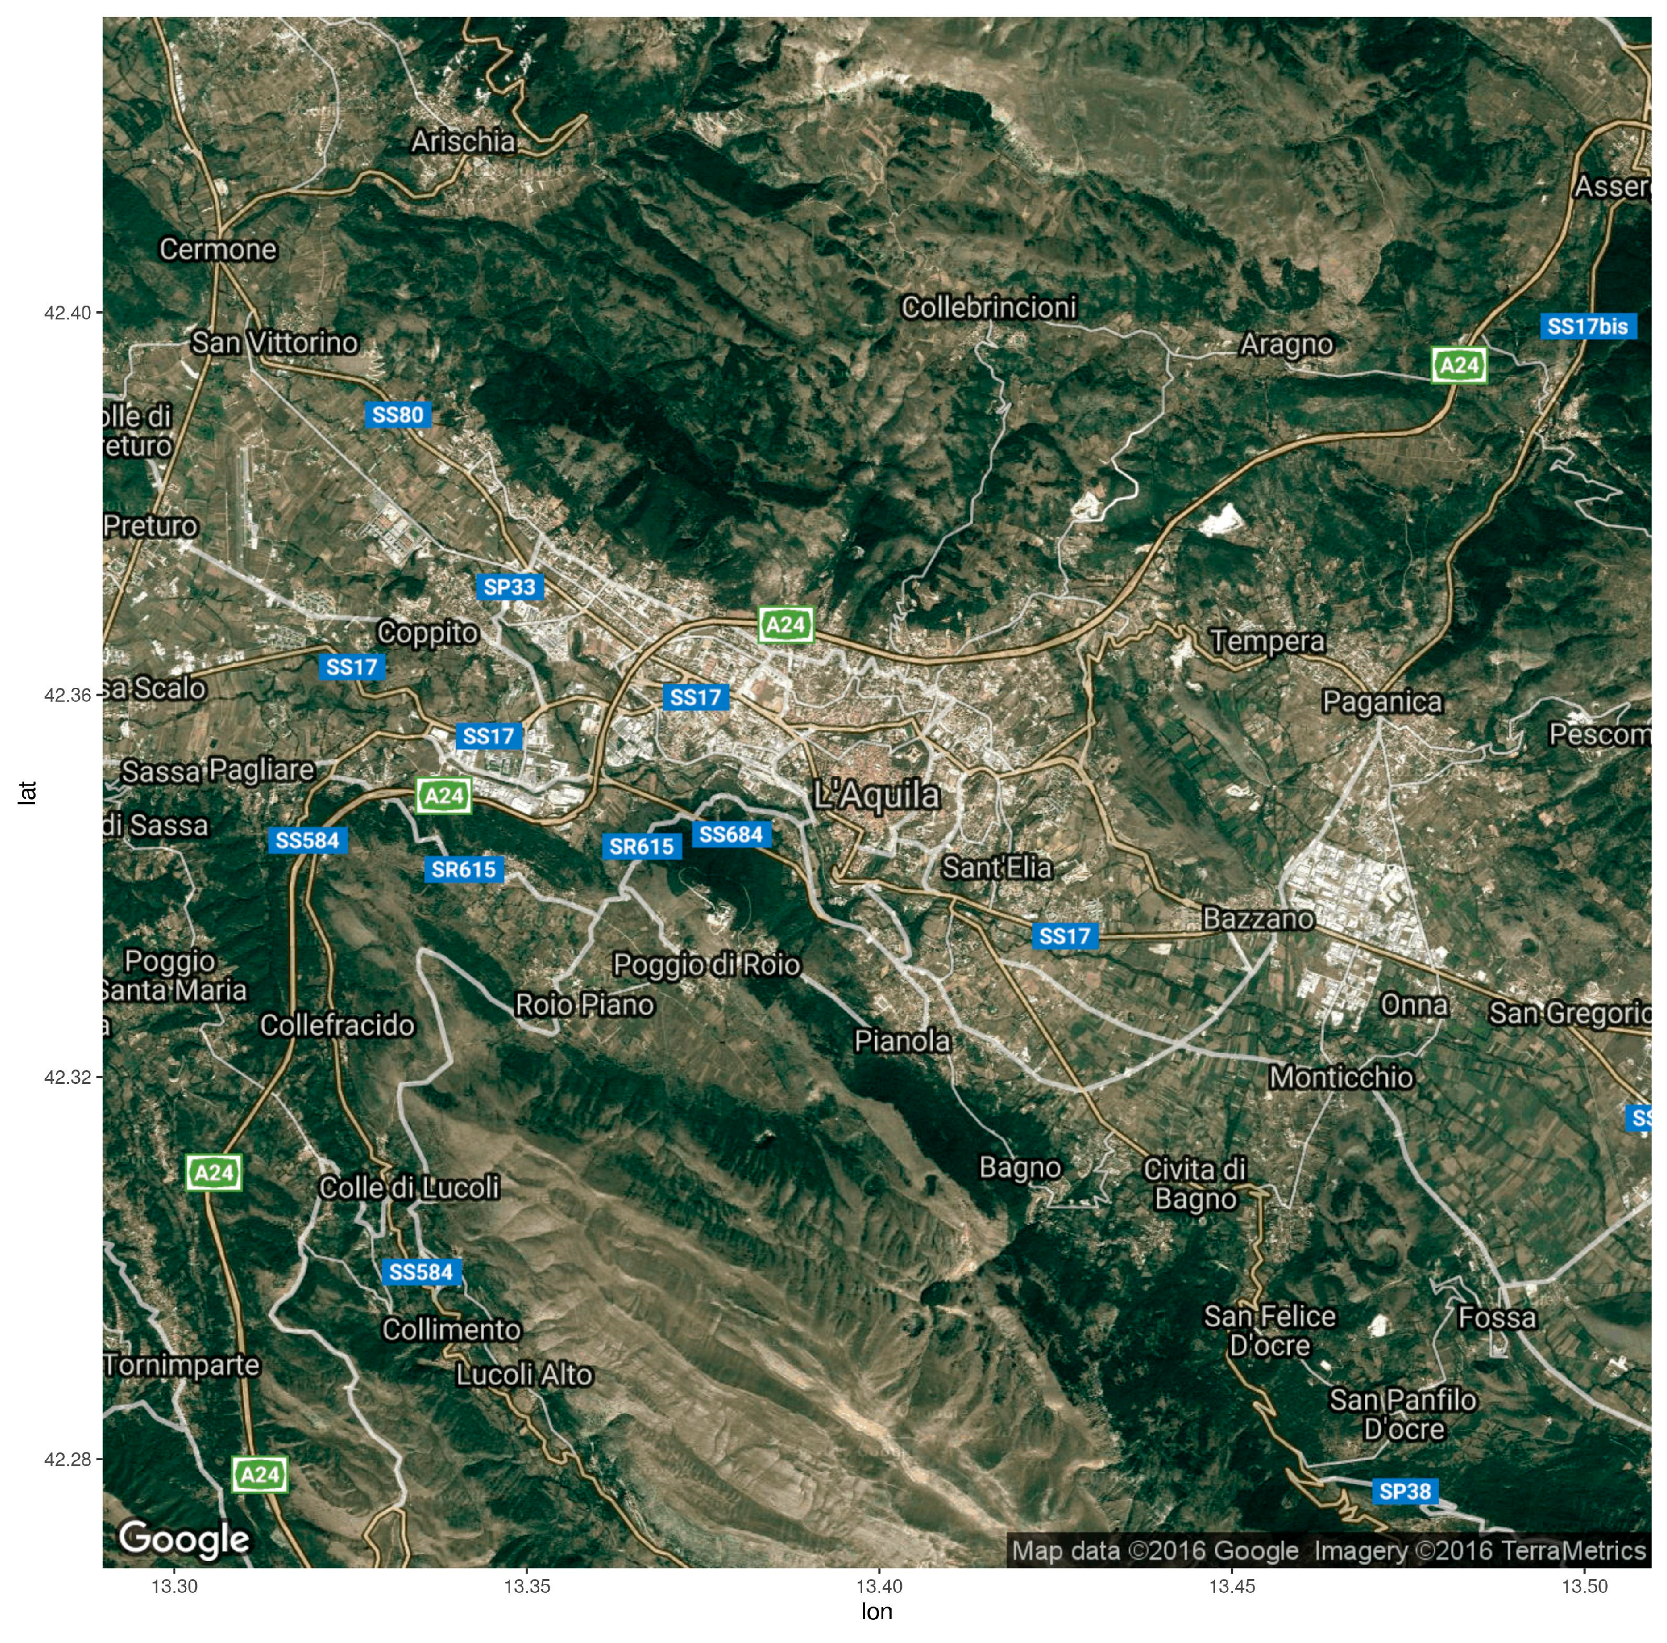
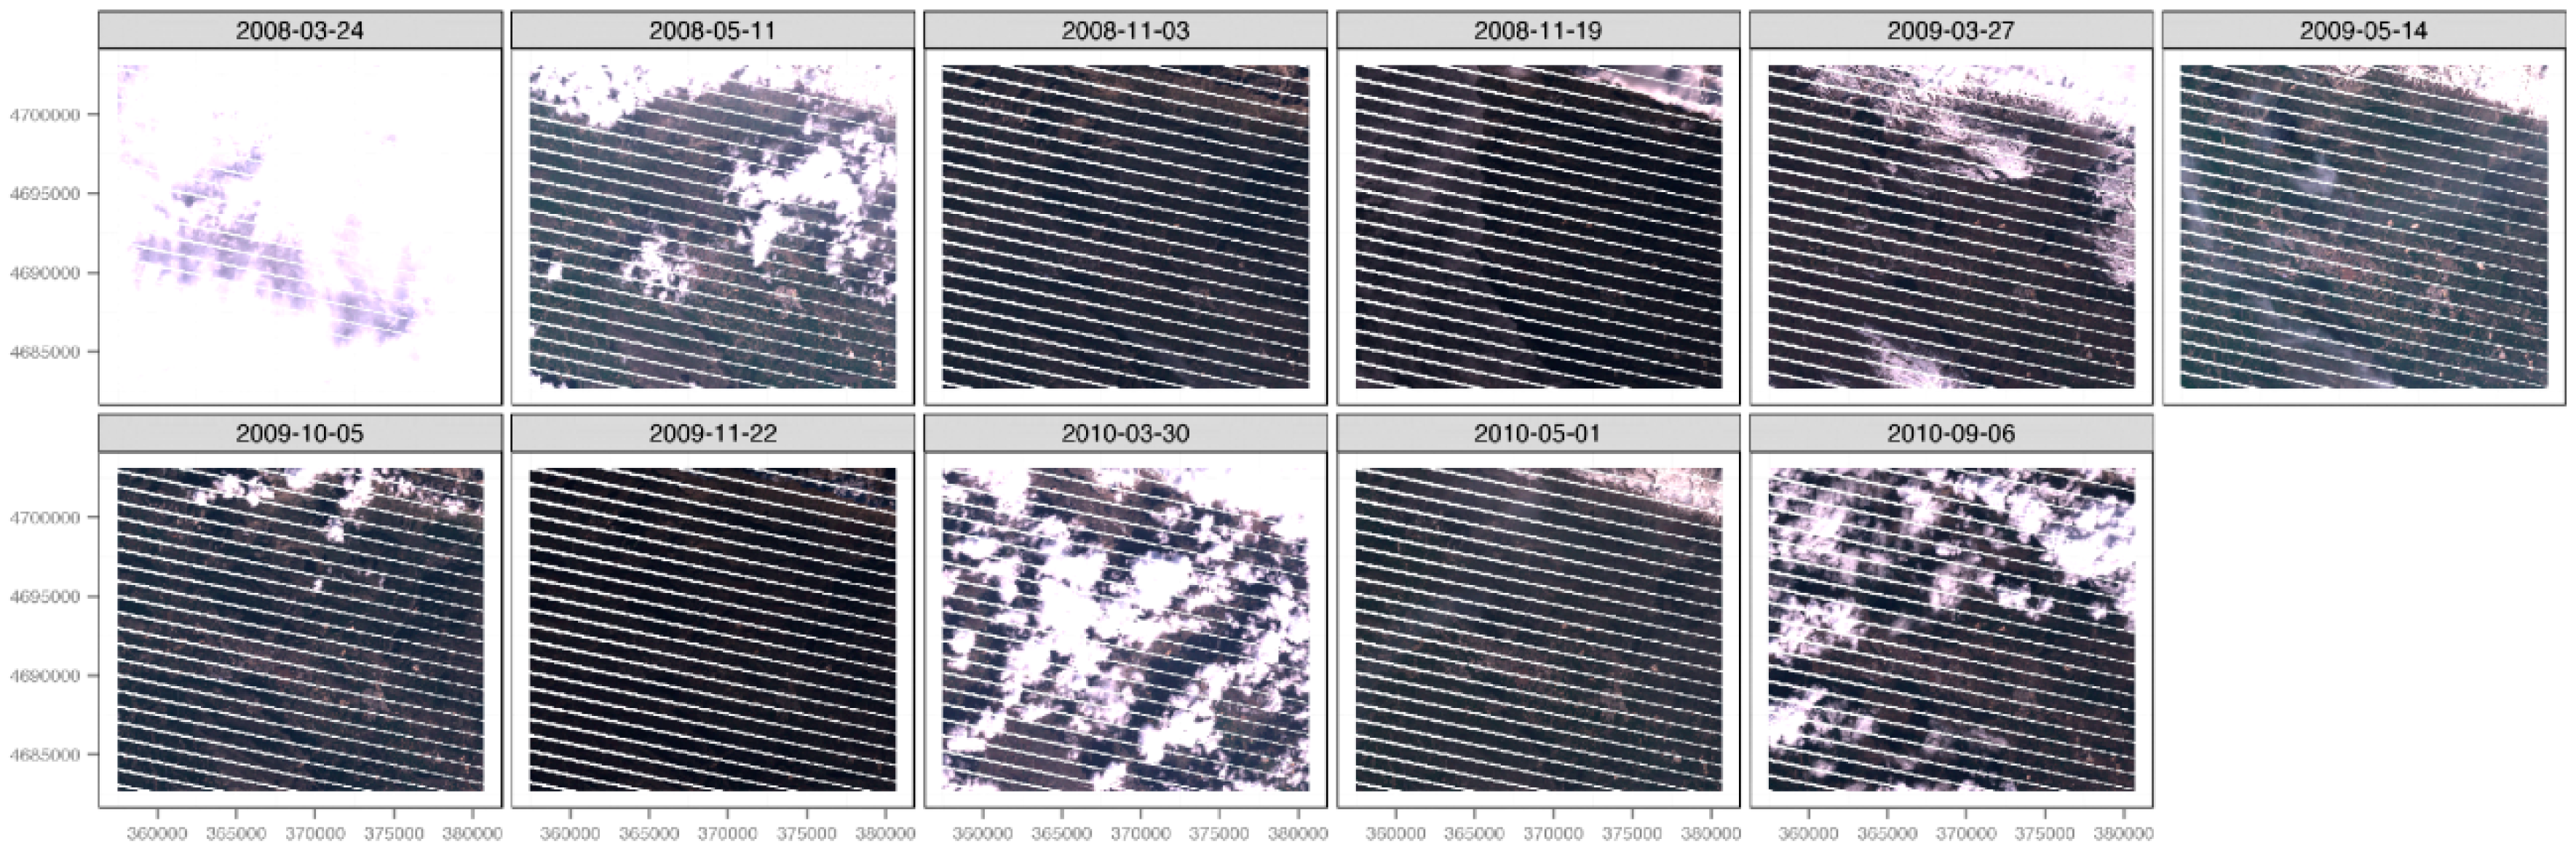
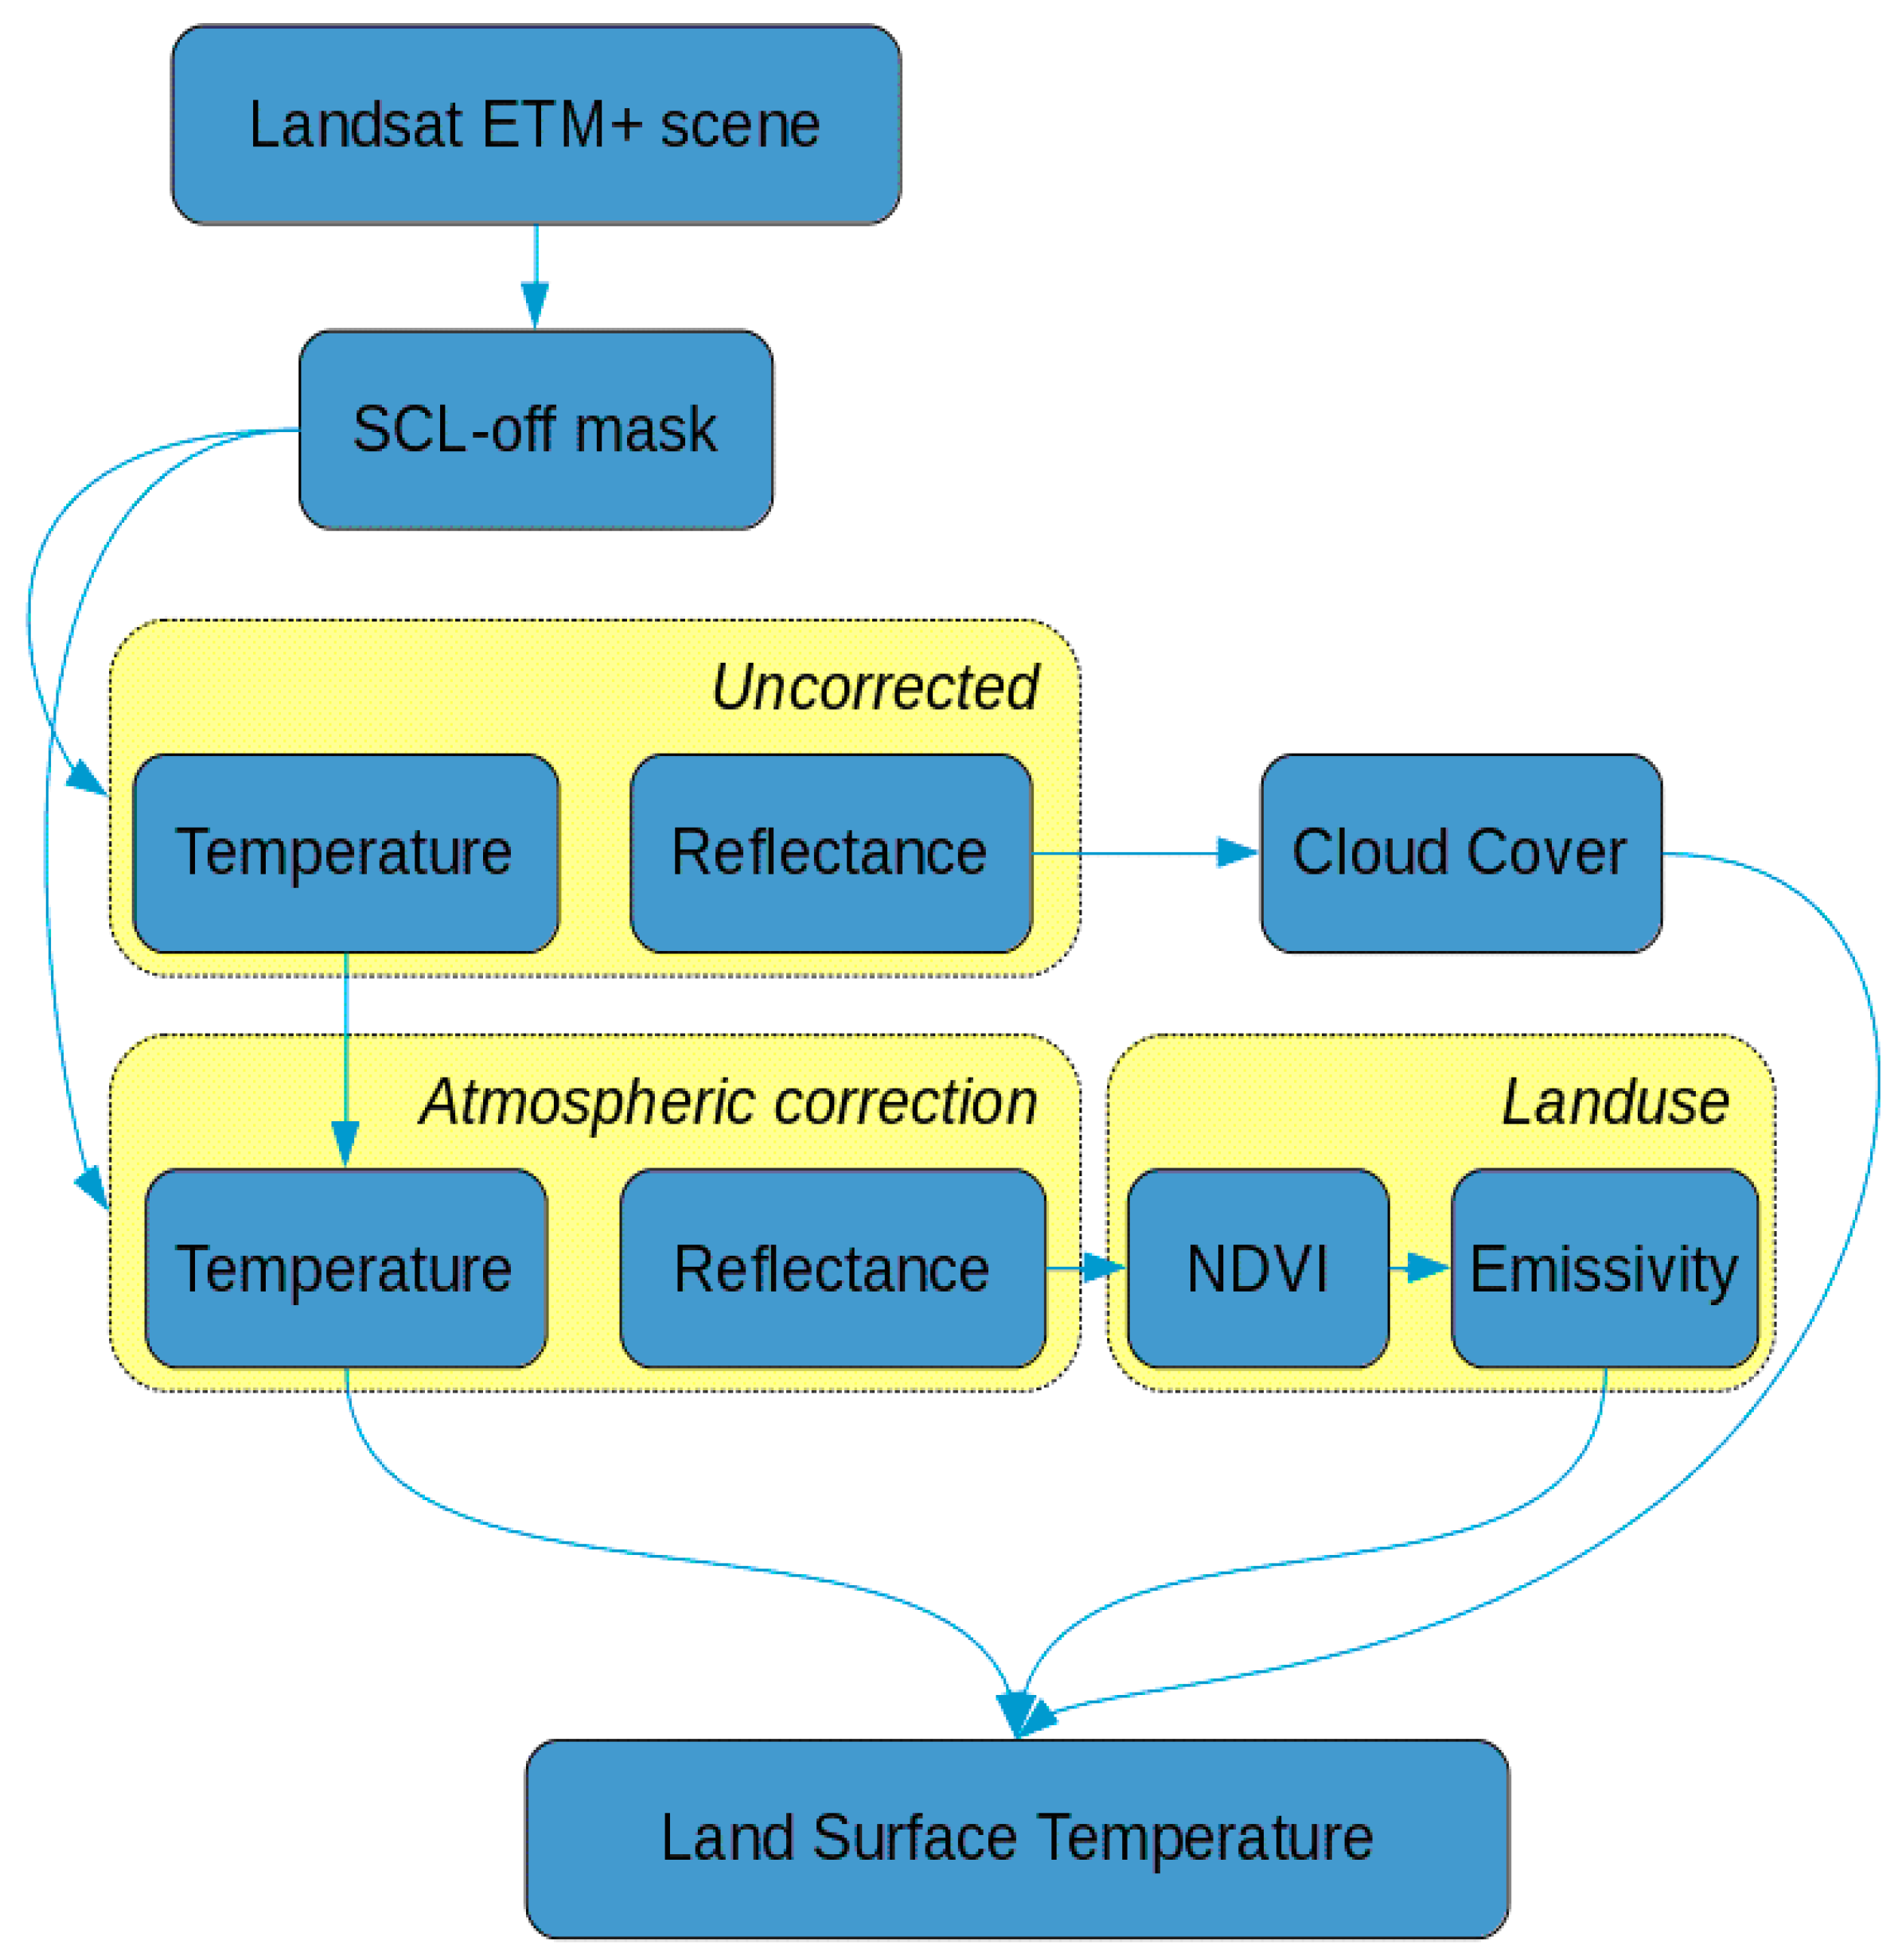
2. Materials and Methods
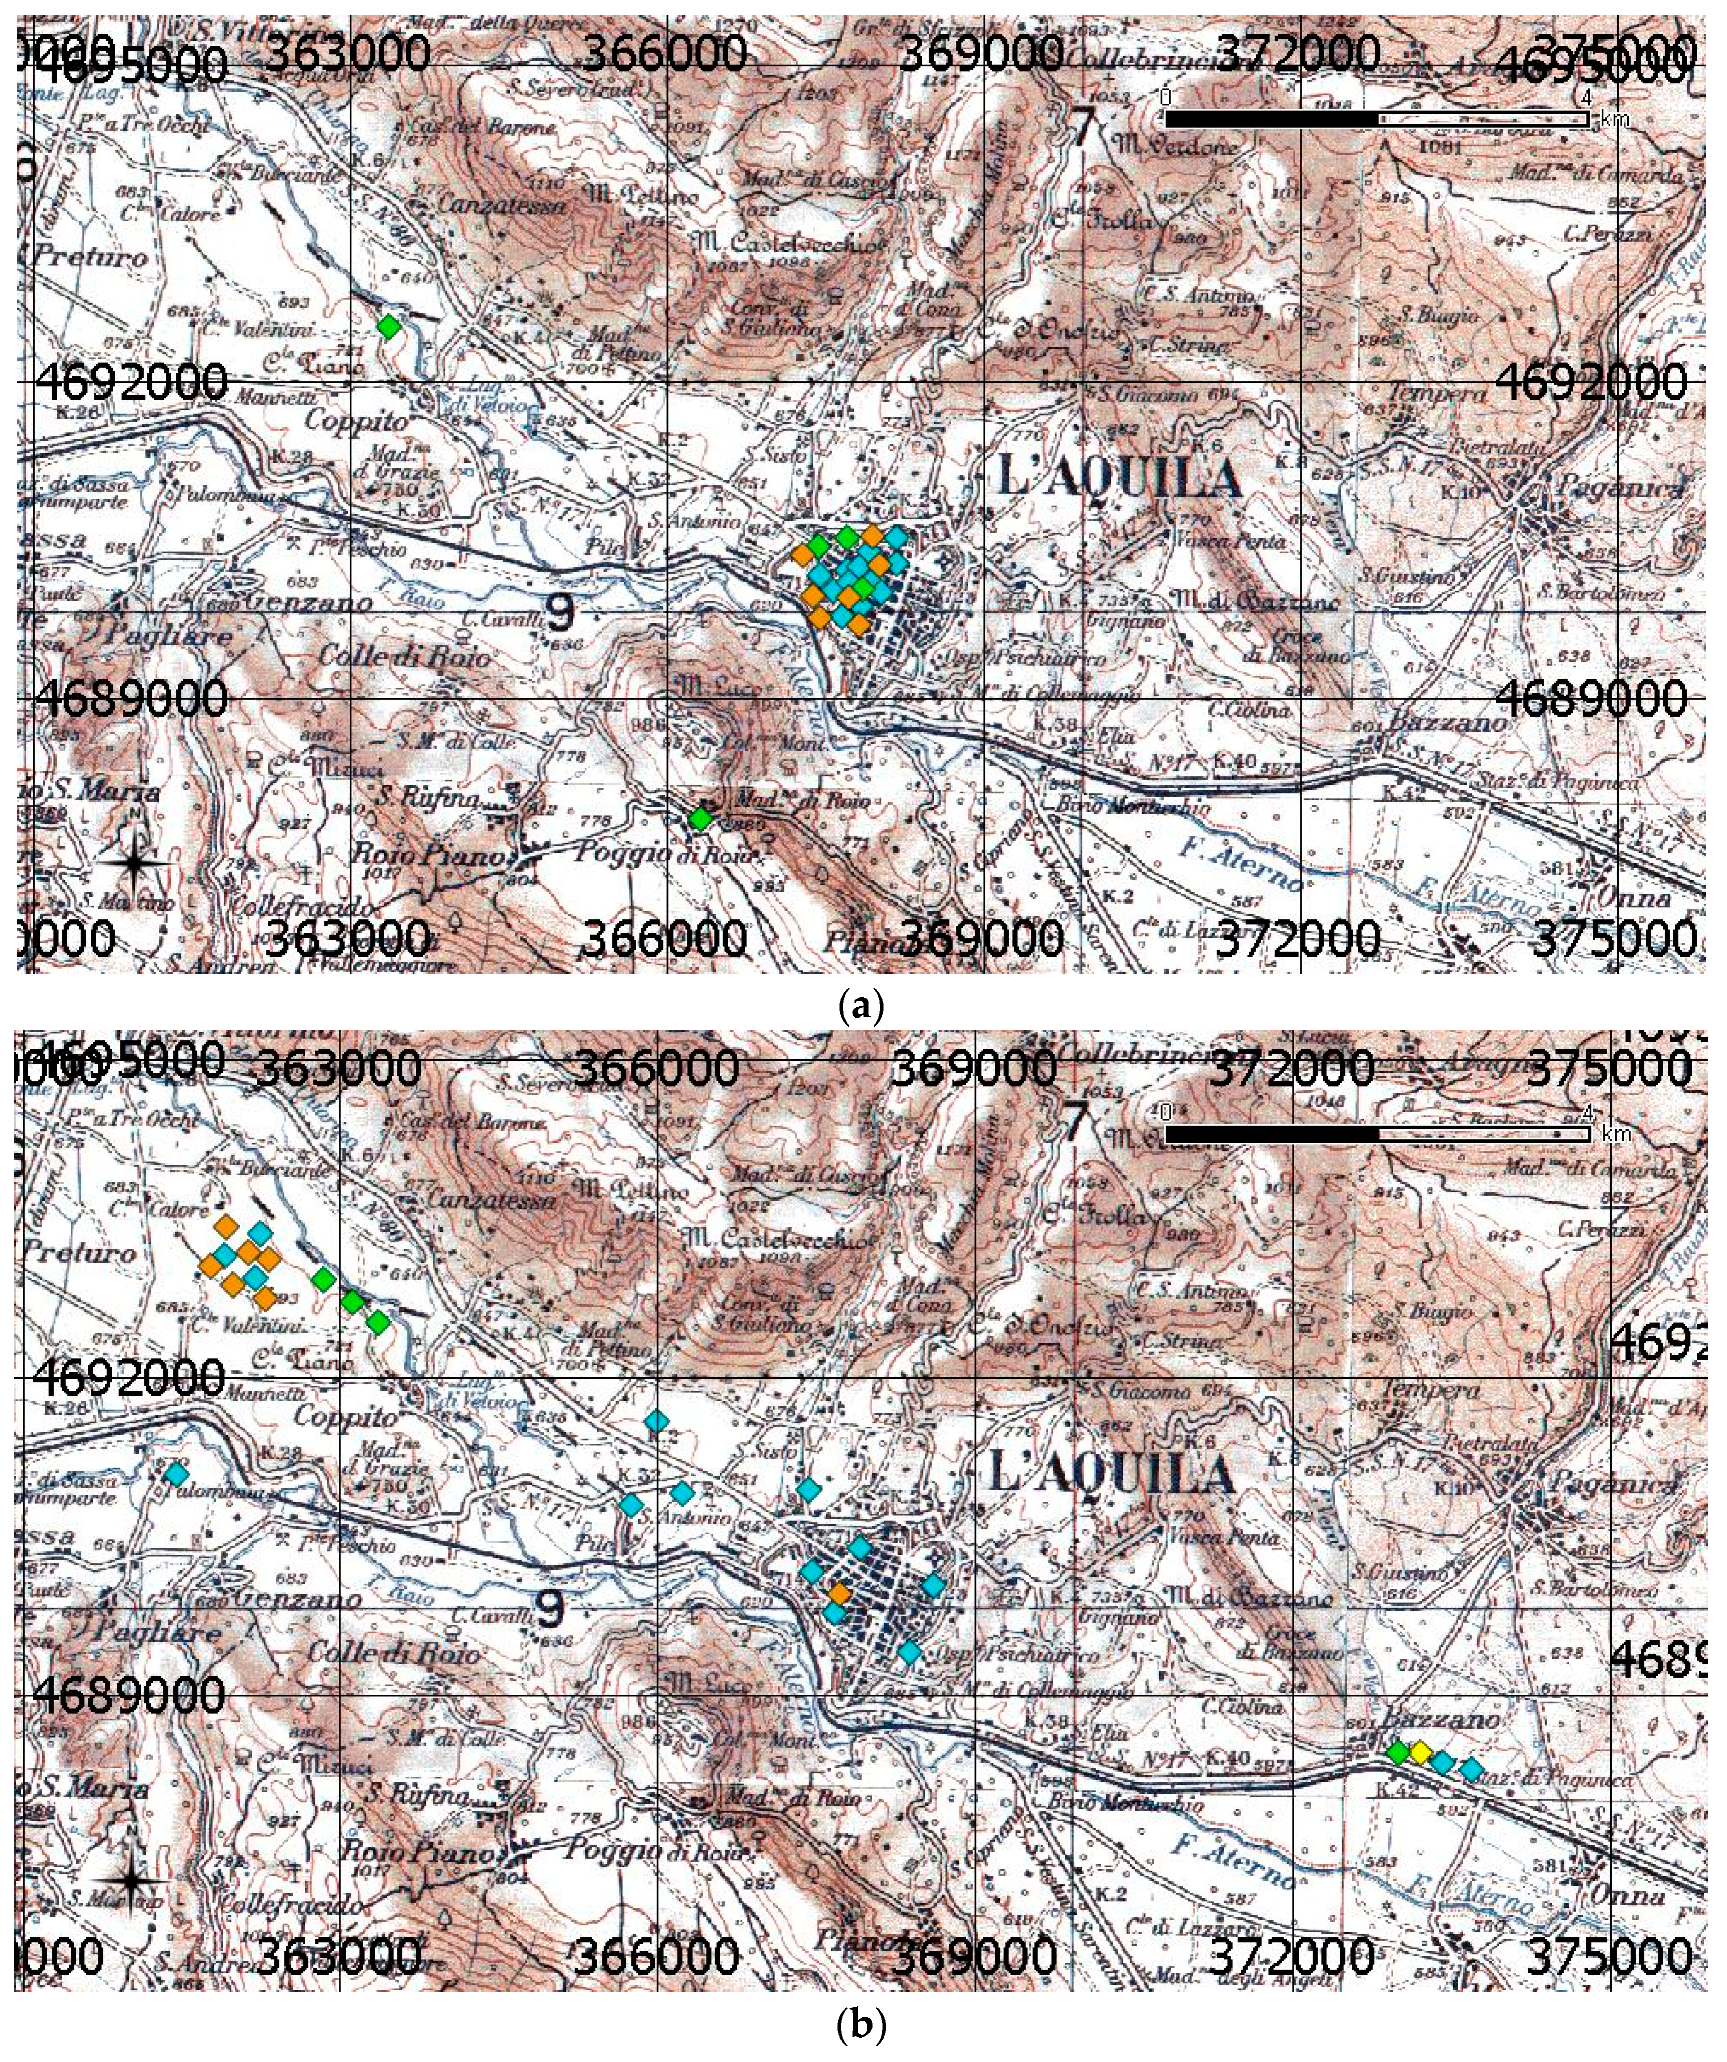
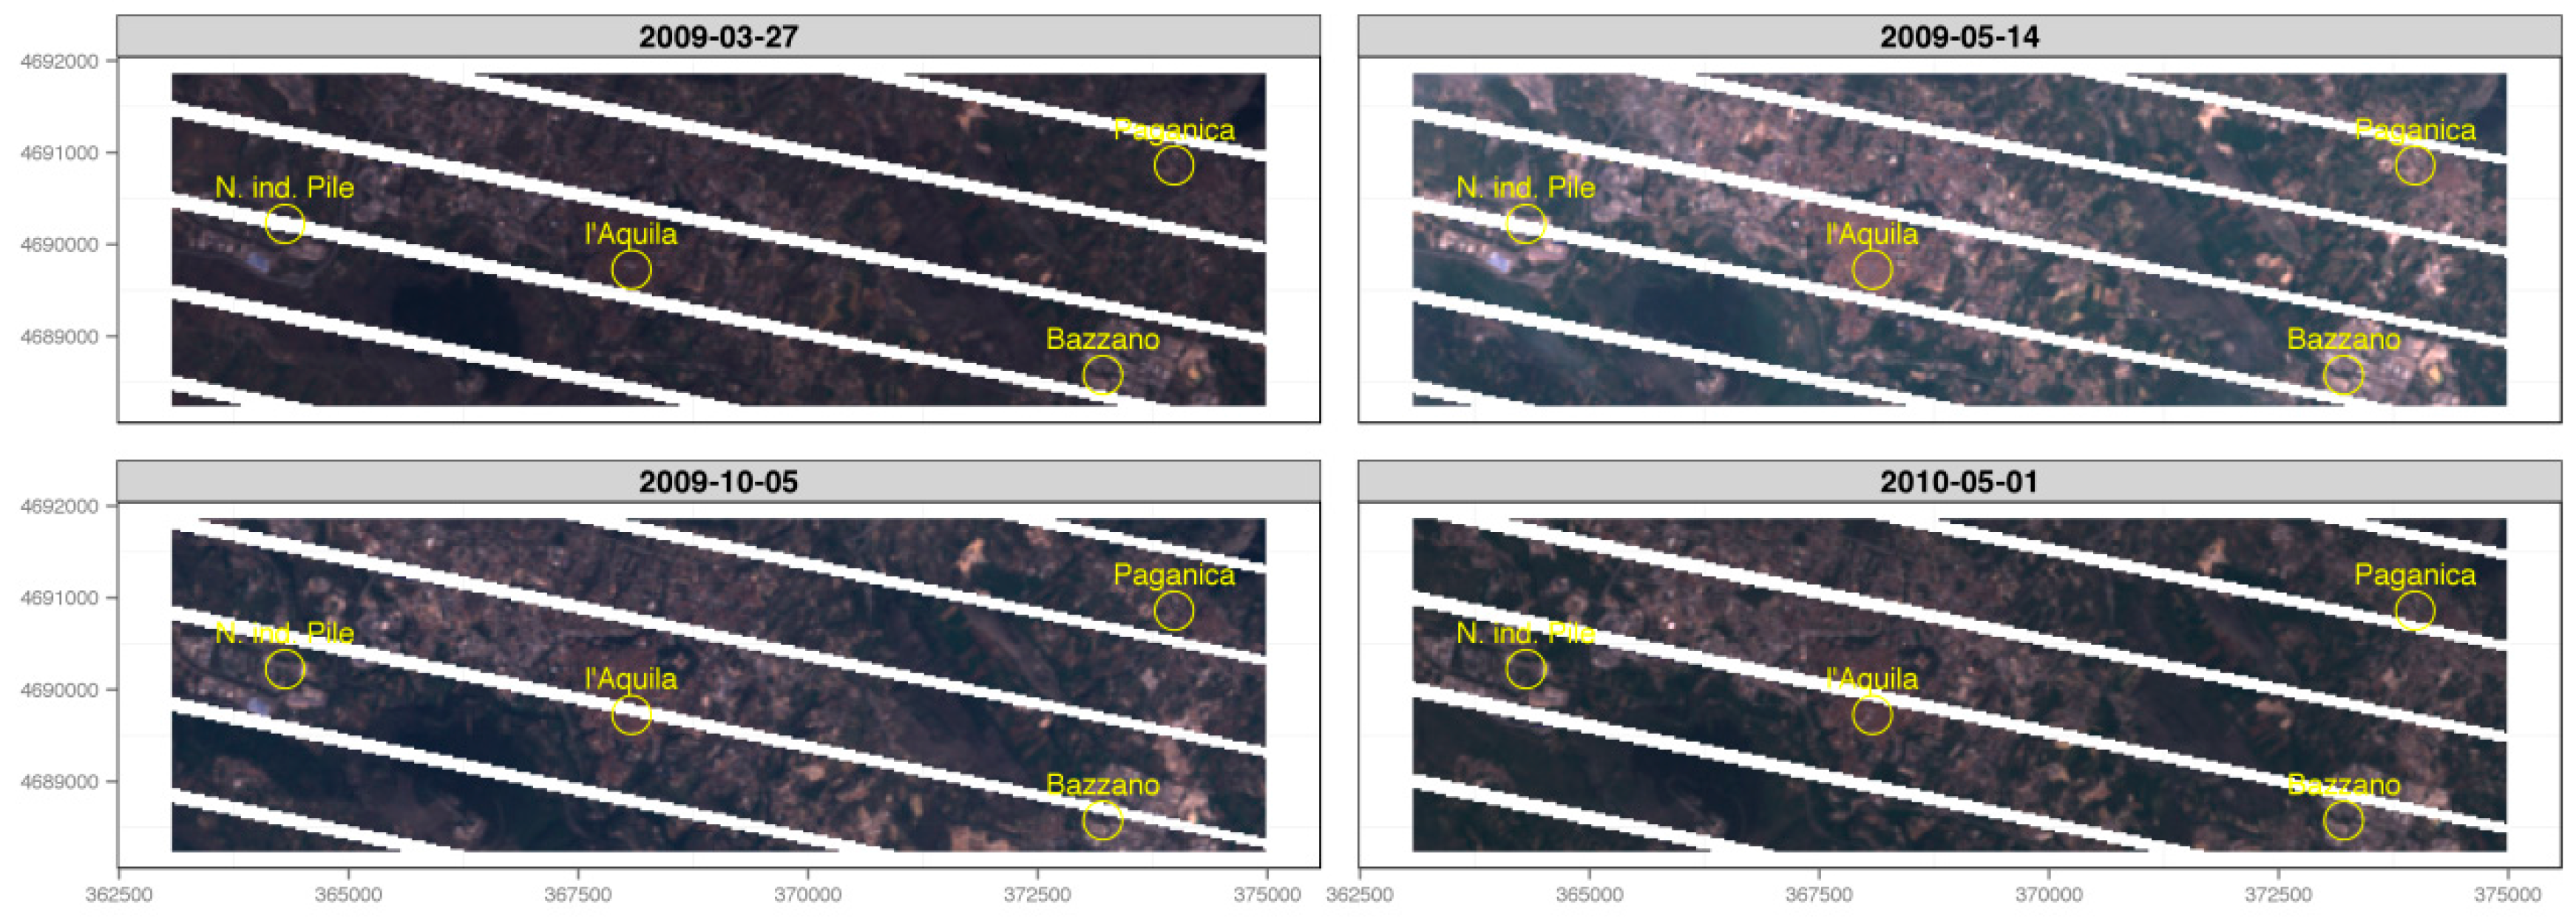
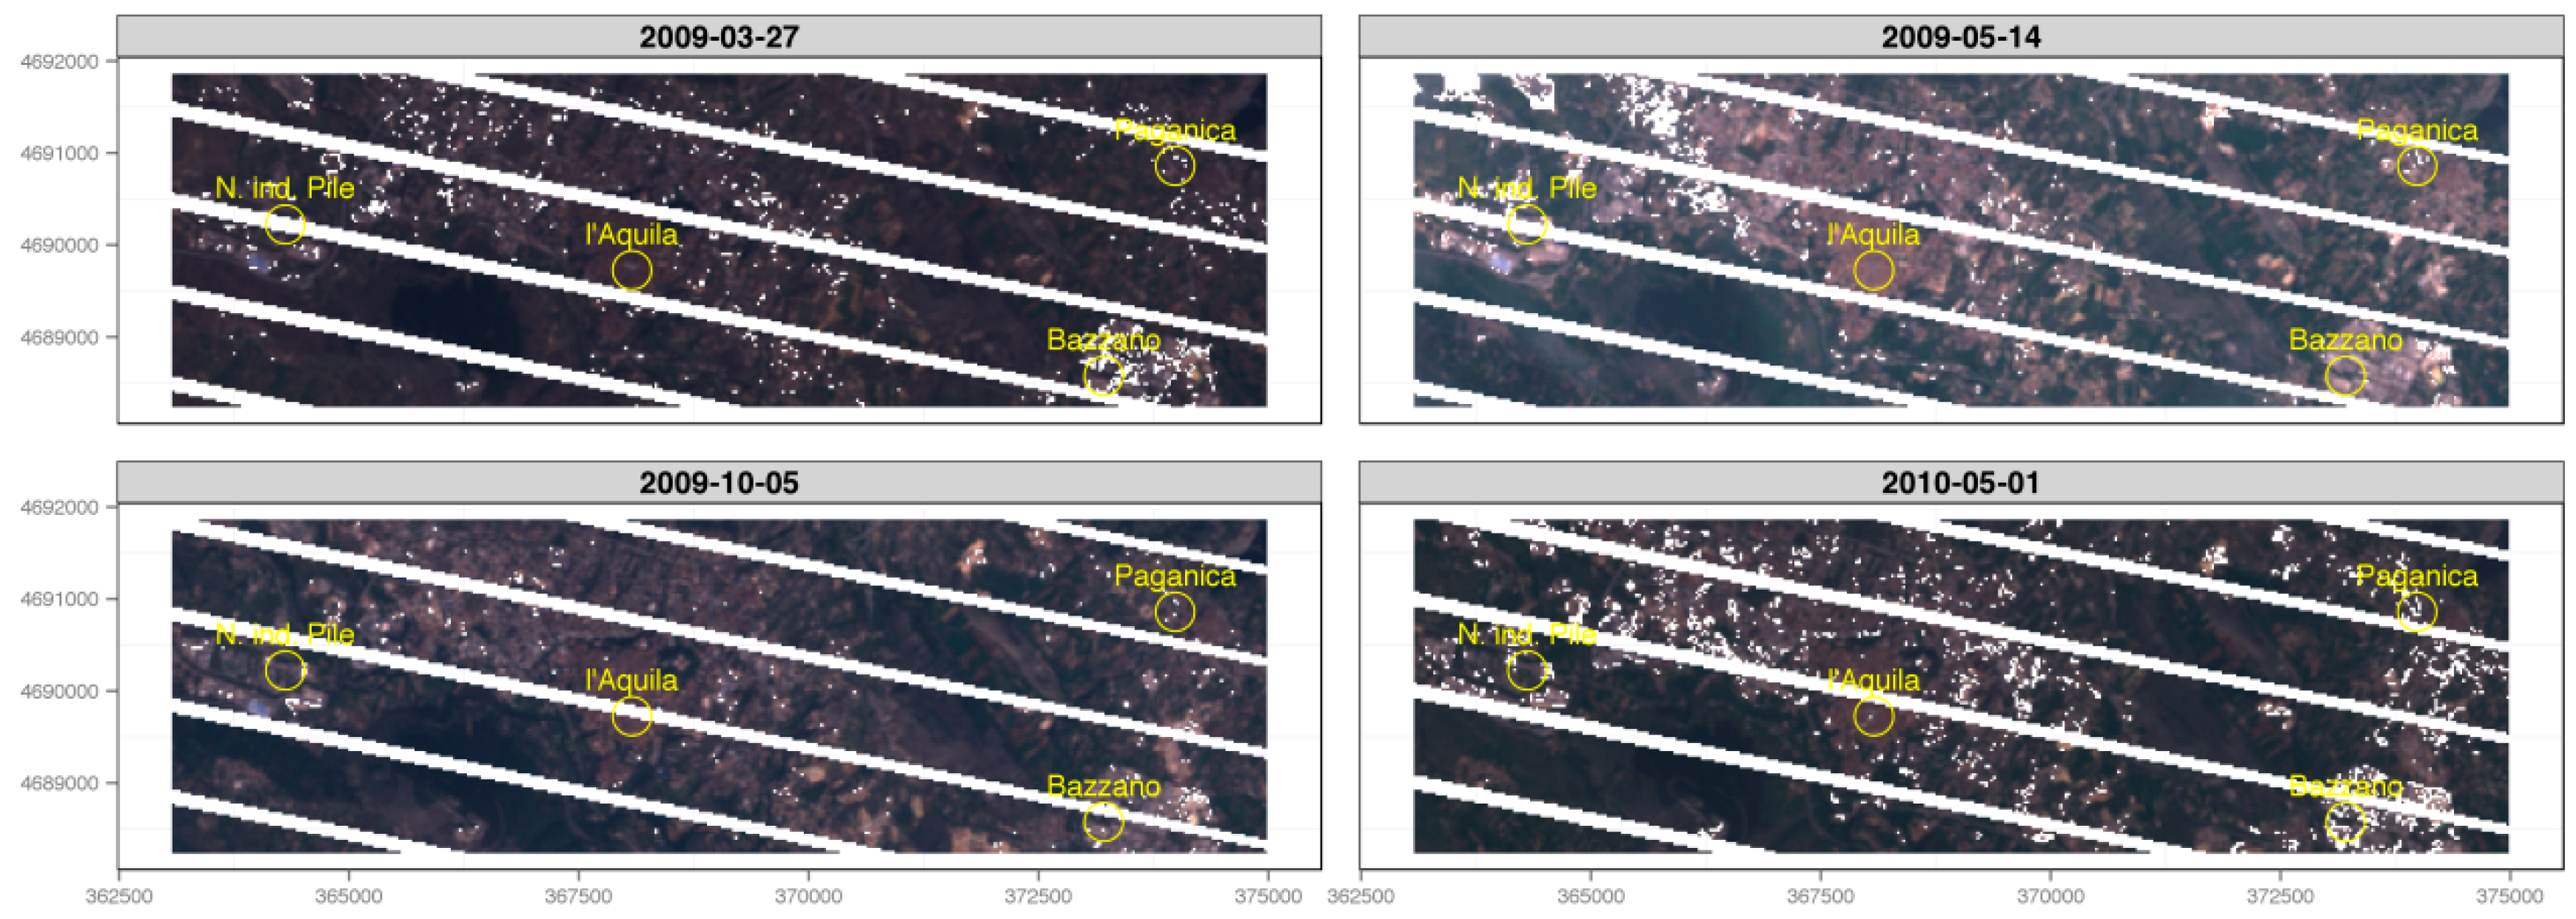
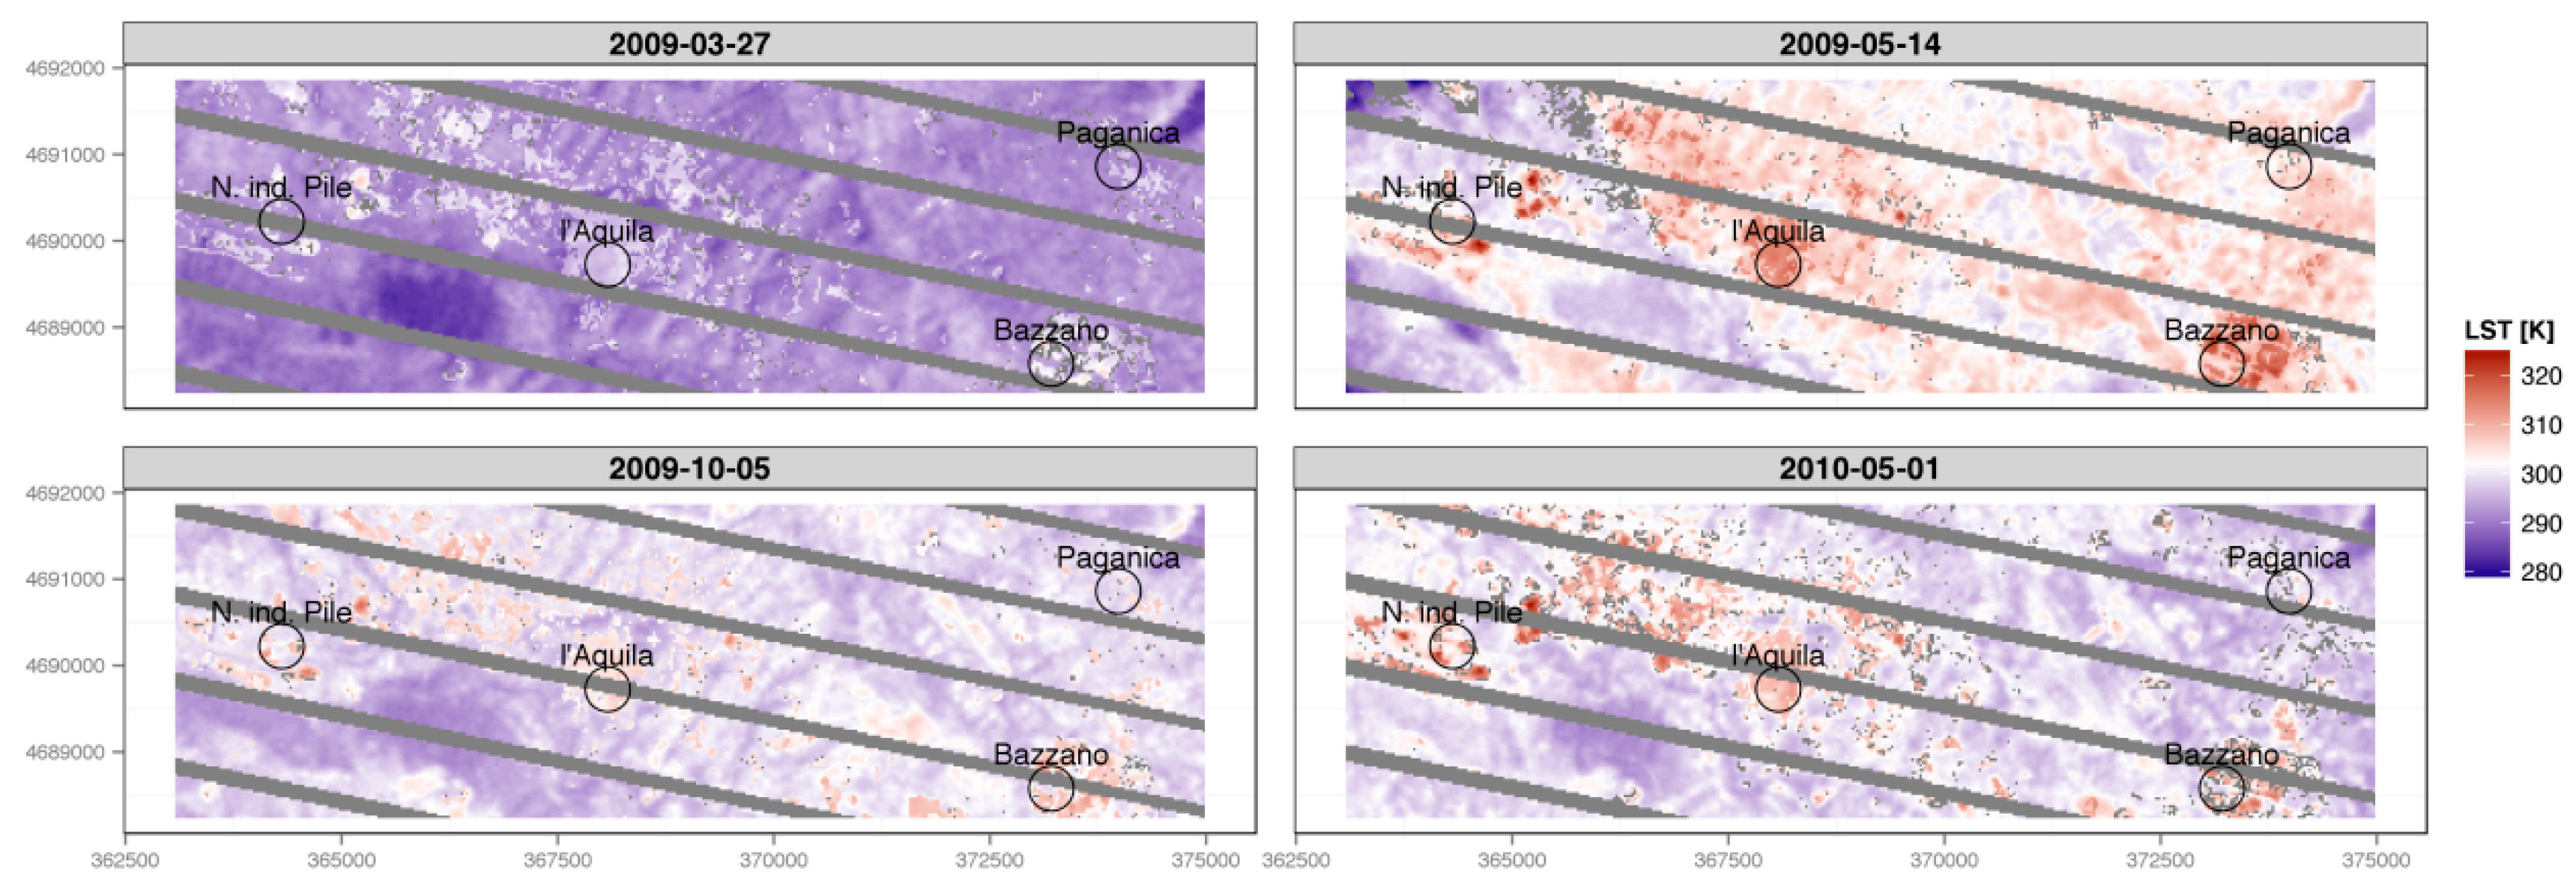
3. Results
4. Discussion and Further Developments
Acknowledgments
Author Contributions
Conflicts of Interest
References
- Voogt, J.A.; Oke, T.R. Thermal remote sensing of urban climates. Remote Sens. Environ. 2003, 86, 370–384. [Google Scholar] [CrossRef]
- Sobrino, J.A.; Jiménez-Muñoz, J.C.; Paolini, L. Land surface temperature retrieval from LANDSAT TM 5. Remote Sens. Environ. 2004, 90, 434–440. [Google Scholar] [CrossRef]
- Imhoff, M.L.; Zhang, P.; Wolfe, R.E.; Bounoua, L. Remote sensing of the urban heat island effect across biomes in the continental USA. Remote Sens. Environ. 2010, 114, 504–513. [Google Scholar] [CrossRef]
- Costantino, D.; Angelini, M.G. Thermal monitoring using an ASTER image. J. Appl. Remote Sens. 2016, 10, 046031. [Google Scholar] [CrossRef]
- Uchida, S.; Takeuchi, W.; Hatoyama, K.; Mazurov, Y. Socio-economic impact of Trans-Siberian railway after the collapse of Soviet Union by integrated spatial data analysis. In Proceedings of the 8th IGRSM International Conference and Exhibition on Geospatial & Remote Sensing (IGRSM 2016), Kuala Lumpur, Malaysia, 13–14 April 2016.
- Bagan, H.; Yamagata, Y. Landsat analysis of urban growth: How Tokyo became the world’s largest megacity during the last 40 years. Remote Sens. Environ. 2012, 127, 210–222. [Google Scholar] [CrossRef]
- Pittore, M.; Wieland, M.; Fleming, K. Perspectives on global dynamic exposure modelling for geo-risk assessment. Nat. Hazards 2016, 1–24. [Google Scholar] [CrossRef]
- Baiocchi, V.; Brigante, R.; Dominici, D.; Milone, M.V.; Mormile, M.; Radicioni, F. Automatic three-dimensional features extraction: The case study of L’Aquila for collapse identification after April 06, 2009 earthquake. Eur. J. Remote Sens. 2014, 47, 413–435. [Google Scholar] [CrossRef]
- Baiocchi, V.; Dominici, D.; Giannone, F.; Zucconi, M. Rapid building damage assessment using EROS B data: the case study of L’Aquila earthquake. Eur. J. Remote Sens. 2012, 44, 153–165. [Google Scholar] [CrossRef]
- Contreras, D.; Blaschke, T.; Tiede, D.; Jilge, M. Monitoring recovery after earthquakes through the integration of remote sensing, GIS, and ground observations: The case of L’Aquila (Italy). Cartogr. Geogr. Inf. Sci. 2016, 43, 115–133. [Google Scholar] [CrossRef]
- Linee di Indirizzo Strategico per la Ricostruzione ed il Rilancio Della Citta. Available online: http://www.comune.laquila.gov.it/moduli/output_immagine.php?id=3030 (accessed on 28 January 2017).
- Hole-Filled SRTM for the Globe Version 4. Available online: http://srtm.csi.cgiar.org (accessed on 28 January 2017).
- Geographic Resources Analysis Support System (GRASS) Software. Available online: http://grass.osgeo.org (accessed on 28 January 2017).
- Goslee, S.C. Analyzing Remote Sensing Data in R: The landsat package. J. Stat. Softw. 2011, 43. [Google Scholar] [CrossRef]
- Irish, R.R. Landsat 7 Automatic Cloud Cover Assessment. In Algorithms for Multispectral, Hyperspectral, and Ultraspectral Imagery VI, Proceedings of the SPIE, Orlando, FL, USA, 24 April 2000; Shen, S.S., Descour, M.R., Eds.; SPIE: Bellingham, WA, USA, 2004; Volume 4049, pp. 348–355. [Google Scholar]
- Irish, R.R. Landsat 7. Science Data Users Handbook; Goddard Space Flight Center: Greenbelt, MD, USA, 1998. Available online: http://landsathandbook.gsfc.nasa.gov/orbit_coverage/ (accessed on 28 January 2017).
- Irish, R.R.; Barker, J.L.; Goward, S.N.; Arvidson, T. Characterization of the Landsat-7 ETM+ Automated Cloud-Cover Assessment (ACCA) Algorithm. Photogramm. Eng. Remote Sens. 2006, 72, 1179–1188. [Google Scholar] [CrossRef]
- Chavez, P.S., Jr. Radiometric calibration of Landsat Thematic Mapper multispectral images. Photogramm. Eng. Remote Sens. 1989, 55, 1285–1294. [Google Scholar]
- Chavez, P.S., Jr. Image-based atmospheric corrections revisited and improved. Photogramm. Eng. Remote Sens. 1996, 62, 1025–1036. [Google Scholar]
- Song, C.; Woodcock, C.E.; Seto, K.C.; Lenney, M.P.; Macombe, S.A. Classification and Change Detection Using Landsat TM Data, When and How to Correct Atmospheric Effects? Remote Sens. Environ. 2001, 75, 230–243. [Google Scholar] [CrossRef]
- Sobrino, J.A.; Raissouni, N. Towards remote sensing methods for land cover dynamic monitoring: Application to Morocco. Int. J. Remote Sens. 2000, 21, 353–366. [Google Scholar] [CrossRef]
- Valor, E.; Caselles, V. Mapping Land Surface Emissivity from NDVI: Application to European, African, and South American Areas. Remote Sens. Environ. 1996, 57, 167–184. [Google Scholar] [CrossRef]
- Van de Griend, A.A.; Owe, M. On the Relationship between Thermal Emissivity and the Normalized Difference Vegetation Index for Natural Surfaces. Int. J. Remote Sens. 1993, 14, 1119–1131. [Google Scholar] [CrossRef]
- Carlson, T.N.; Ripley, D.A. On the Relation between NDVI, Fractional Vegetation Cover, and Leaf Area Index. Remote Sens. Environ. 1997, 62, 241–252. [Google Scholar] [CrossRef]
- Alipour, T.; Sarajian, M.R.; Esmaeily, A. Land Surface Temperature Estimation from Thermal Band of Landsat Sensor, Case Study: Alashtar City. The International Archieves of the Photogrammetry, Remote Sensing and Spatial Information Sciences. XXXVIII-4/C7. Available online: https://www.researchgate.net/publication/215444122_Land_Surface_Temprature_Estimation_Base_on_Thermal_Band_of_ETMSensor (accessed on 28 January 2017).
- Coll, C.J.; Galve, J.M.; Sanchez, M.; Caselles, V. Validation of Landsat-7/ETM+Thermal-Band Calibration and Atmospheric Correction with Ground-Based Measurements. IEEE Trans. Geosci. Remote Sens. 2014, 48, 547–555. [Google Scholar] [CrossRef]
- Barsi, J.A.; Barker, J.L.; Schott, J.R. An Atmospheric Correction Parameter Calculator for a Single Thermal Band Earth-Sensing Instrument. In Proceedings of the IGARSS03, Toulouse, France, 21–25 July 2003.
- Barsi, J.A.; Schott, J.R.; Palluconi, F.D.; Hook, S.J. Validation of a Web-Based Atmospheric Correction Tool for Single Thermal Band Instruments. In Earth Observing Systems, Proceedings of X SPIE, San Diego, CA, USA; SPIE: Bellingham, WA, USA, 2005; Volume 5882. [Google Scholar]
- Hijmans, R.J. Raster: Raster: Geographic Data Analysis and Modeling. R Package Version 2.3-12. Available online: http://CRAN.R-project.org/package=raster (accessed on 28 January 2017).
- Wickham, H. Ggplot2: Elegant Graphics for Data Analysis; Springer: New York, NY, USA, 2009. [Google Scholar]
- Kahle, D.; Wickham, H. Ggmap: A Package for Spatial Visualization with Google Maps and OpenStreetMap. R Package Version 2.3. Available online: http://CRAN.R-project.org/package=ggmap (accessed on 28 January 2017).
- R Core Team. R: A Language and Environment for Statistical Computing; R Foundation for Statistical Computing: Vienna, Austria, 2011; Available online: http://www.R-project.org/ (accessed on 28 January 2017).
- Berk, A.; Conforti, P.; Kennett, R.; Perkins, T.; Hawes, F.; Van den Bosh, J. MODTRAN6: A major upgrade of the MODTRAN radiative transfer code. Proc. SPIE 2014, 9088. [Google Scholar] [CrossRef]
- Mlawer, E.J.; Payne, V.H.; Moncet, J.L.; Delamere, J.S.; Alvarado, M.J.; Tobin, D.C. Development and recent evaluation of the MT_CKD model of continuum absorption. Philos. Trans. R. Soc. A 2012, 370, 1–37. [Google Scholar] [CrossRef] [PubMed]
- Clough, S.A.; Shephard, M.W.; Mlawer, E.J.; Delamere, J.S.; Iacono, M.J.; Cady-Pereira, K.; Boukabara, S.; Brown, P.D. Atmospheric radiative transfer modeling: A summary of the AER codes. J. Quant. Spectrosc. Radiat. Transf. 2005, 91, 233–244. [Google Scholar] [CrossRef]
- Mishchenko, M.I.; Travis, L.D.; Lacis, A.A. Multiple Scattering of Light by Particles: Radiative Transfer and Coherent Backscattering; Cambridge University Press: Cambridge, UK, 2006. [Google Scholar]


| Id | Date | Greenwich Medium Time (GMT) | Lat (Deg.) | Lon (Deg.) | LST Successfully Processed |
|---|---|---|---|---|---|
| LE71900312008084ASN00 | 24/03/2008 | 09:37:21 | 41.76665 | 13.61165 | |
| LE71900312008132ASN00 | 11/05/2008 | 09:37:13 | 41.76504 | 13.59003 | |
| LE71900312008308ASN00 | 03/11/2008 | 09:36:11 | 41.76288 | 13.63519 | |
| LE71900312008324ASN00 | 19/11/2008 | 09:36:25 | 41.76024 | 13.64066 | |
| LE71900312009086ASN00 | 27/03/2009 | 09:37:26 | 41.76393 | 13.6099 | * |
| LE71900312009134ASN00 | 14/05/2009 | 09:37:38 | 41.76234 | 13.59009 | * |
| LE71900312009278ASN00 | 05/10/2009 | 09:37:18 | 41.76517 | 13.60086 | * |
| LE71900312009326ASN00 | 22/11/2009 | 09:37:54 | 41.76312 | 13.65504 | |
| LE71900312010089ASN00 | 30/03/2010 | 09:39:24 | 41.75448 | 13.58893 | |
| LE71900312010121ASN00 | 01/05/2010 | 09:39:23 | 41.75542 | 13.62054 | * |
| LE71900312010249ASN00 | 06/09/2010 | 09:39:29 | 41.75601 | 13.62678 |
© 2017 by the authors. Licensee MDPI, Basel, Switzerland. This article is an open access article distributed under the terms and conditions of the Creative Commons Attribution (CC BY) license ( http://creativecommons.org/licenses/by/4.0/).
Share and Cite
Baiocchi, V.; Zottele, F.; Dominici, D. Remote Sensing of Urban Microclimate Change in L’Aquila City (Italy) after Post-Earthquake Depopulation in an Open Source GIS Environment. Sensors 2017, 17, 404. https://doi.org/10.3390/s17020404
Baiocchi V, Zottele F, Dominici D. Remote Sensing of Urban Microclimate Change in L’Aquila City (Italy) after Post-Earthquake Depopulation in an Open Source GIS Environment. Sensors. 2017; 17(2):404. https://doi.org/10.3390/s17020404
Chicago/Turabian StyleBaiocchi, Valerio, Fabio Zottele, and Donatella Dominici. 2017. "Remote Sensing of Urban Microclimate Change in L’Aquila City (Italy) after Post-Earthquake Depopulation in an Open Source GIS Environment" Sensors 17, no. 2: 404. https://doi.org/10.3390/s17020404