1. Introduction
Methyl mercaptan (methanethiol, CH
3SH, MM), a colorless gas with a foul odor, is produced by both natural [
1] and industrial sources [
2]. The olfactory threshold of MM is very low (~2 ppb). It is significantly toxic at high concentrations and can destroy the central nervous system of living beings. The recommended threshold concentration limit of MM, as defined by the American Conference of Governmental Industrial Hygienists (ACGIH), is 0.5 ppm (threshold limit value: 8 h time weighted average; TLV-TWA) [
3]. CH
3SH is also a predominant marker in exhaled breath (ppm levels) for the diagnosis of periodontal and stomach diseases [
4,
5]. Therefore, it is necessary to monitor CH
3SH continuously from ppb to ppm levels for purposes of environmental monitoring and biomedical diagnosis.
Several common methods are used for CH
3SH detection, including combined gas chromatography and mass spectroscopy (GC–MS) [
6,
7], gas sensors [
3,
8,
9], chemiluminescence [
10,
11,
12], and mid-infrared (MIR) laser spectroscopy [
13,
14]. GC–MS and sensors such as biosensors can provide accurate analyses down to a few ppb; however, these methods are either costly or have a short lifetime. Electrochemical devices are only sensitive to ppm level of CH
3SH, which greatly exceeds the olfactory threshold [
8]. Gaseous CH
3SH should be collected and react with certain chemical substances before the detection using chemiluminescence. Although it can achieve ppb levels and near real-time detection, it is complex for the maintenance of the equipment. MIR laser spectroscopy has also been used for CH
3SH detection due to its high sensitivity and fast response. Vance et al. [
13] characterized CH
3SH absorption using a carbon isotope laser spectrometer. A 3.27 µm infrared tunable laser spectrometer (TLAS) was recommended for monitoring CH
3SH in situ and real time as earth-based bio-signatures for extraterrestrial exploration. The selected spectral line absorption can be influenced by significant interference, especially by methane absorption. We previously examined CH
3SH absorption features from 3260 to 3400 nm and selected the spectral line at 3393.584 nm for measuring CH
3SH using direct absorption TLAS technology [
14]. The detection limit was 25 ppb, and the integration time was 1.84 s under laboratory conditions in the measurement of pure CH
3SH. However, the detection of CH
3SH in the atmosphere will be disturbed by interfering atmospheric absorption, while CH
3SH concentration is lower than several ppm [
14].
In this paper, an improved CH3SH sensor with high sensitivity based on wavelength modulation spectroscopy (WMS) was developed to detect atmospheric CH3SH using a 3392 nm MIR interband cascade laser (ICL). A multicomponent spectral fitting approach was used to eliminate the influence of the main atmospheric interferents, H2O and CH4. A series of experiments were performed to verify the performance of the sensor.
2. Methods
In wavelength modulation spectroscopy [
15,
16,
17], the injection current of a tunable laser is modulated by a high-frequency sinusoid superimposed on a repetitive ramp. Therefore, the incident laser frequency (wavelength),
, can be expressed as [
17]
where
is the average frequency (wavelength) of the laser, and
is the amplitude of the frequency (wavelength) modulation.
According to the Beer–Lambert law, for optically thin samples,
, where
is the absorption coefficient at frequency
, and the transmission coefficient
can be written as
The spectral absorbance,
, is an even periodic function in 2π
ft and can be expanded as a Fourier cosine series:
Typically, the case of
k = 2 is widely used in WMS, because the second harmonic signal (2
f) is closely related to the absorption and is free of background. The second harmonic signal of a mixture of
N types of gases can be expressed as
where
is the mole fraction of the
absorbing species;
(
cm/molecule) and
are the line strength and line shape function of the
line of the
absorbing species, respectively;
P is the total pressure of the mixture;
L is the path length. To simplify Equation (4), if the temperature and pressure of the gas sample remain constant, and the line shape variation is ignored, then Equation (4) can be expressed as
where
is the second harmonic signal of the
species in per unit volume concentration. Equation (5) means that the second harmonic signal of a mixture is equal to the sum of the product of each component’s concentration and that its second harmonic signal in per unit volume concentration when the condition of optically thin is met.
The magnitude of the absorption-based
2f signal in Equation (4),
, which is usually measured by a lock-in amplifier, can be described as
where
is the electro-optical gain of the detection system, and
is the
2f signal of the
species in per unit volume concentration, which can be measured off-line and stored in the internal memory. Therefore,
of a mixture theoretically equals the sum of the product of each component’s concentration and its
2f signal in per unit volume concentration.
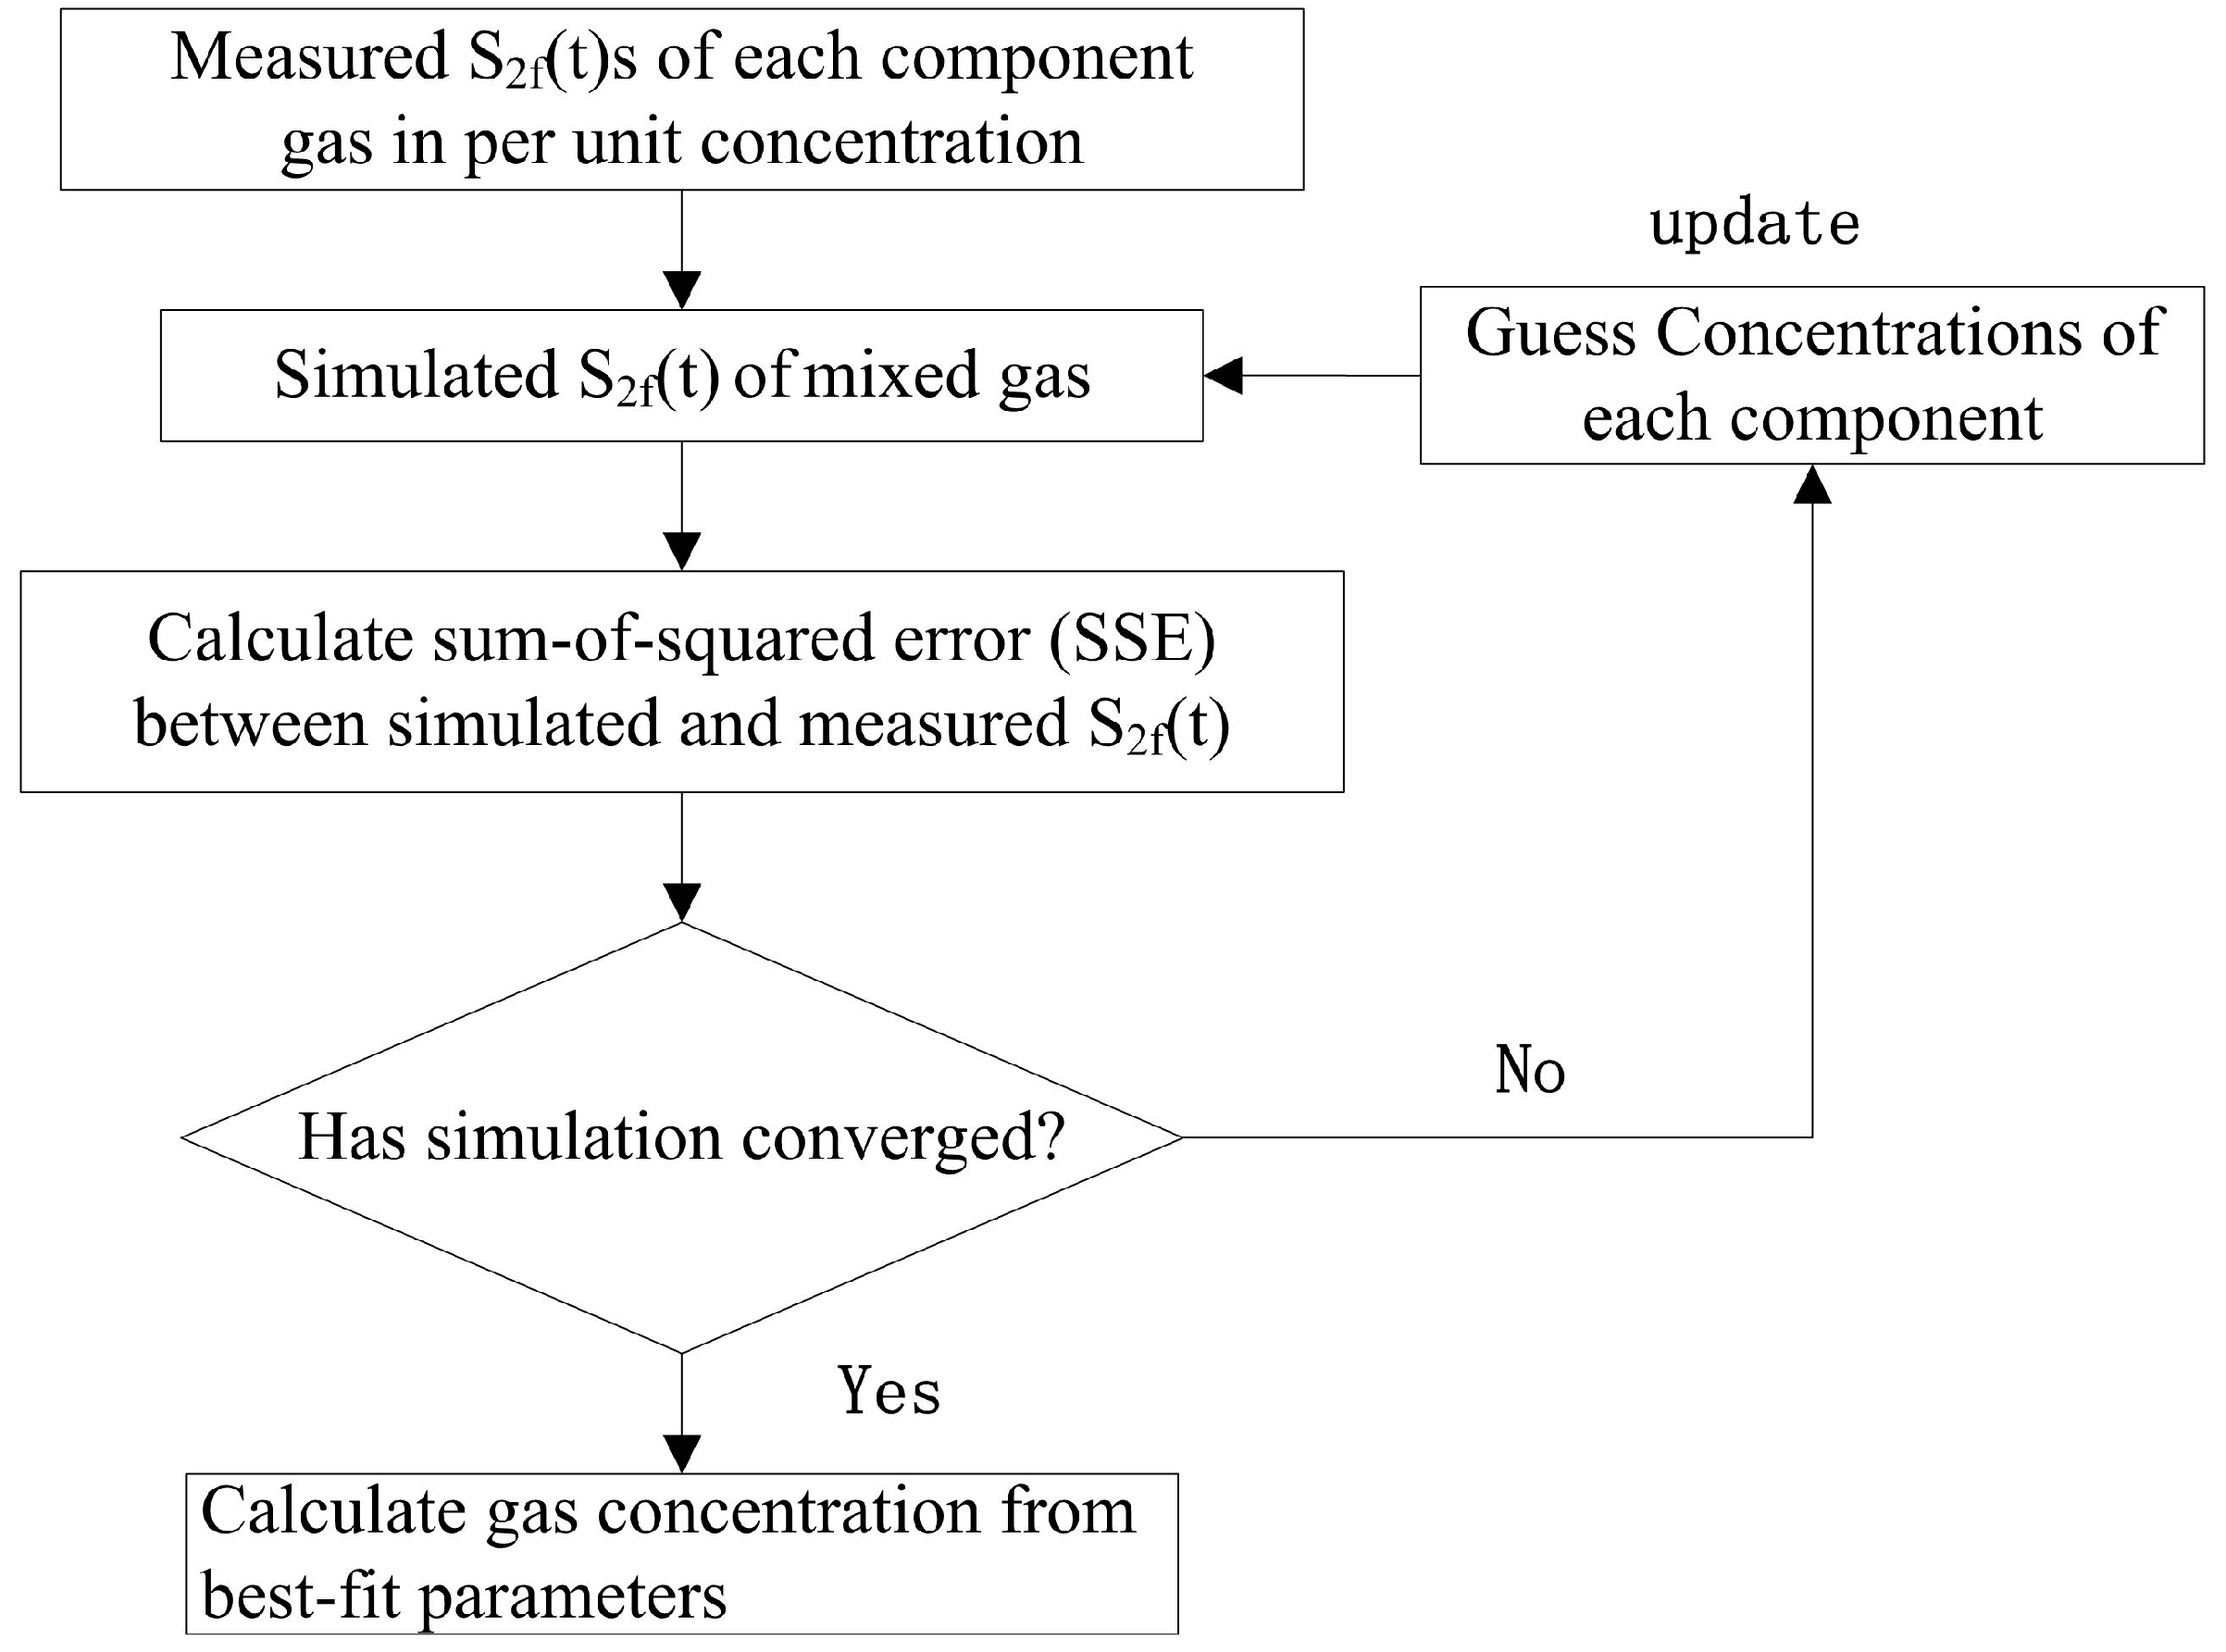
A multicomponent spectral fitting algorithm, based on multivariate regression and nonlinear least square fitting [
16], is used to calculate the multi-component concentration in a mixture according to Equation (6). The steps of this algorithm are displayed in
Figure 1.
The Levenburg–Marquardt algorithm [
15] was applied during the iterative process of the method. To complete the algorithm, the reference
2f signal of every component was obtained beforehand; the concentrations of all components in the mixture under study were non-negative parameters according to the Levenburg–Marquardt algorithm, and their initial values were given first. In each iteration of the fitting routine, the
2f signal of the mixture was simulated according to Equation (6) with the updated parameters. The sum-of-square (SSE) between the measured and simulated
2f was calculated to quantify the accuracy of the latter. When the SSE was minimized, the fitting routine converged upon a unique solution. Once the routine converged, the best fitting parameters were determined as the concentrations of the components.
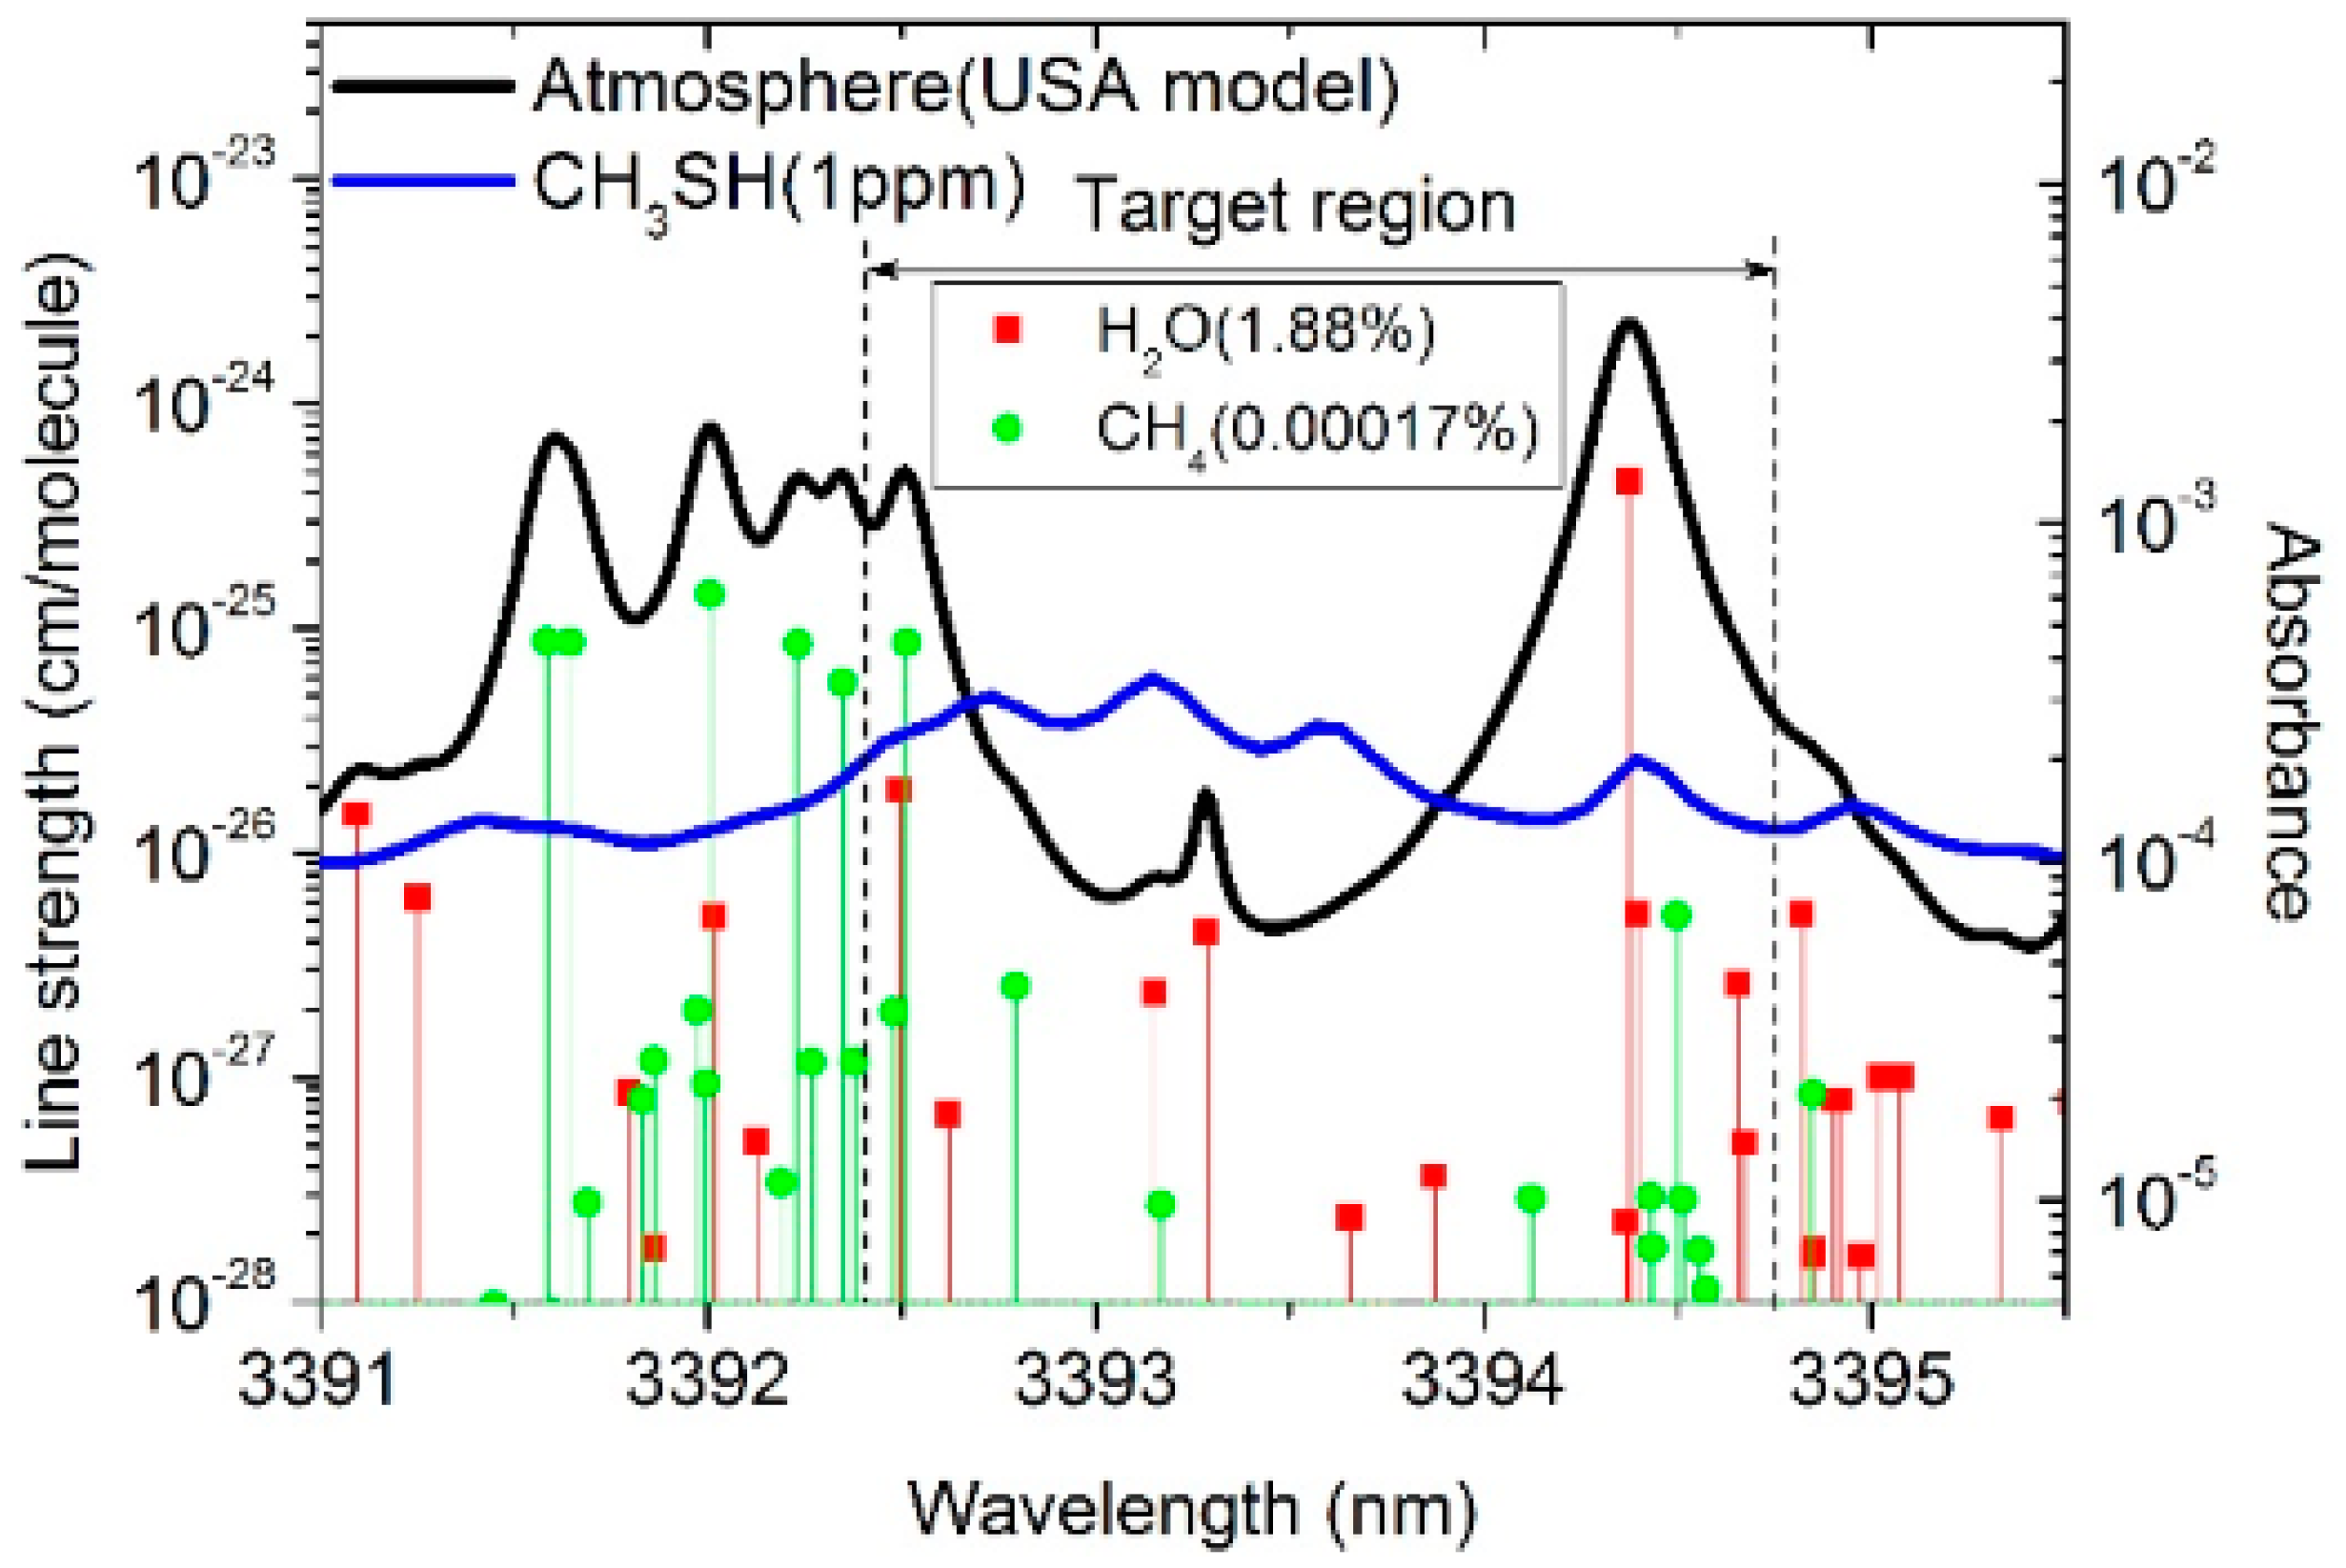
Based on the absorption of CH
3SH in the MIR band [
14] and the available operating wavelength range of the ICL in our laboratory, an absorption range of 3392.4–3394.7 nm was used to measure the CH
3SH concentration. The absorption of CH
3SH is the band spectrum with the interference of H
2O and CH
4 in the atmosphere (
Figure 2) [
18,
19]. The algorithm proposed above could be applied to the detection of atmospheric CH
3SH to eliminate the interference of H
2O and CH
4.
3. Experimental Setup
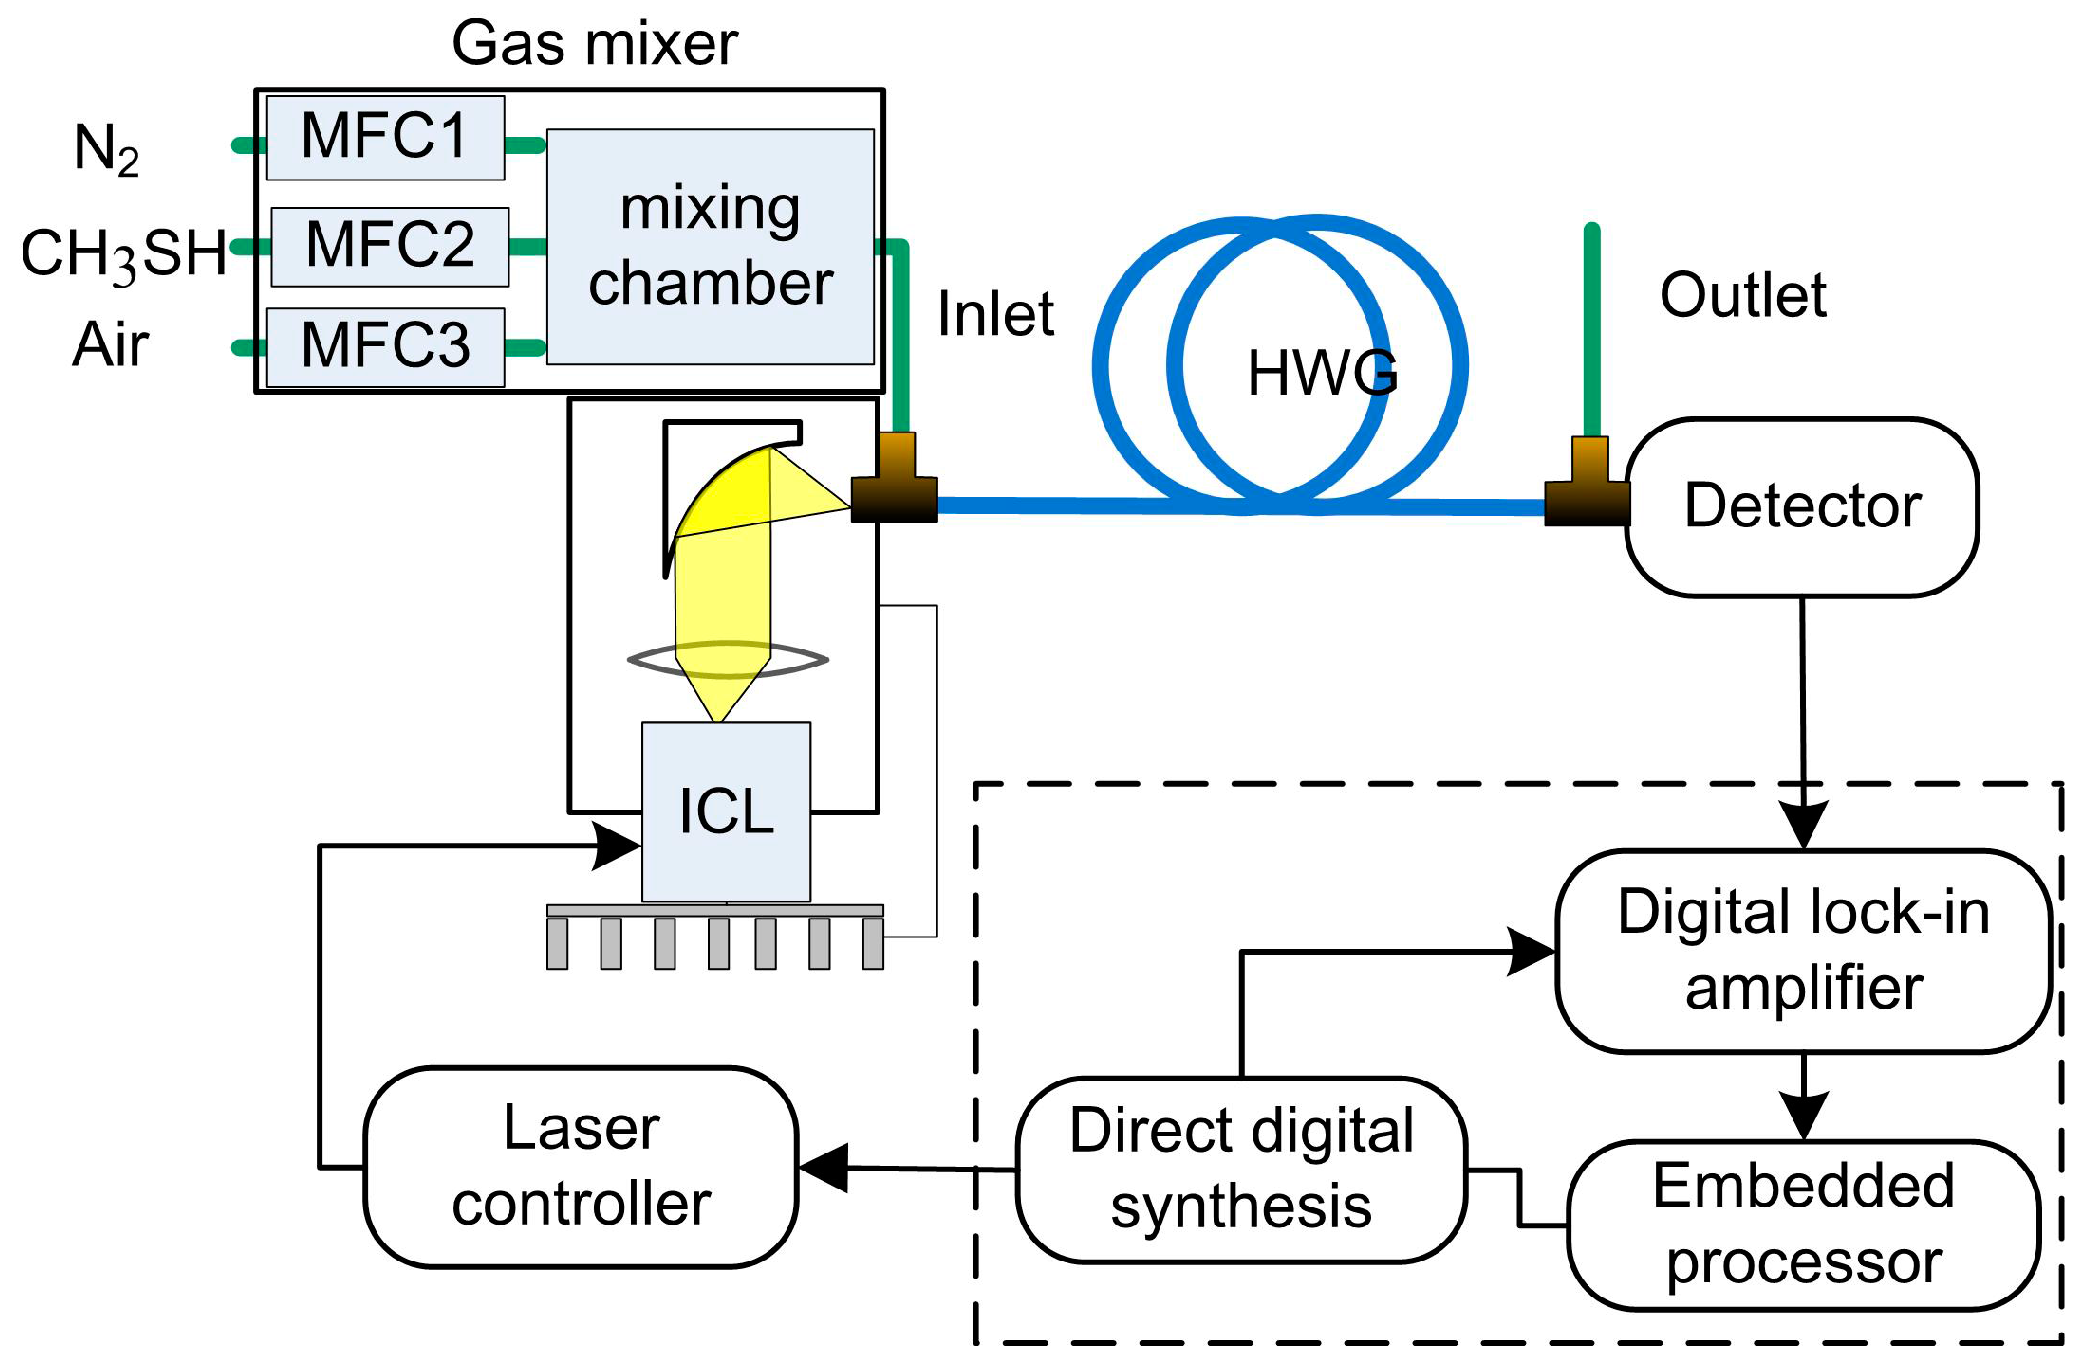
The sensor mainly comprised a 3392 nm ICL (Nanoplus GmbH, Gerburnn, Germany) as the optical source, a hollow waveguide (HWG, Polymicro Technologies, Brookfield, Illinois, USA, Type HWEA10001600) as the gas cell, a laser controller (ILX Lightwave, Irvine, CA, USA, LDC-3908), a photodetector (Thorlabs, Newton, NJ, USA, PDA20H-EC), and a homemade digital lock-in amplifier (DLIA) (
Figure 3). The DLIA contained a direct digital synthesizer, a phase sensitive detector, a digital low-pass filter with selectable order and time constant, and an embedded processor. The laser was placed in a homemade laser mount, and both the temperature and the current of the laser were controlled by the laser controller. The beam emitted from the ICL was collimated with an aspheric lens, coupled into the HWG by an off-axis parabolic mirror, and then collected by the photodetector. The
2f signal was demodulated and processed by the DLIA to obtain the target gas concentration.
The dynamic spectral characteristics of ICLs have been reported to be suitable for precision spectroscopic measurements [
20]. The effective optical path length of the HWG was 5 m and its volume was as small as ~4.7 mL. The injection voltage provided by the direct digital synthesizer in the DLIA was composed of a 10 Hz sawtooth ramp summed in an adder with a 2.56 kHz sine wave to obtain wavelength modulation. A period of the sine wave was made up of 256 sample points, which was determined by the direct digital synthesizer in the DLIA. The frequency of the sine wave should be an integral multiple of 256 to ensure the phase synchronization of the sawtooth and sine wave. Considering the 10 kHz bandwidth of the photodetector, a 2.56 kHz saw wave was chosen. Because of the band absorption of CH
3SH, the modulation depth cannot be chosen accurately. After the pre-experiment was carried out, the amplitude of the sine wave was set at 25 mV, corresponding to the modulation depth of 0.15 nm [
21], while the amplitude of CH
3SH
2f signal peak reached its maximum. According to the pre-experiment, 18 dB/oct and a 10 ms time constant of the digital low-pass filter in the DLIA were selected. The average of ten
2f signal readings was used to determine the concentration corresponding to the temporal resolution of 1 s.
4. Results and Discussion
To obtain the reference signals for fitting according to the algorithm discussed in
Section 2, the
2f signals of CH
3SH, CH
4 and H
2O were measured with the experimental system (
Figure 3). The flow rate of all gas samples was controlled by a mass flow controller (MFC, Type 8715, Burkert Inc., Shanghai, China) and set to 500 mL/min. The HWG was first filled with N
2 and then with a reference gas. Because the HWG volume was small (~4.7 mL), the reference gas immediately filled the HWG within 1 s and the etalon fringes were unable to change. Therefore, the differences between the
2f signals of the reference gases and N
2 could be used as reference signals that were free of etalon fringes. The reference signals of CH
3SH and CH
4 were obtained using reference gases with concentrations of 10 ppm and 3 ppm, respectively. In contrast, the reference signal of H
2O was obtained using air with different concentrations of H
2O. The concentration of H
2O in the air was increased by a humidifier, and the difference between the
2f signals of air with high and low concentrations of H
2O was used as the reference signal. There was no specific concentration of the obtained H
2O reference signal; therefore, the measured concentration of H
2O was simply a ratio of the concentration of the H
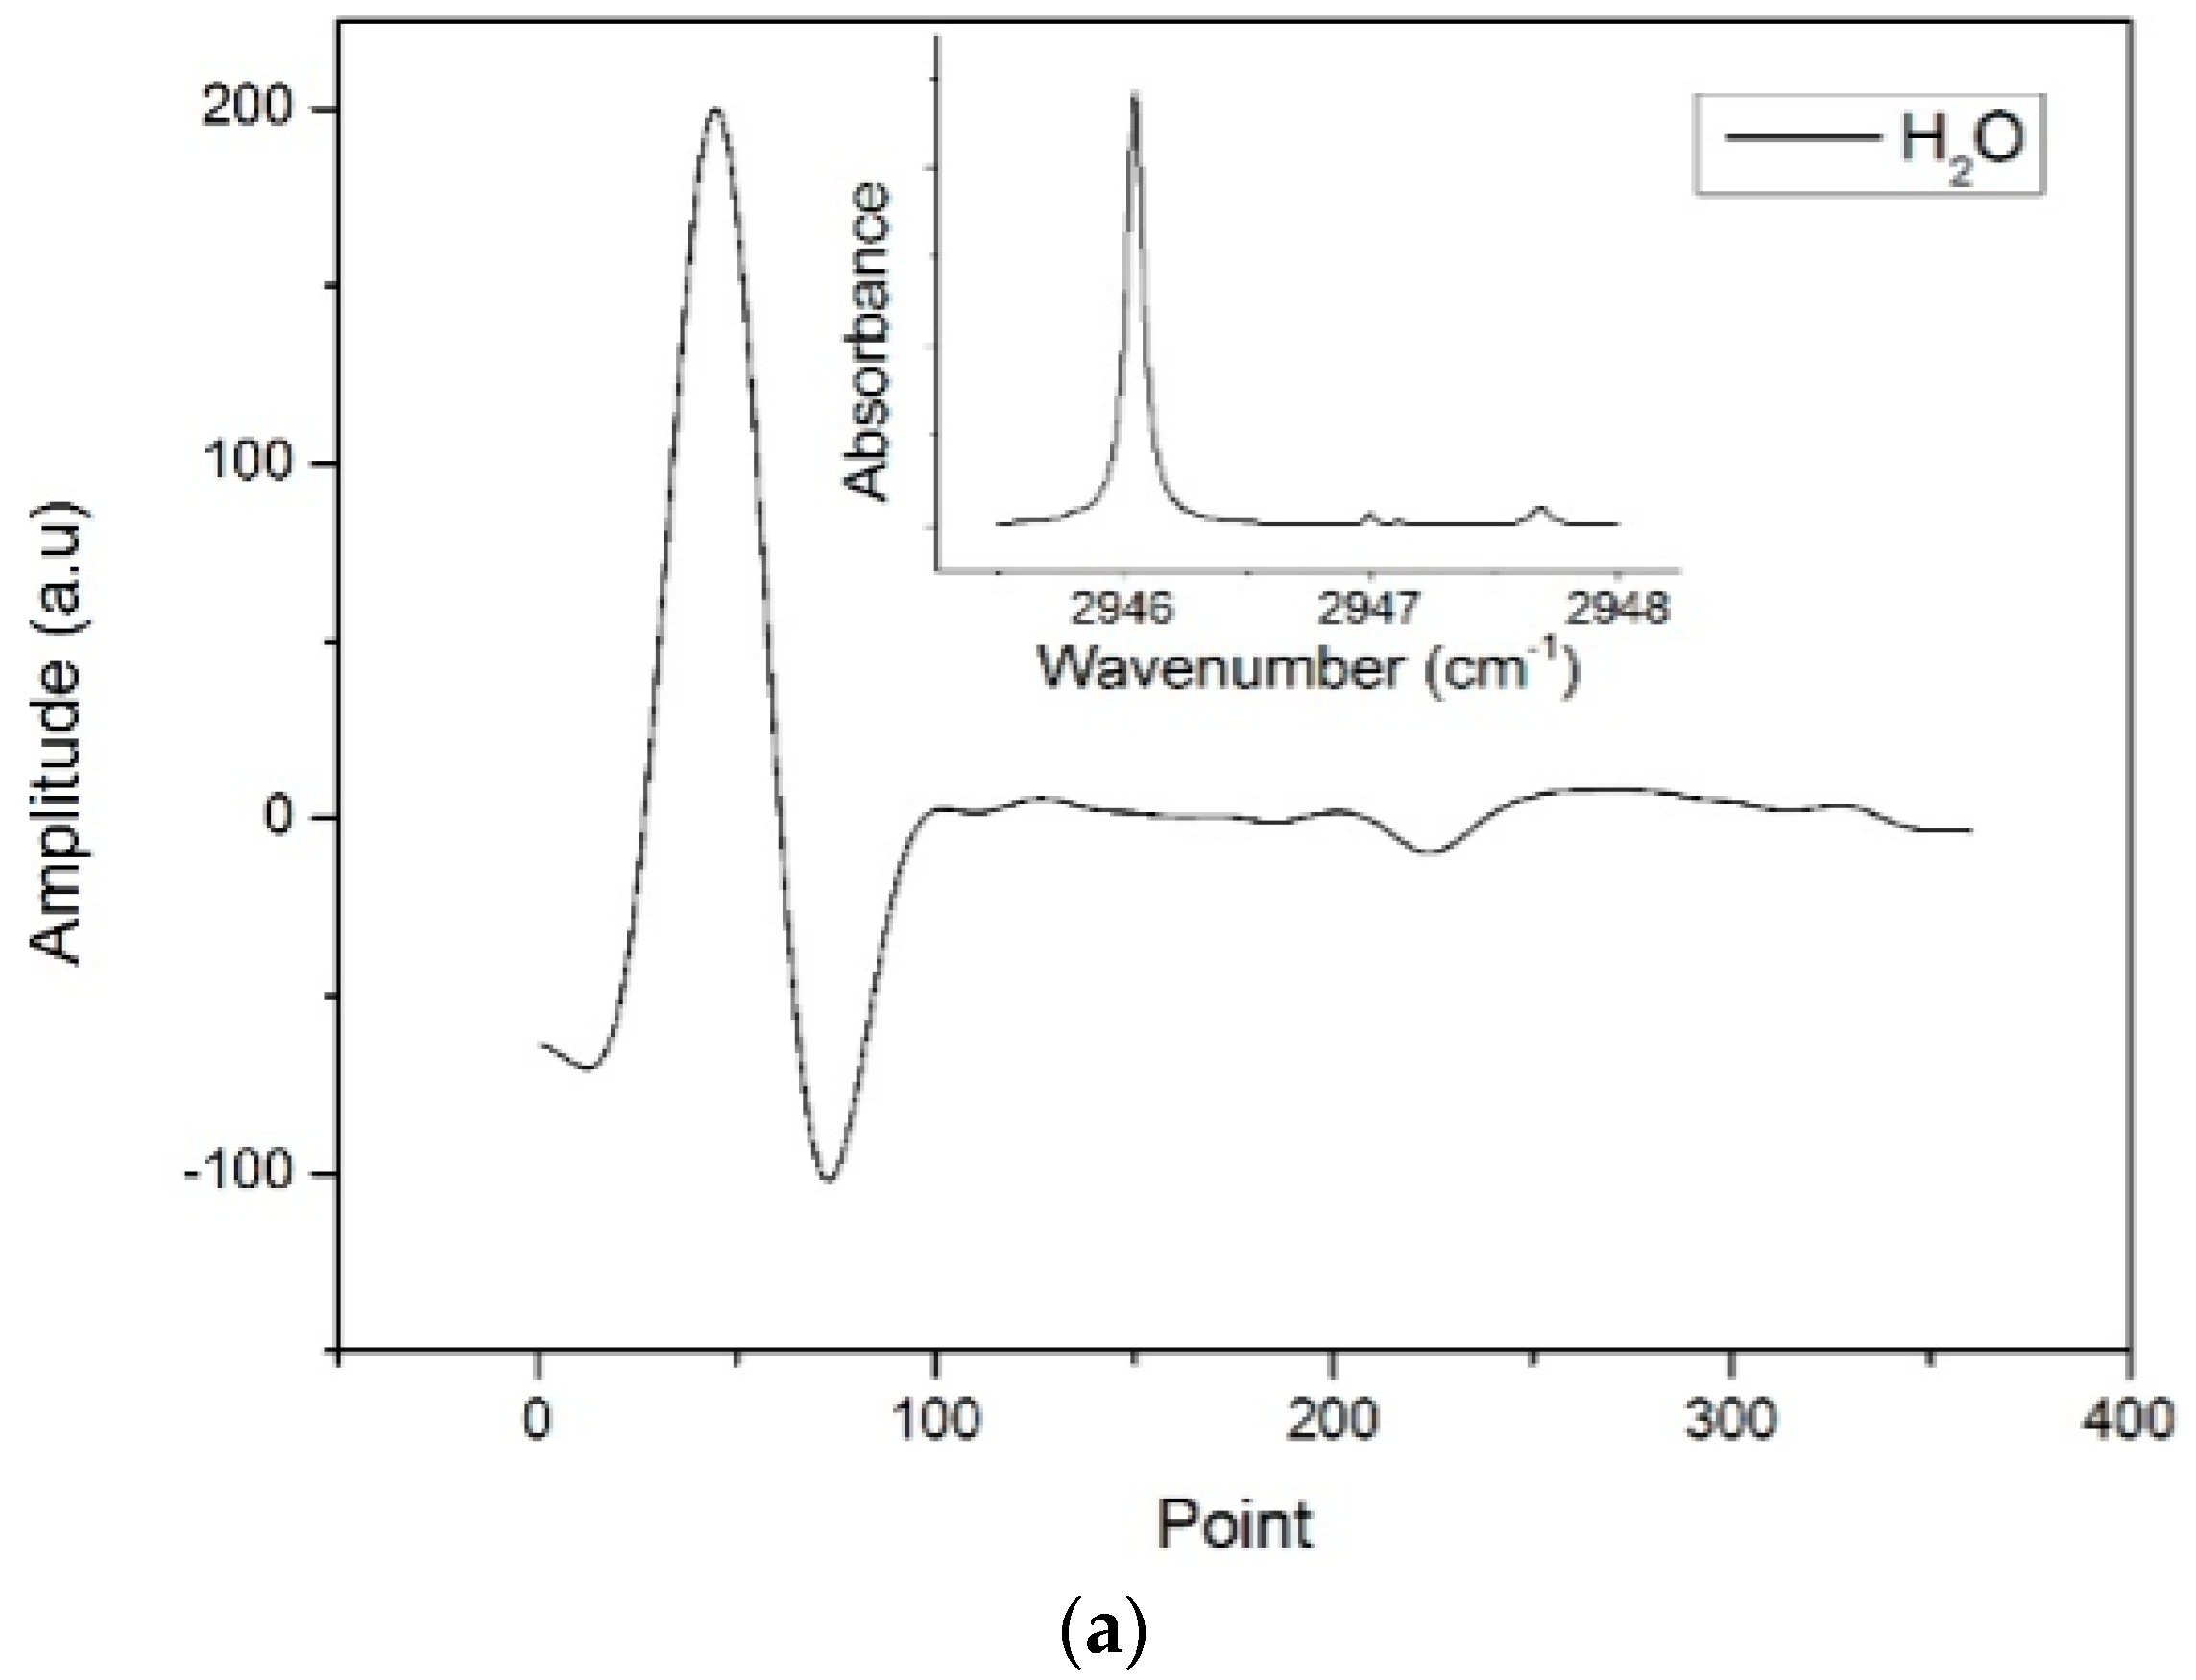
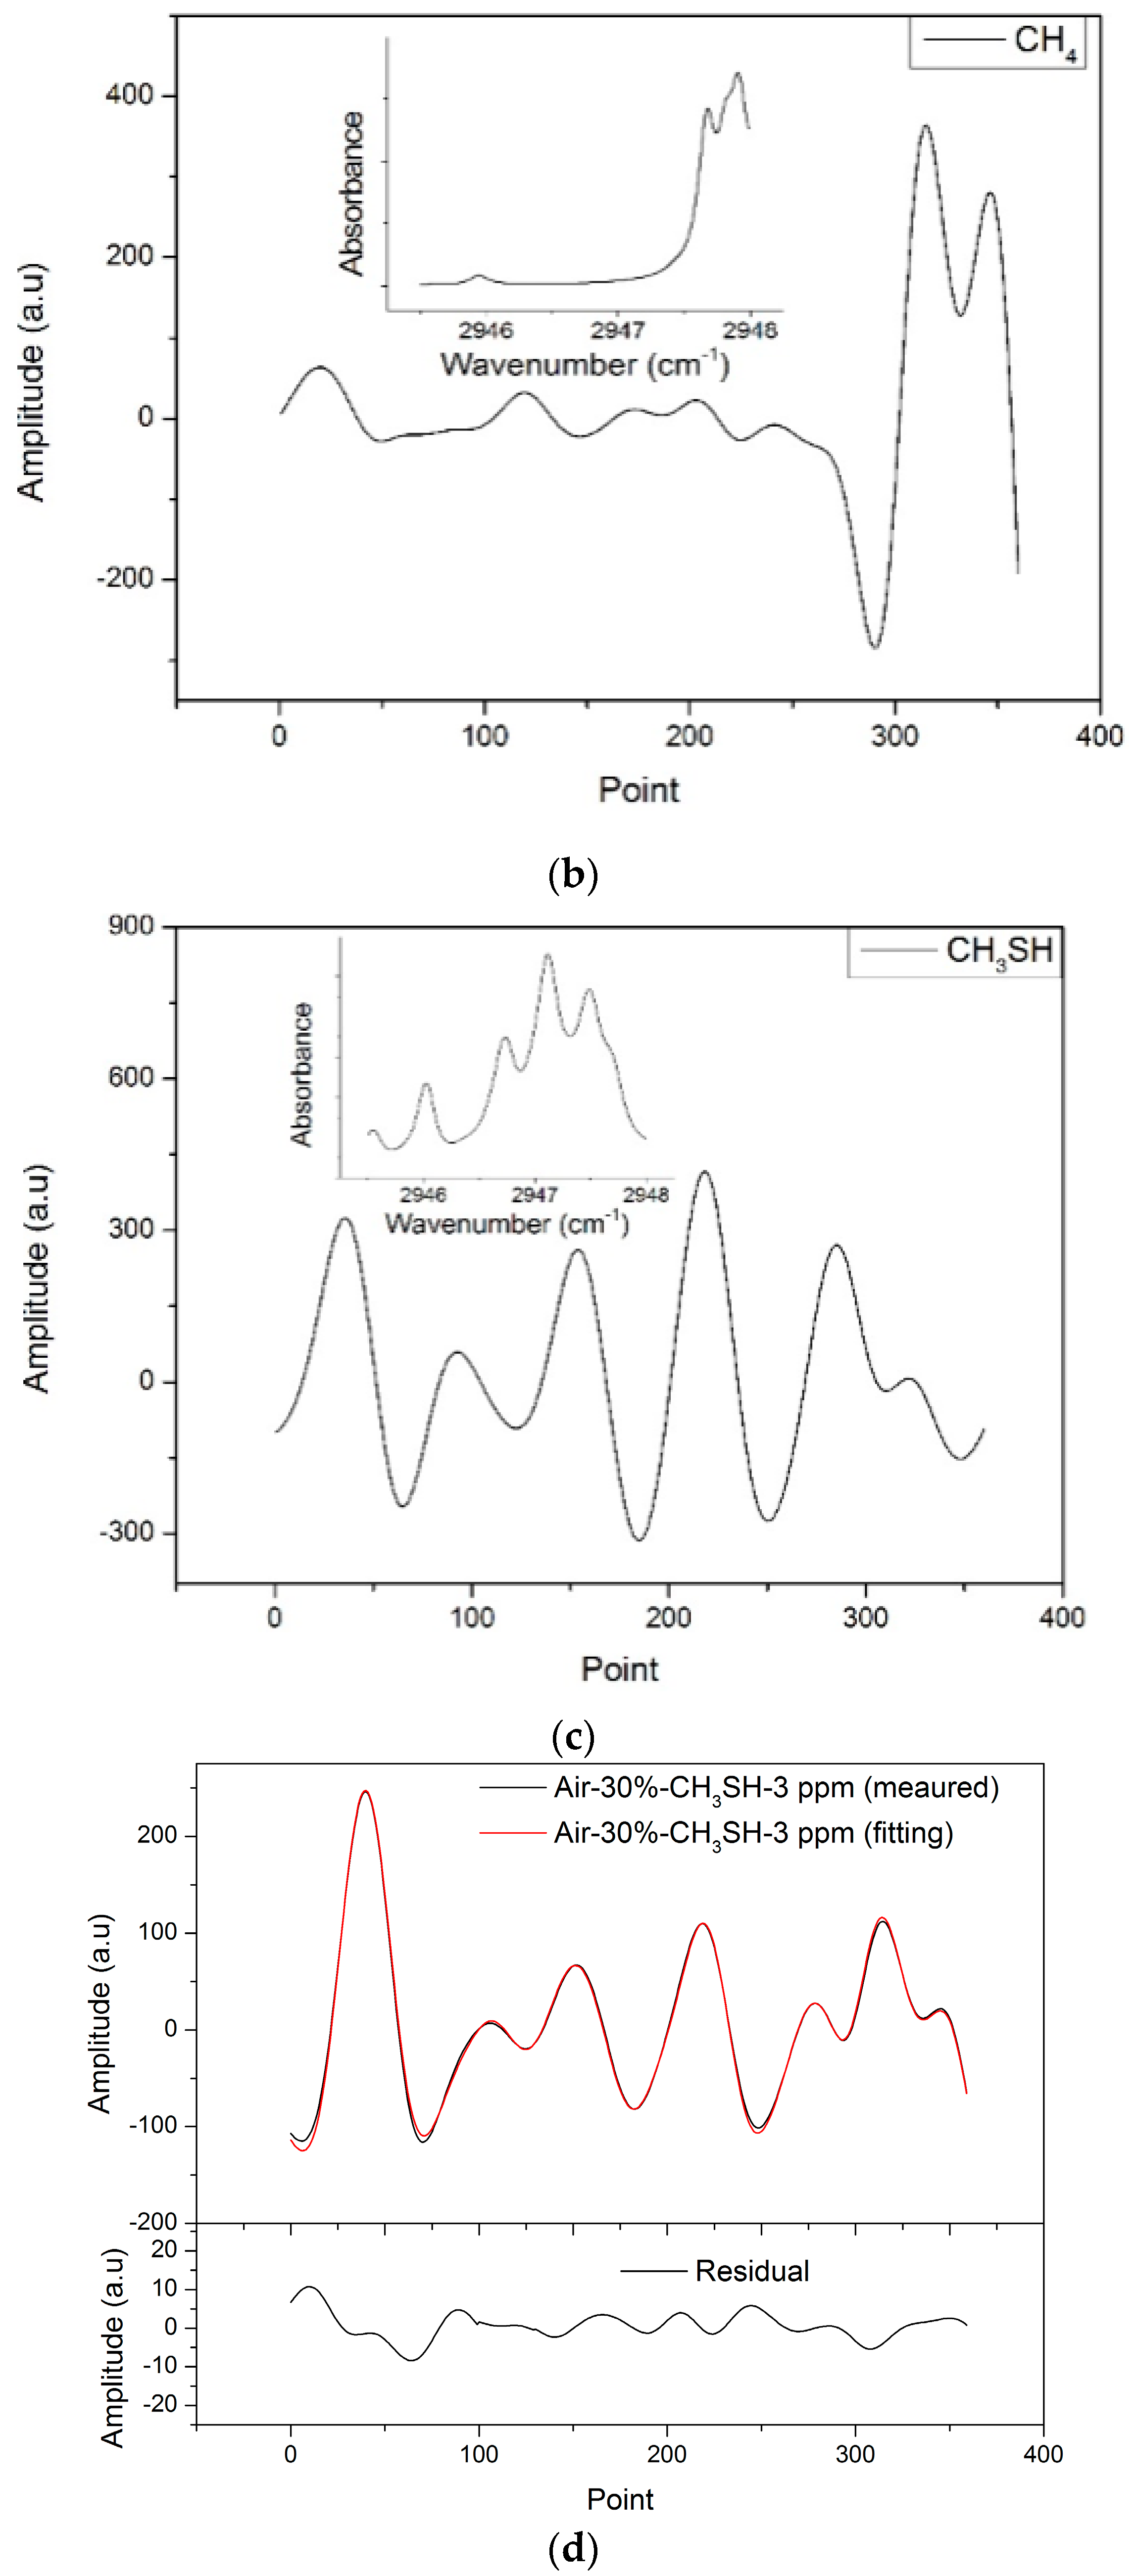
2O reference signals rather than an absolute value. Thus, the reference signals obtained had a high signal–noise ratio (SNR), were free of etalon fringes, and had the tuning characteristics of the laser and the response characteristics of the detector. The measured reference
2f signals and the absorption spectrums in 2945.5–2948 cm
−1 (3392.1–3395 nm) of CH
3SH, CH
4 and H
2O are shown in
Figure 4a–c, respectively.
To verify the validity of the algorithm for detecting atmospheric CH3SH, a series of experiments with CH3SH–air–N2 mixtures were performed. The CH3SH–air–N2 mixtures under study were prepared in a homemade gas mixer. The flows of gas samples were controlled by a homemade gas mixer that consists of three mass flow controllers (MFC, Type 8715, Burkert Inc., Shanghai, China) and were set to 500 mL/min. Two groups of concentration gradient experiments were carried out, between which the gas mixture ratio of CH3SH–air–N2 varied. In one group, the CH3SH concentration ranged from 2 to 20 ppm (in 2 ppm intervals), while the volume of air remained at 50%. In the second group, the volume fraction of air ranged from 10% to 70% (in 20% intervals), while the CH3SH concentration was fixed at 3 ppm. Each mixture was measured 10 times. The peak absorptions of all the mixtures were estimated to be less than 0.05, and the optically thin condition of WMS was satisfied. Thus, there was a linearly proportional relationship between gas concentration and the 2f signal. All experiments were carried out with flowing gas samples in room temperature.
Figure 4d shows an example of the measured
2f signal fitted by the simulated
2f signal. The fitting residual in the measurement of a CH
3SH(3 ppm)–air(30%)–N
2 mixture is addressed. The simulated
2f signal agrees well with the measured
2f signal. The residual is less than 5%, which mostly consists of etalon fringes and residual amplitude modulation.
4.1. Accuracy
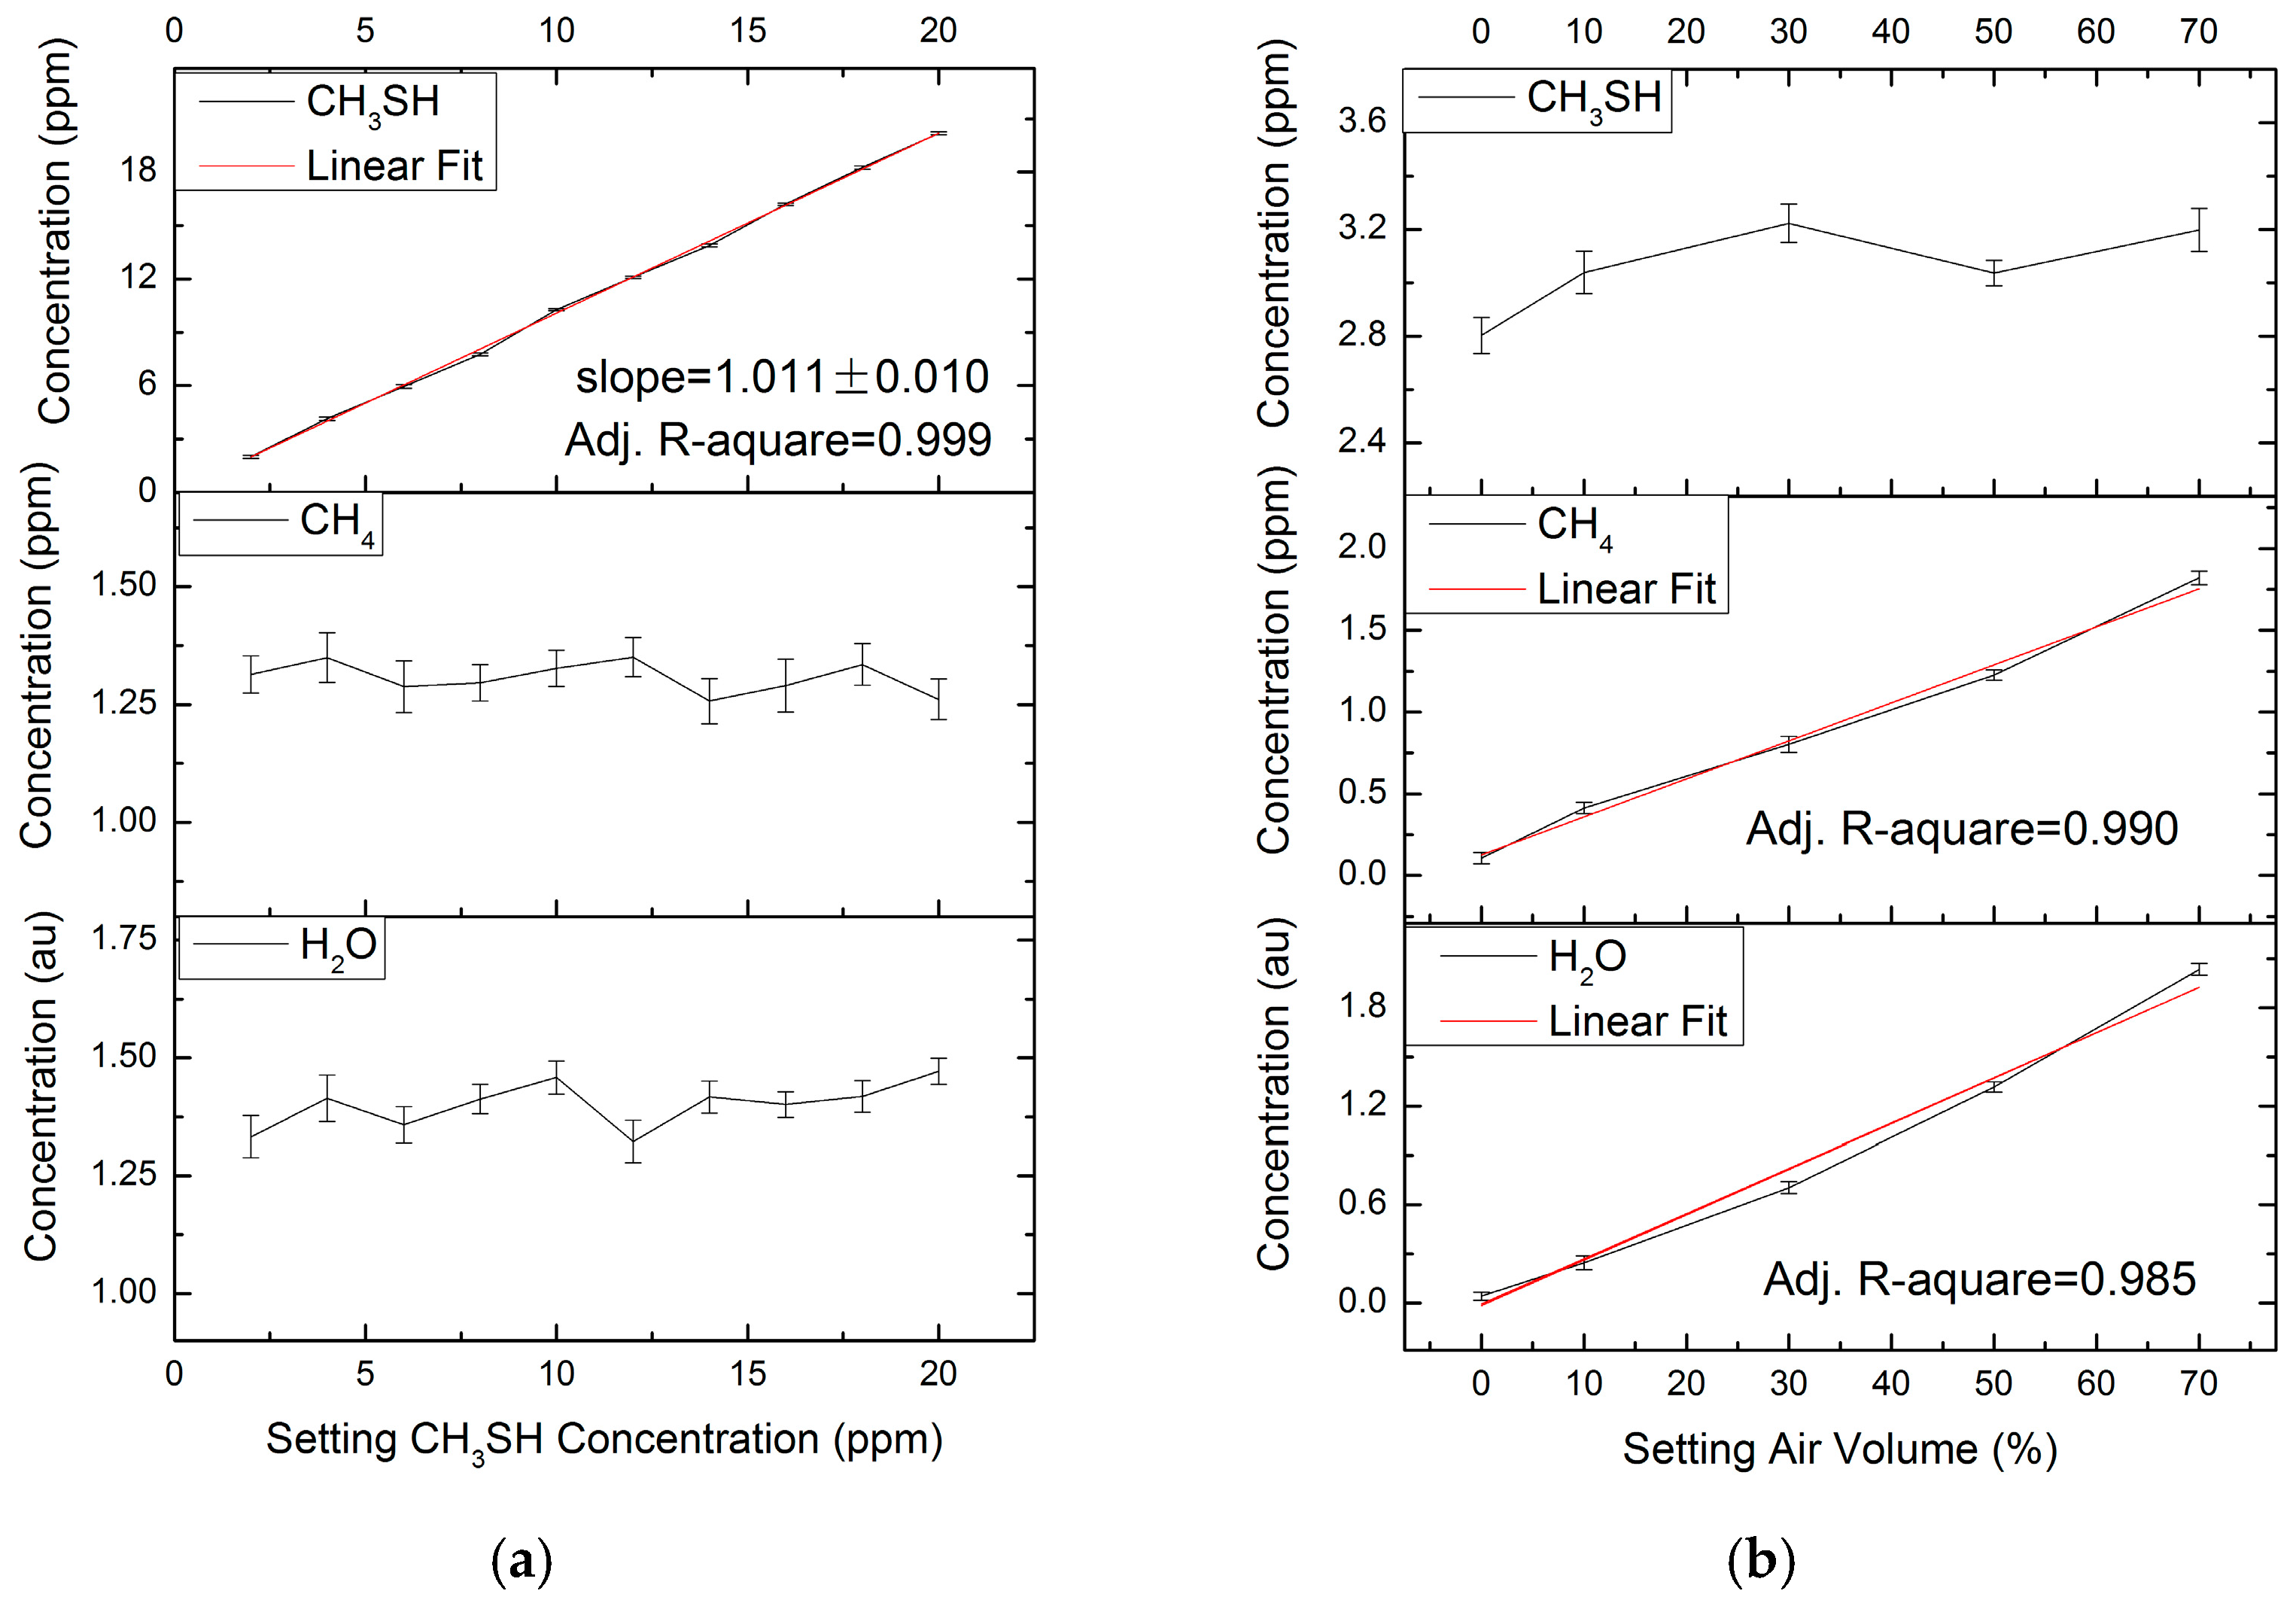
The average and standard deviation of measured concentrations of CH
3SH, CH
4 and H
2O in the two groups are shown in
Figure 5a,b. The measured concentrations of CH
3SH are in good agreement with the setting concentrations, with a linearity of 0.999 (
Figure 5a). The accuracy of the CH
3SH measurement is 1.1%, which can be deduced from the linear fitted slopes of 1.011 ± 0.010. The measured concentrations of H
2O and CH
4 are 1.307 ± 0.0954 arbitrary unit (au)and 1.401 ± 0.186 ppm, respectively. As shown in
Figure 5b, the measured concentrations of H
2O and CH
4 agree closely with the setting volume fraction of air, with good linearity. The standard deviations of measured concentrations of CH
3SH are no more than 0.1 ppm.
4.2. Uncertainty
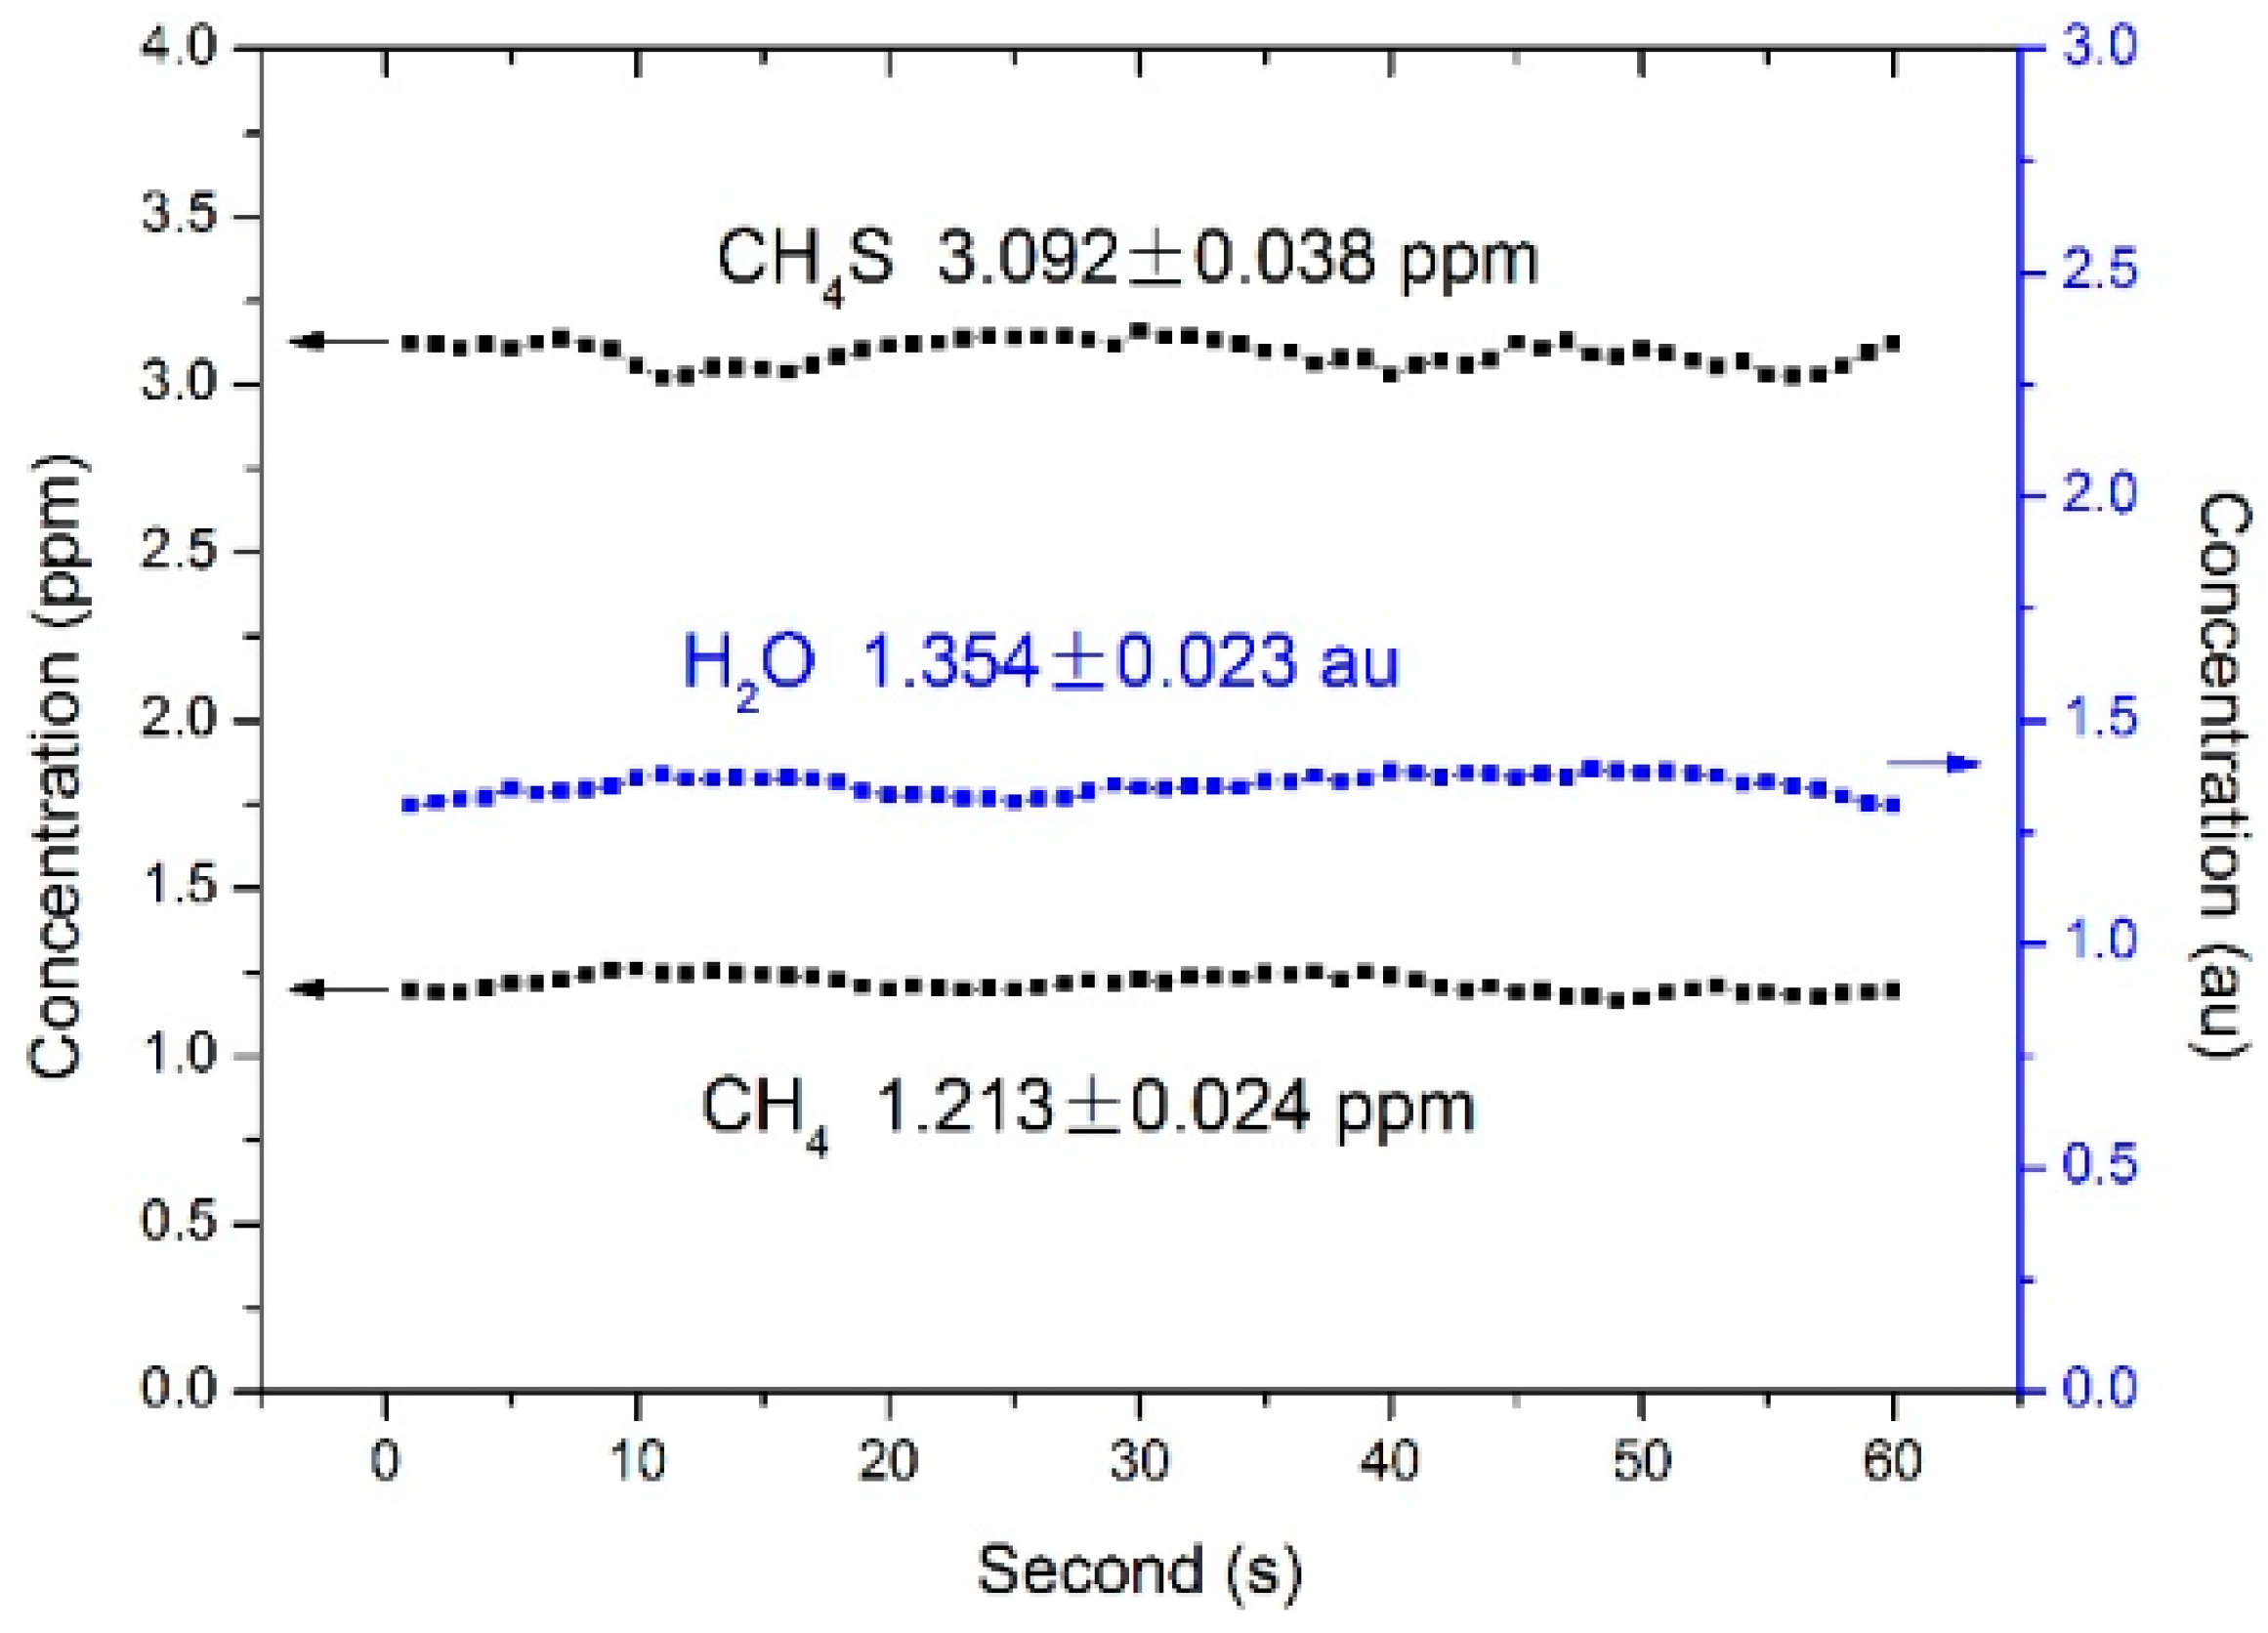
Sixty successive measurements with 1 s intervals were performed with the flowing gas sample of 3 ppm CH
3SH, 50% air fraction, and N
2. The measurements yielded average concentration values of 3.092 ± 0.038 ppm, 1.213 ± 0.024 ppm, and 1.354 ± 0.023 au for CH
3SH, H
2O, and CH
4, respectively, indicating corresponding precisions of 1.2%, 1.7% and 2.0% for the concentration measurements of the sensor (
Figure 6).
The error in the concentration measurements can primarily be attributed to the uncertainties in the concentrations of CH3SH, CH4 and H2O during the preparation of the mixtures, while the uncertainty of the home-made gas mixer is 1.4%. Although the reference 2f signal had a high signal–noise ratio and was free of etalon fringes, the random noise in the reference signal also influenced the uncertainties of the results, while the etalon fringes in the gas mixture 2f signal contributed to the uncertainty as well. The uncertainties of H2O and CH4 were also caused by the concentration fluctuation of H2O and CH4 in the atmosphere.
4.3. Detection Limit
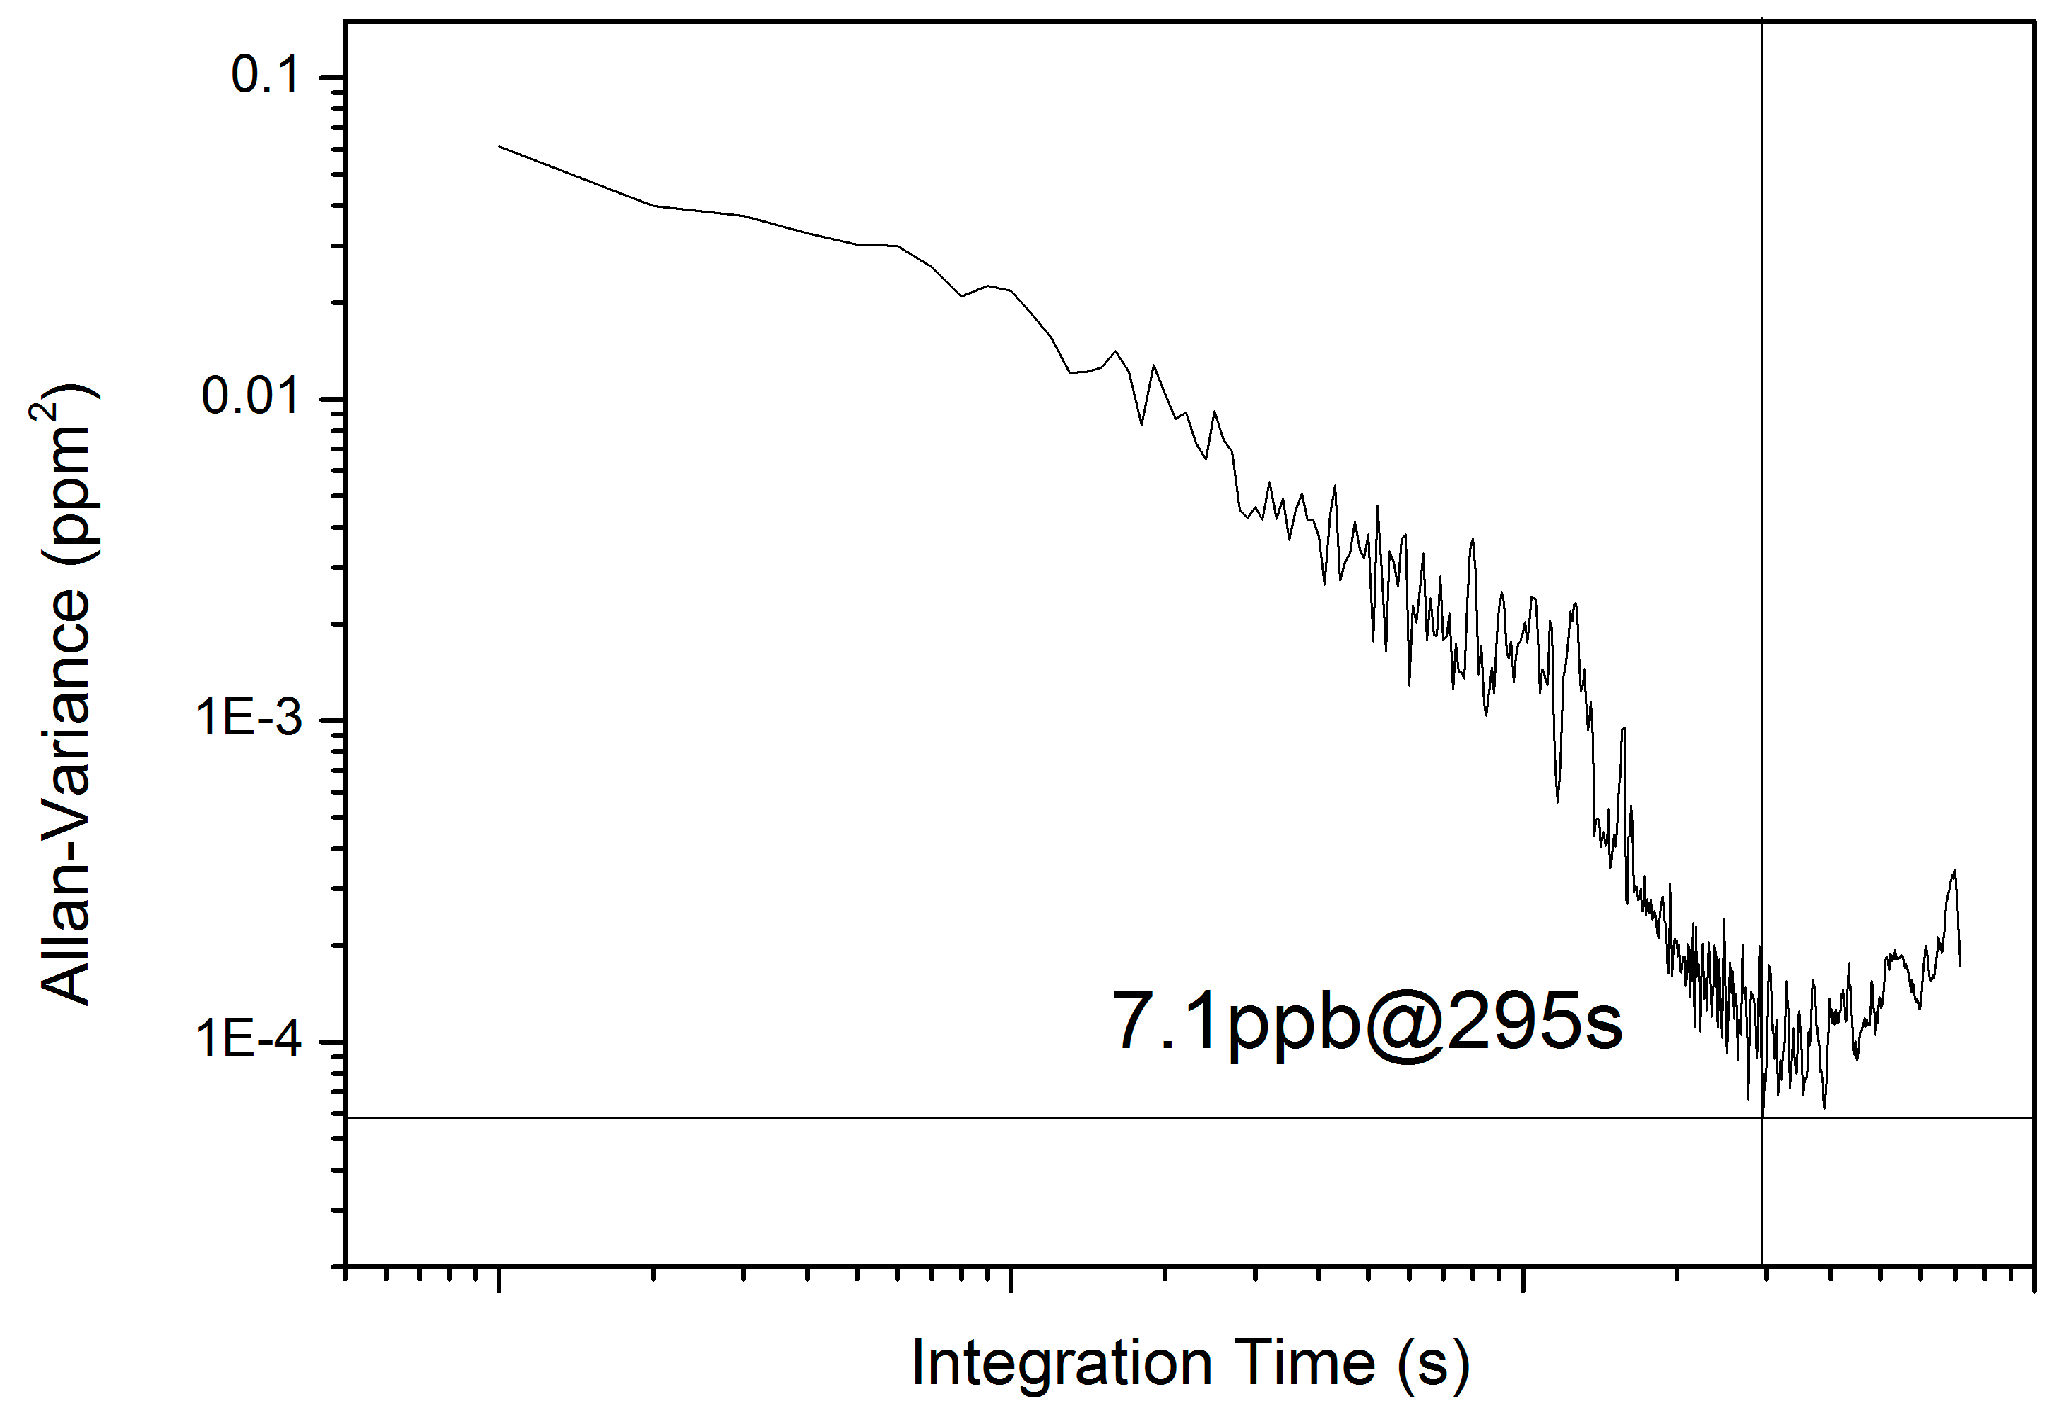
Forty min continuous measurements of 10 ppm CH
3SH in flow mode were performed to calculate the Allan variance. The results indicate that the sensor achieved a detection limit of 7.1 ppb with an optimal integration time of 295 s (
Figure 7), which corresponds to an absorbance of 3.6 × 10
−5. The detection limit can possibly be further improved by restraining etalon fringes and lengthening the HWG.
5. Conclusions
A high-sensitivity sensor based on WMS with a DFB-ICL as the optical source and an HWG as the gas cell was presented for atmospheric CH
3SH measurement. The multicomponent spectral fitting was used to eliminate the influence of the atmospheric interferents, H
2O and CH
4, in CH
3SH detection. An accuracy of 1.1%, a precision of 1.2%, and a detection limit of 7.1 ppb with an integration time of 295 s confirmed the excellent performance of the sensor for the atmospheric detection of CH
3SH. Combined with a breath tube and a filter fixed on the gas inlet, the sensor can also be applied to CH
3SH detection in exhaled breath for noninvasive diagnosis of relative diseases for the same interfering components with that in the air. While there are some other interferents besides H
2O and CH
4 that influence the detection of CH
3SH, such as ethane [
14] in the measurement environment, they can be eliminated by using the multicomponent spectral fitting introduced in this paper. Moreover, by changing the laser wavelength, the sensor can also be used with mid-infrared absorption features to detect other trace gases. As a versatile gas sensor, it can also be used for the simultaneous measurement of multicomponent gases.


