Highly Selective Polypyrrole MIP-Based Gravimetric and Electrochemical Sensors for Picomolar Detection of Glyphosate


 , , , ,
Abstract
:1. Introduction
2. Materials and Methods
2.1. Chemicals
2.2. Instrumentation
2.2.1. Gravimetric Measurements
2.2.2. Electrochemical Measurements
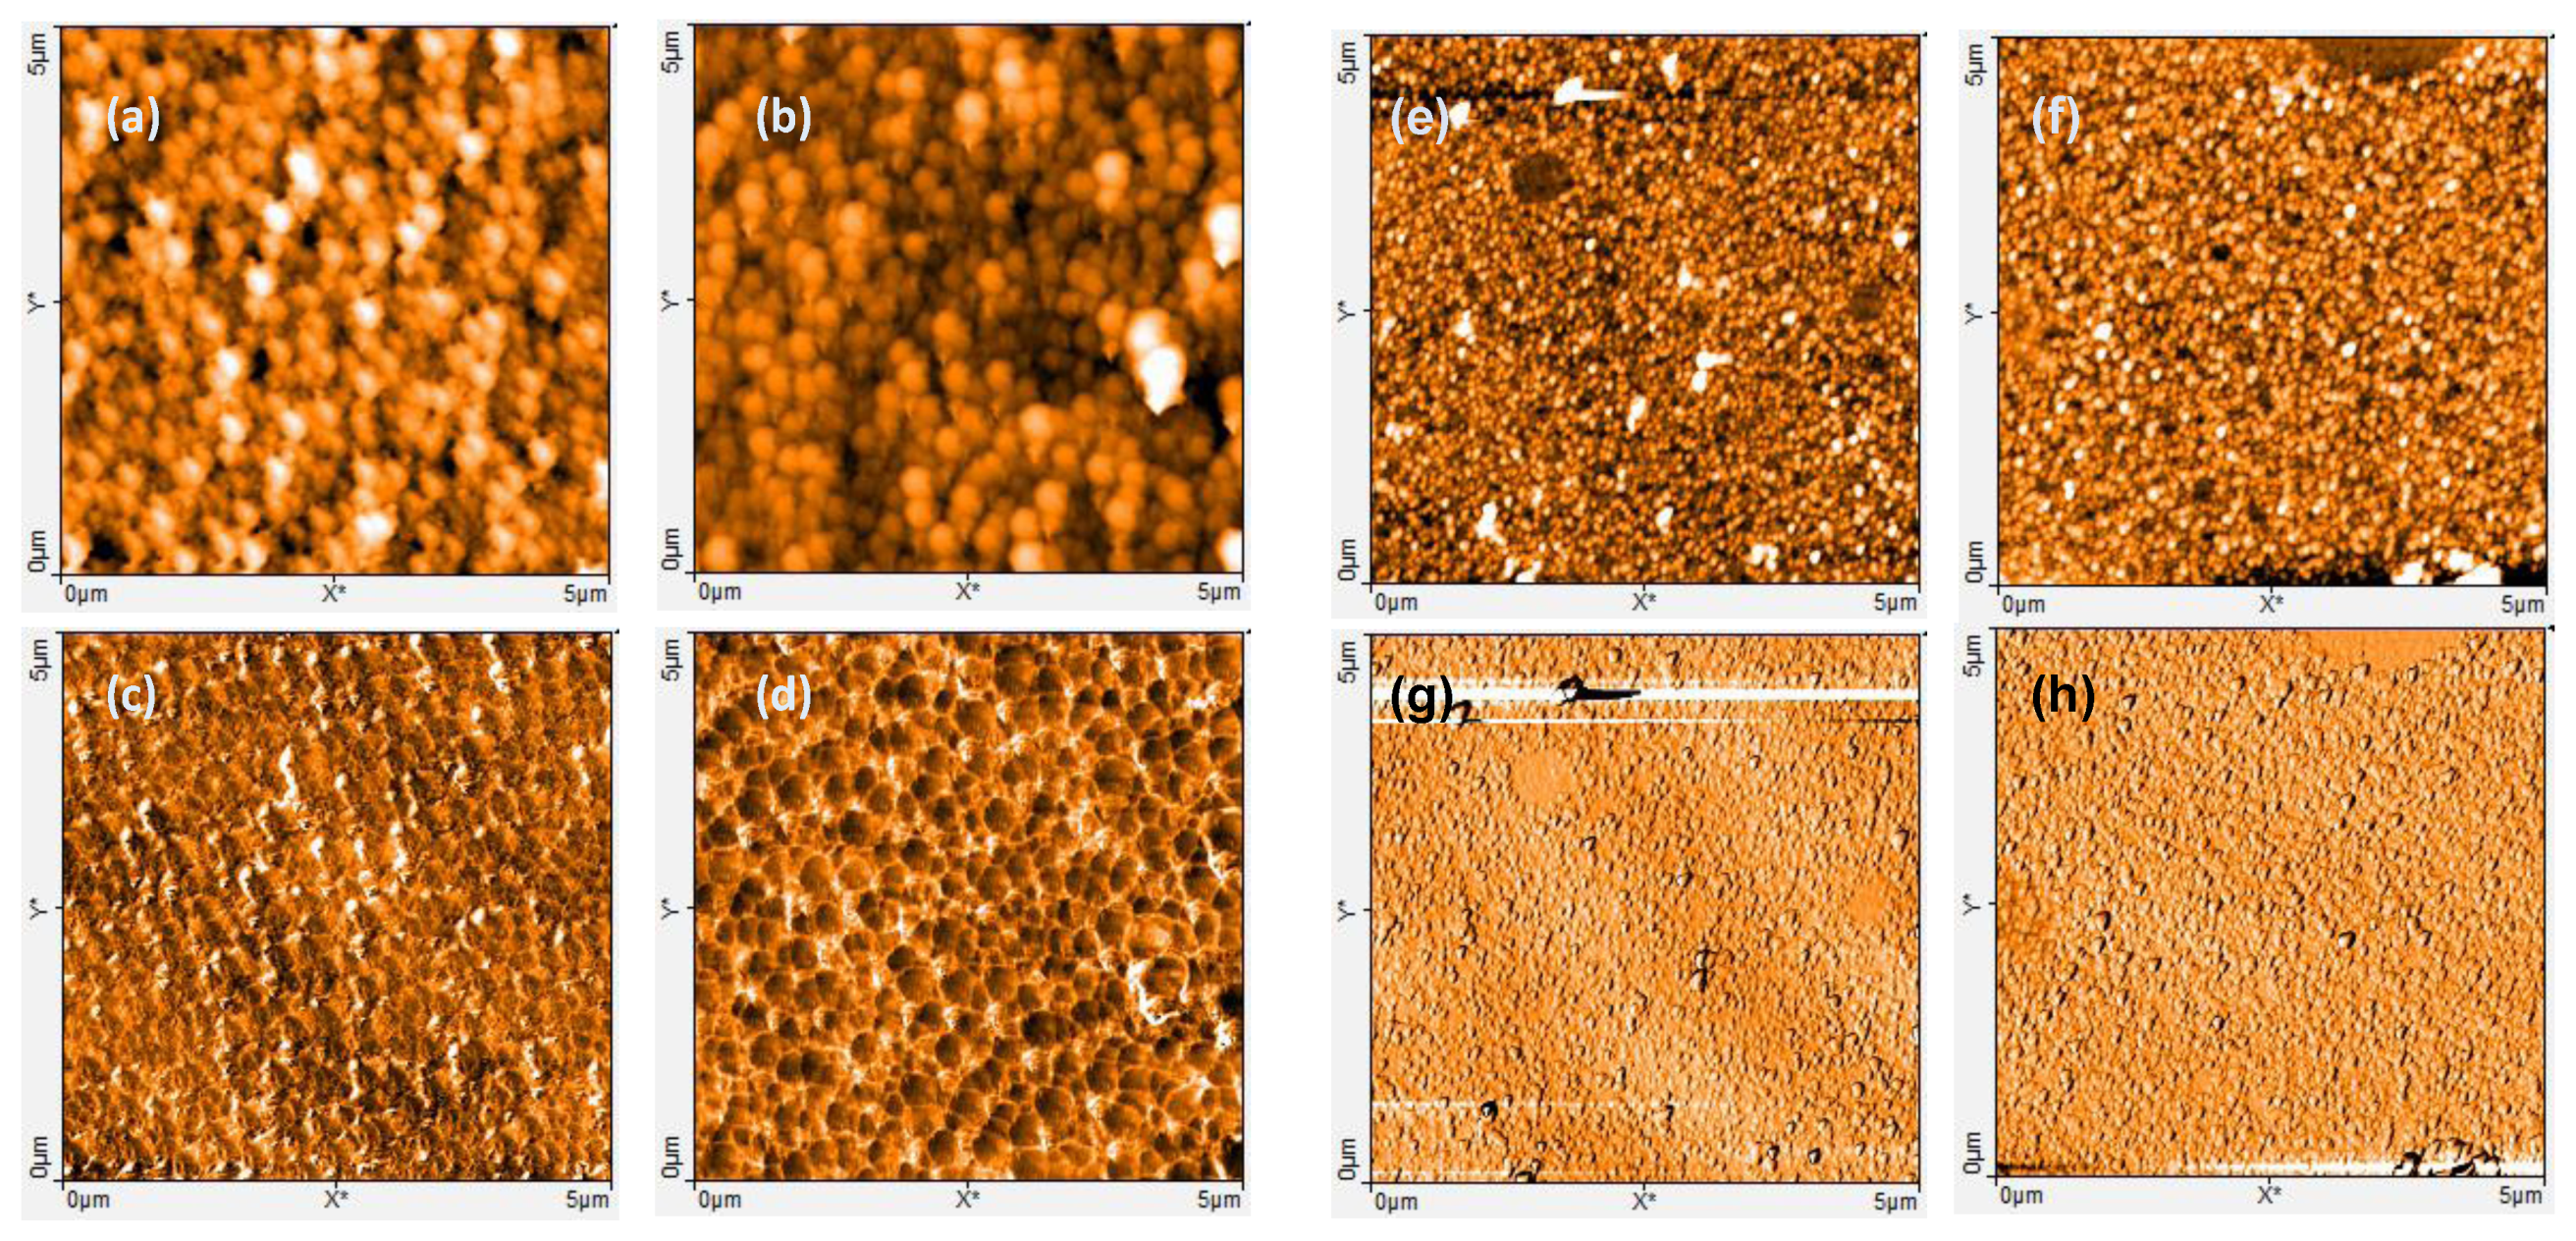
2.2.3. AFM Measurements
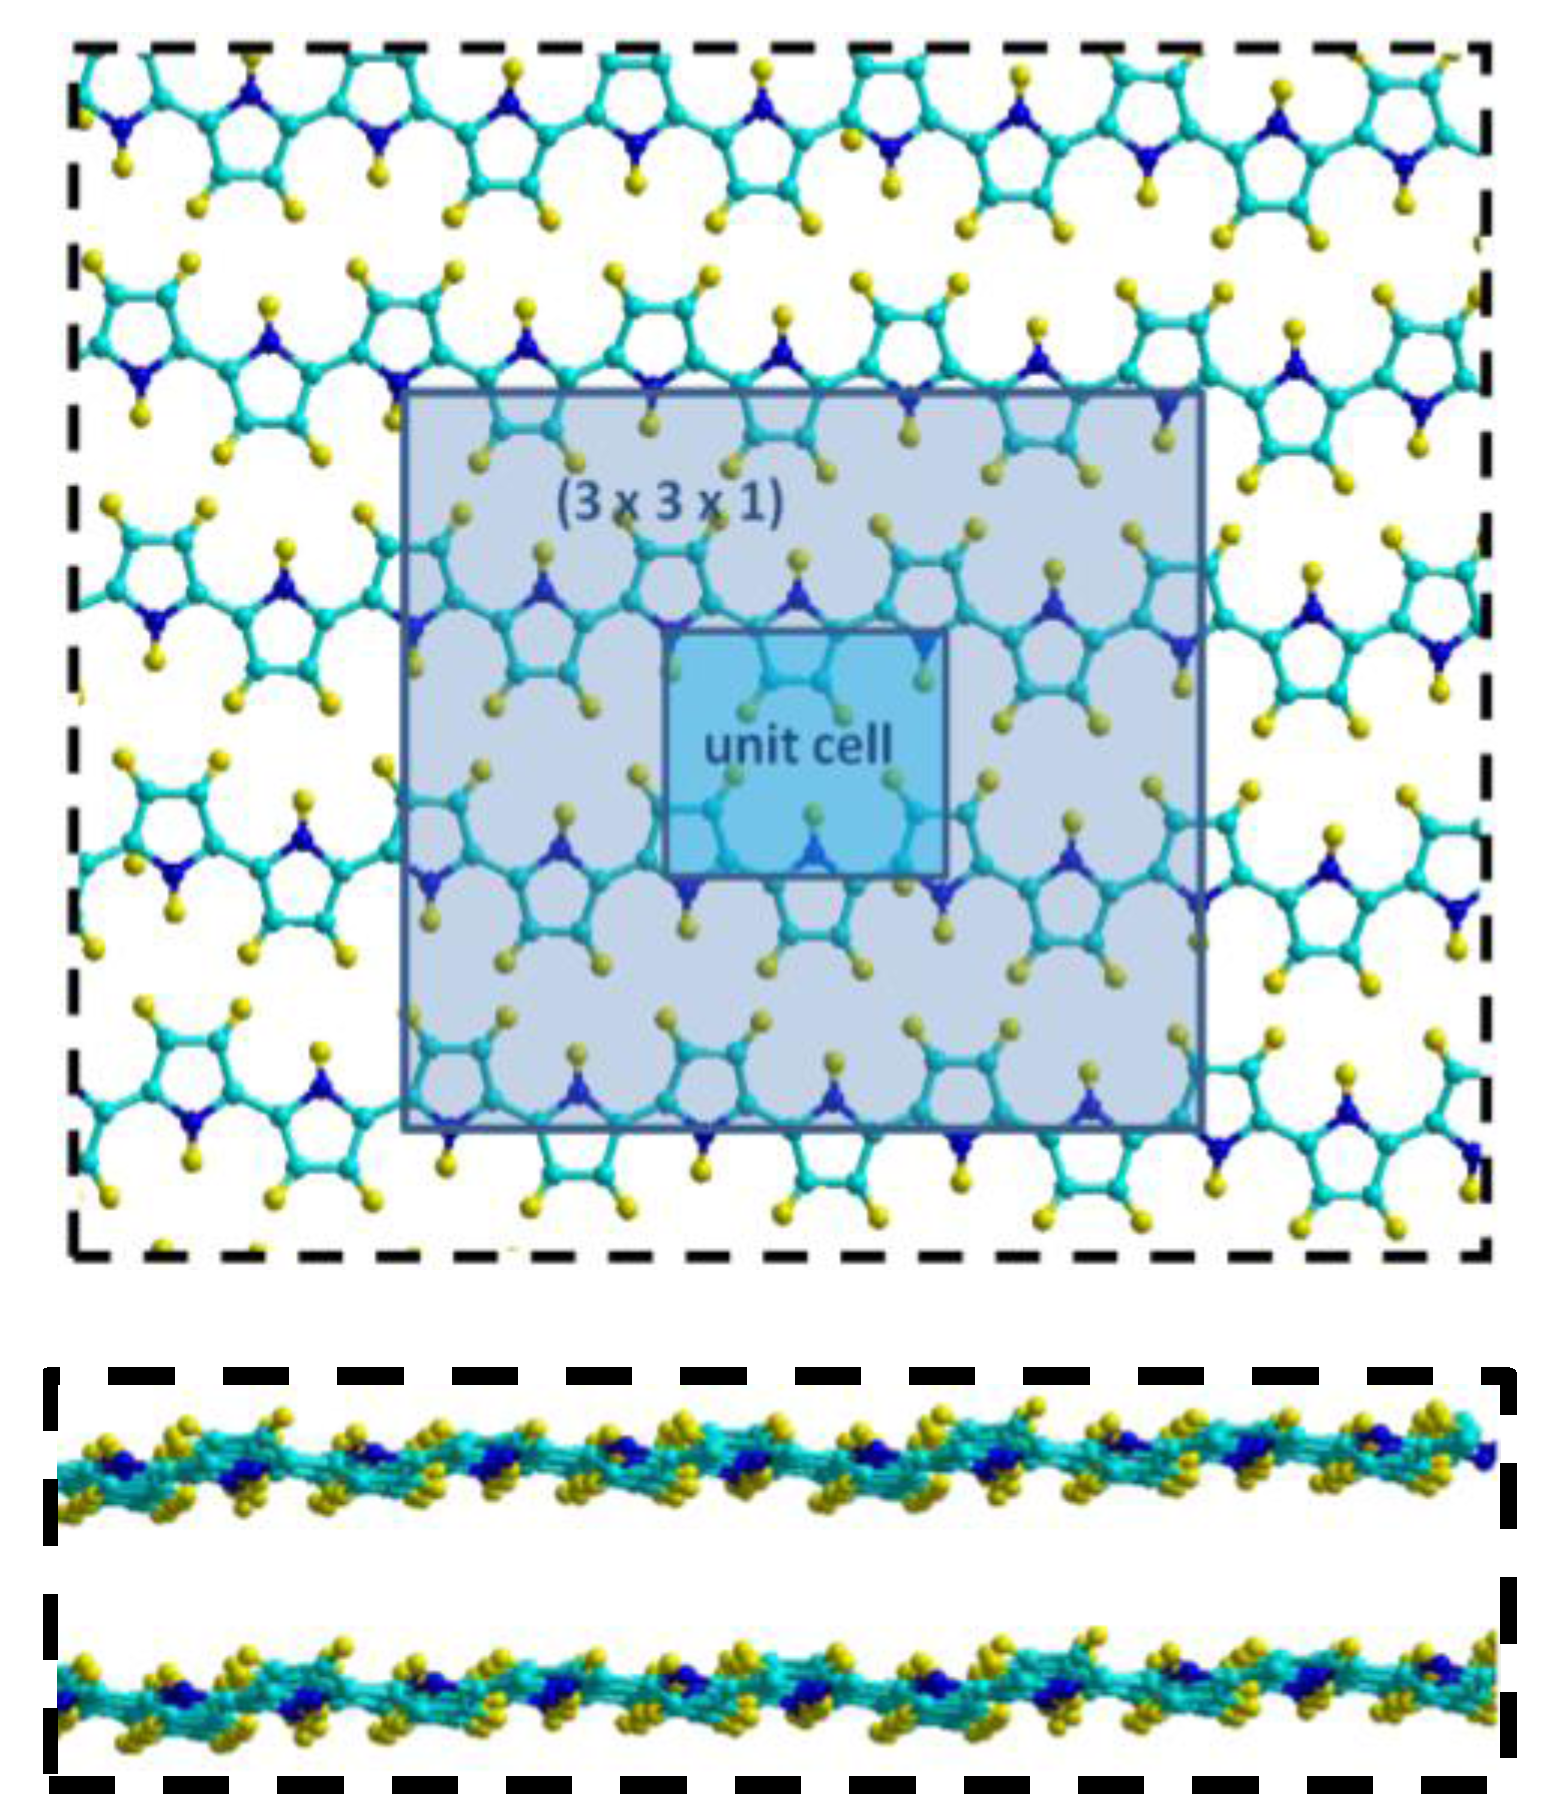
2.2.4. Calculation Methods
3. Results
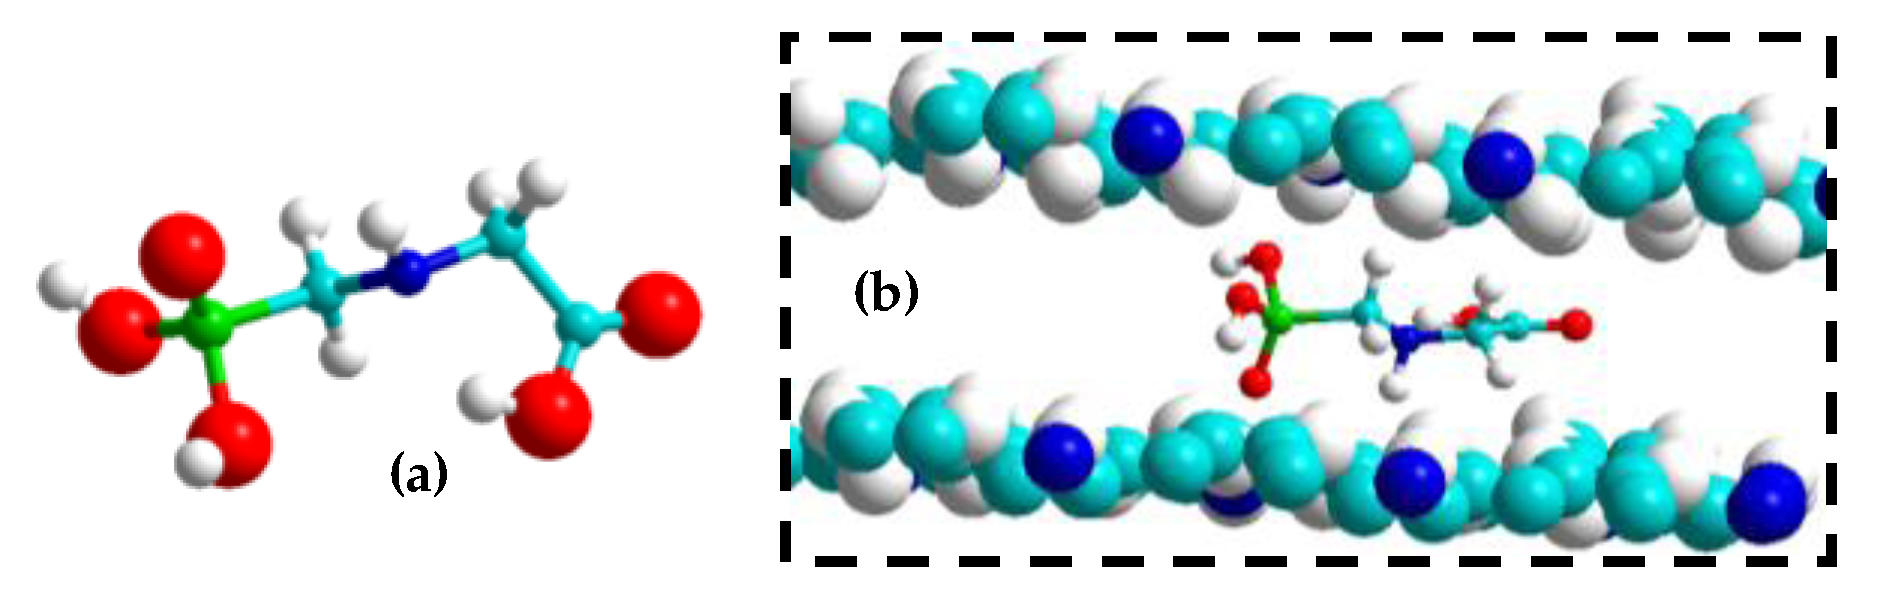
3.1. MIP Design
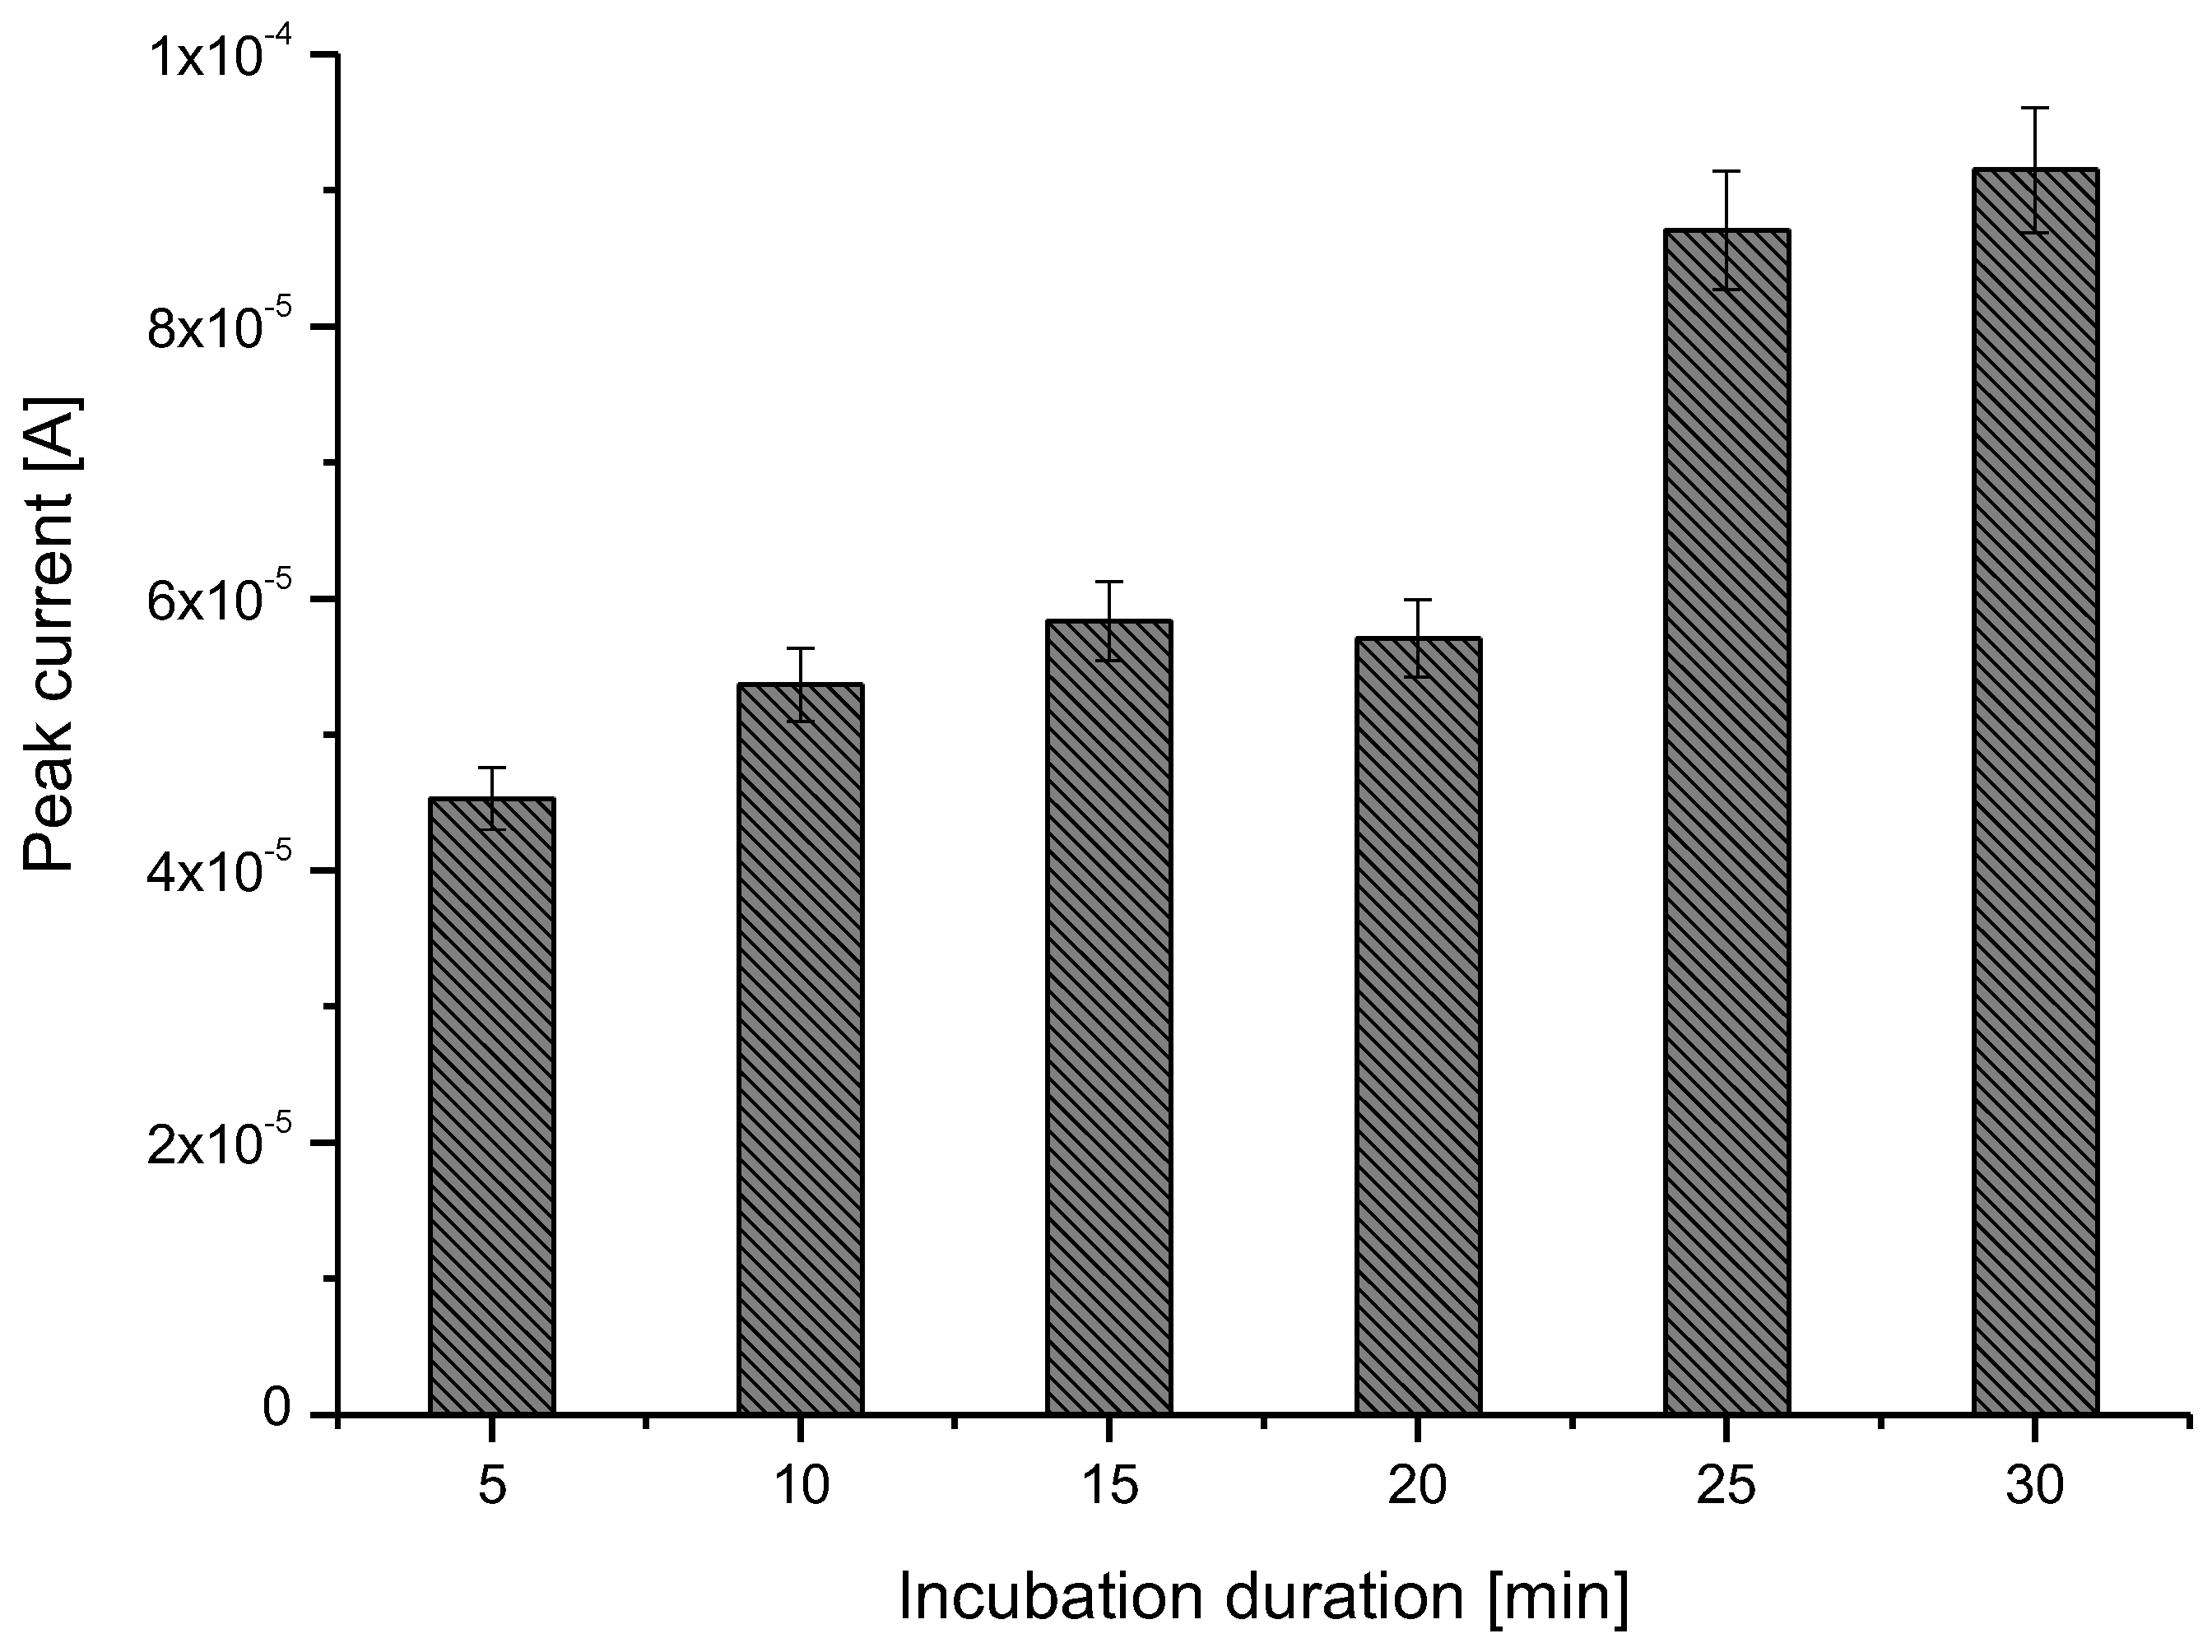
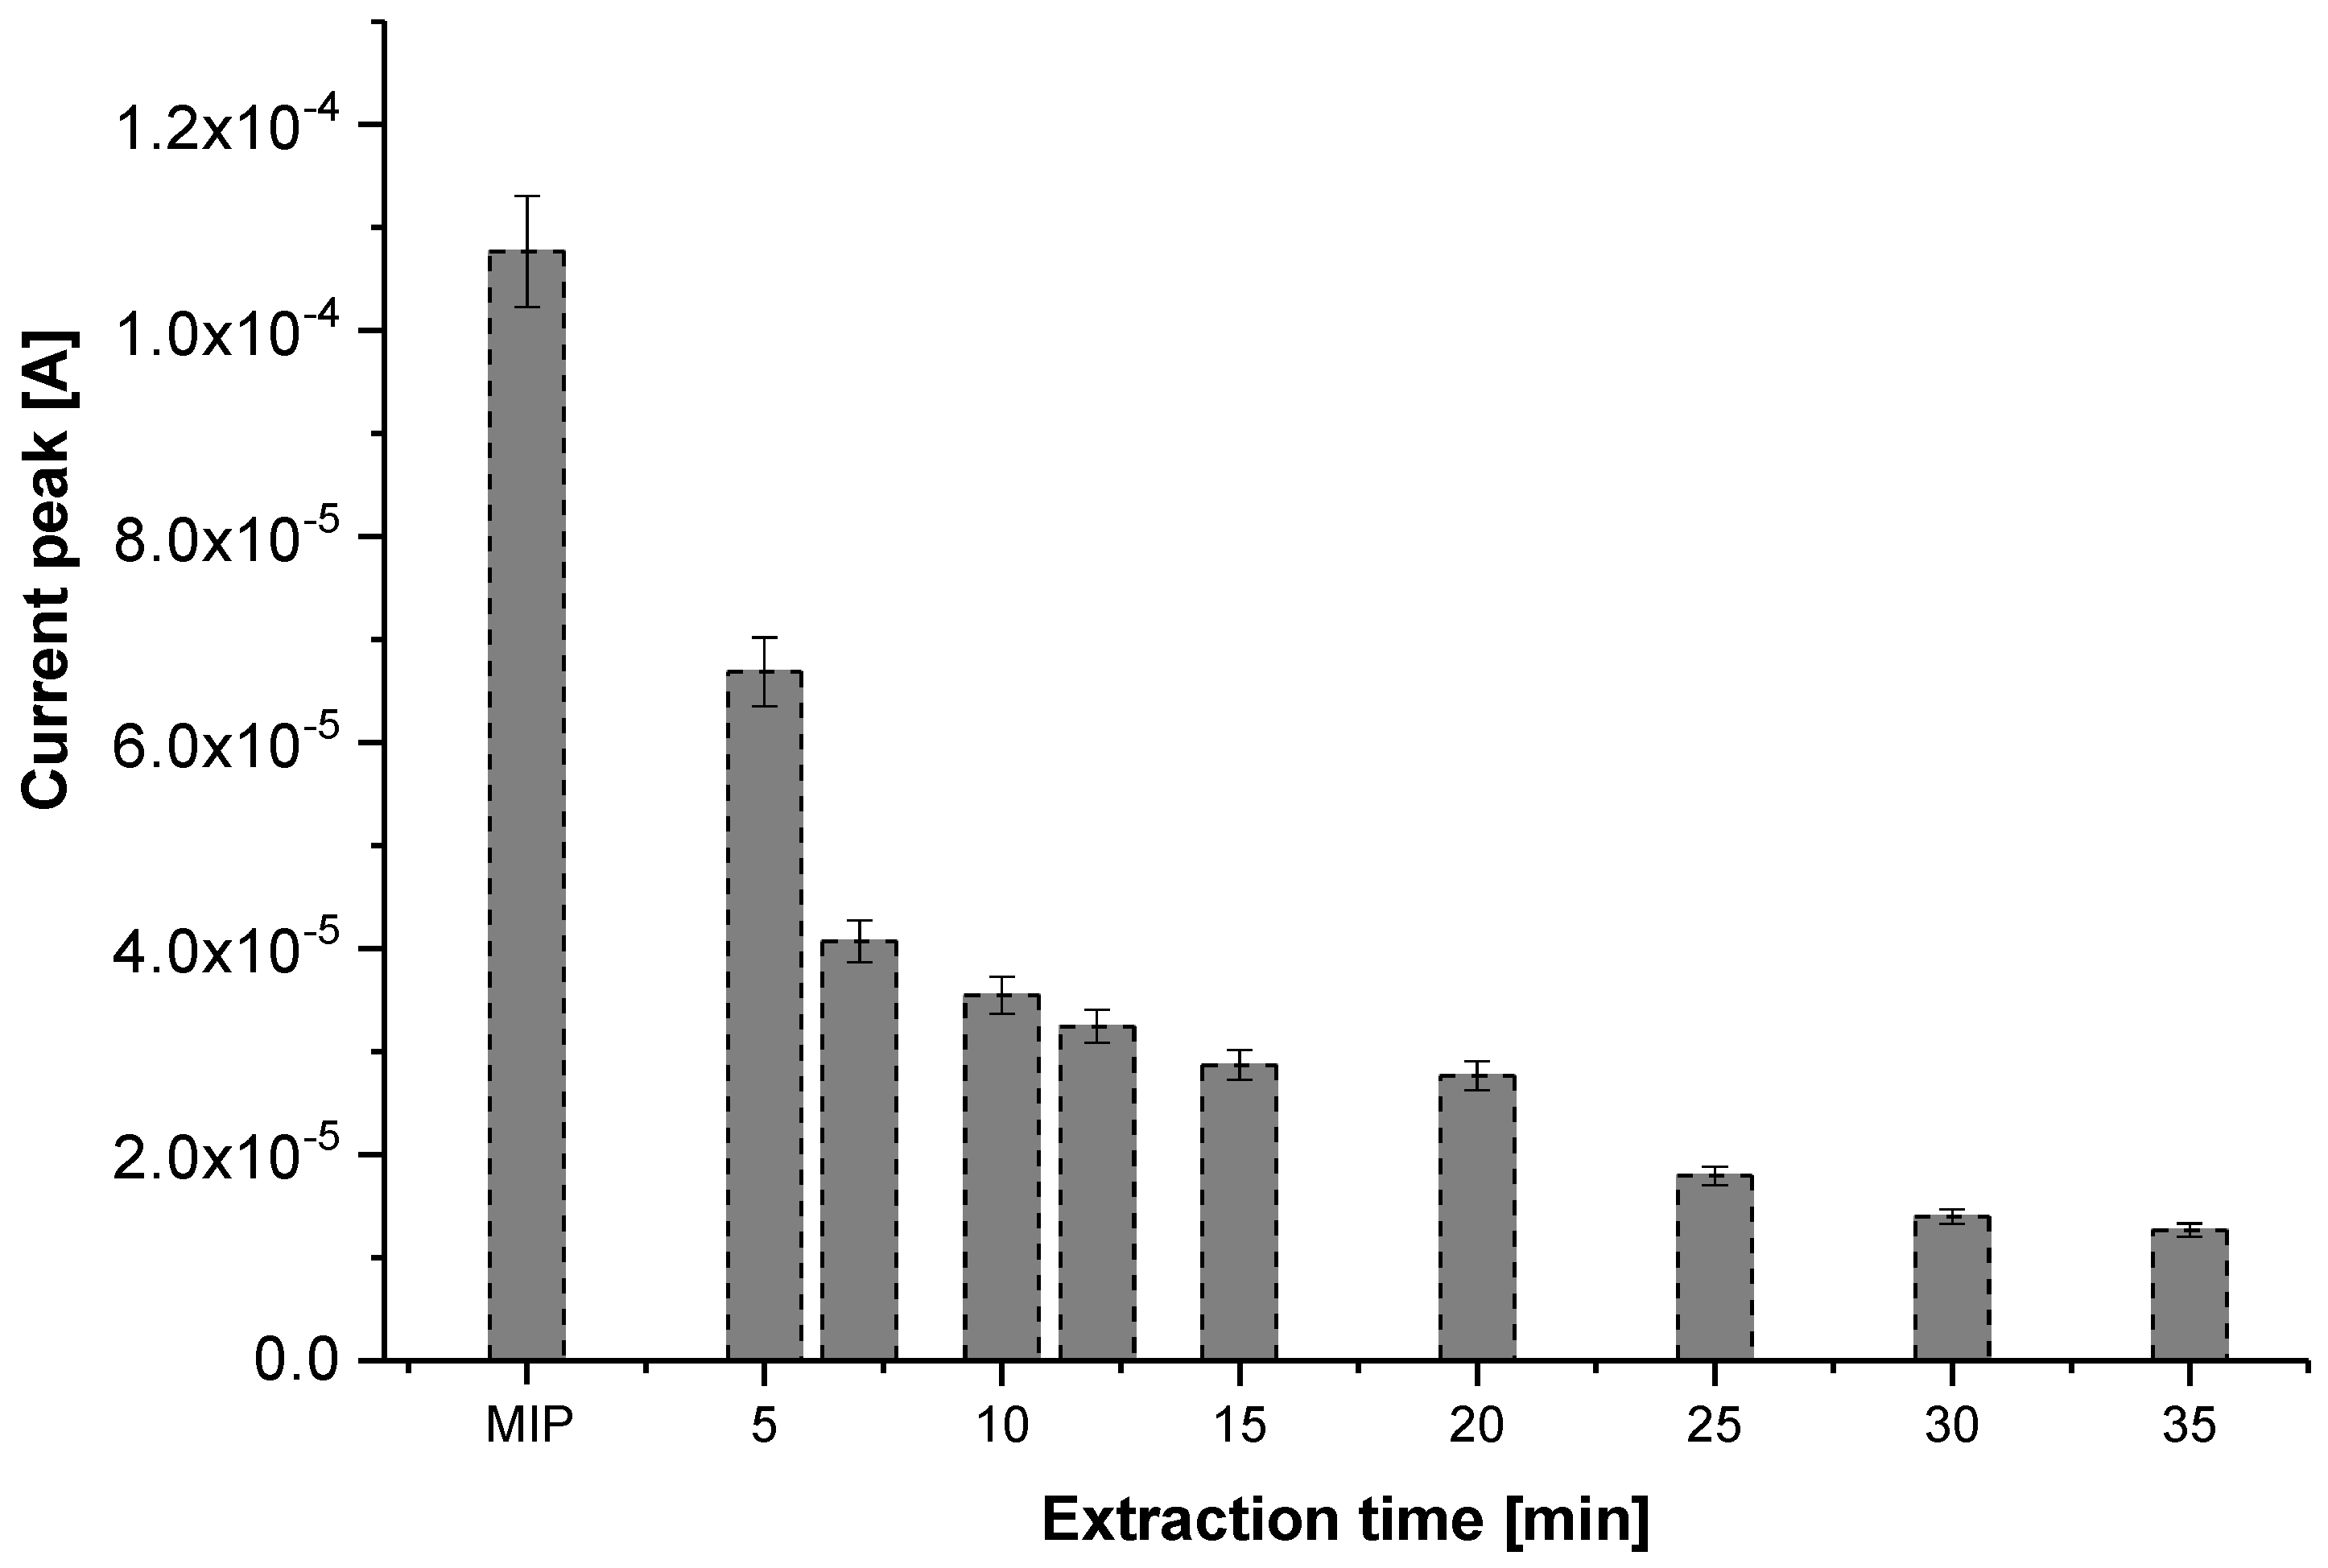
3.2. Glyphosate Extraction
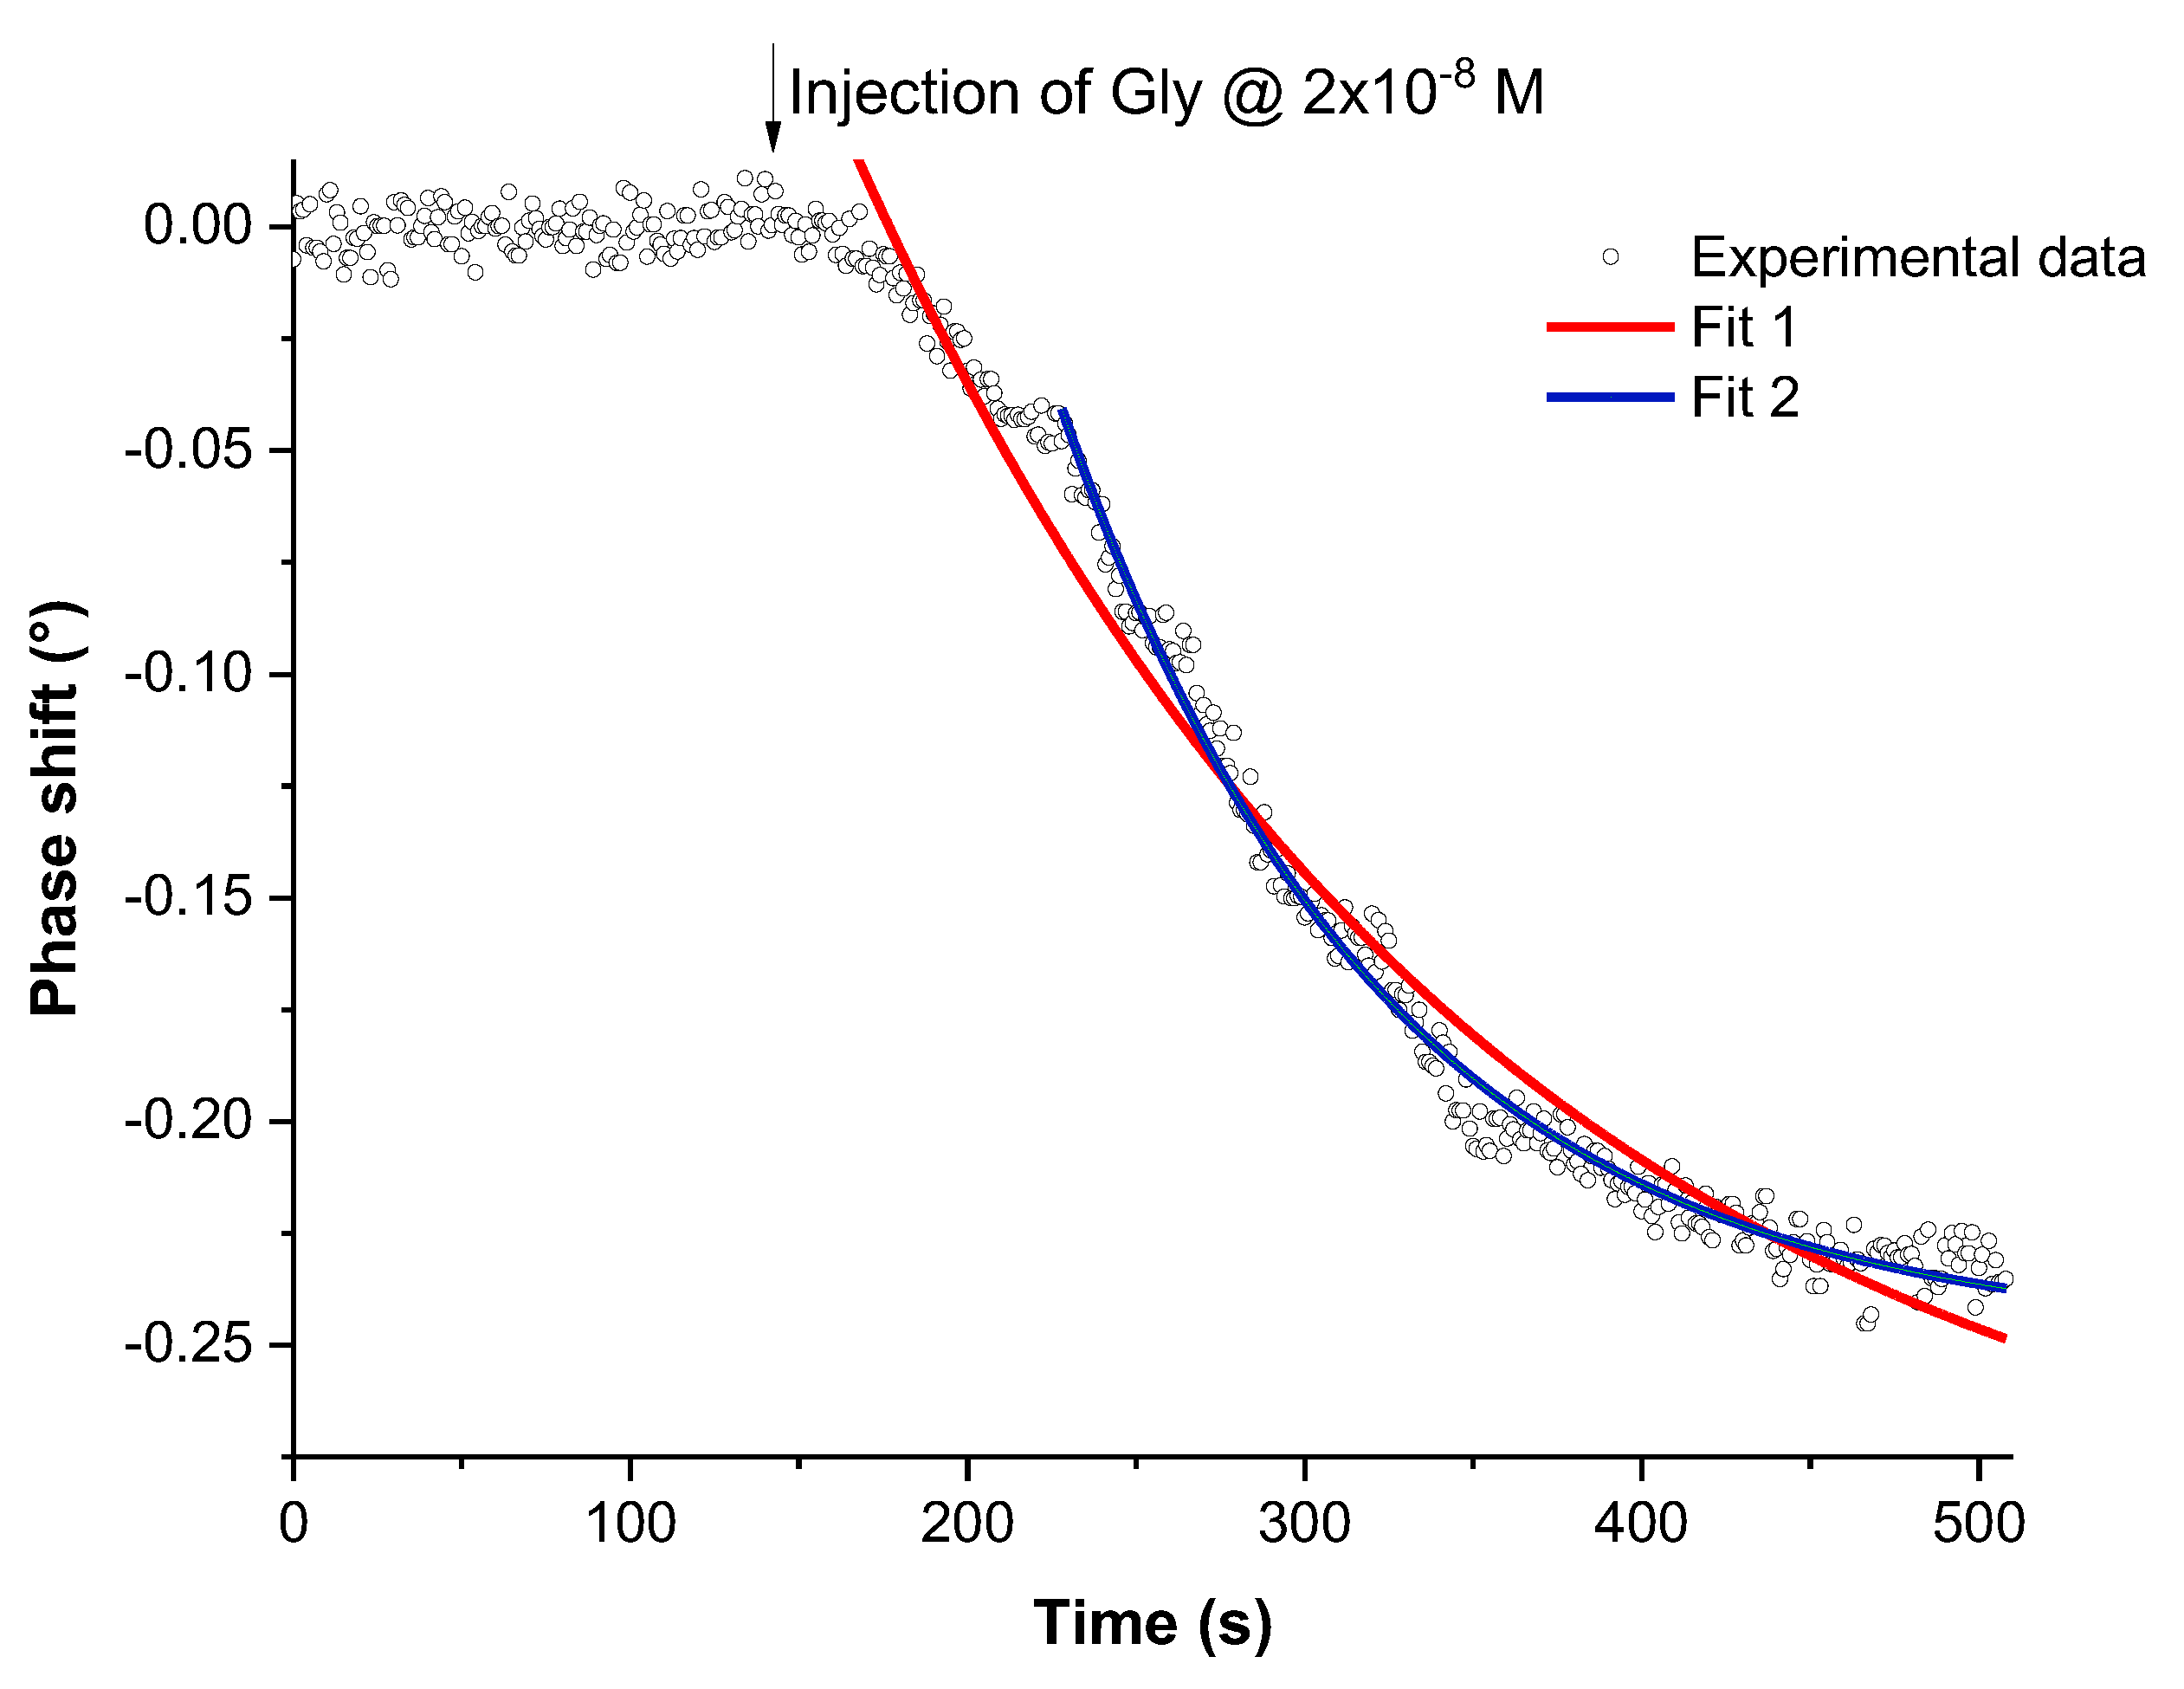
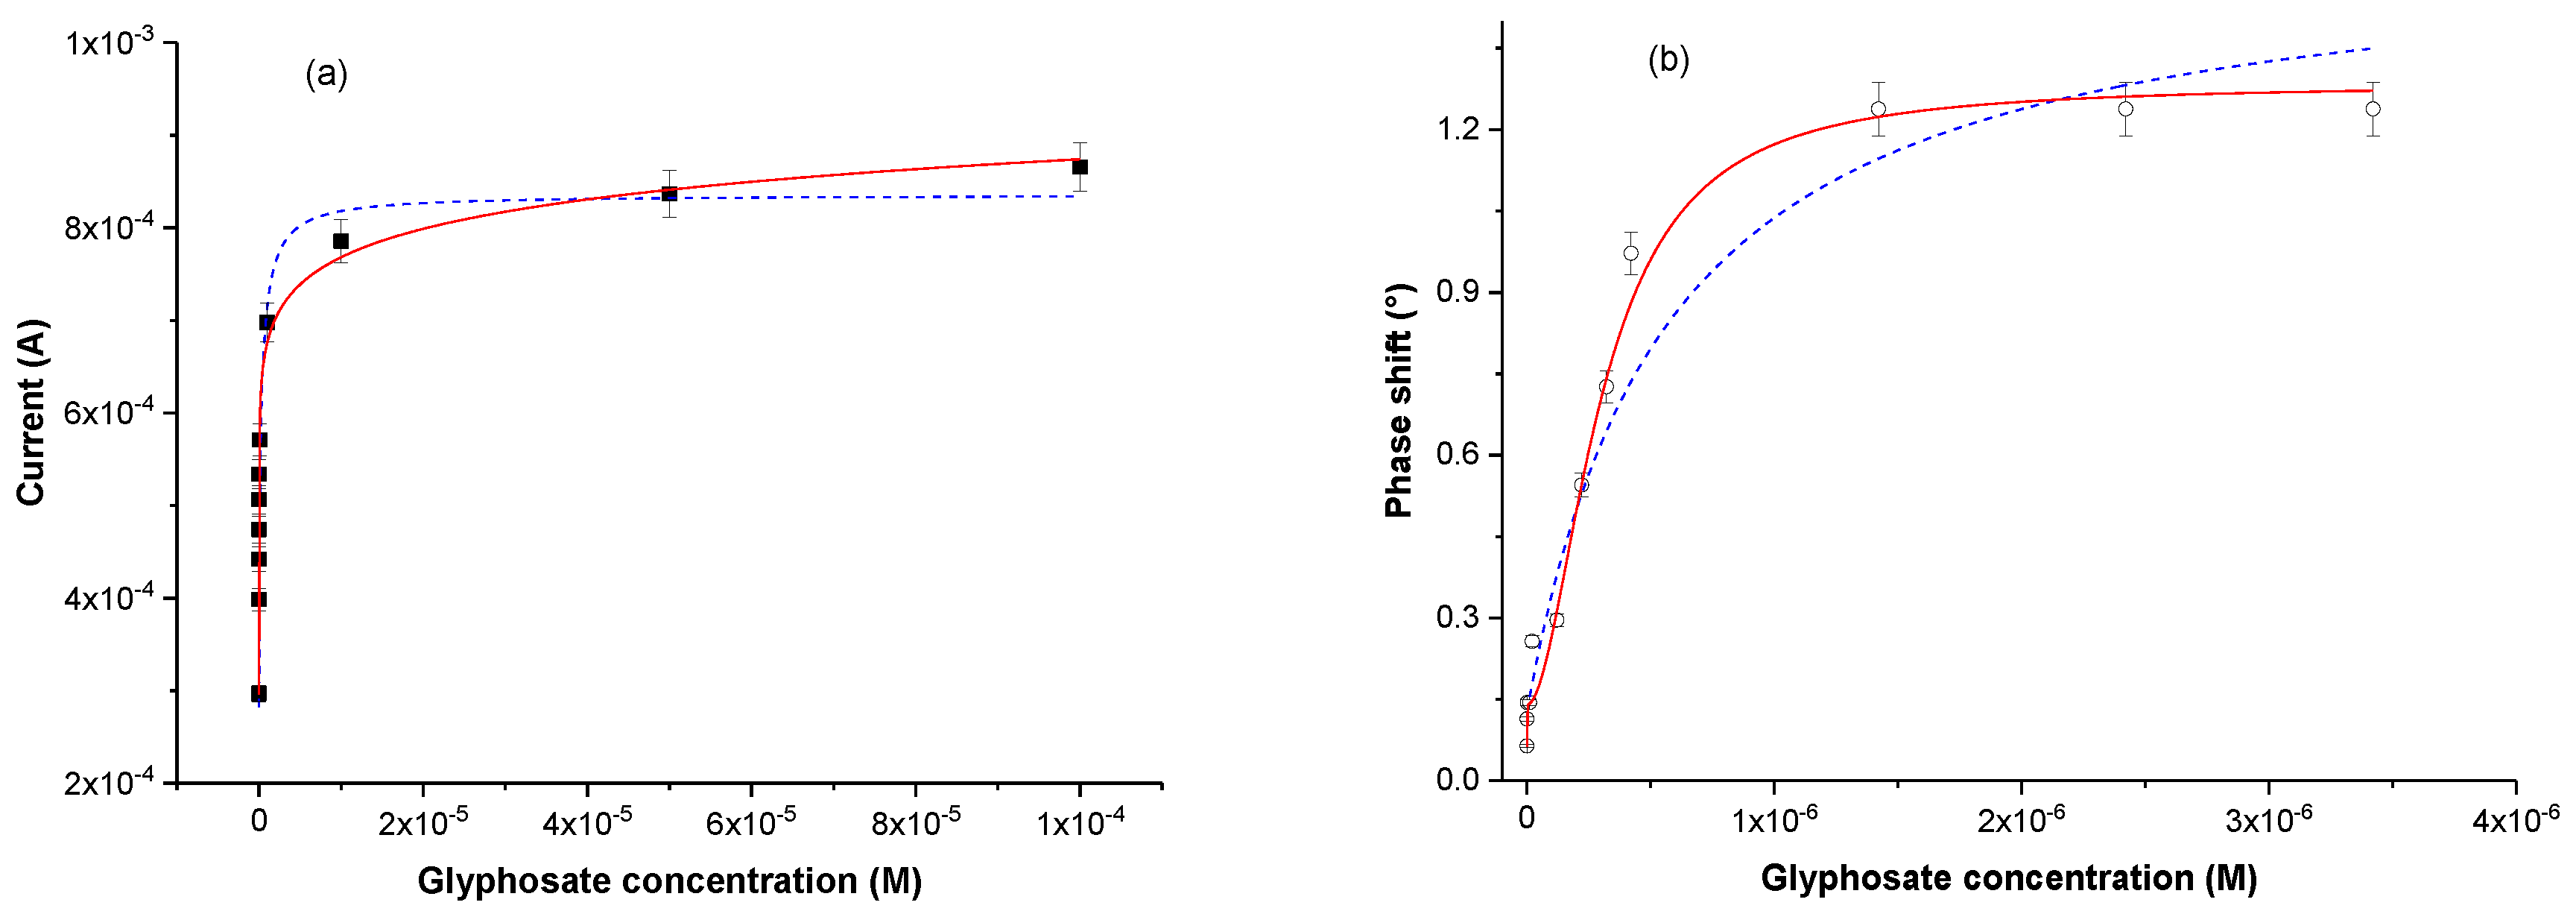
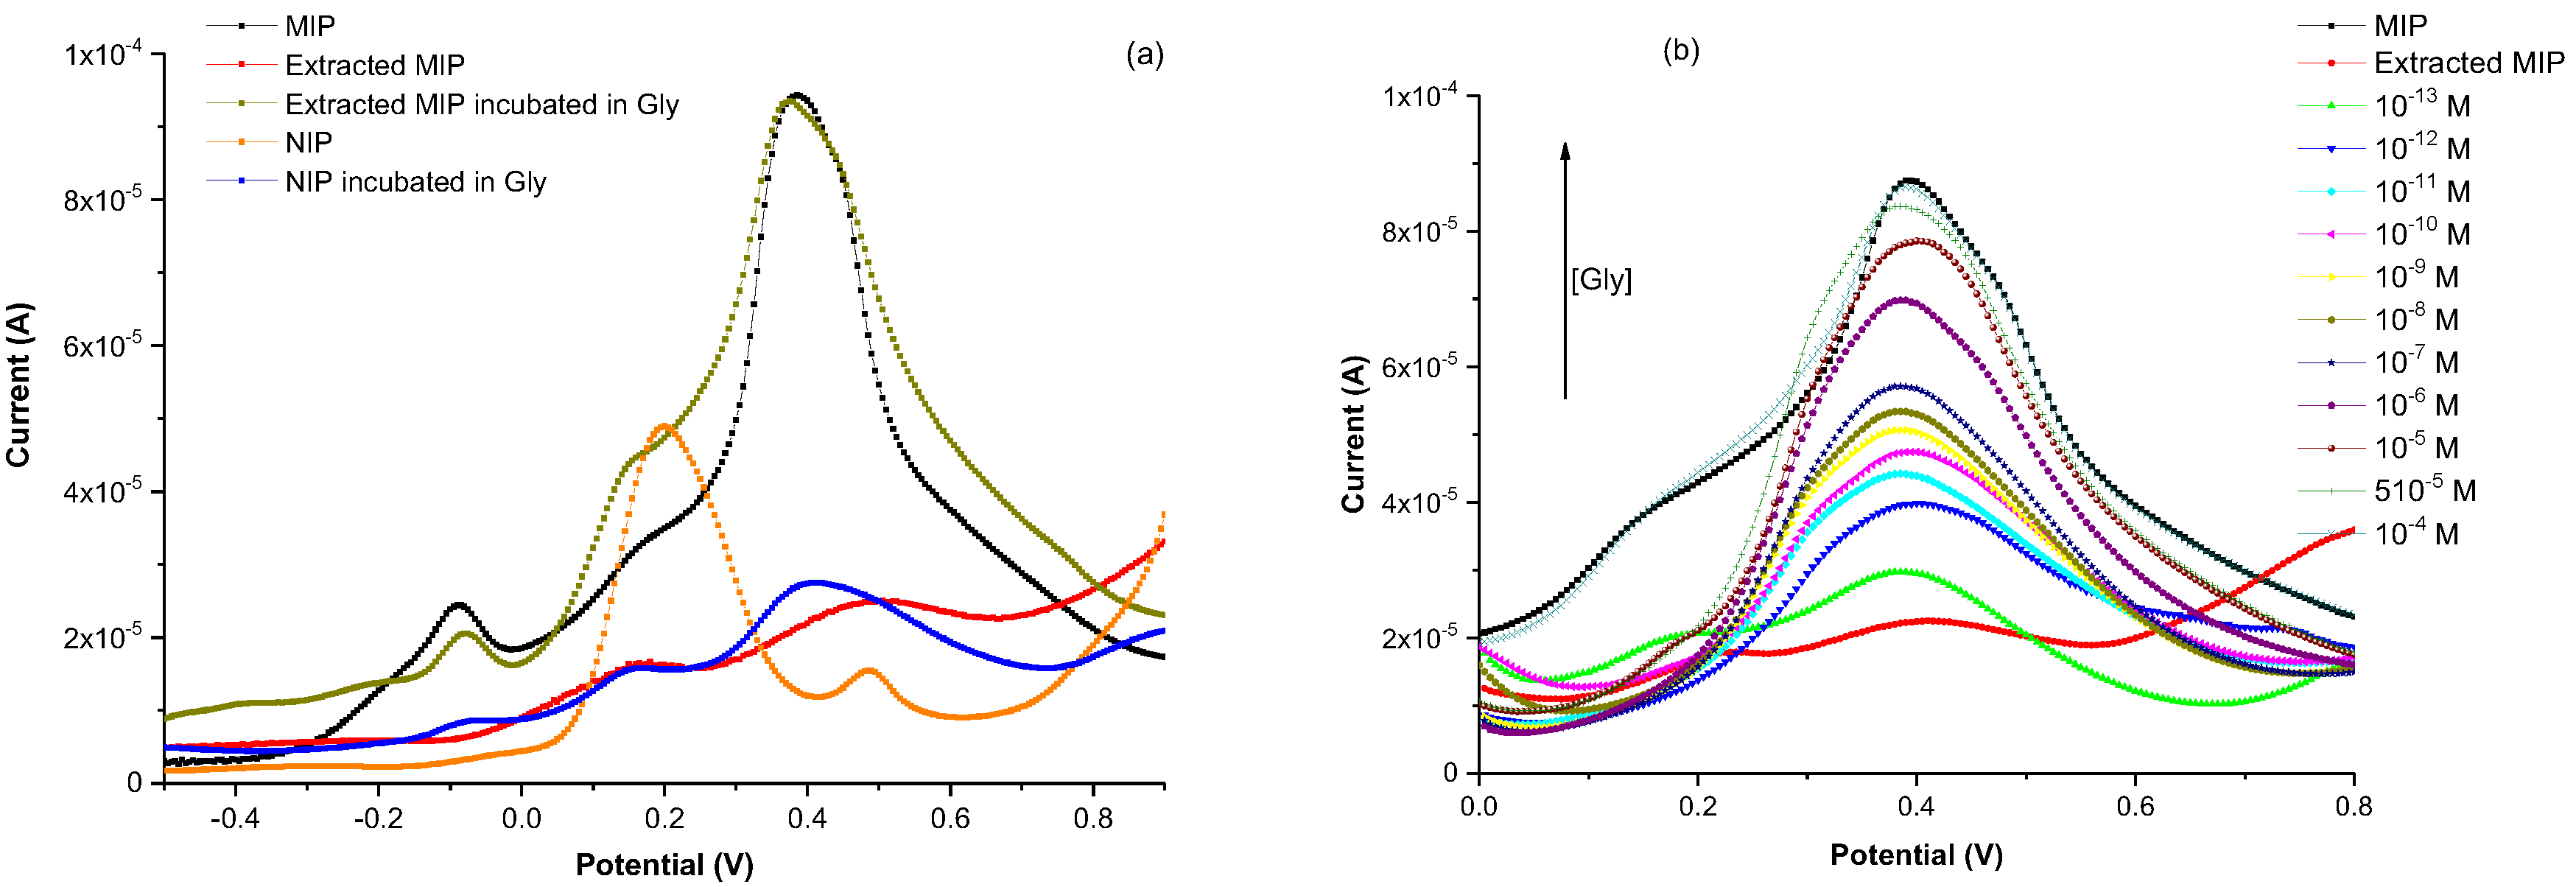
3.3. Glyphosate Detection
3.4. Estimation of Glyphosate/Polypyrrole Dissociation Constants
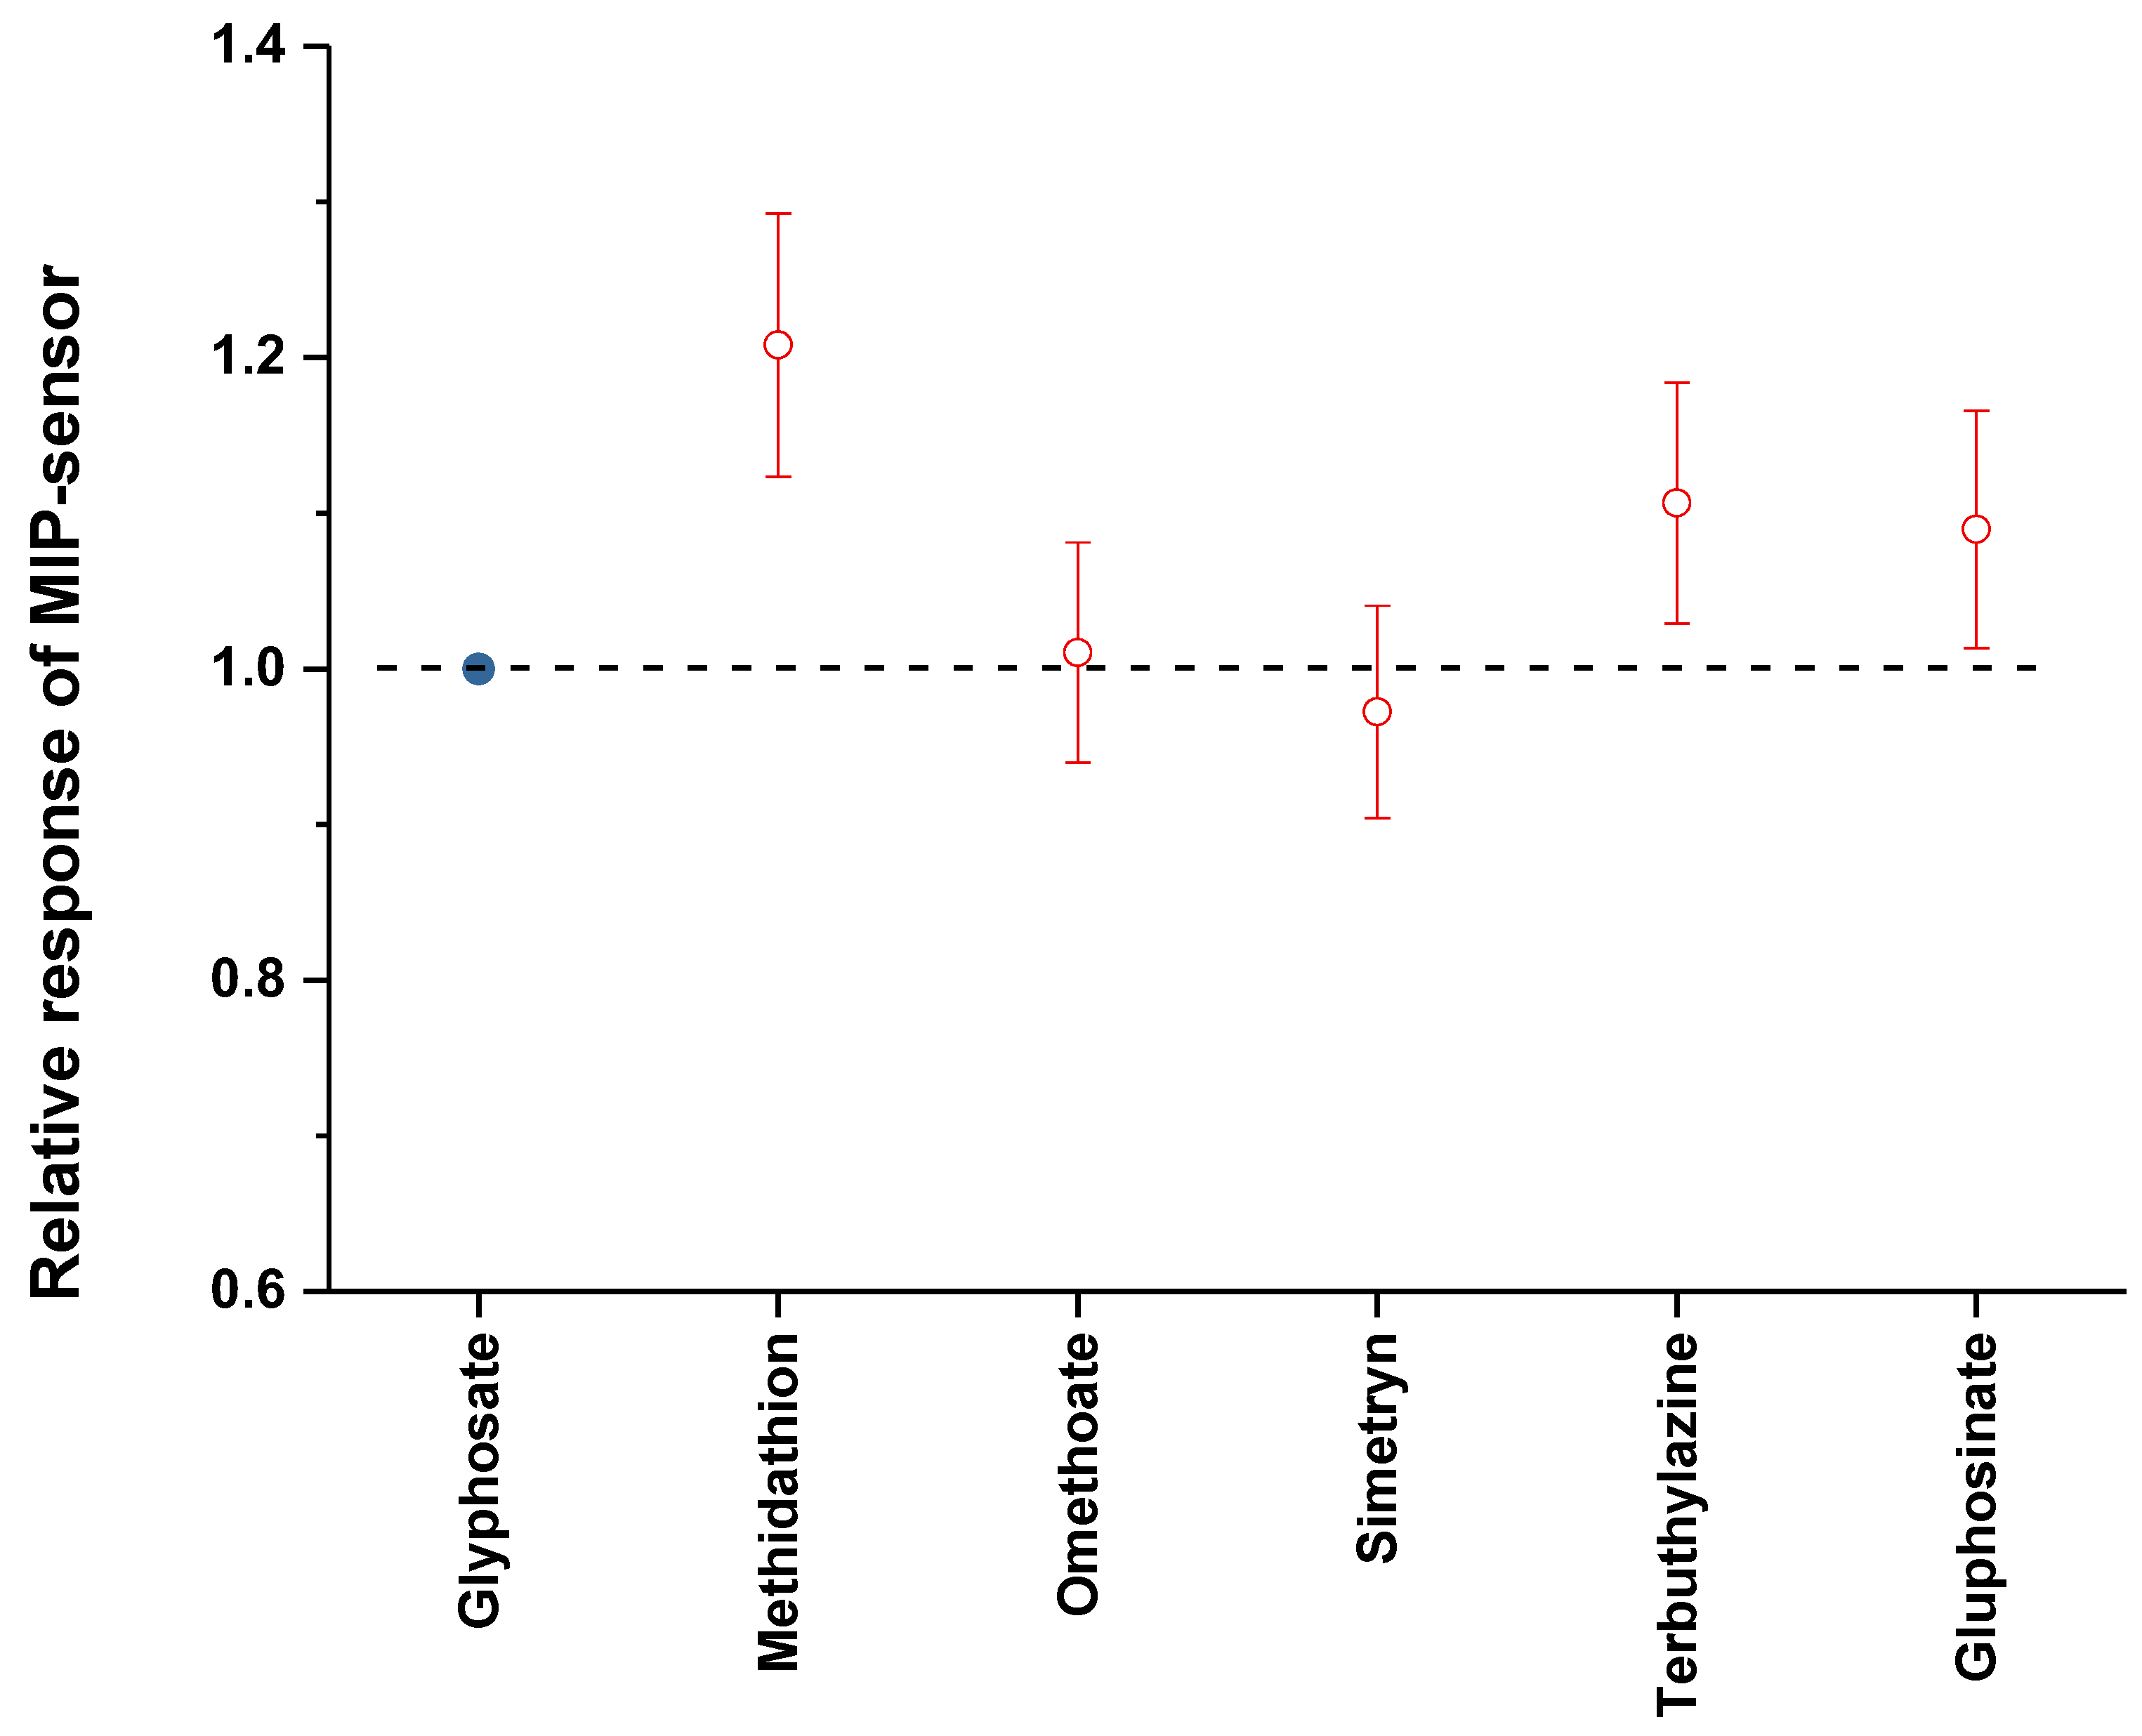
3.5. Selectivity Tests
4. Conclusions
Acknowledgments
Author Contributions
Conflicts of Interest
References
- Glyphosate Facts. Transparency on Safety Aspects and Use of Glyphosate-Containing Herbicide in Europe. Available online: http://www.glyphosate.eu/glyphosate-basics/history-glyphosate (accessed on 28 September 2017).
- Souzaa, J.S.; Kizysa, M.M.L.; da Conceição, R.R.; Glebocki, G.; Romano, R.M.; Ortiga-Carvalho, T.M.; Giannocco, G.; Guerreirod, I.D.C.; da Silva, S.M.R.D.; Romano, M.A.; et al. Perinatal exposure to glyphosate-based herbicide alters the thyrotrophic axis and causes thyroid hormone homeostasis imbalance in male rats. Toxicology 2017, 377, 25–37. [Google Scholar] [CrossRef] [PubMed]
- Some Organophosphate Insecticides and Herbicides. Available online: http://monographs.iarc.fr/ENG/Monographs/vol112/index.php (accessed on 28 September 2017).
- Glyphosate and AMPA in Drinking-Water. Background Document for Development of WHO Guidelines for Drinking-Water Quality. Available online: http://www.who.int/water_sanitation_health/dwq/chemicals/glyphosateampa290605.pdf (accessed on 6 October 2017).
- IARC Monograph on Glyphosate. Available online: https://www.iarc.fr/en/media-centre/iarcnews/2016/glyphosate_IARC2016.php (accessed on 28 September 2017).
- Gasnier, C.; Dumont, C.; Benachour, N.; Clair, E.; Chagnon, M.; Seralini, G. Glyphosate-based herbicides are toxic and endocrine disruptors in human cell lines. Toxicology 2009, 262, 184–191. [Google Scholar] [CrossRef] [PubMed]
- Dallegrave, E.; Mantese, F.D.; Oliveira, R.T.; Andrade, A.J.M.; Dalsenter, P.R.; Langeloh, A. Pre- and postnatal toxicity of the commercial glyphosate formulation in Wistar rats. Arch. Toxicol. 2007, 81, 665–673. [Google Scholar] [CrossRef] [PubMed]
- Sanchís, J.; Kantiani, L.; Llorca, M.; Rubio, F.; Ginebreda, A.; Fraile, J.; Garrido, T.; Farré, M. Determination of glyphosate in groundwater samples using an ultrasensitive immunoassay and confirmation by on-line solid-phase extraction followed by liquid chromatography coupled to tandem mass spectrometry. Anal. Bioanal. Chem. 2012, 402, 2335–2345. [Google Scholar] [CrossRef] [PubMed]
- Ramirez, C.E.; Bellmund, S.; Gardinali, P.R. A simple method for routine monitoring of glyphosate and its main metabolite in surface waters using lyophilization and LC-FLD + MS/MS. Case study: Canals with influence on Biscayne National Park. Sci. Total Environ. 2014, 496, 389–401. [Google Scholar] [CrossRef] [PubMed]
- Fang, F.; Wei, R.; Liu, X. Novel pre-column derivatisation reagent for glyphosate by highperformance liquid chromatography and ultraviolet detection. Int. J. Environ. Anal. Chem. 2014, 94, 661–667. [Google Scholar] [CrossRef]
- Chuang, H.; Hong, T.; Whang, C. A simple and rapid screening method for glyphosate in water using flow-injection with electrochemiluminescence detection. Anal. Methods 2013, 5, 6186–6191. [Google Scholar] [CrossRef]
- Wang, D.; Lin, B.; Cao, Y.; Guo, M.; Yu, Y. A highly selective and sensitive fluorescence detection method of glyphosate based on an immune reaction strategy of carbon dots labeled antibody and antigen magnetic beads. J. Agric. Food Chem. 2016, 64, 6042–6050. [Google Scholar] [CrossRef] [PubMed]
- Dai, H.; Sang, M.; Wang, Y.; Dua, R.; Yuan, W.; Jia, Z.; Cao, Z.; Chen, X. Determination of trace glyphosate in water with a prism coupling optical waveguide configuration. Sens. Actuator A-Phys. 2014, 218, 88–93. [Google Scholar] [CrossRef]
- Wei, X.; Gao, X.; Zhao, L.; Peng, X.; Zhou, L.; Wang, J.; Pu, Q. Fast and interference-free determination of glyphosate and glufosinate residues through electrophoresis in disposable microfluidic chips. J. Chromatogr. A 2013, 1281, 148–154. [Google Scholar] [CrossRef] [PubMed]
- Mörtl, M.; Németh, G.; Juracsek, J.; Darvas, B.; Kamp, L.; Rubio, F.; Székács, A. Determination of glyphosate residues in Hungarian water samples by immunoassay. Michrochem. J. 2013, 107, 143–151. [Google Scholar] [CrossRef]
- Guo, Z.-X.; Cai, Q.; Yang, Z. Determination of glyphosate and phosphate in water by ion chromatography—Inductively coupled plasma mass spectrometry detection. J. Chromatogr. A 2005, 1100, 160–167. [Google Scholar] [CrossRef]
- Wang, L.; Bi, Y.; Hou, J.; Xu, Y.; Wang, B.; Ding, H.; Ding, L. Facile, green and clean one-step synthesis of carbon dots from wool: Application as a sensor for glyphosate detection based on the inner filter effect. Talanta 2016, 160, 268–275. [Google Scholar] [CrossRef] [PubMed]
- Yoshioka, N.; Asano, M.; Kuse, A.; Mitsuhashi, T.; Nagasaki, Y.; Ueno, Y. Rapid determination of glyphosate, glufosinate, bialaphos, and their major metabolites in serum by liquid chromatography-tandem mass spectrometry using hydrophilic interaction chromatography. J. Chromatogr. A 2011, 1218, 3675–3680. [Google Scholar] [CrossRef] [PubMed]
- Acquavella, J.F.; Alexander, B.H.; Mandel, J.S.; Gustin, C.; Baker, B.; Chapman, P.; Bleeke, M. Glyphosate biomonitoring for farmers and their families: Results from the Farm Family Exposure Study. Environ. Health Perspect. 2004, 112, 321–326. [Google Scholar] [CrossRef] [PubMed]
- Curwin, B.D.; Hein, M.J.; Sanderson, W.T.; Heederik, C.S.D.; Kromhout, H.; Reynolds, S.J.; Alavanja, M.C. Urinary pesticide concentrations among children, mothers and fathers living in farm and non-farm households in Iowa. Ann. Occup. Hyg. 2007, 51, 53–65. [Google Scholar] [CrossRef] [PubMed]
- Ktari, N.; Fourati, N.; Zerrouki, C.; Ruan, M.X.W.; Seydou, M.; Barbaut, F.; Nal, F.; Yaakoubi, N.; Chehimi, M.M.; Kalfat, R. Design of a polypyrrole MIP-SAW sensor for selective detection of flumequine in aqueous media. Correlation between experimental results and DFT calculations. RSC Adv. 2015, 5, 88666–88674. [Google Scholar] [CrossRef]
- Maouche, N.; Guergouri, M.; Gam-Derouich, S.; Jouini, M.; Nessark, B.; Chehimi, M.M. Molecularly imprinted polypyrrole films: Some key parameters for electrochemical picomolar detection of dopamine. J. Electroanal. Chem. 2012, 685, 21–27. [Google Scholar] [CrossRef]
- Dickert, F.L.; Lieberzeit, P.A. Imprinted Polymers in Chemical Recognition for Mass-Sensitive Devices. Ser. Chem. Sens. Biosens. 2007, 5, 173–210. [Google Scholar] [CrossRef]
- Cieplak, M.; Kutner, W. Artificial Biosensors: How Can Molecular Imprinting Mimic Biorecognition? Trends Biotechnol. 2016, 34, 922–941. [Google Scholar] [CrossRef] [PubMed]
- Chen, L.; Wang, X.; Lu, W.; Wu, X.; Li, J. Molecular imprinting: Perspectives and applications. Chem. Soc. Rev. 2016, 45, 2137–2211. [Google Scholar] [CrossRef] [PubMed]
- Haupt, K. (Ed.) Molecular Imprinting; Series: Topics in Current Chemistry; Springer: Compiègne, France, 2012; p. 350. ISBN 978-3-642-28421-2. [Google Scholar]
- Ye, L. (Ed.) Molecular Imprinting: Principles and Applications of Micro- and Nanostructured Polymers; CRC Press, Taylor and Francis Group: Boca Raton, FL, USA, 2013; ISBN 978-981-4364-87-4. [Google Scholar]
- Muzyka, K.; Mykola, S.P. Molecularly Imprinted Polymer-based Volammetric Sensors. In Handbook of Molecularly Imprinted Polymers; Smithers Rapra Technology Ltd.: Shawbury, UK, 2013; ISBN 978-1-84735-959-9. [Google Scholar]
- Rada, A.S.; Valipour, P. Interaction of methanol with some aniline and pyrrole derivatives: DFT calculations. Synth. Met. 2015, 209, 502–511. [Google Scholar] [CrossRef]
- Singh, D.K.; Asthana, B.P.; Sunil; Srivastava, K. Modeling the weak hydrogen bonding of pyrrole and dichloromethane through Raman and DFT study. J. Mol. Model. 2012, 18, 3541–3552. [Google Scholar] [CrossRef] [PubMed]
- Jin, R.; Sun, W.; Tang, S. A DFT Study of Pyrrole-Isoxazole Derivatives as Chemosensors for Fluoride Anion. Int. J. Mol. Sci. 2012, 13, 10986–10999. [Google Scholar] [CrossRef] [PubMed]
- Lattach, Y.; Fourati, N.; Zerrouki, C.; Fougnion, J.M.; Garnier, F.; Pernelle, C.; Rémita, S. Molecularly imprinted surface acoustic wave sensors: The synergy of electrochemical and gravimetric transductions in chemical recognition processes. Electrochim. Acta 2012, 73, 36–44. [Google Scholar] [CrossRef]
- Lattach, Y.; Fourati, N.; Zerrouki, C.; Fougnion, J.M.; Rémita, S. Surface acoustic wave sensor as a combined gravimetric and electrochemical transductions platform for the detection of atrazine. Sens. Lett. 2011, 9, 2249–2252. [Google Scholar] [CrossRef]
- Kresse, G.; Hafner, J. Ab initio molecular dynamics for liquid metals. Phys. Rev. B 1993, 47, 558–561. [Google Scholar] [CrossRef]
- Kresse, G.; Hafner, J. Ab initio molecular-dynamics simulation of the liquid-metal-amorphous-semiconductor transition in germanium. Phys. Rev. B 1994, 49, 14251–14269. [Google Scholar] [CrossRef]
- Blochl, P.E. Projector augmented-wave method. Phys. Rev. B 1994, 50, 17953–17979. [Google Scholar] [CrossRef]
- Kresse, G.; Joubert, D. From ultrasoft pseudopotentials to the projector augmented-wave method. Phys. Rev. B 1999, 59, 1758–1775. [Google Scholar] [CrossRef]
- Hammer, B.; Hansen, L.B.; Norskov, J.K. Improved adsorption energetics within density-functional theory using revised Perdew-Burke-Ernzerhof functionals. Phys. Rev. B 1999, 59, 7413–7421. [Google Scholar] [CrossRef] [Green Version]
- Perdew, J.P.; Burke, K.; Ernzerhof, M. Generalized Gradient Approximation Made Simple. Phys. Rev. Lett. 1997, 78, 1396. [Google Scholar] [CrossRef]
- Grimme, S. Semiempirical GGA-type density functional constructed with a long-range dispersion correction. J. Comput. Chem. 2006, 27, 1787–1799. [Google Scholar] [CrossRef] [PubMed]
- Council Directive 98/83/EC of 3 November 1998 on the Quality of Water Intended for Human Consumption. Available online: https://www.eea.europa.eu/policy-documents/council-directive-98-83-ec (accessed on 28 September 2017).
- Gomez-Caballero, A.; Diaz-Diaz, G.; Bengoetxea, O.; Quintela, A.; Unceta, N.; Goicolea, M.A.; Barrio, R.J. Water compatible stir-bar devices imprinted with underivatisedglyphosate for selective sample clean-up. J. Chromatogr. A 2016, 1451, 23–32. [Google Scholar] [CrossRef] [PubMed]
- Zhao, P.; Yan, M.; Zhang, C.; Peng, R.; Ma, D.; Yu, J. Determination of glyphosate in foodstuff by one novel chemiluminescence-molecular imprinting sensor. Spectrochim. Acta A 2011, 78, 1482–1486. [Google Scholar] [CrossRef] [PubMed]
- Duan, G.; Zhang, J.; Li, Y.; Xu, Y.; Yin, F.; Fu, Y. The Preparation of Fe3O4/Molecular-Imprinted Nanocomposite and the Application on the Recognition and Separation of Glyphosate. Inorg. Met.-Org. Nano-Met. Chem. 2016, 47, 481–487. [Google Scholar] [CrossRef]
- Do, M.H.; Florea, A.; Farre, C.; Bonhomme, A.; Bessueille, F.; Vocanson, F.; Tran-Thi, N.; Jaffrezic-Renault, N. Molecularly imprinted polymer-based electrochemical sensor for the sensitive detection of glyphosate herbicide. Int. J. Environ. Anal. Chem. 2015, 95, 1489–1501. [Google Scholar] [CrossRef]
- Xu, J.; Zhang, Y.; Wu, K.; Zhang, L.; Ge, S.; Yu, J. A molecularly imprinted polypyrrole for ultrasensitive voltammetric determination of glyphosate. Microchim. Acta 2017, 184, 1959–1967. [Google Scholar] [CrossRef]
- Prasad, B.B.; Jauhari, D.; Tiwari, M.P. Doubly imprinted polymer nanofilm-modified electrochemical sensor for ultra-trace simultaneous analysis of glyphosate and glufosinate. Biosens. Bioelectron. 2014, 59, 81–88. [Google Scholar] [CrossRef] [PubMed]


| Sample Matrix | Analytical Technique | LOD | Linear Range | Ref. |
|---|---|---|---|---|
| Ground water | Solid-phase extraction followed by liquid chromatography coupled to tandem mass spectrometry (SPE-LC-MS/MS) | 18.9 pM | 0.3–3 nM | [8] |
| Canal water | Liquid chromatography fluorescence (LC-FLD) + tandem mass spectrometry (MS-MS) | 0.6 nM | 0.6 nM–0.3 µM | [9] |
| Tap water | High-performance liquid chromatography (HPLC) and ultraviolet spectroscopy | 0.4 µm | 29.6 µM–0.6 mM | [10] |
| Tap water and irrigation water | Electrochemiluminescence | 0.2 mM | 0.2–16.6 mM | [11] |
| Pearl River water | Fluorescence | 47.3 nM | 59.1 nM–47.3 µM | [12] |
| Water | Optical: prism coupling optical waveguide | 1.4 nM | 1.4–5.0 nM | [13] |
| Laser induced fluorescence (LIF) | 0.3 nM | 0.1 nM–5.0 µM | [14] | |
| Enzyme-linked immunosorbent assay (ELISA) | 0.6 nM | 3.2–4.5 nM | [15] | |
| Ion chromatography—inductively coupled plasma mass spectrometry | 4.1 nM | up to 2.4 µM | [16] | |
| 4.1 nM | ||||
| Cereals | Fluorescence | 71.0 nM | 0.1–14.8 µM | [17] |
| Serum | LC-MS/MS | 0.2 µM | [18] | |
| Urine | HPLC with post-column reaction and FD | 5.9 nM | - | [19] |
| ELISA | 5.3 nM | - | [20] |
| Main Steps for Gly Detection and/or Sensors Construction | Extraction Technique | Analytical Method | LOD/LOQ | Linear Range | Ref. |
|---|---|---|---|---|---|
| - Dissolution of Gly+ C10H19NO2 + C4H8N2S in a porogenic solvent | Stirring in NaH2PO4 during 30 min at room temperature | HPLC + Fluorescence Detection | LOD: 2.5 nM | 1.5 nM to 5.9 µM | [42] |
| - Addition of C10H14O4 cross-linking monomers + C2H4O + C8H18OSi2 | |||||
| - Addition of C13H10O benzophenone (last) | LOQ: 0.8 nM | ||||
| - UV Irradiation for 30 min | |||||
| - Dissolution of Gly + chloroforme + methanol | Washing with a 1:9 (v/v) mixture of acetic acid and methanol | Chemi-luminescence | LOD: 0.27 µM | 2.96 µM to 0.2 Mm | [43] |
| - Further addition of C3H4O2, C10H14O4 (EGDMA) and C8H12N4 (AIBN) | |||||
| - Degassing of the mixture with nitrogen for 15 min and then polymerization at 60 °C for 24 h | |||||
| - Preparation of Fe3O4 NPs then Fe3O4 MIP composite | - Methanol and acetic acid (v/v, 9:1) solution in Soxhlet extractor | Cyclic Voltammetry | LOD: 10 µM | - | [44] |
| - Preparation of solution (a) a dispersion of: C18H29NaO3S and Fe3O4 NPs into methanol-water + Gly+ C4H6O2 (MAA) | |||||
| - Preparation of solution (b) Glutaraldehyde (crosslinker) + NH4)2S2O8 (initiator of free radical polymerization) in methanol | |||||
| - Injection of (b) into (a) in an atmosphere of nitrogen at 60 °C for 18 h | |||||
| - Preparation of (HAuCl4) | PBS at pH 7.2 for 30 min | Linear sweep voltammetry (LSV) | LOQ: 5 fM | 5 fM to 5 nM | [45] |
| -fnctionalized AuNPs | |||||
| - Dissolution of Gly + PATP-functionalized AuNPs + [Fe(CN)6]3−/4− in a solution of PBS with 20% methanol | |||||
| - Electropolymerization (20 cycles): scan rate = 100 mV/s, voltage from −0.35 to 0.85 V | |||||
| - Application of a fixed potential of 0.80 V during 30 min to stabilize the MIP | |||||
| - Dissolution of Gly + C4H5N in PBS. | A mixture of water + Methanol + dichloro-methane + Ultra-Turrax® | Electrochemical Impedance Spectroscopy + Cyclic voltammetry | LOD: 0.5 µM | 2.4 to 7.1 µM | [46] |
| - Electropolymerization (20 cycles): scan rate = 0.05 V s−1. Voltage ranged from −0.35 to 0.85 V | |||||
| - Synthesis of MAC monomers | Acetonitrile + triethylamine (4/1: v/v) for 30 min | Differential pulse anodic stripping voltammetry (DPASV) | LOD: 2.1 nM | 23.5 nM to 0.1 µM | [47] |
| - Synthesis of GNPs gold nanoparticles | |||||
| - Attachment of GNPs to pencil rod (PGE) surface | |||||
| - Formation of MAC–gold nanoparticles complexes | |||||
| - Dissolution of C10H8N2 + CuCl2 in DMSO to get a solution of Cu(II)-complex | |||||
| - Mixture of this complex with NGLY templates + GLU + EGDMA + MWCNTs + (C2H5)3N reducing agent | |||||
| - Purge of the whole mixture in a glass tube with N2 gas | |||||
| - Spin coating at 2500 rpm onto the surface of MAC modified GNPs-PGE | |||||
| - Incubation in an oven for 3 h at 70 °C | |||||
| Electro-polymerization of Py + Gly + LiClO4 by chronoamperometry | Methanol + Acetic acid 1/1: v/v | Square wave voltammetry and gravimetry | LOD: 1 pM | 1 pM to 1 nM | This study |
© 2017 by the authors. Licensee MDPI, Basel, Switzerland. This article is an open access article distributed under the terms and conditions of the Creative Commons Attribution (CC BY) license (http://creativecommons.org/licenses/by/4.0/).
Share and Cite
Mazouz, Z.; Rahali, S.; Fourati, N.; Zerrouki, C.; Aloui, N.; Seydou, M.; Yaakoubi, N.; Chehimi, M.M.; Othmane, A.; Kalfat, R. Highly Selective Polypyrrole MIP-Based Gravimetric and Electrochemical Sensors for Picomolar Detection of Glyphosate. Sensors 2017, 17, 2586. https://doi.org/10.3390/s17112586
Mazouz Z, Rahali S, Fourati N, Zerrouki C, Aloui N, Seydou M, Yaakoubi N, Chehimi MM, Othmane A, Kalfat R. Highly Selective Polypyrrole MIP-Based Gravimetric and Electrochemical Sensors for Picomolar Detection of Glyphosate. Sensors. 2017; 17(11):2586. https://doi.org/10.3390/s17112586
Chicago/Turabian StyleMazouz, Zouhour, Seyfeddine Rahali, Najla Fourati, Chouki Zerrouki, Nadia Aloui, Mahamadou Seydou, Nourdin Yaakoubi, Mohamed M. Chehimi, Ali Othmane, and Rafik Kalfat. 2017. "Highly Selective Polypyrrole MIP-Based Gravimetric and Electrochemical Sensors for Picomolar Detection of Glyphosate" Sensors 17, no. 11: 2586. https://doi.org/10.3390/s17112586