Highly Sensitive and Selective Hydrogen Gas Sensor Using the Mesoporous SnO2 Modified Layers

1
School of Material Science and Engineering, Wuhan University of Technology, Wuhan 430070, China
2
Department of Materials Science and Engineering, Huazhong University of Science and Technology, Wuhan 430074, China
*
Author to whom correspondence should be addressed.
Sensors 2017, 17(10), 2351; https://doi.org/10.3390/s17102351
Submission received: 7 September 2017
/
Revised: 10 October 2017
/
Accepted: 10 October 2017
/
Published: 14 October 2017
(This article belongs to the Special Issue Gas Sensors based on Semiconducting Metal Oxides)
Abstract
:It is important to improve the sensitivities and selectivities of metal oxide semiconductor (MOS) gas sensors when they are used to monitor the state of hydrogen in aerospace industry and electronic field. In this paper, the ordered mesoporous SnO2 (m-SnO2) powders were prepared by sol-gel method, and the morphology and structure were characterized by X-ray diffraction analysis (XRD), transmission electron microscope (TEM) and Brunauer–Emmett–Teller (BET). The gas sensors were fabricated using m-SnO2 as the modified layers on the surface of commercial SnO2 (c-SnO2) by screen printing technology, and tested for gas sensing towards ethanol, benzene and hydrogen with operating temperatures ranging from 200 °C to 400 °C. Higher sensitivity was achieved by using the modified m-SnO2 layers on the c-SnO2 gas sensor, and it was found that the S(c/m2) sensor exhibited the highest response (Ra/Rg = 22.2) to 1000 ppm hydrogen at 400 °C. In this paper, the mechanism of the sensitivity and selectivity improvement of the gas sensors is also discussed.
1. Introduction
As one of the most important clean energies, H2 is widely used in various fields such as fuel cell vehicles, aerospace industry, petrochemical industry, and electronic field [1,2,3]. In consideration of the leakage in the applications of H2 whose explosive limit is very low, it is essential to monitor the state of hydrogen. Gas sensor is one of the most effective detectors [4,5].
Great emphasis is being given to metal oxide semiconductors (MOS), including ZnO [6], WO3 [7], TiO2 [8], In2O3 [9] and SnO2 [10], as gas sensing materials for a long time. Among various MOS gas sensors, SnO2-based gas sensors are widely used because of their low cost, high sensitivity and long-term stability [11]. However, poor selectivity to various gases restricts their applications. Gas sensing performances of SnO2, especially the selectivity to H2, can be improved by applying doping [12,13,14], catalyst [15,16,17], filtering membranes [18,19,20], etc. For example, Inyawilert et al. studied the films of SnO2 nanoparticles doped with 0.1~2 wt.% rhodium (Rh). It showed that the Rh-doped SnO2 sensor presented high H2 selectivity against NO2, SO2, C2H4, C3H6O, CH4, H2S and CO [13]. Liewhiran et al. reported that Pd-catalyzed SnO2 sensor (0.2 wt.% Pd/ SnO2, 10 μm in thickness) showed ultra-high response to H2 [15]. It was found in the work of Tournier et al. that SiO2 filter film deposited on the SnO2 film is highly selective to hydrogen [18]. Filtering membranes such as SiO2, Al2O3, Fe2O3, etc. work as molecular sieves. They are useful to improve the selectivity of gas sensors.
Gas sensing performances of SnO2 gas sensors can be highly improved by using mesoporous material because of its high specific surface area (SSA) [21]. Japanese researchers fabricated nano-SnO2 powders coated by mesoporous SnO2 (m-SnO2), and this kind of SnO2 films highly increased the responses to H2 [21]. It was found in the work of Pijolat et al. that thin SiO2 films deposited on the SnO2 thick films could improve the selectivity to H2 [22]. Dhawale et al. synthesized mesoporous ZnO thin films which showed high selectivity towards liquefied petroleum [23]. The aim of the present study was to improve the selectivity and sensitivity simultaneously in hydrogen detection. The uses of such mesoporous materials enable enhancement of the adsorption and reaction of test gas because of the high specific surface area. On the other hand, mesoporous materials are potential molecular sieves for gas sensors to improve their selectivity because of the mesoporous structure.
In this paper, the m-SnO2 powders were synthesized with a simple and low cost sol-gel method. The sensors were fabricated using commercial SnO2 (c-SnO2) films as the basic layer and the m-SnO2 films as the modified layers by screen printing method. Their sensing performances were tested with hydrogen, ethanol and benzene. The relationships between selectivity and the thickness of the films were studied. The present study aims to develop a low cost and highly sensitive and selective hydrogen gas sensor.
2. Materials and Methods
2.1. Preparation of m-SnO2 Powders
Employing Na2SnO3·4H2O as the Sn source, n-cetylpyridinium chloride (C16PyCl) as the template and trimethylbenzene (C6H3(CH3)3) as the surfactant, m-SnO2 powders were prepared in a similar way to that reported previously [21]. The typical preparation manner was as follows. C16PyCl was added to the deionized water at 2.6 wt.%, while Na2SnO3·4H2O was dissolved in the deionized water at 3.6 wt.%. In this case, Na2SnO3·4H2O aqueous was mixed with the C16PyCl solution at a molar ratio [C16PyCl]/[Na2SnO3·4H2O] = 2.0. Then, trimethylbenzene was added to the solution at a molar ratio [C6H3(CH3)3]/[Na2SnO3·4H2O] = 2.5. The pH of the mixture was then adjusted to 10 with an aqueous 35 wt.% HCl solution. The resultant emulsion solution was aged for 2 days at 25 °C. After suction filtration with deionized water and drying, the resultant solid products were treated with a 0.1 M aqueous phosphoric acid (PA) solution for 2 h with magnetic stirrers. Then, it was filtered off, washed and dried at 60 °C for 12 h. Eventually, the solid was calcined at 600 °C for 5 h in air. After calcination, the powders were subjected to mechanical grinding with an agate mortar.
The crystal phases of the m-SnO2 powders were characterized via X-ray diffraction analysis (XRD, D8 Adwance, Bruker, Karlsruhe, Germany). The specific surface area and pore size distribution were measured by the Brunauer–Emmett–Teller (BET) method using a N2 adsorption isotherm (BET, ASAP 2020, Micromeritics, Norcross, GA, USA). Morphology of the m-SnO2 powders was observed by a transmission electron microscope (TEM, JEM2100F STEM/EDS, JEOL, Tokyo, Japan) and the morphology of the commercial SnO2 (c-SnO2) powders was observed by a scanning electron microscope (SEM, JSM-IT300, JEOL, Tokyo, Japan).
2.2. Fabrication of SnO2 Sensors
Pastes of the c-SnO2 powders and the as-prepared m-SnO2 powders were applied on a substrate (30 mm × 6 mm × 0.625 mm), on which interdigitated Pt electrodes had been printed with mechanically automated screen printing technology, as shown in Figure 1.
The thick film gas sensors were fabricated using screen printing technology. For the first layer, the c-SnO2 powders were mixed with the printing oil (YY-1010, Wuhan Huachuang Ruike Tech. Co. LTD, Wuhan, China) at the mass ratio of 1:1 as the paste. Furthermore, to improve the stability of the gas sensors, the frit of PbO, B2O3, and SiO2 (mass ratio [PbO]/[B2O3]/[SiO2] = 45/35/20) was added into the c-SnO2 powders at the level of 2 wt.%. The substrates were treated with drying at room temperature for 10 min and 50 °C for 1 h when the pastes were printed on them. For modified layer, the paste was mixed with the m-SnO2 powders and the printing oil at the same mass ratio of 1:1. To prepare more modified layers, simply repeat the printing step above. Eventually, the gas sensors were dried at 50 °C for 1 h and calcined at 650 °C for 2 h. The different fabricated gas sensors are listed in Table 1.
The surface morphology of the prepared gas sensors was observed by a scanning electron microscope (SEM, Zeiss Utral Plus, Cari Zeiss AG, Jena, Germany). The cross-sections of the different SnO2 films were observed by a scanning electron microscope (SEM, S-4800, HITACHI, Tokyo, Japan).
2.3. Measurement of Sensing Performance
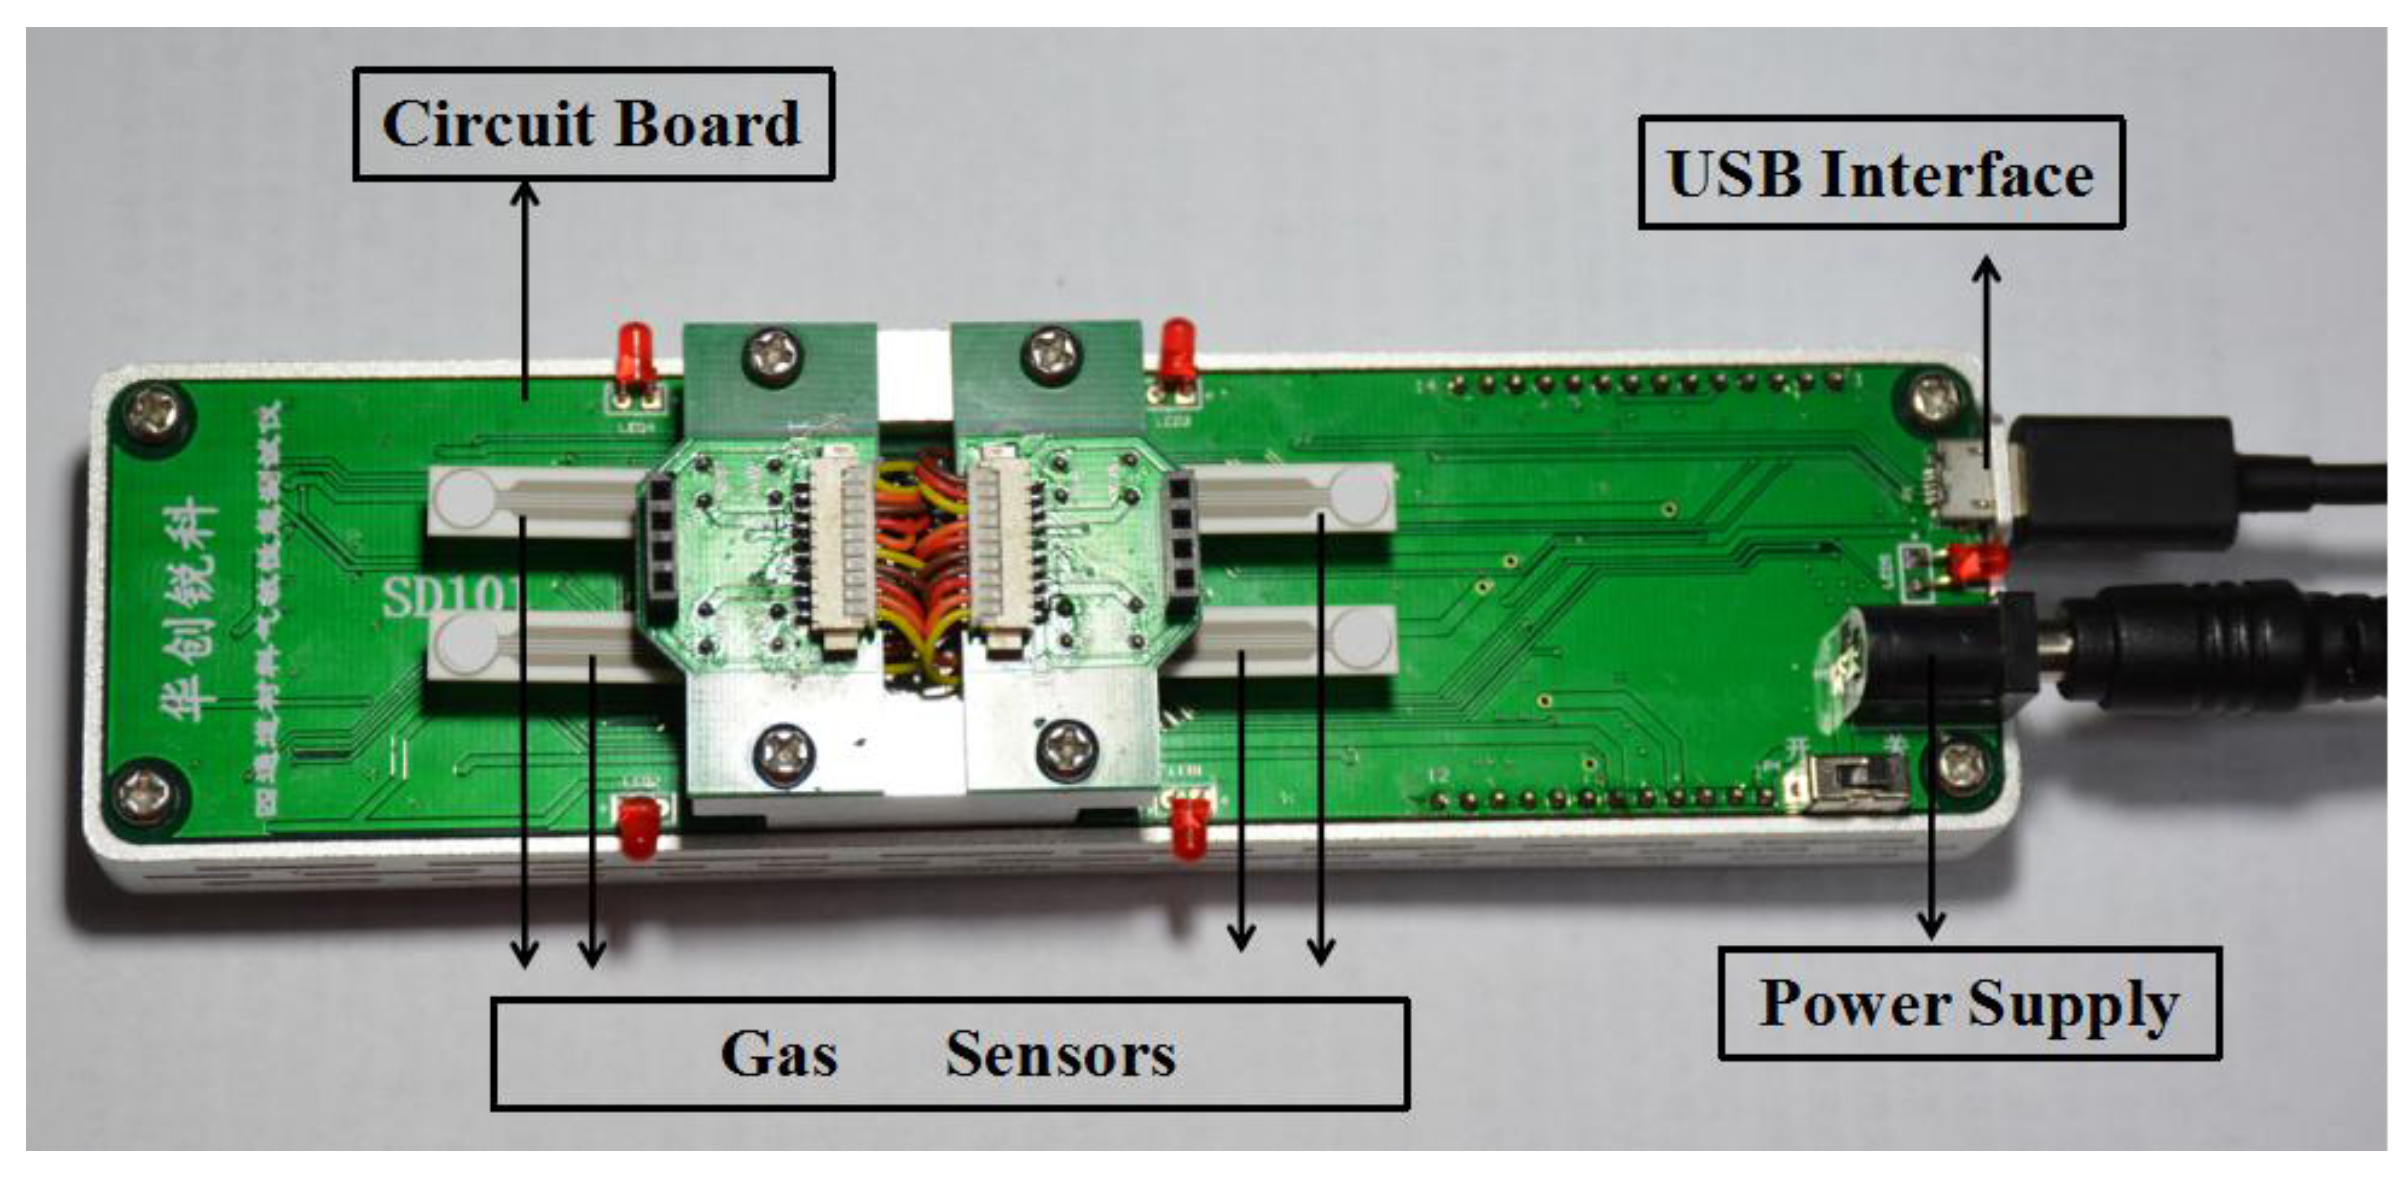
The gas sensors were measured by a commercial SD-101 gas sensing performance testing device (Wuhan Huachuang Ruike Tech. Co. LTD, Wuhan, China) which can be used with four gas sensors to test their gas sensing performance simultaneously (Figure 2). The operating temperature can be controlled via adjusting the power of the heater coil by a microprocessor. The operating temperature of the gas sensors is in the range of room temperature to 450 °C.
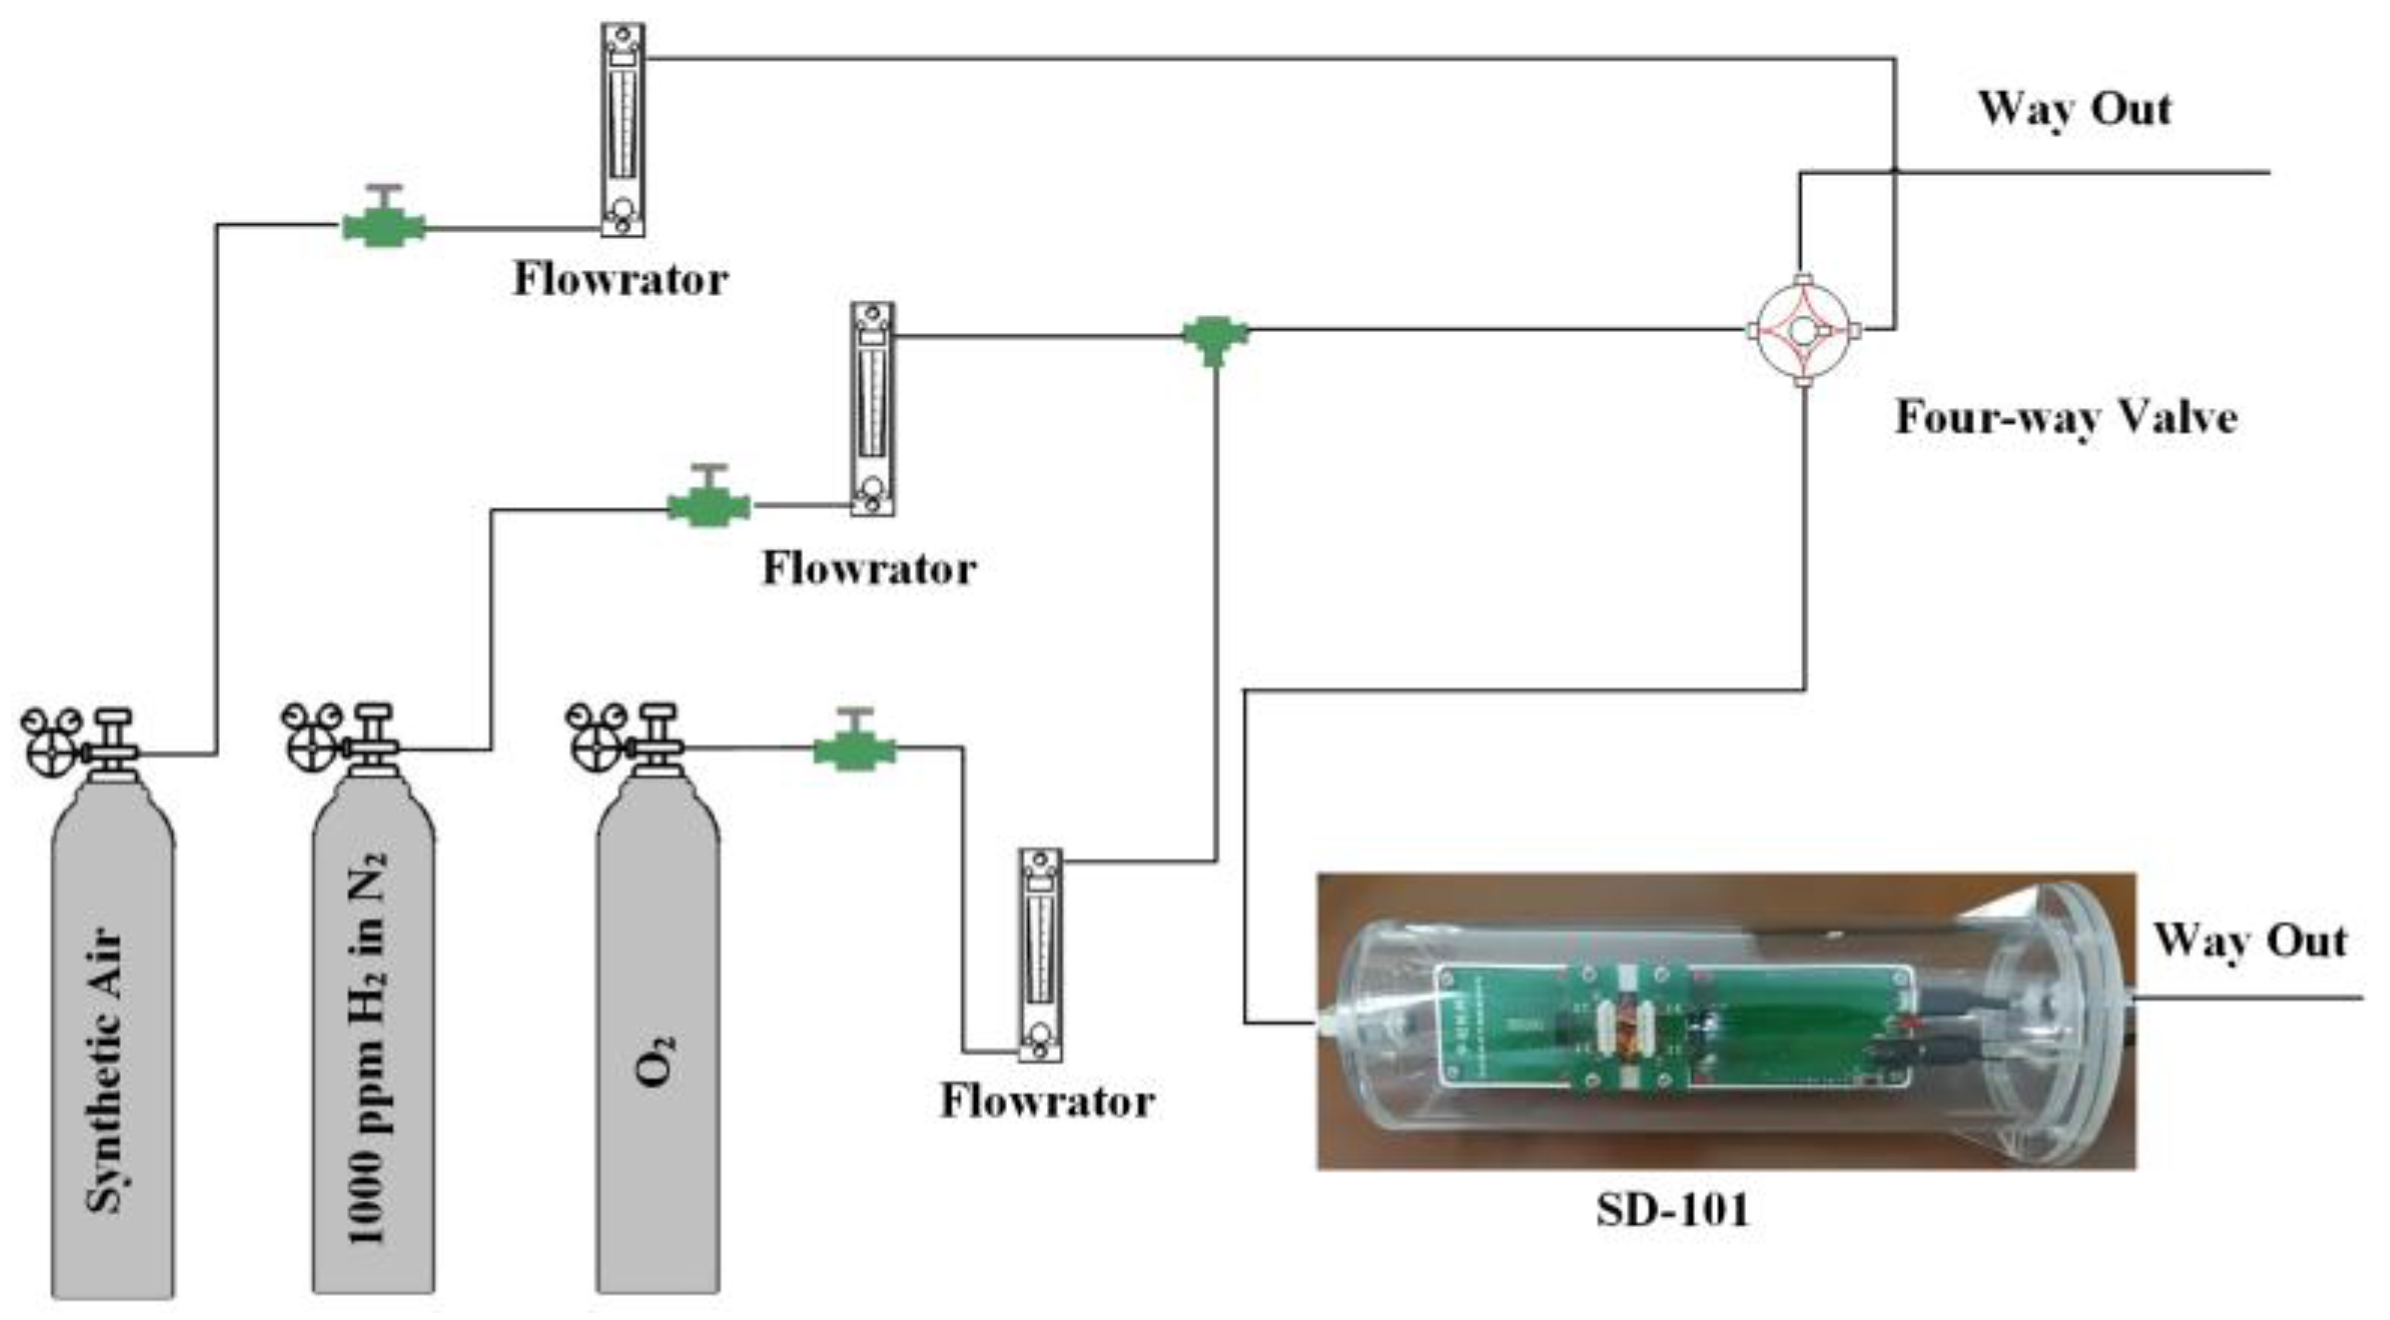
The prepared gas sensors were measured to sense 1000 ppm H2 with dynamic method and 10 ppm ethanol and benzene with static method at the temperature of 200 °C, 250 °C, 300 °C, 350 °C and 400 °C. In the process of dynamic measurement, the SD-101 gas sensing performance testing device was placed in a cylinder of 60 mm in diameter, which is made of polymethyl methacrylate (PMMA). The testing gas flowchart is shown in Figure 3.
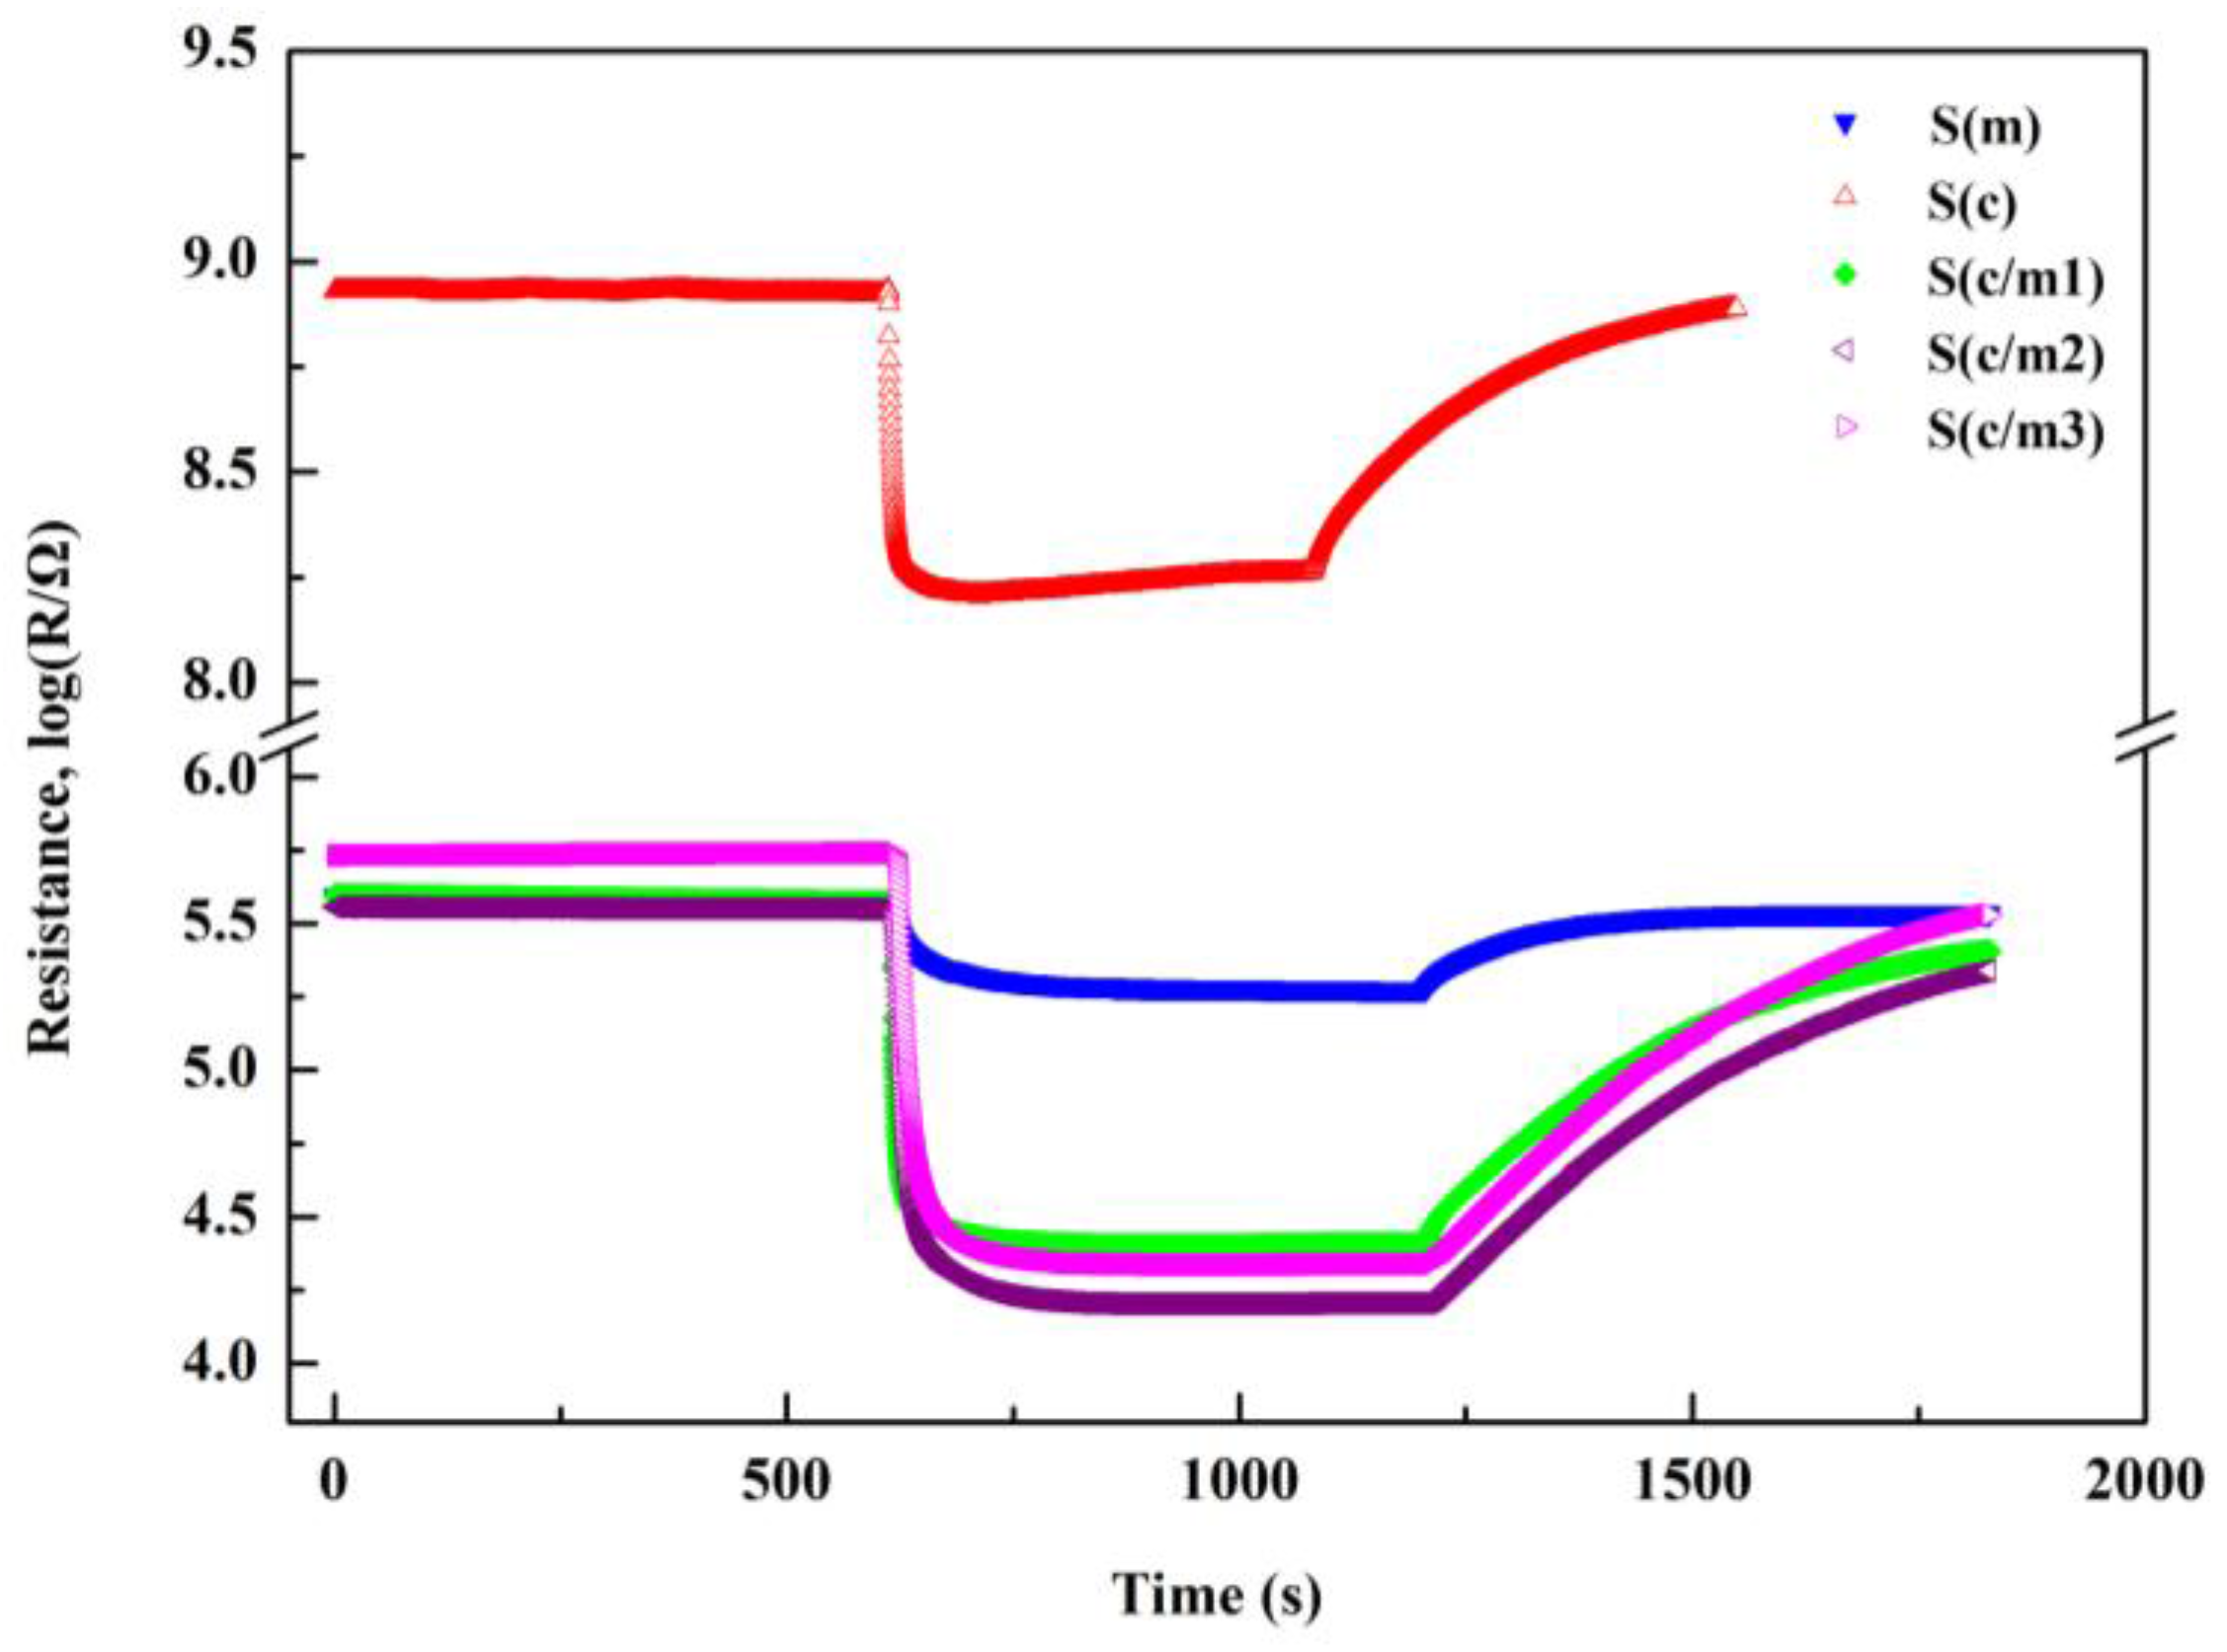
The synthetic air, whose flow rate was set as 250 mL/min, consisted of N2 and O2 at the volume ratio of 4:1. To match with the synthetic air, the volume ratio of the 1000 ppm H2 in N2 and O2 was also set as 4:1 with the flow rate of 200 mL/min and 50 mL/min, respectively. During the testing process, the synthetic air was replenished by adjusting the four-way valve. The four-way valve is first turned to let the hydrogen in when the response was stabilized. When the response was stabilized, the four-way valve is turned to lead the synthetic air to go through the cylinder until the sensors recover from the hydrogen. The response transients of the gas sensors to 1000 ppm H2 at 400 °C is shown in Figure 4. It is obvious that all the gas sensors exhibit stable and quick response. In the process of dynamic measurement, the SD-101 gas sensing performance testing device was placed in a cubic evaporated cavity for 50 L. During the testing process, the corresponding quantities of the organic solution (ethanol and benzene) were injected by a micro-injector on a heating panel in the evaporated cavity, when the gas sensors responses to air stabilized. When the response to the test gas stabilized, the cubic testing cavity was opened for recovery.
The response is defined as Ra/Rg, where Ra and Rg are the sensor resistances in air and in the test gas, respectively. The response time is generally defined as the time necessary for achieving a 90% resistance change to the steady-state value. The recovery time is defined as the time for sensor resistance to reach 90% of air resistance.
3. Results and Discussion
3.1. Characterization of the c-SnO2 Powders and the m-SnO2 Powders
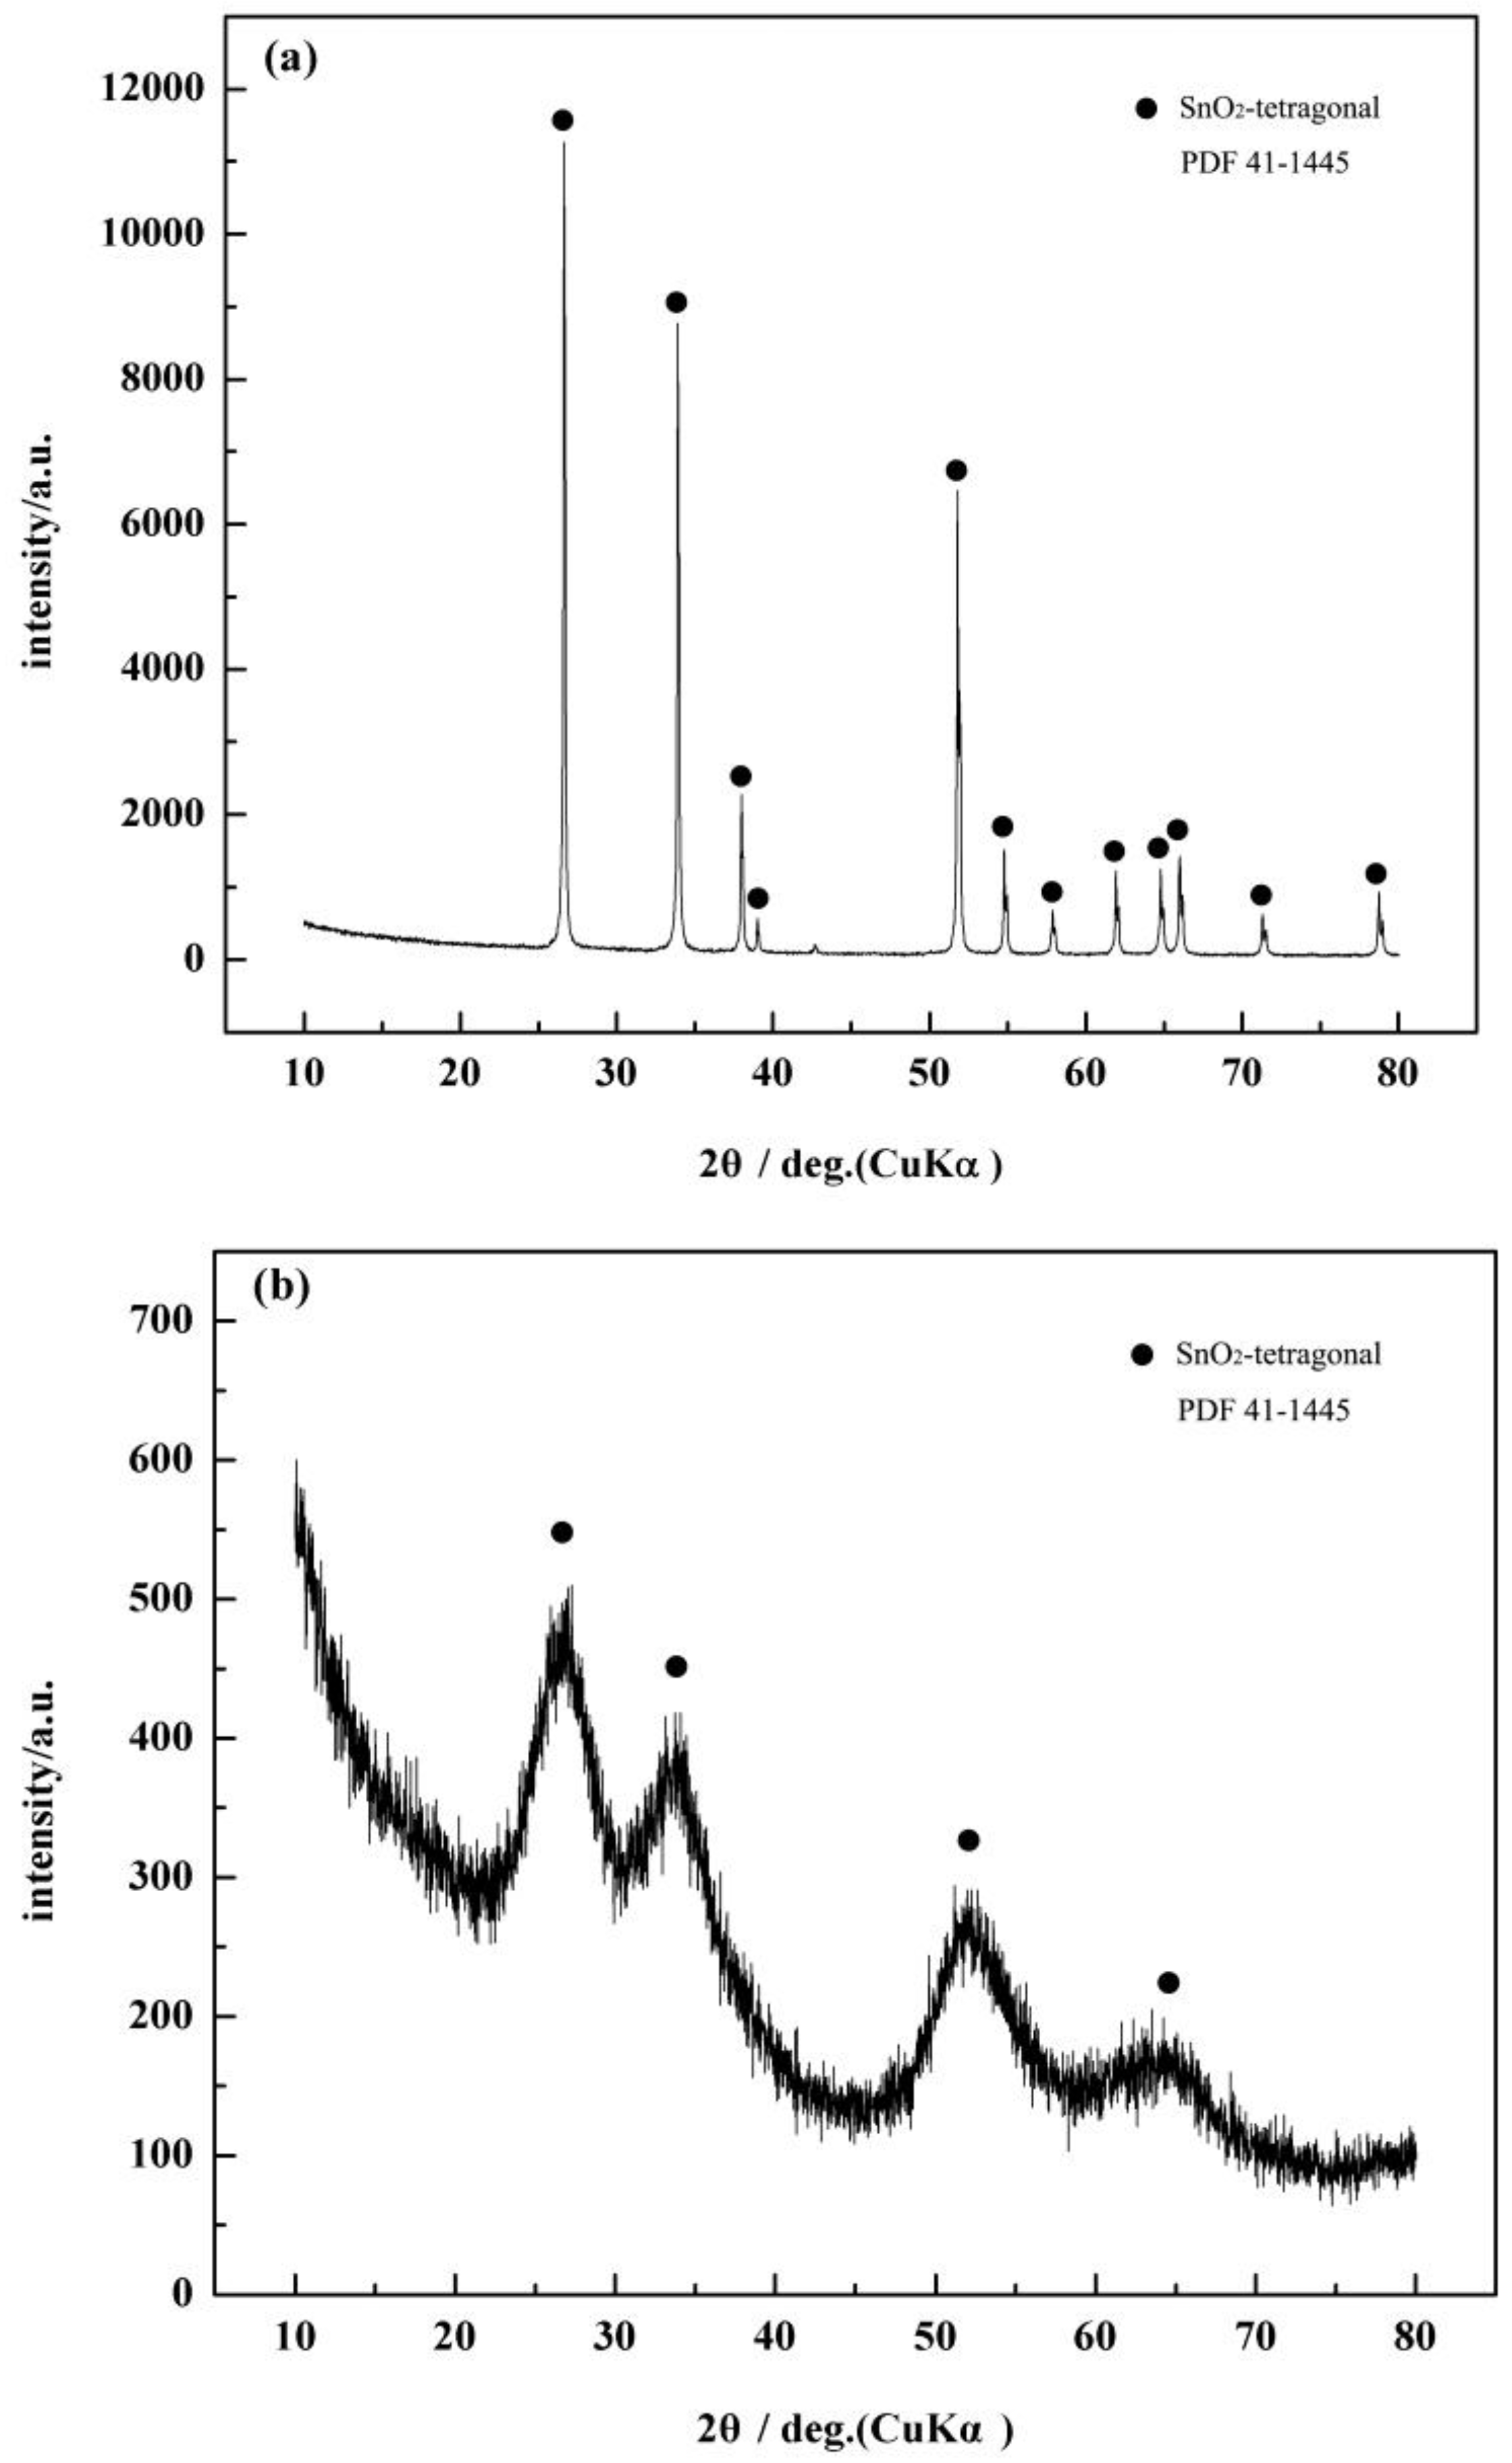
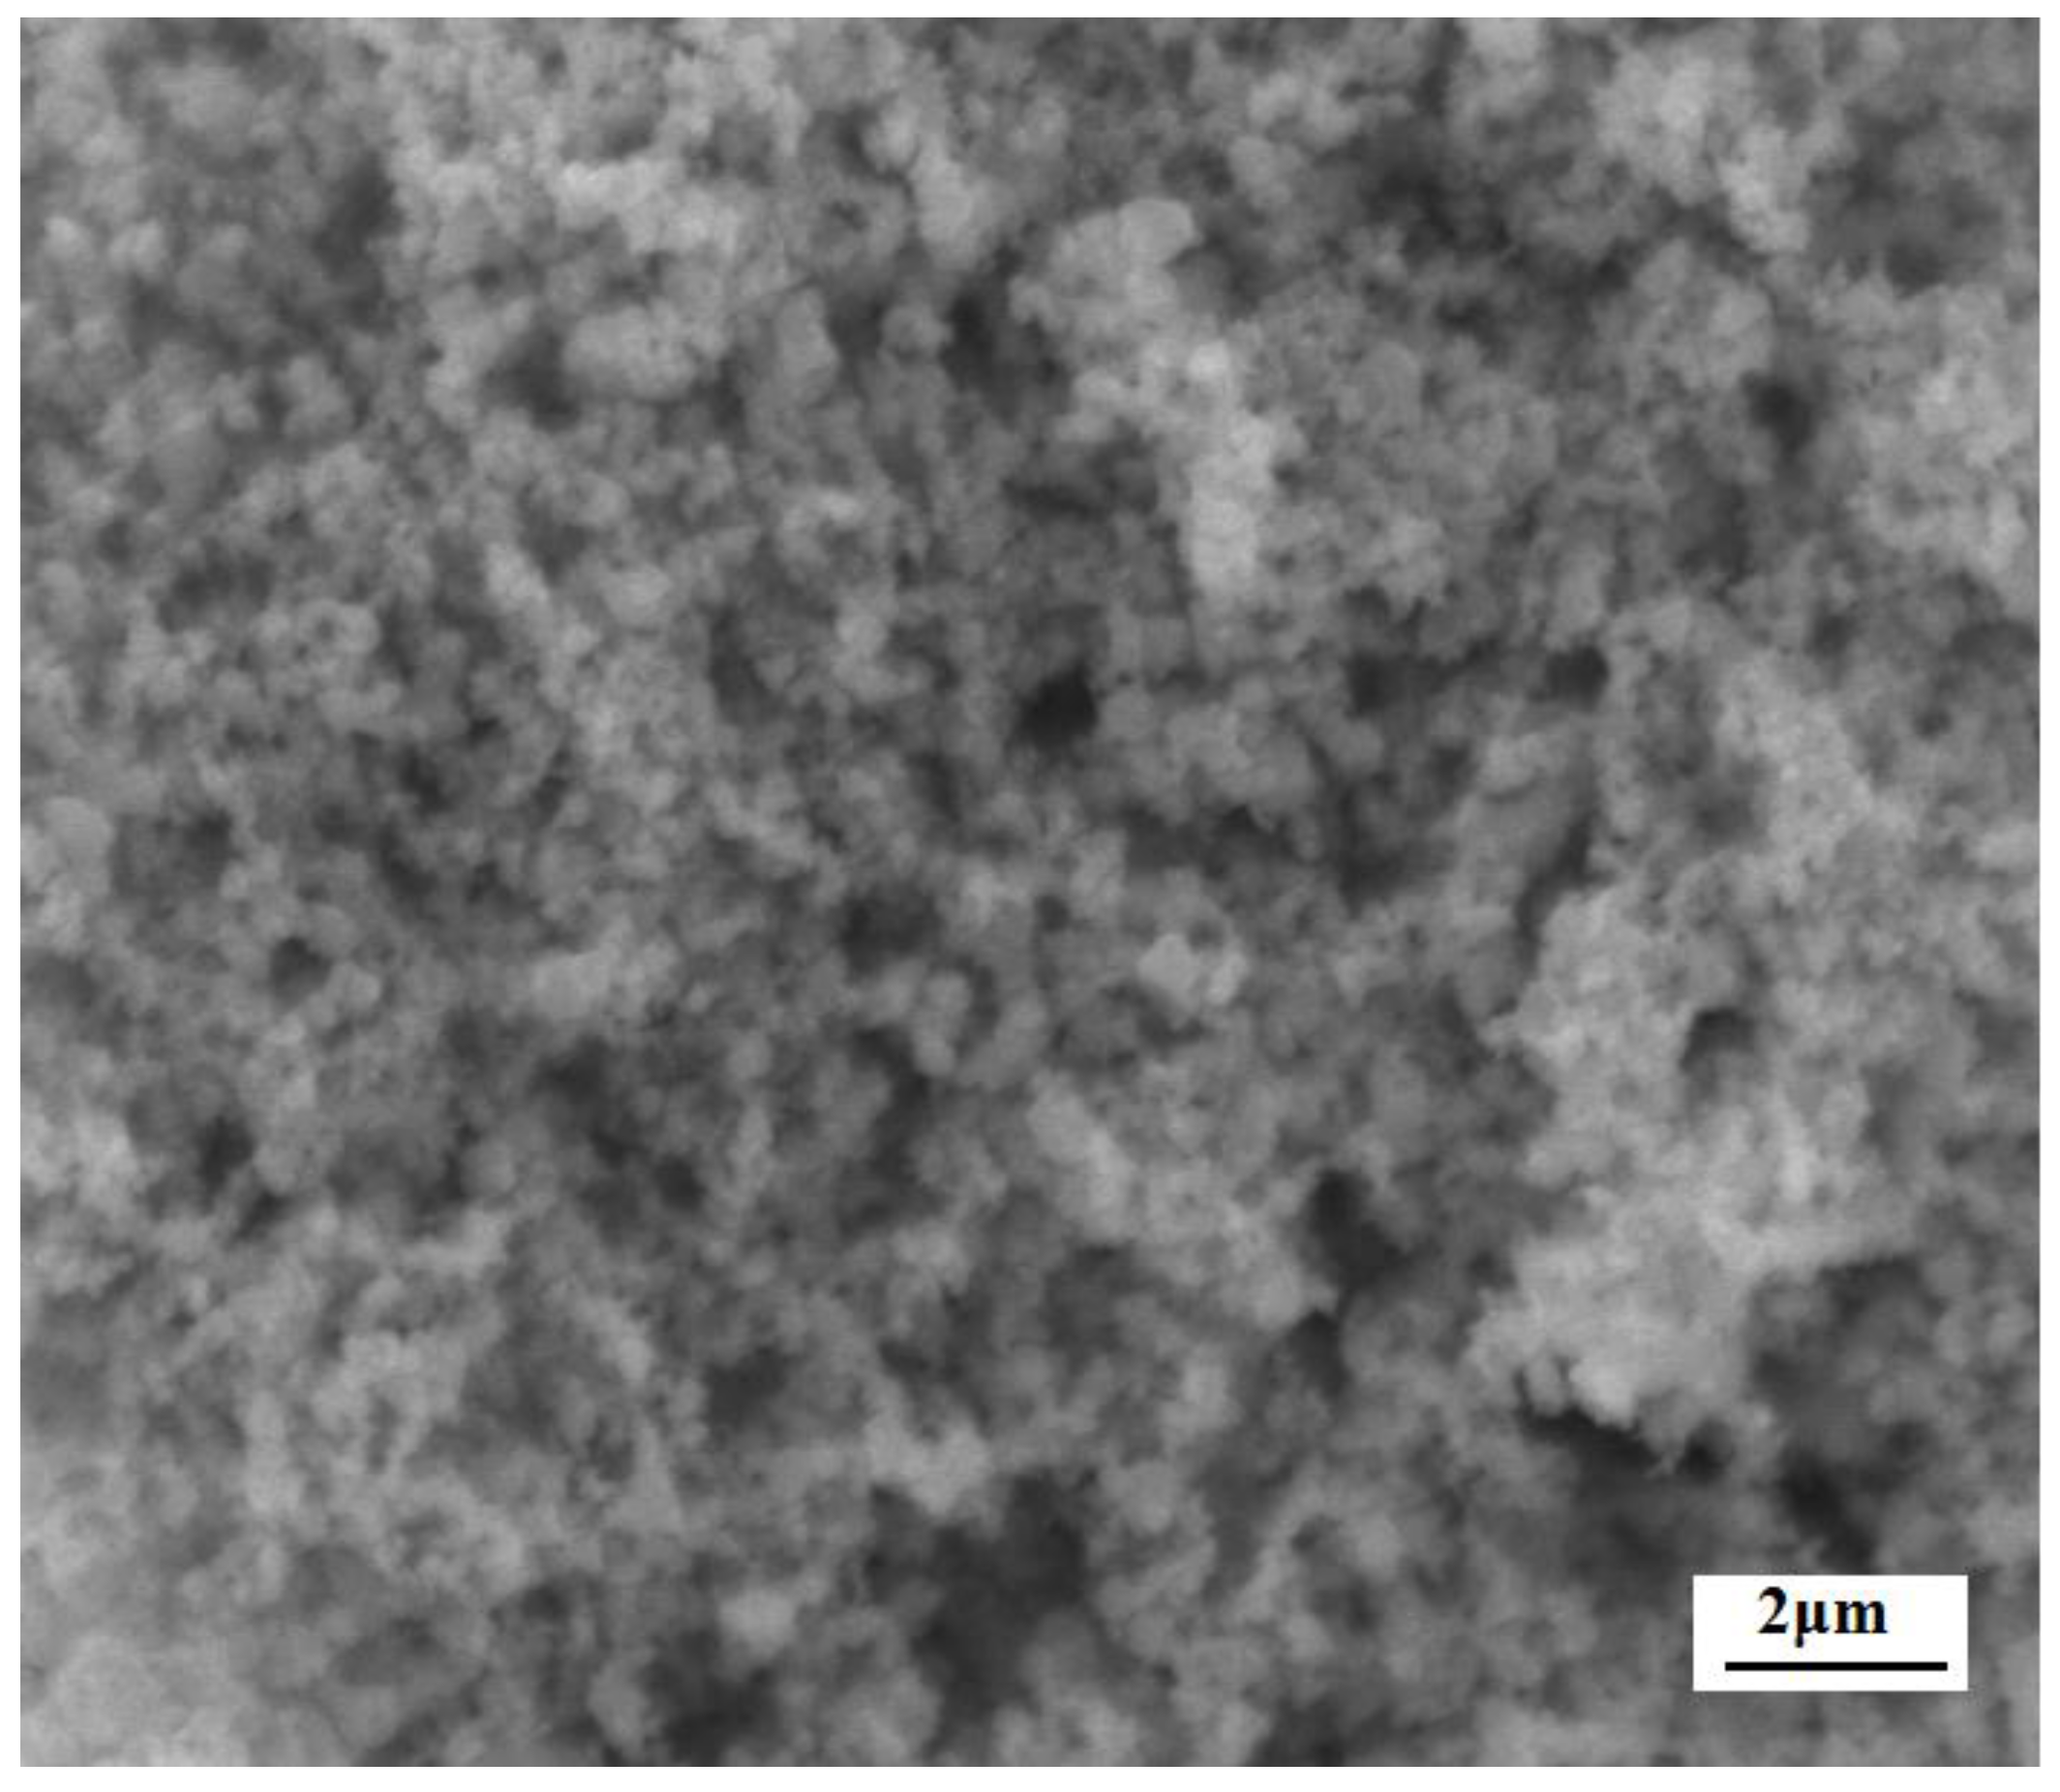
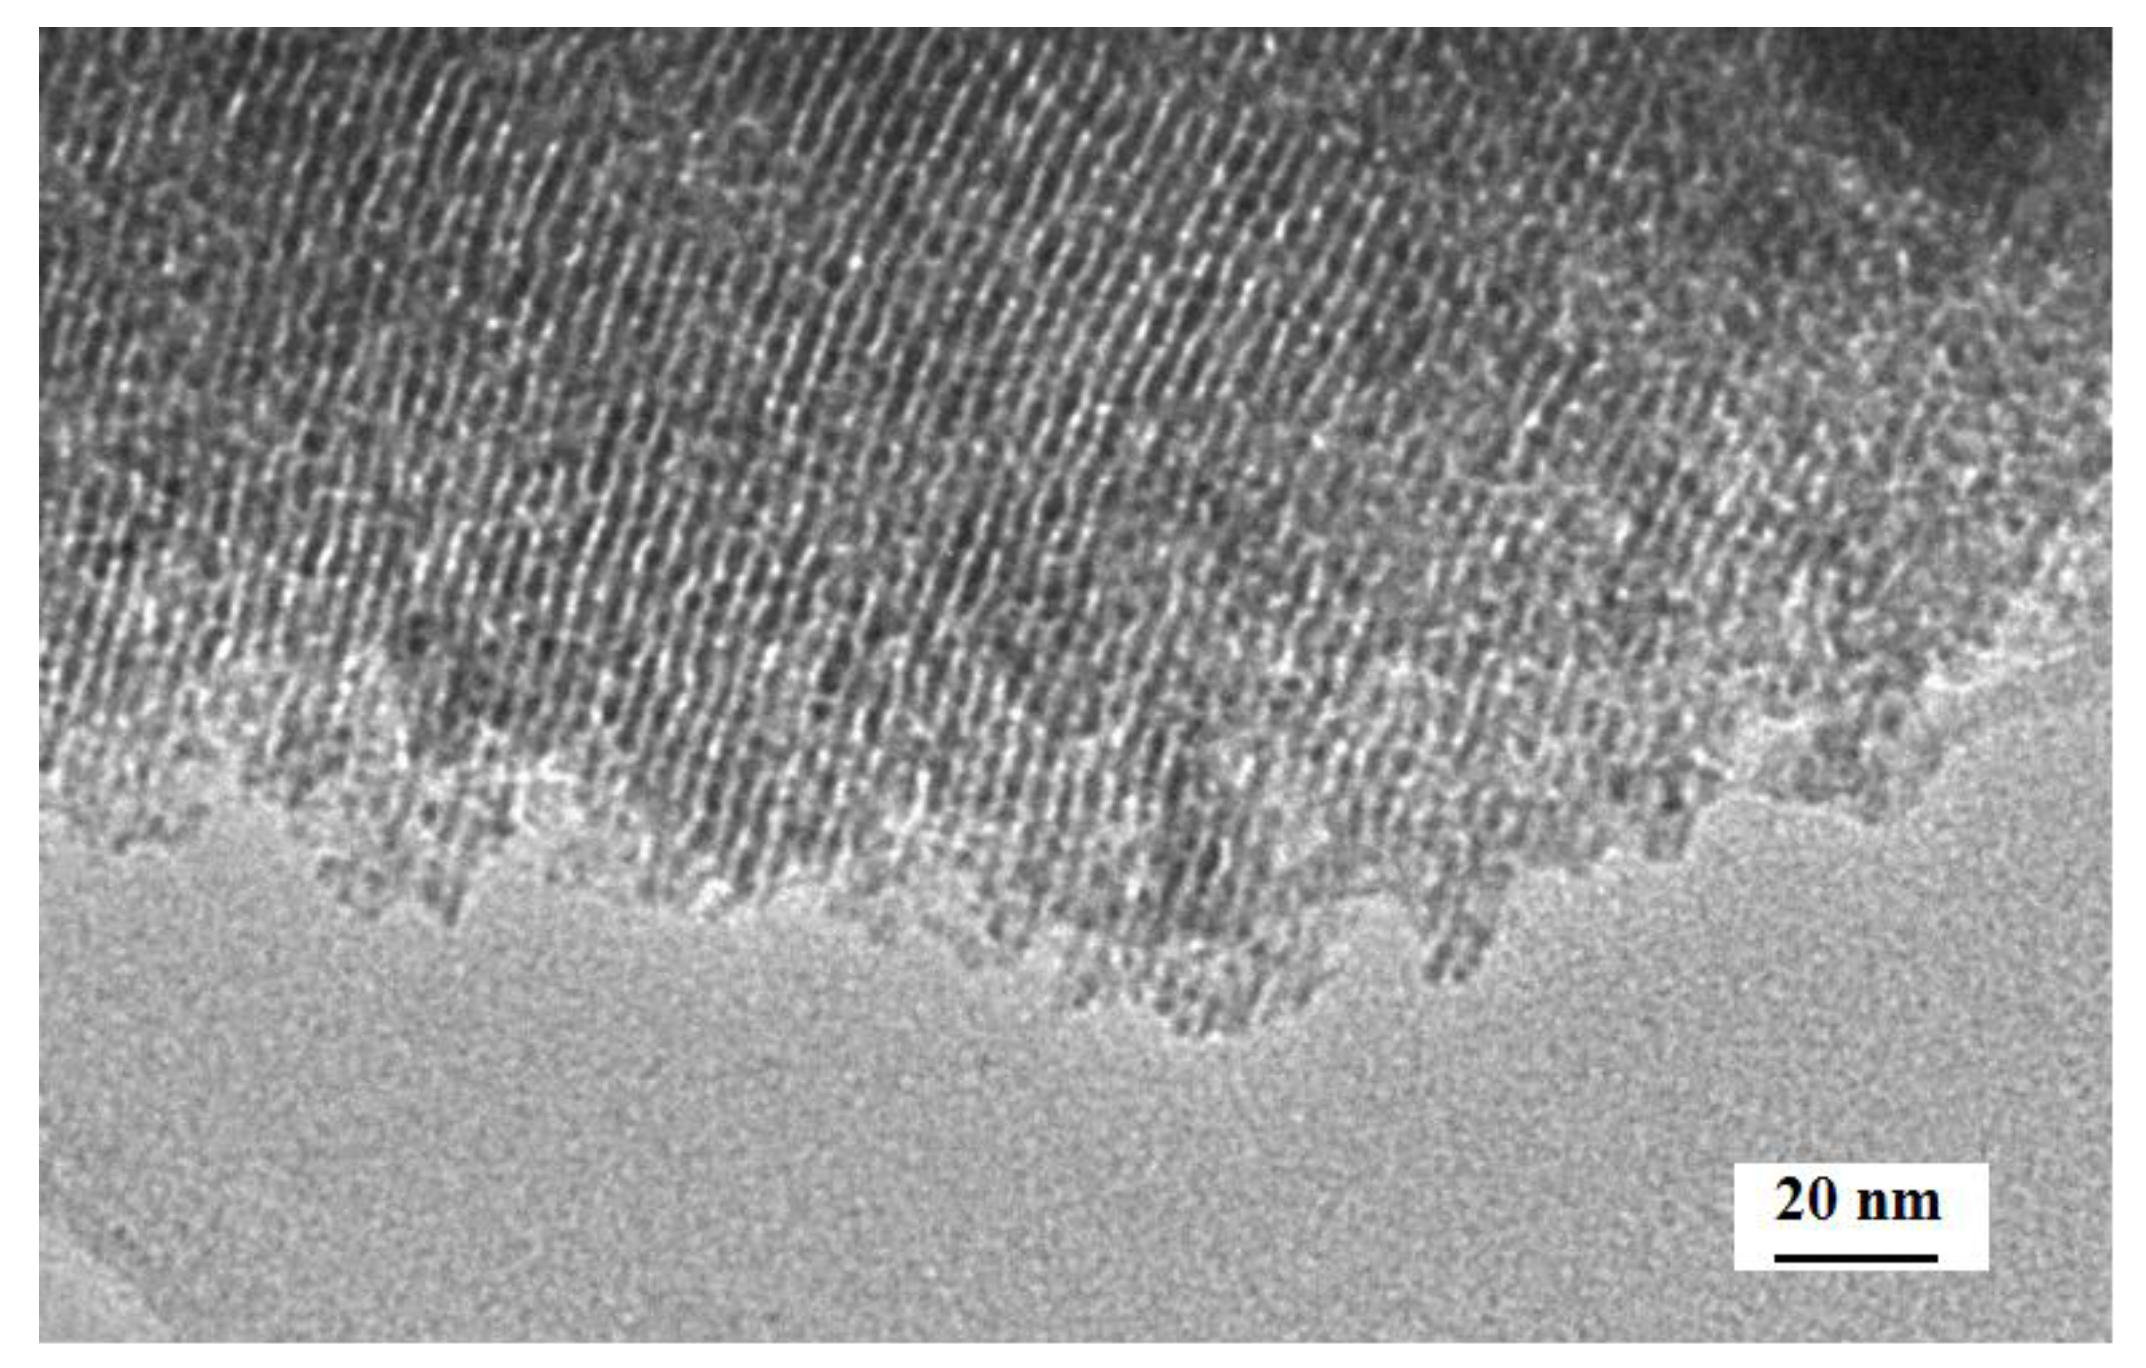
Figure 5 shows XRD patterns of the c-SnO2 powders (Figure 5a) and the m-SnO2 powders (Figure 5b). The c-SnO2 powders have peaks corresponding to the SnO2 crystalline phase (PDF 41-1445). This implies that the c-SnO2 powders are well-crystallized, and have a tetragonal SnO2 phase. The crystallite size of the c-SnO2, calculated by Scherrer’s equation (Jade), is about 65.5 nm. It is also confirmed by the SEM image (Figure 6). The XRD pattern of the m-SnO2 powders (Figure 5b) shows that they have some main peaks corresponding to SnO2 crystalline phase. It reveals that the prepared m-SnO2 powders have low crystallinity. In addition, the ordered mesoporous structure is confirmed clearly by the TEM observation of the m-SnO2 powders in Figure 7. The pore size distribution and the specific surface area of the m-SnO2 powders are shown in Figure 8. It is clear that the m-SnO2 powders show a large SSA of 262.30 m2/g with a small pore size of 2.6 nm.
3.2. Characterization of Gas Sensors
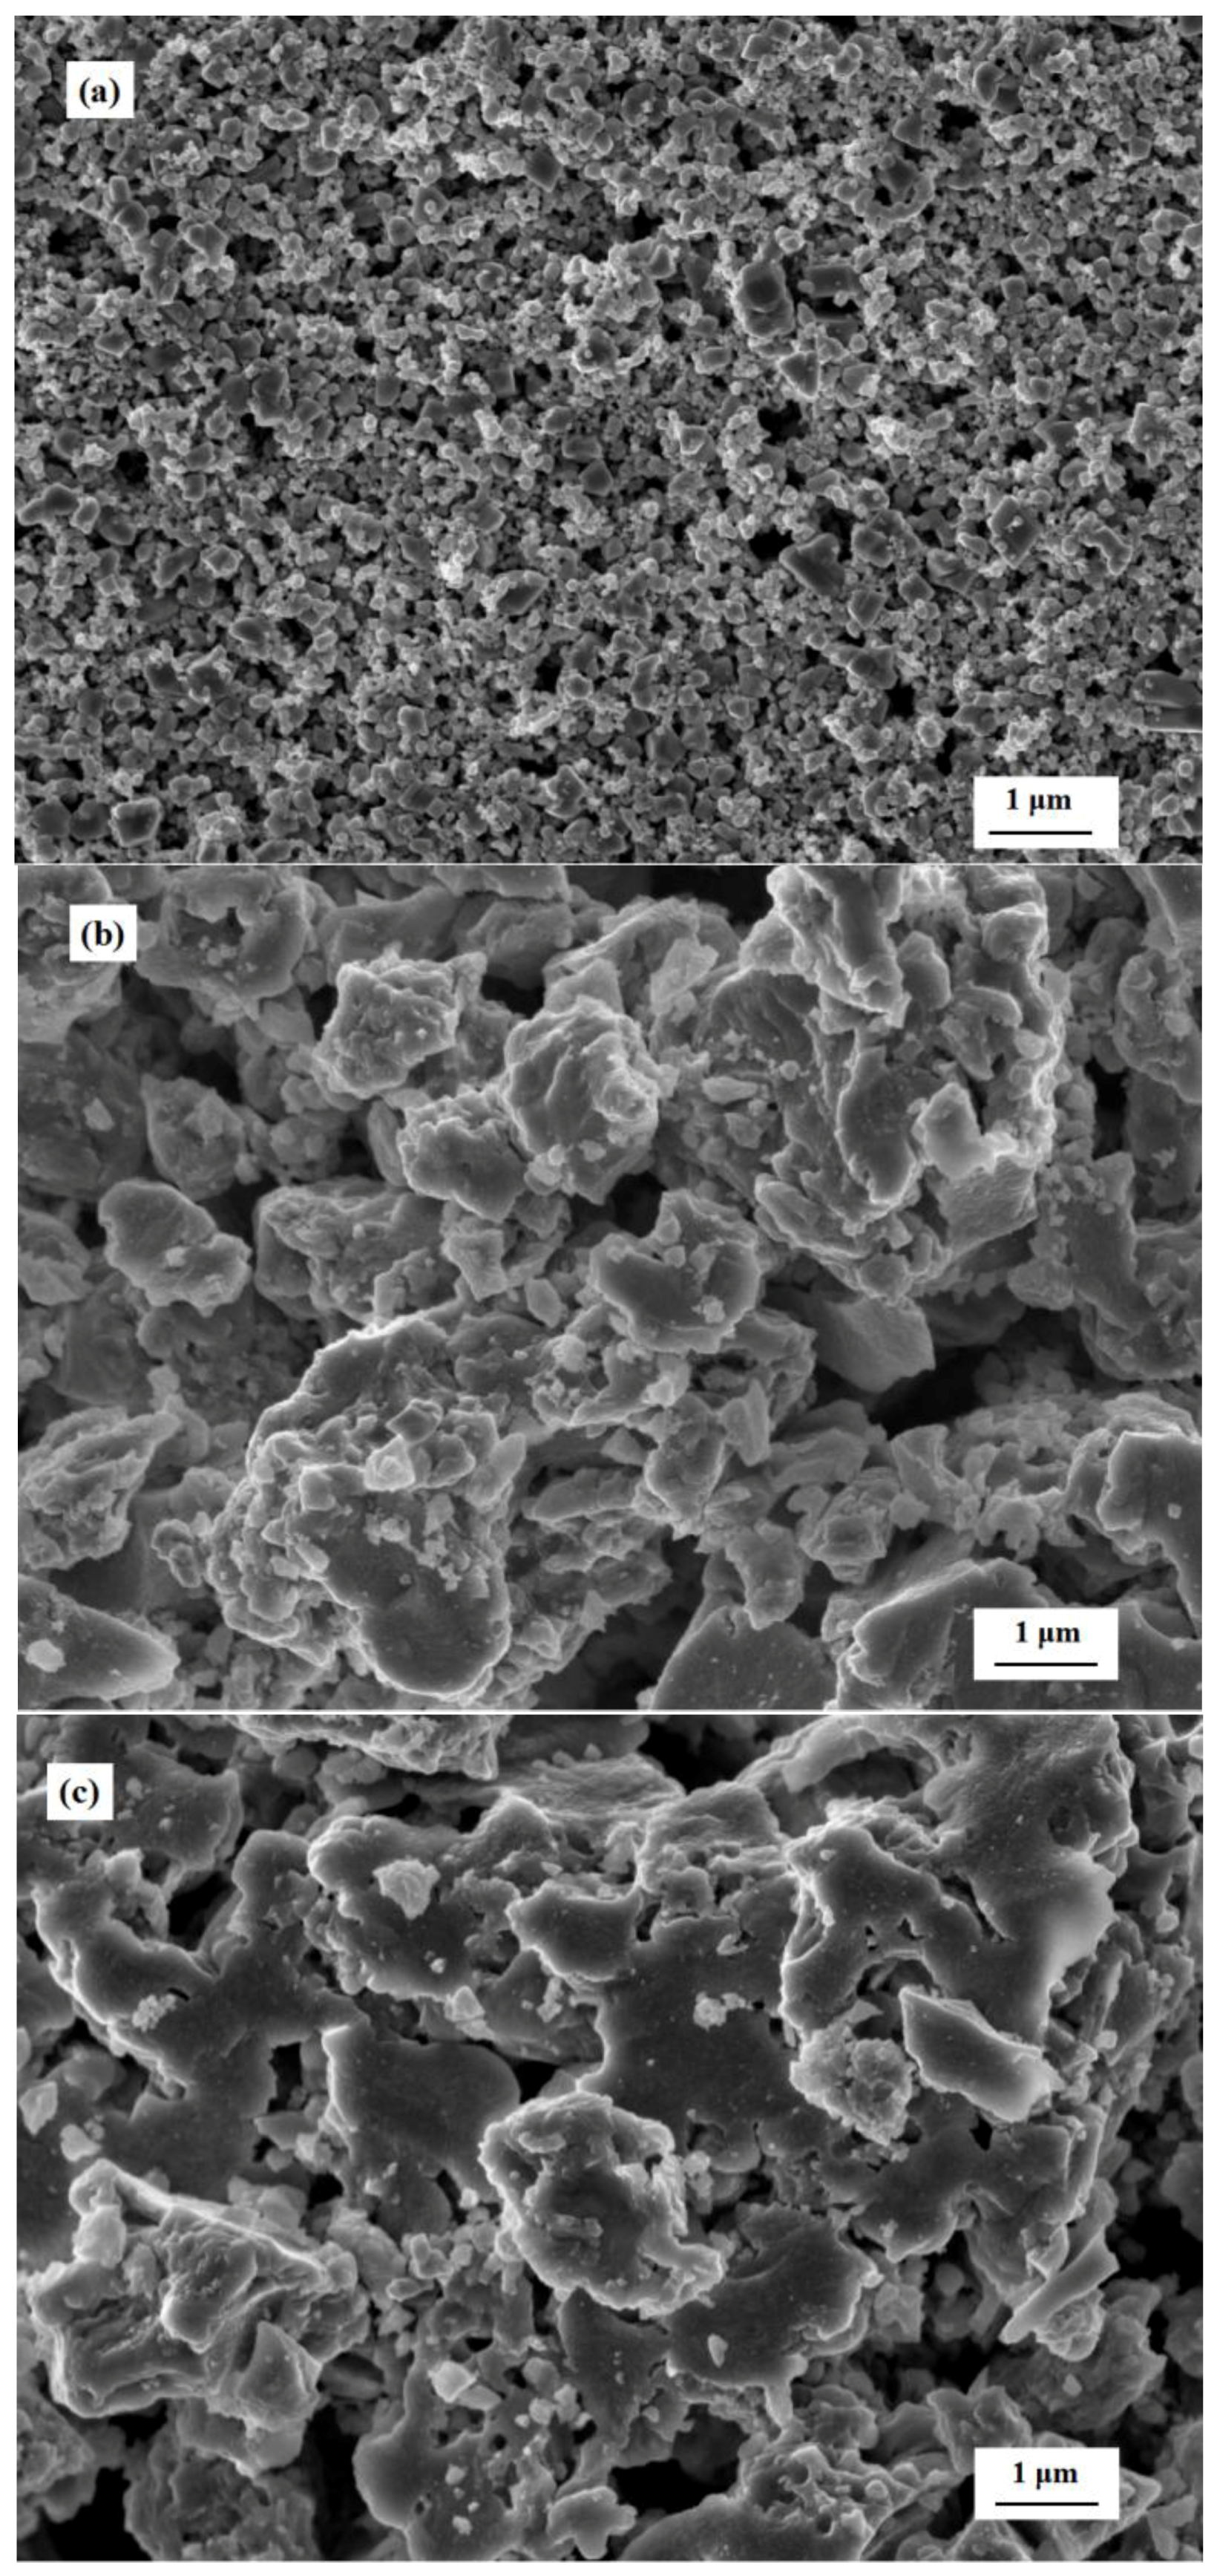
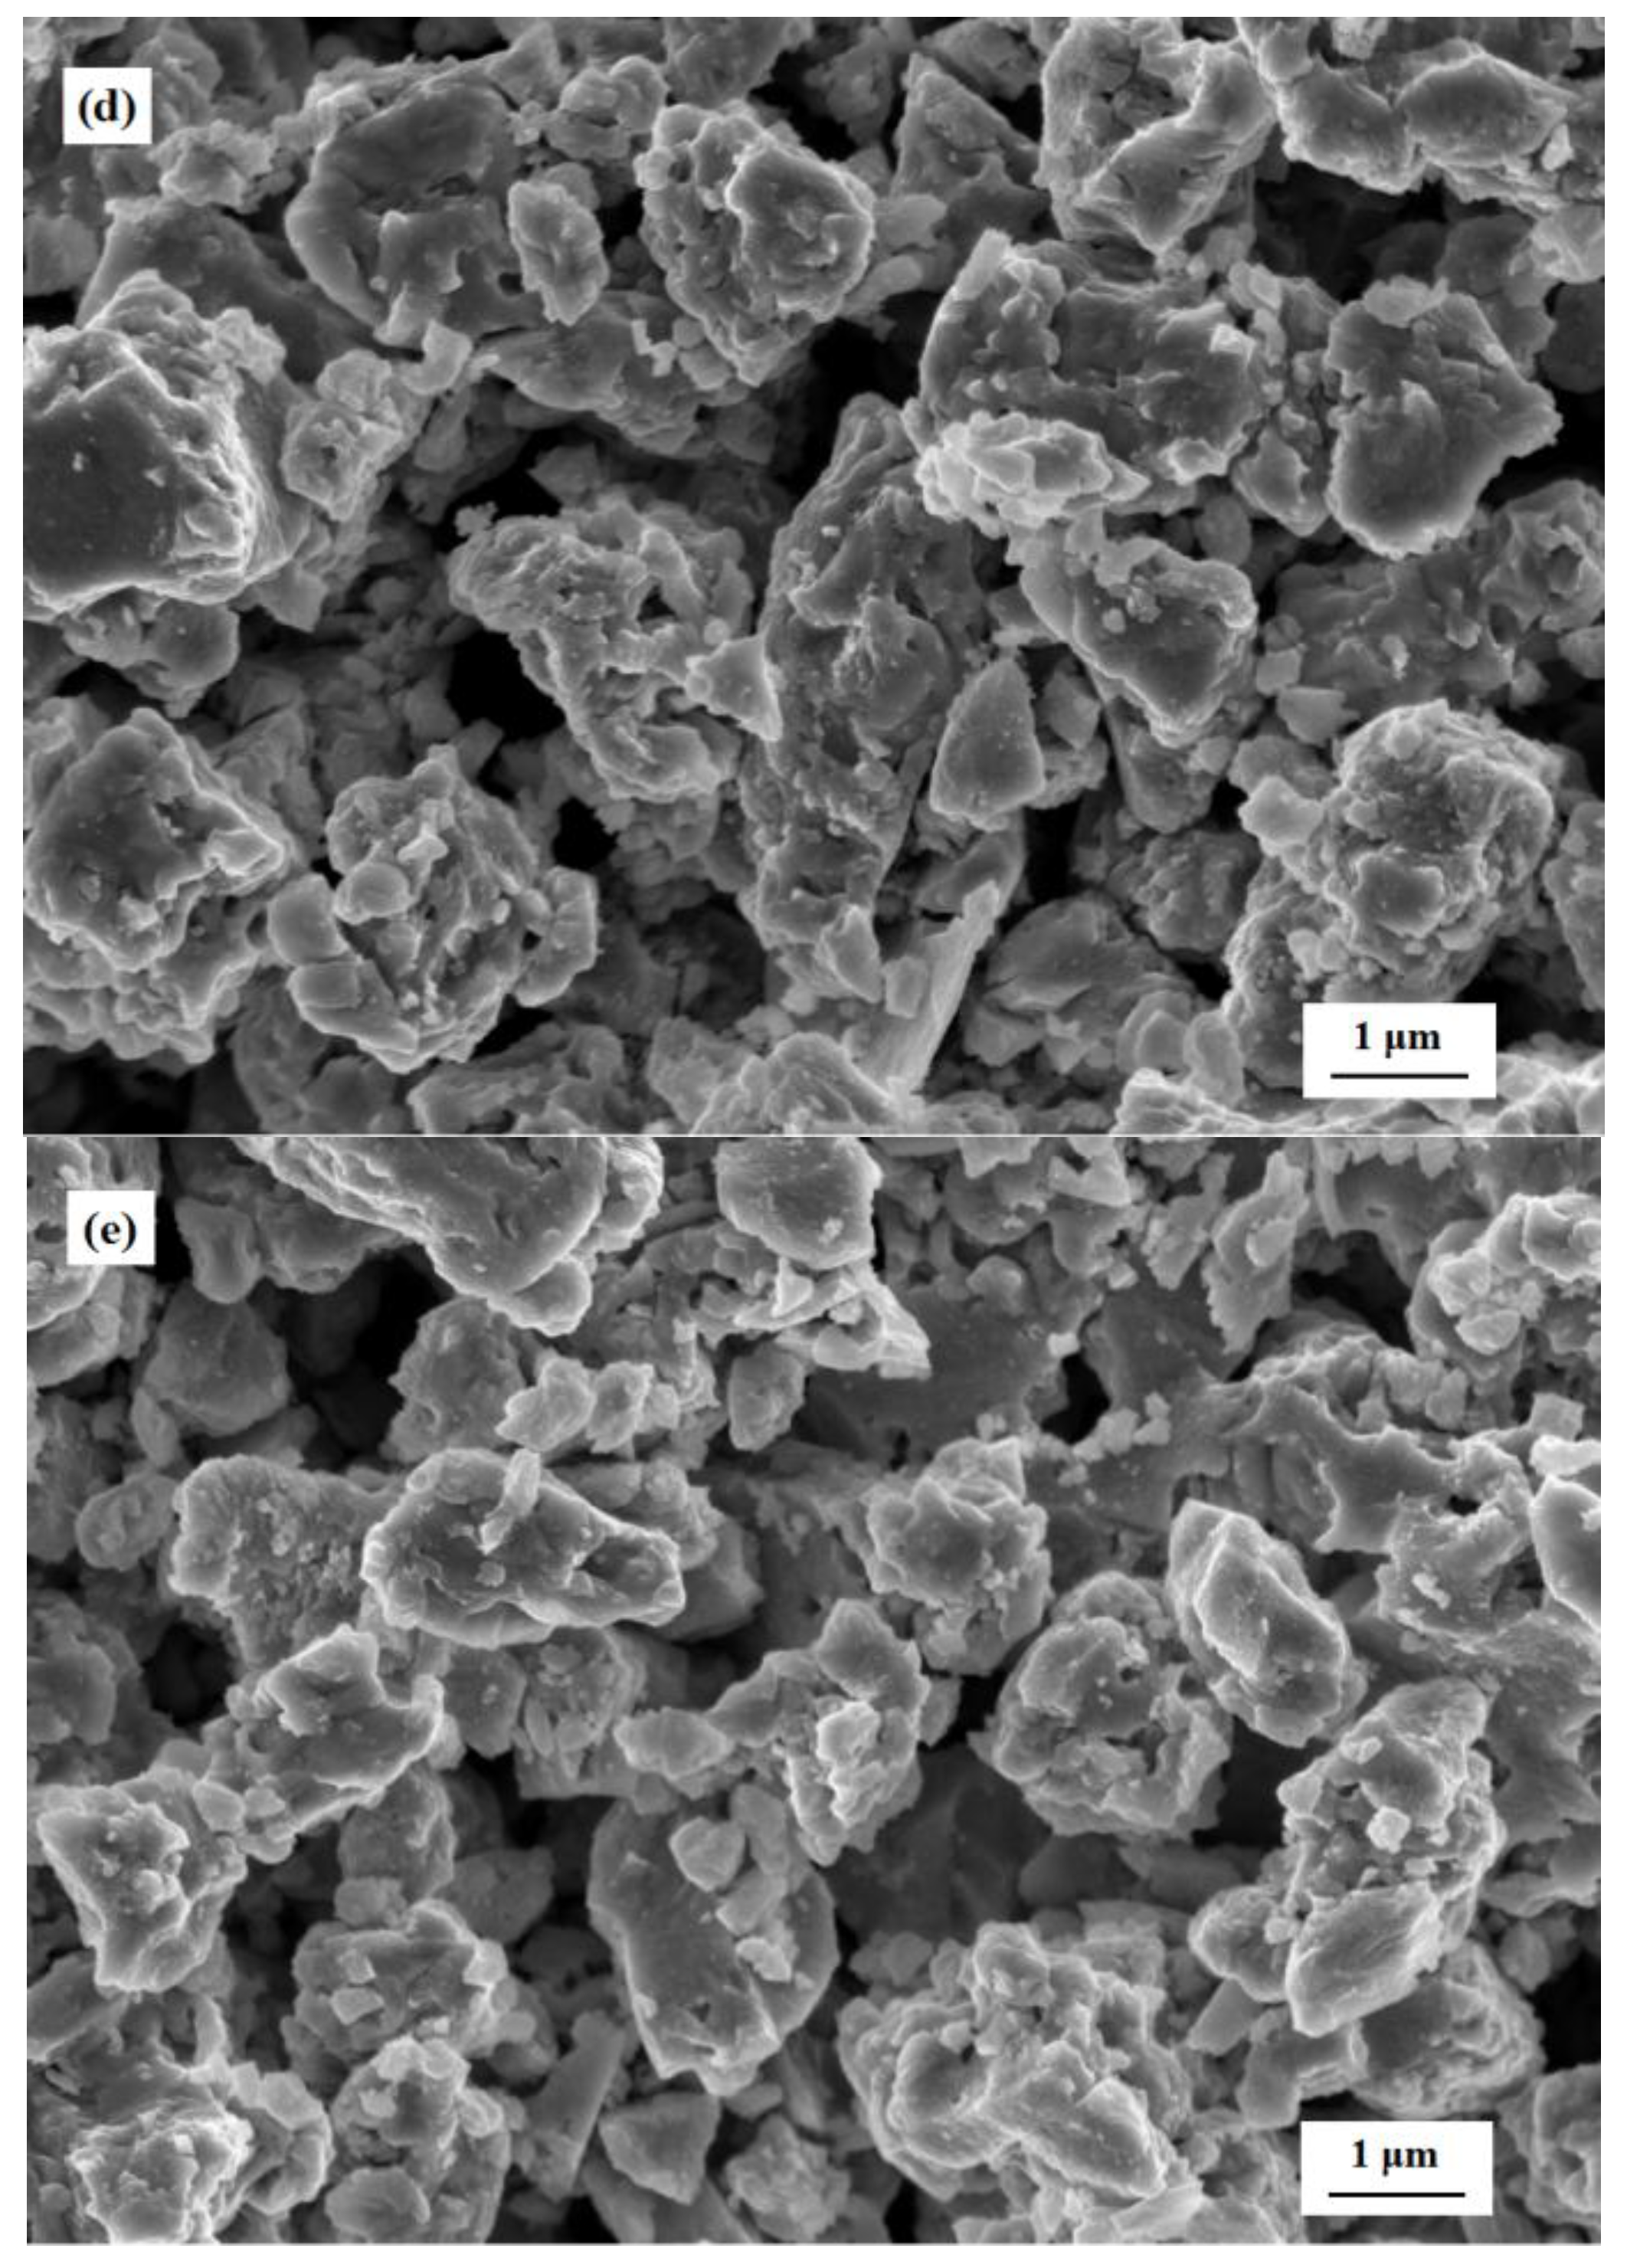
Figure 9 shows the SEM images of the surface morphology of the gas sensors. It was found that the basic layers of the S(c) sensor were dense and have flat surfaces (see Figure 9a). Moreover, the S(c) sensor appeared to have a particle size of approximately dozens of nanometers, despite a small quantity of lager particles. The calcination resulted in some sintered macropores with a size of several hundred nanometers. In contrast, the film of the S(m) sensor show rough and loosened surfaces, as shown in Figure 9b. It is obvious that the S(m) sensor film showed lager particles (100–200 nm) than that of the S(c) sensor film due to the agglomerations of the particles. The agglomerations of the m-SnO2 were extremely distinct from those of c-SnO2. Furthermore, the calcination of the S(m) sensor resulted in lager sintered macropores. The surface morphology of the other sensors is similar to those of the S(m) sensor (see Figure 9c–e) because of the same printing materials and printing process.
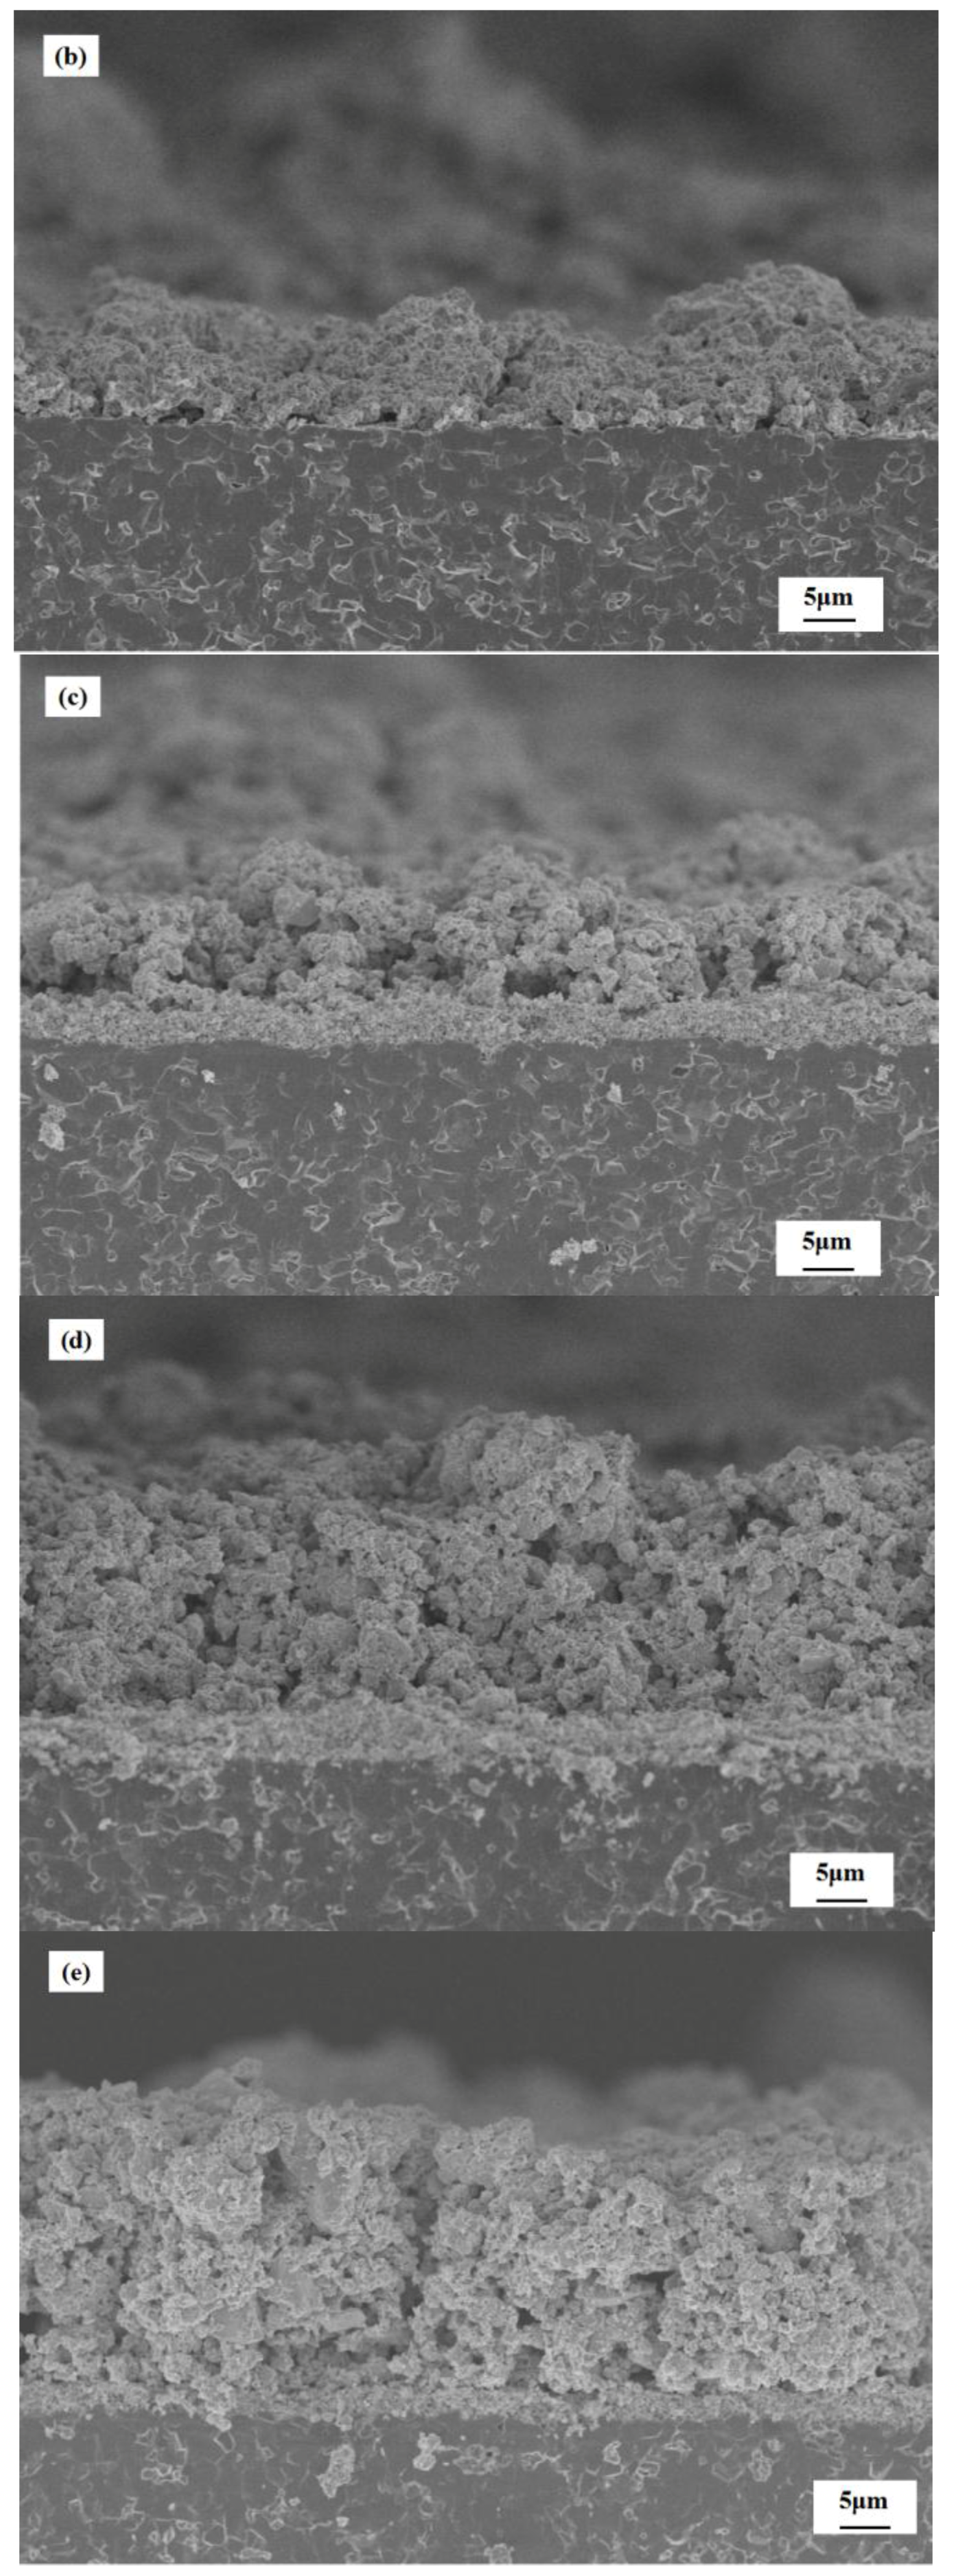
The SEM images of the cross-sections of the gas sensors are shown in Figure 10. The cross-sectional morphology of the S(c) sensor shows that the calcined c-SnO2 was more compact with the thickness of about 5 μm (see Figure 10a), but the modified layers of the m-SnO2 showed relatively loosened morphology (see Figure 10b). It is apparent that there is an obvious stratification between the c-SnO2 basic layer and the m-SnO2 modified layer (see Figure 10c). In addition, fabricated with the same materials and printing manner, the m-SnO2 modified layers had no stratification to each other. The thickness of each m-SnO2 modified layer was confirmed with SEM observation to be about 10–15 µm. Thus, the thickness of the m-SnO2 modified layers of the S(c/m1), S(c/m2) and S(c/m3) sensors were confirmed to be 15 µm, 31 µm and 41 µm, respectively (see Figure 10c–e).
3.3. The Resistance of the Gas Sensors in Air
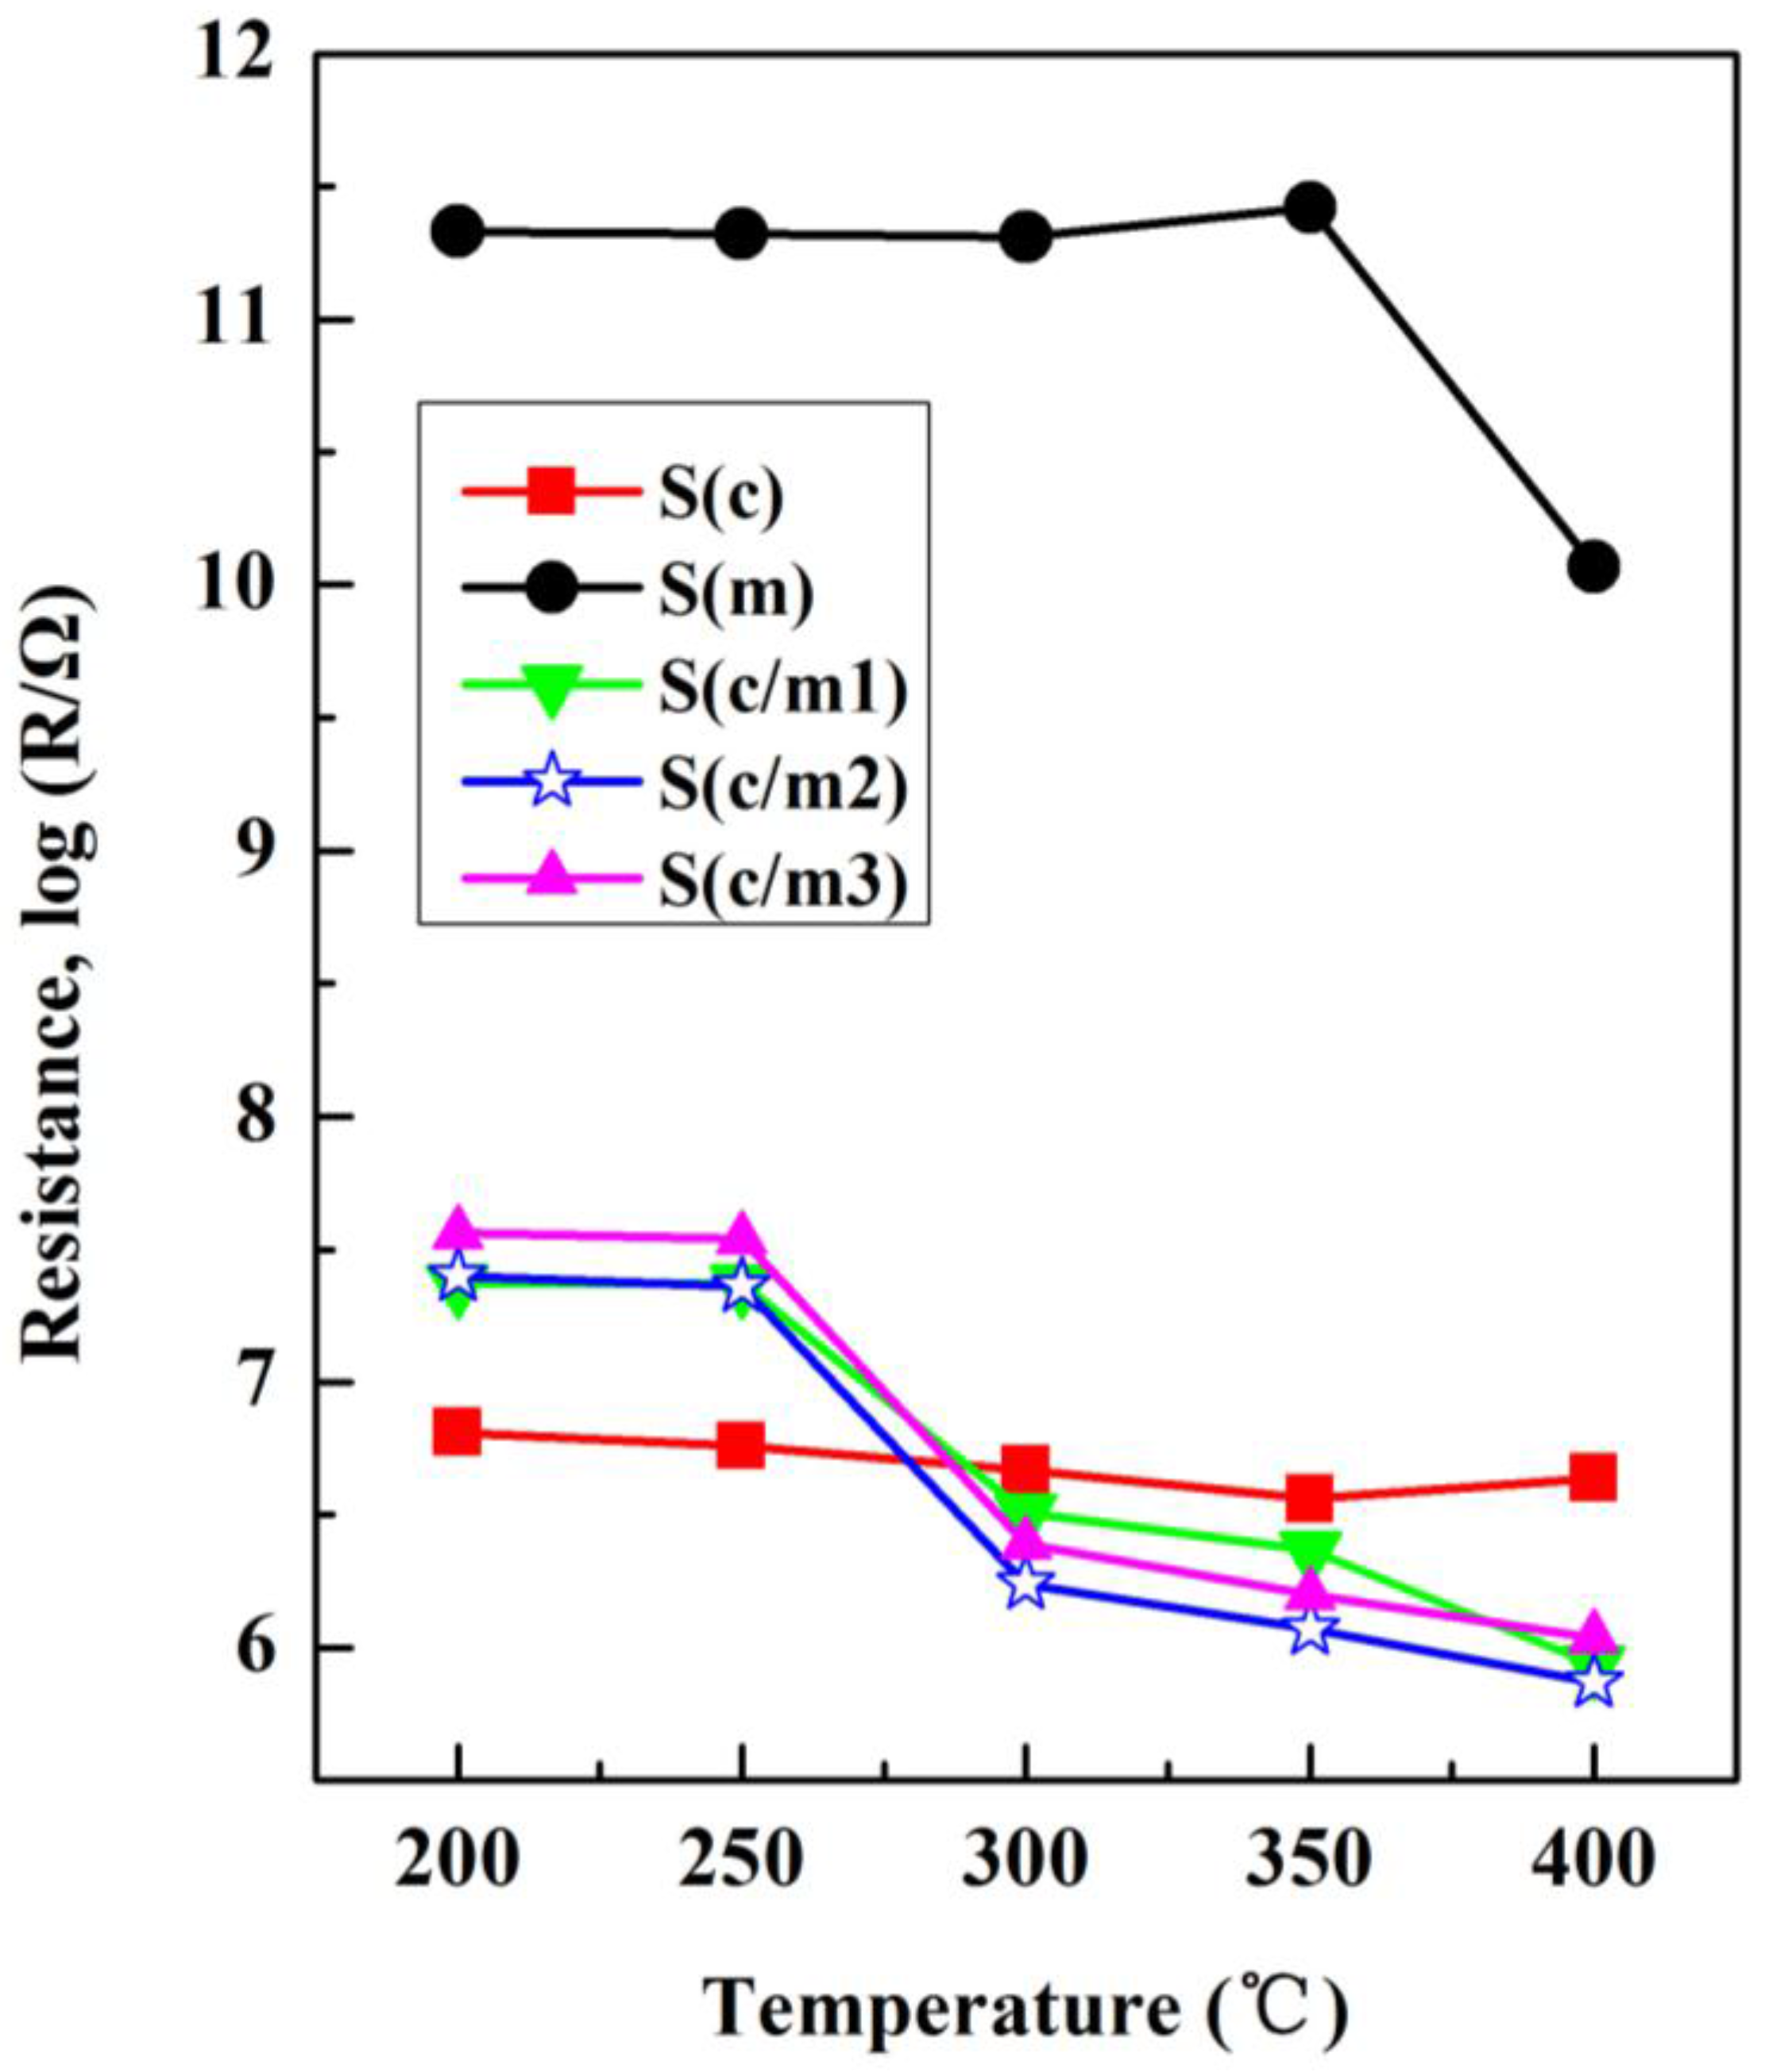
Figure 11 shows the temperature dependence of the resistances of the gas sensors in air. As a semiconductor material, the resistance of SnO2 shows decrement trend due to the increase of carriers at the condition of thermal excitation, as confirmed in Figure 11. The higher is the operating temperature in which the gas sensors work, the lower is the resistances in air.
The values of the resistance in air of the S(c) sensor were slightly decreased due to the frit. The resistance of the S(m) sensor in air was much higher, which leads to difficult measurement problem in its application. It can be ascribed to the mesoporous structure, which leads to the extreme decrease of conductive path [21]. However, the resistance of the S(m) sensor in air decreased obviously when the operating temperature increased to 400 °C, owing to the condition of thermal excitation [24]. Using the m-SnO2 as the modified layers, the resistances of the (S(c/m1), S(c/m2) and S(c/m3)) sensors changed obviously. Since the resistance of SnO2 semiconductors was affected by thermal excitation, the resistance of the (S(c/m1), S(c/m2) and S(c/m3)) sensors in air decreased remarkably when the operating temperature increased to 300 °C. As for the S(c/m1), S(c/m2) and S(c/m3) sensors, the resistance of the S(c/m2) sensor in air appeared to be the lowest at all the tested operating temperature. The value of the resistance in air of the S(c/m2) sensor was 3.7 × 10⁵ Ω at 400 °C. The above results demonstrate that both thermal excitation and adsorption affect the resistance of MOS gas sensors in air. The oxygen adsorbates were considered as the main reason to change the resistance of MOS gas sensors in air. The absorbed O2 on the surface of SnO2 films implies the formation of O− or O2−, which result in a decrease in the quantity of carrier. Thus, the resistance of the sensors fabricated with the modified m-SnO2 layers in air increased, due to the marked improvement of the adsorption capacity of surface oxygen. However, since the increase of the modified m-SnO2 layers resulted in larger distance for the oxygen adsorbates diffusing to the basic c-SnO2 layer, as well as the diffusion inhibition of mesoporous to oxygen, the S(c/m3) sensor showed lower resistance in air than the S(c/m2) sensor.
3.4. Sensing Responses to the Testing Gas
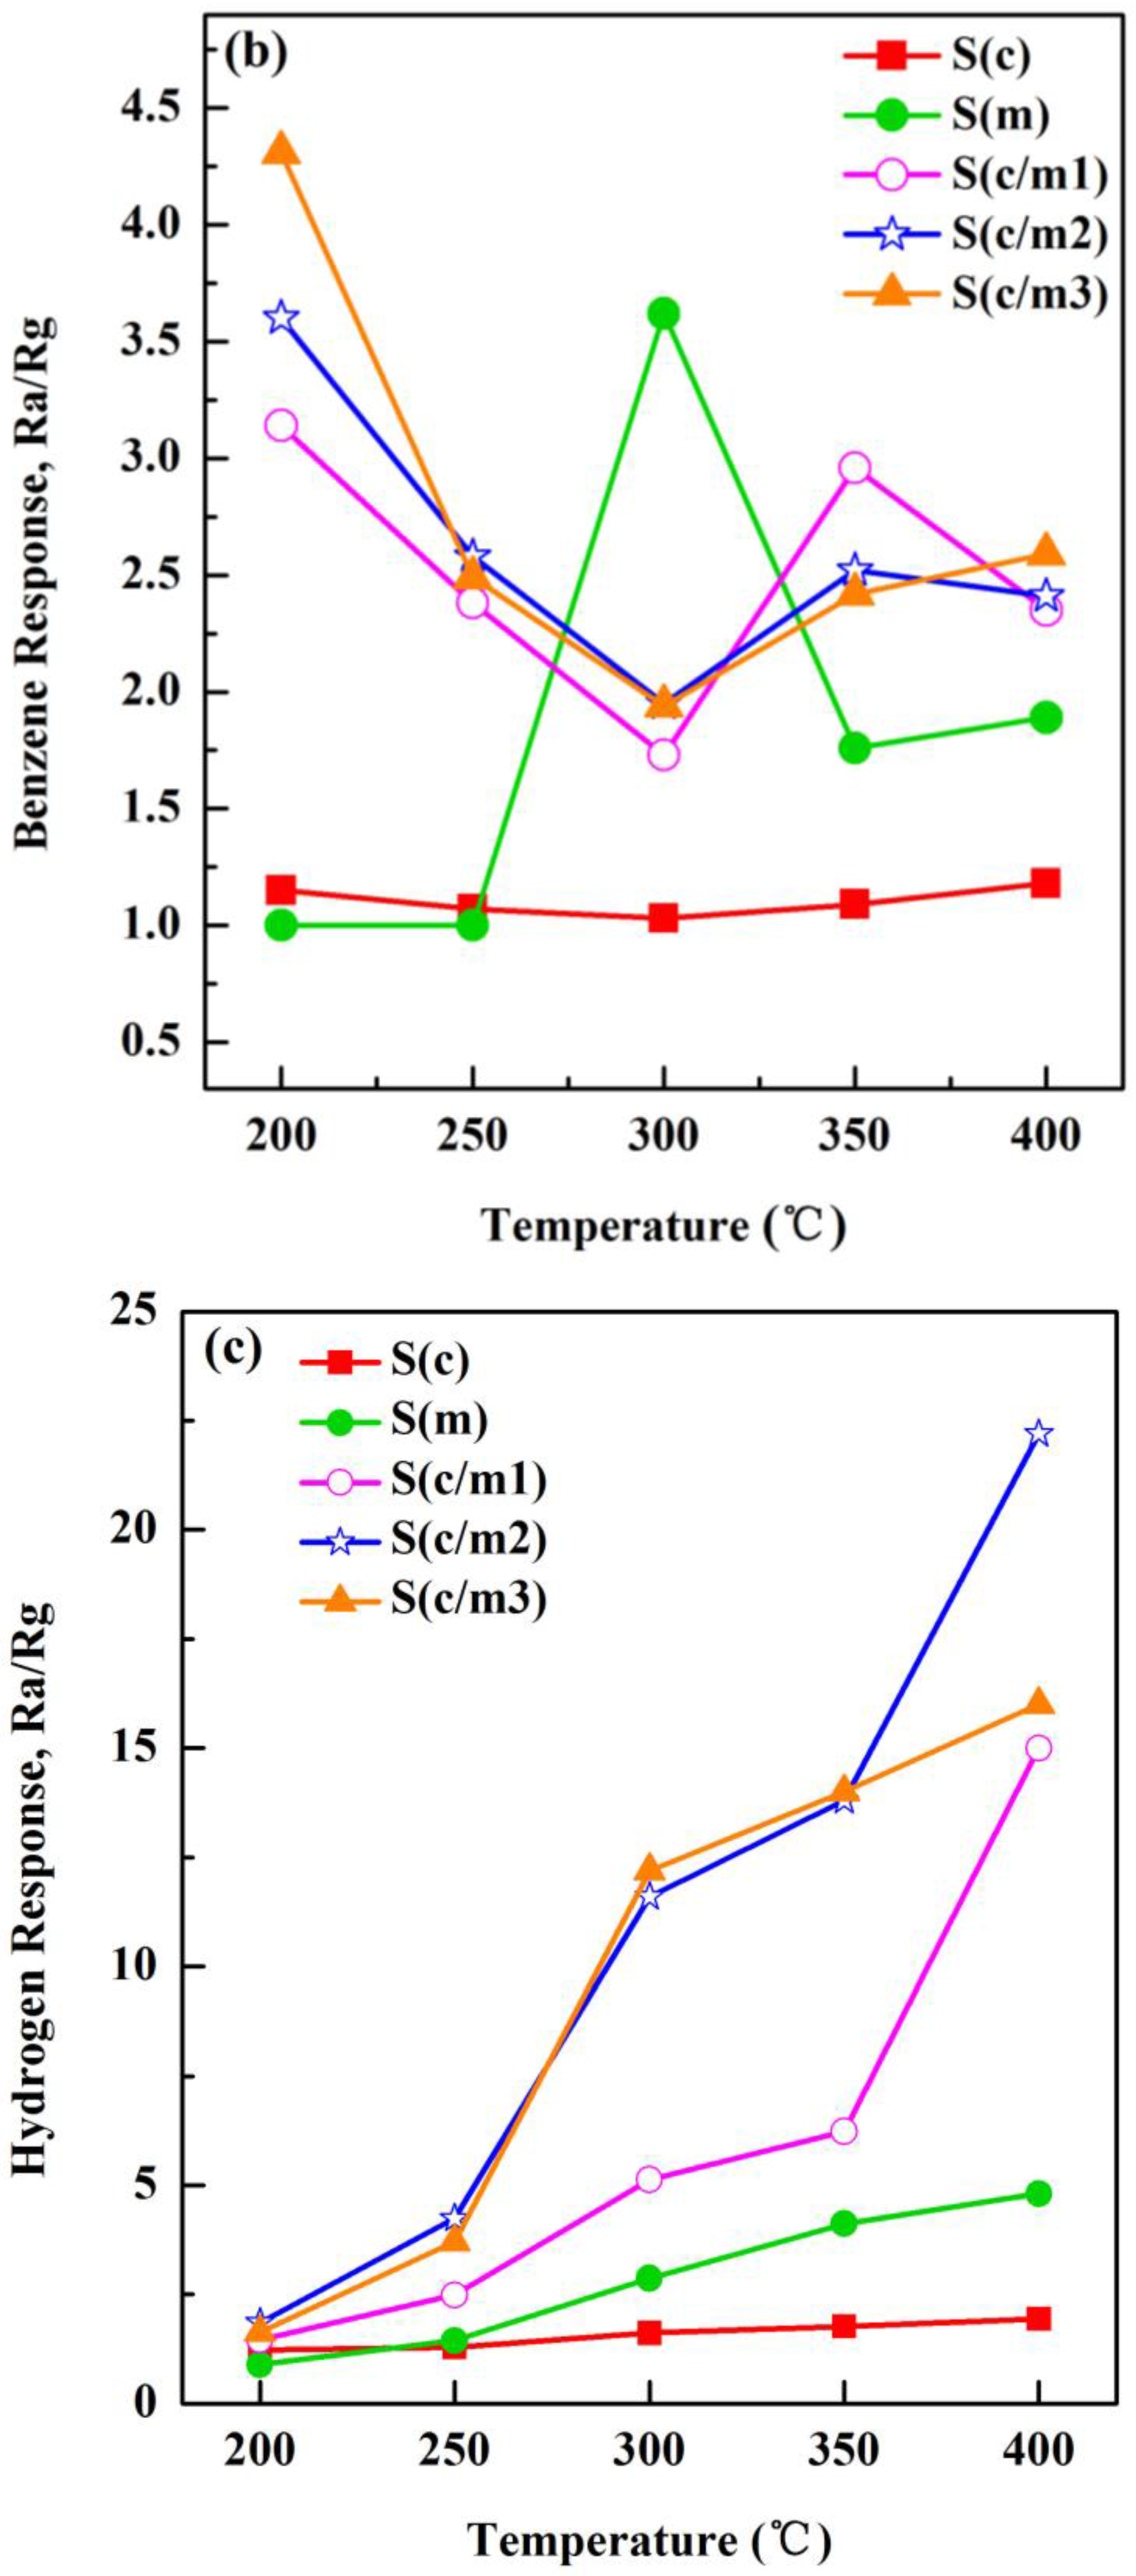
The temperature dependence of the responses to ethanol, benzene and hydrogen are depicted in Figure 12. The response of the S(c) sensor to ethanol at 10 ppm increased slightly with the increasing of operating temperature up to 400 °C, as shown in Figure 12a. However, the responses to ethanol of the S(c) sensor were lower than those of the S(c/m1), S(c/m2) and S(c/m3) sensors, due to the large specific surface area (262.30 m2/g) of the m-SnO2. In addition, the S(c/m3) sensor showed the largest response (Ra/Rg = 11.4) to ethanol at 300 °C. The responses to benzene of the S(c/m1), S(c/m2) and S(c/m3) sensors showed a similar tendency: the response decreased at the relatively low operating temperature due to a slight effect of thermal diffusion. While the reaction between testing gas and the basic c-SnO2 was controlled by gas absorption, the response to benzene was improved with the increasing of operating temperature from 300 °C to 400 °C mainly due to the thermal diffusion. The S(c/m3) sensor exhibited the largest response (Ra/Rg = 4.31) to benzene at 200 °C, as shown in Figure 12b. The response to hydrogen increased from 200 °C to 400 °C (Figure 12c), while the S(c/m2) sensor showed the largest response (Ra/Rg = 22.2) to hydrogen at 400 °C. It can be deduced from the hydrogen molecular diffusion that the small molecular dimension of hydrogen benefits the gas diffusion. While gas adsorbing capacity was enhanced, the response to hydrogen was highly improved (see Figure 12c). All of the above results confirmed that the modified layers of the m-SnO2 contribute to improving the response of the S(c) sensor sufficiently. Moreover, the magnitude of the response enhancement is not directly proportional to the amount of the m-SnO2.
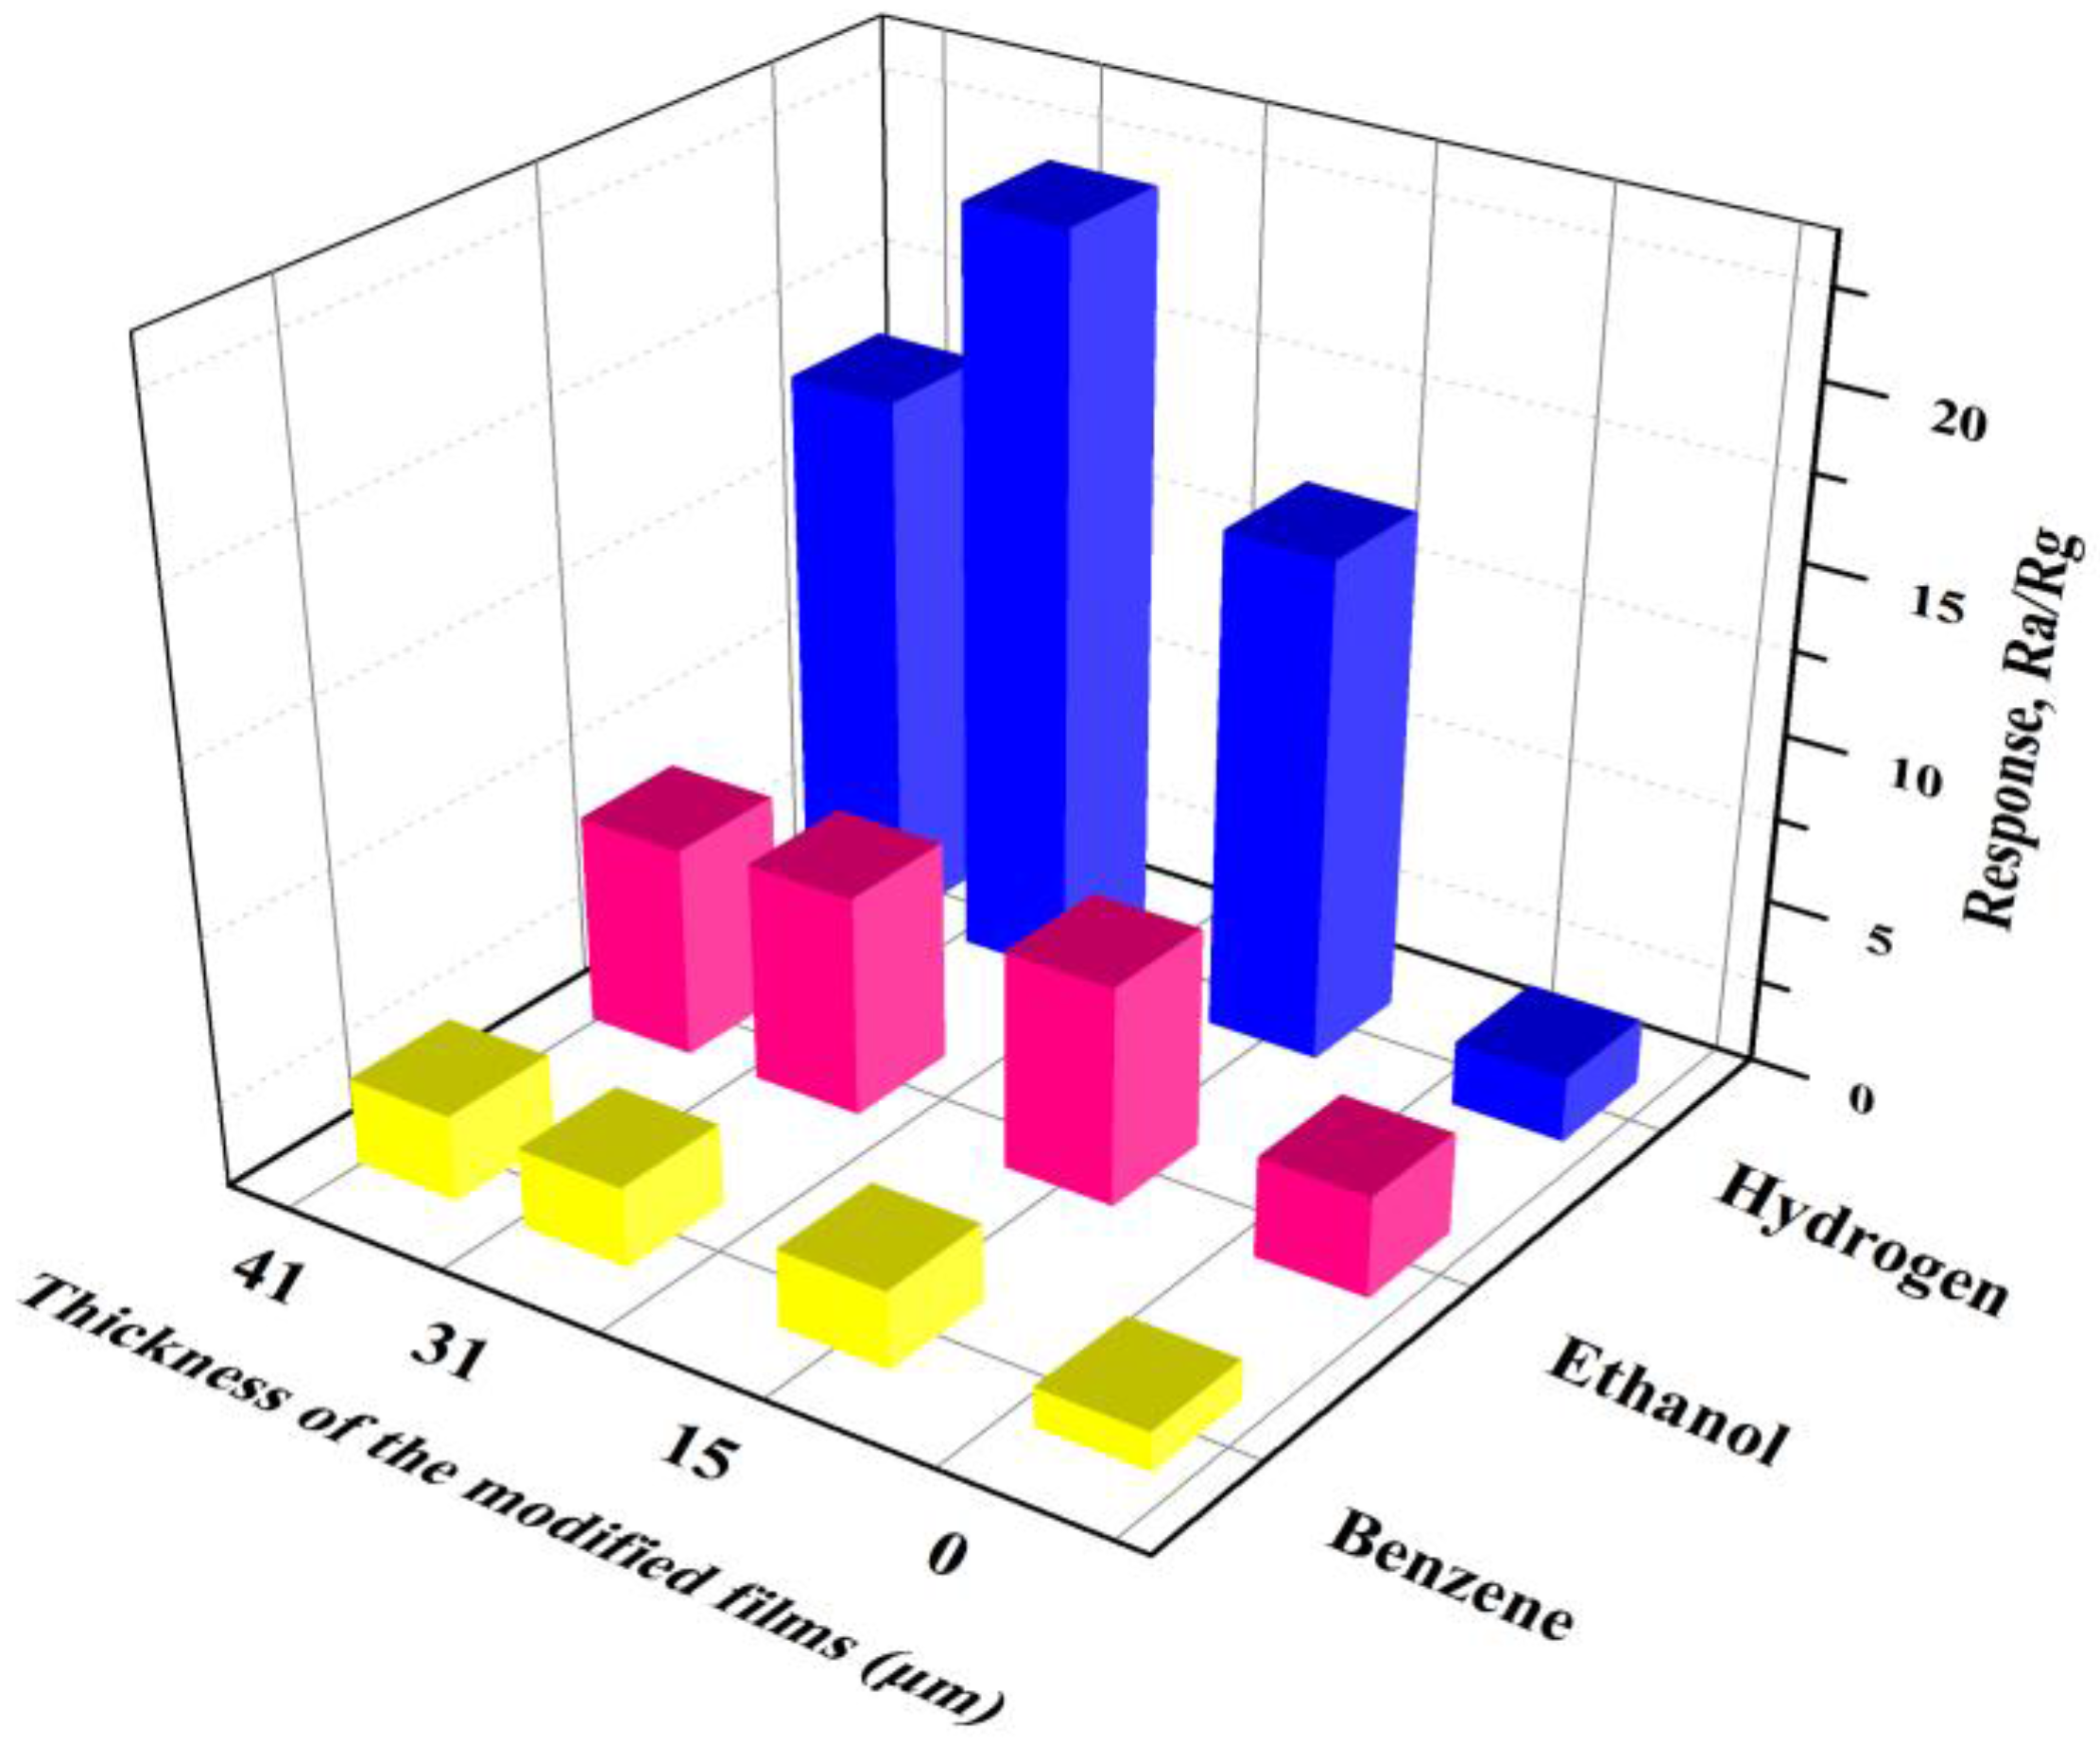
To further investigate the effects of the modified m-SnO2 layers, the evolutions of the response versus thickness of the modified films of the gas sensors at 400 °C are depicted in Figure 13. It is clear that the response of the S(c/m1), S(c/m2) and S(c/m3) sensors to ethanol, benzene and hydrogen were all improved to a certain extent in comparison to the S(c) sensor response, which means higher gas sensitivities. Especially, the response of the S(c/m2) sensor to hydrogen appeared to improve by 11.4 times, compared to benzene and ethanol improvements of 2.03 and 2.18 times, respectively.
3.5. The Response and Recovery Times of the Gas Sensors
Table 2 shows the response and recovery times of the gas sensors to ethanol, benzene and hydrogen. The response and recovery times of some of the gas sensors were difficult to summarize due to the lower response at low operating temperature. The response time of the S(c) sensor to ethanol was markedly short from 350 °C (response time = 115 s) to 400 °C (response time = 54 s), while the values of response time to hydrogen at 350 °C and 400 °C were 80 s and 89 s, respectively. However, the response times of benzene were hard to summarize because of the relatively large molecular dimension (0.65–0.68 nm), which led to the low response to benzene. In the case of the S(c/m1), S(c/m2) and S(c/m3) sensors, the response times increased with the thicker modified m-SnO2 layers for all of the tested gases at 350 °C and 400 °C. In addition, the smallest response time appeared to be 74 s with the S(c/m1) sensors to hydrogen at 400 °C. It can be ascribed to the large specific surface area and the molecular diffusion at high temperature, both of which lead to easy gas diffusion inside the mesopores.
All gas sensors showed longer recovery times to ethanol and benzene in comparison to hydrogen from 350 °C to 400 °C. Especially, the S(c/m1), S(c/m2) and S(c/m3) sensors tended to show a longer response time (>500 s) to hydrogen than to ethanol (<467 s) and benzene (<207 s).
3.6. Discussion
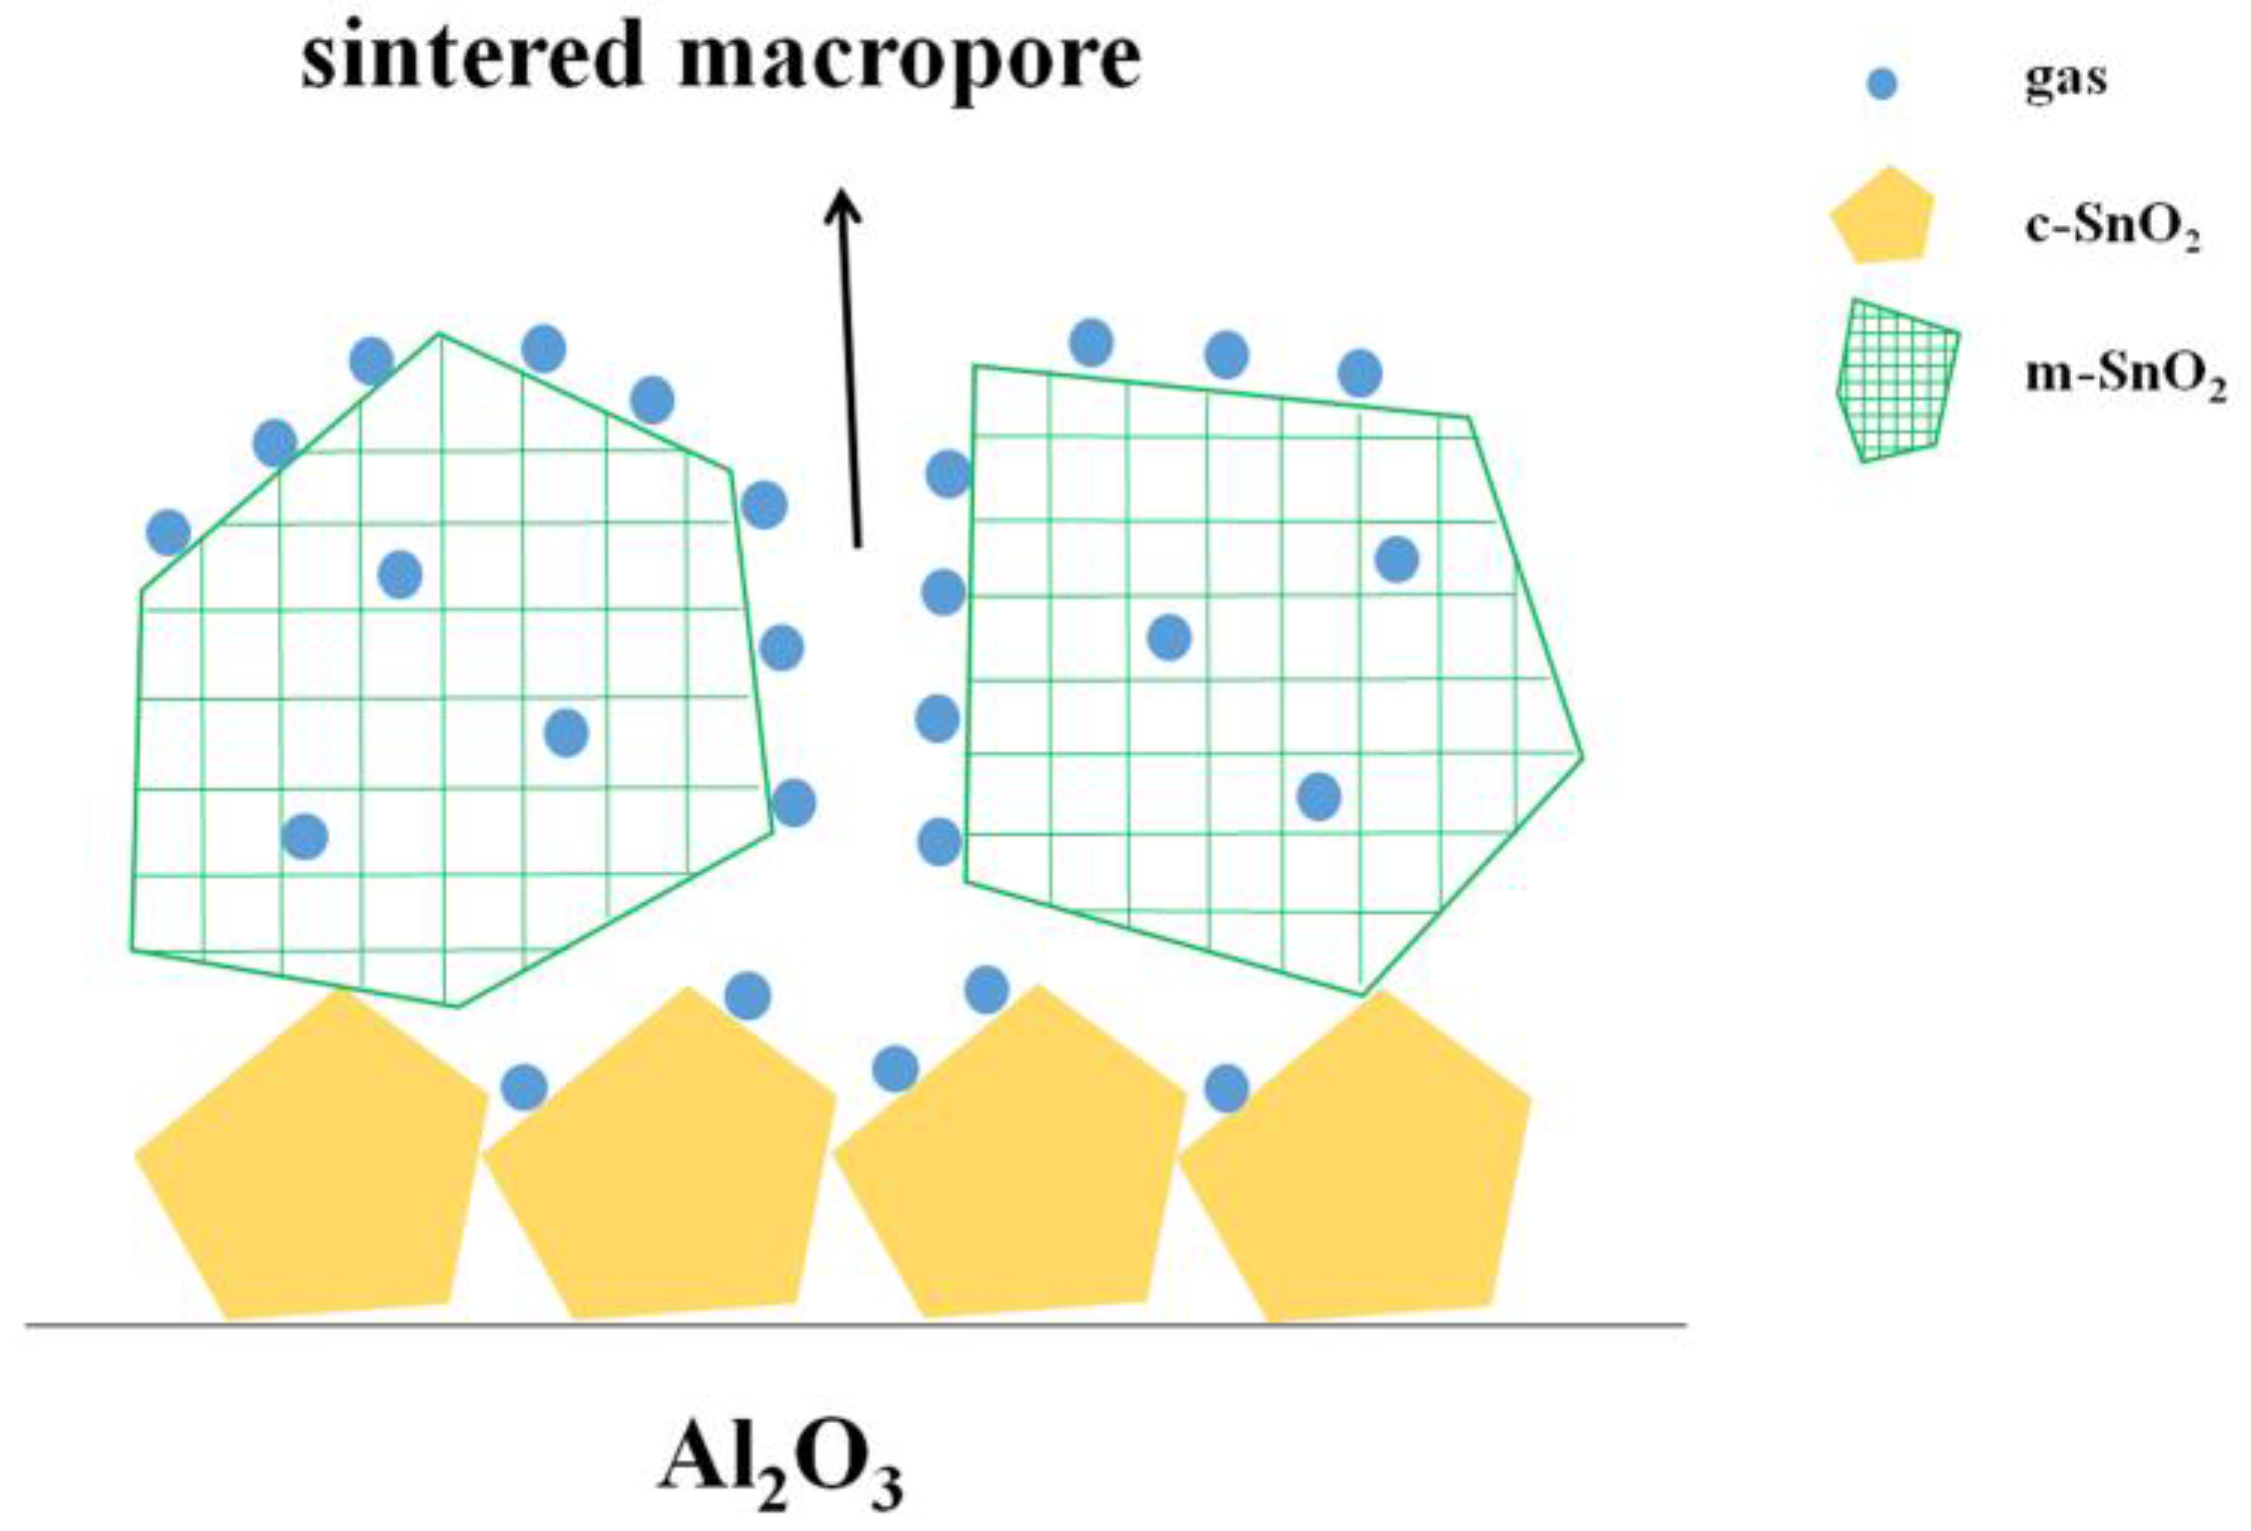
Among these, the possible gas sensing mechanism of the gas sensors are shown in Figure 14. It is considered that the adsorption/desorption properties of the mesoporous influenced the gas sensing performances of the gas sensors. Owing to the large specific surface area of m-SnO2, which could enhance the adsorption of gas molecules, the S(c/m1) S(c/m2) and S(c/m3) sensors exhibited higher gas (ethanol, benzene, and hydrogen) responses than those of the S(c) sensor. The responses of benzene are lower than those of ethanol and hydrogen because of its weak reducibility and larger size of benzene ring, which is difficult to pass through the m-SnO2 modified layer. However, the sintered macropores (Figure 14) among the m-SnO2 is helpful to adsorb more benzene molecules. This is why the responses of the S(c/m1), S(c/m2) and S(c/m3) sensors to benzene are higher than those of the S(c) sensor to benzene. In contrast, the smaller molecular size of the hydrogen is beneficial to pass through the ordered structure of m-SnO2 and the sintered macropores. Thus, thickness of the films and the ordered level of mesoporous influenced the gas sensing performance of the gas sensors fabricated with the modified m-SnO2 layers. In addition, further approaches to control the amount of sintered macropores, the thickness of the films, surface contact of the films and the ordered level of mesoporous would be effective to improve the sensing performance of the gas sensors.
Experimental results of SnO2 sensors have been compared with the results reported by the other researchers on H2 sensors. Manjula et al. reported the Pd doped m-SnO2 gas sensors. It showed that the 0.25% Pd doped gas sensor response towards 1000 ppm hydrogen at 50 °C is 0.95. The gas sensors showed zero response to ethanol, LPG, NH3 and acetone [25]. Seftel et al. obtained gas sensing material by combining Pt with SnO2 or In2O3 based on SBA-15. The response of the gas sensor based on Pt/SnO2/SBA-15 is about 1.4 to 1000 ppm hydrogen at 350 °C [26]. Although the selectivity of the sensors was improved by doping, the responses of the sensors to hydrogen are no more than 2, which limits the applications of the sensors in hydrogen measurement.
We can find a large number of examples of sensitivities improvement of gas sensors to hydrogen when mesoporous structures are employed. Shen et al. reported that the influence of the different morphology of SnO2 nanomaterials on hydrogen sensing properties. They obtained the response of about 2.1 to 1000 ppm hydrogen at 250 °C for nanofilms [27]. Yeow et al. reported the gas sensors based on SnO2 nanospheres with various degrees porosity. The reference (SSA SnO2 = 101.4 m2/g) gas sensor showed the largest response: 5.2 to 500 ppm hydrogen at 350 °C [28]. Zhao et al. prepared ordered mesoporous SnO2 and mesoporous Pd/SnO2 via nanocasting method using the hexagonal mesoporous SBA-15 as template. The maximum response of the sensor based on the ordered mesoporous SnO2 is 16.4 to 1000 ppm hydrogen at 300 °C [29]. Hayashi et al. prepared SnO2 gas sensors based on various m-SnO2 powders from two kinds of combination of tin source and surfactant template. The largest response of the gas sensors to 1000 ppm hydrogen at 350 °C appeared to be 42 [30]. It is evidential that the responses of the sensors based on the ordered mesoporous SnO2 to hydrogen have been dramatically increased. The one limitation of these studies is that the selectivity of the mesoporous SnO2 has not been studied.
Shahabuddin et al. reported the sputter deposited SnO2 thin film gas sensors with 9 nm thin Pt clusters. The Pt/SnO2 sensor shows an improvement in sensing response: 168 towards 500 ppm of hydrogen at 110 °C. The sensor revealed negligible cross sensing signals against acetone, IPA, NO2, methane, LPG, etc. [10]. Gong et al. reported the mesoporous nanocrystalline SnO2 gas sensor based on the fabricated SnO2 sputtering with Pt thin film. The gas sensor showed the response of about 1.8 to 1000 ppm hydrogen at 250 °C [31]. The sensitivities and selectivity of the SnO2 gas sensors could be significantly improved by sputtering with Pt thin film. However, the method requires an expensive facility and complex sample preparing process.
In our work, the ordered mesoporous SnO2 was prepared by simple sol-gel method. The gas sensors were prepared with a simple and low cost screen printing method while the mesoporous SnO2 worked as the modified layers. It was shown that both the sensitivities and the selectivity of the gas sensors to hydrogen were improved. The S(c/m2) sensor showed the largest response 22.2 to 1000 ppm hydrogen at 400 °C. The response to hydrogen is >10 times higher than that of the sensor without the modified layer (the S(c) sensor). Compared with the responses of the S(c) sensor, the responses of the S(c/m2) sensor to benzene and ethanol did not change significantly.
4. Conclusions
Ordered mesoporous SnO2 powders were prepared by employing Na2SnO3·4H2O, C16PyCl and trimethylbenzene. The specific surface area of the m-SnO2 powder was 262.30 m2/g after calcination at 600 °C. The gas sensors were fabricated using m-SnO2 films as the modified layers. It was proven that the gassensing performance of the gas sensors could be highly improved, especially to hydrogen, compared with ethanol or benzene gas. In addition, the S(c/m2) sensor exhibited the highest sensitivity (response: Ra/Rg = 22.2) to 1000 ppm hydrogen at 400 °C. The main reason for the high selectivity may be the diffusivity of hydrogen molecules in the ordered mesopores is easier than that of ethanol and benzene molecules.
Acknowledgments
This work was founded by the Scientific Research Foundation for Returned Scholars, Ministry of Education of China, and the National Science Foundation of China (Grant No. 51502229).
Author Contributions
Qinyi Zhang and Niuzi Xue conceived and designed the experiments; Niuzi Xue, Feng Yang and Pan Zong performed the experiments; Niuzi Xue and Qinyi Zhang analyzed the data; Shunping Zhang contributed the test tools; and Niuzi Xue wrote the paper.
Conflicts of Interest
The authors declare no conflict of interest.
References
- Cao, S.; Klein, K.; Herkel, S.; Sirén, K. Approaches to enhance the energy performance of a zero-energy building integrated with a commercial-scale hydrogen fueled zero-energy vehicle under finnish and german conditions. Energy Convers. Manag. 2017, 142, 153–175. [Google Scholar] [CrossRef]
- Andronov, D.Y.; Arseniev, D.G.; Polyanskiy, A.M.; Polyanskiy, V.A.; Yakovlev, Y.A. Application of multichannel diffusion model to analysis of hydrogen measurements in solid. Int. J. Hydrogen Energy 2017, 42, 699–710. [Google Scholar] [CrossRef]
- Bockris, J.O.M. On hydrogen futures: Toward a sustainable energy system. Int. J. Hydrogen Energy 2003, 28, 131–133. [Google Scholar] [CrossRef]
- Cardozacontrera, M.N.; Romoherrera, J.M.; Ríos, L.A.; Garcíagutiérrez, R.; Zepeda, T.A.; Contreras, O.E. Single ZnO Nanowire-Based Gas Sensors to Detect Low Concentrations of Hydrogen. Sensors 2015, 15, 30539–30544. [Google Scholar] [CrossRef] [PubMed]
- Kim, S.; Choi, J.; Jung, M.; Joo, S.; Kim, S. Silicon carbide-based hydrogen gas sensors for high-temperature application. Sensors 2013, 13, 13575–13583. [Google Scholar] [CrossRef] [PubMed]
- Kim, H.W.; Kwon, Y.J.; Mirzaei, A.; Kang, S.Y.; Choi, M.S.; Bang, J.H.; Kim, S.S. Synthesis of zinc oxide semiconductors-graphene nanocomposites by microwave irradiation for application to gas sensors. Sens. Actuators B Chem. 2017, 249, 590–601. [Google Scholar] [CrossRef]
- Wongchoosuk, C.; Wisitsoraat, A.; Phokharatkul, D.; Tuantranont, A.; Kerdcharoen, T. Multi-Walled Carbon Nanotube-Doped Tungsten Oxide Thin Films for Hydrogen Gas Sensing. Sensors 2010, 10, 7705–7715. [Google Scholar] [CrossRef] [PubMed]
- Krško, O.; Plecenik, T.; Roch, T.; Grančič, B.; Satrapinskyy, L.; Truchlý, M.; Ďurina, P.; Gregor, M.; Kúš, P.; Plecenik, A. Flexible highly sensitive hydrogen gas sensor based on a TiO2 thin film on polyimide foil. Sens. Actuators B Chem. 2017, 240, 1058–1065. [Google Scholar] [CrossRef]
- Kimura, Y.; Kimura, S.; Kojima, R.; Bitoh, M.; Abe, M.; Niwano, M. Micro-scaled hydrogen gas sensors with patterned anodic titanium oxide nanotube film. Sens. Actuators B Chem. 2013, 177, 1156–1160. [Google Scholar] [CrossRef]
- Shahabuddin, M.; Umar, A.; Tomar, M.; Gupta, V. Custom designed metal anchored SnO2 sensor for H2 detection. Int. J. Hydrogen Energy 2017, 42, 4597–4609. [Google Scholar] [CrossRef]
- Nguyen, V.T.; Nguyen, V.C.; Nguyen, V.D.; Hoang, S.H.; Hugo, N.; Nguyen, D.H.; Nguyen, V.H. Fabrication of highly sensitive and selective H2 gas sensor based on SnO2 thin film sensitized with microsized Pd islands. J. Hazard. Mater. 2016, 301, 433–442. [Google Scholar] [PubMed]
- Ammar, A.H.; Abo-Ghazala, M.S.; Farag, A.A.M.; Abdel-Moniem, N.M.; Farag, E.-S.M. Effect of gas type, pressure and temperature on the electrical characteristics of Al-doped SnO2 thin films deposited by RGTO method for gas sensor application. Vacuum 2013, 94, 30–40. [Google Scholar] [CrossRef]
- Inyawilert, K.; Wisitsoraat, A.; Tuantranont, A.; Phanichphant, S.; Liewhiran, C. Ultra-sensitive and highly selective H2 sensors based on FSP-made Rh-substituted SnO2 sensing films. Sens. Actuators B Chem. 2017, 240, 1141–1152. [Google Scholar] [CrossRef]
- Bianchetti, M.F.; Arrieta, C.; Walsöe de Reca, N.E. Microstructural study of nanocrystalline pure and doped tin dioxide to be used for resistive gas sensors. Sens. Actuators B Chem. 2015, 217, 113–118. [Google Scholar] [CrossRef]
- Liewhiran, C.; Tamaekong, N.; Wisitsoraat, A.; Tuantranont, A.; Phanichphant, S. Ultra-sensitive H2 sensors based on flame-spray-made Pd-loaded SnO2 sensing films. Sens. Actuators B Chem. 2013, 176, 893–905. [Google Scholar] [CrossRef]
- Jang, B.-H.; Landau, O.; Choi, S.-J.; Shin, J.; Rothschild, A.; Kim, I.-D. Selectivity enhancement of SnO2 nanofiber gas sensors by functionalization with Pt nanocatalysts and manipulation of the operation temperature. Sens. Actuators B Chem. 2013, 188, 156–168. [Google Scholar] [CrossRef]
- Yamaguchi, M.; Anggraini, S.A.; Fujio, Y.; Sato, T.; Breedon, M.; Miura, N. Stabilized zirconia-based sensor utilizing SnO2-based sensing electrode with an integrated Cr2O3 catalyst layer for sensitive and selective detection of hydrogen. Int. J. Hydrogen Energy 2013, 38, 305–312. [Google Scholar] [CrossRef]
- Tournier, G.; Pijolat, C. Selective filter for SnO-based gas sensor: Application to hydrogen trace detection. Sens. Actuators B Chem. 2005, 106, 553–562. [Google Scholar] [CrossRef]
- Masuzawa, S.; Okazaki, S.; Maru, Y.; Mizutani, T. Catalyst-type-an optical fiber sensor for hydrogen leakage based on fiber bragg gratings. Sens. Actuators B Chem. 2015, 217, 151–157. [Google Scholar] [CrossRef]
- Yaqoob, U.; Uddin, A.S.M.I.; Chung, G.-S. Foldable hydrogen sensor using Pd nanocubes dispersed into multiwall carbon nanotubes-reduced graphene oxide network assembled on nylon filter membrane. Sens. Actuators B Chem. 2016, 229, 355–361. [Google Scholar] [CrossRef]
- Hyodo, T.; Abe, S.; Shimizu, Y.; Egashira, M. Gas-sensing properties of ordered mesoporous SnO2 and effects of coatings thereof. Sens. Actuators B Chem. 2003, 93, 590–600. [Google Scholar] [CrossRef]
- Pijolat, C.; Viricelle, J.P.; Tournier, G.; Montmeat, P. Application of membranes and filtering films for gas sensors improvements. Thin Solid Films 2005, 490, 7–16. [Google Scholar] [CrossRef]
- Dhawale, D.S.; Lokhande, C.D. Chemical route to synthesis of mesoporous ZnO thin films and their liquefied petroleum gas sensor performance. J. Alloys Compd. 2011, 509, 10092–10097. [Google Scholar] [CrossRef]
- Das, S.; Jayaraman, V. SnO2: A comprehensive review on structures and gas sensors. Prog. Mater. Sci. 2014, 66, 112–255. [Google Scholar] [CrossRef]
- Manjula, P.; Satyanarayana, L.; Swarnalatha, Y.; Manorama, S.V. Raman and MASNMR studies to support the mechanism of low temperature hydrogen sensing by Pd doped mesoporous SnO2. Sens. Actuators B Chem. 2009, 138, 28–34. [Google Scholar] [CrossRef]
- Seftel, E.M.; Cool, P.; Lloyd-Spetz, A.; Lutic, D. Pt-doped semiconductive oxides loaded on mesoporous SBA-15 for gas sensing. Comptes Rendus Chim. 2014, 17, 717–724. [Google Scholar] [CrossRef]
- Shen, Y.; Wang, W.; Fan, A.; Wei, D.; Liu, W.; Han, C.; Shen, Y.; Meng, D.; San, X. SnO2: Highly sensitive hydrogen sensors based on SnO2 nanomaterials with different morphologies. Int. J. Hydrogen Energy 2015, 40, 15773–15779. [Google Scholar] [CrossRef]
- Yeow, S.C.; Ong, W.L.; Wong, A.S.W.; Ho, G.W. Template-free synthesis and gas sensing properties of well-controlled porous tin oxide nanospheres. Sens. Actuators B Chem. 2009, 143, 295–301. [Google Scholar] [CrossRef]
- Zhao, J.; Wang, W.; Liu, Y.; Ma, J.; Li, X.; Du, Y.; Lu, G. Ordered mesoporous Pd/SnO2 synthesized by a nanocasting route for high hydrogen sensing performance. Sens. Actuators B Chem. 2011, 160, 604–608. [Google Scholar] [CrossRef]
- Hayashi, M.; Hyodo, T.; Shimizu, Y.; Egashira, M. Effects of microstructure of mesoporous SnO2 powders on their H2 sensing properties. Sens. Actuators B Chem. 2009, 141, 465–470. [Google Scholar] [CrossRef]
- Gong, J.; Chen, Q.; Fei, W.; Seal, S. Micromachined nanocrystalline SnO2 chenical gas sensors for electronic nose. Sens. Actuators B Chem. 2004, 102, 117–125. [Google Scholar] [CrossRef]
Figure 1.
The substrate structure of the gas sensor.
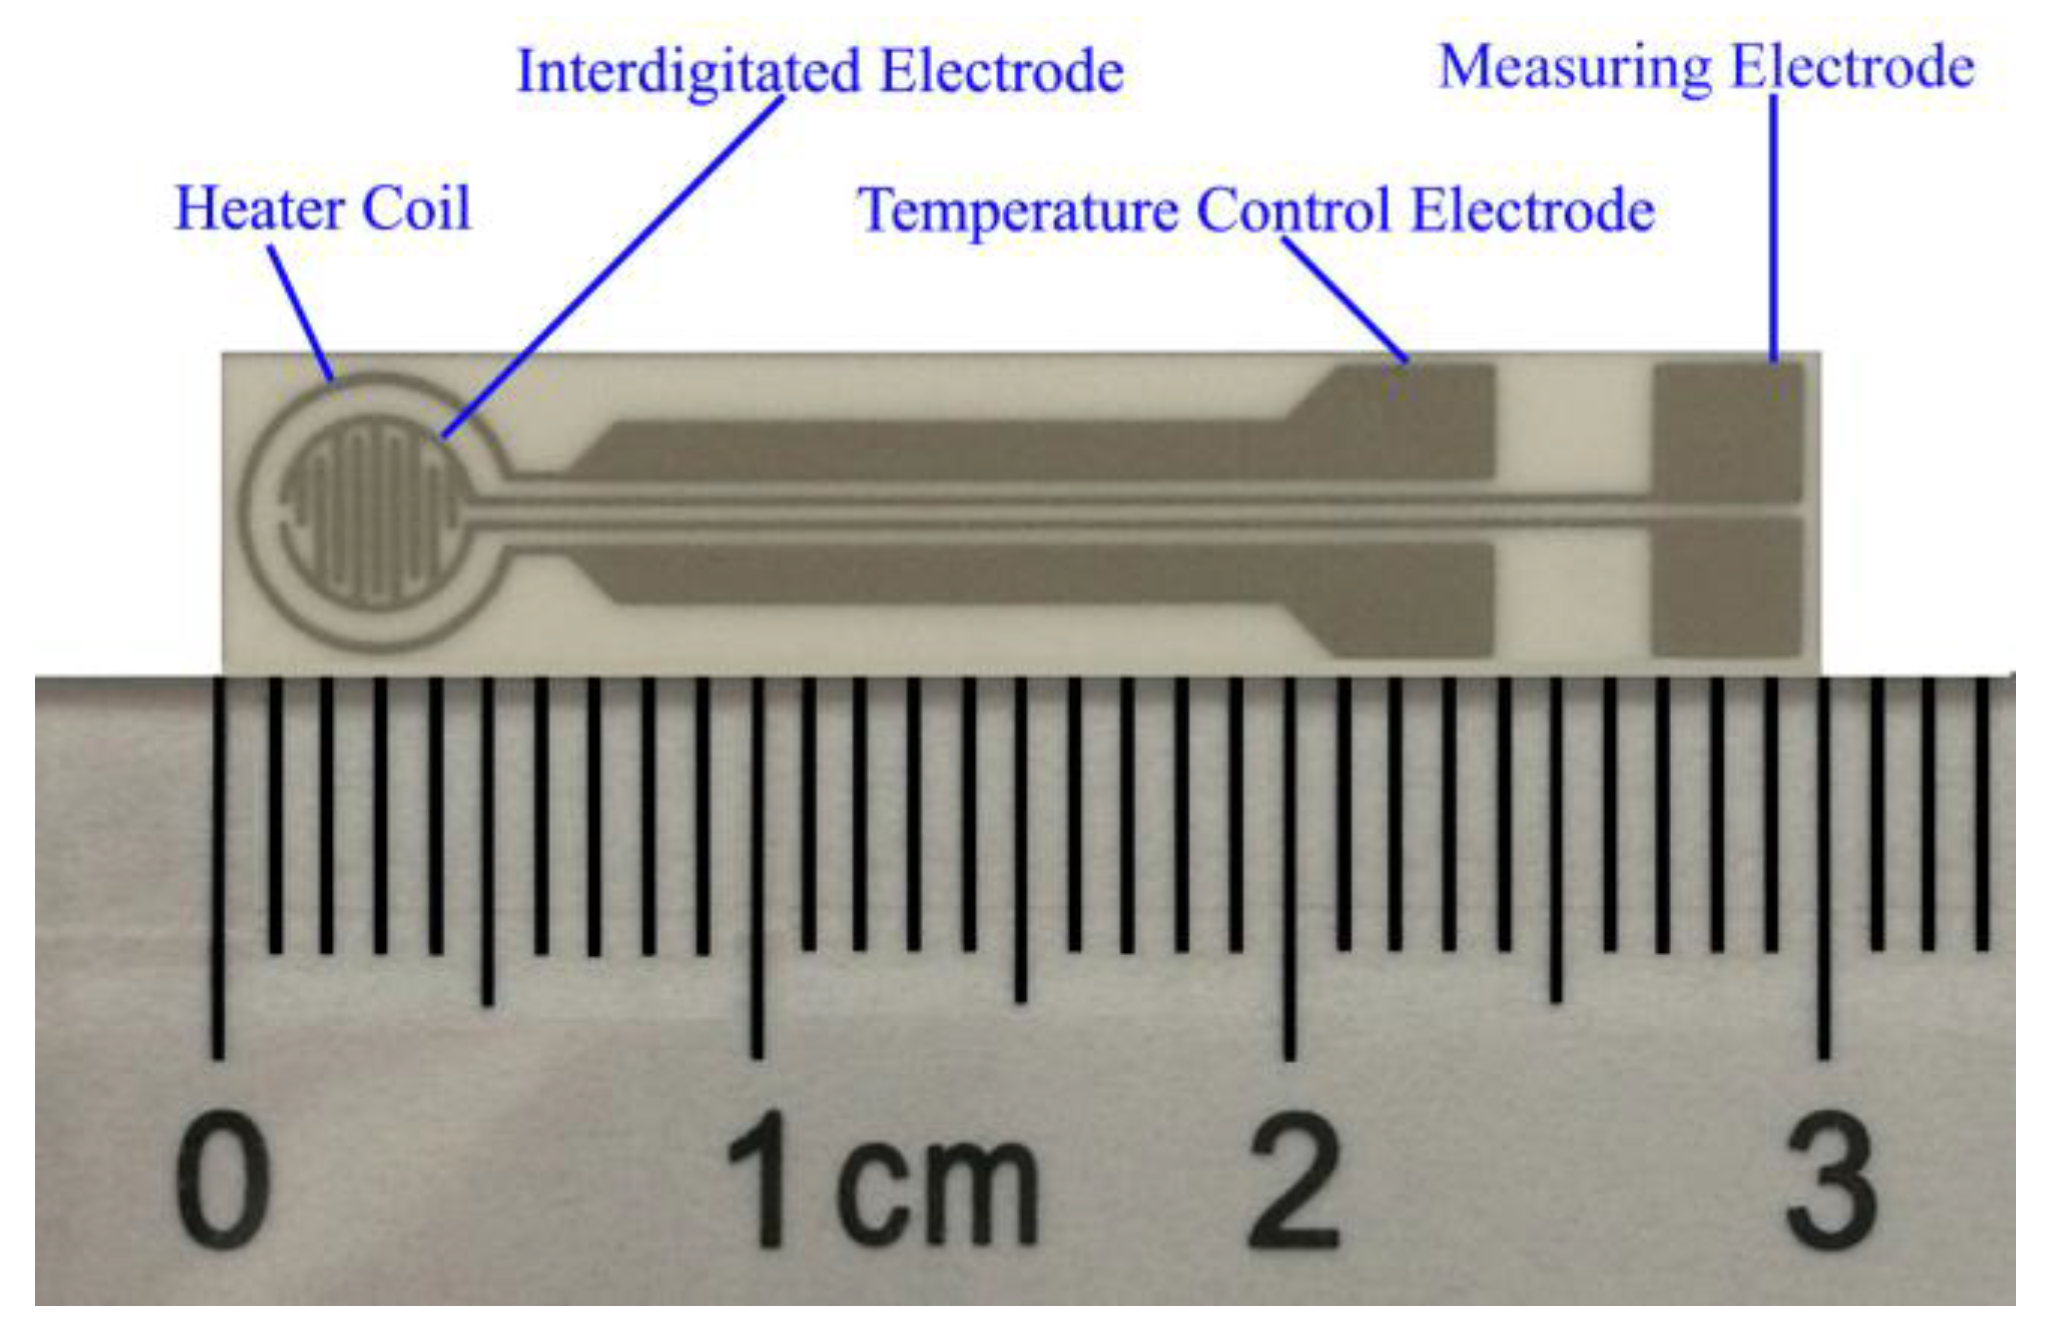
Figure 2.
The SD-101 gas sensing performance testing device.

Figure 3.
Gas sensing testing device.

Figure 4.
Response transients of the gas sensors to 1000 ppm H2 at 400 °C.
Figure 5.
XRD patterns of the c-SnO2 powders and the m-SnO2 powders.: (a) c-SnO2; and (b) m-SnO2.

Figure 6.
SEM image of the c-SnO2 powders.

Figure 7.
TEM image of the m-SnO2 powders.

Figure 8.
Pore size distribution of the m-SnO2 powders.
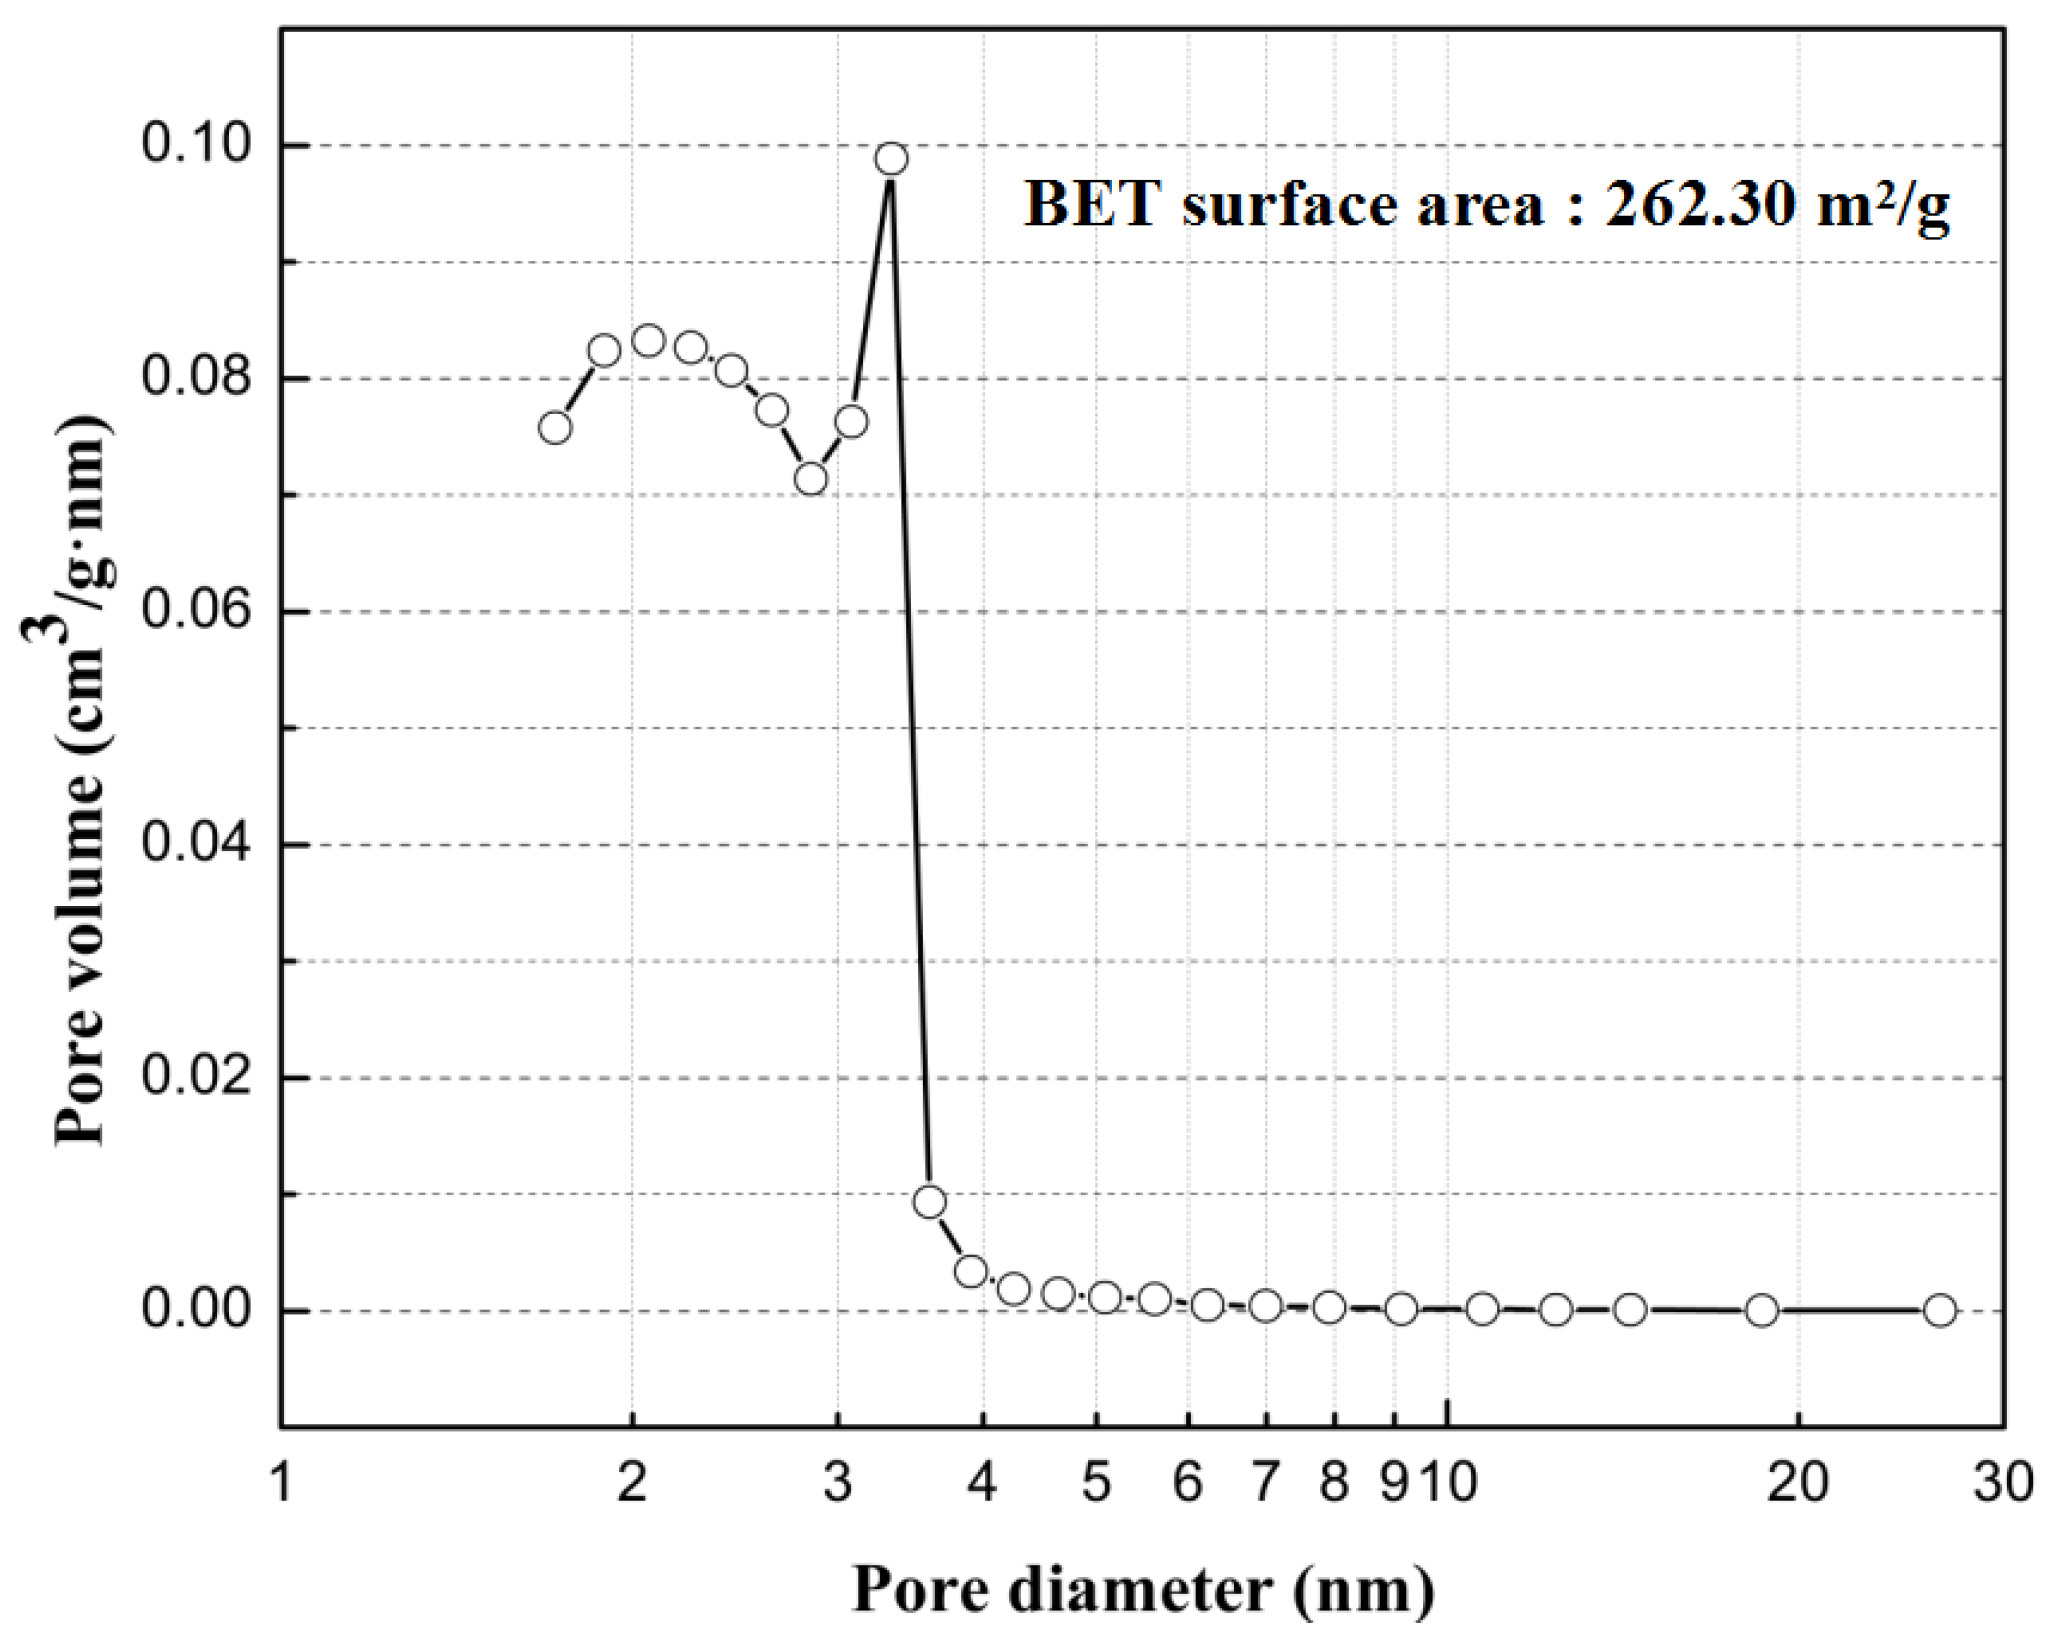
Figure 9.
SEM images of the surfaces of the gas sensors: (a) S(c); (b) S(m); (c) S(c/m1); (d) S(c/m2); and (e) S(c/m3).
Figure 9.
SEM images of the surfaces of the gas sensors: (a) S(c); (b) S(m); (c) S(c/m1); (d) S(c/m2); and (e) S(c/m3).


Figure 10.
SEM images of the cross-section of the gas sensors: (a) S(c); (b) S(m); (c) S(c/m1); (d) S(c/m2); and (e) S(c/m3).
Figure 10.
SEM images of the cross-section of the gas sensors: (a) S(c); (b) S(m); (c) S(c/m1); (d) S(c/m2); and (e) S(c/m3).
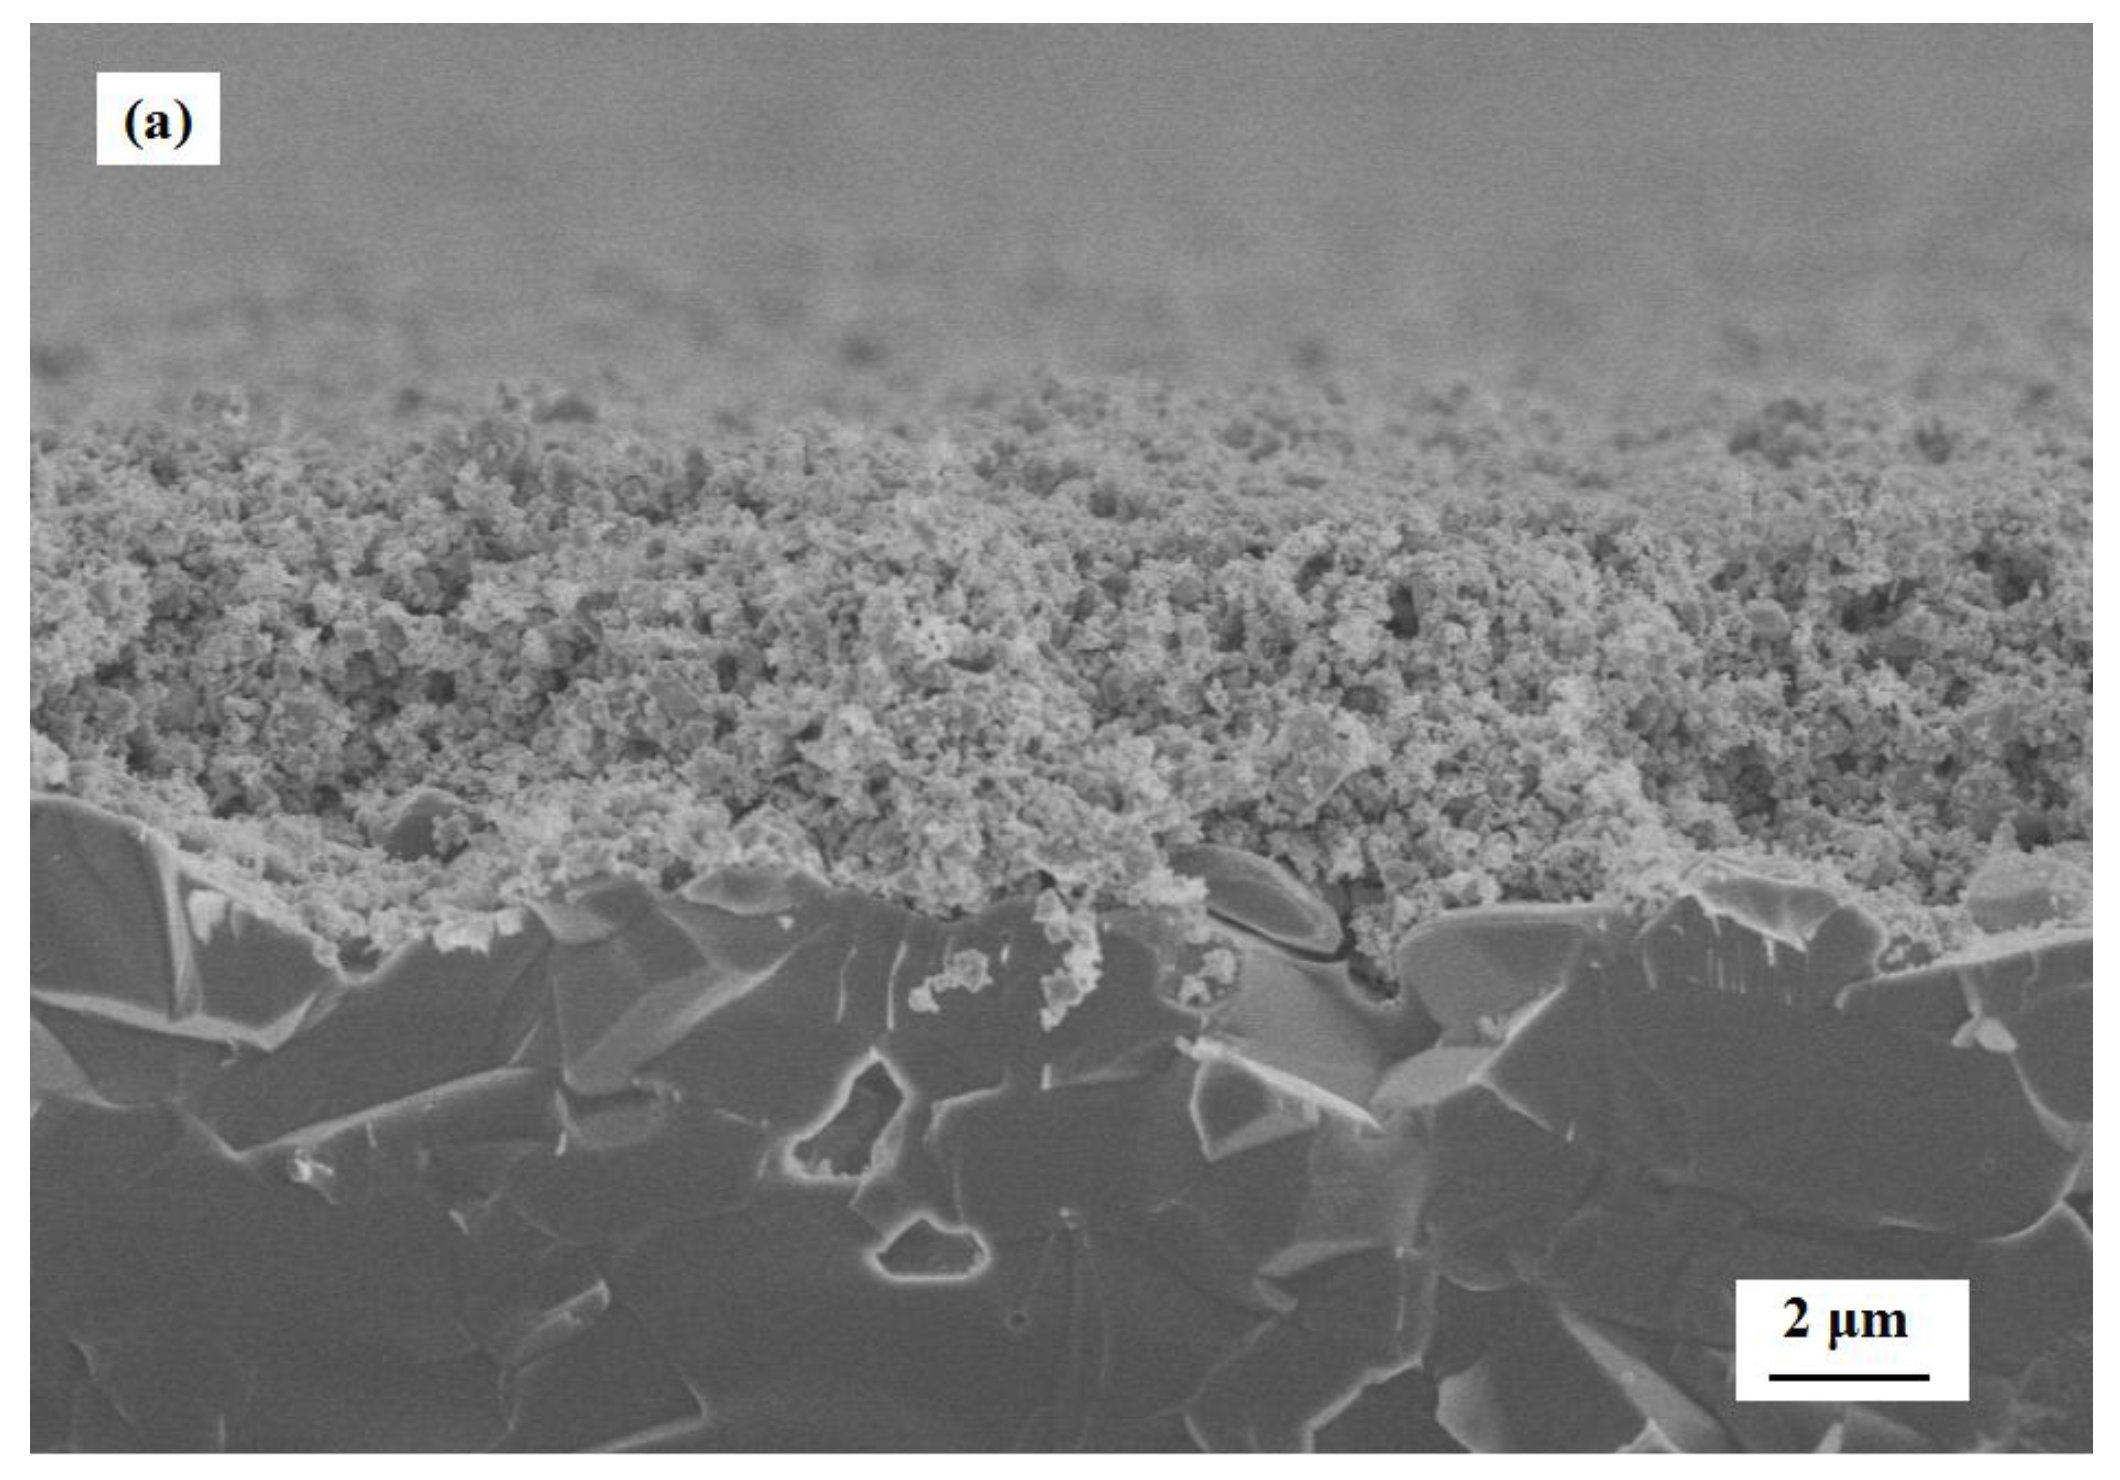

Figure 11.
Temperature dependence of the resistances of the gas sensors in air.

Figure 12.
Temperature dependence of the responses of the gas sensors: (a) ethanol at 10 ppm; (b) benzene at 10 ppm; and (c) hydrogen at 1000 ppm.
Figure 12.
Temperature dependence of the responses of the gas sensors: (a) ethanol at 10 ppm; (b) benzene at 10 ppm; and (c) hydrogen at 1000 ppm.
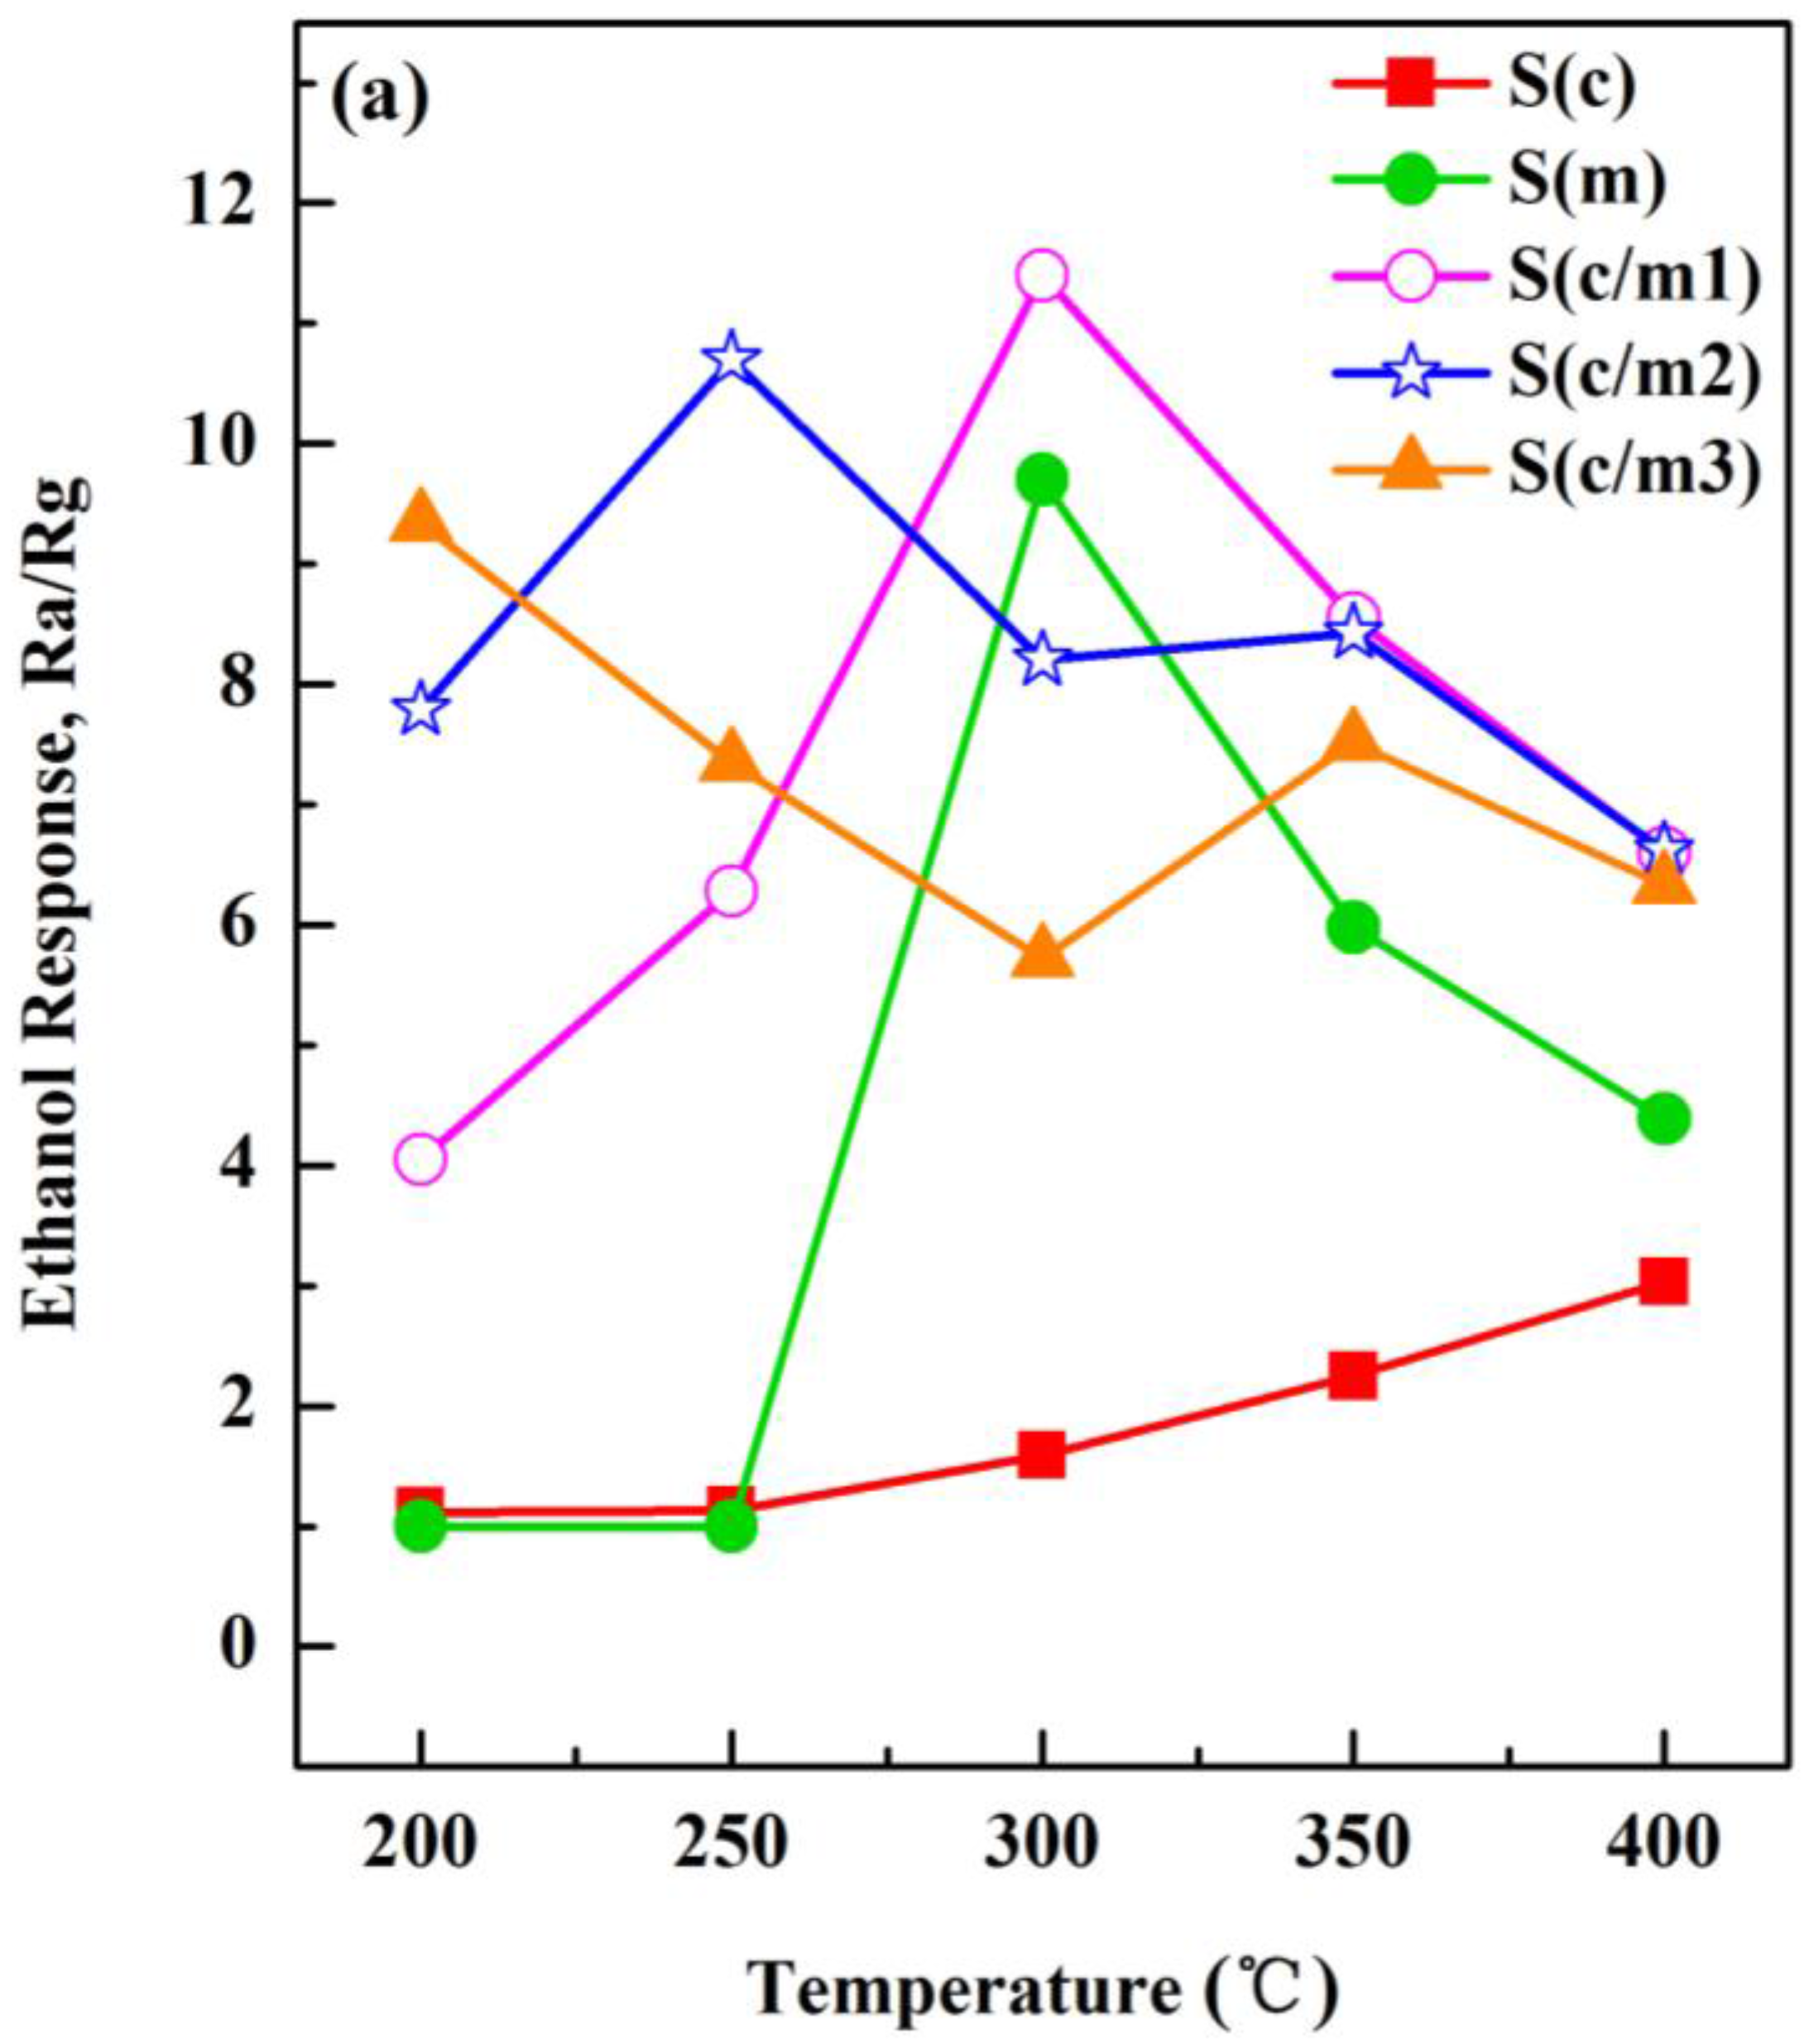

Figure 13.
Evolutions of the response versus thickness of the modified films of the gas sensors at 400 °C. The thickness of the modified films with the gas sensors: S(c), 0 μm; S(c/m1), 15 μm; S(c/m2), 31 μm; and S(c/m3), 41 μm.
Figure 13.
Evolutions of the response versus thickness of the modified films of the gas sensors at 400 °C. The thickness of the modified films with the gas sensors: S(c), 0 μm; S(c/m1), 15 μm; S(c/m2), 31 μm; and S(c/m3), 41 μm.

Figure 14.
Schematic drawing of the possible gas sensing mechanism of the gas sensors.

Table 1.
The structure of the gas sensors.
| Sample | Basic Layer | Modified Layer | Description |
|---|---|---|---|
| Material | Material | ||
| S(c) | c-SnO2 | / | one layer of c-SnO2 |
| S(m) | m-SnO2 | / | one layer of m-SnO2 |
| S(c/m1) | c-SnO2 | m-SnO2 | one layer of c-SnO2 and one layer of m-SnO2 |
| S(c/m2) | c-SnO2 | m-SnO2 | one layer of c-SnO2 and two layers of m-SnO2 |
| S(c/m3) | c-SnO2 | m-SnO2 | one layer of c-SnO2 and three layers of m-SnO2 |
Table 2.
The response and recovery times of the gas sensors to ethanol, benzene and hydrogen.
| Gas | Temperature (°C) | Response Time (s) | Recovery Time (s) | ||||||||
|---|---|---|---|---|---|---|---|---|---|---|---|
| S(c) | S(m) | S(c/m1) | S(c/m2) | S(c/m3) | S(c) | S(m) | S(c/m1) | S(c/m2) | S(c/m3) | ||
| Ethanol | 200 | - | - | 286 | 496 | 549 | - | - | 292 | 519 | >600 |
| 250 | - | - | 252 | 277 | 180 | - | - | 281 | 355 | 349 | |
| 300 | 126 | 19 | 197 | 106 | 87 | 14 | 90 | 178 | 182 | 142 | |
| 350 | 115 | 41 | 127 | 289 | 430 | 26 | 271 | 246 | 235 | 226 | |
| 400 | 54 | 56 | 152 | 210 | 295 | 37 | 201 | 467 | 467 | 462 | |
| Benzene | 200 | - | - | >600 | >600 | >600 | - | - | >600 | >600 | >600 |
| 250 | - | - | 360 | 486 | >600 | - | - | 60 | 158 | >600 | |
| 300 | - | - | 110 | 225 | 403 | - | - | 14 | 12 | 13 | |
| 350 | - | - | 411 | 422 | 478 | - | - | 89 | 63 | 78 | |
| 400 | - | - | 173 | 218 | 293 | - | - | 207 | 103 | 115 | |
| Hydrogen | 200 | - | - | 344 | 343 | 349 | - | - | 84 | 216 | 233 |
| 250 | - | - | 261 | 162 | 146 | - | - | 387 | 406 | 404 | |
| 300 | 83 | 131 | 96 | 82 | 87 | 194 | >600 | 423 | 451 | 442 | |
| 350 | 80 | 144 | 87 | 110 | 121 | 165 | >600 | 568 | >600 | >600 | |
| 400 | 89 | 34 | 74 | 105 | 110 | 139 | >600 | 507 | 519 | 520 | |
© 2017 by the authors. Licensee MDPI, Basel, Switzerland. This article is an open access article distributed under the terms and conditions of the Creative Commons Attribution (CC BY) license (http://creativecommons.org/licenses/by/4.0/).
Share and Cite
MDPI and ACS Style
Xue, N.; Zhang, Q.; Zhang, S.; Zong, P.; Yang, F. Highly Sensitive and Selective Hydrogen Gas Sensor Using the Mesoporous SnO2 Modified Layers. Sensors 2017, 17, 2351. https://doi.org/10.3390/s17102351
AMA Style
Xue N, Zhang Q, Zhang S, Zong P, Yang F. Highly Sensitive and Selective Hydrogen Gas Sensor Using the Mesoporous SnO2 Modified Layers. Sensors. 2017; 17(10):2351. https://doi.org/10.3390/s17102351
Chicago/Turabian StyleXue, Niuzi, Qinyi Zhang, Shunping Zhang, Pan Zong, and Feng Yang. 2017. "Highly Sensitive and Selective Hydrogen Gas Sensor Using the Mesoporous SnO2 Modified Layers" Sensors 17, no. 10: 2351. https://doi.org/10.3390/s17102351
Note that from the first issue of 2016, this journal uses article numbers instead of page numbers. See further details here.