
Weak Fault Feature Extraction of Rolling Bearings Based on an Improved Kurtogram

Abstract
:1. Introduction
2. Theoretical Background
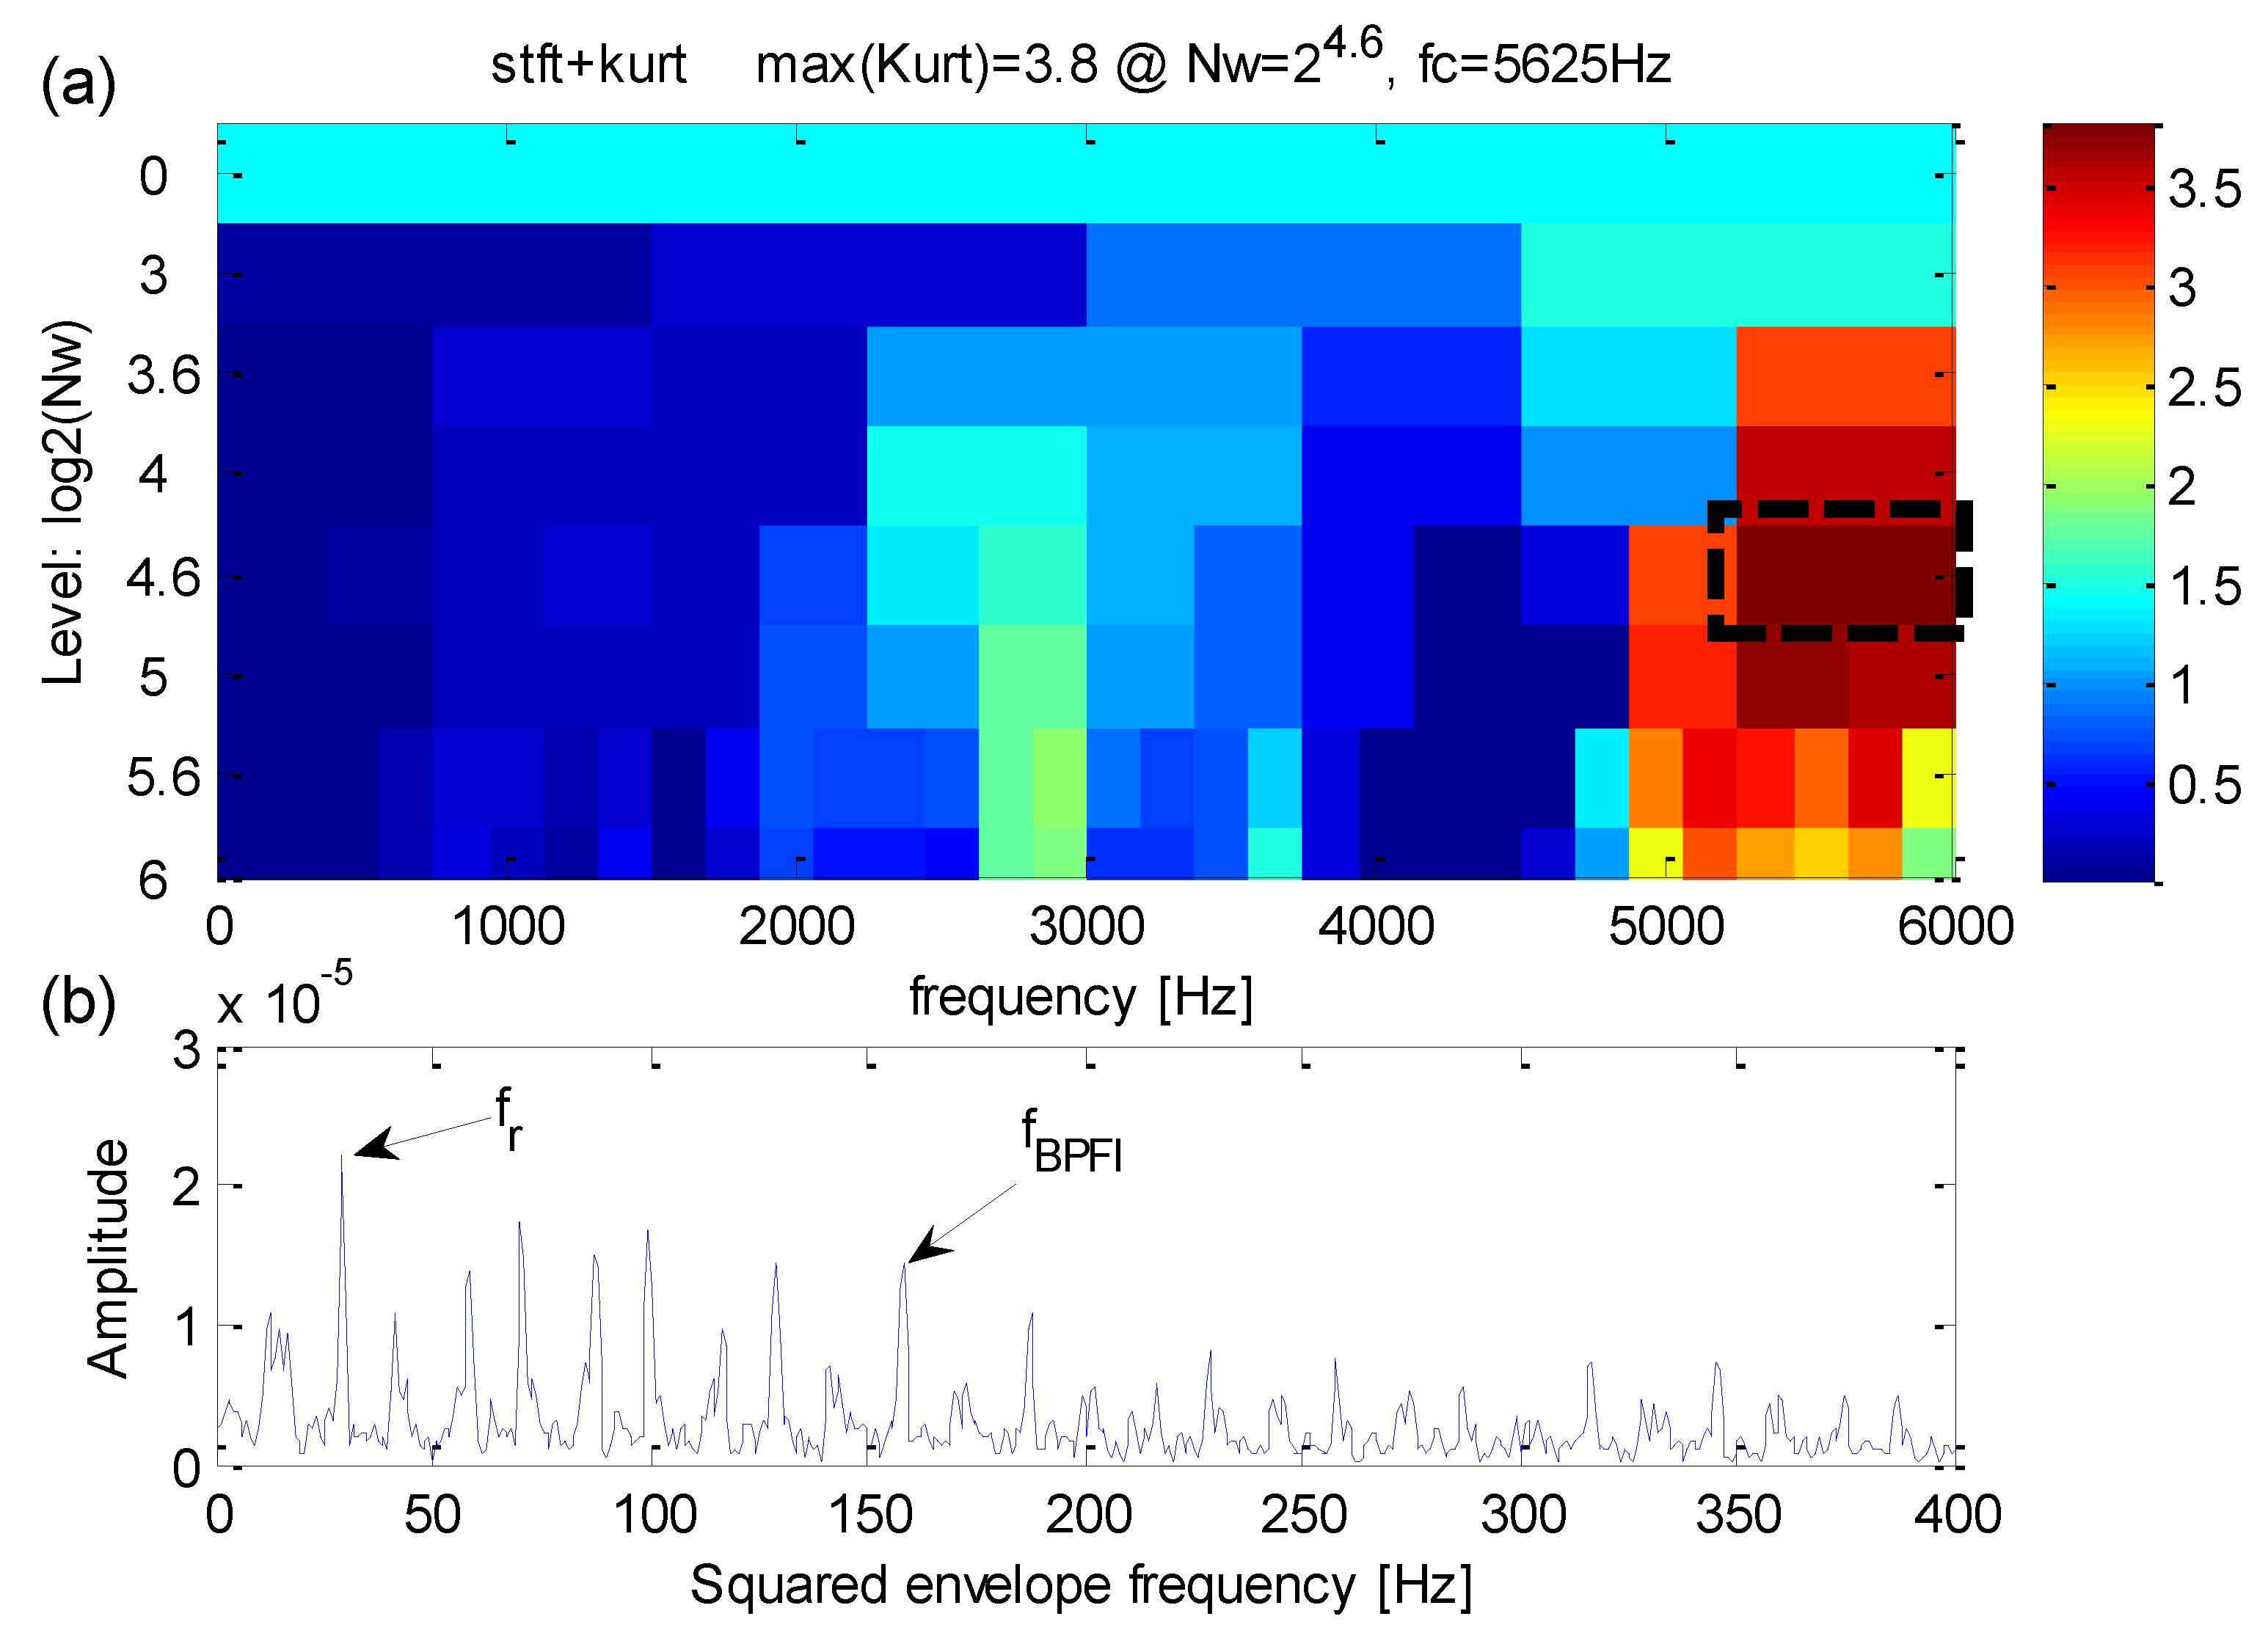
2.1. Spectral Kurtosis and Kurtogram
2.2. Correlated Kurtosis
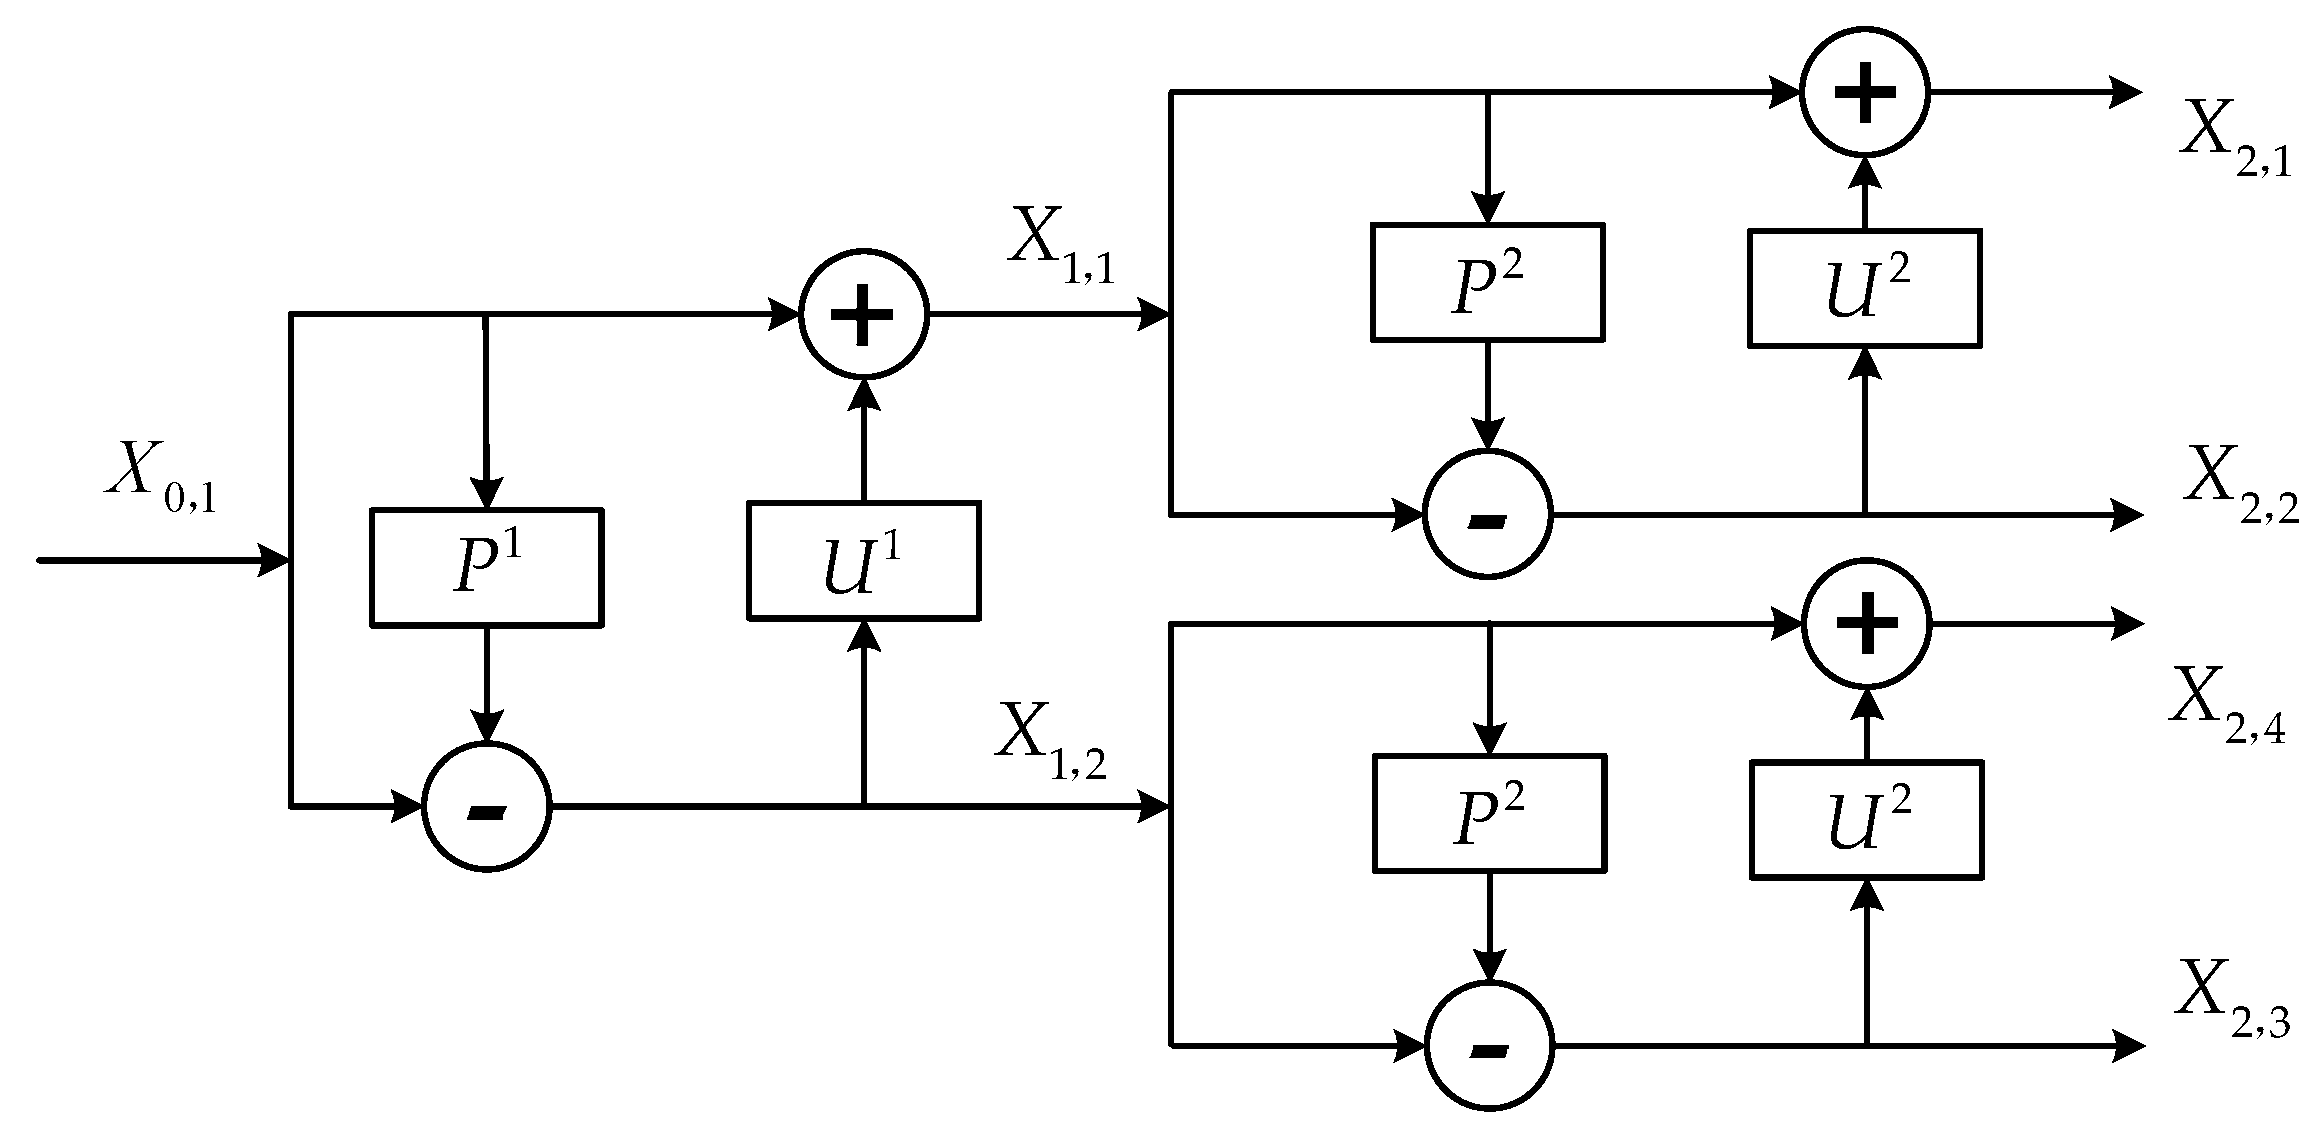
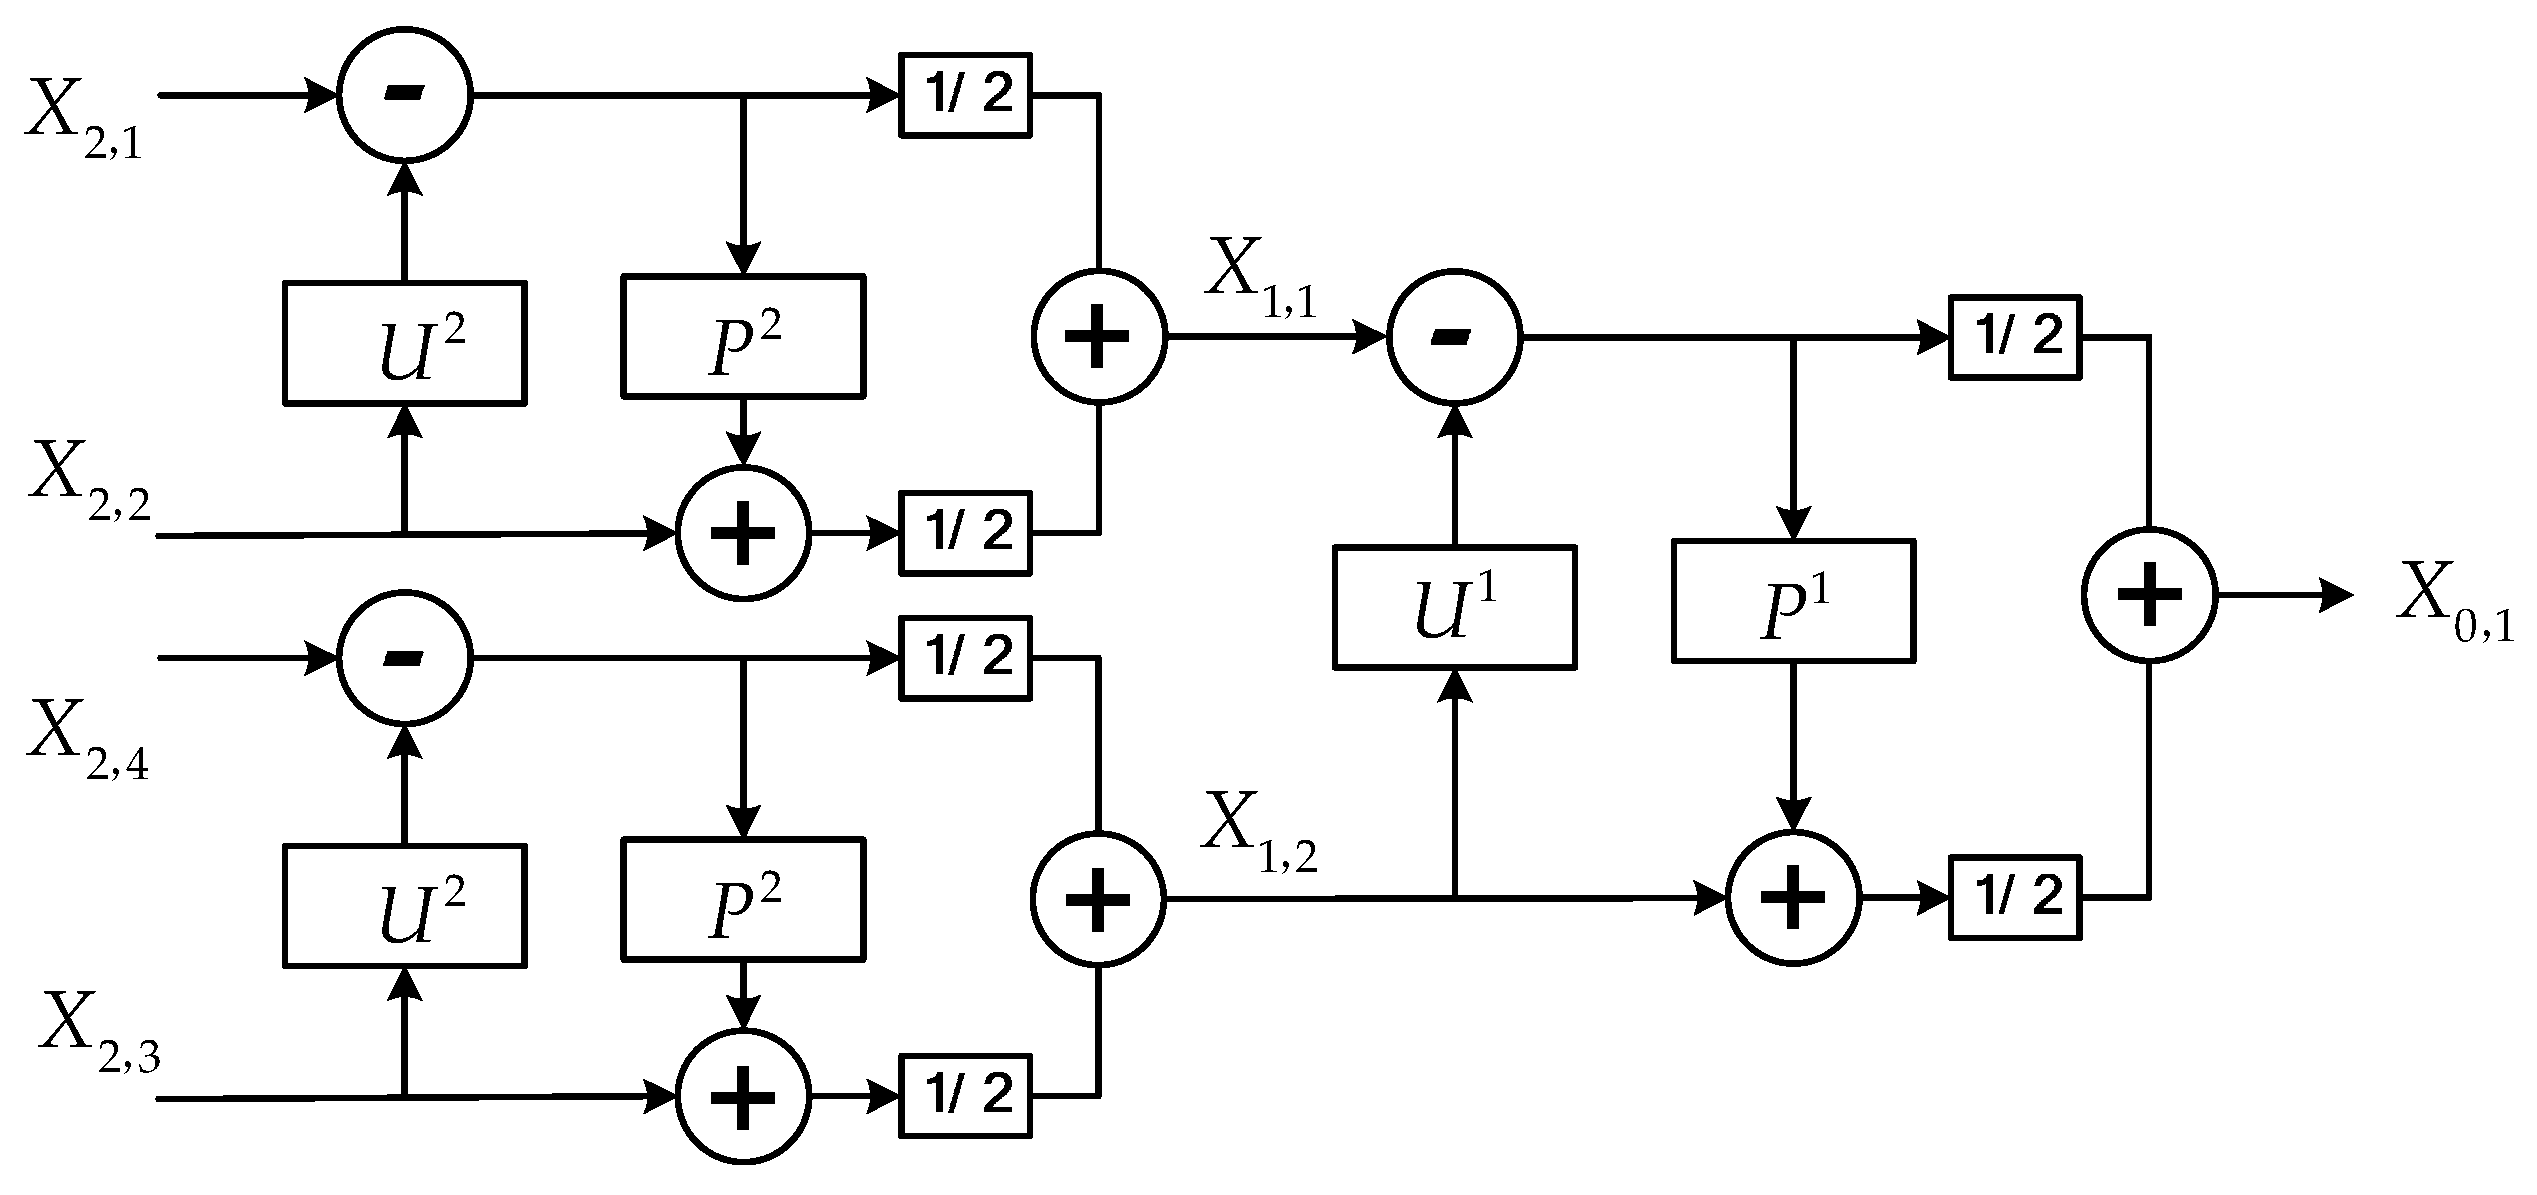
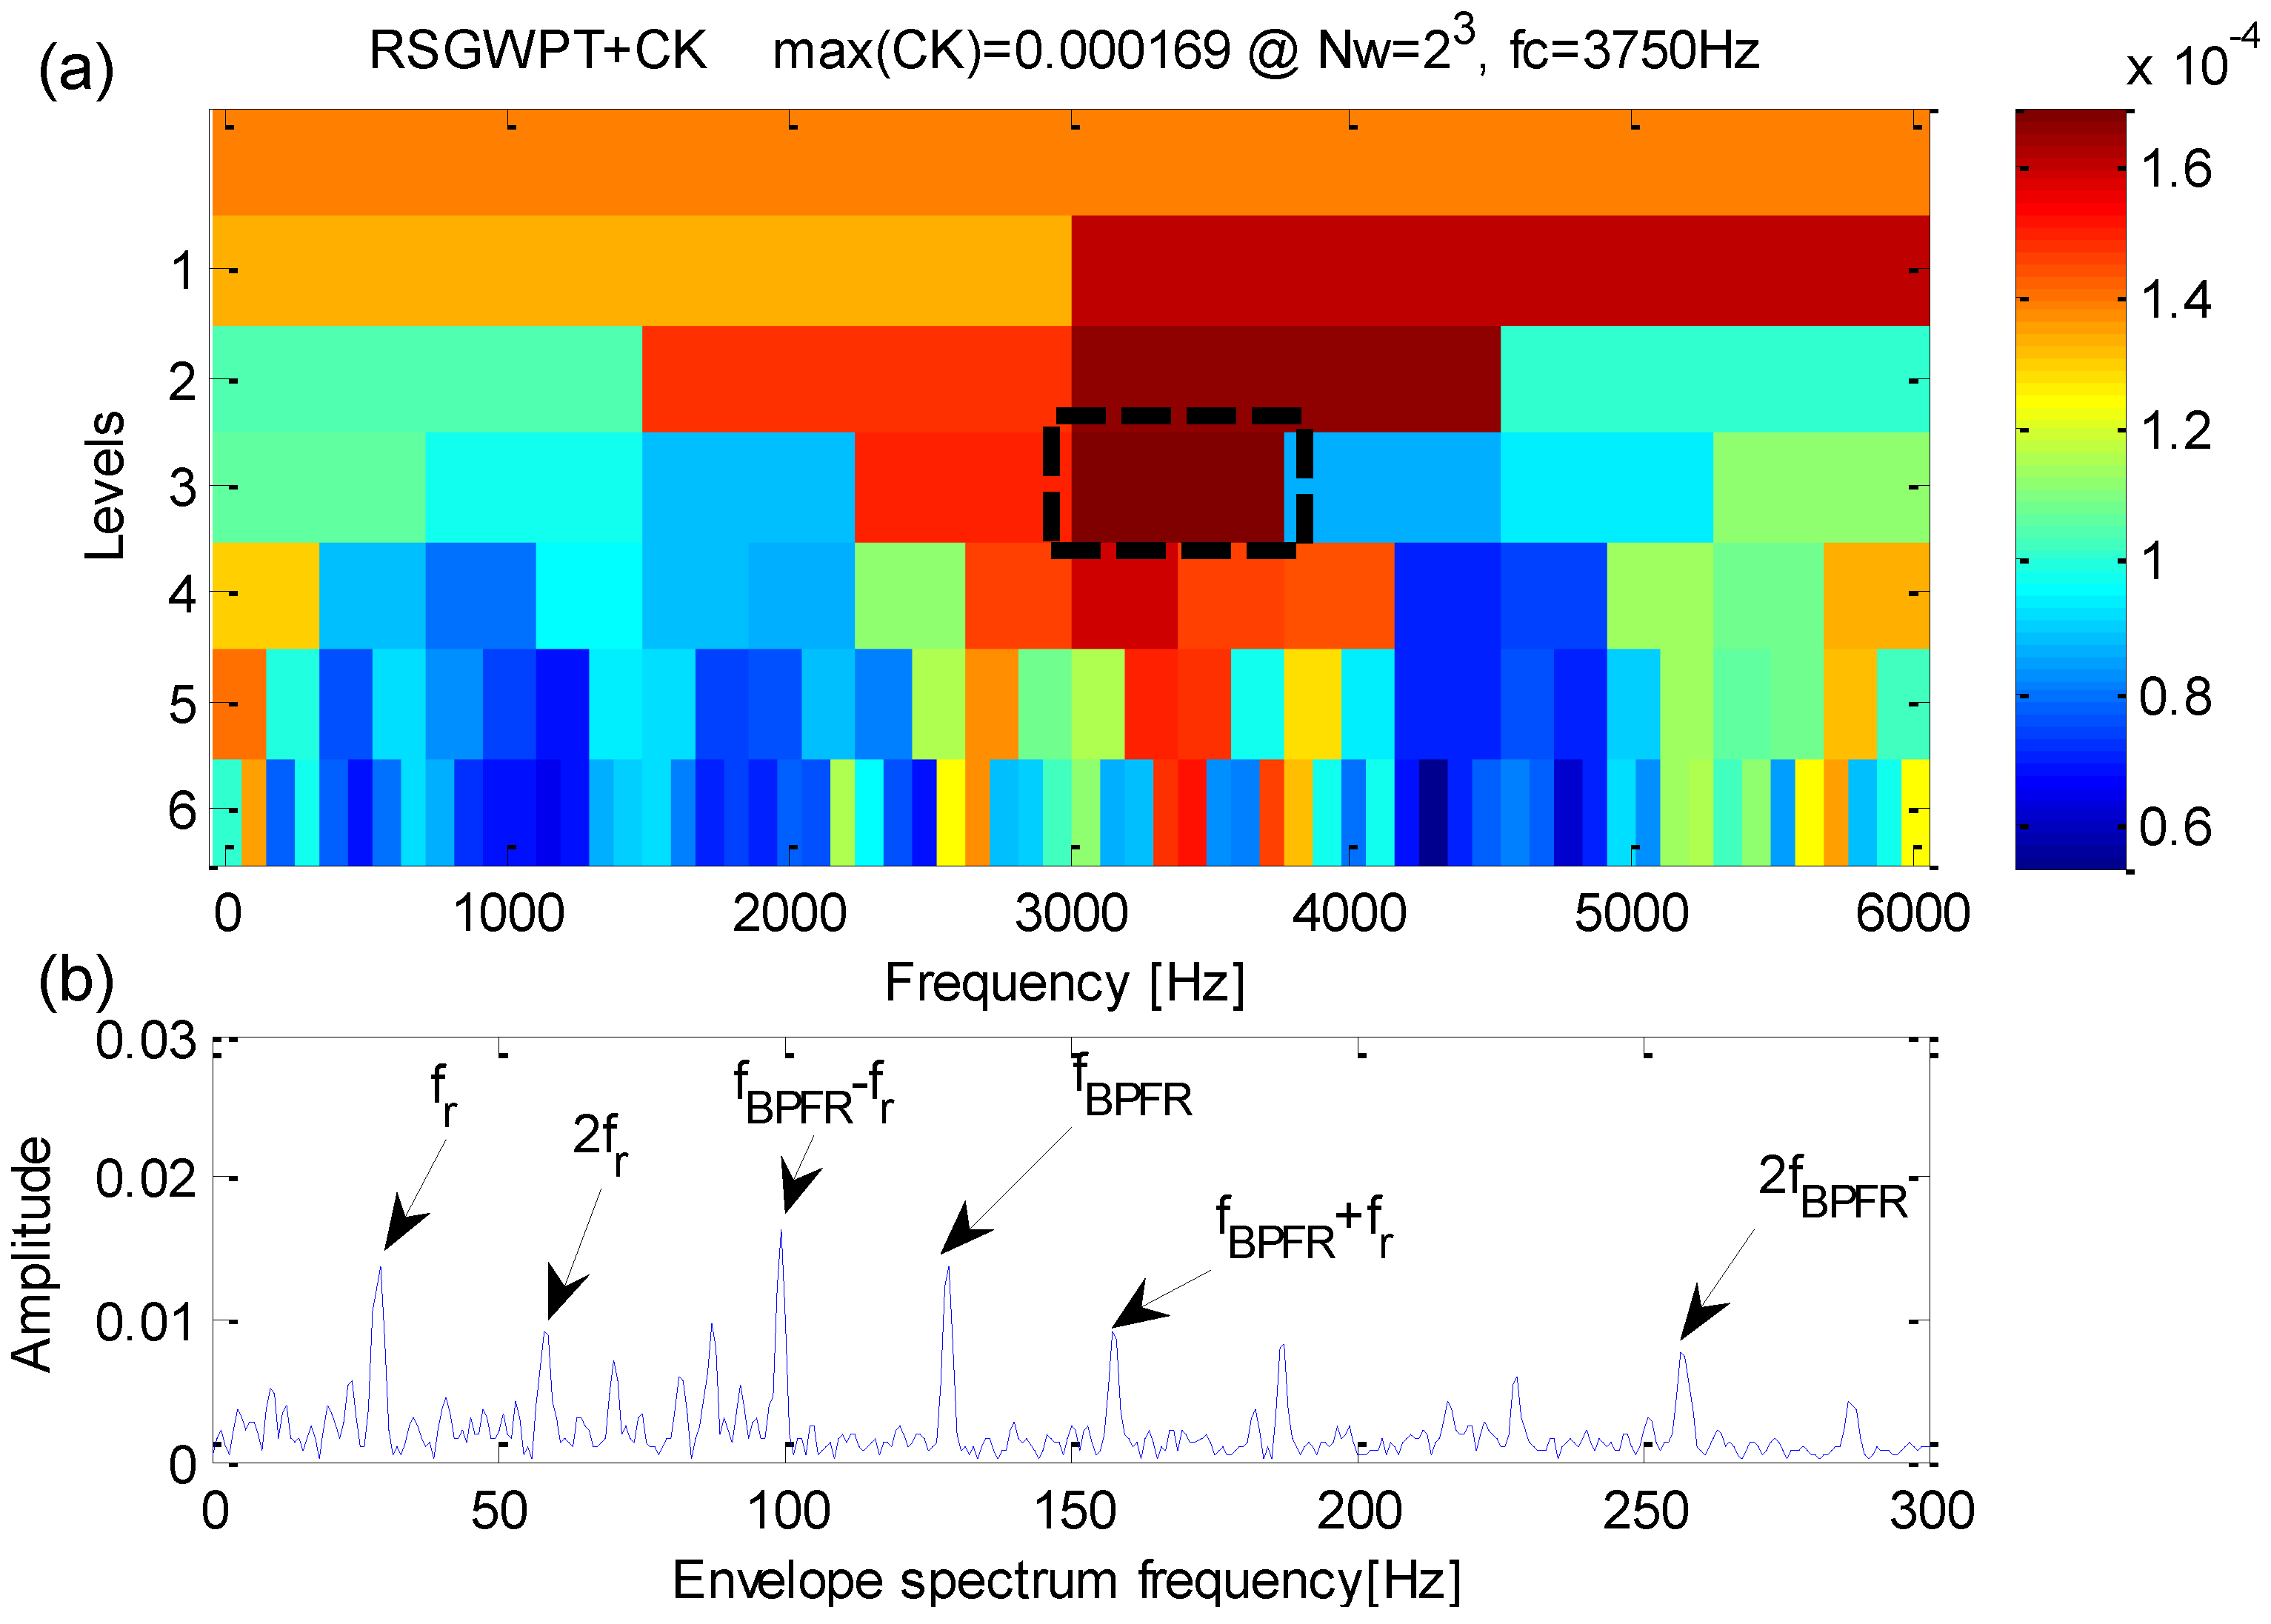
2.3. Redundant Second Generation Wavelet Package Transform
- (1)
- The prediction step and update step of RSGWPT at level are performed by and , which are expressed as follows:where is the k-th wavelet node coefficients at level , is the redundant prediction operator at level and is the redundant update operator at level .
- (2)
- The reconstruction stage of RSGWPT can be obtained from its decomposition stage, which is expressed as follows:
- (3)
- The redundant prediction operator and the redundant update operator at level are expressed as follows:where , and , are initial prediction operator and initial update operator of SGWT, and are their length.
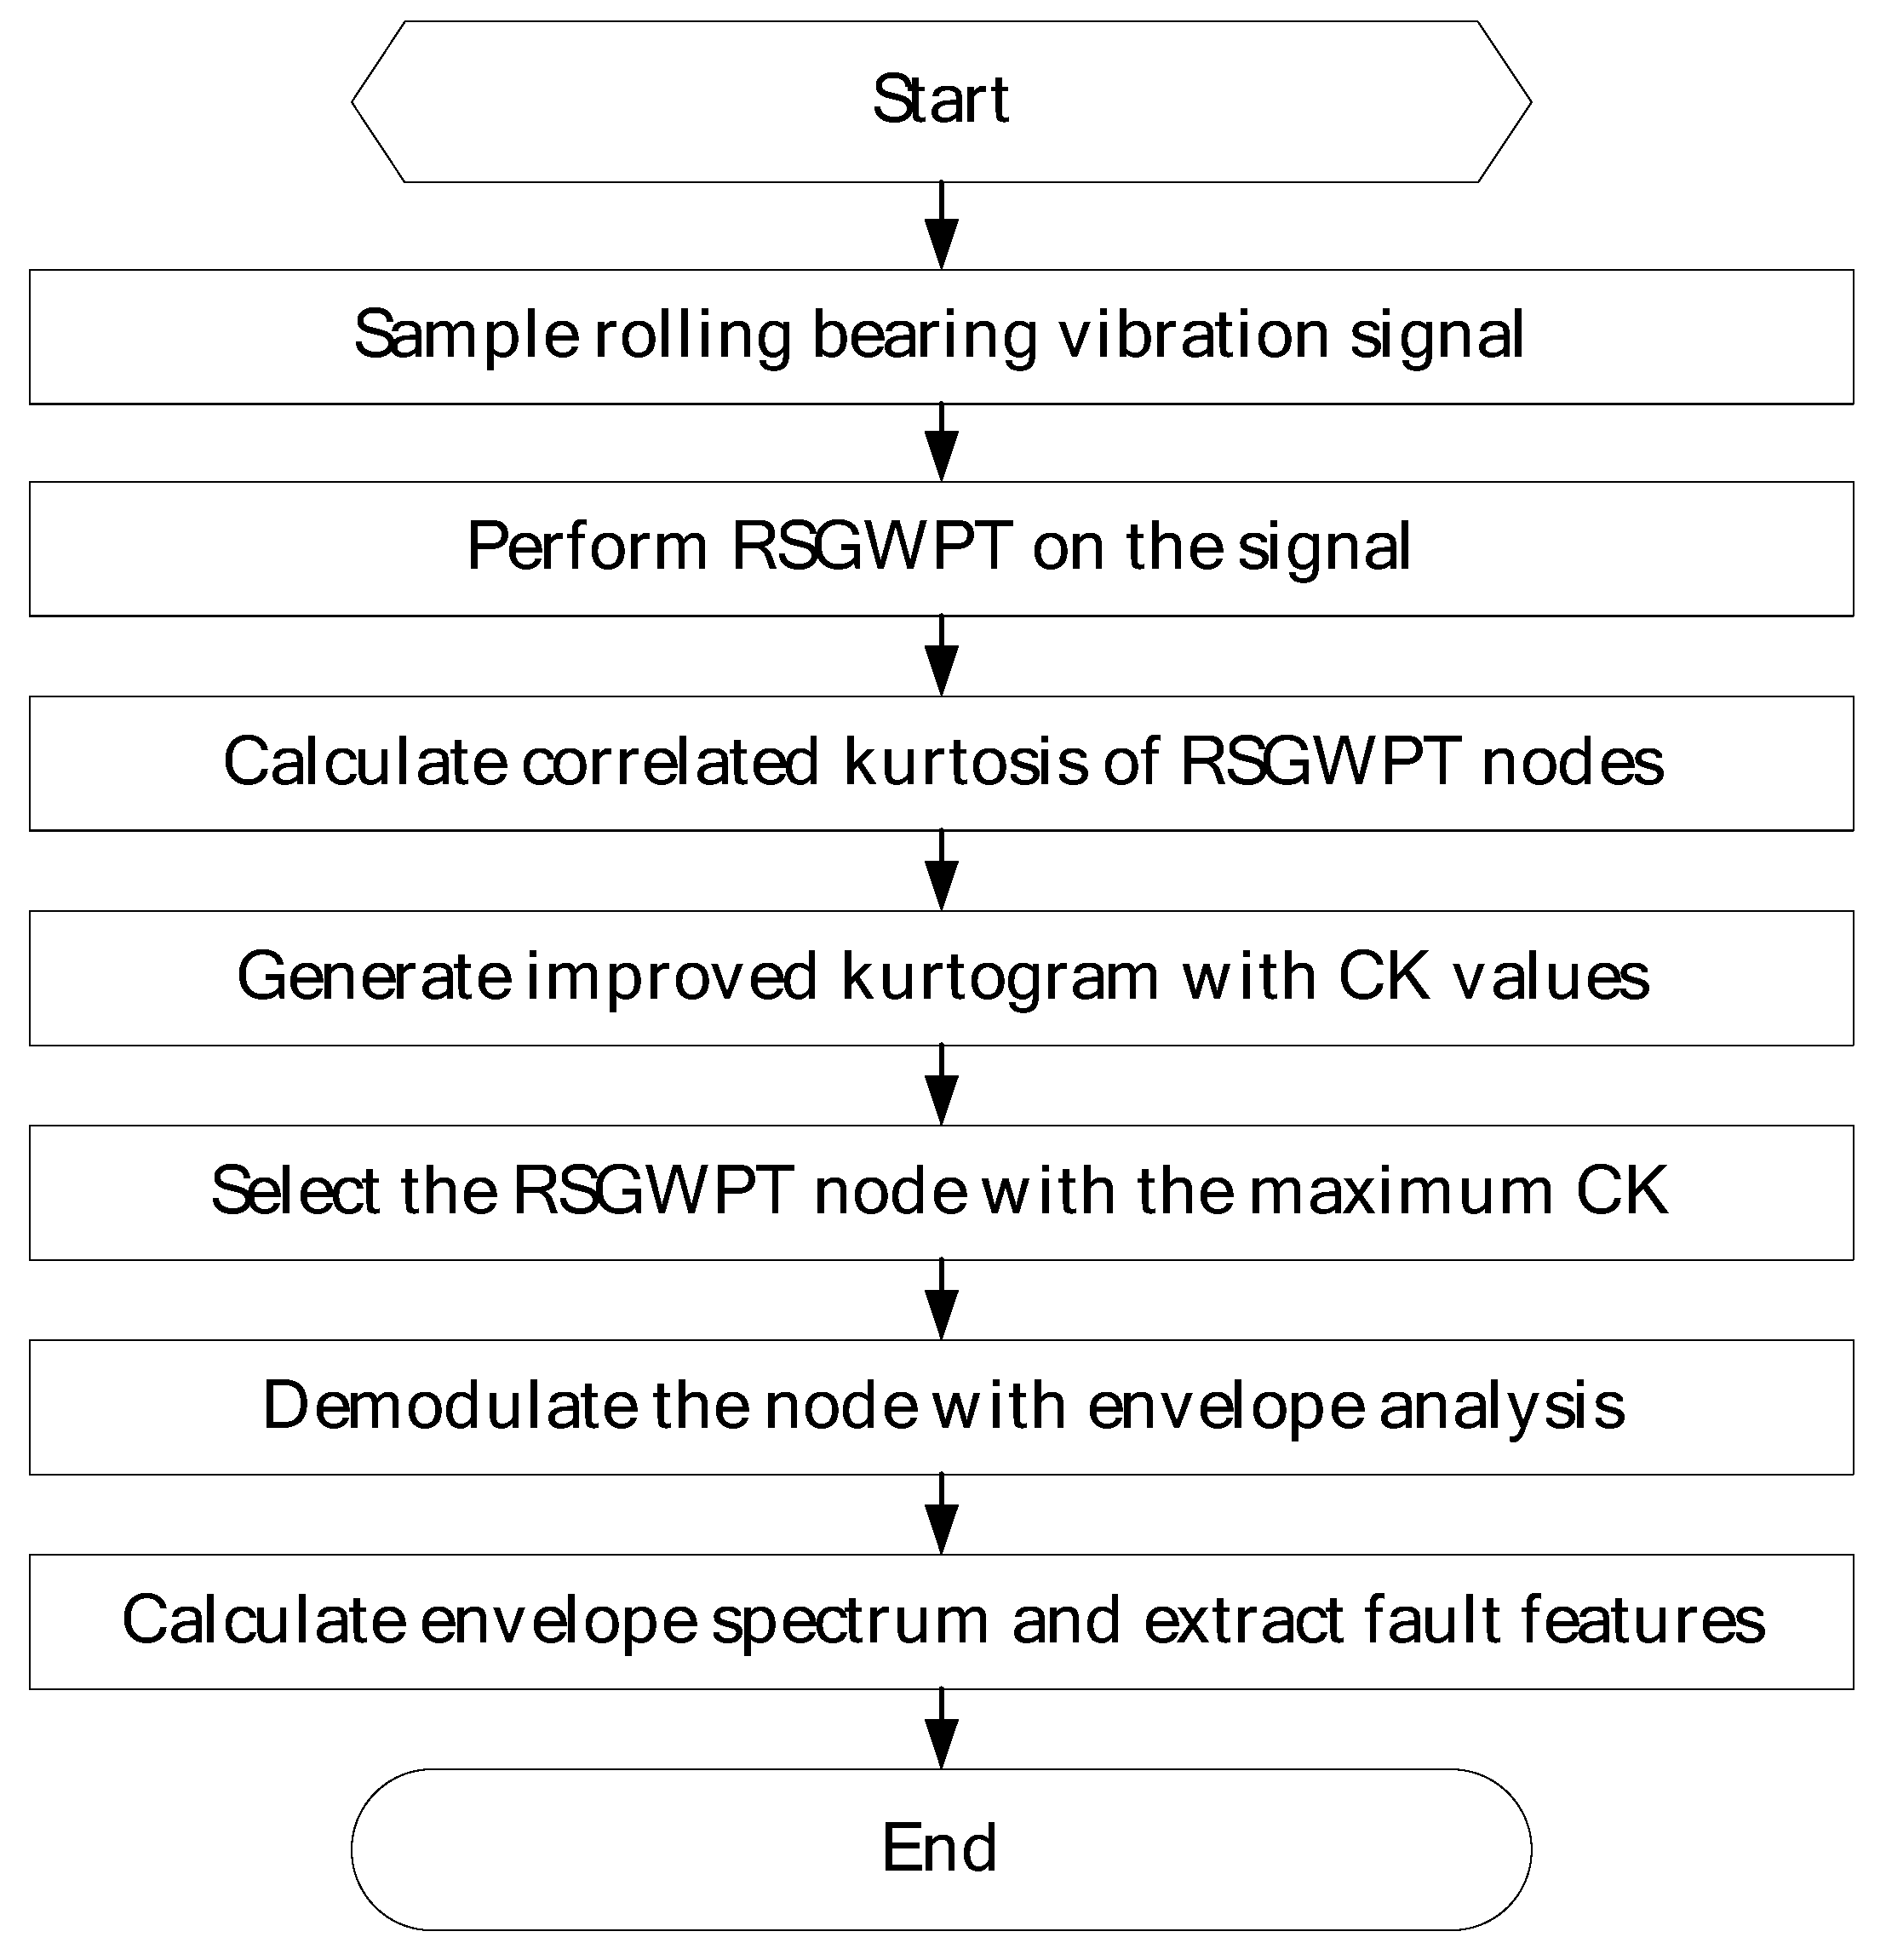
3. Proposed Method
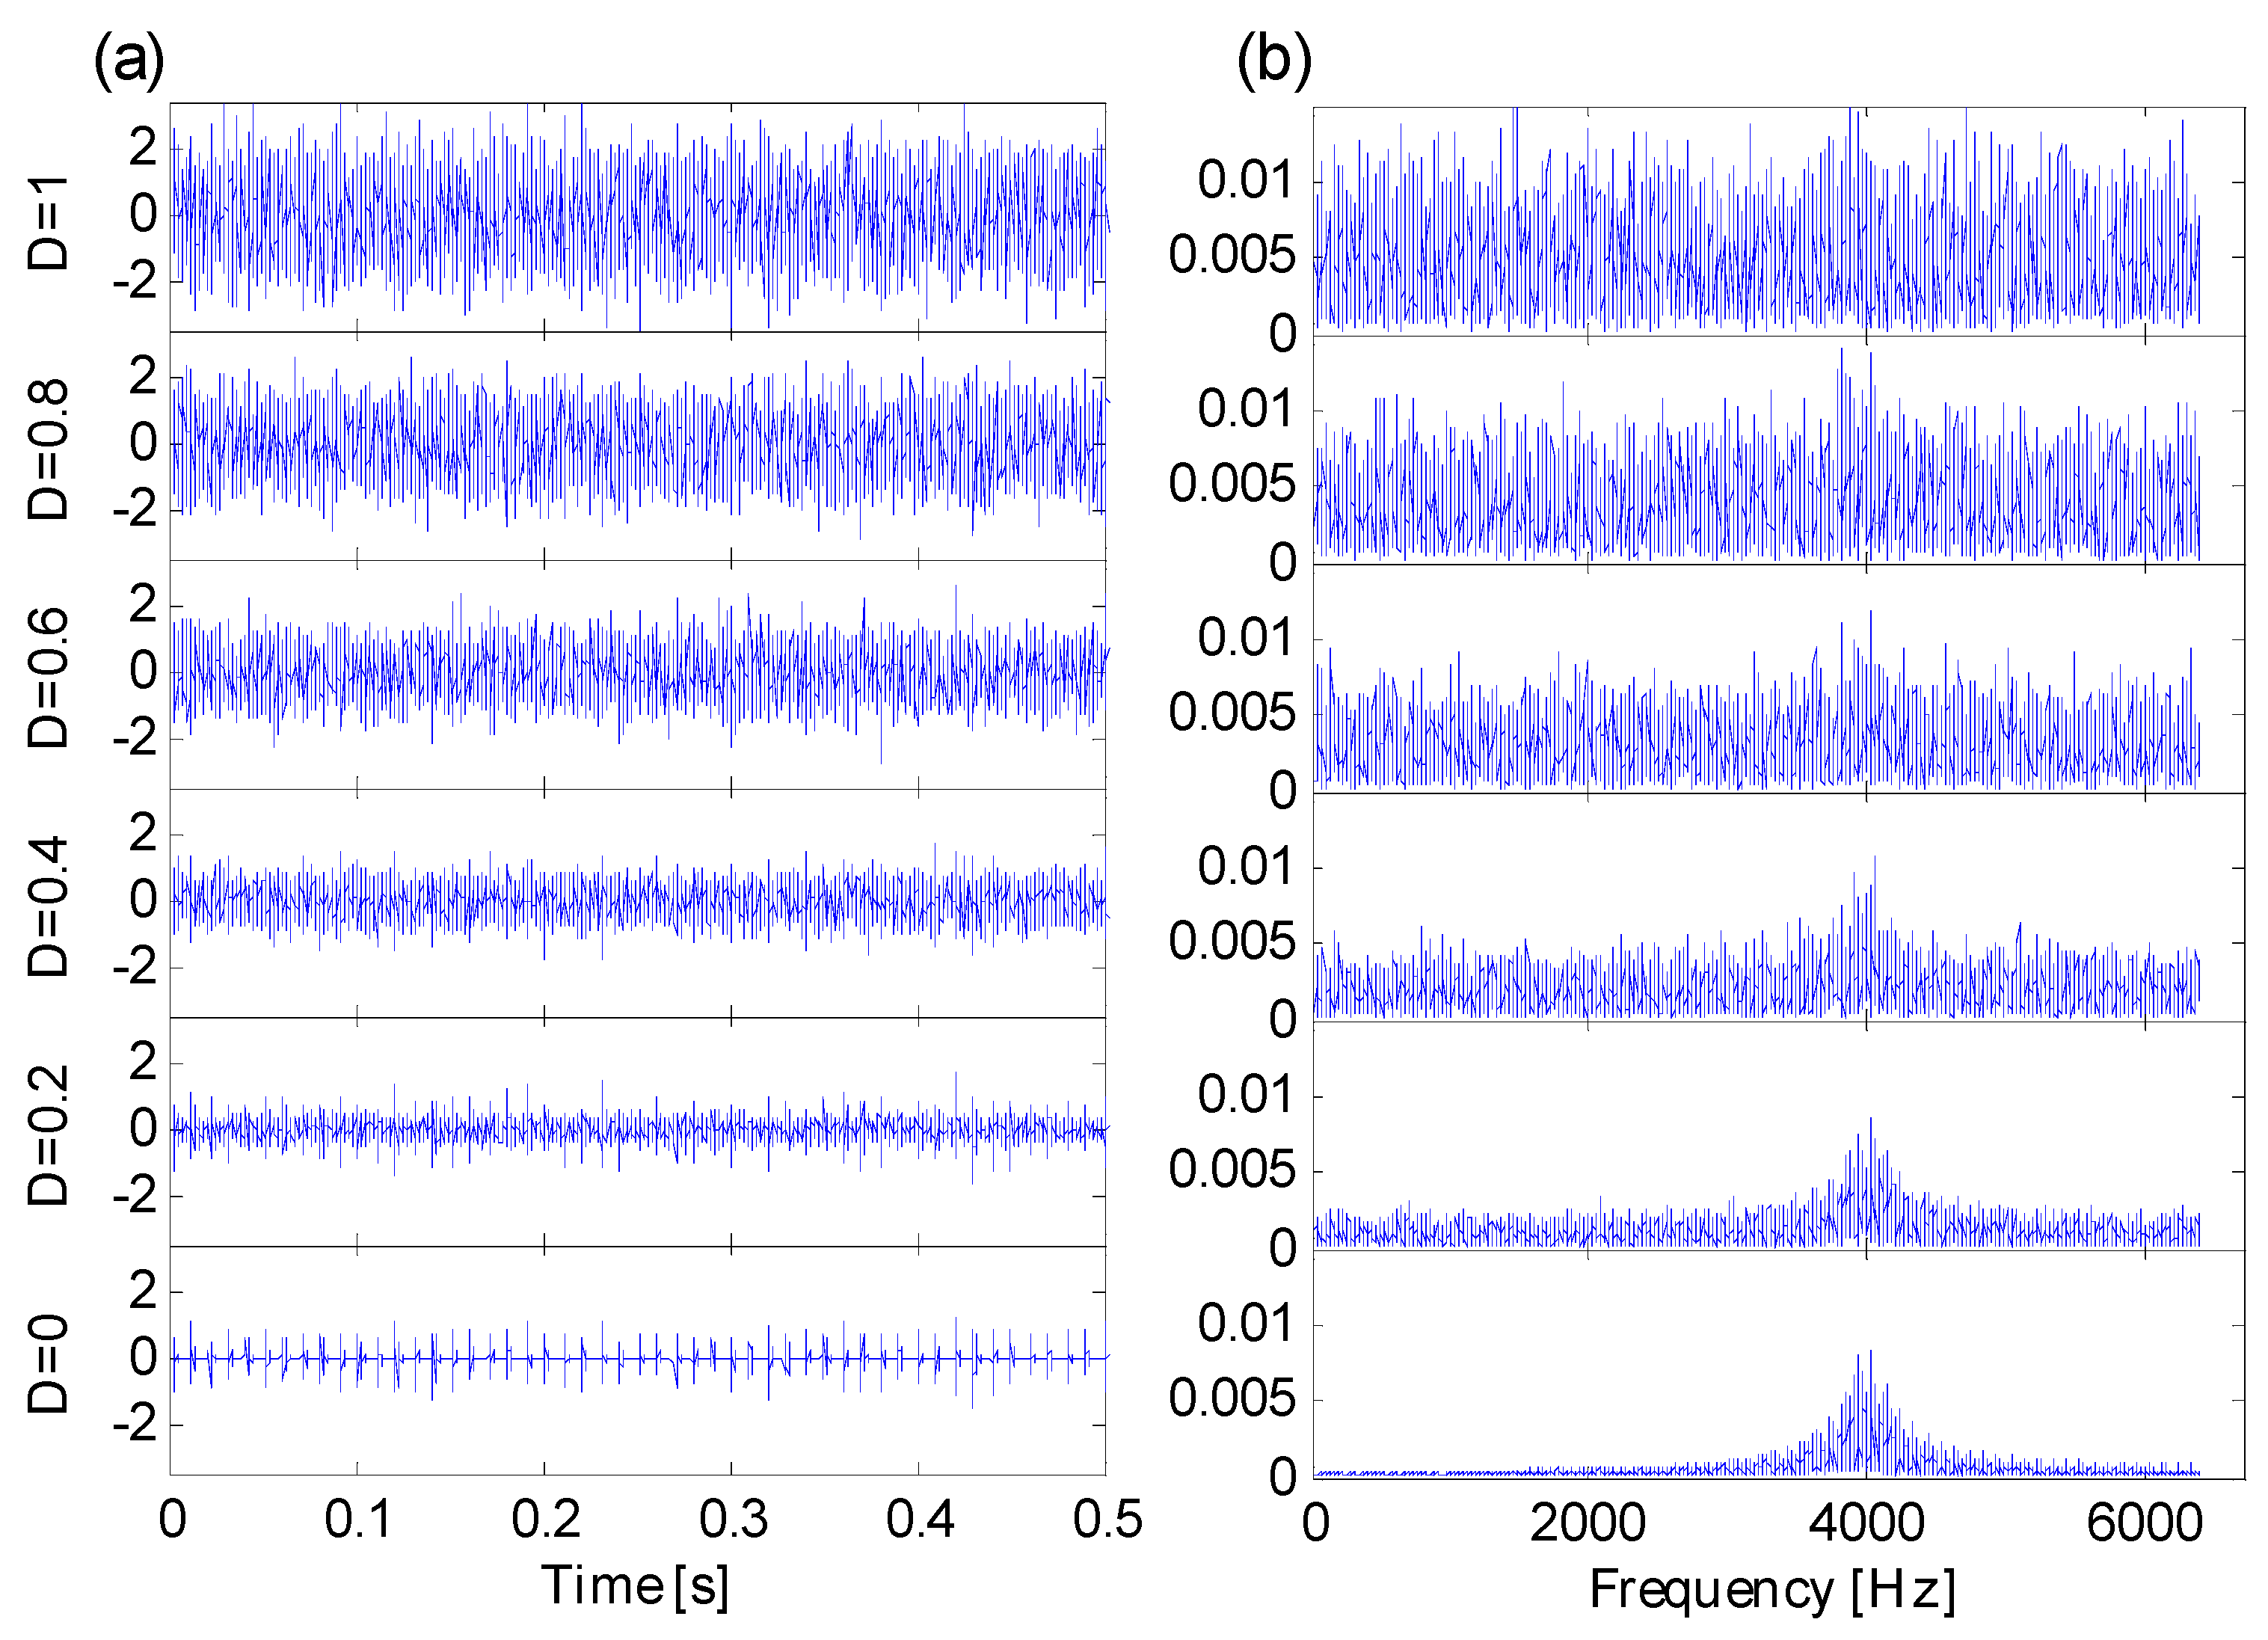
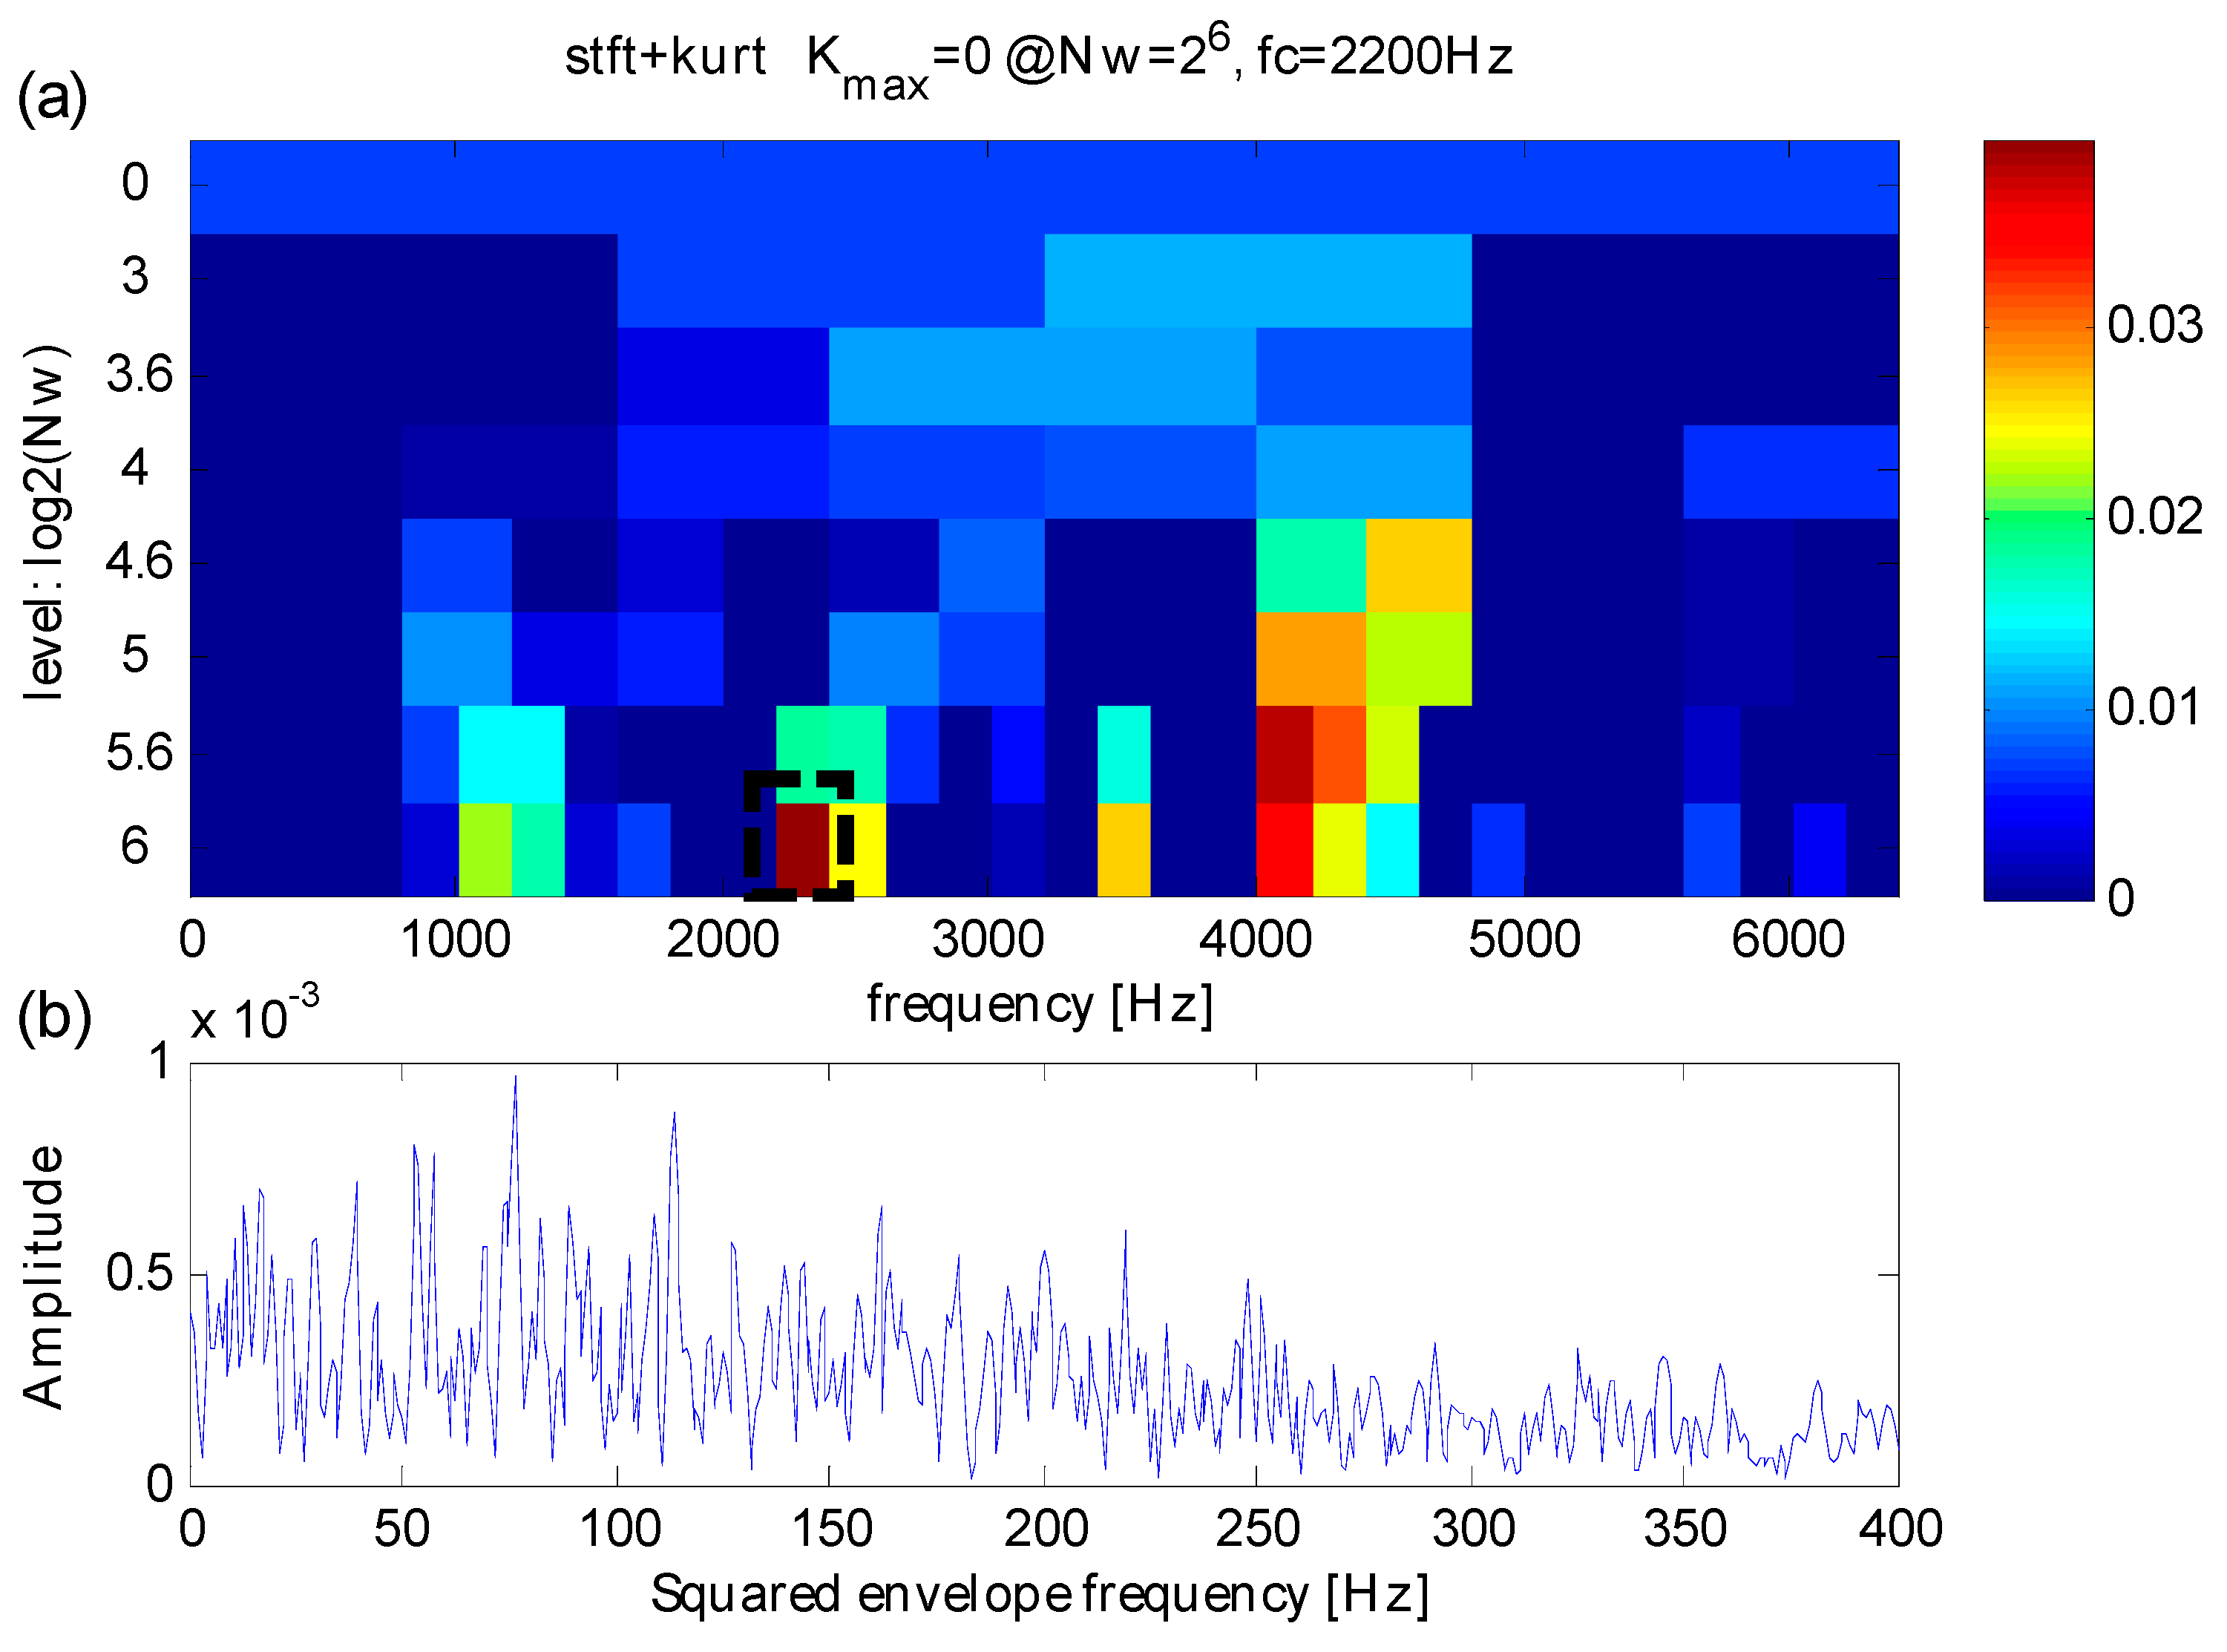
4. Simulation Analysis
5. Applications
5.1. Case 1: Extraction Test Based on Bearing Data from CWRU
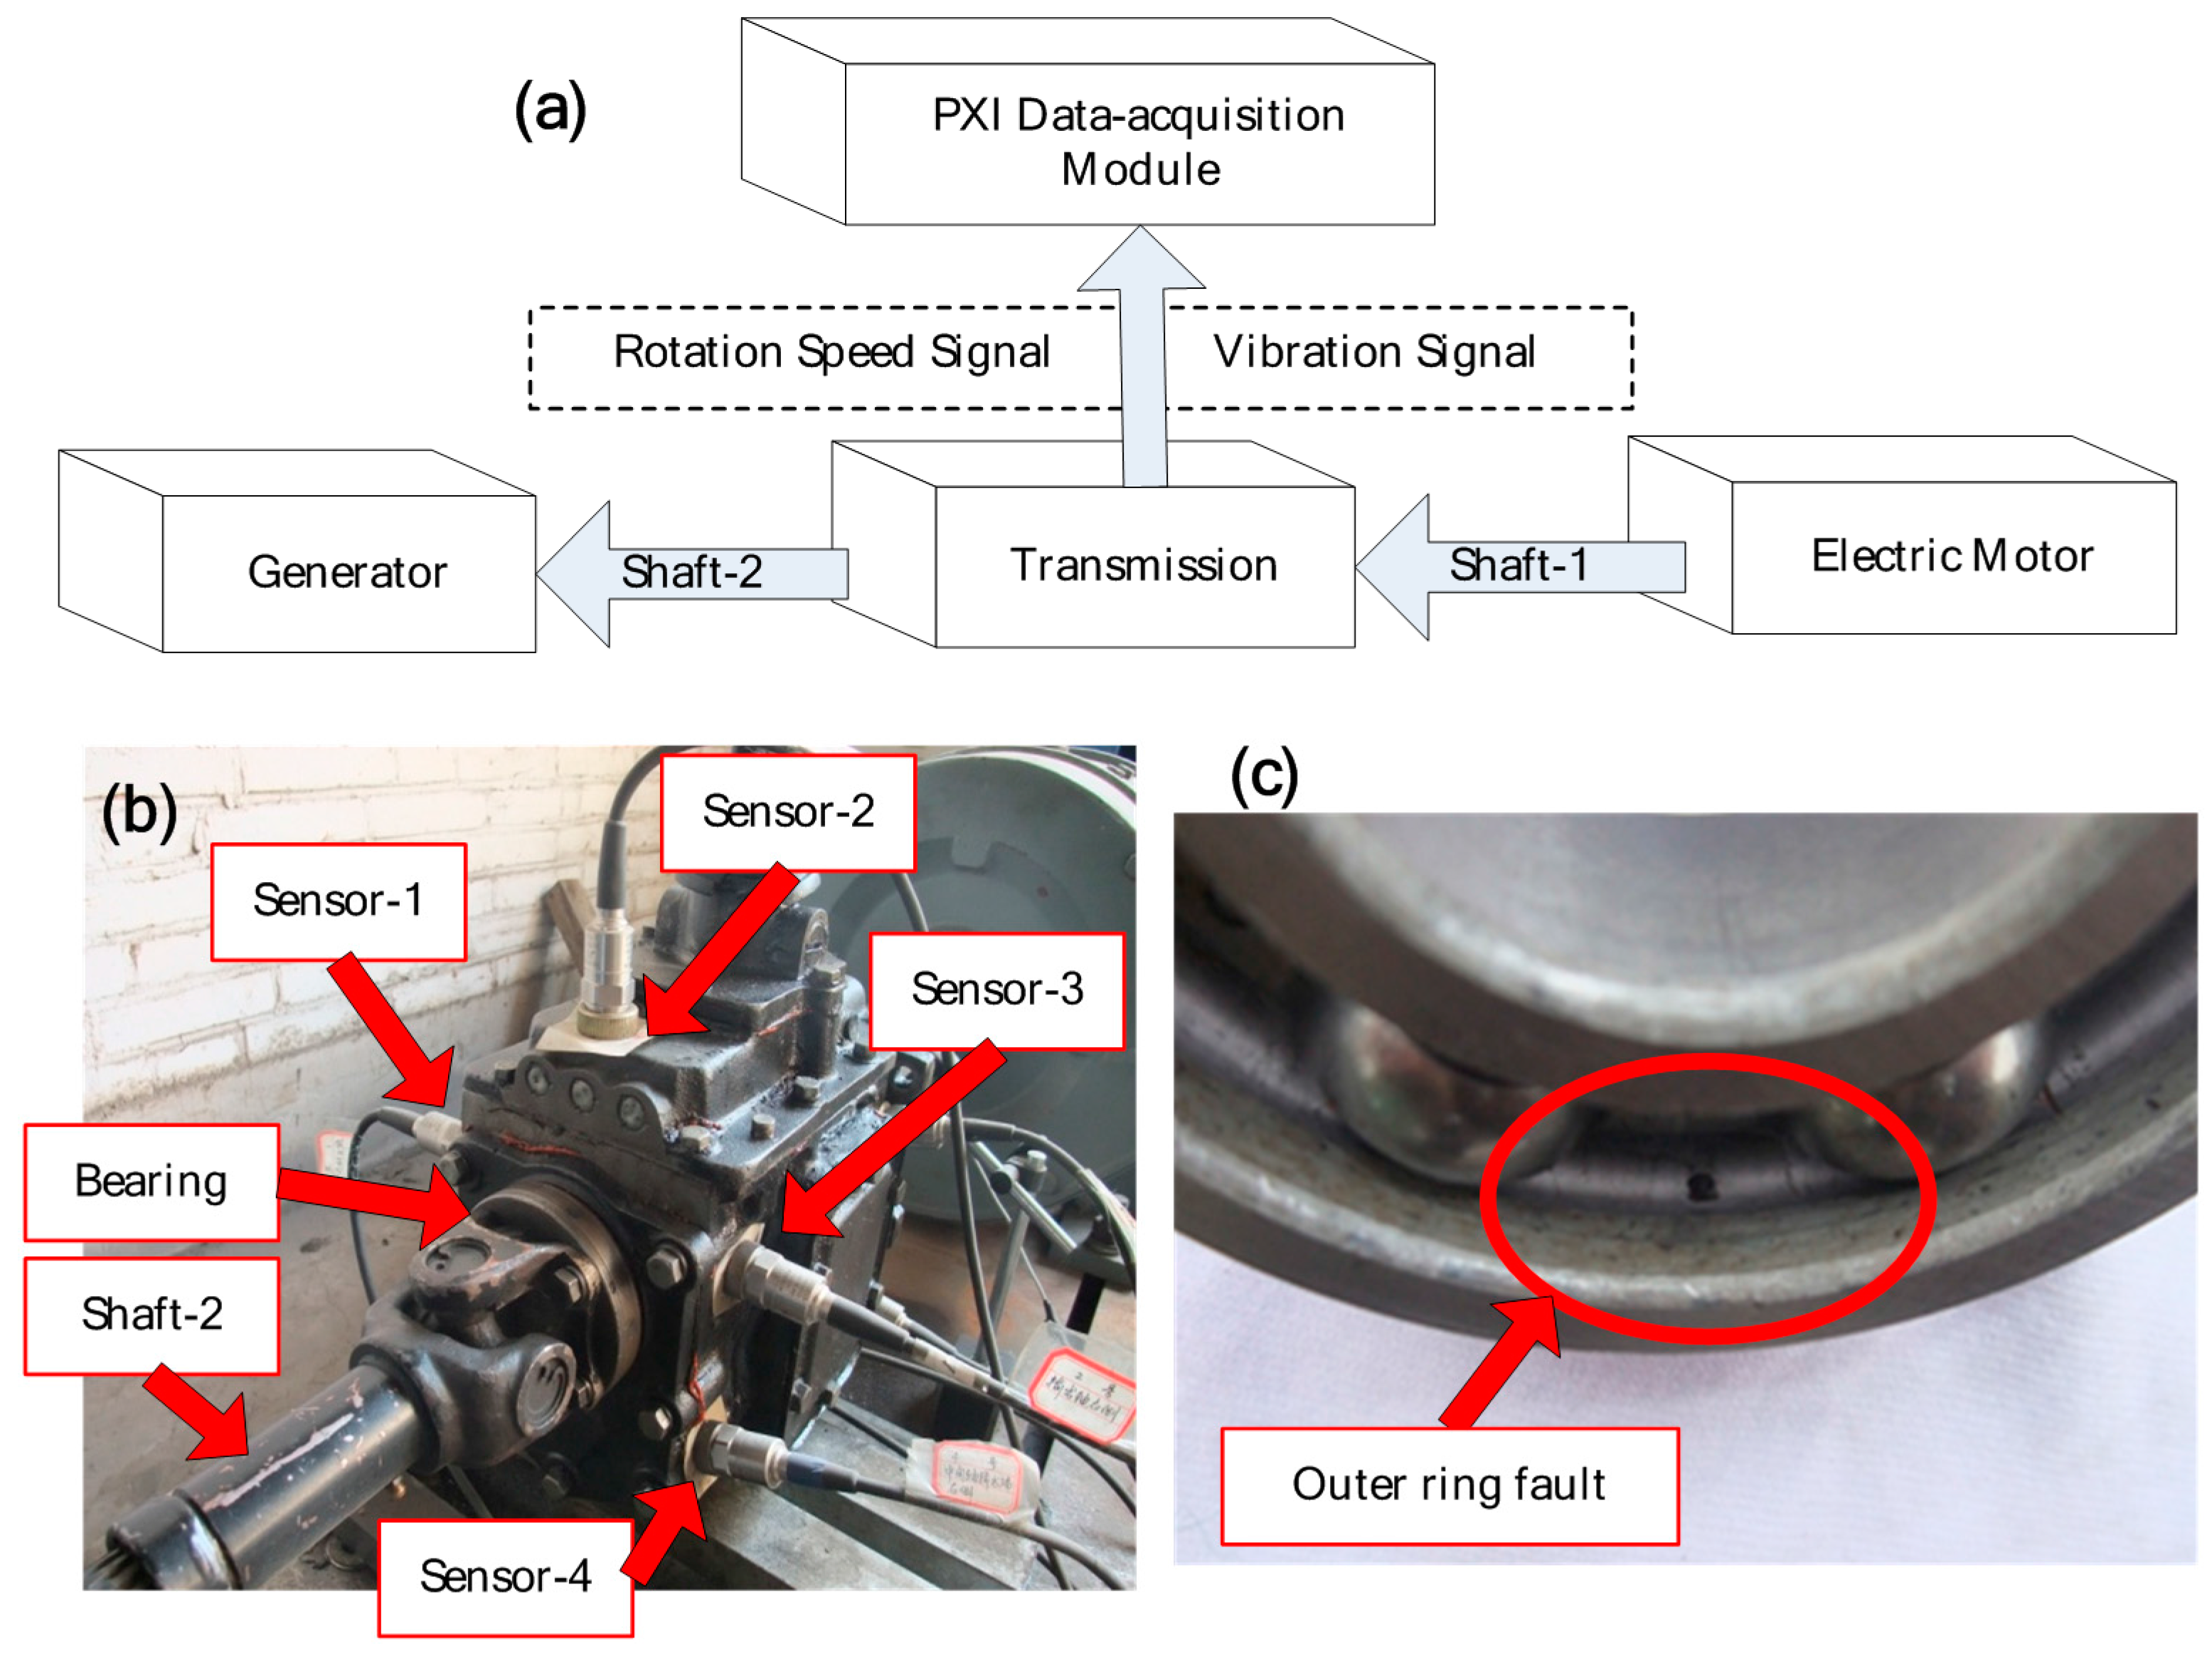
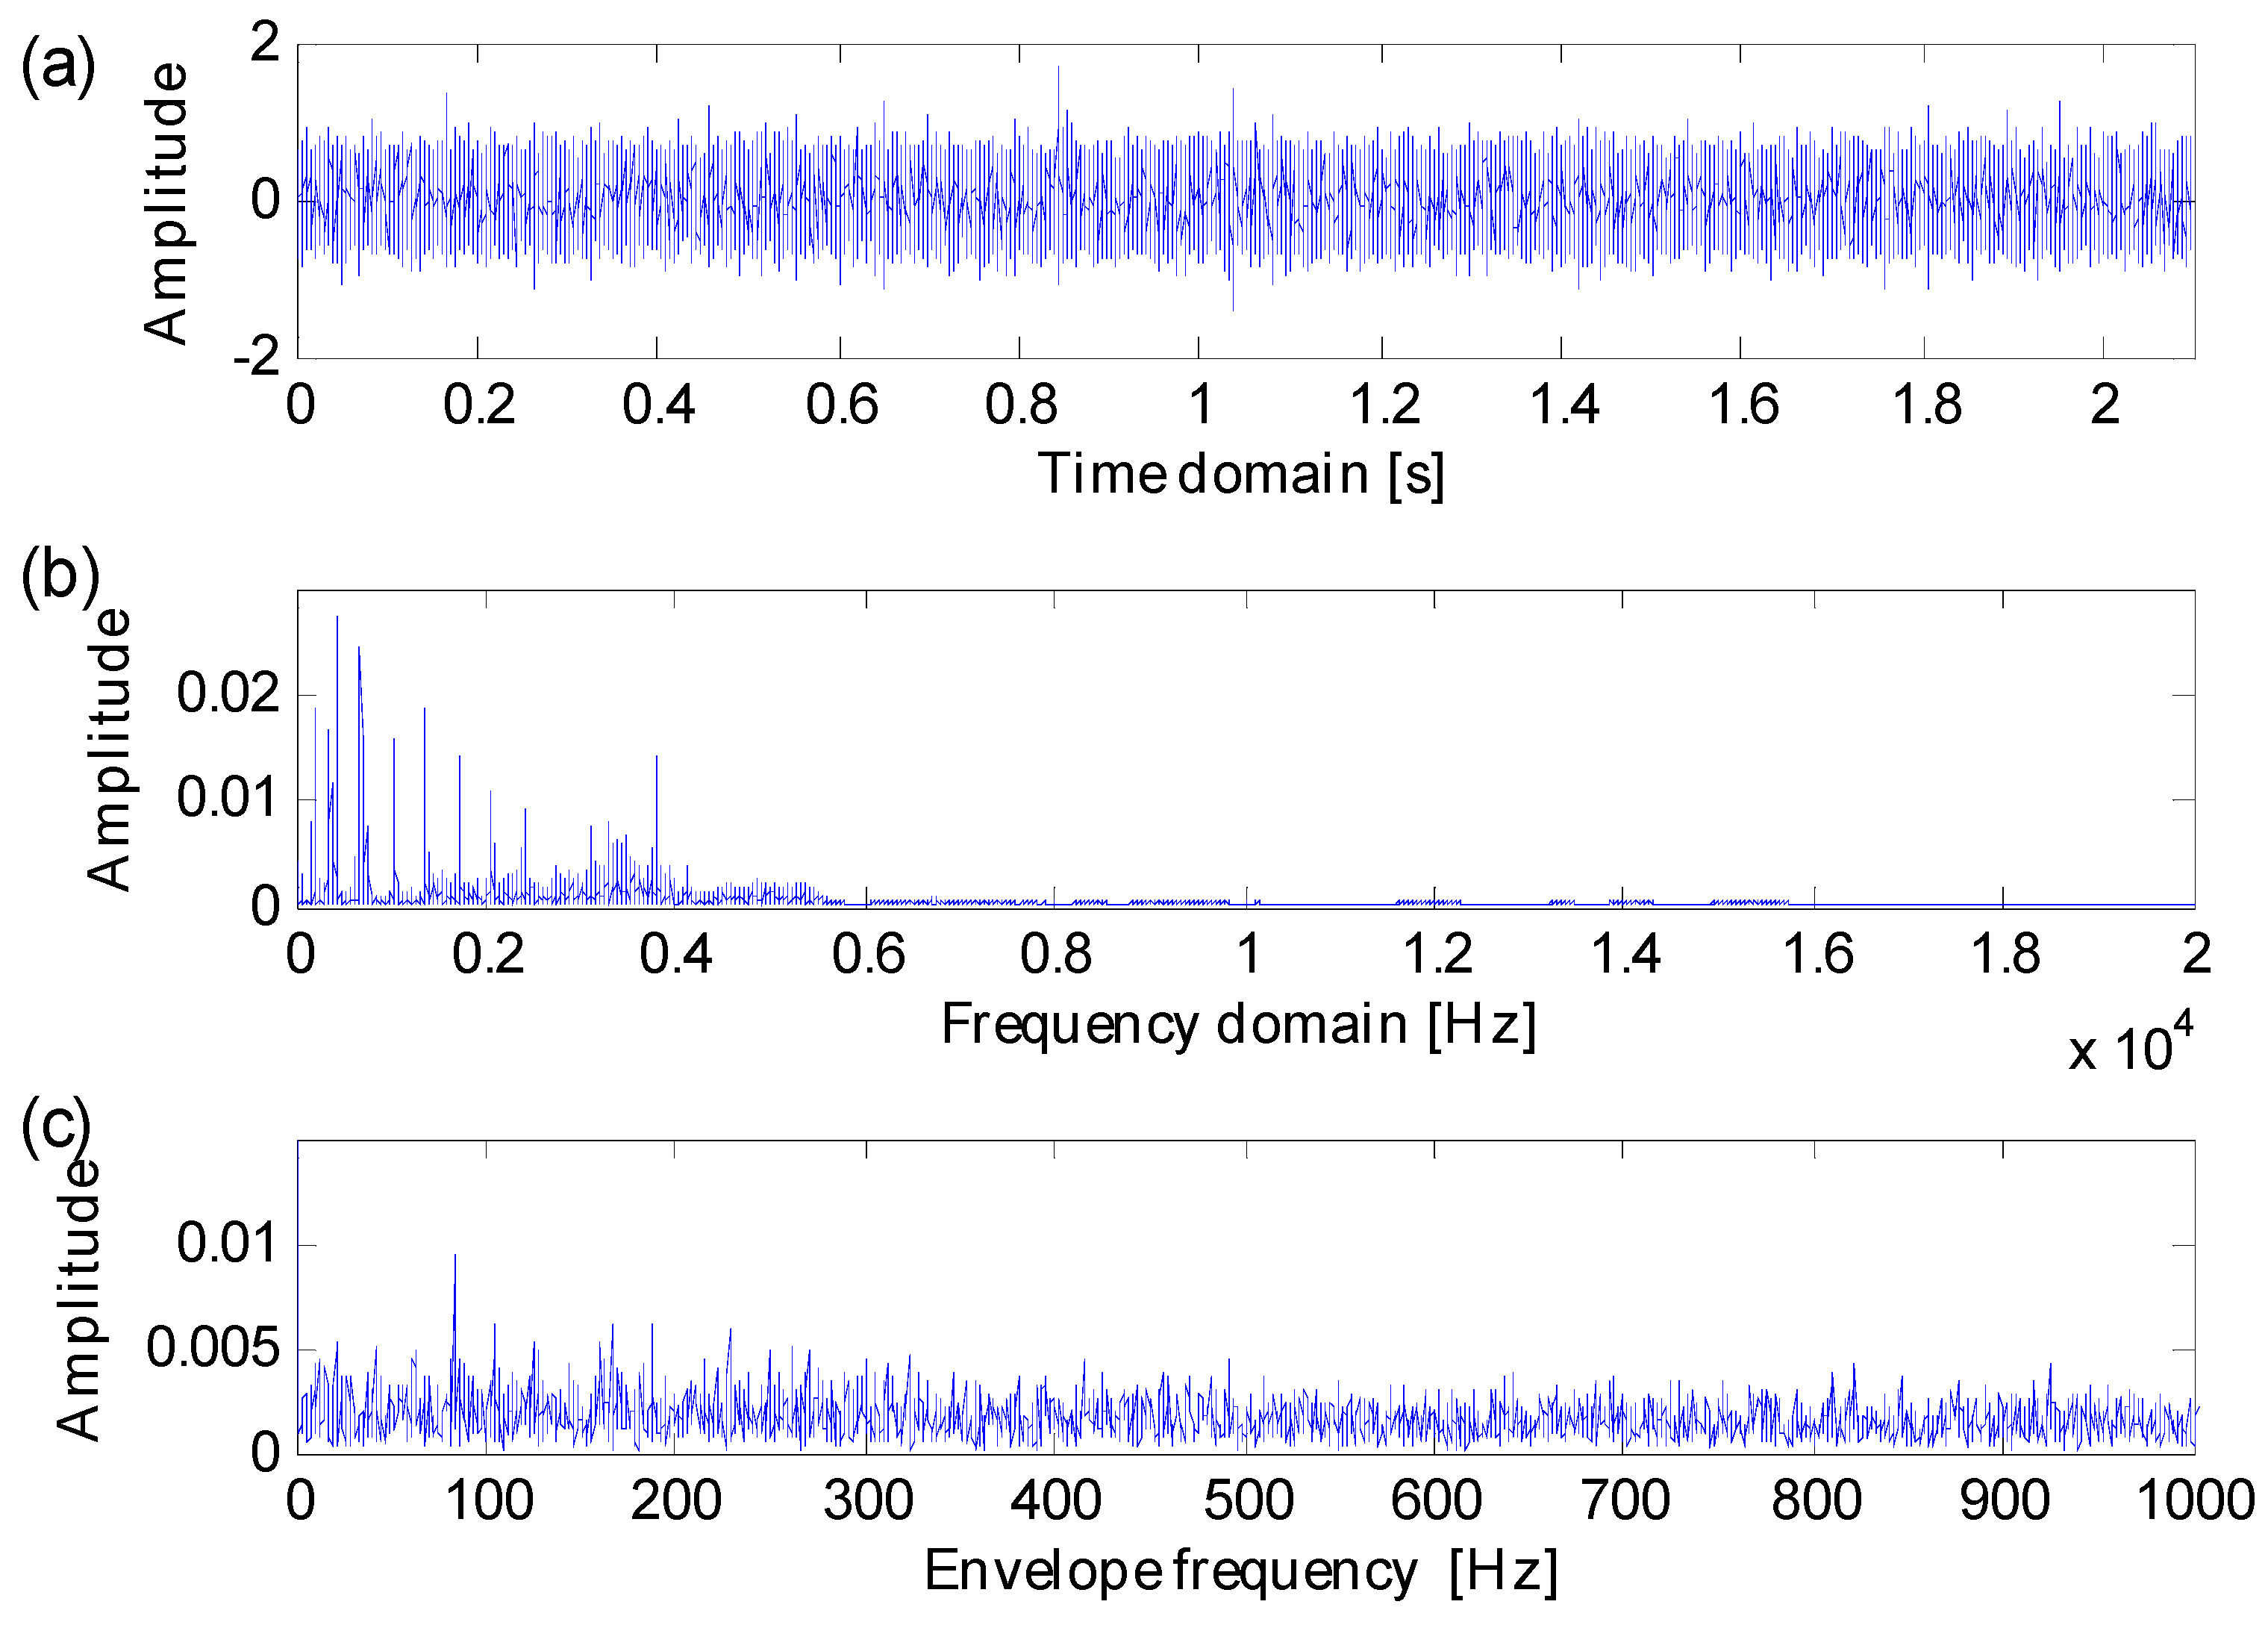
5.2. Case 2: Extraction Test Based on Data from a Real Transmission Rolling Bearing
6. Conclusions
Acknowledgments
Author Contributions
Conflicts of Interest
References
- Smith, W.A.; Randall, R.B. Rolling element bearing diagnostics using the Case Western Reserve University data: A benchmark study. Mech. Syst. Signal Process. 2015, 64–65, 100–131. [Google Scholar] [CrossRef]
- Jia, F.; Lei, Y.; Shan, H.; Lin, J. Early Fault Diagnosis of Bearings Using an Improved Spectral Kurtosis by Maximum Correlated Kurtosis Deconvolution. Sensors 2015, 15, 29363–29377. [Google Scholar] [CrossRef] [PubMed]
- Chen, J.; Li, Z.; Pan, J.; Chen, G.; Zi, Y.; Yuan, J.; Chen, B.; He, Z. Wavelet transform based on inner product in fault diagnosis of rotating machinery: A review. Mech. Syst. Signal Process. 2016, 70–71, 1–35. [Google Scholar] [CrossRef]
- Huang, N.E.; Shen, Z.; Long, S.R.; Wu, M.C.; Shih, H.H.; Zheng, Q.; Yen, N.C.; Tung, C.C.; Liu, H.H. The empirical mode decomposition and the Hilbert spectrum for nonlinear and non-stationary time series analysis. Proc. R. Soc. Lond. Ser. A Math. Phys. Eng. Sci. 1998, 454, 903–995. [Google Scholar] [CrossRef]
- Smith, J.S. The local mean decomposition and its application to EEG perception data. J. R. Soc. Interface 2005, 2, 443–454. [Google Scholar] [CrossRef] [PubMed]
- Lei, Y.; Han, D.; Lin, J.; He, Z. Planetary gearbox fault diagnosis using an adaptive stochastic resonance method. Mech. Syst. Signal Process. 2013, 38, 113–124. [Google Scholar] [CrossRef]
- Tse, P.W.; Wang, D. The design of a new sparsogram for fast bearing fault diagnosis: Part 1 of the two related manuscripts that have a joint title as “Two automatic vibration-based fault diagnostic methods using the novel sparsity measurement—Parts 1 and 2”. Mech. Syst. Signal Process. 2013, 40, 499–519. [Google Scholar] [CrossRef]
- Tse, P.W.; Wang, D. The automatic selection of an optimal wavelet filter and its enhancement by the new sparsogram for bearing fault detection. Mech. Syst. Signal Process. 2013, 40, 520–544. [Google Scholar] [CrossRef]
- Antoni, J. The infogram: Entropic evidence of the signature of repetitive transients. Mech. Syst. Signal Process. 2016, 74, 73–94. [Google Scholar] [CrossRef]
- Wang, D. An extension of the infograms to novel Bayesian inference for bearing fault feature identification. Mech. Syst. Signal Process. 2016, 80, 19–30. [Google Scholar] [CrossRef]
- Antoni, J. The spectral kurtosis: A useful tool for characterizing non-stationary signals. Mech. Syst. Signal Process. 2006, 20, 282–307. [Google Scholar] [CrossRef]
- Antoni, J.; Randall, R.B. The spectral kurtosis: Application to the vibratory surveillance and diagnostics of rotating machines. Mech. Syst. Signal Process. 2006, 20, 308–331. [Google Scholar] [CrossRef]
- De la Rosa, J.J.G.; Agüera Pérez, A.; Palomares Salas, J.C.; Sierra Fernández, J.M. A novel measurement method for transient detection based in wavelets entropy and the spectral kurtosis: An application to vibrations and acoustic emission signals from termite activity. Measurement 2015, 68, 58–69. [Google Scholar] [CrossRef]
- Barszcz, T.; Randall, R.B. Application of spectral kurtosis for detection of a tooth crack in the planetary gear of a wind turbine. Mech. Syst. Signal Process. 2009, 23, 1352–1365. [Google Scholar] [CrossRef]
- Chen, B.; Zhang, Z.; Zi, Y.; He, Z.; Sun, C. Detecting of transient vibration signatures using an improved fast spatial-spectral ensemble kurtosis kurtogram and its applications to mechanical signature analysis of short duration data from rotating machinery. Mech. Syst. Signal Process. 2013, 40, 1–37. [Google Scholar] [CrossRef]
- Wang, Y.; Xiang, J.; Markert, R.; Liang, M. Spectral kurtosis for fault detection, diagnosis and prognostics of rotating machines: A review with applications. Mech. Syst. Signal Process. 2016, 66, 679–698. [Google Scholar] [CrossRef]
- Antoni, J. Fast computation of the kurtogram for the detection of transient faults. Mech. Syst. Signal Process. 2007, 21, 108–124. [Google Scholar] [CrossRef]
- Wang, Y.; Xu, G.; Liang, L.; Jiang, K. Detection of weak transient signals based on wavelet packet transform and manifold learning for rolling element bearing fault diagnosis. Mech. Syst. Signal Process. 2015, 54, 259–276. [Google Scholar] [CrossRef]
- Rother, A.; Jelali, M.; Söffker, D. A brief review and a first application of time-frequency-based analysis methods for monitoring of strip rolling mills. J. Process Control 2015, 35, 65–79. [Google Scholar] [CrossRef]
- Lei, Y.; Lin, J.; He, Z.; Zi, Y. Application of an improved kurtogram method for fault diagnosis of rolling element bearings. Mech. Syst. Signal Process. 2011, 25, 1738–1749. [Google Scholar] [CrossRef]
- Wang, D.; Tse, P.W.; Tsui, K.L. An enhanced Kurtogram method for fault diagnosis of rolling element bearings. Mech. Syst. Signal Process. 2013, 35, 176–199. [Google Scholar] [CrossRef]
- McDonald, G.L.; Zhao, Q.; Zuo, M.J. Maximum correlated Kurtosis deconvolution and application on gear tooth chip fault detection. Mech. Syst. Signal Process. 2012, 33, 237–255. [Google Scholar] [CrossRef]
- Zhou, R.; Bao, W.; Li, N.; Huang, X.; Yu, D. Mechanical equipment fault diagnosis based on redundant second generation wavelet packet transform. Digit. Signal Process 2010, 20, 276–288. [Google Scholar] [CrossRef]
- Dwyer, R. Detection of non-Gaussian signals by frequency domain Kurtosis estimation. In Proceedings of the IEEE International Conference on Acoustics, Speech, and Signal Processing (ICASSP), Boston, MA, USA, 14–16 April 1983; pp. 607–610.
- Zhang, X.; Kang, J.; Hao, L.; Cai, L.; Zhao, J. Bearing fault diagnosis and degradation analysis based on improved empirical mode decomposition and maximum correlated kurtosis deconvolution. J. Vibroeng. 2015, 17, 243–260. [Google Scholar]
- Li, N.; Zhou, R.; Hu, Q.; Liu, X. Mechanical fault diagnosis based on redundant second generation wavelet packet transform, neighborhood rough set and support vector machine. Mech. Syst. Signal Process. 2012, 28, 608–621. [Google Scholar] [CrossRef]
- Randall, R.B.; Antoni, J.; Chobsaard, S. The Relationship between spectral correlation and envelope analysis in the diagnostics of bearing faults and other cyclostationary machine signals. Mech. Syst. Signal Process. 2001, 15, 945–962. [Google Scholar] [CrossRef]
- Antoni, J.; Bonnardot, F.; Raad, A.; El Badaoui, M. Cyclostationary modelling of rotating machine vibration signals. Mech. Syst. Signal Process. 2004, 18, 1285–1314. [Google Scholar] [CrossRef]
- Case Western Reserve University Bearing Data Center Website. Available online: http://csegroups.case.edu/bearingdatacenter/ (accessed on 9 April 2016).


| Position on Rig | Bearing Model | Fault Frequencies (Multiple of Running Speed in Hz) | |||
|---|---|---|---|---|---|
| Inner Ring | Outer Ring | Cage Train | Rolling Element | ||
| Drive end | SKF 6205-2 RS JEM | 5.415 | 3.585 | 0.398 | 4.714 |
| Fan end | SKF 6203-2 RS JEM | 4.947 | 3.053 | 0.382 | 3.987 |
| Parameter | Value |
|---|---|
| Rolling model | 6307N |
| Pitch ring diameter (mm) | 57.5 |
| Roller diameter (mm) | 14.22 |
| Roller number | 7 |
| Contact angel (deg) | 0 |
| Rotating speed (rpm) | 471 |
| BPFO (Hz) | 20.7 |
© 2016 by the authors; licensee MDPI, Basel, Switzerland. This article is an open access article distributed under the terms and conditions of the Creative Commons Attribution (CC-BY) license (http://creativecommons.org/licenses/by/4.0/).
Share and Cite
Chen, X.; Feng, F.; Zhang, B. Weak Fault Feature Extraction of Rolling Bearings Based on an Improved Kurtogram. Sensors 2016, 16, 1482. https://doi.org/10.3390/s16091482
Chen X, Feng F, Zhang B. Weak Fault Feature Extraction of Rolling Bearings Based on an Improved Kurtogram. Sensors. 2016; 16(9):1482. https://doi.org/10.3390/s16091482
Chicago/Turabian StyleChen, Xianglong, Fuzhou Feng, and Bingzhi Zhang. 2016. "Weak Fault Feature Extraction of Rolling Bearings Based on an Improved Kurtogram" Sensors 16, no. 9: 1482. https://doi.org/10.3390/s16091482