
Time-Varying Vocal Folds Vibration Detection Using a 24 GHz Portable Auditory Radar


 ,
,
Abstract
:1. Introduction
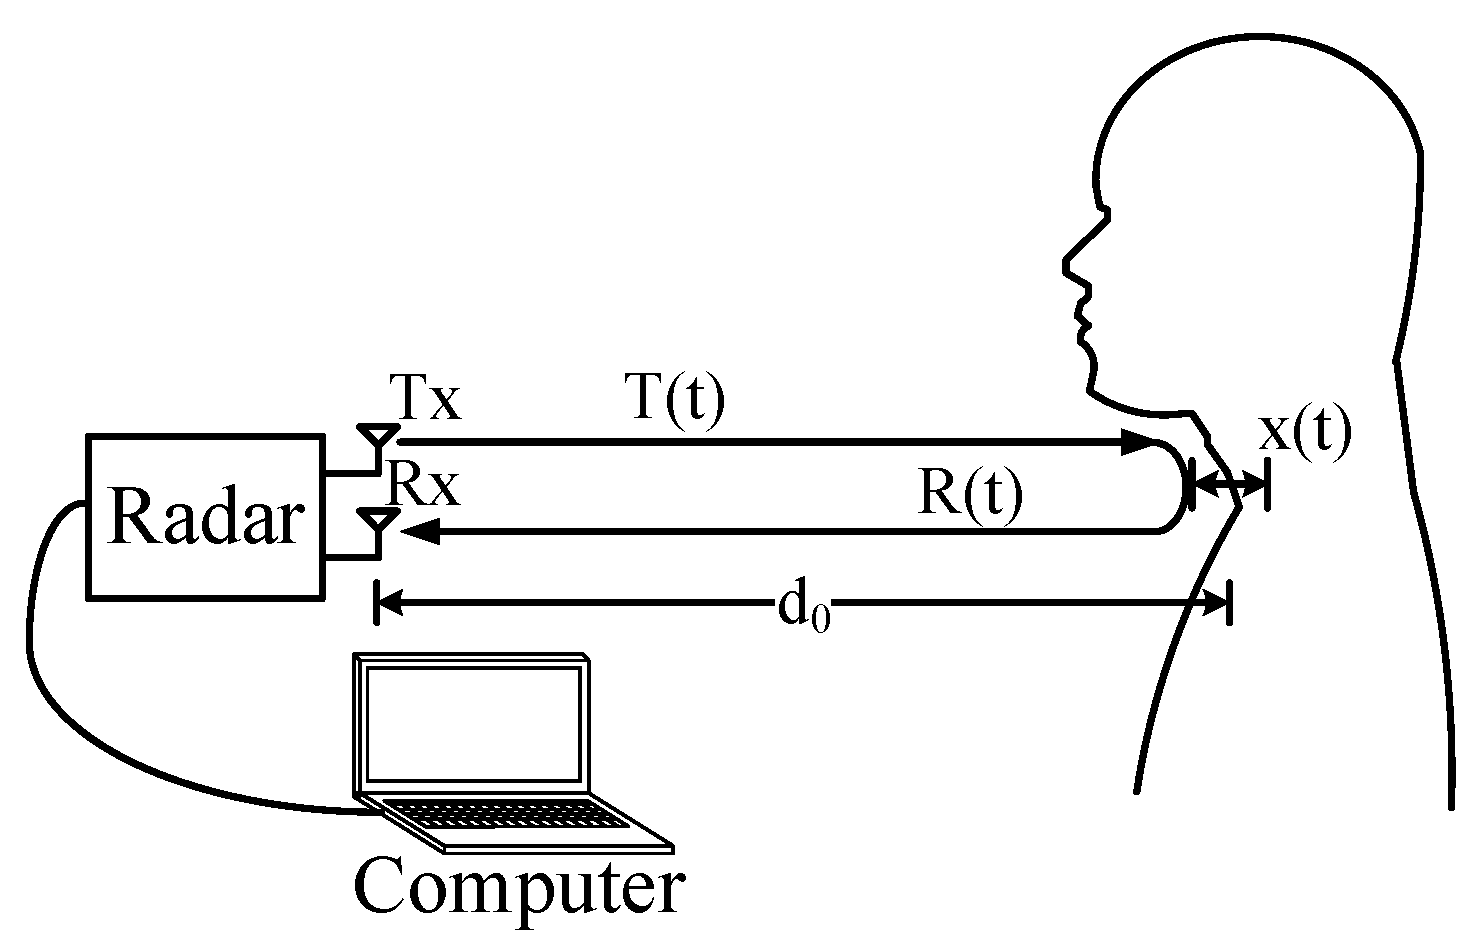
2. Auditory Radar Theory
2.1. Basic Detection Theory
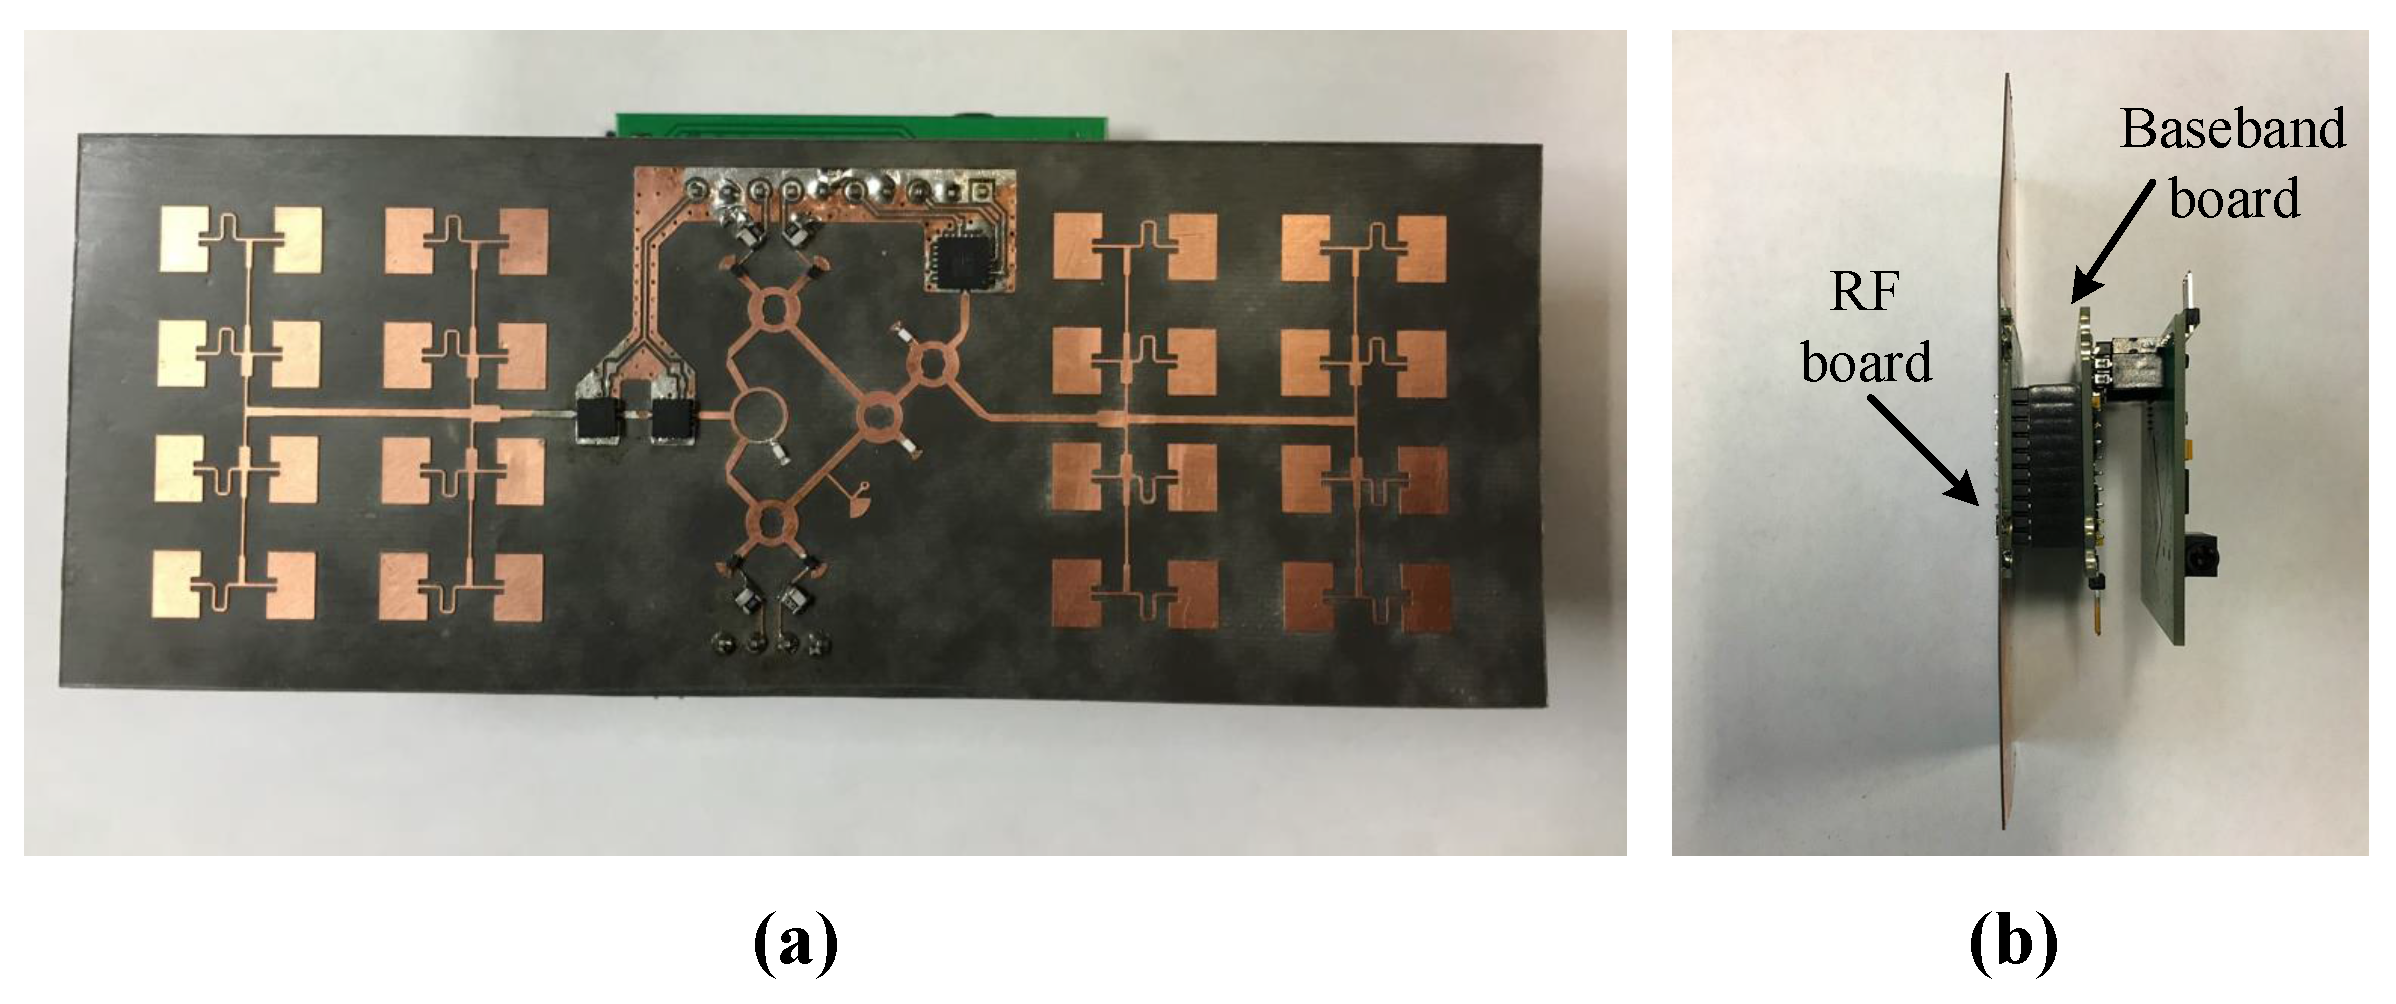
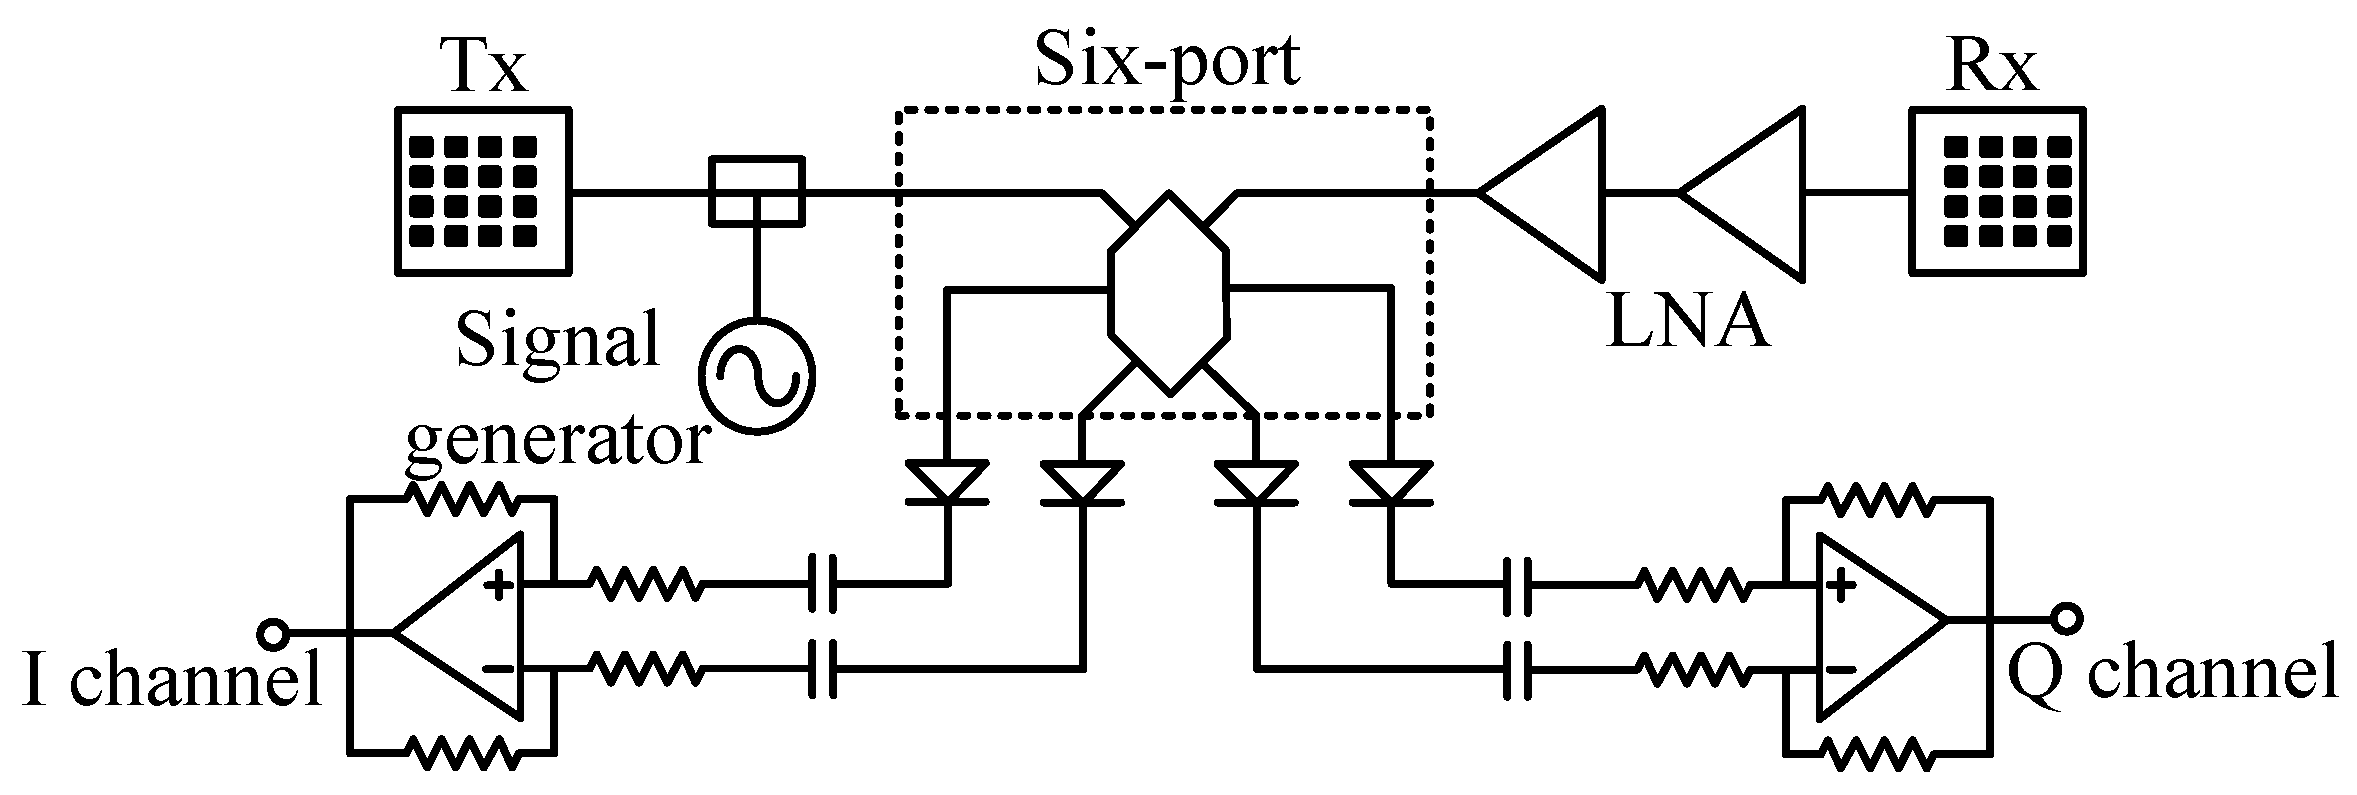
2.2. The 24 GHz Portable Auditory Radar
3. Algorithm and Its Implementation
3.1. VMD
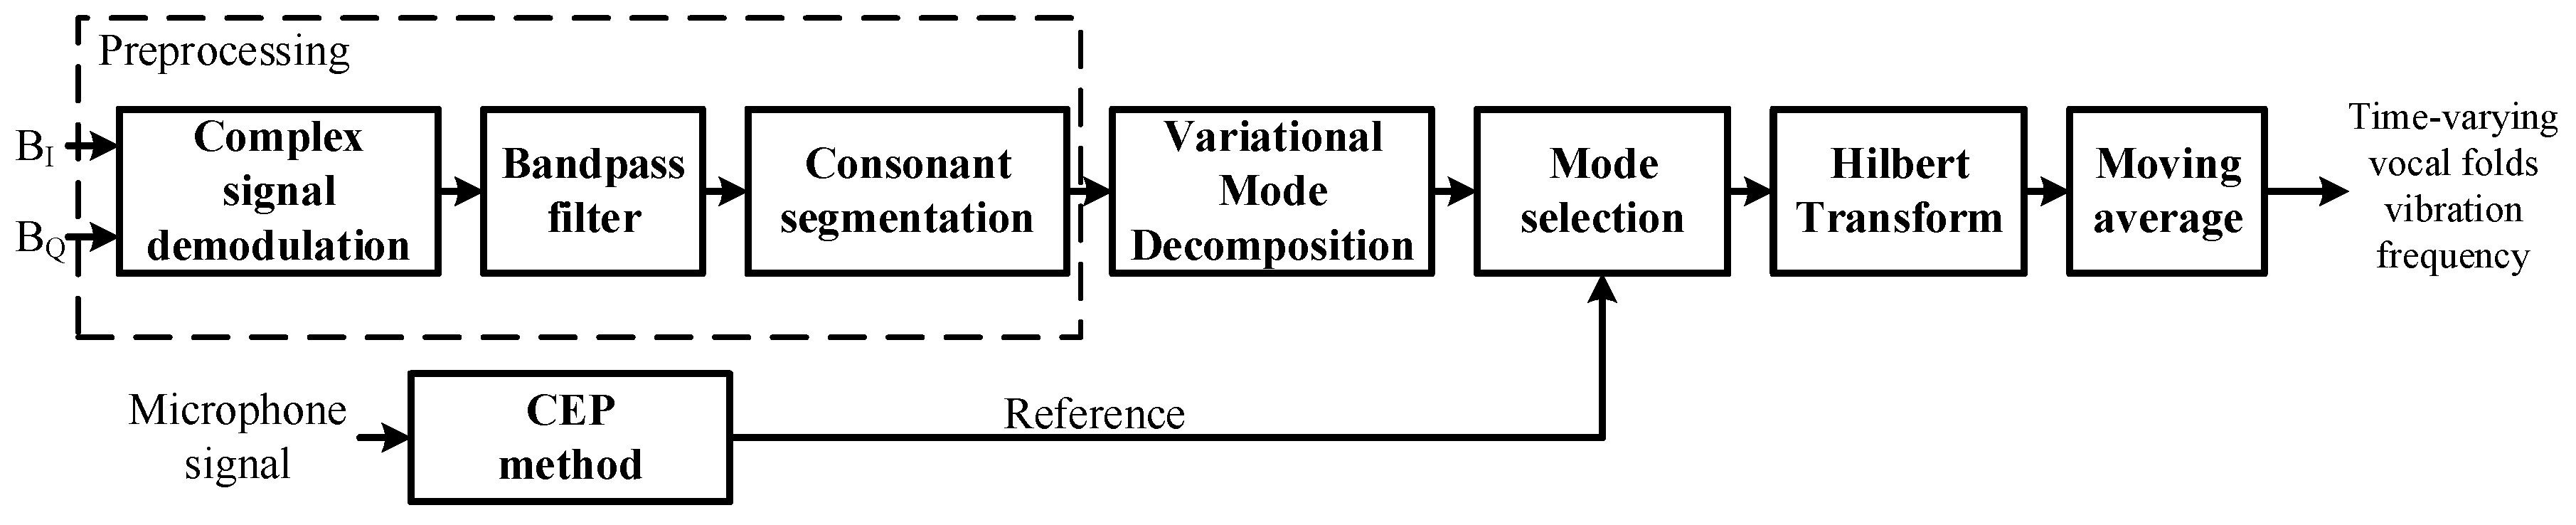
3.2. Implementation
3.2.1. Preprocessing
3.2.2. Decomposition and Mode Selection
3.2.3. Calculation of Time-Varying Vocal Folds Vibration Frequency
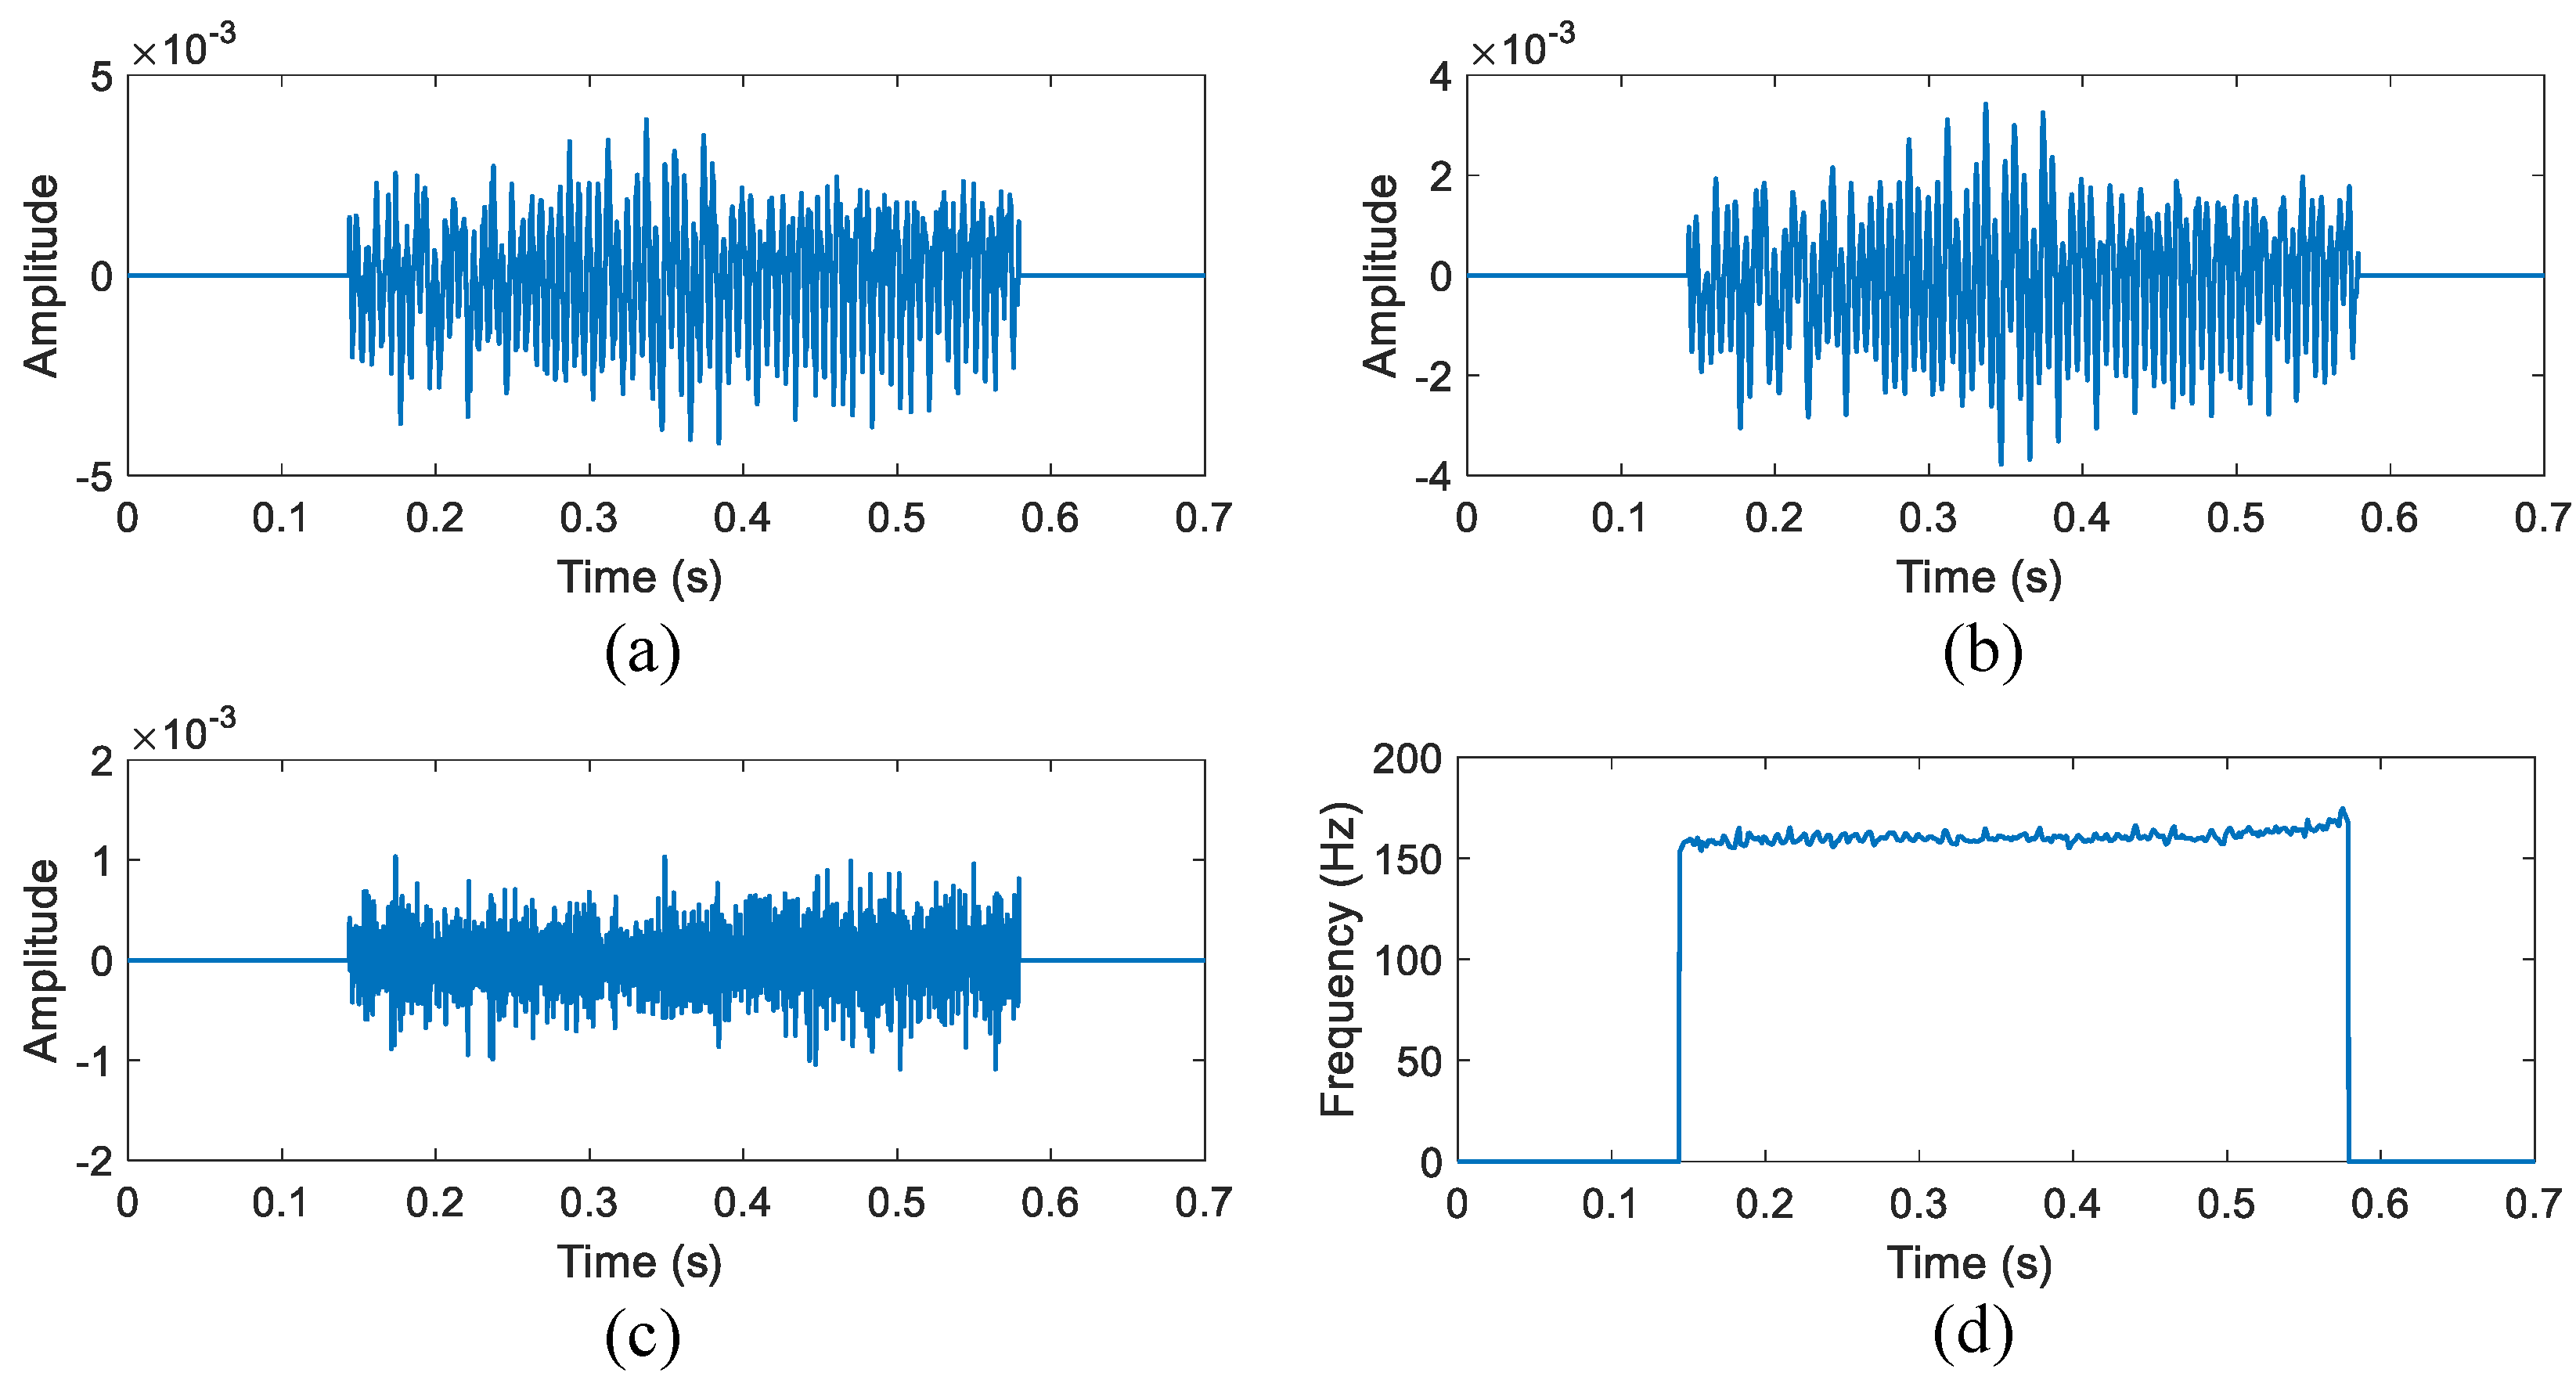
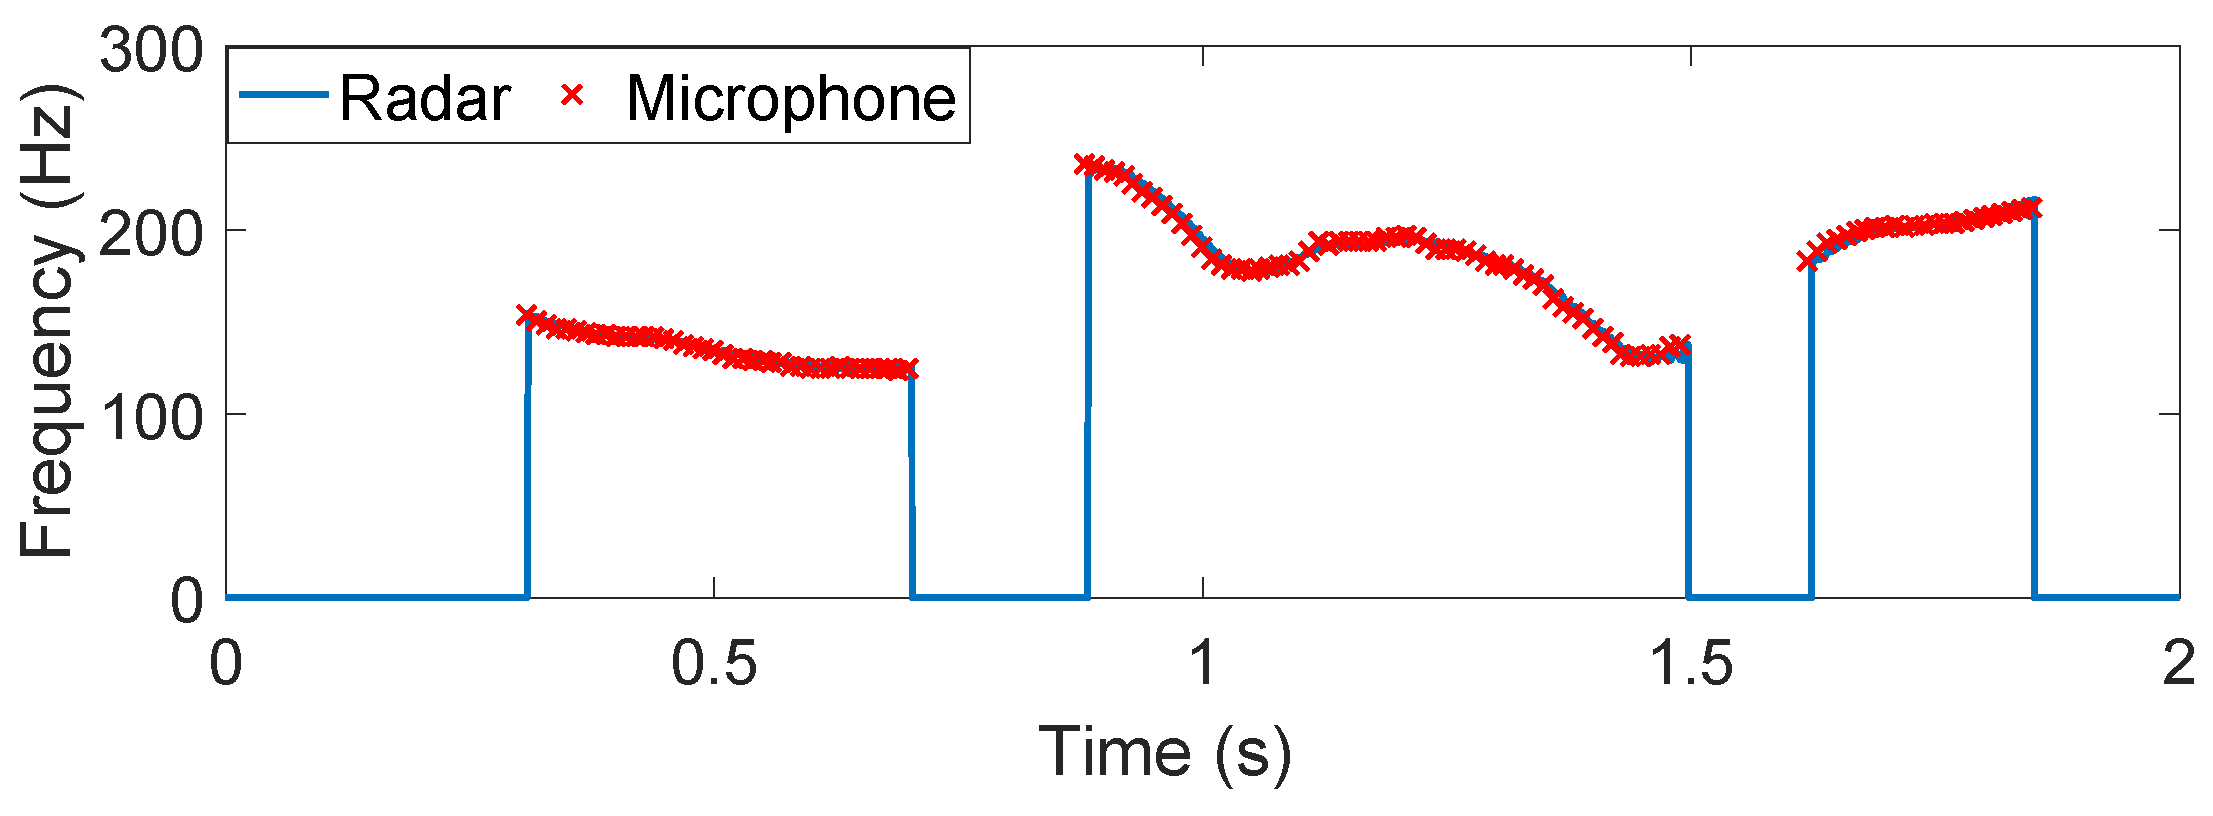
3.3. Illustration
4. Experiments
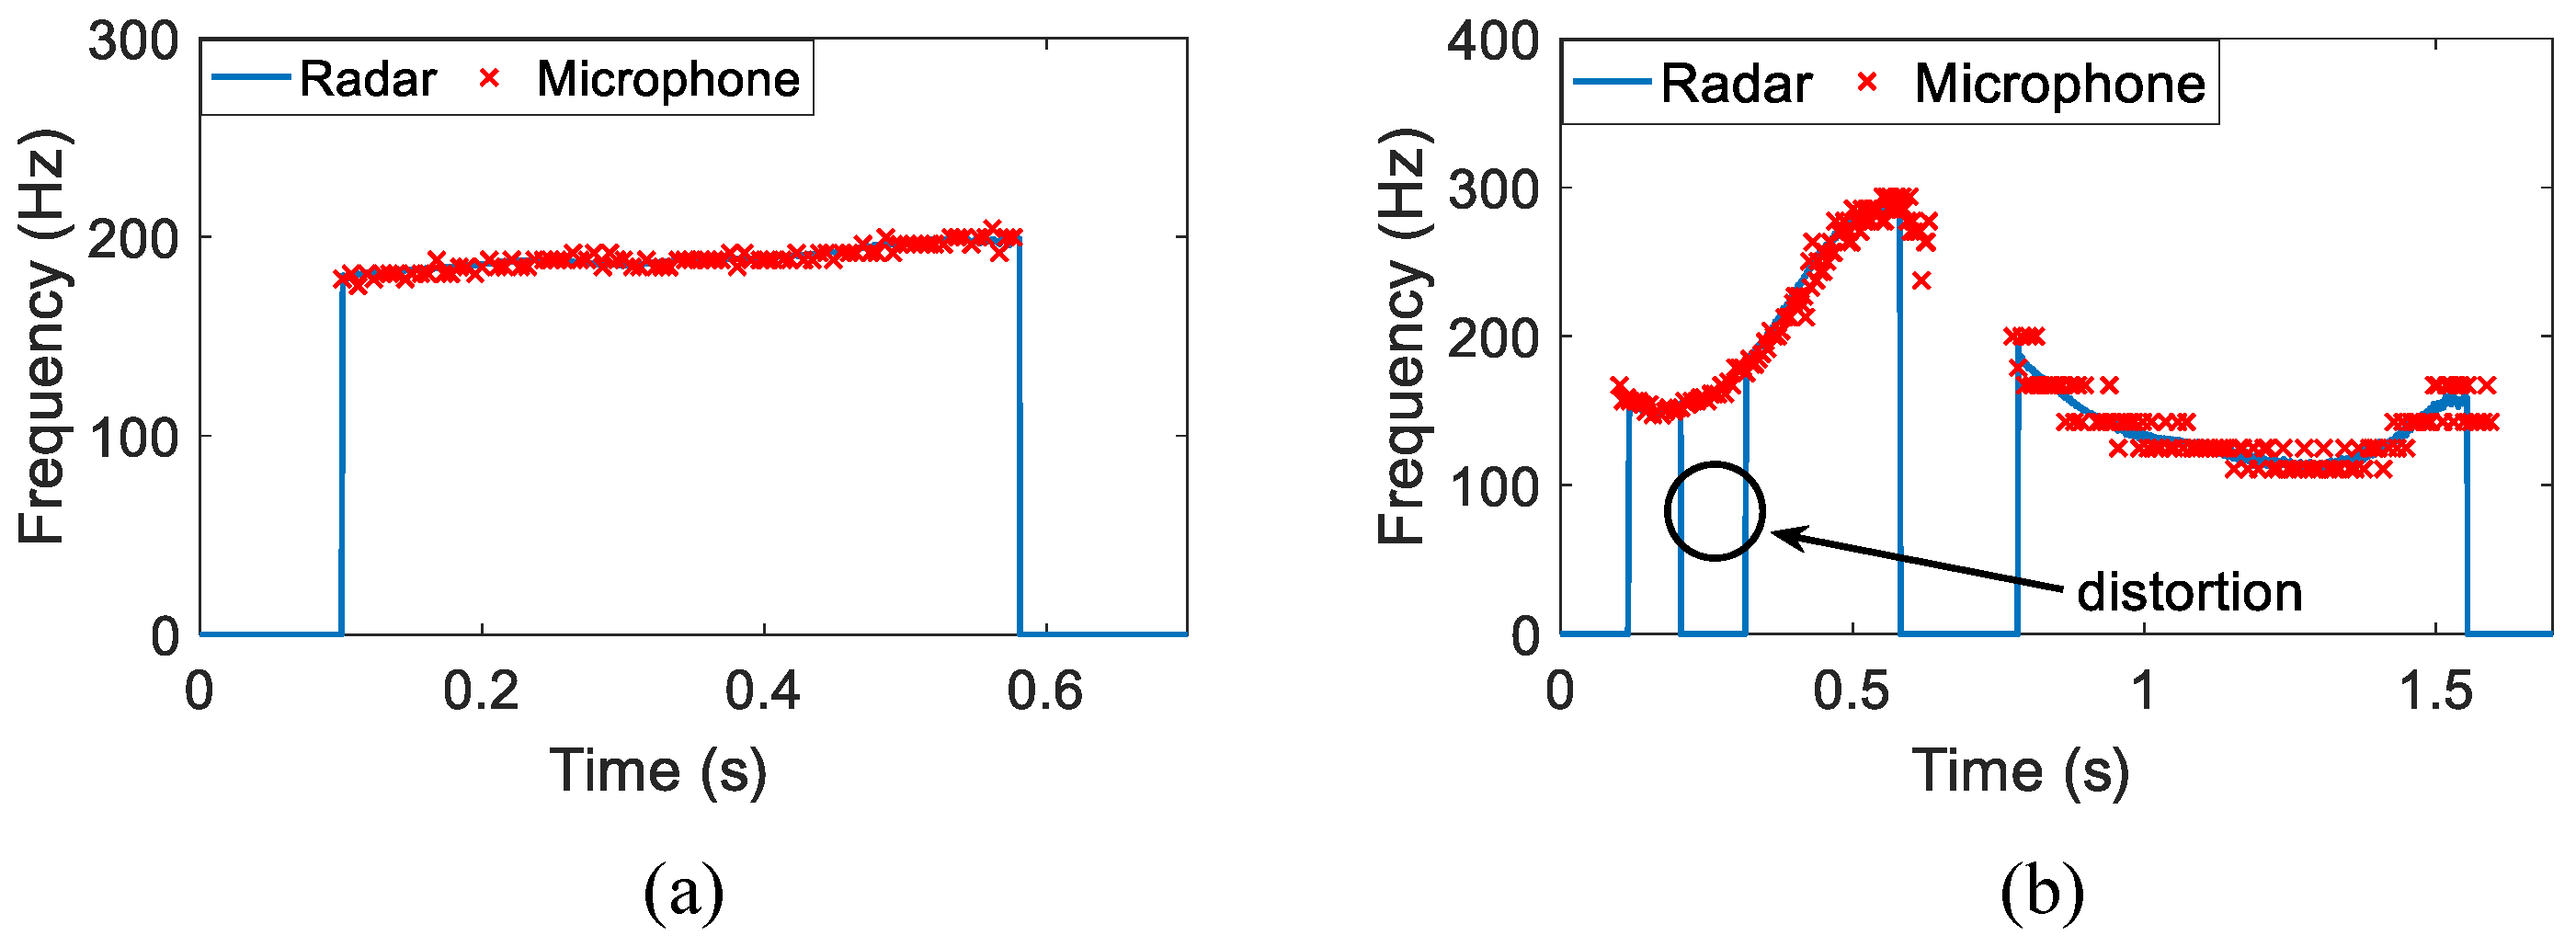
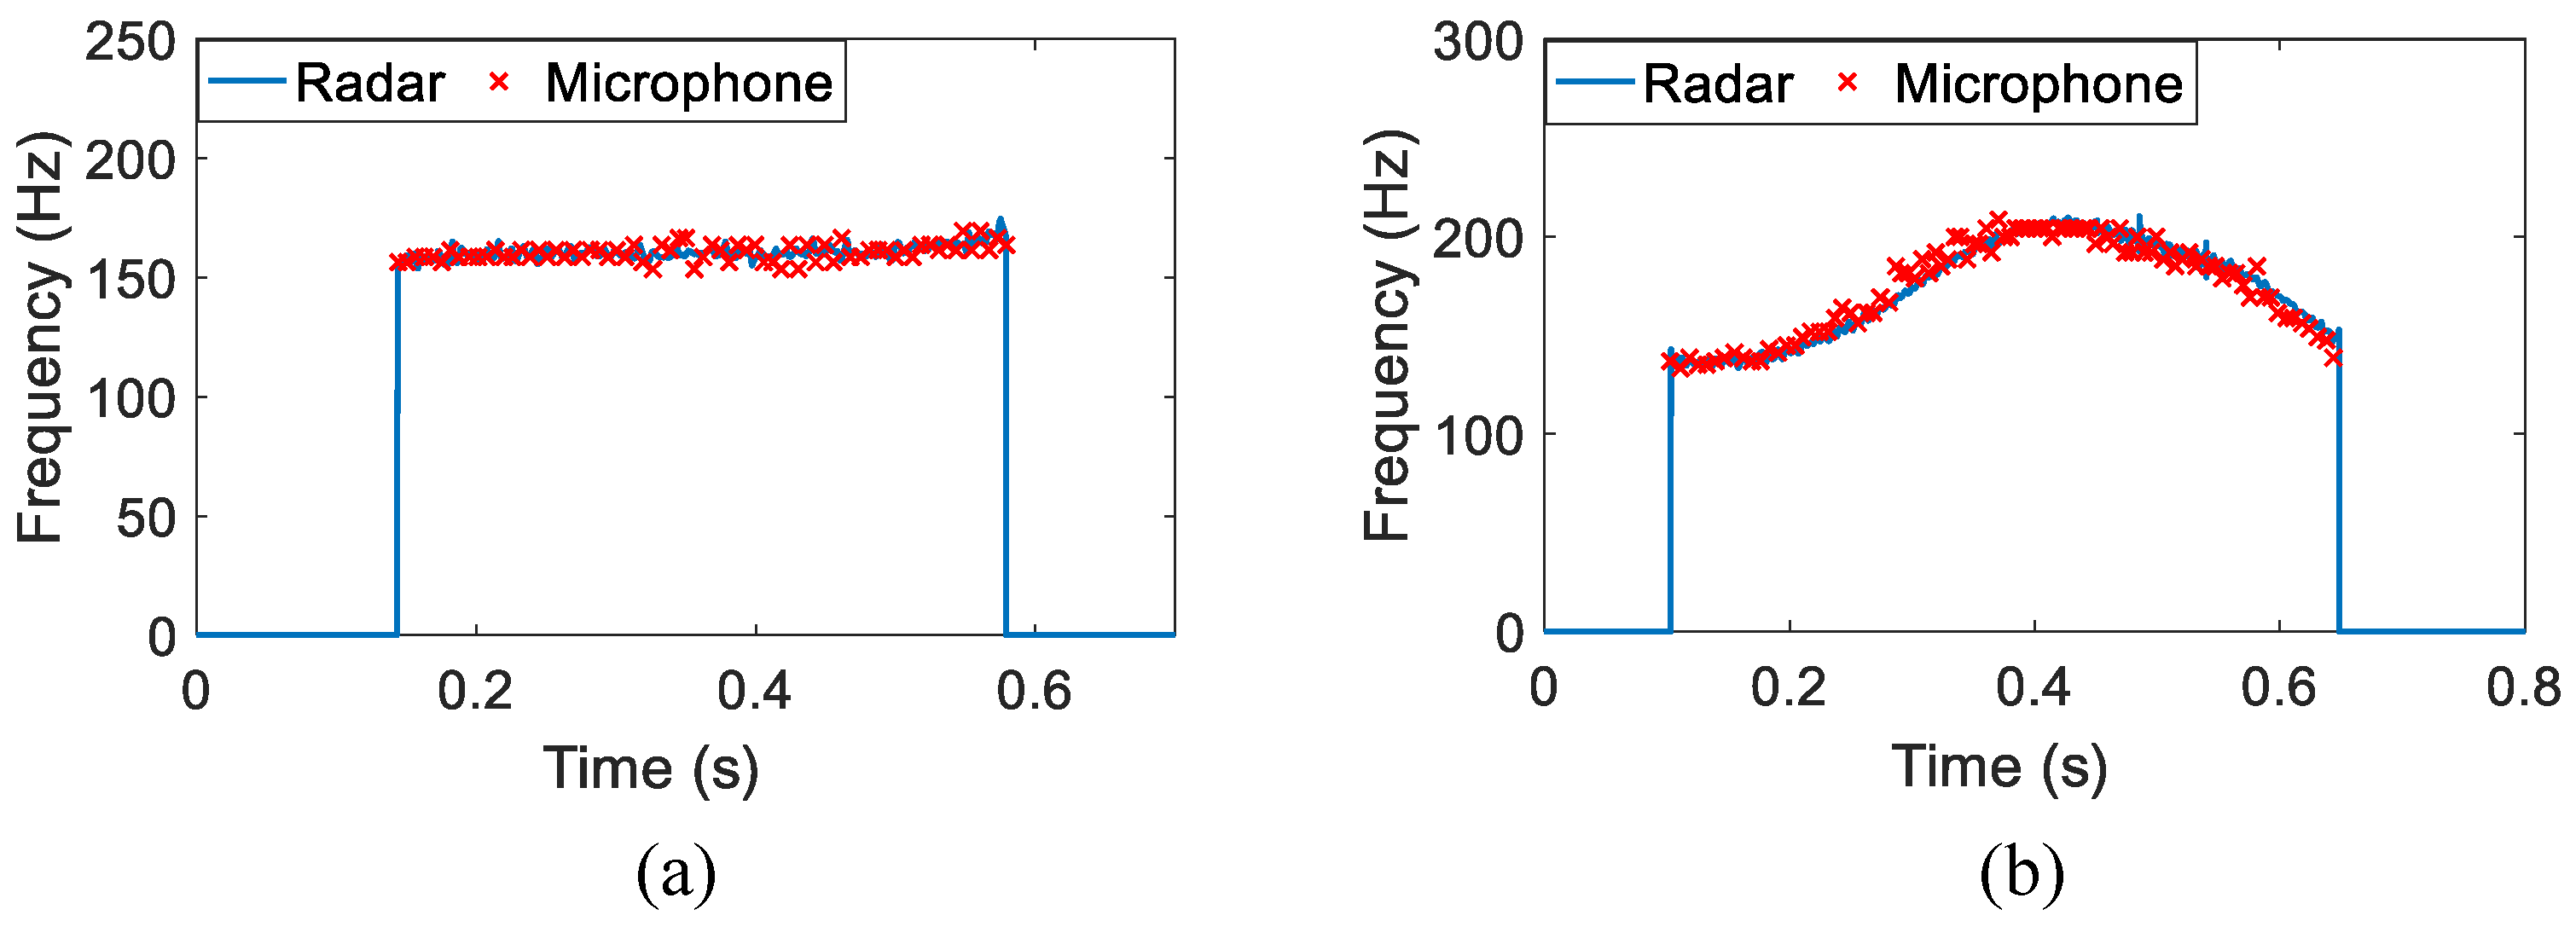
4.1. Non-Tonal Language
4.2. Tonal Language
5. Conclusions
Acknowledgments
Author Contributions
Conflicts of Interest
References
- Quatieri, T.F. Discrete-Time Speech Signal Processing Principles and Practice; Prentice Hall: Upper Saddle River, NJ, USA, 2001. [Google Scholar]
- Varela, O.; San-Segundo, R.; Hernandez, L.A. Robust speech detection for noisy environments. IEEE Aerosp. Electron. Syst. Mag. 2011, 26, 16–23. [Google Scholar] [CrossRef] [Green Version]
- Jain, P.; Pachori, R.B. Event-Based Method for Instantaneous Fundamental Frequency Estimation from Voiced Speech Based on Eigenvalue Decomposition of the Hankel Matrix. IEEE/ACM Trans. Audio Speech Lang. Process. 2014, 22, 1467–1482. [Google Scholar] [CrossRef]
- Barnes, T.; Burnett, G.; Gable, T.; Holzrichter, J.F.; Ng, L. Direct and indirect measures of speech articulator motions using low power EM sensors. In Proceedings of the XlVth International Congress of Phonetic Sciences, San Francisco, CA, USA, 1–7 Augest 1999.
- Brady, K.; Quatieri, T.F.; Campbell, J.P.; Campbell, W.M.; Brandstein, M.; Weinstein, C.J. Multisensor MELPe using parameter substitution. In Proceedings of the IEEE International Conference on Acoustics, Speech, and Signal Processing, 2004 (ICASSP ’04), Motreal, QC, Canada, 17–21 May 2004; Volume 1, pp. 77–80.
- Holzrichter, J.F.; Ng, L.C.; Burke, G.J.; Champagne, N.J.; Kallman, J.S.; Sharpe, R.M.; Kobler, J.B.; Hillman, R.E.; Rosowski, J.J. Measurements of glottal structure dynamics. J. Acoust. Soc. Am. 2005, 117, 1373–1385. [Google Scholar] [CrossRef] [PubMed]
- Erzin, E. Improving Throat Microphone Speech Recognition by Joint Analysis of Throat and Acoustic Microphone Recordings. IEEE Trans. Audio Speech Lang. Proc. 2009, 17, 1316–1324. [Google Scholar] [CrossRef]
- Burnett, G.C.; Holzrichter, J.F.; Ng, L.C.; Gable, T.J. The use of glottal electromagnetic micropower sensors (GEMS) in determining a voiced excitation function. J. Acoust. Soc. Am. 1999, 106, 2183–2184. [Google Scholar] [CrossRef]
- Campbell, W.M.; Quatieri, T.F.; Weinstein, C.J. Multimodal speaker authentication using nonacoustic sensors. In Proceedings of the in Workshop Multimodal User Authentication, Santa Barbara, CA, USA, 11–12 December 2003; pp. 215–222.
- Holzrichter, J.F.; Burnett, G.C.; Ng, L.C.; Lea, W.A. Speech articulator measurements using low power EM-wave sensors. J. Acoust. Soc. Am. 1998, 103, 622–625. [Google Scholar] [CrossRef] [PubMed]
- Chen, K.M.; Huang, Y.; Zhang, J.; Norman, A. Microwave life-detection systems for searching human subjects under earthquake rubble or behind barrier. IEEE Trans. Biomed. Eng. 2000, 47, 105–114. [Google Scholar] [CrossRef] [PubMed]
- Li, C.; Cummings, J.; Lam, J.; Graves, E.; Wu, W. Radar remote monitoring of vital signs. IEEE Microw. Mag. 2009, 10, 47–56. [Google Scholar] [CrossRef]
- Mikhelson, I.V.; Lee, P.; Bakhtiari, S.; Elmer, T.W.; Katsaggelos, A.K.; Sahakian, A.V. Noncontact Millimeter-Wave Real-Time Detection and Tracking of Heart Rate on an Ambulatory Subject. IEEE Trans. Inf. Technol. Biomed. 2012, 16, 927–934. [Google Scholar] [CrossRef] [PubMed]
- Kim, H.J.; Kim, K.H.; Hong, Y.S.; Choi, J.J. Measurement of human heartbeat and respiration signals using phase detection radar. Rev. Sci. Instrum. 2007, 78, 104703–104703-3. [Google Scholar] [CrossRef] [PubMed]
- Zhao, H.; Hong, H.; Sun, L.; Xi, F.; Li, C.; Zhu, X. Accurate DC offset calibration of Doppler radar via non-convex optimisation. Electron. Lett. 2015, 51, 1282–1284. [Google Scholar] [CrossRef]
- Sun, L.; Hong, H.; Li, Y.; Gu, C.; Xi, F.; Li, C.; Zhu, X. Noncontact Vital Sign Detection based on Stepwise Atomic Norm Minimization. IEEE Signal Process. Lett. 2015, 22, 2479–2483. [Google Scholar] [CrossRef]
- Sun, L.; Li, Y.; Hong, H.; Xi, F.; Cai, W.; Zhu, X. Super-resolution spectral estimation in short-time non-contact vital sign measurement. Rev. Sci. Instrum. 2015, 86, 105–133. [Google Scholar] [CrossRef] [PubMed]
- Jiao, M.; Lu, G.; Jing, X.; Li, S.; Li, Y.; Wang, J. A novel radar sensor for the non-contact detection of speech signals. Sensors 2010, 10, 4622–4633. [Google Scholar] [CrossRef] [PubMed]
- Tian, Y.; Li, S.; Lv, H.; Wang, J.; Jing, X. Smart radar sensor for speech detection and enhancement. Sens. Actuators A Phys. 2013, 191, 99–104. [Google Scholar] [CrossRef]
- Li, S.; Tian, Y.; Lu, G.; Zhang, Y.; Lv, H.; Yu, X.; Xue, H.; Zhang, H.; Wang, J.; Jing, X. A 94-GHz Millimeter-Wave Sensor for Speech Signal Acquisition. Sensors 2013, 13, 14248. [Google Scholar] [CrossRef] [PubMed]
- Chen, F.; Li, S.; Li, C.; Liu, M.; Li, Z.; Xue, H.; Jing, X.; Wang, J. A Novel Method for Speech Acquisition and Enhancement by 94 GHz Millimeter-Wave Sensor. Sensors 2015, 15. [Google Scholar] [CrossRef] [PubMed]
- Lin, C.S.; Chang, S.F.; Chang, C.C.; Lin, C.C. Microwave Human Vocal Vibration Signal Detection Based on Doppler Radar Technology. IEEE Trans. Microw. Theory Tech. 2010, 58, 2299–2306. [Google Scholar] [CrossRef]
- Zhao, H.; Peng, Z.; Hong, H.; Zhu, X.; Li, C. A Portable 24-GHz Auditory Radar for Non-Contact Speech Sensing with Background Noise Rejection and Directional Discrimination. In Proceedings of the 2016 IEEE MTT-S International Microwave Symposium, San Francisco, CA, USA, 22–27 May 2016.
- Dragomiretskiy, K.; Zosso, D. Variational Mode Decomposition. IEEE Trans. Signal Proc. 2014, 62, 531–544. [Google Scholar] [CrossRef]
- Wang, Y.; Markert, R.; Xiang, J.; Zheng, W. Research on variational mode decomposition and its application in detecting rub-impact fault of the rotor system. Mech. Syst. Signal Process. 2015, 60, 243–251. [Google Scholar] [CrossRef]
- Droitcour, A.D.; Boric-Lubecke, O.; Lubecke, V.M.; Lin, J.; Kovacs, G.T.A. Range correlation and I/Q performance benefits in single-chip silicon Doppler radars for noncontact cardiopulmonary monitoring. IEEE Trans. Microw. Theory Tech. 2004, 52, 838–848. [Google Scholar] [CrossRef]
- Li, C.; Lubecke, V.M.; Boric-Lubecke, O.; Lin, J. A Review on Recent Advances in Doppler Radar Sensors for Noncontact Healthcare Monitoring. IEEE Trans. Microw. Theory Tech. 2013, 61, 2046–2060. [Google Scholar] [CrossRef]
- Gu, C.; Inoue, T.; Li, C. Analysis and Experiment on the Modulation Sensitivity of Doppler Radar Vibration Measurement. IEEE Microw. Wirel. Compon. Lett. 2013, 23, 566–568. [Google Scholar] [CrossRef]
- Hong, H.; Zhao, Z.; Wang, X.; Tao, Z. Detection of Dynamic Structures of Speech Fundamental Frequency in Tonal Languages. IEEE Signal Proc. Lett. 2010, 17, 843–846. [Google Scholar] [CrossRef]
- Childers, D.G.; Skinner, D.P.; Kemerait, R.C. The cepstrum: A guide to processing. IEEE Proc. 1977, 65, 1428–1443. [Google Scholar] [CrossRef]
- Noll, A.M. Cepstrum Pitch Determination. J. Acoust. Soc. Am. 1967, 41, 293. [Google Scholar] [CrossRef] [PubMed]
- Huang, N.E.; Shen, Z.; Long, S.R.; Wu, M.C.; Shih, H.H.; Zheng, Q.; Yen, N.C.; Tung, C.C.; Liu, H.H. The empirical mode decomposition and the Hilbert spectrum for nonlinear and non-stationary time series analysis. Proc. R. Soc. Lond. A 1998, 454, 903–995. [Google Scholar] [CrossRef]


| Character/Word | A | B | C | D | E | F | O | Hello | Boy |
|---|---|---|---|---|---|---|---|---|---|
| Duration/s | 0.44 | 1.07 | 0.41 | 0.66 | 0.41 | 0.08 | 0.29 | 0.55 | 0.81 |
| Relative error | 3.23% | 4.45% | 1.47% | 4.09% | 6.22% | 3.89% | 2.49% | 5.46% | 9.88% |
| Character/Word | /n/ | /xng/ | /w/ | /ho/ | /ho/ | /yu/ | /tan/ | /png gu/ | /zo shng ho/ |
|---|---|---|---|---|---|---|---|---|---|
| Duration/s | 0.43 | 0.448 | 0.188 | 0.415 | 0.21 | 0.17 | 0.48 | 1.44 | 1.66 |
| Relative error | 1.62% | 2.36% | 1.96% | 8.31% | 2.29% | 6.06% | 1.03% | 3.20% | 7.07% |
© 2016 by the authors; licensee MDPI, Basel, Switzerland. This article is an open access article distributed under the terms and conditions of the Creative Commons Attribution (CC-BY) license (http://creativecommons.org/licenses/by/4.0/).
Share and Cite
Hong, H.; Zhao, H.; Peng, Z.; Li, H.; Gu, C.; Li, C.; Zhu, X. Time-Varying Vocal Folds Vibration Detection Using a 24 GHz Portable Auditory Radar. Sensors 2016, 16, 1181. https://doi.org/10.3390/s16081181
Hong H, Zhao H, Peng Z, Li H, Gu C, Li C, Zhu X. Time-Varying Vocal Folds Vibration Detection Using a 24 GHz Portable Auditory Radar. Sensors. 2016; 16(8):1181. https://doi.org/10.3390/s16081181
Chicago/Turabian StyleHong, Hong, Heng Zhao, Zhengyu Peng, Hui Li, Chen Gu, Changzhi Li, and Xiaohua Zhu. 2016. "Time-Varying Vocal Folds Vibration Detection Using a 24 GHz Portable Auditory Radar" Sensors 16, no. 8: 1181. https://doi.org/10.3390/s16081181