
A Bandwidth-Efficient Dissemination Scheme of Non-Safety Information in Urban VANETs †


Abstract
:1. Introduction
- Geo-broadcast: The sender wants to immediately inform all of the vehicles in a larger area about a sudden event. For example, a vehicle that suddenly brakes needs to inform coming vehicles about it. Depending on the message, it may be repeated from time to time and have more relaxed time and delivery requirements, like in the case of work zone warning. The forwarding scheme may be optimized to reduce overhead in cases of high node density.
- Advanced information dissemination: The goal is to provide information among vehicles in a given area during a certain time, bridging network partitions. In this case, a wide coverage and the persistence during the intended period are more important than a low latency. Thus, this type of communication usually applies store-carry-forward mechanisms, in which a relay node awaits the appearance of new nodes in its communication range, also called neighbors, before forwarding the message one or more times.
- Direction of the message and determination of the region of interest (ROI). The authors consider that the definition of the ROI depends on the type of application and the vehicles that may be interested in the information. Furthermore, the direction of the message should correspond to the direction of the targets, so defining it may pose a privacy risk.
- Changes of vehicle direction. A vehicle may change its current direction at any intersection. This is a problem for choosing nodes for store-carry-forwarding: the selected relay may not go towards the desired direction at some point. The conclusion they reach is that typical mechanisms for roadways are not applicable to this type of scenario.
- Multiple points to enter or exit the ROI. As there will be several streets going through the bi-dimensional ROI, vehicles can enter or exit them at different points around the edge. The main implication is that we cannot consider that a dissemination is complete when the message reaches the edge, because it may have covered only a sector of the area of interest.
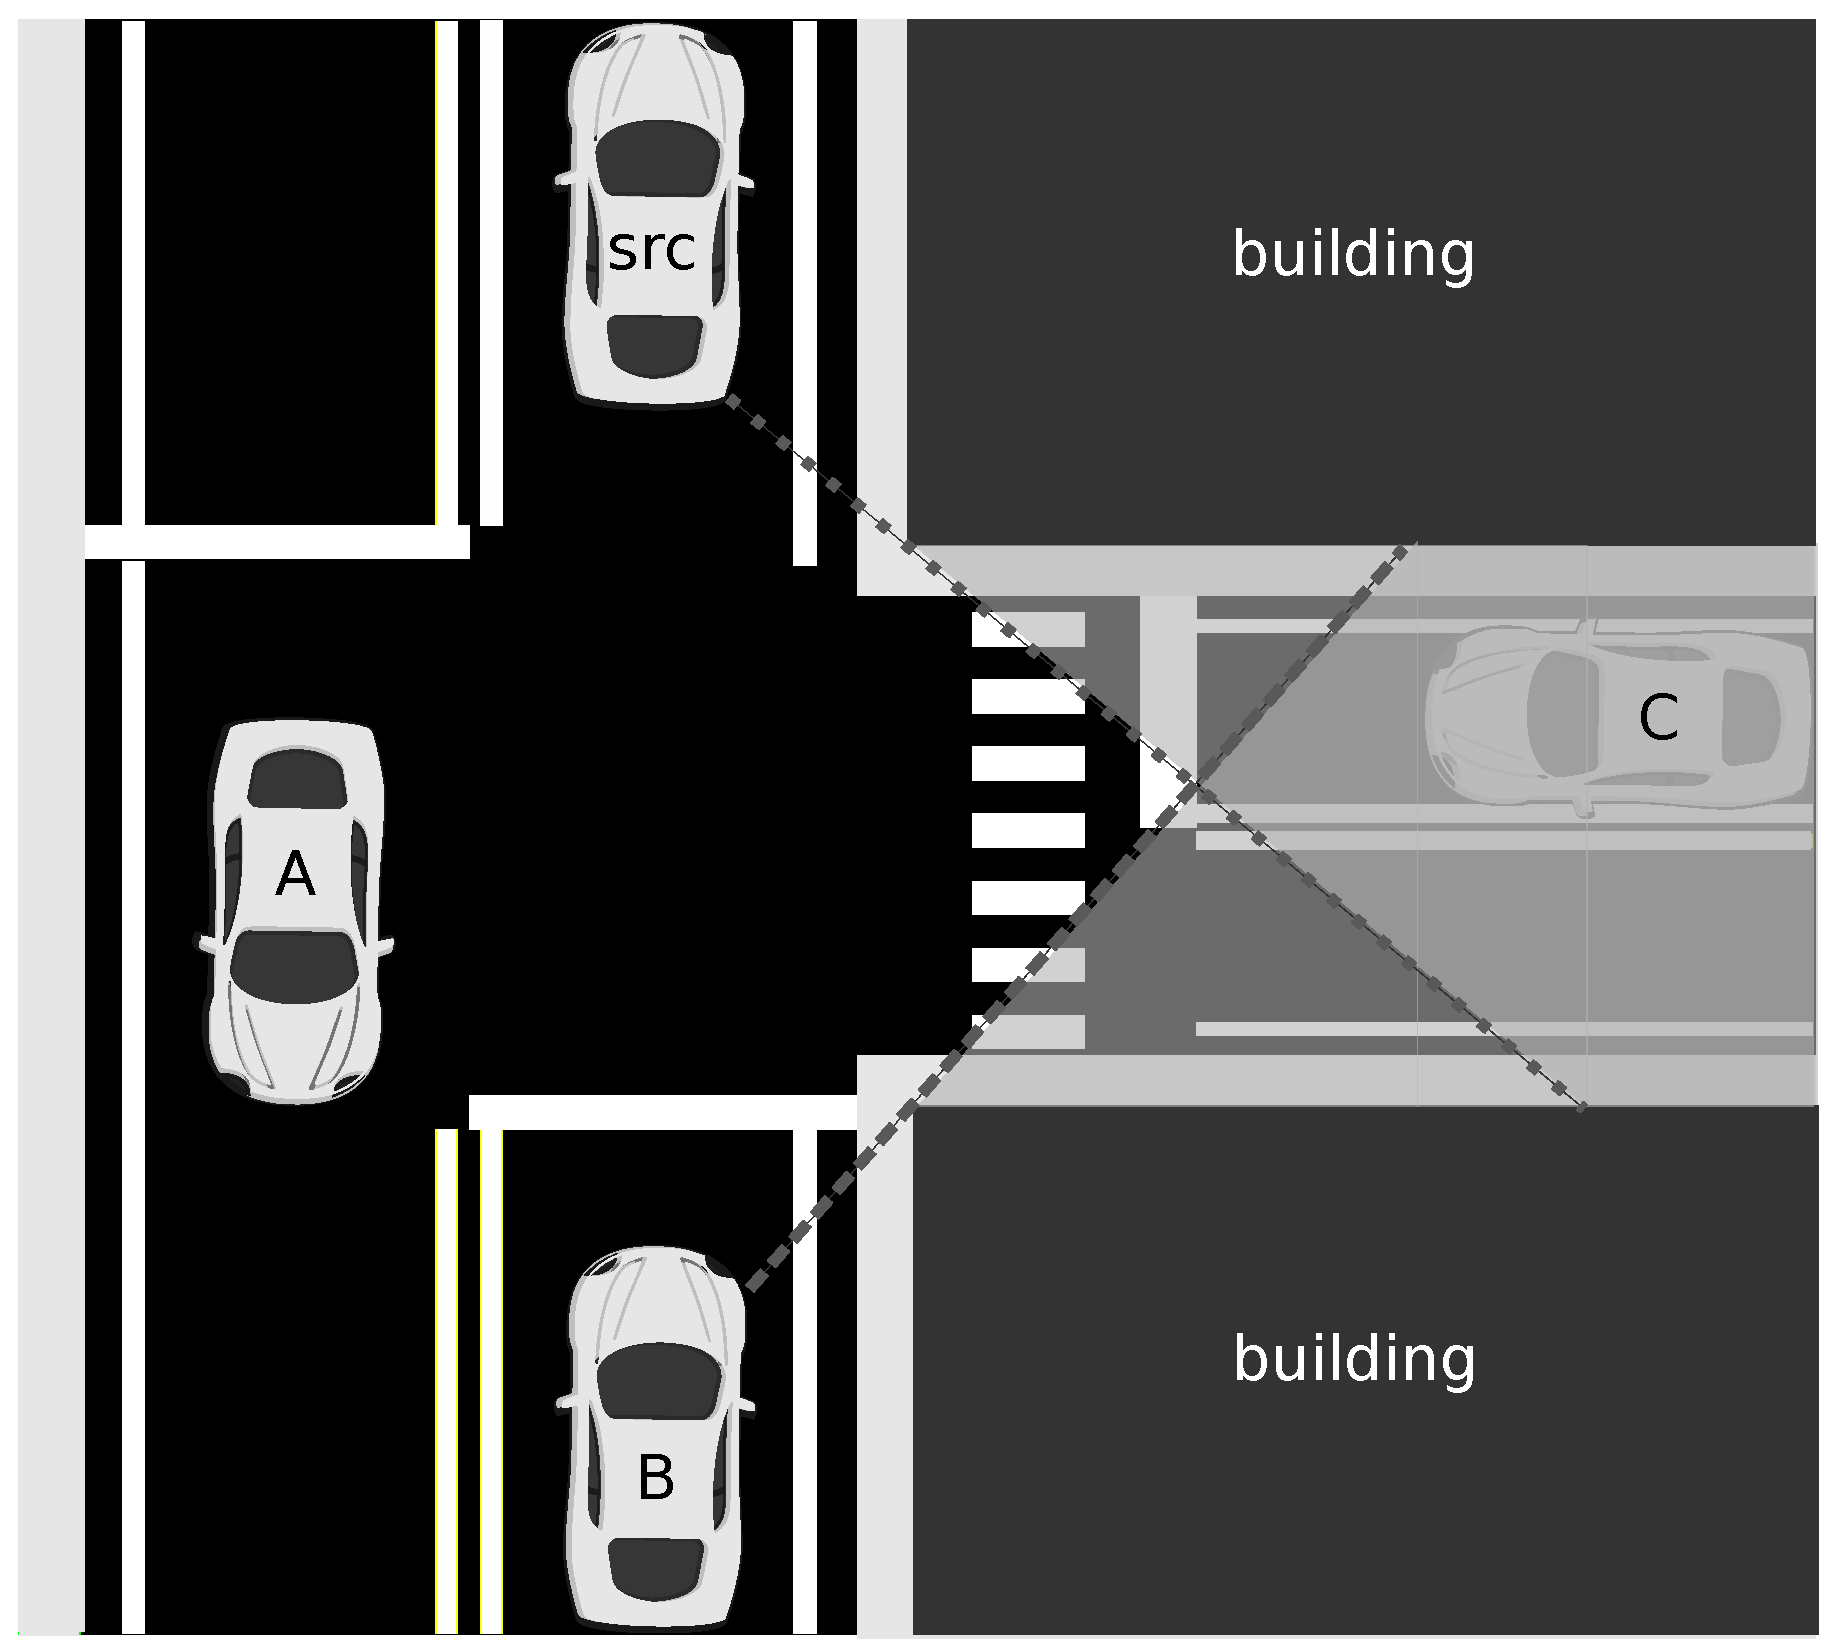
- The coverage of a vehicle depends on its location. The authors point out that vehicles at intersections can connect with vehicles in other streets, while others can only reach vehicles behind or in front of them. They suggest that routing and dissemination protocols should bear in mind this difference in order to take advantage of it.
2. Related Work
2.1. Dissemination Schemes for Urban VANETs
2.2. Our Dissemination Scheme for Roadways
3. Design of a Scheme for Urban Dissemination
- an omni-directional and circular approach in the dissemination, because targets may be moving in any direction around the source and
- an effort to reach neighbors that may be hiding around corners.
3.1. Broadcast Suppression Mechanism
3.1.1. Map-Based Adaptation for Cities
3.1.2. Angle-Based Adaptation for Cities
3.2. Store-Carry-Forward Mechanism
3.2.1. Acknowledging and Taking over as Relay
3.2.2. Waiting before Forwarding Again
- As we do not use beacons in our scheme, we would not rely on receiving them from vehicles that do not appear in each vehicle’s neighbor database.
- The best time to forward again is after the vehicle has moved out of the area that it covered with its first retransmission. In order to suit the speed of not only the relay, which may be slow, but also the nearby vehicles, we opted to use the maximum allowed speed, . Then, the right time to forward again was every , being r our communication range.
Speed-Adaptive
Fixed Interval
Map Polling
4. Parameter Tuning and Evaluation through Simulations
4.1. Metrics
4.2. Simulations Configuration
4.3. Results
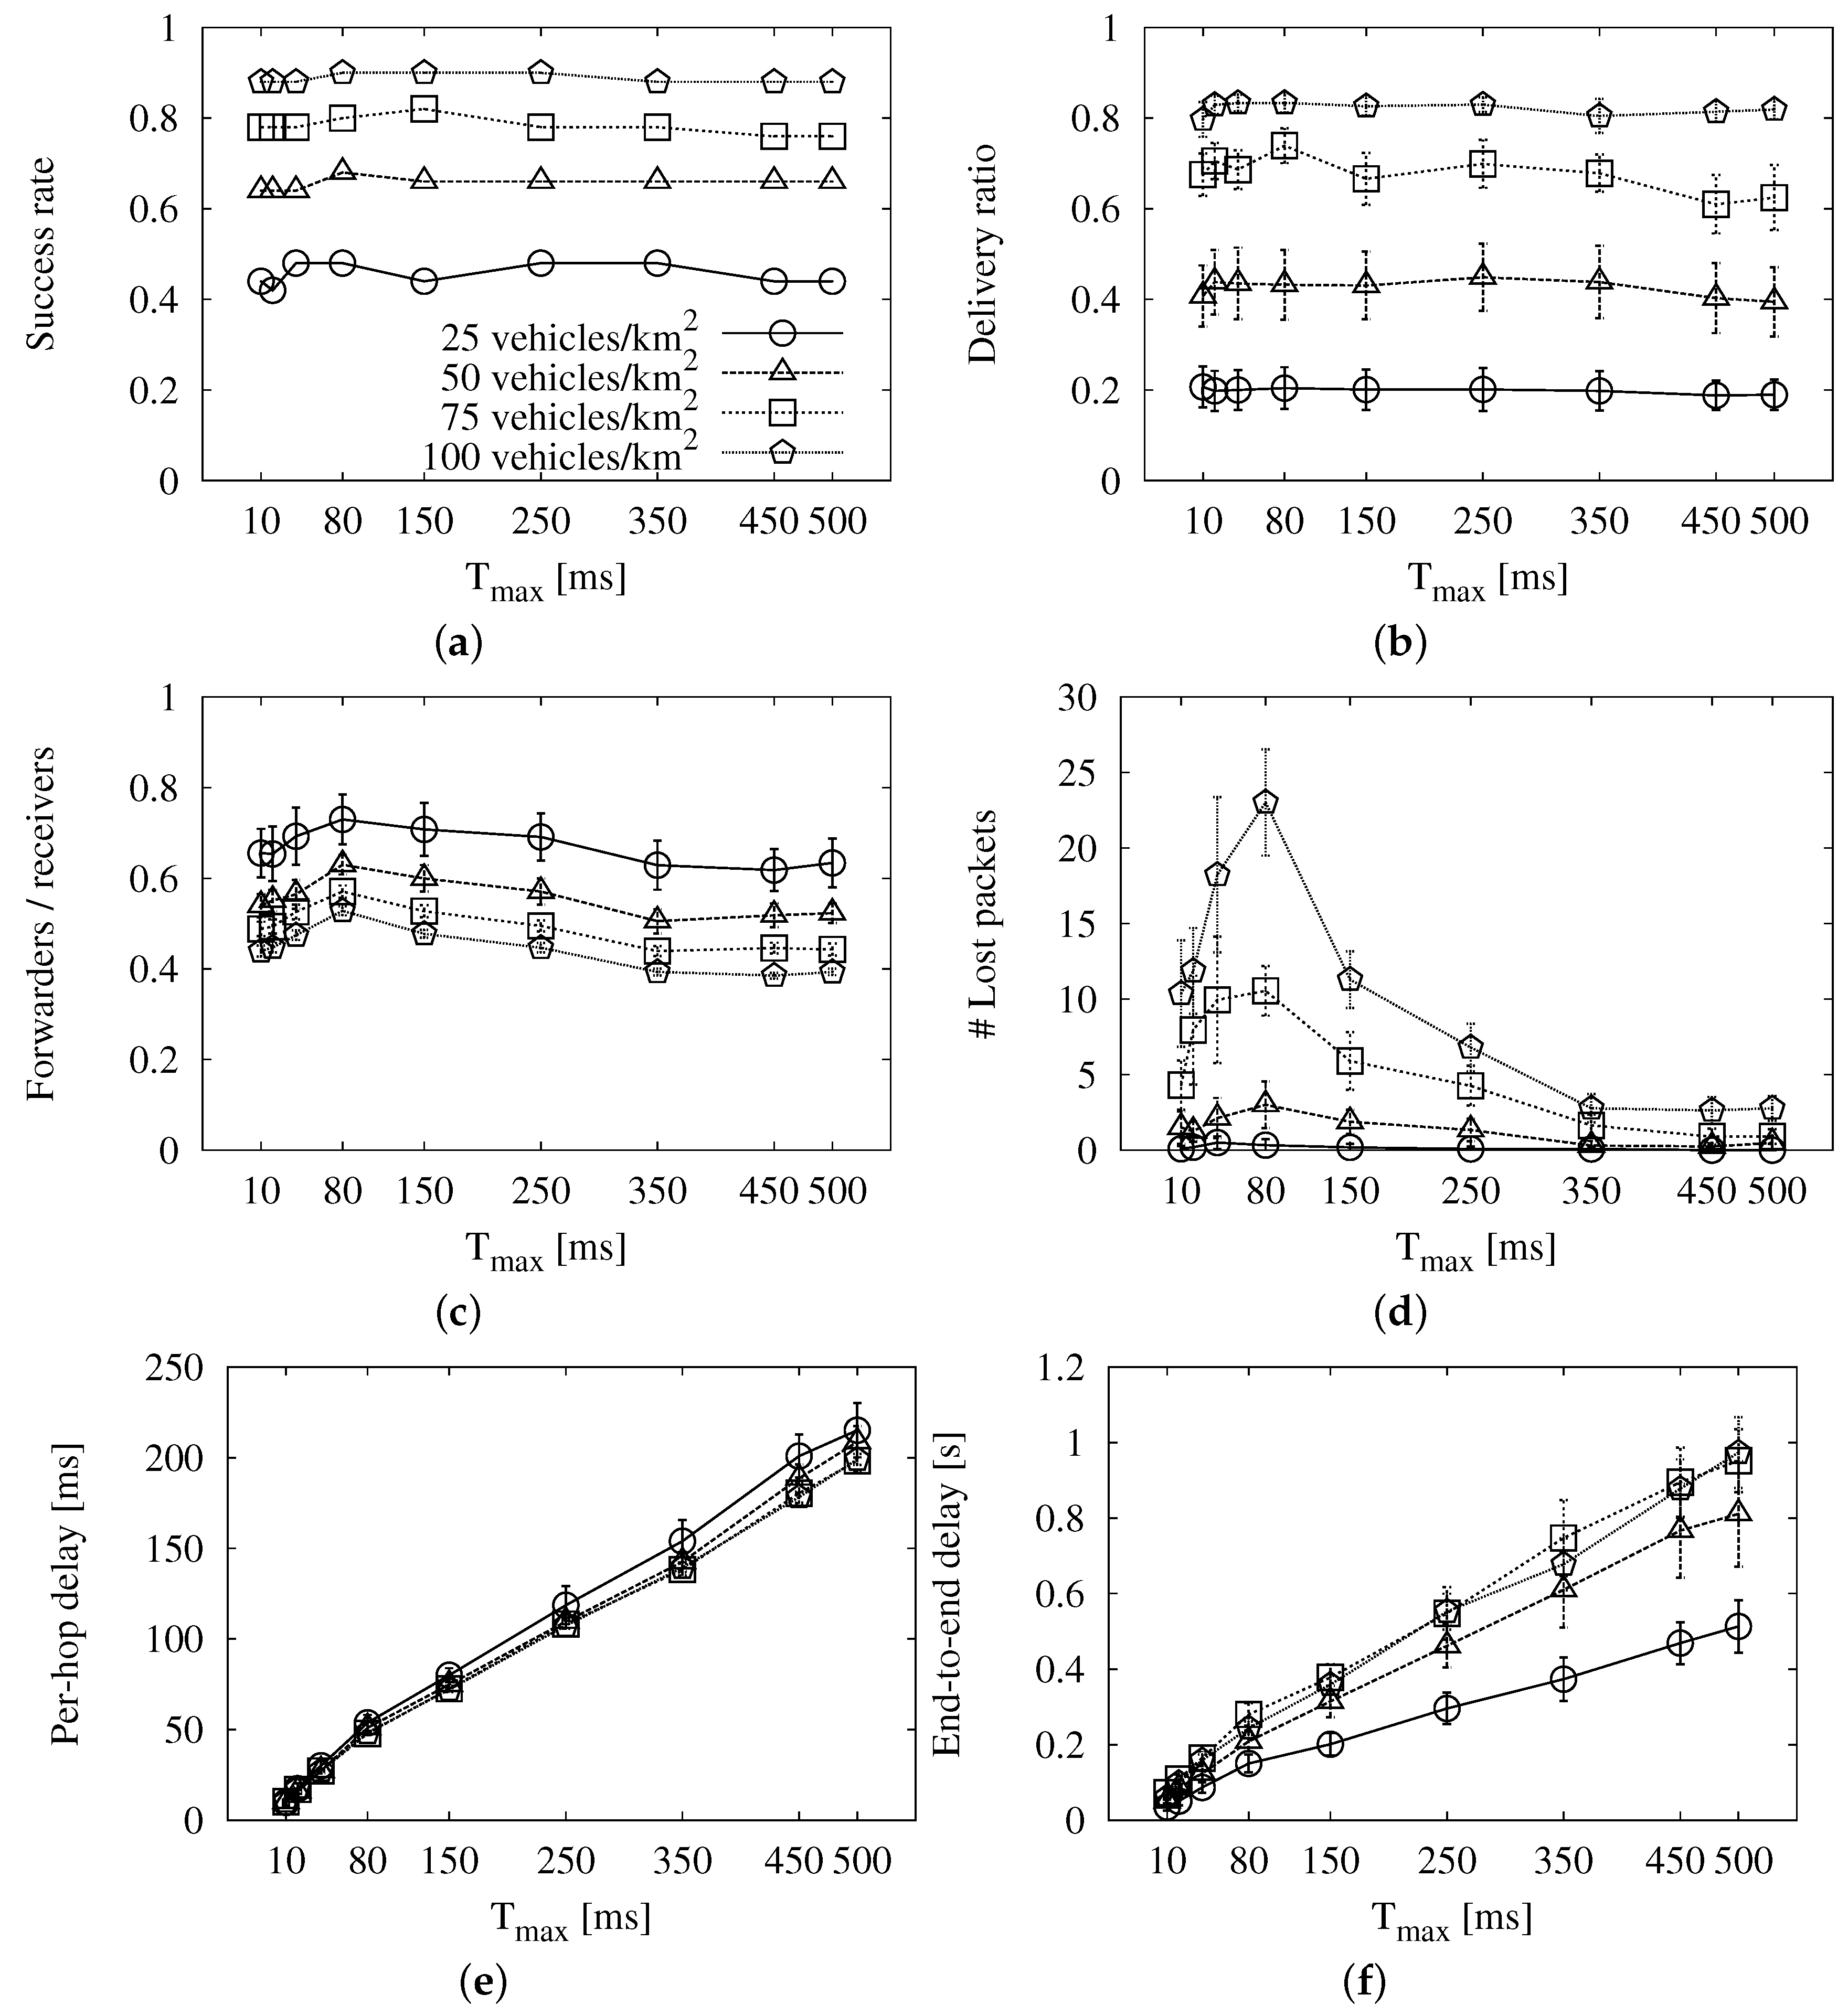
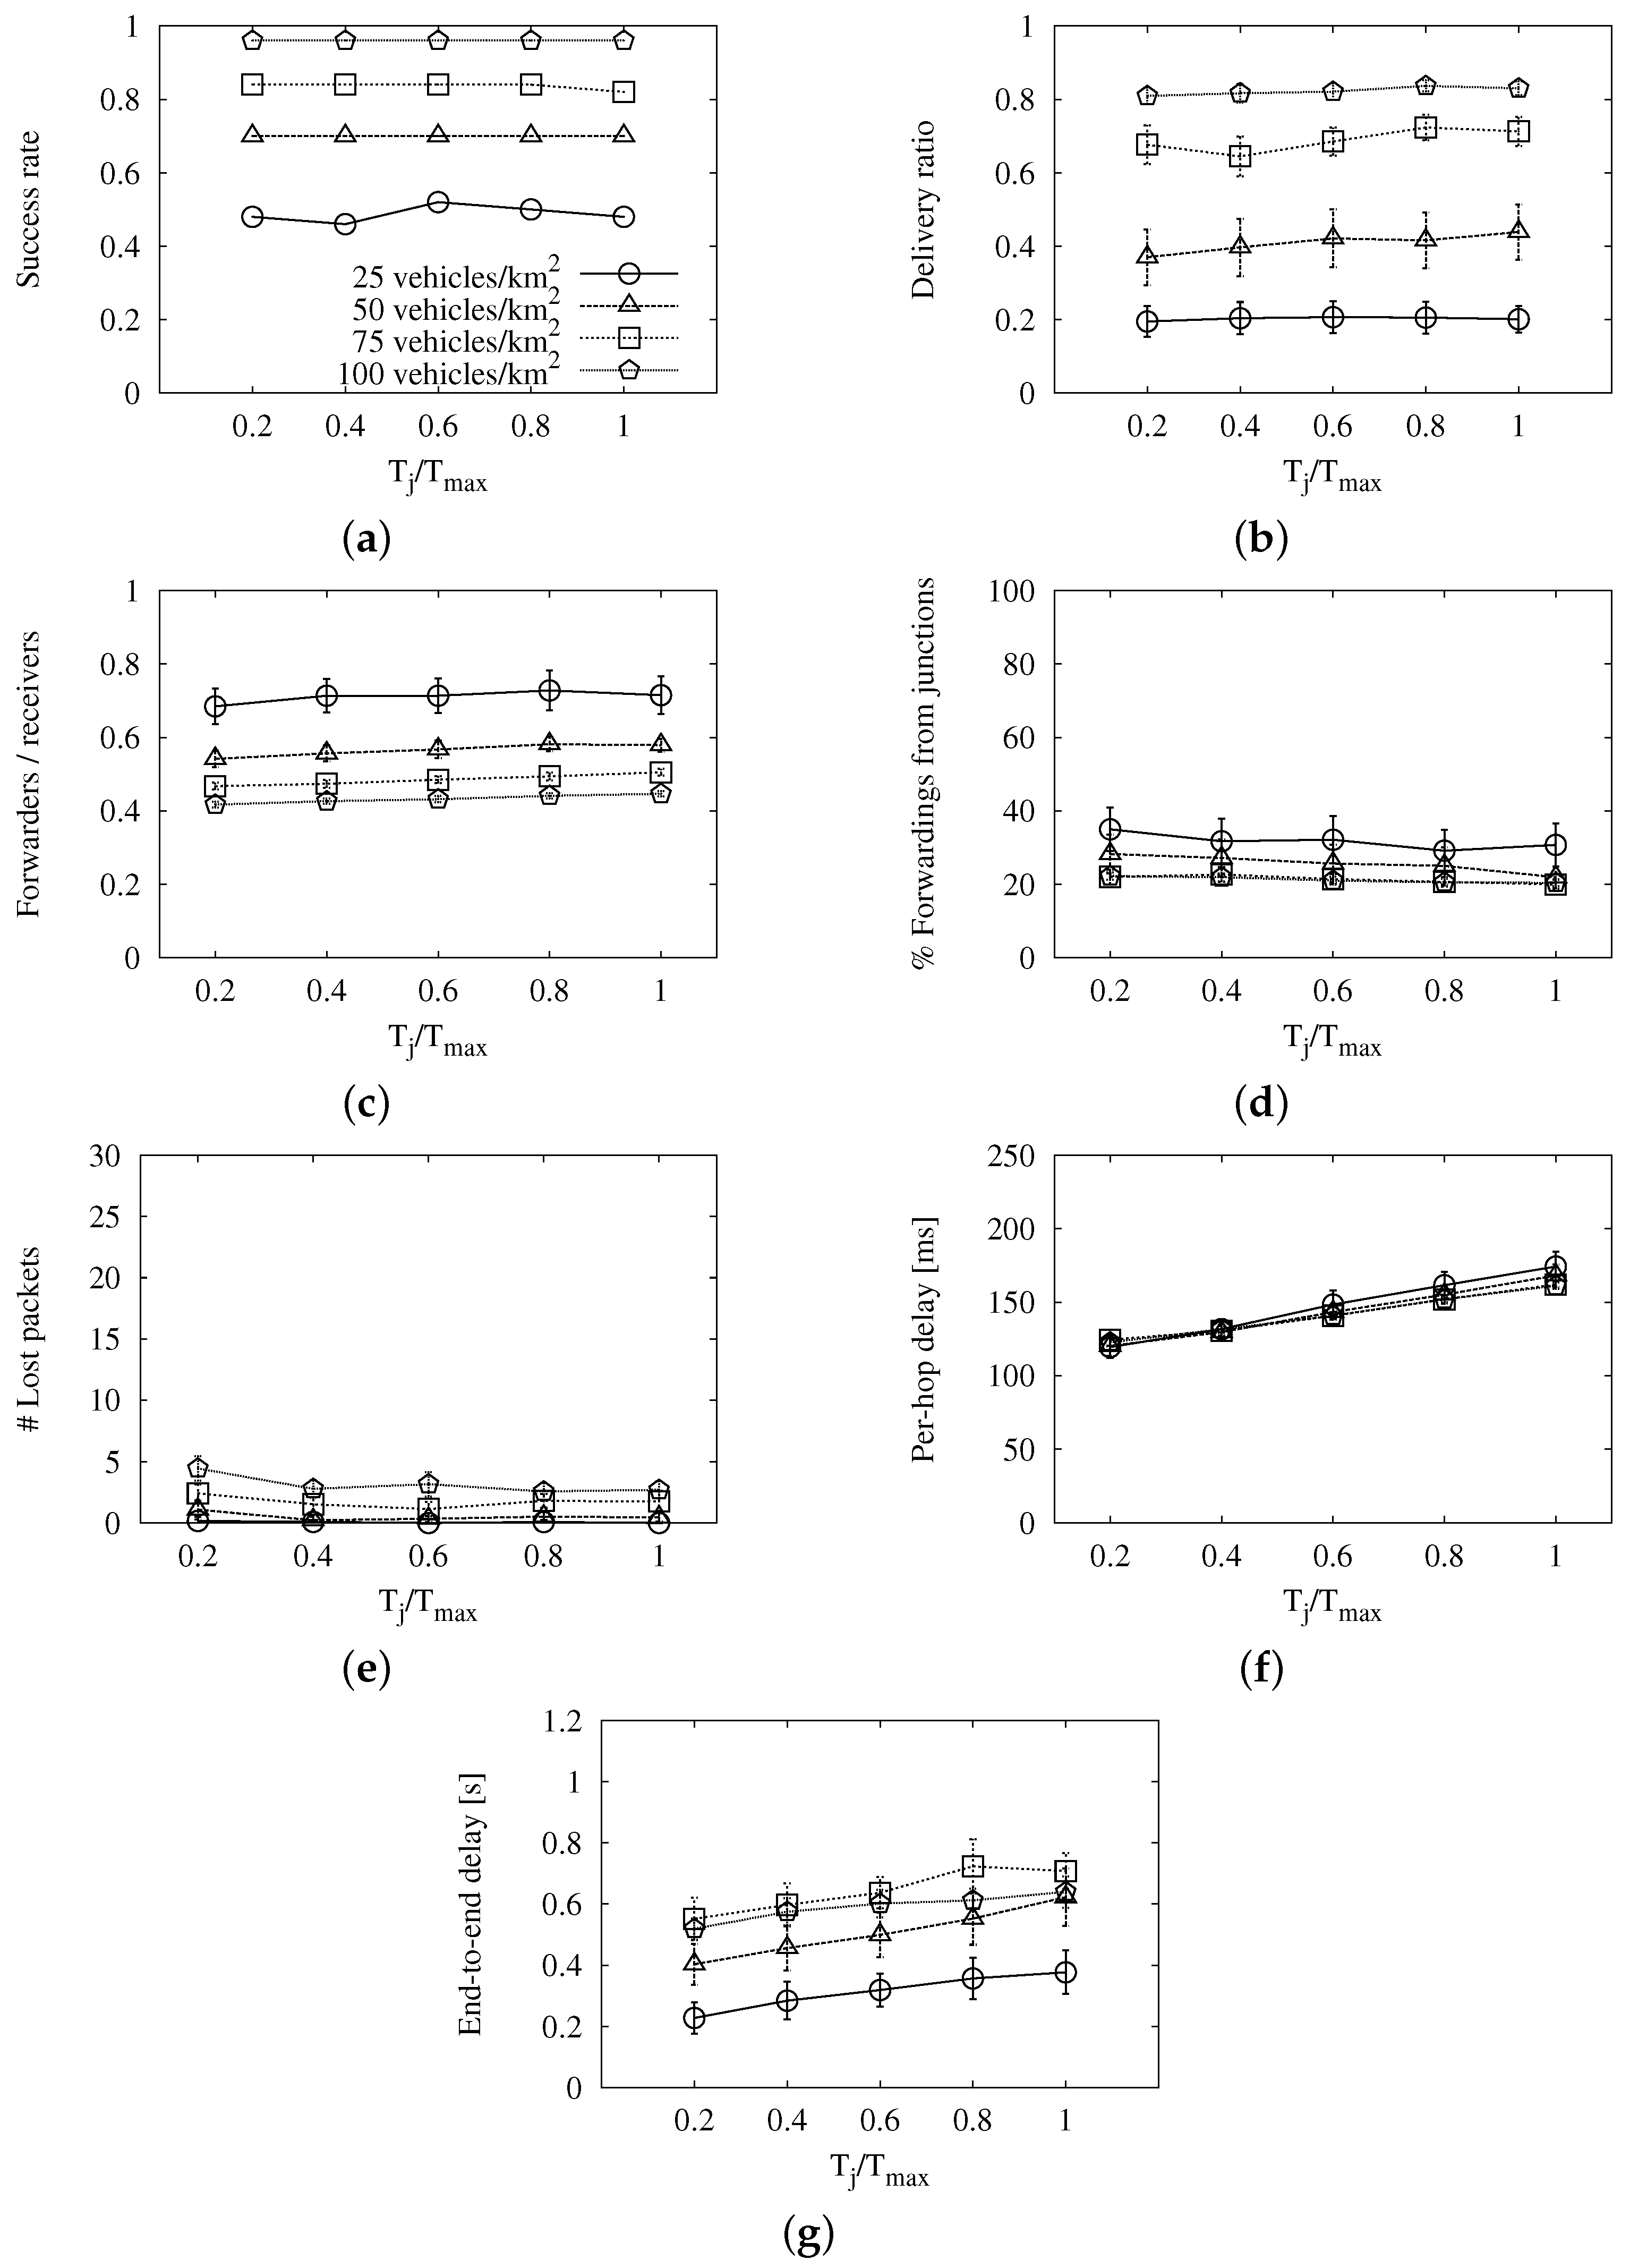
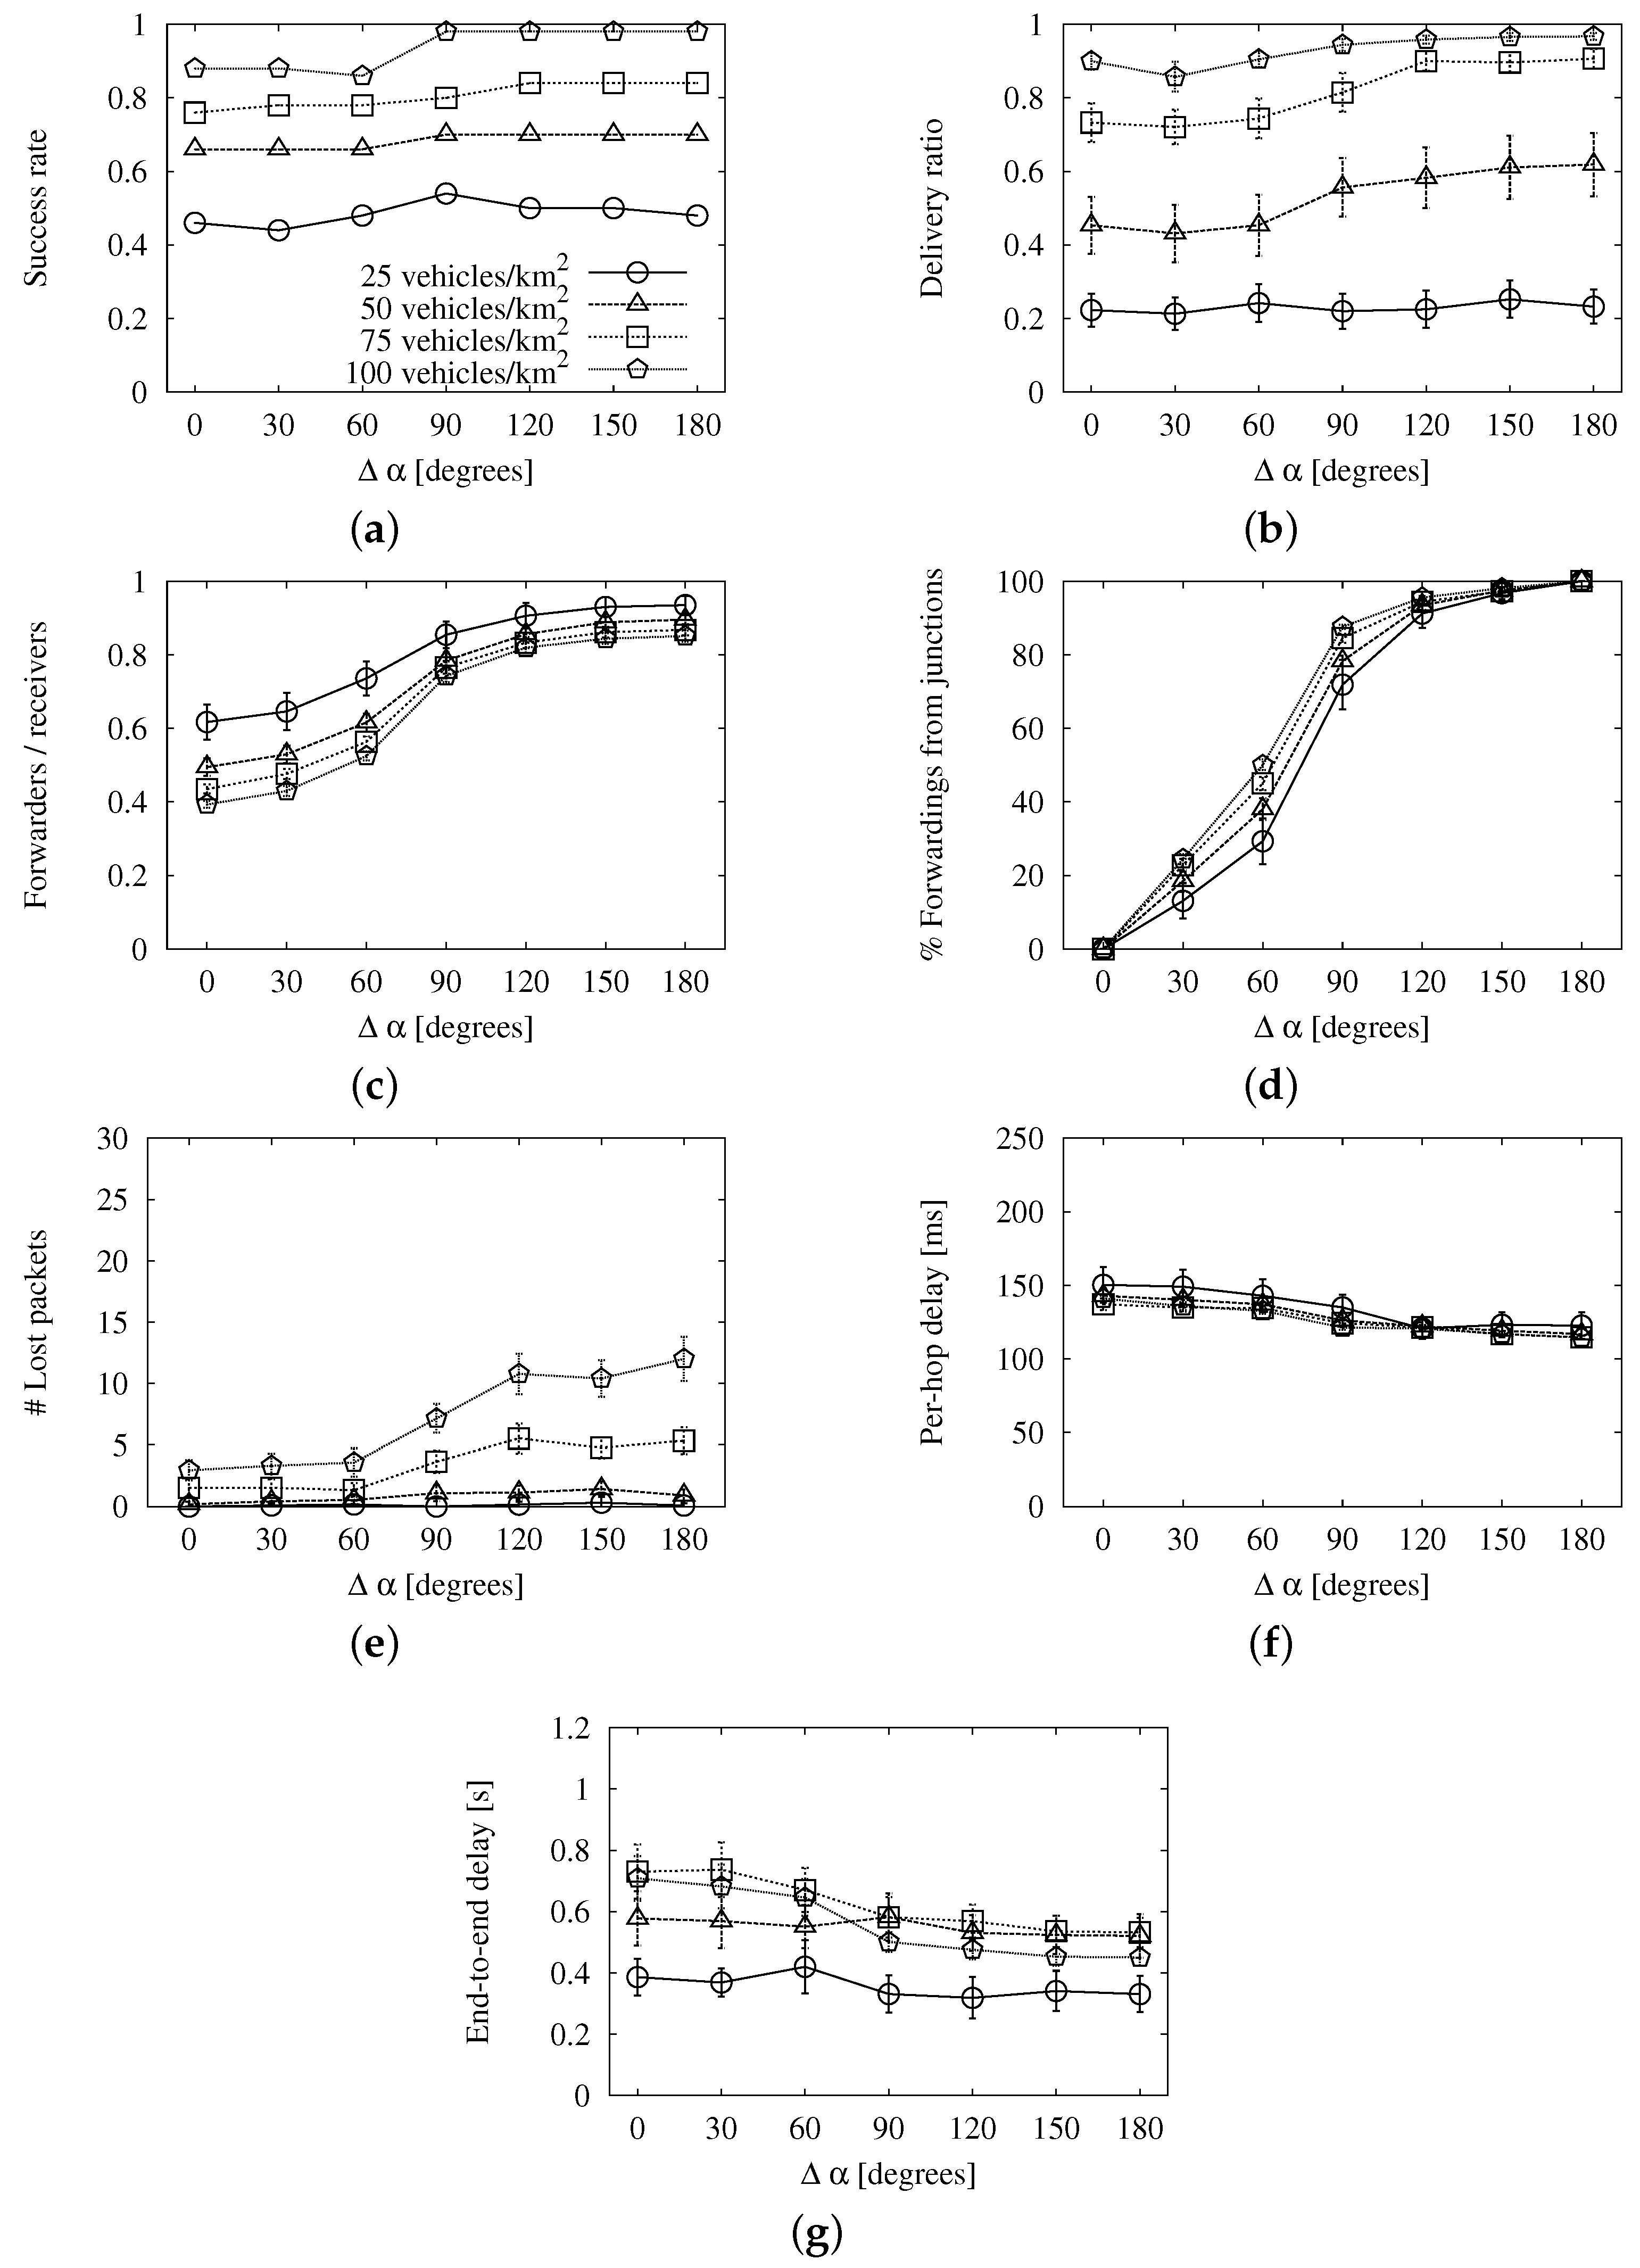
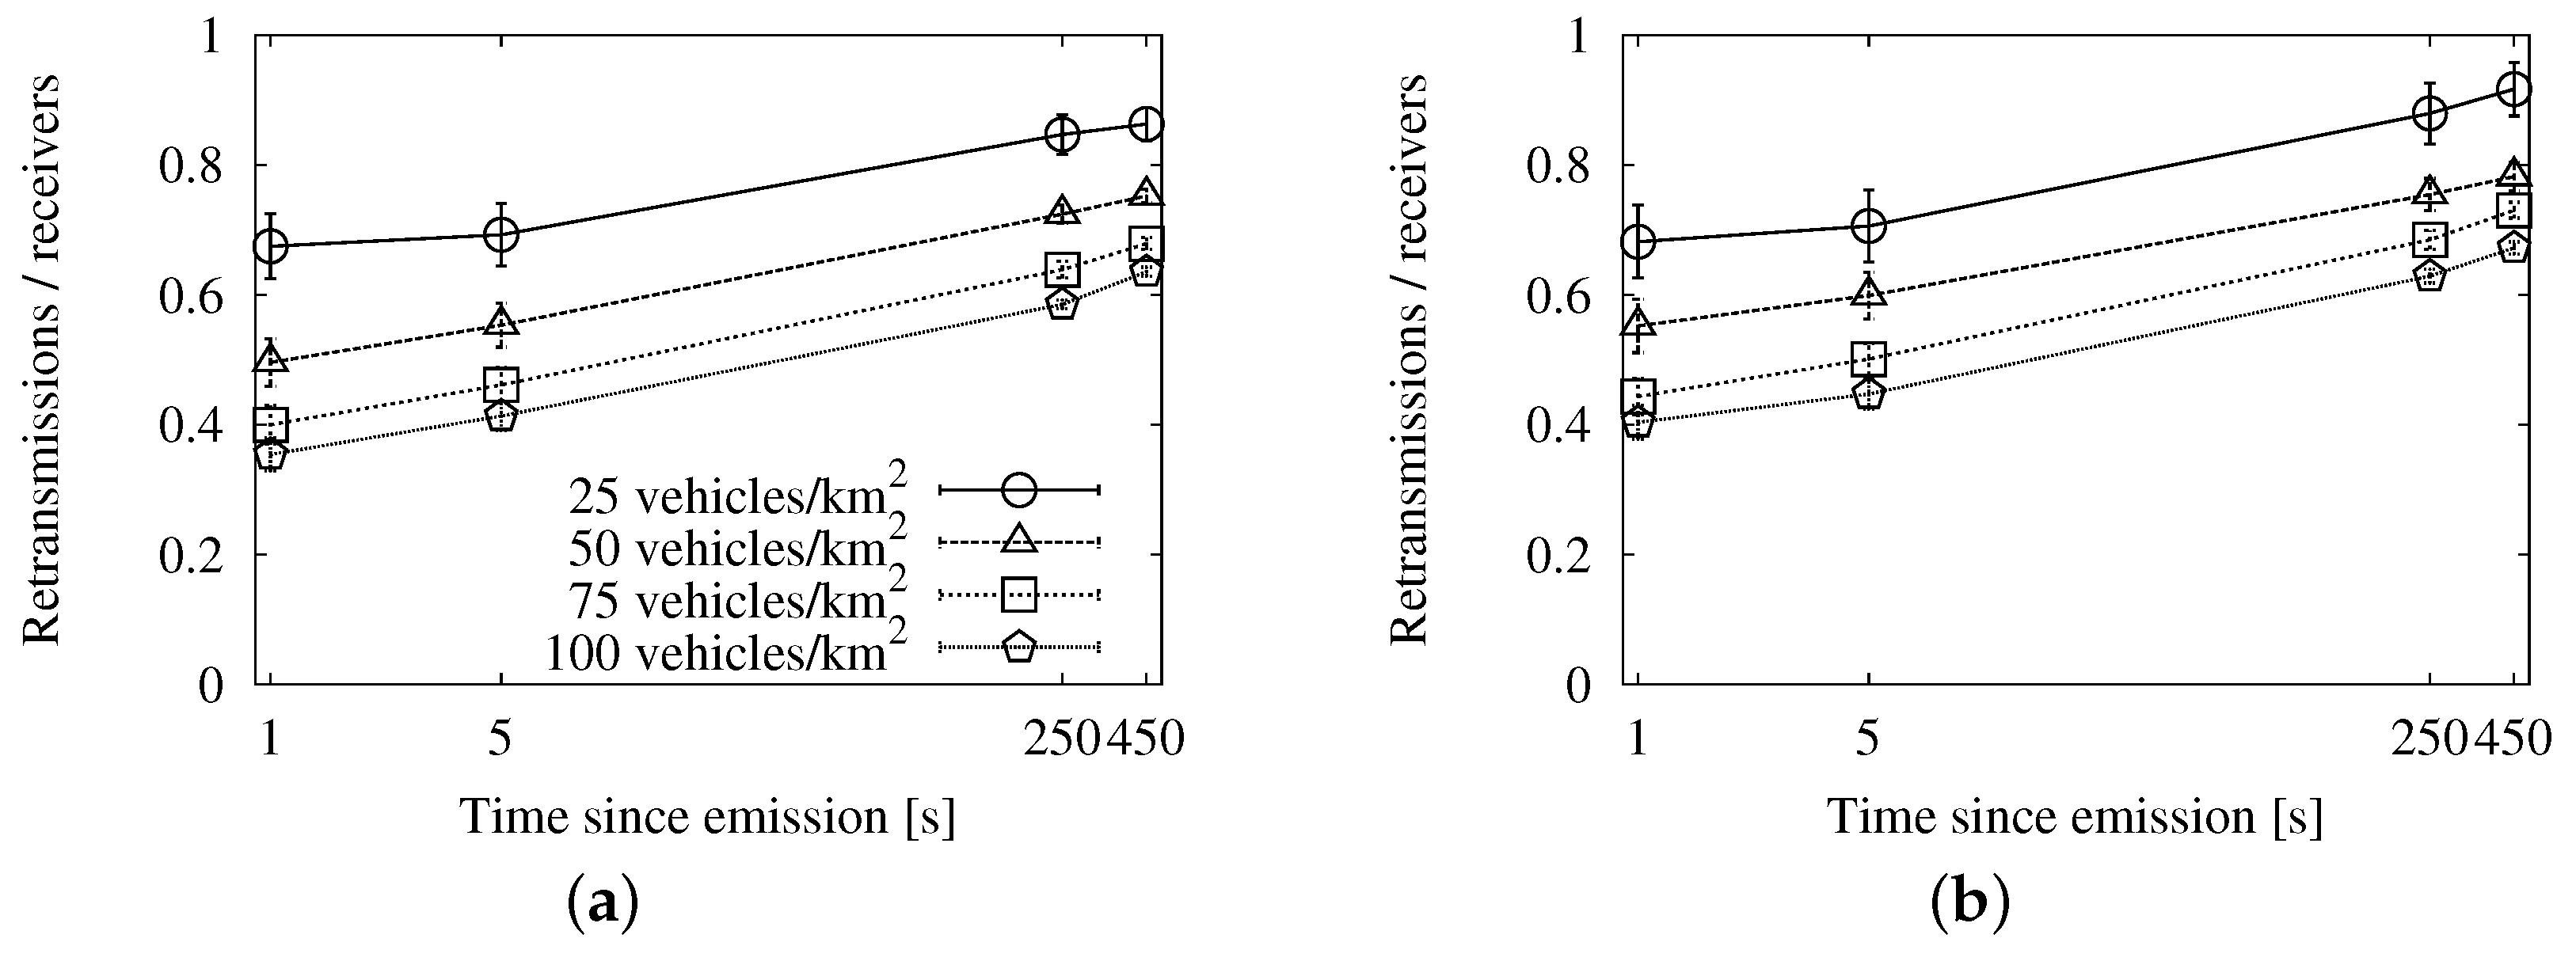
4.3.1. Parameters for Broadcast Suppression
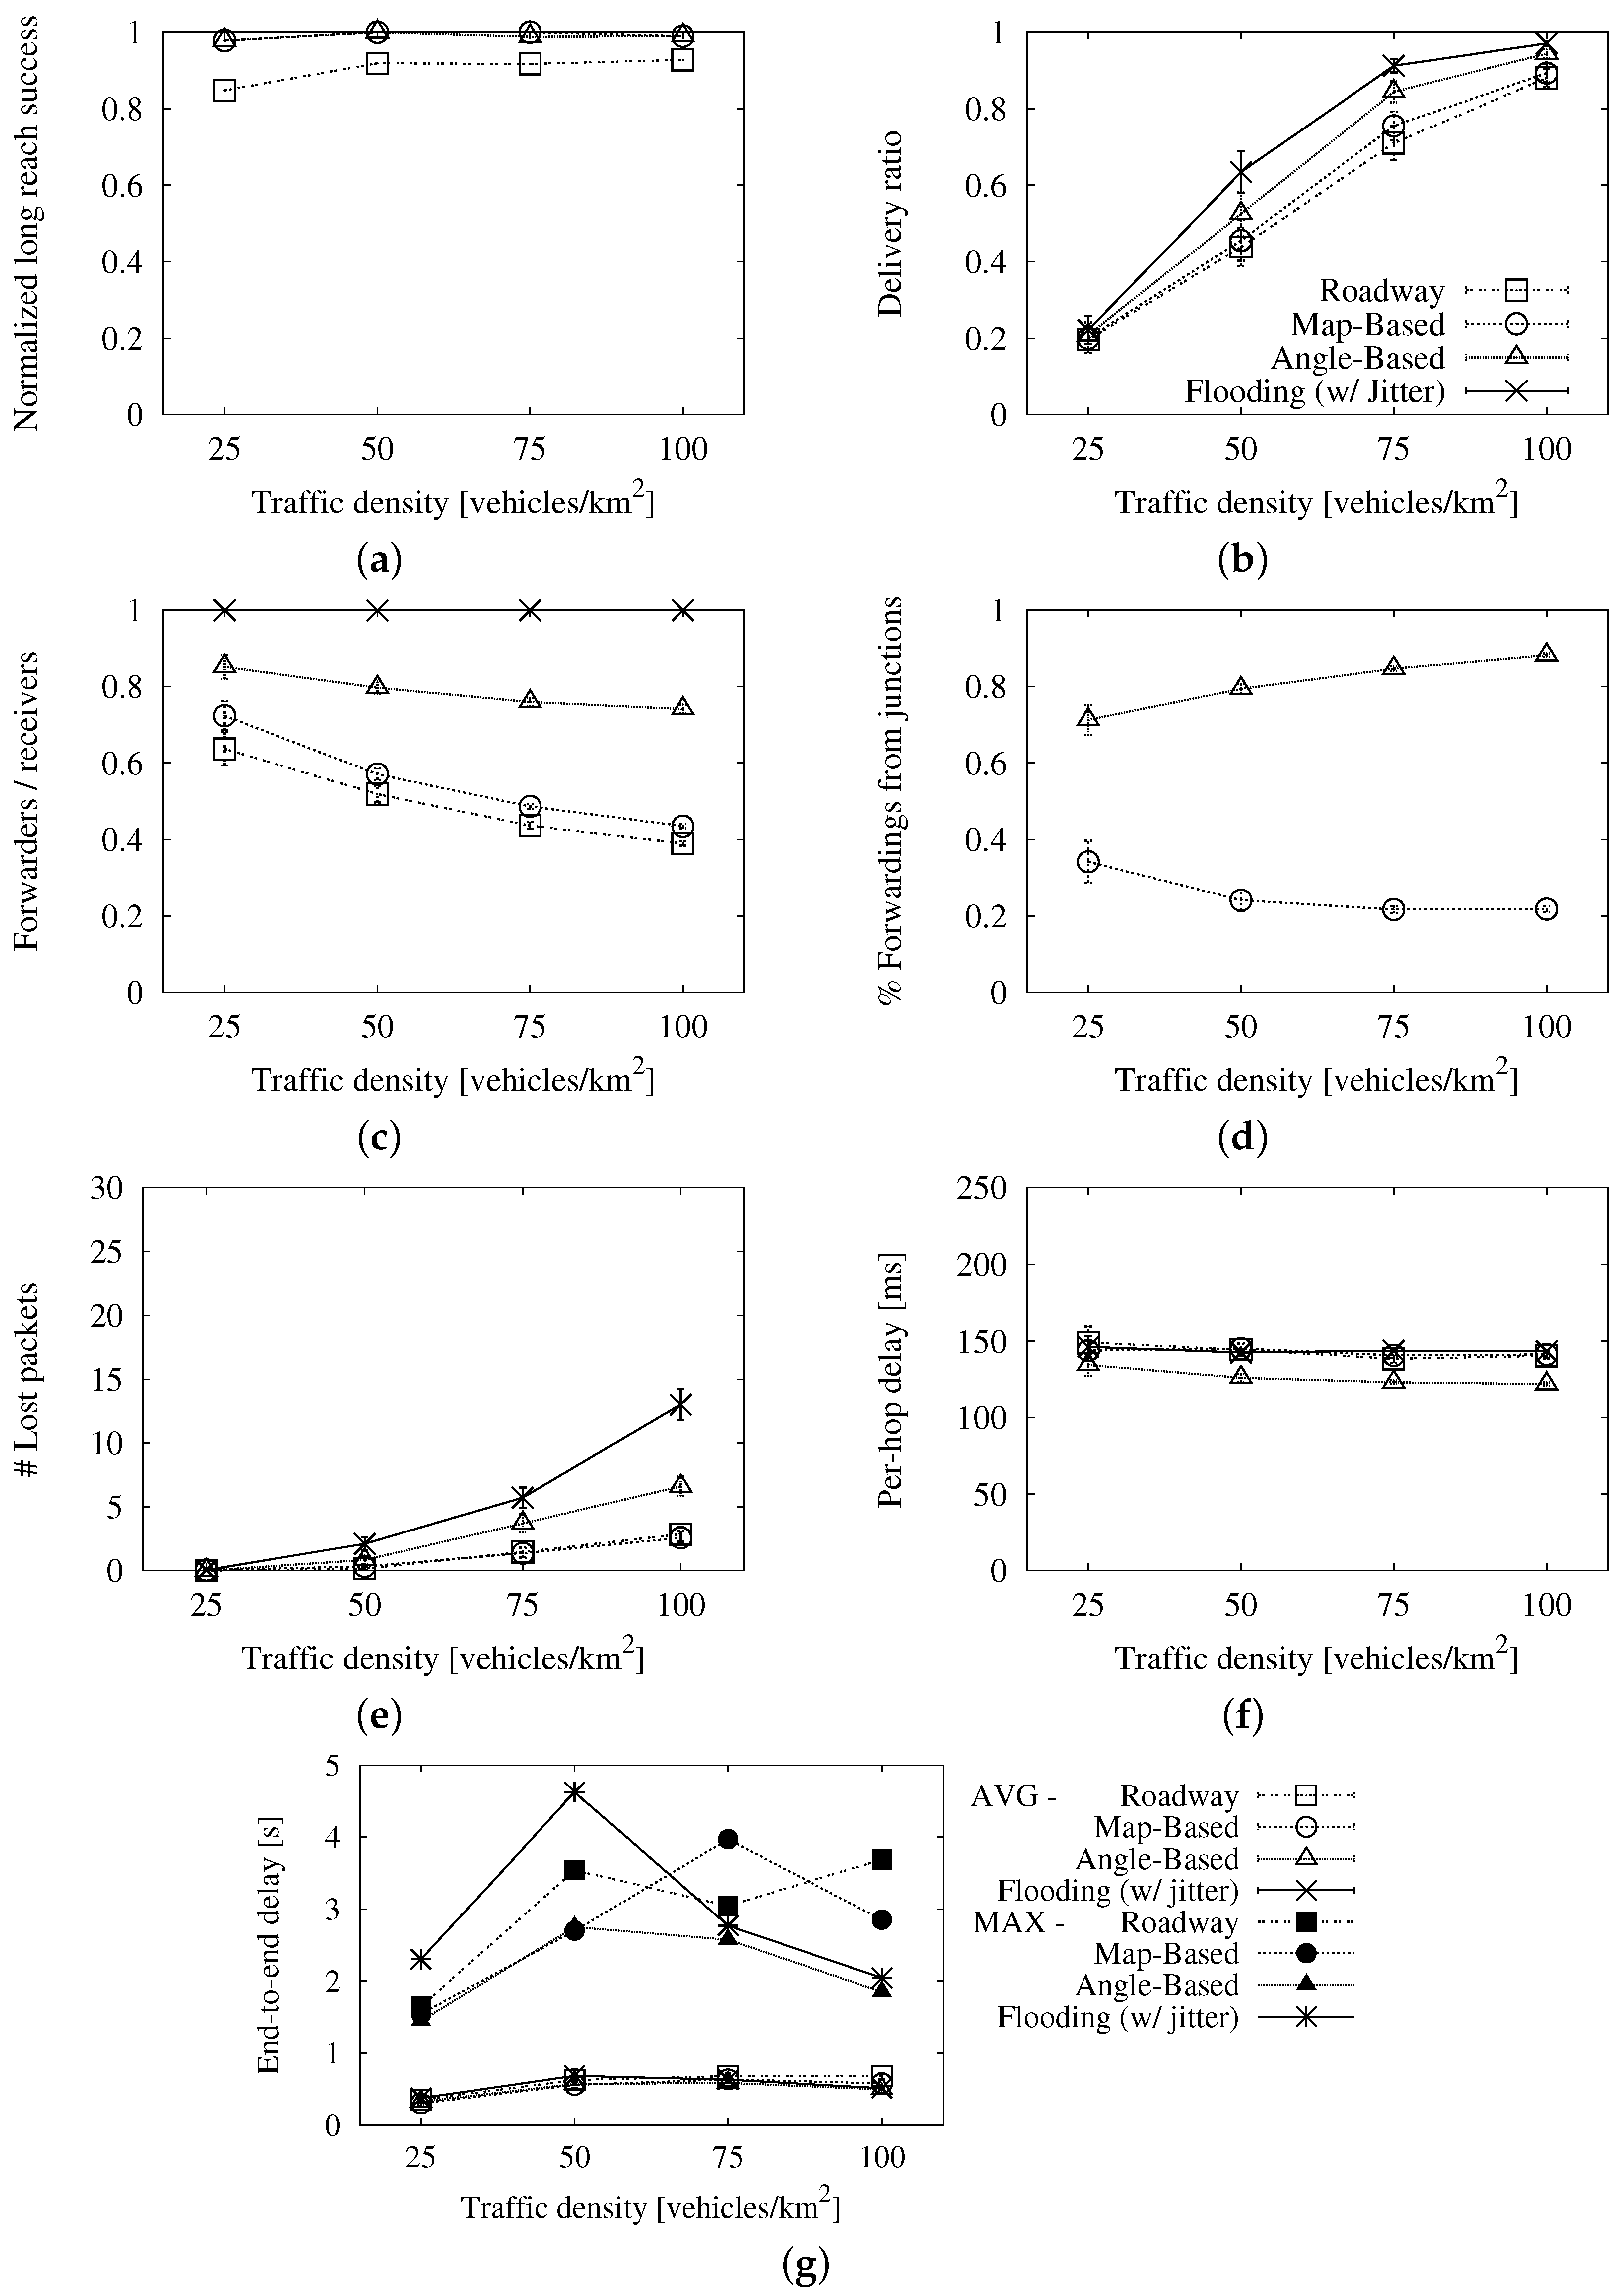
4.3.2. Comparative Evaluation of the Broadcast Suppression Schemes
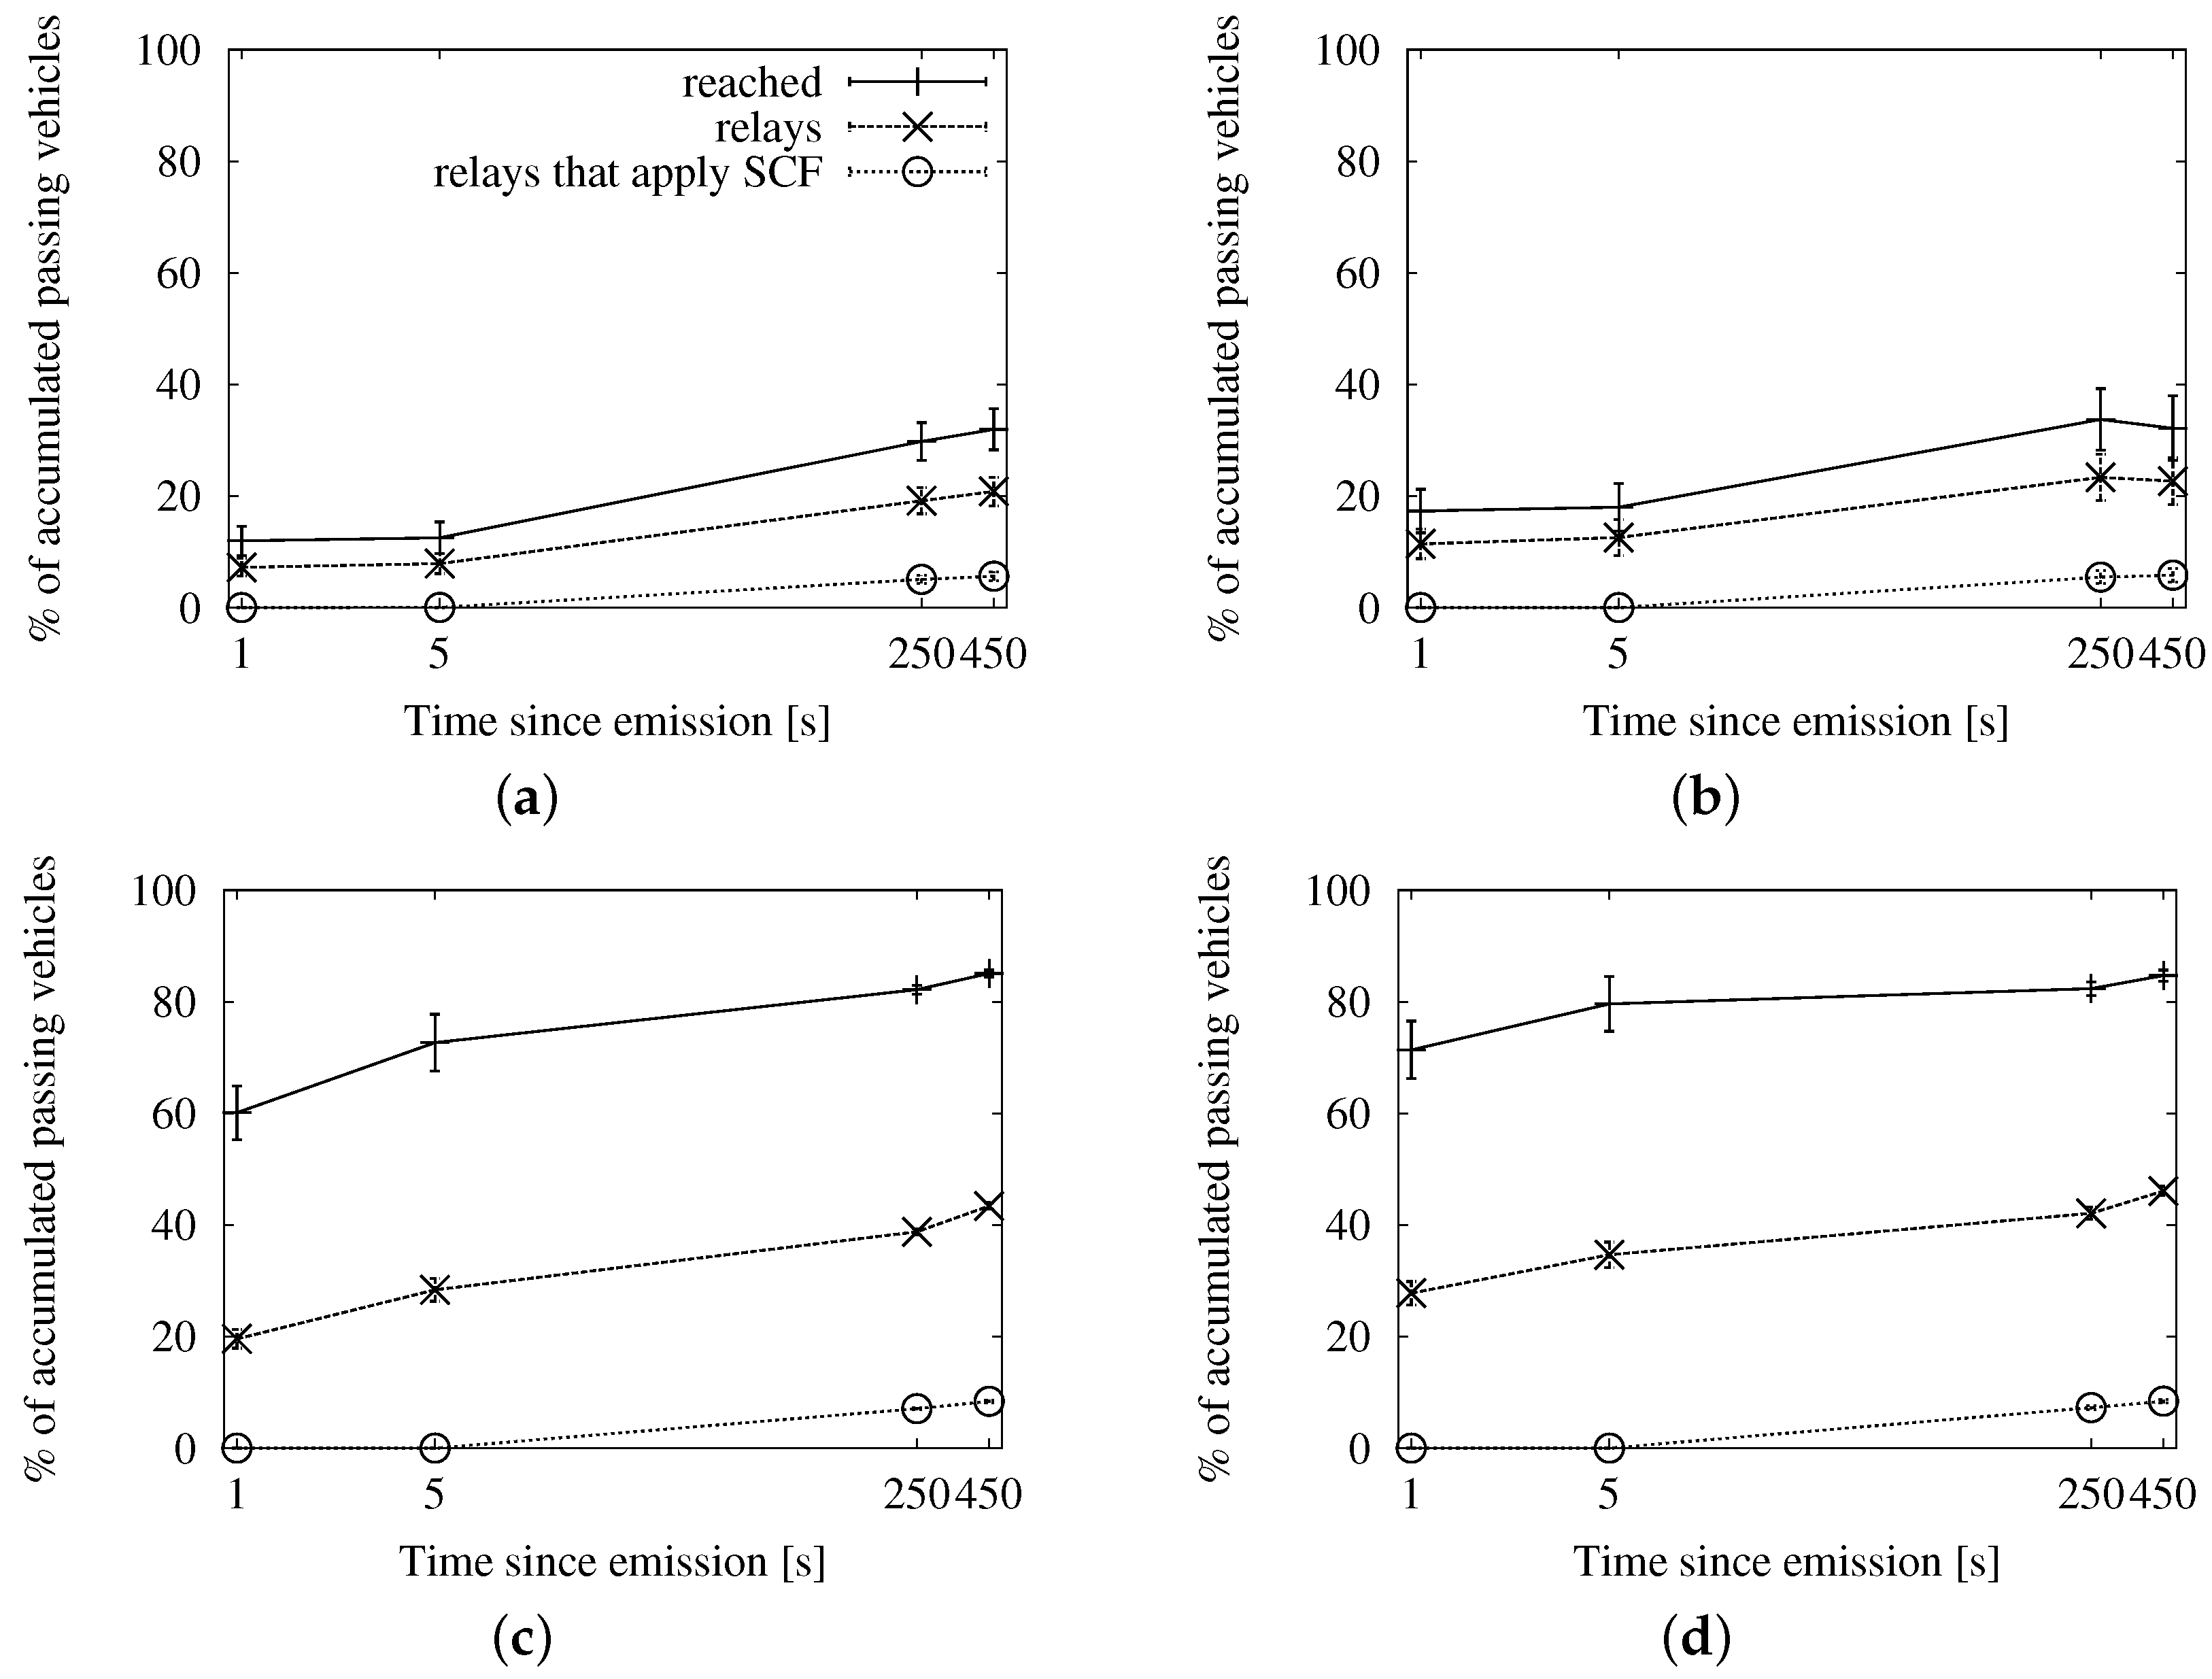
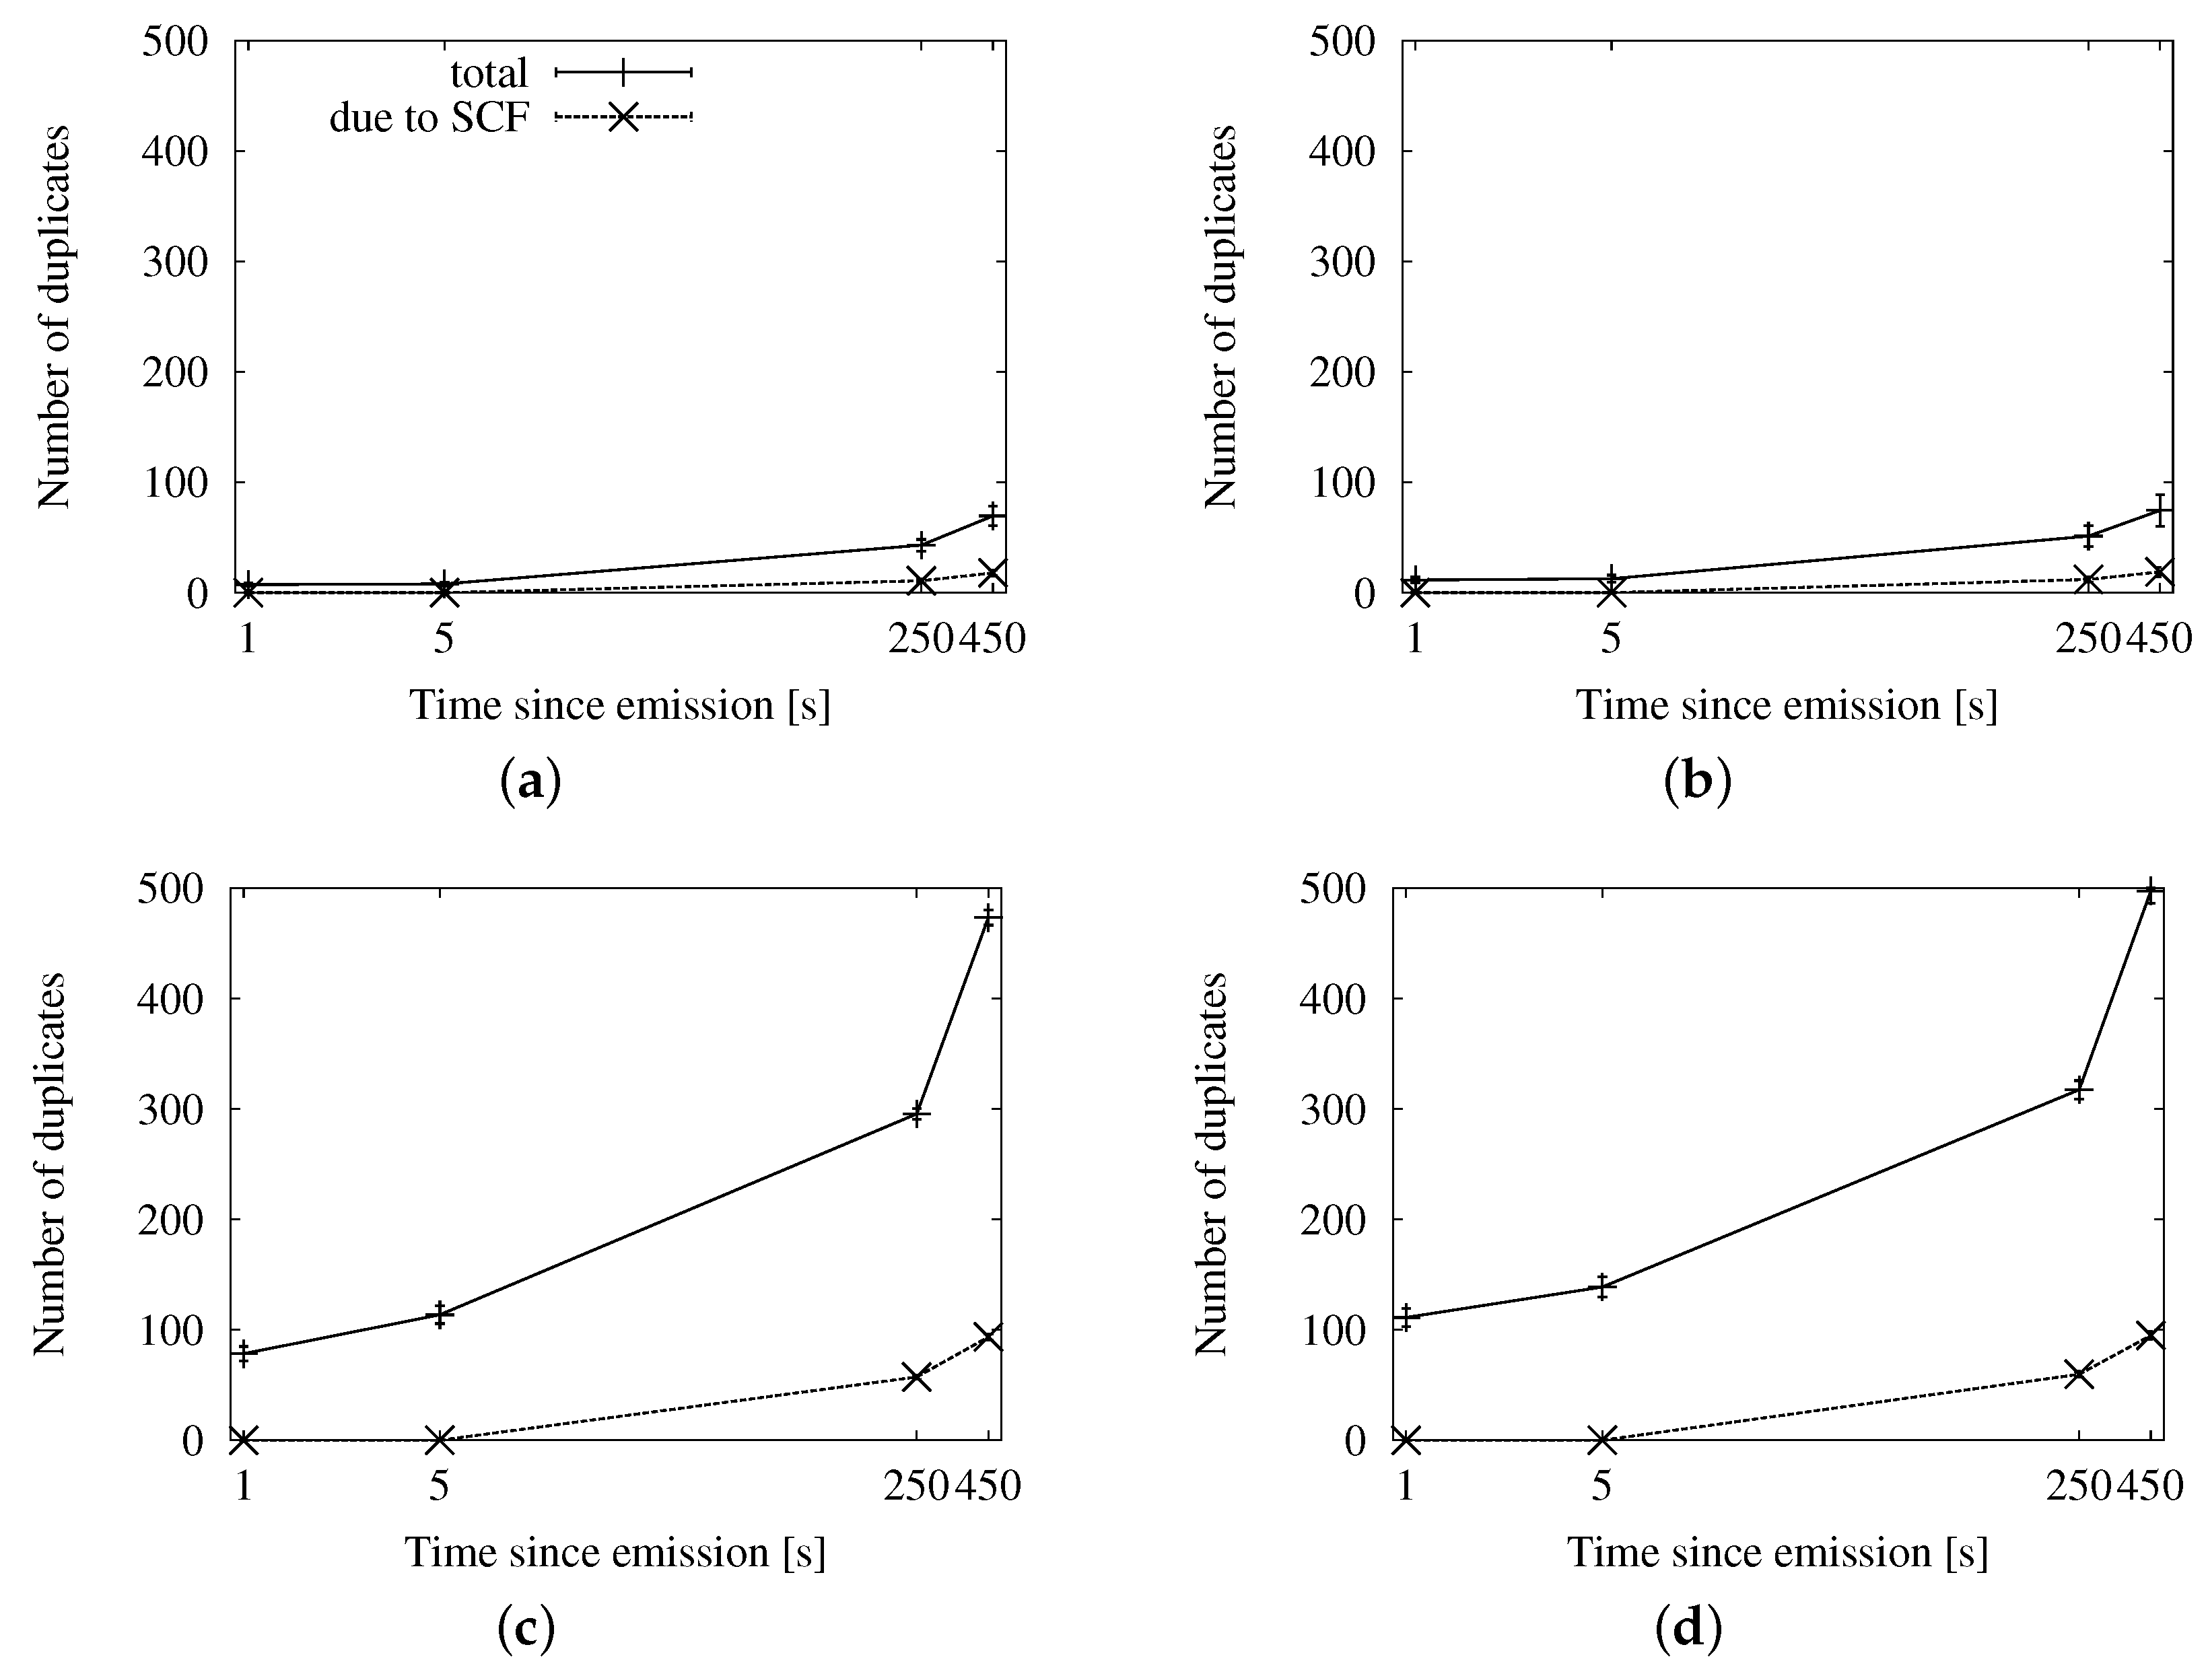
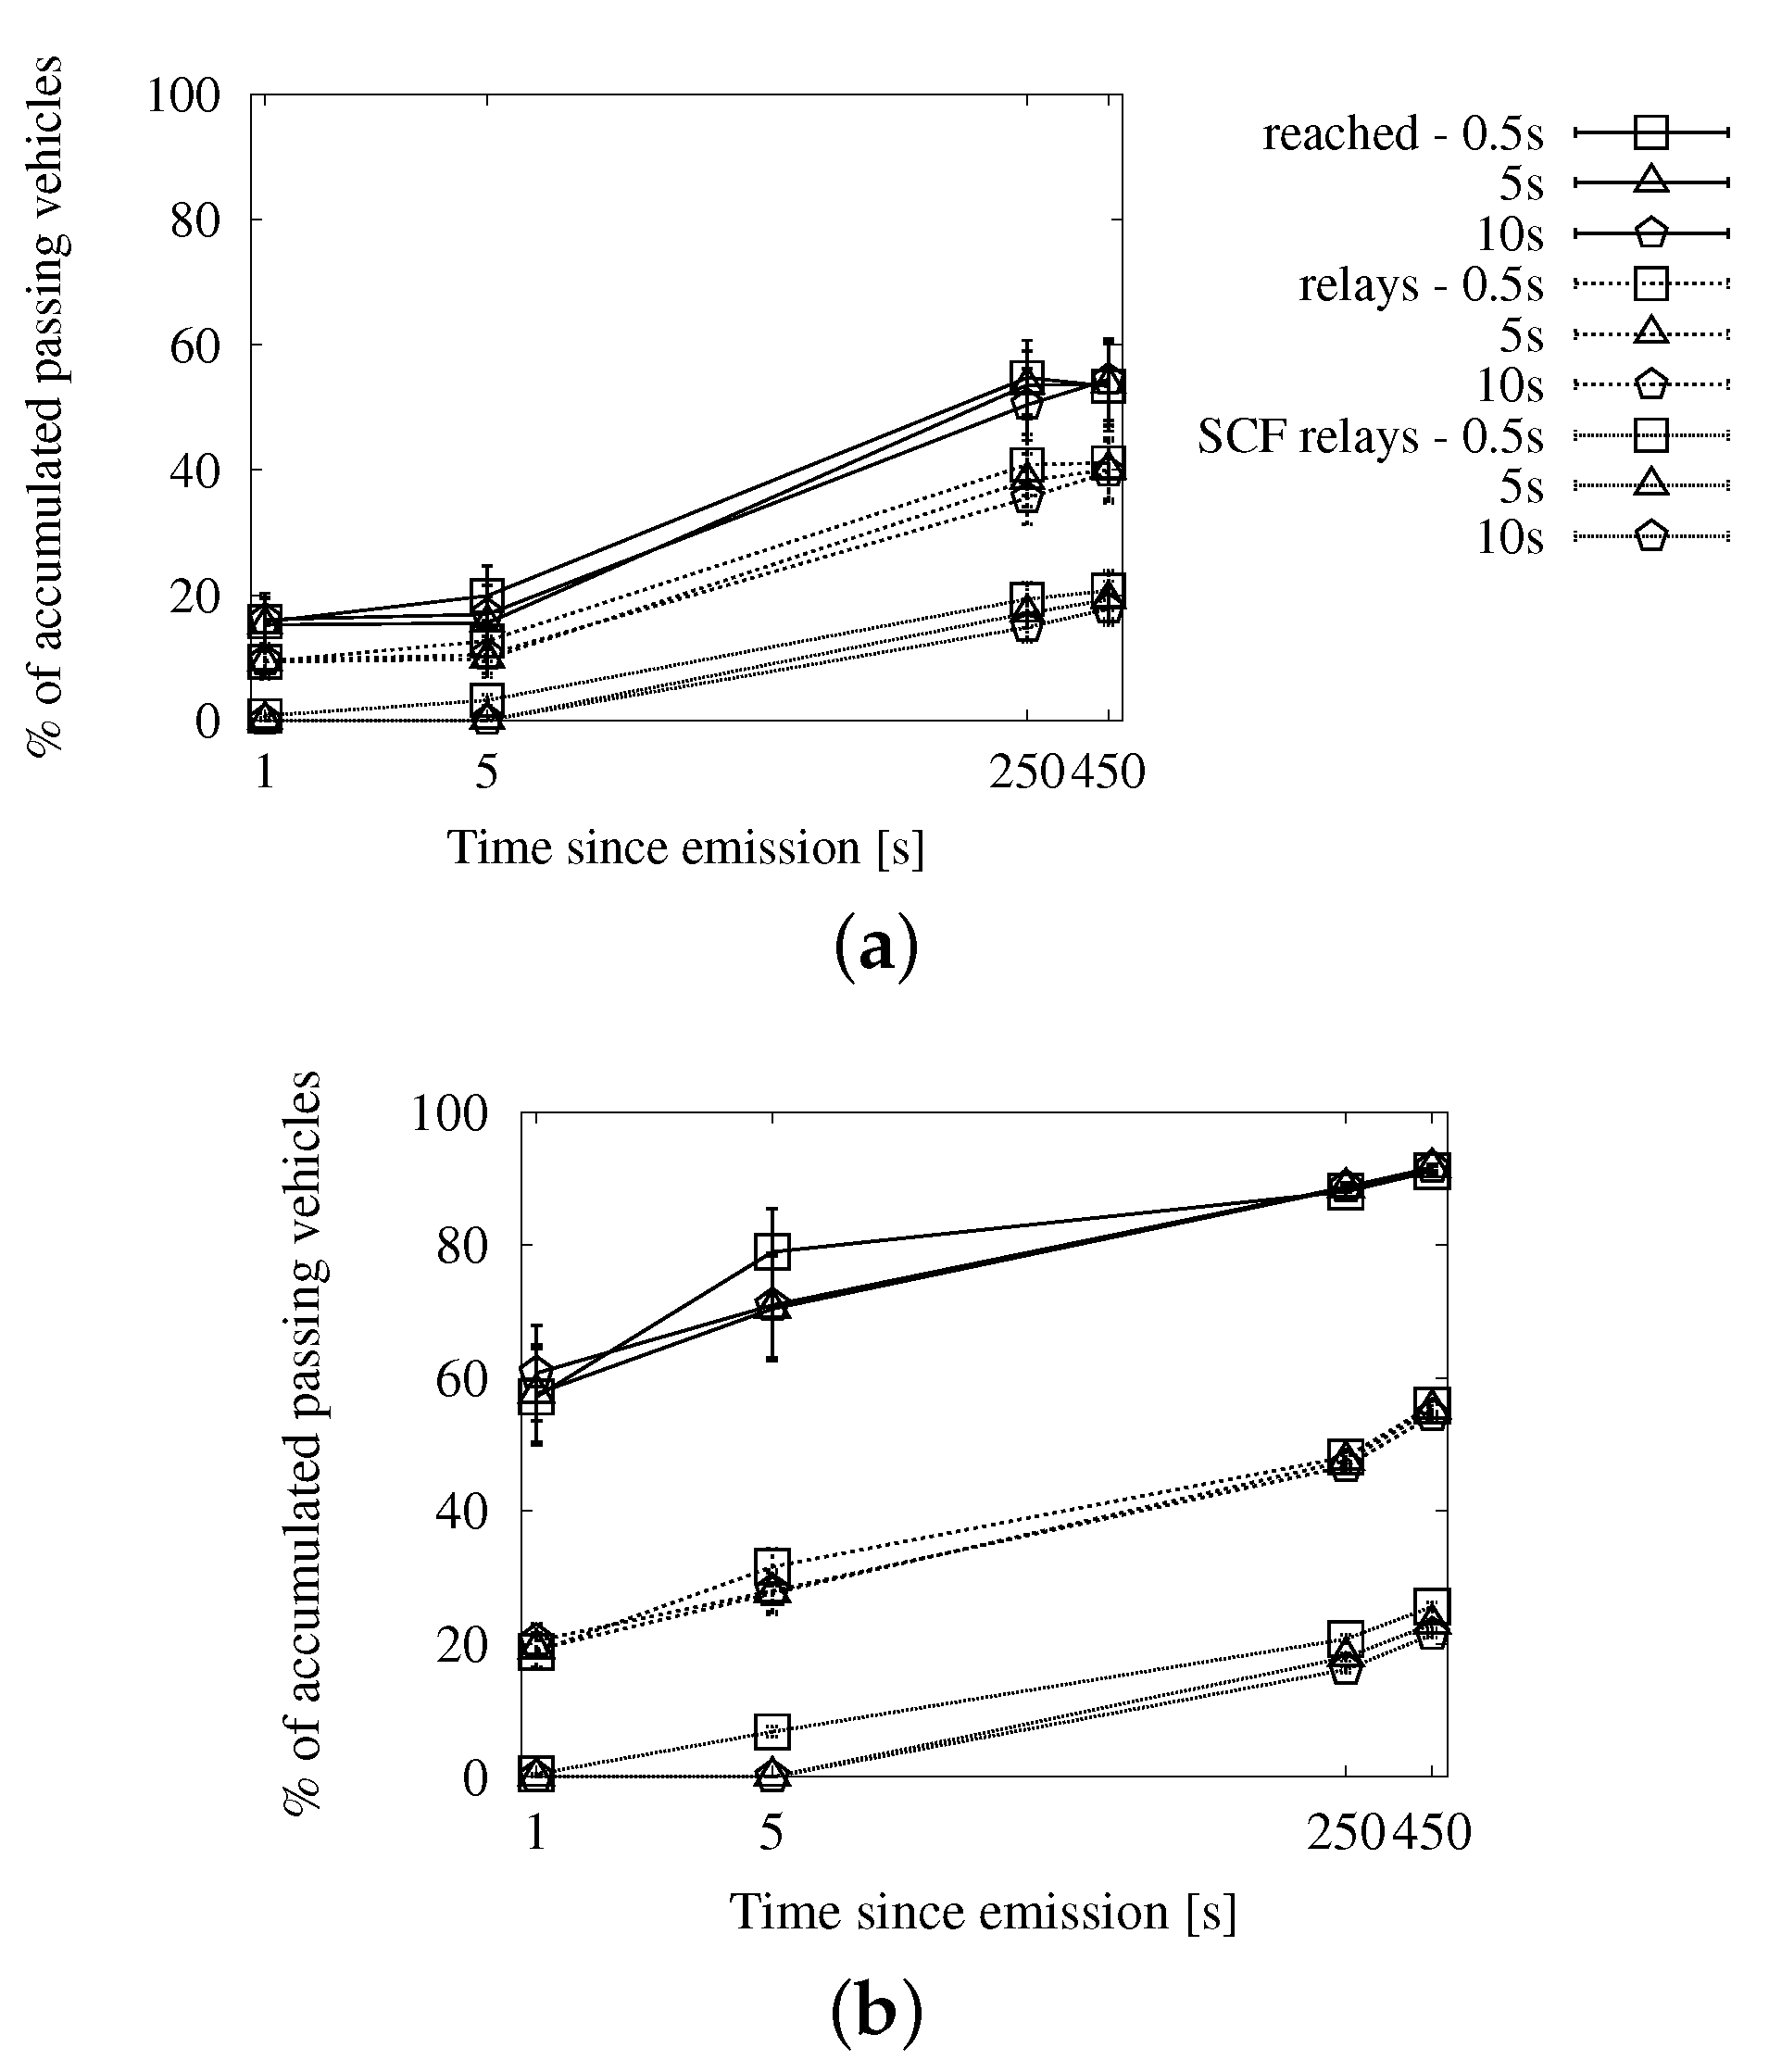
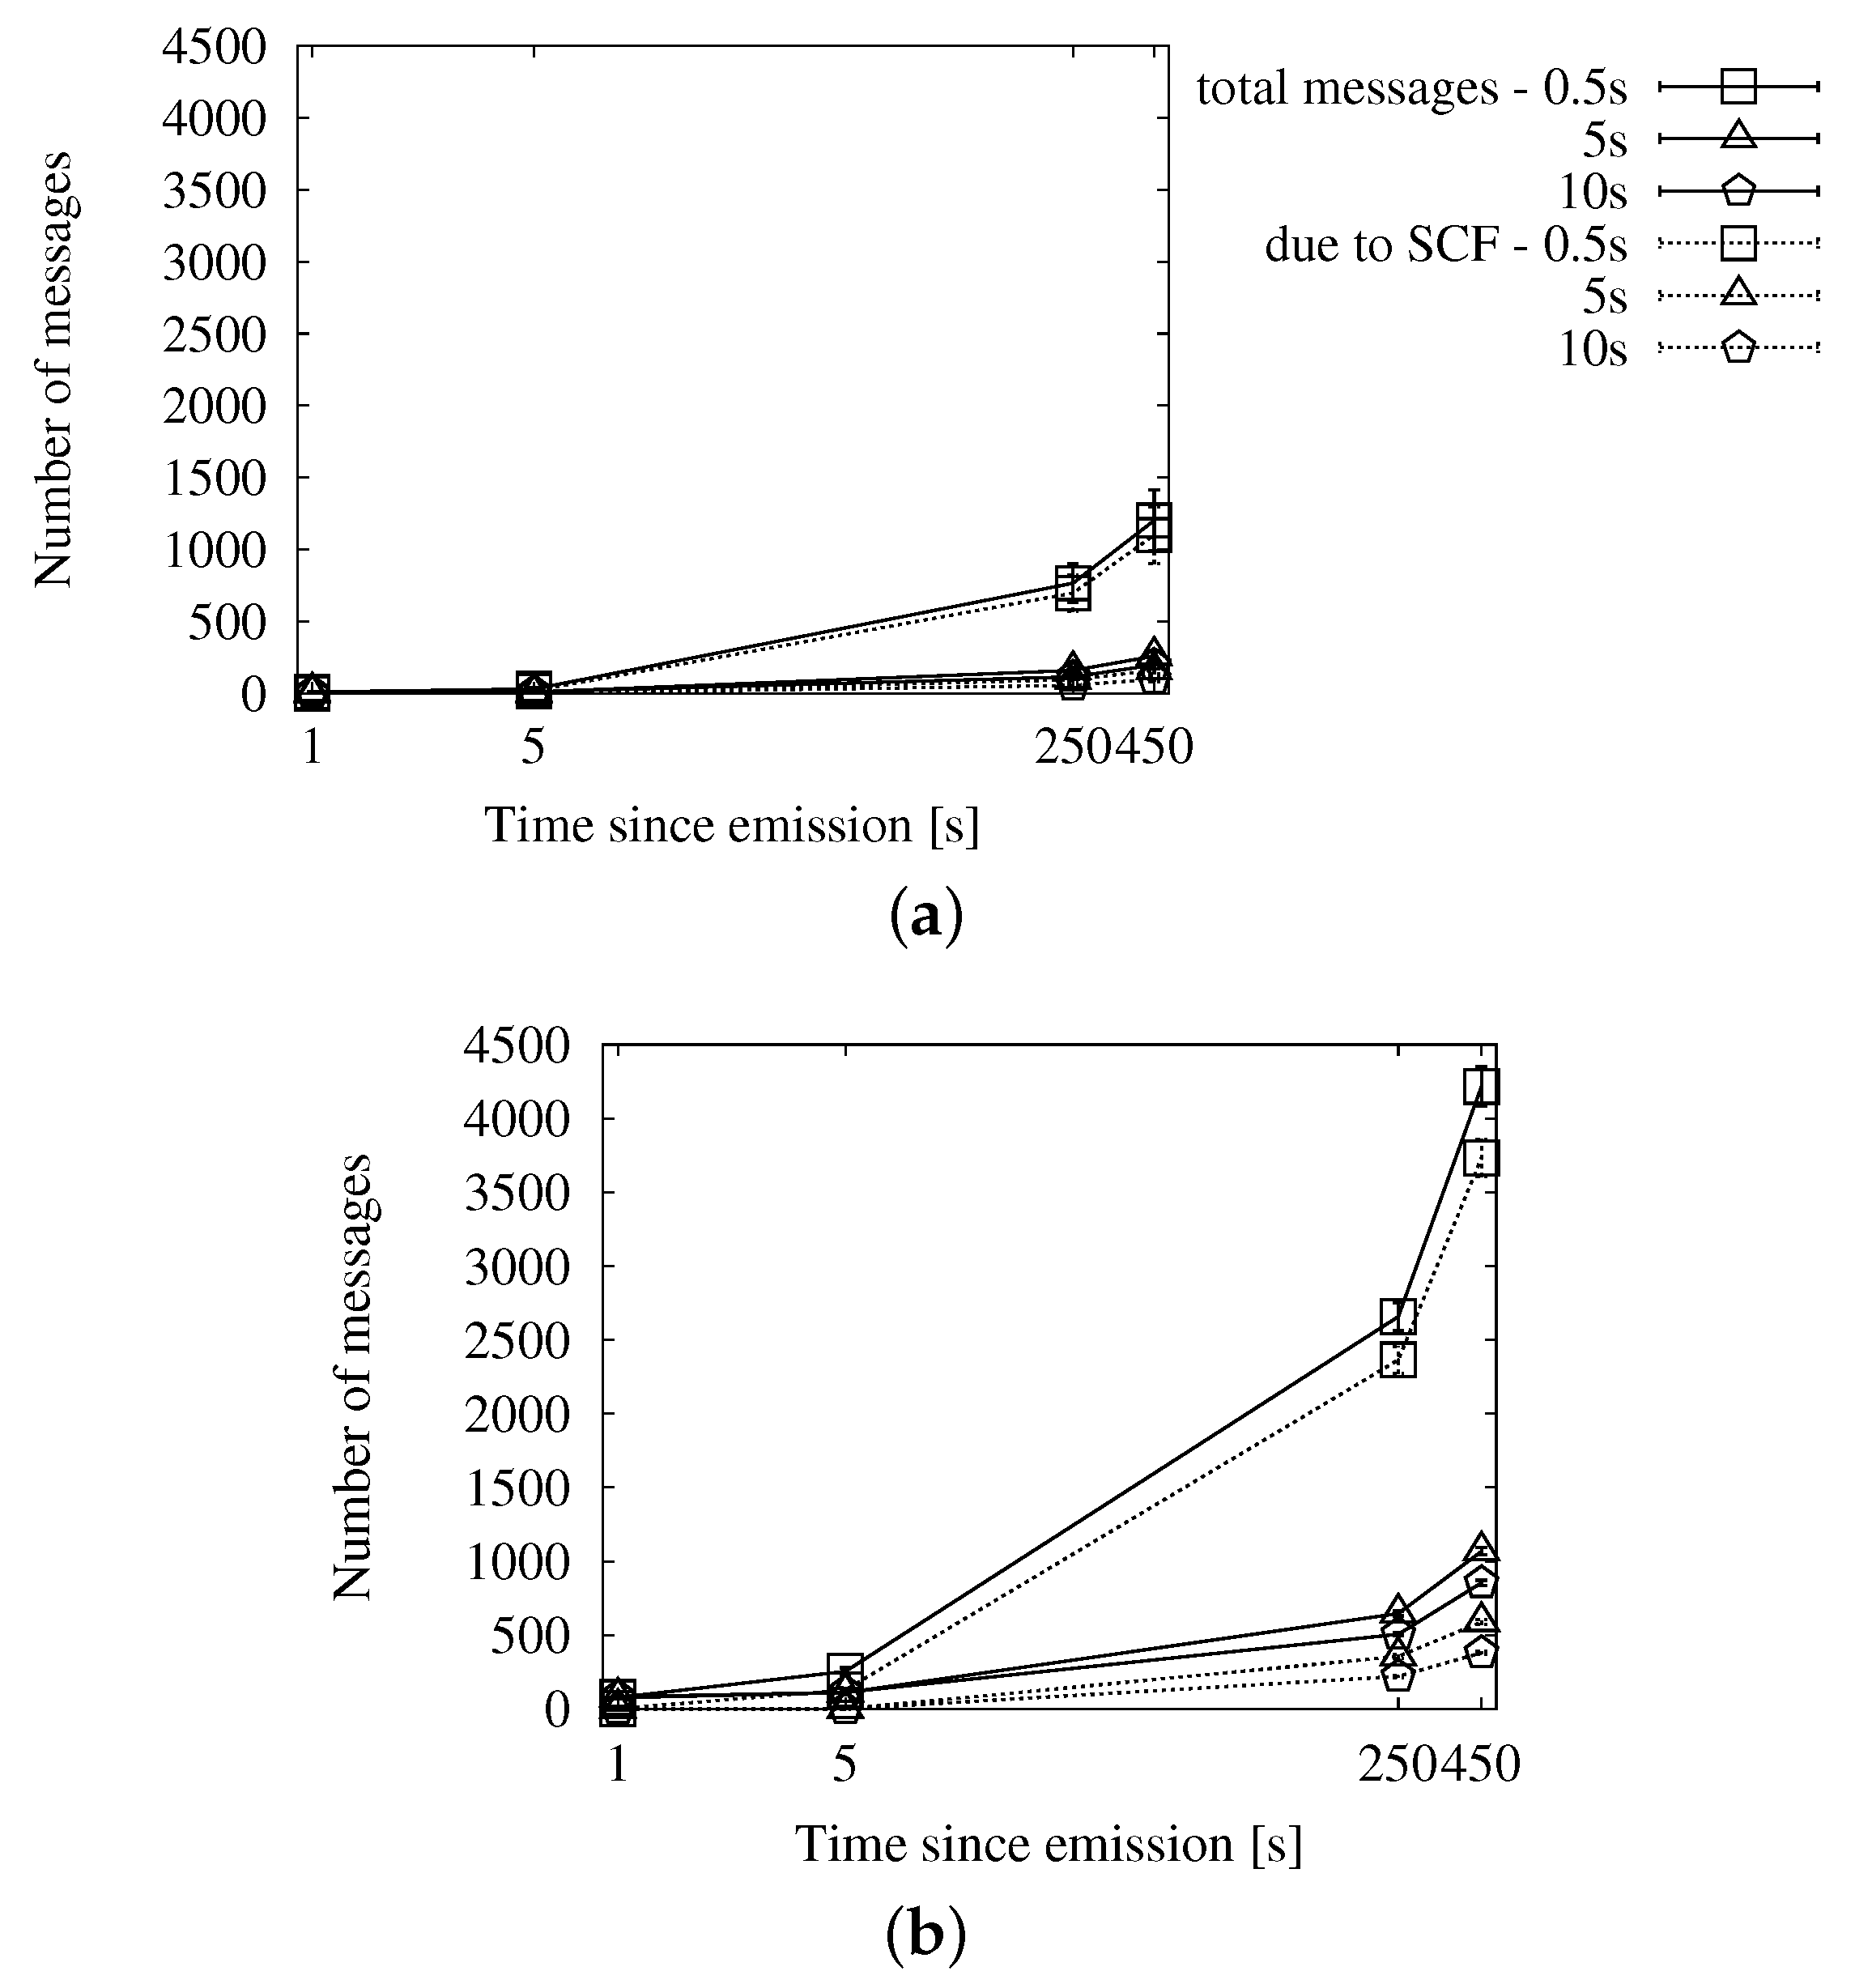
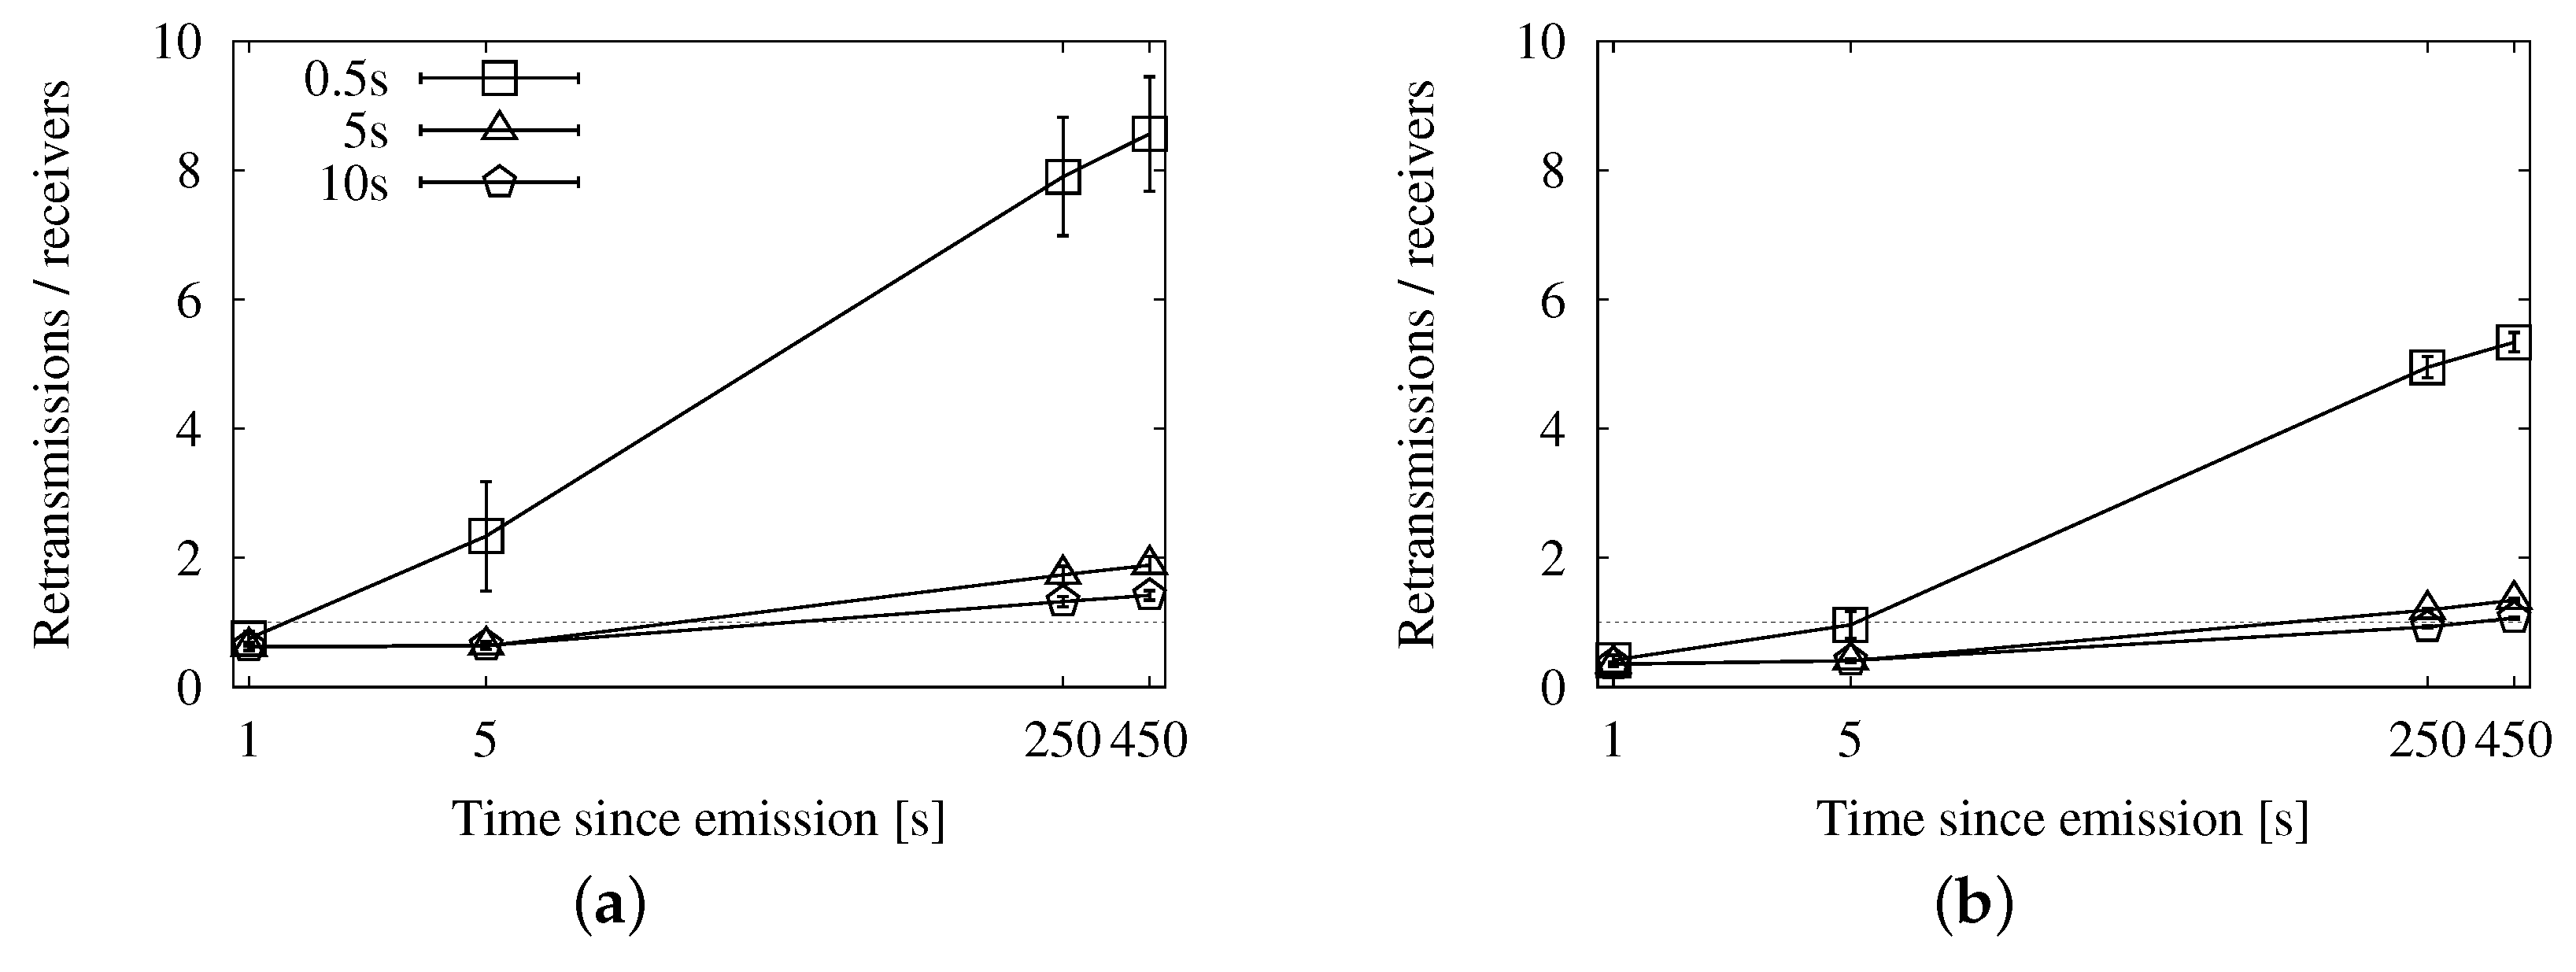
4.3.3. Comparative Evaluation of the Store-Carry-Forward Strategies
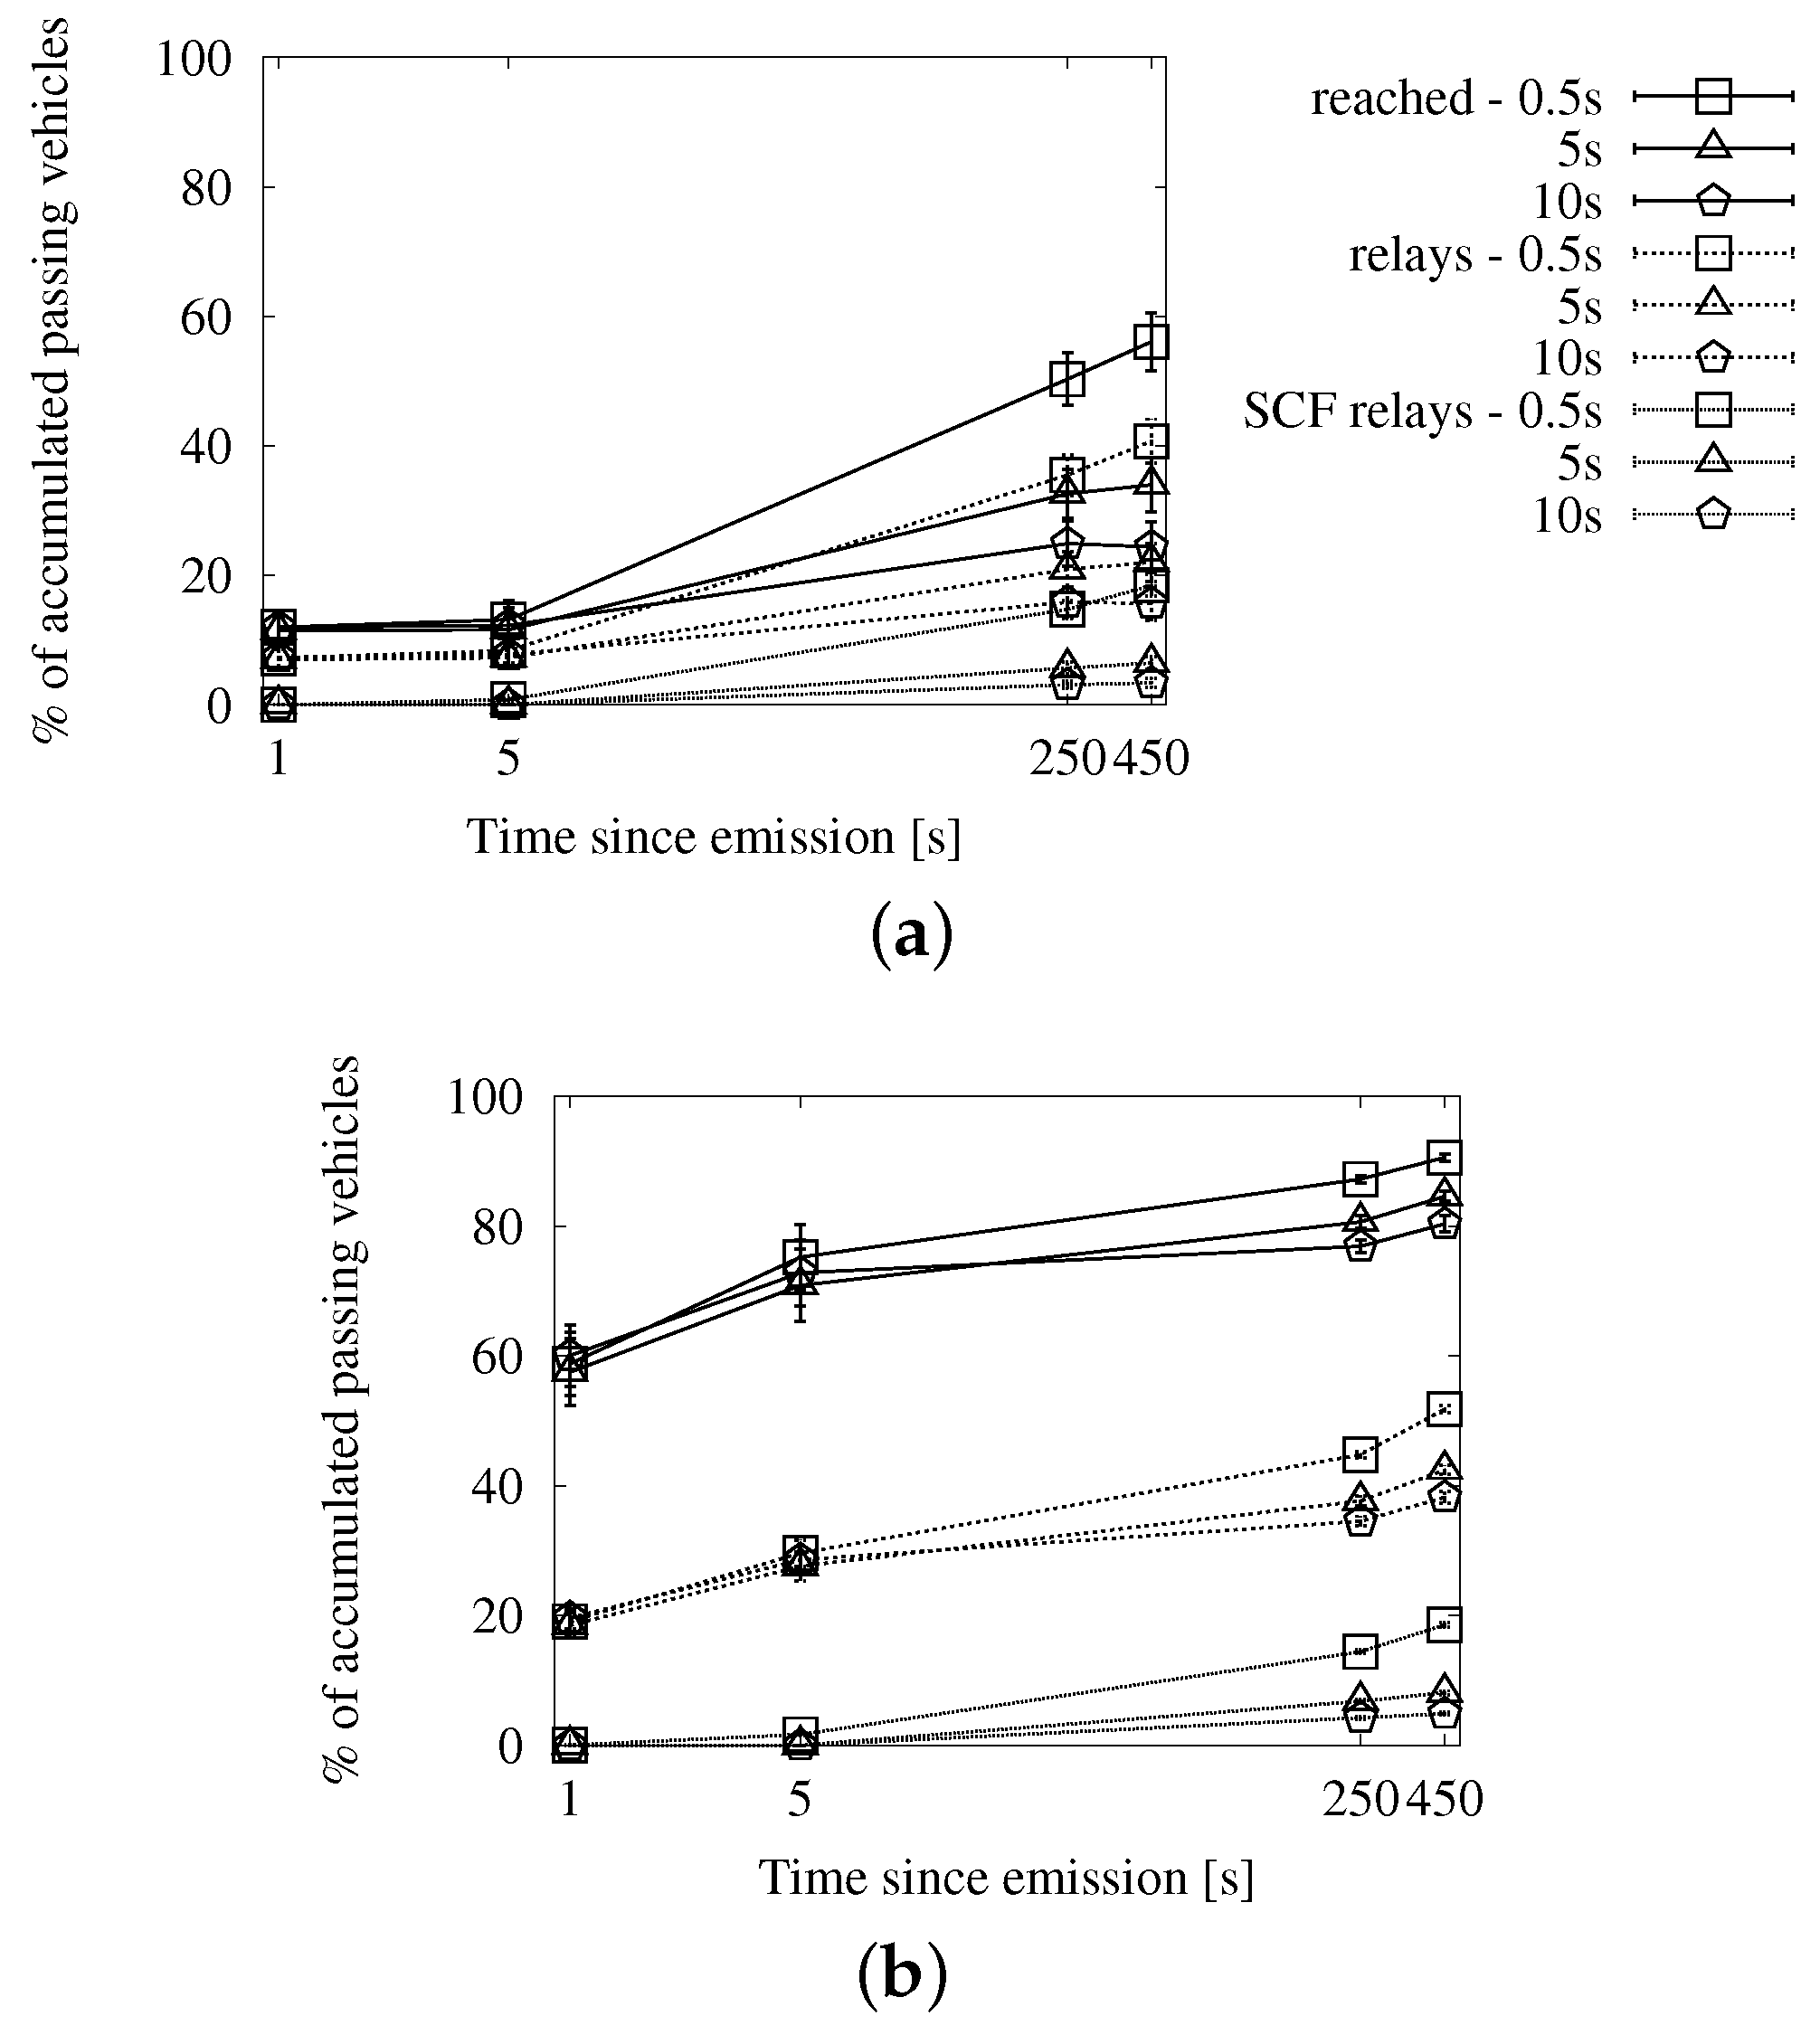
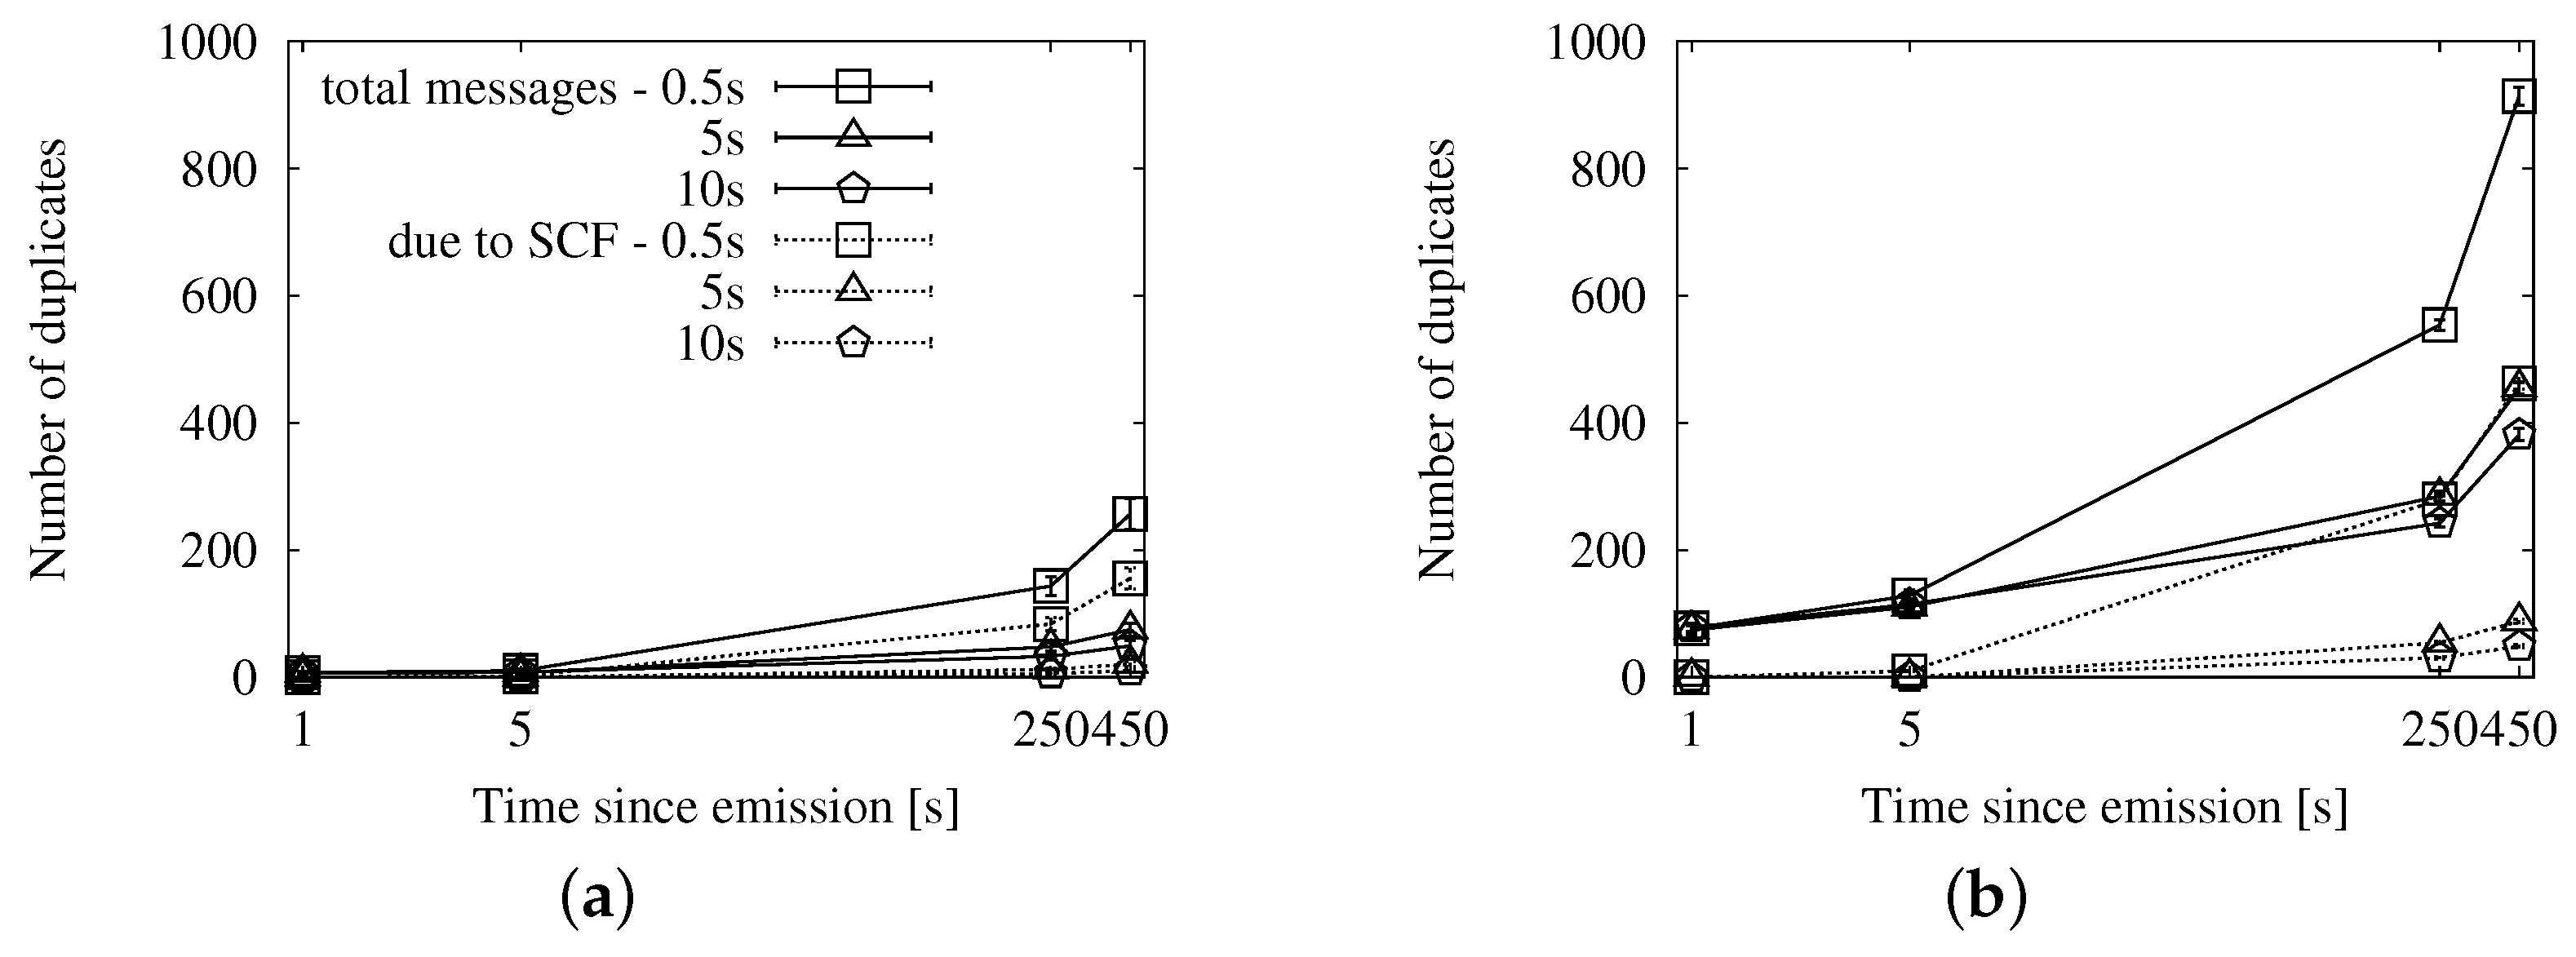
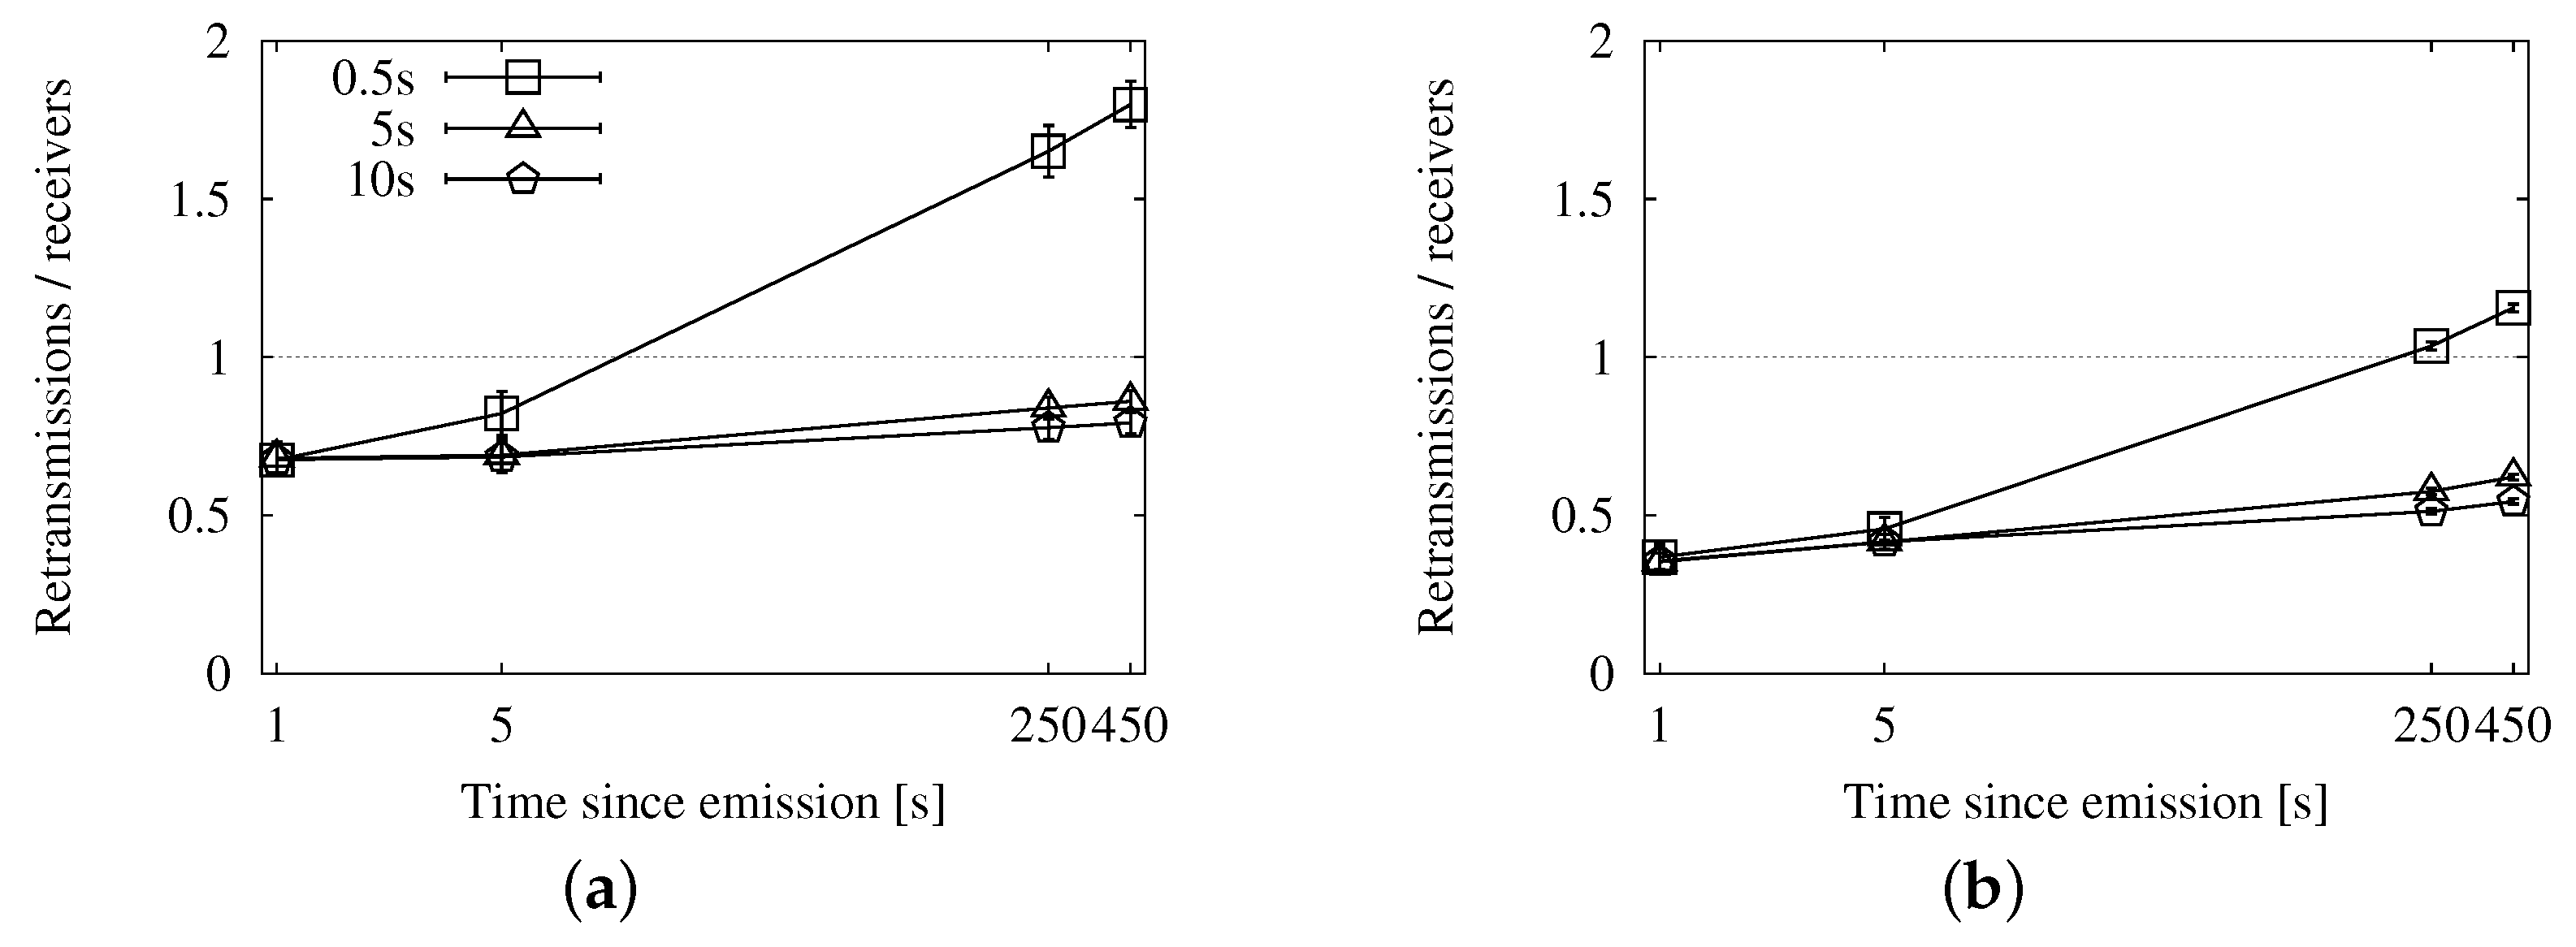
Speed-Adaptive Approach
Fixed Interval Approach
Map Polling Approach
Comprehensive Comparison
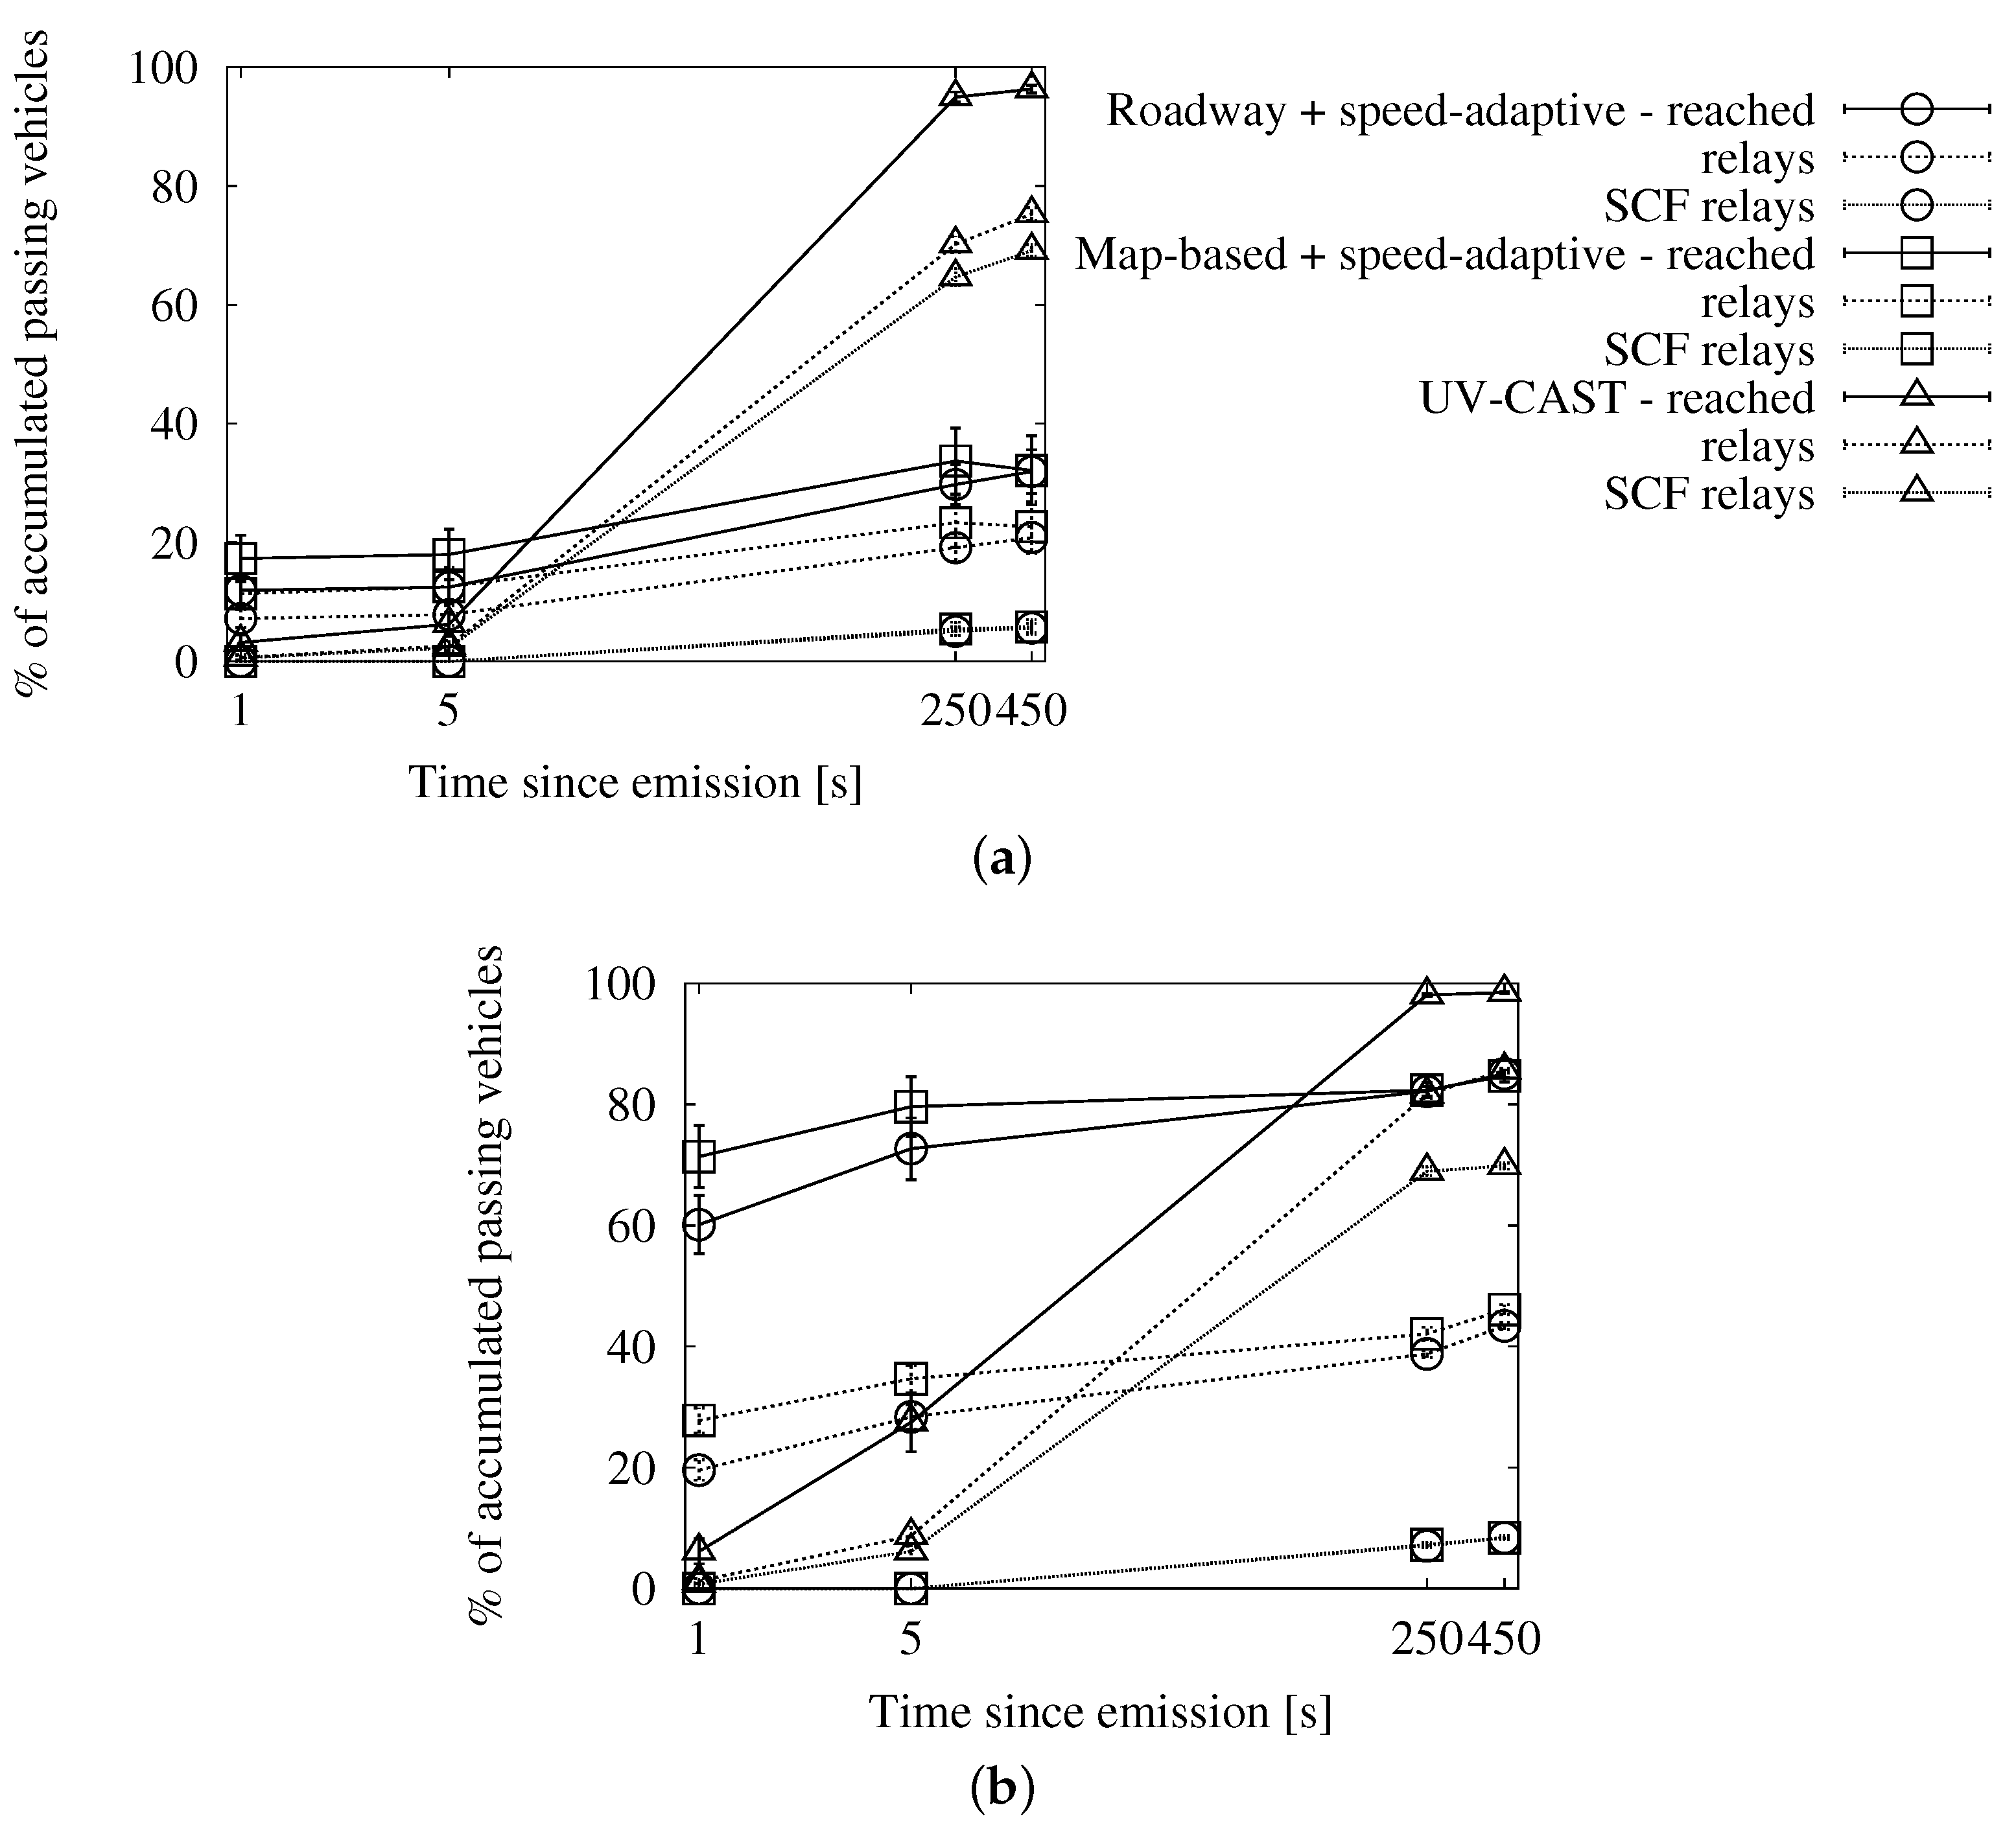
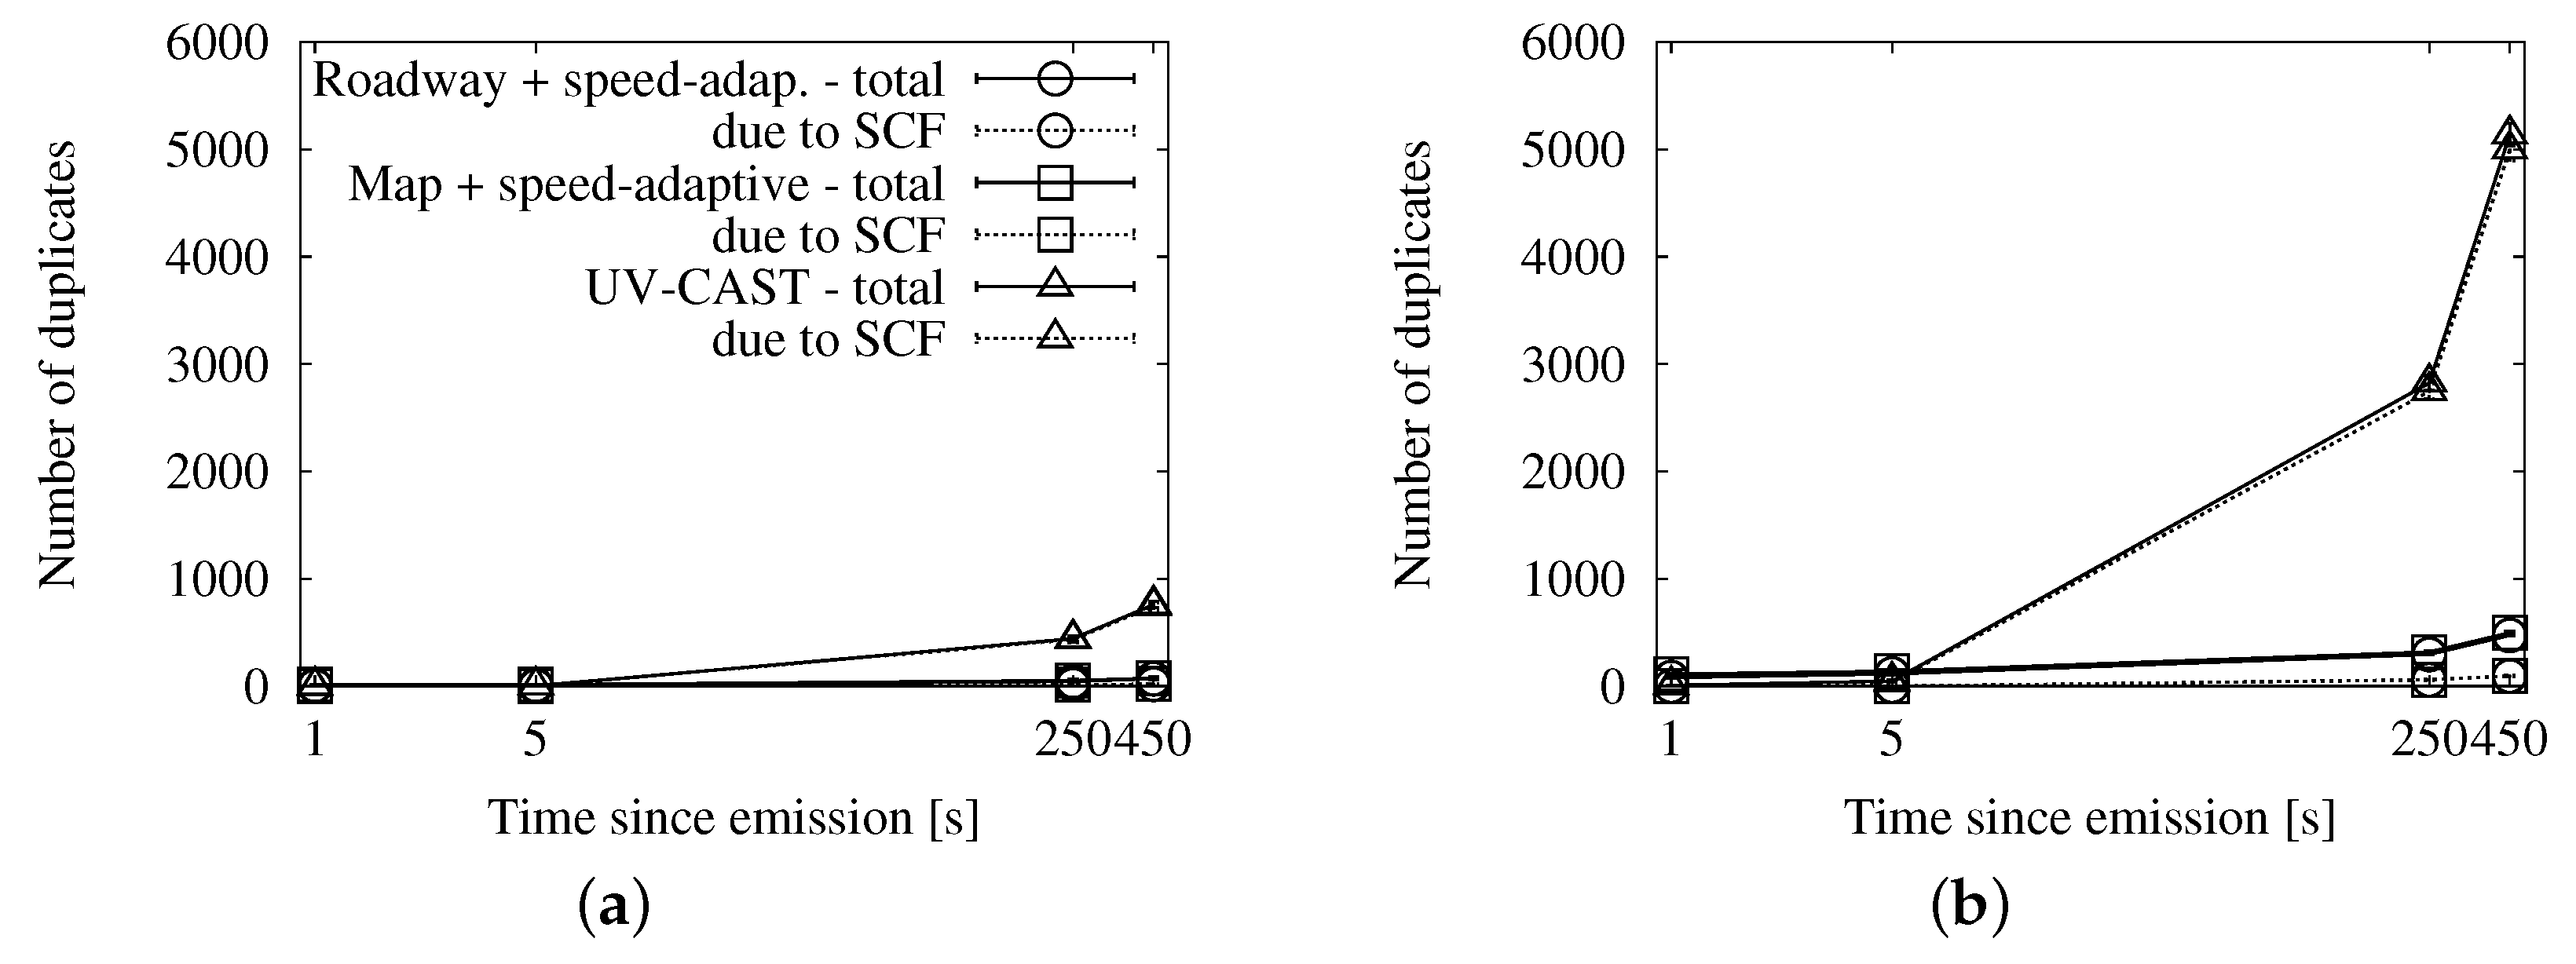
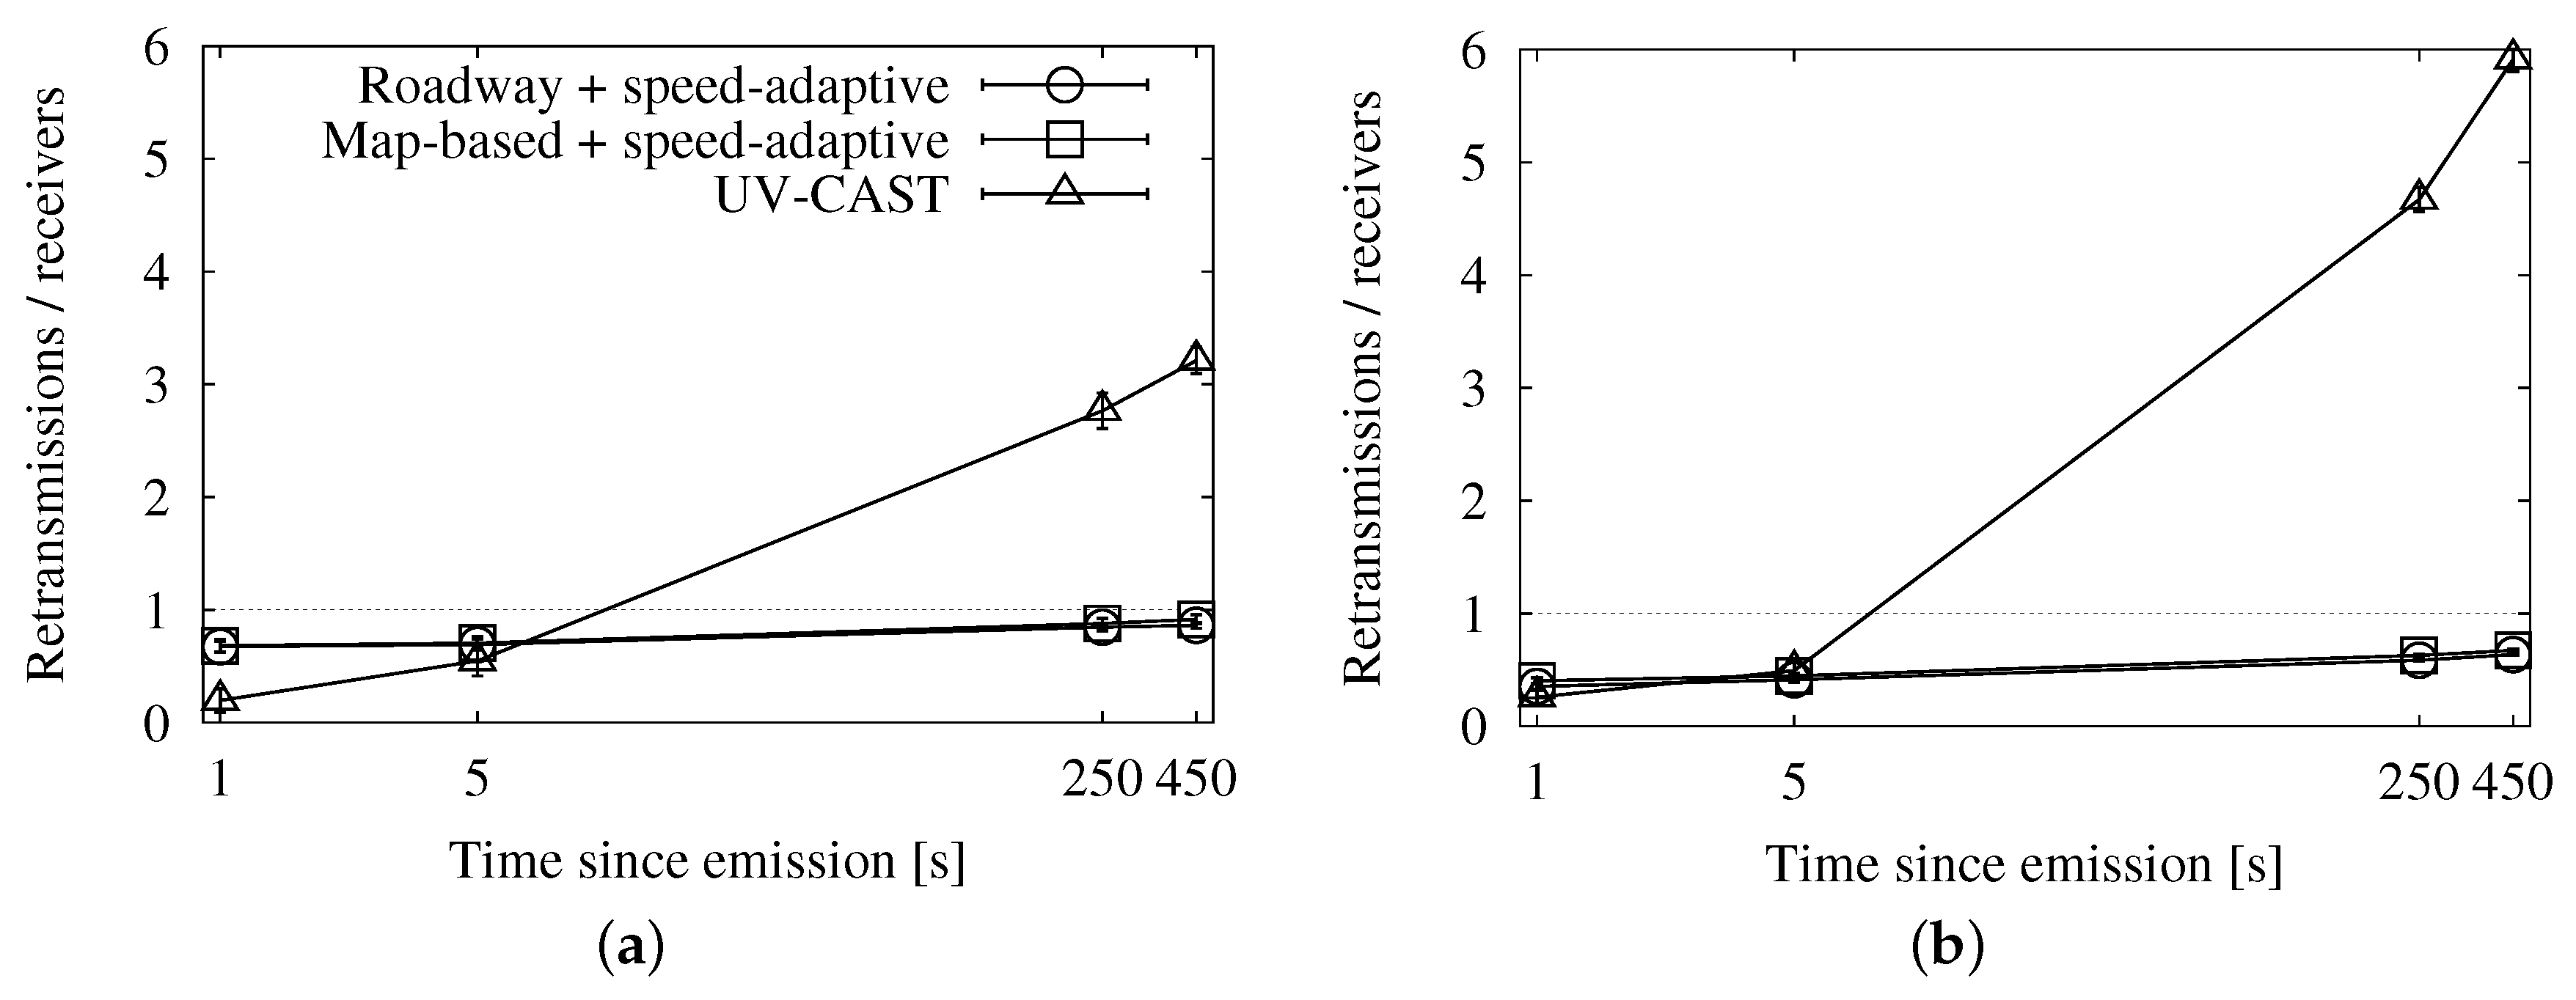
4.3.4. Comparison with UV-CAST
5. Conclusions
Acknowledgments
Author Contributions
Conflicts of Interest
References
- Schoch, E.; Kargl, F.; Weber, M.; Leinmuller, T. Communication patterns in VANETs. IEEE Commun. Mag. 2008, 46, 119–125. [Google Scholar] [CrossRef]
- Viriyasitavat, W.; Tonguz, O.; Bai, F. Network connectivity of VANETs in urban areas. In Proceedings of the 6th Annual IEEE Communications Society Conference on Sensor, Mesh and Ad Hoc Communications and Networks (SECON’09), Rome, Italy, 22–26 June 2009; pp. 1–9.
- Viriyasitavat, W.; Tonguz, O.; Bai, F. UV-CAST: An urban vehicular broadcast protocol. IEEE Commun. Mag. 2011, 49, 116–124. [Google Scholar] [CrossRef]
- Chen, R.; Jin, W.L.; Regan, A. Broadcasting safety information in vehicular networks: Issues and approaches. IEEE Netw. 2010, 24, 20–25. [Google Scholar] [CrossRef]
- Intelligent Transport Systems (ITS); Vehicular communications; GeoNetworking; Part 4: Geographical addressing and forwarding for point-to-point and point-to-multipoint communications; Sub-part 1: Media-Independent Functionality; European Standard EN 302 636-4-1, V1.2.1; ETSI: Sophia Antipolis, France, 2014.
- Korkmaz, G.; Ekici, E.; Ozguner, F. Black-burst-based multihop broadcast protocols for vehicular networks. IEEE Trans. Veh. Technol. 2007, 56, 3159–3167. [Google Scholar] [CrossRef]
- Tonguz, O.; Wisitpongphan, N.; Bai, F. DV-CAST: A distributed vehicular broadcast protocol for vehicular ad hoc networks. IEEE Wirel. Commun. 2010, 17, 47–57. [Google Scholar] [CrossRef]
- Salvo, P.; De Felice, M.; Cuomo, F.; Baiocchi, A. Infotainment traffic flow dissemination in an urban VANET. In Proceedings of the 2012 IEEE Global Communications Conference (GLOBECOM), Anaheim, CA, USA, 3–7 December 2012; pp. 67–72.
- Ros, F.; Ruiz, P.; Stojmenovic, I. Acknowledgment-based broadcast protocol for reliable and efficient data dissemination in vehicular ad hoc networks. IEEE Trans. Mob. Comput. 2012, 11, 33–46. [Google Scholar] [CrossRef]
- Fogue, M.; Garrido, P.; Martinez, F.J.; Cano, J.C.; Calafate, C.T.; Manzoni, P. Evaluating the impact of a novel message dissemination scheme for vehicular networks using real maps. Transp. Res. C Emerg. Technol. 2012, 25, 61–80. [Google Scholar] [CrossRef]
- Garcia-Lozano, E.; Campo, C.; Garcia-Rubio, C.; Cortes-Martin, A.; Rodriguez-Carrion, A.; Noriega-Vivas, P. A bandwidth-efficient service for local information dissemination in sparse to dense roadways. Sensors 2013, 13, 8612–8639. [Google Scholar] [CrossRef] [PubMed]
- Garcia-Lozano, E.; Campo, C.; Garcia-Rubio, C.; Cortes-Martin, A. Bandwidth-efficient techniques for information dissemination in urban vehicular networks. In Proceedings of the 11th ACM Symposium on Performance Evaluation of Wireless Ad Hoc, Sensor and Ubiquitous Networks (PE-WASUN 2014), Montreal, QC, Canada, 21 September 2014; pp. 61–68.
- Garcia-Lozano, E.; Campo, C.; Garcia-Rubio, C.; Rodriguez-Carrion, A. Adapting a bandwidth-efficient information dissemination scheme for urban VANETs. In Proceedings of the 9th International Symposium on Ubiquitous Computing and Ambient Intelligence (UCAmI 2015), Puerto Varas, Chile, 1–4 December 2015; pp. 72–83.
- Sommer, C.; German, R.; Dressler, F. Bidirectionally coupled network and road traffic simulation for improved IVC analysis. IEEE Trans. Mob. Comput. 2011, 10, 3–15. [Google Scholar] [CrossRef]
- OpenStreetMap. Available online: http://www.openstreetmap.org (accessed on 28 April 2016).
- Krajzewicz, D.; Erdmann, J.; Behrisch, M.; Bieker, L. Recent development and applications of SUMO—Simulation of Urban MObility. Int. J. Adv. Syst. Meas. 2012, 5, 128–138. [Google Scholar]
- OMNeT. Available online: http://www.omnetpp.org (accessed on 28 April 2016).
- Sommer, C.; Eckhoff, D.; German, R.; Dressler, F. A computationally inexpensive empirical model of IEEE 802.11p radio shadowing in urban environments. In Proceedings of the 8th IEEE/IFIP Conference on Wireless On demand Network Systems and Services (WONS), Bardonecchia, Italy, 26–28 January 2011; pp. 84–90.
- Baguena, M.; Tornell, S.; Torres, A.; Calafate, C.; Cano, J.C.; Manzoni, P. VACaMobil: VANET car mobility manager for OMNeT++. In Proceedings of the 2013 IEEE International Conference on Communications Workshops (ICC), Budapest, Hungary, 9–13 June 2013; pp. 1057–1061.
- Brakemeier, A. White Paper on Network Design Limits and VANET Performance (V0.6); Technical Report; Car 2 Car Communication Consortium (C2C-CC): Braunschweig, Germany, 2009. [Google Scholar]


| Goal | Relay Selection | ACKed | Junction Detection | Store-Carry-Forward | Needs Infrastructure | Needs Beacons | |
|---|---|---|---|---|---|---|---|
| UMB, 2007 | fast | distance-based | hand-shake | digital map | no | yes | no |
| UV-CAST, 2011 | efficient, resilient to disconnections | distance-based | in beacons | digital map | yes | no | yes |
| TAF, 2012 | efficient | distance-based | no | reception angles | no | no | no |
| ABSM, 2012 | reliable, efficient | clustering (CDS construction) | in beacons | - | yes | no | yes |
| eMDR, 2012 | fast | location-based + distance thresholds | no | digital map | no | no | yes |
| Parameter | Value |
|---|---|
| MAC | 802.11p |
| Frequency band (10 MHz channel) | 5.900 GHz |
| Propagation model | Simple Obstacle Shadowing |
| Transmission power | 1 W |
| Sensitivity | −77 dBm |
| SNR | 13 dBm |
| Thermal noise | −104 dBm |
| LOS communication range (r) | 232 m |
| Modulation | QPSK |
| Bitrate | 6 Mbps |
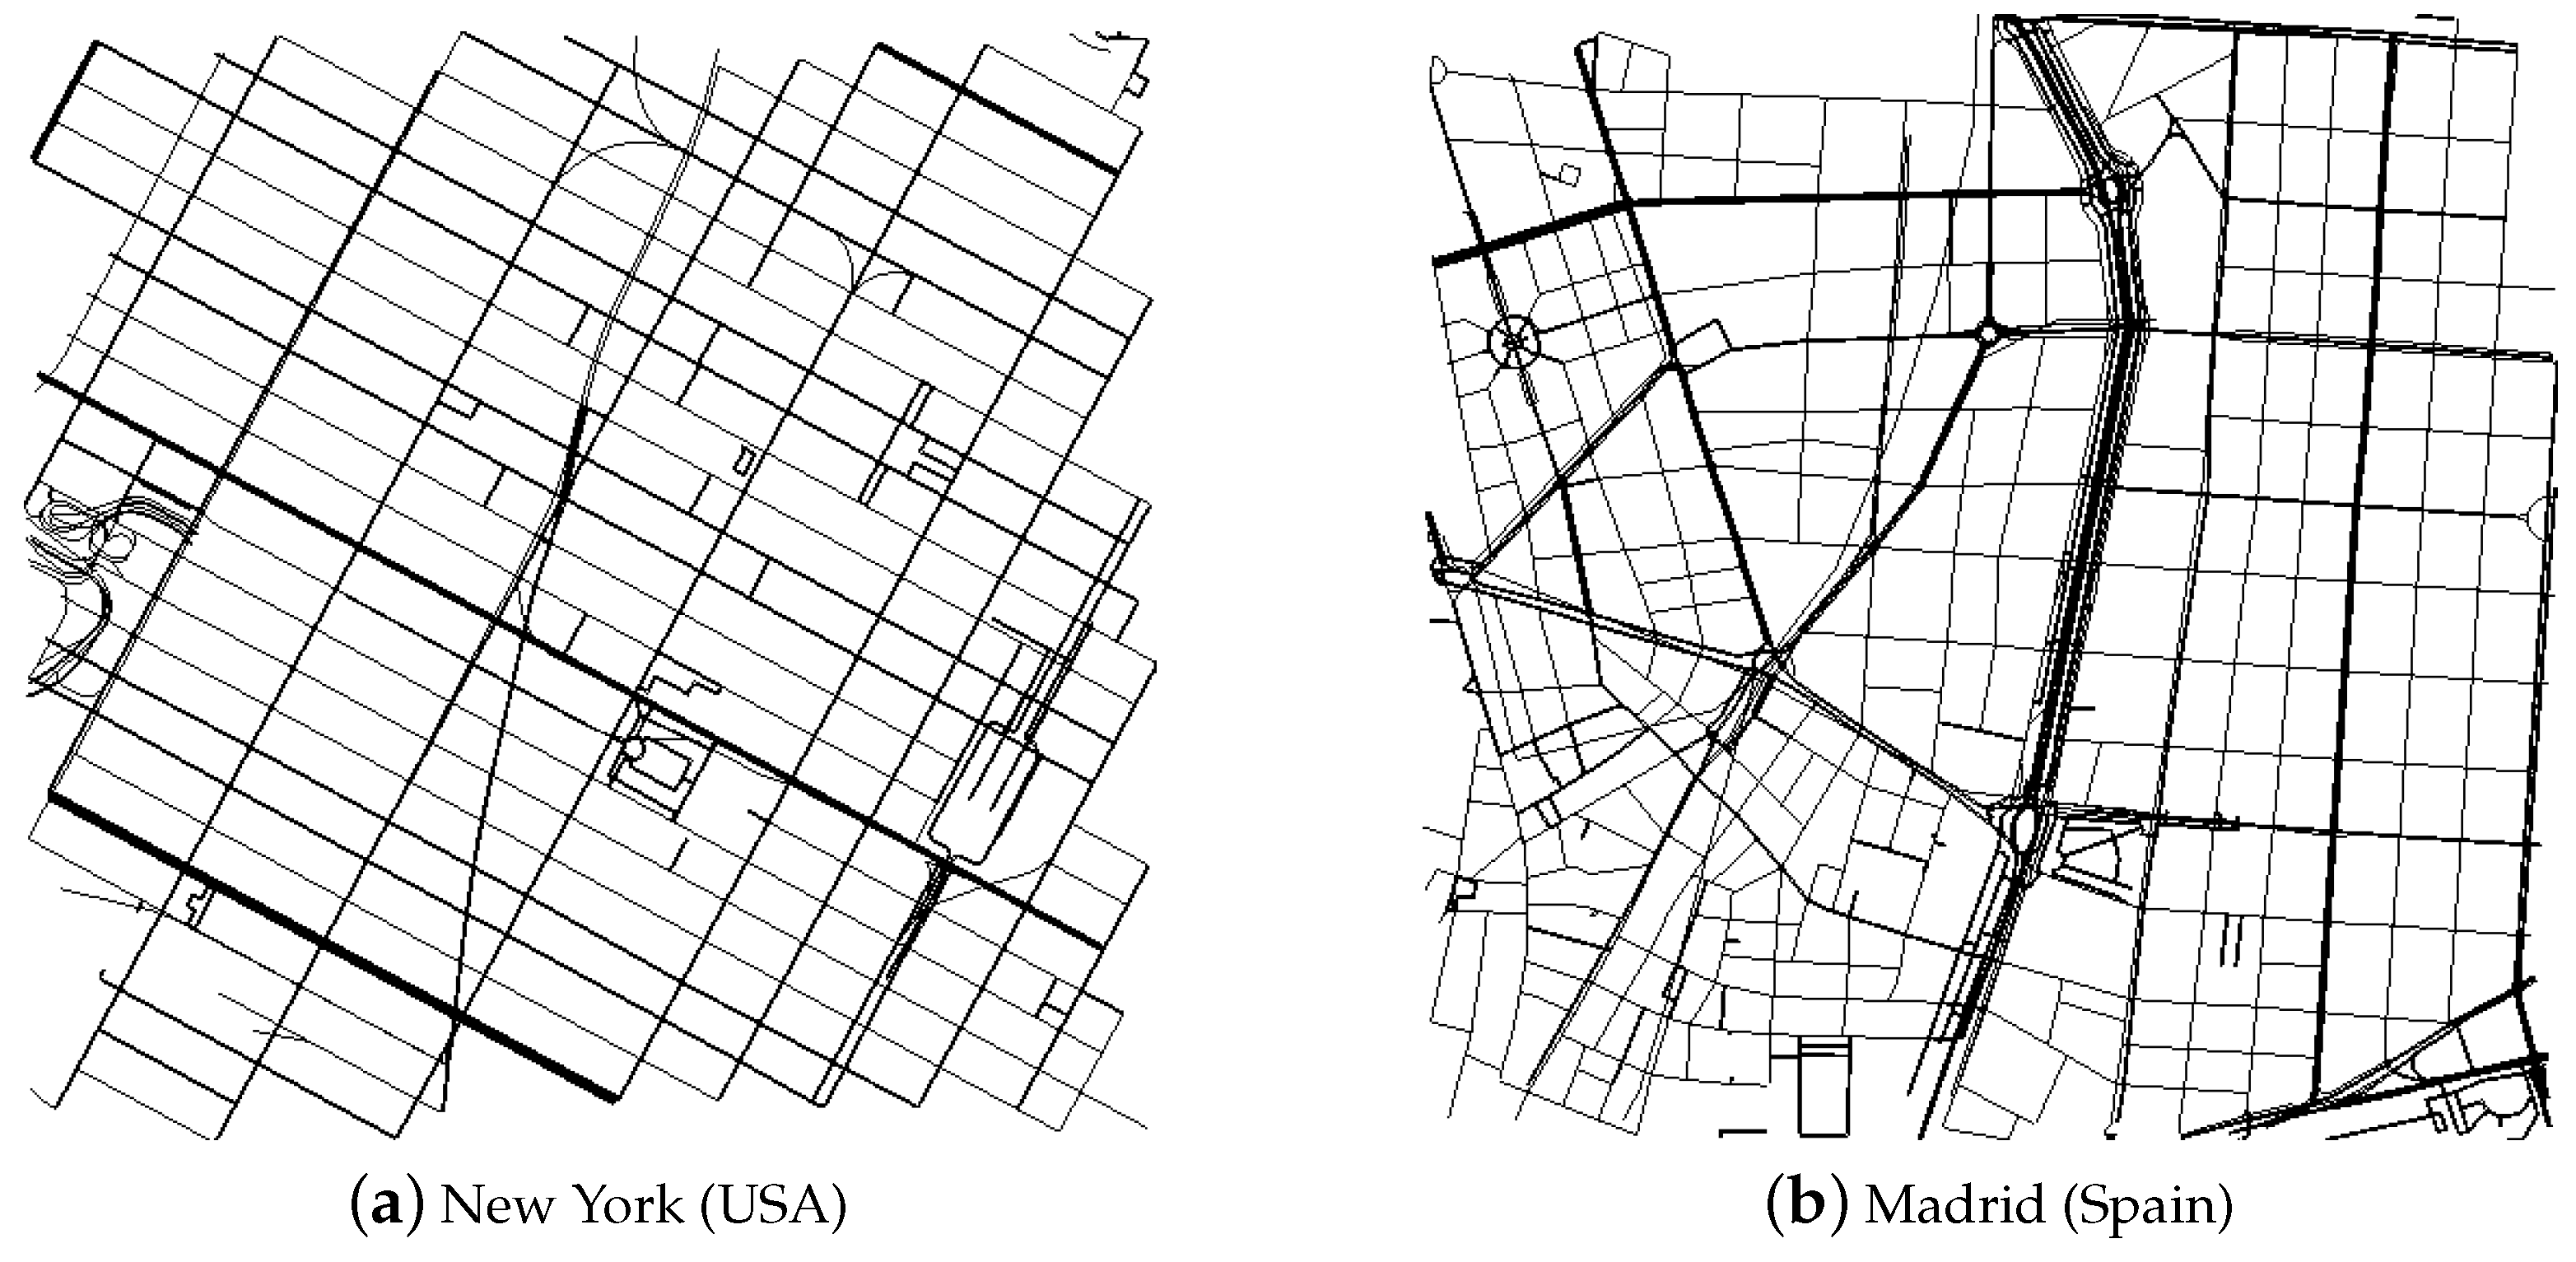
| City | Minimum | Median | Maximum |
|---|---|---|---|
| New York | 2.34 m | 9.89 m | 49.69 m |
| Madrid | 2.56 m | 9.24 m | 45.09 m |
| Rome | 2.29 m | 9.64 m | 81.62 m |
| Cologne | 2.31 m | 9.61 m | 77.80 m |
© 2016 by the authors; licensee MDPI, Basel, Switzerland. This article is an open access article distributed under the terms and conditions of the Creative Commons Attribution (CC-BY) license (http://creativecommons.org/licenses/by/4.0/).
Share and Cite
Garcia-Lozano, E.; Campo, C.; Garcia-Rubio, C.; Rodriguez-Carrion, A. A Bandwidth-Efficient Dissemination Scheme of Non-Safety Information in Urban VANETs. Sensors 2016, 16, 988. https://doi.org/10.3390/s16070988
Garcia-Lozano E, Campo C, Garcia-Rubio C, Rodriguez-Carrion A. A Bandwidth-Efficient Dissemination Scheme of Non-Safety Information in Urban VANETs. Sensors. 2016; 16(7):988. https://doi.org/10.3390/s16070988
Chicago/Turabian StyleGarcia-Lozano, Estrella, Celeste Campo, Carlos Garcia-Rubio, and Alicia Rodriguez-Carrion. 2016. "A Bandwidth-Efficient Dissemination Scheme of Non-Safety Information in Urban VANETs" Sensors 16, no. 7: 988. https://doi.org/10.3390/s16070988