1. Introduction
High
-g accelerometers are one of the most important inertial devices [
1,
2,
3,
4] and have been widely applied to measuring dynamic impact and high-speed motion during overload, especially in the field of inertia measurement and automatic control [
5,
6,
7]. Calibrations in amplitude and dynamic sensitivity for accelerometers have been reported by Bateman
et al. and Lee
et al. [
8,
9,
10,
11]. Bateman
et al. suggested that the key factors affecting the dynamic performance of accelerometers are amplitude linearity and frequency characteristics [
8,
9,
10], and they also experimentally discussed performance characteristics including time-domain amplitude linearity, which reflects the relationship between the sensitivity of the sensor, the acceleration amplitude, and frequency-domain characteristics of a model 7280 A Endevco accelerometer. The calibration data shown in their papers matched frequency- and time-domain requirements. The frequency-domain requirement imposed a frequency response that was flat to within ±5% across the frequency range of interest, and the time domain requirement is that, if the sensitivity is based upon the low amplitude vibration calibration, it is critical that the linearity characteristics of the shock-based “Amplitude Linearity” be understood such that an amplitude measurement uncertainty is clearly defined [
9,
11,
12,
13,
14]. However, they did not realize the importance of dynamic linearity for an accelerometer, which is rarely researched but is especially important for accelerometer calibration [
15,
16,
17,
18]. In [
13], Akira Umeda described the dynamic linearity as being “used to represent the relationship between the sensor input value, output value, and frequency, which reflects the relationship between the sensor range and the working frequency band.” In accordance with the linear superposition principle of a one-dimensional stress wave, Umeda put forward the principle of the dynamic linear test [
13]. In this study, for the first time, a novel method for calibrating the dynamic linearity of an accelerometer based on a dual-warhead Hopkinson bar was developed. Firstly, we theoretically determined the dynamic linearity with the output of the accelerometer. We then setup the dual-warhead Hopkinson bar experiment to experimentally confirm these findings and conclude that the dynamic linearity of the dual-warhead Hopkinson bar is 2.5% without a high
-g piezoresistive accelerometer. Based on the experiment, the dynamic linearity of the high
-g piezoresistive accelerometer was found to be 3.88%.
2. The Principle of Dynamic Linearity Measurement
Firstly, it is known that a linear system has the property listed below:
If the inputs are X1(t) and X2(t) and the corresponding outputs are recorded as Y1(t) and Y2(t), respectively, then, when the input is aX1(t) + bX2(t), the output is Y1+2(t), namely, aY1(t) + bY2(t), where a and b are constants.
In fact, considering the errors of the system, the dynamic linearity of the system σ is given by the following equation:
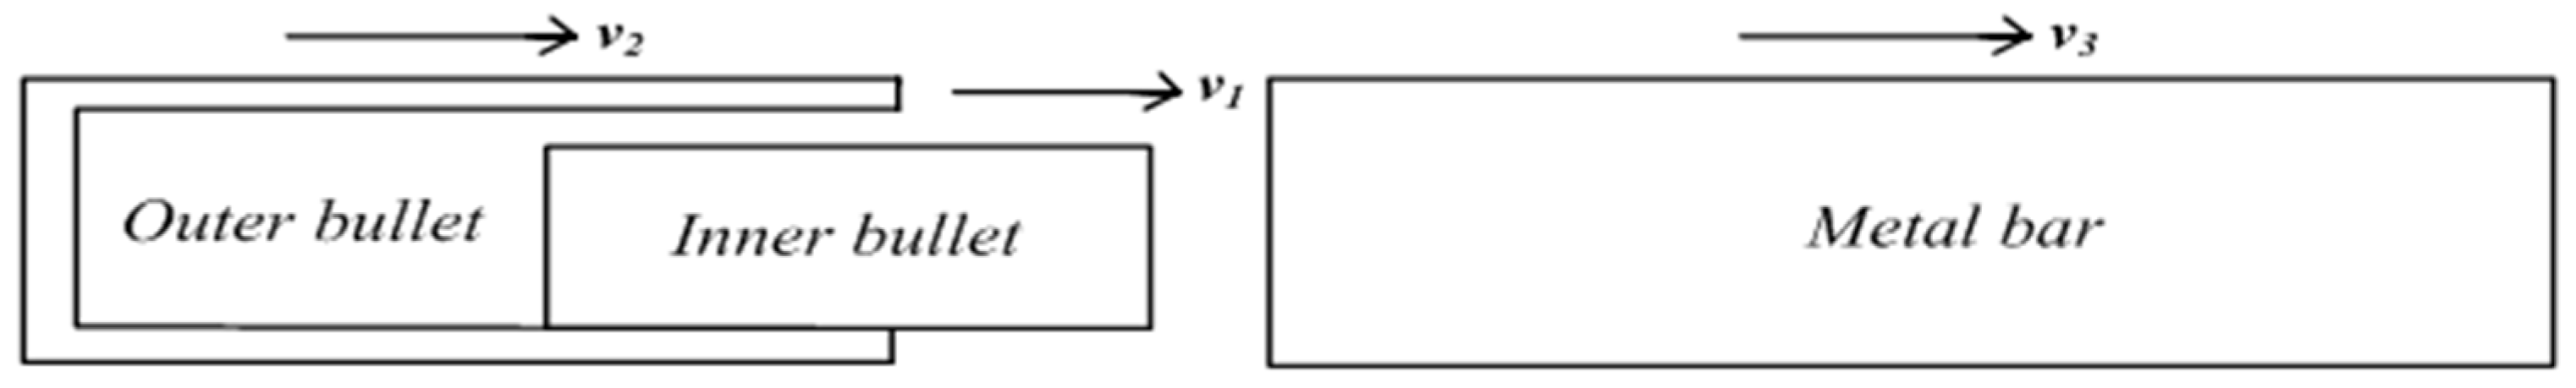
It is believed that the one-dimensional stress wave theory can be used under the condition that the propagation pulse wavelength is at least 6–10 times longer than that of the diameter of a bar, shown in
Figure 1 [
19]. The velocity of the stress wave propagation in Hopkinson bar is given by the following equation [
20,
21]:
where
c,
E,
ρ,
r,
R, and
λ with the values of 5010 m/s, 113 GPa, 4.5 g/cm
3, 0.3, and 15 mm represent stress wave velocity, elastic modulus, density, Poisson ratio, the bar radius, and the stress wave length, respectively.
The impact acceleration
a(
t) is generated at the moment
t when the reflection of the elastic pulse occurs. One-dimensional stress wave theory can be used to derive the following equation:
where
ε(
t),
C, and
a(
t) are the strain of an elastic pulse incident upon the end surface, the velocity of the elastic pulse in the bar, and the acceleration of the motion of the end surface of the bar generated during the reflection of the elastic pulse, respectively.
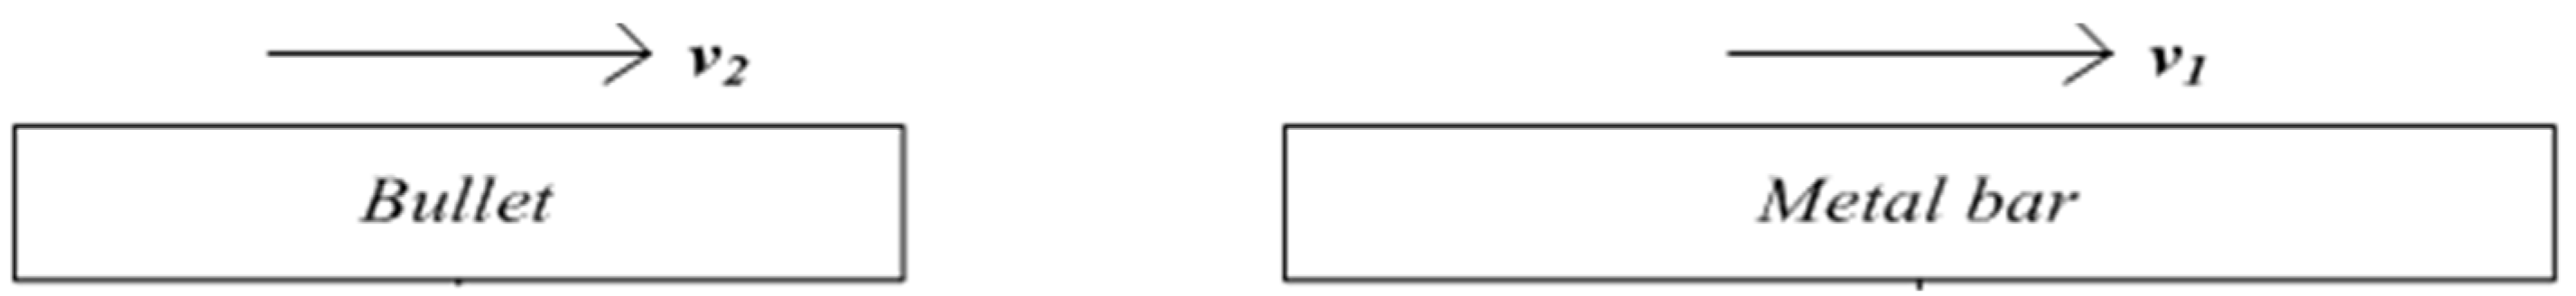
Figure 2 shows the elastic impact system comprising the inner and outer bullets and the metal bar. The inner bullet is put inside the outer one, and it is assumed that there is no interaction between the bullets except for gravity during coaxial impact. The two bullets can impact the metal bar simultaneously or separately while maintaining the same impact conditions. The incident elastic wave pulse strains of the end surface of the bar are
εin,1(
t),
εin,2(
t), and
εin,1+2(
t) when the inner bullet, outer bullet, and both, respectively, impact the bar. We define the corresponding velocities of the end surface of the bar as
vin,1(
t),
vin,2(
t), and
vin,1+2(
t), based on one-dimensional stress wave theory, and they can be given by the following [
19]:
Therefore, the corresponding impact accelerations
αin,1(
t),
αin,2(
t), and
αin,1+2(
t), which are the differentials of velocity, at the end of the surface of the bar are given by the following:
Thus, the dynamic linearity in the elastic impact system of two bullets and a metal bar is as follows:
where
aouter,
ainner, and
atotal are the output accelerations for the bar when impacted by the outer bullet, inner bullet, and both, respectively. The
aplus represents the sum of
aouter and
ainner. The
atotal represents the dynamic linearity of the impact system.
Consequently, we can obtain the dynamic linearity of the impact system and the accelerometers by directly measuring the accelerations of the bullets. We will discuss how to obtain these results later in this paper.
3. Experiment Details
The origin of the use of the Hopkinson bar for characterization of high
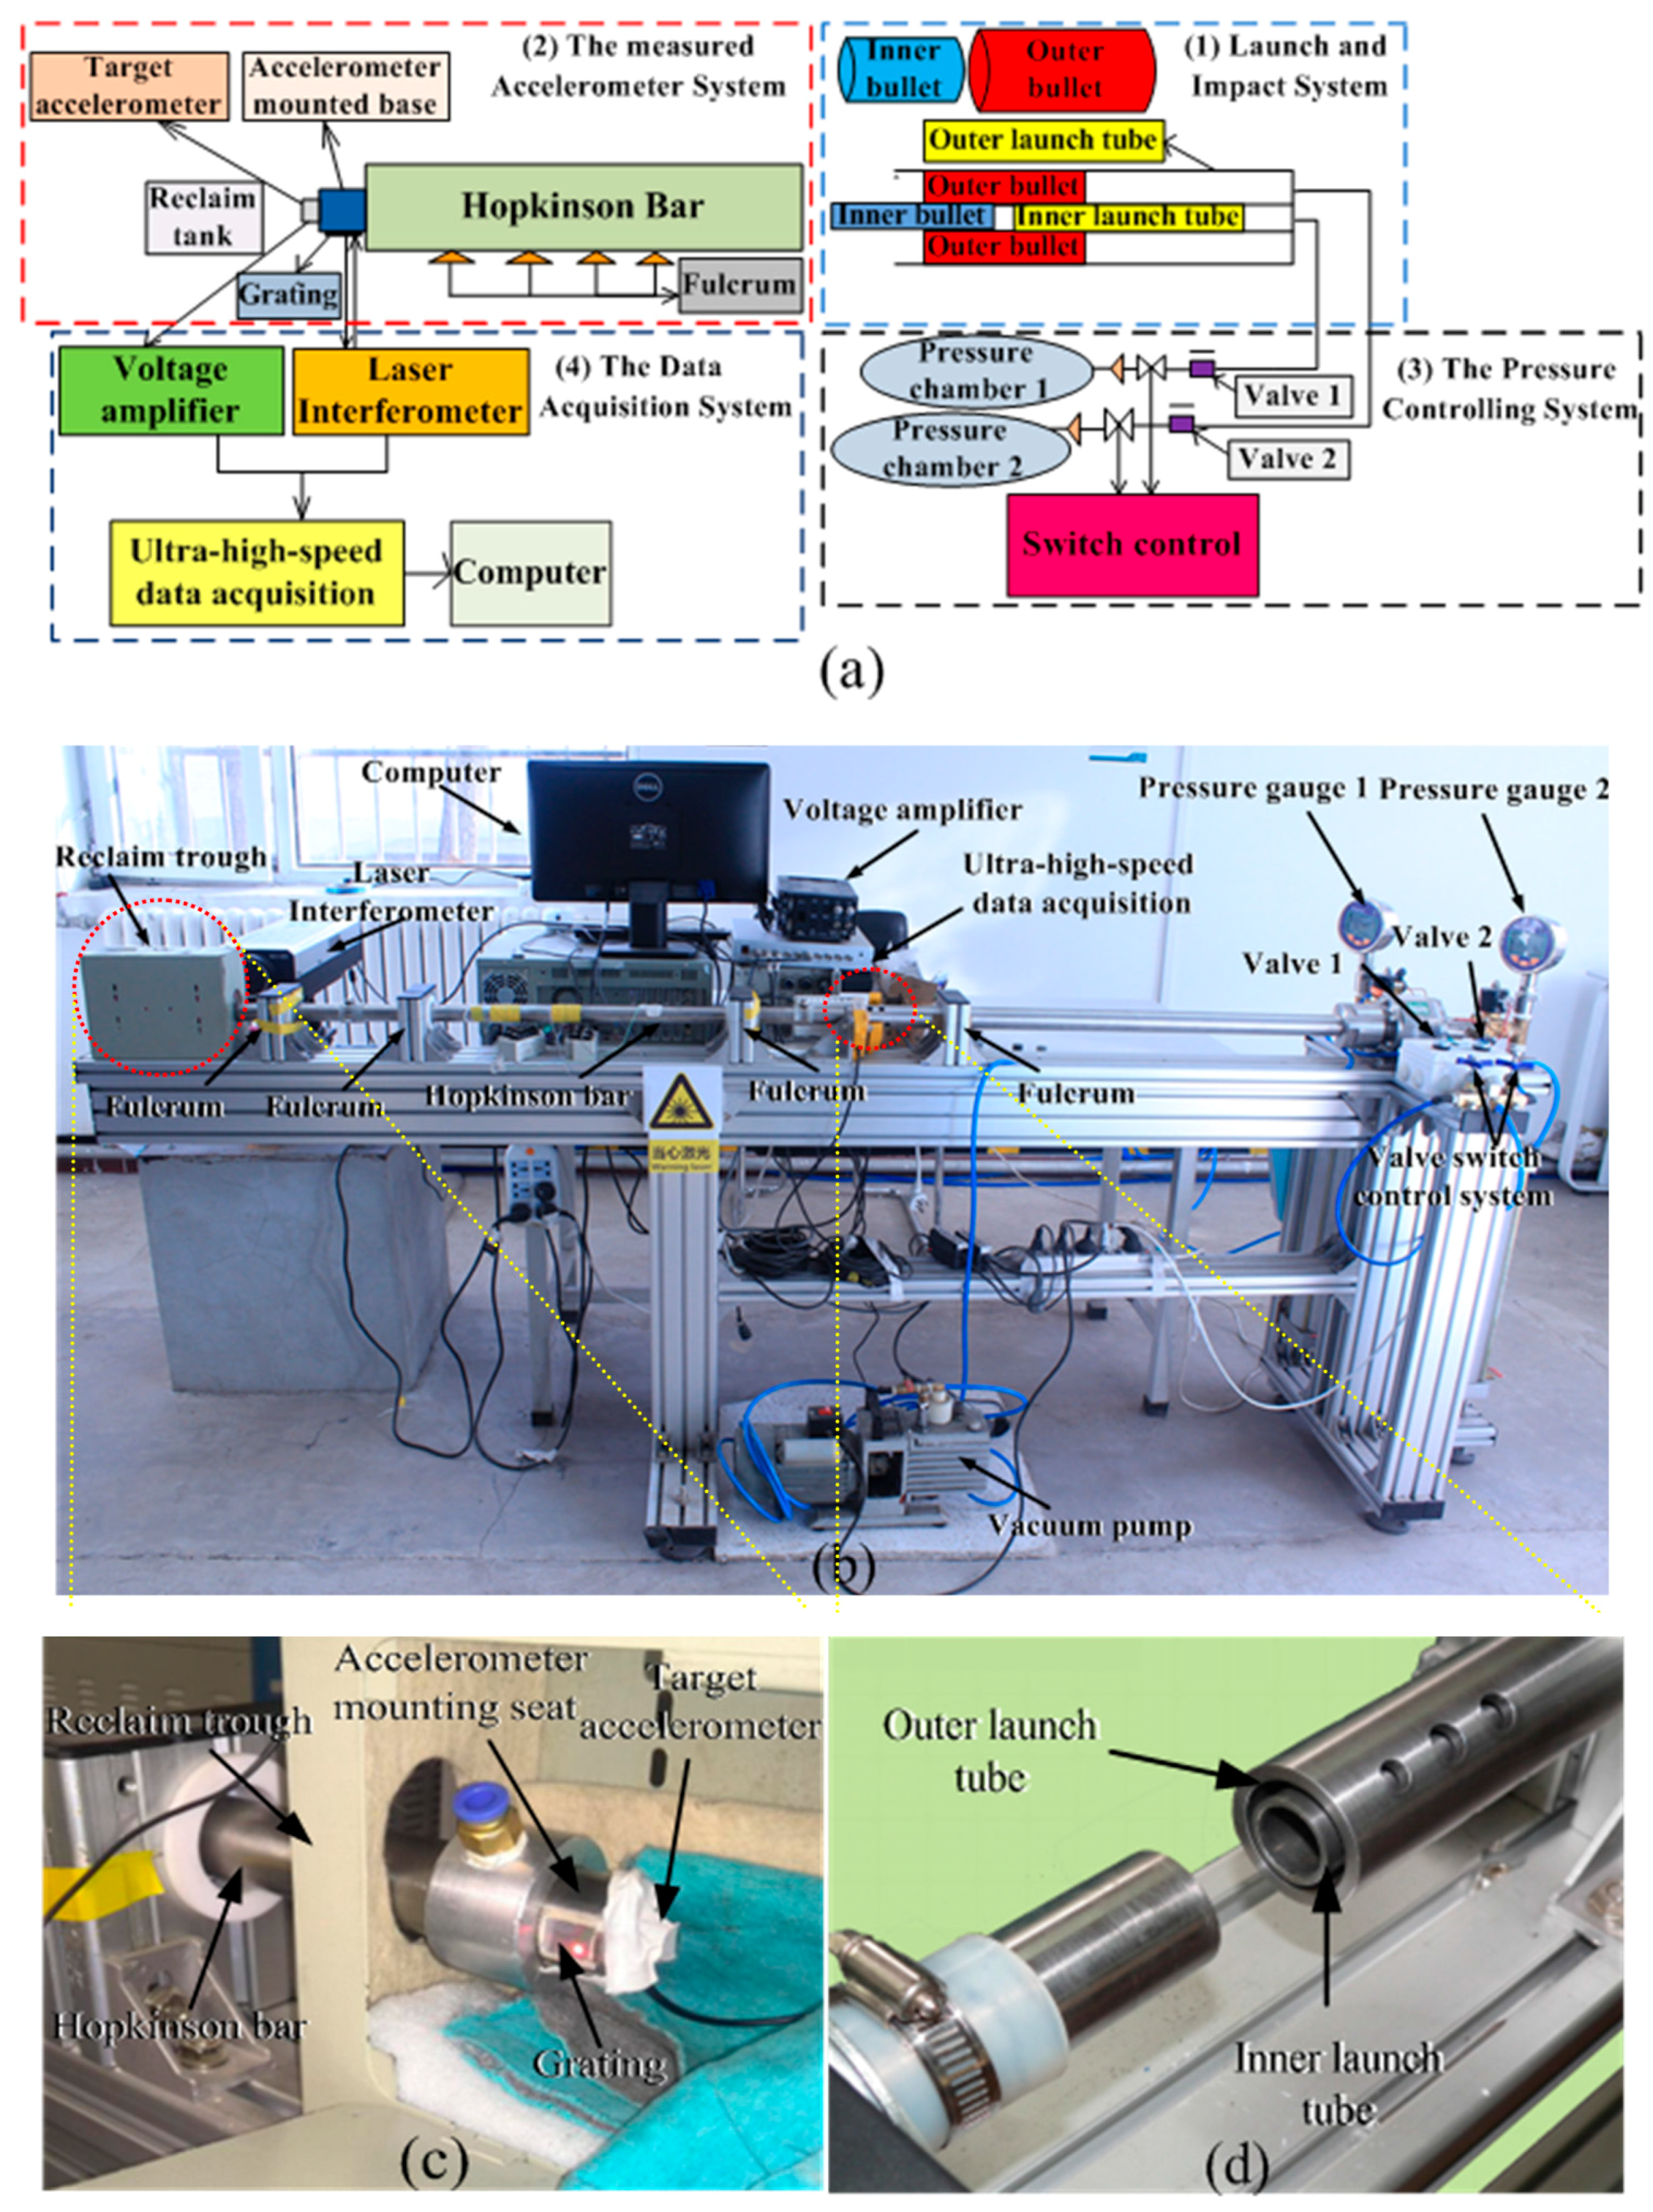
-g accelerometer's performances is worth mentioning. The schematics and experimental setup of the impact system using a developed dual-warhead Hopkinson bar for dynamic linearity increment with a high measurement range are shown in
Figure 3.
The impact measurement system can be divided into four subsystems, including a launch and impact system, a measured accelerometer system, the pressure controlling system, and the data acquisition system, as shown in
Figure 3a,b.
Figure 3c,d show close-ups of the dual-warhead made in-houses, its launch tube and the measured accelerometer marked by both red circles in
Figure 3b.
The launch-measured accelerometer and impact systems comprise home-made inner and outer launching tubes for the blast-off of the bullets. The home-made Hopkinson bar fabricated from high-strength titanium is used as the incident bar to generate the strain wave when impacted by the bullets. The inner and outer bullets made of No. 45 quenched and tempered steel are used as the generator of the elastic impact to the Hopkinson bar and are launched by the launching tubes. The parameters of these bullets are shown in
Table 1.
The measured accelerometer system comprises a home-made piezoresistive accelerometer [
22,
23,
24], a mounted base, grating, and reclamation tank. The accelerometer is mounted on the end of the base, with a measuring range of 1.5 × 10
5 g and anti-overload reaching of 2.0 × 10
5 g, and is used to measure the acceleration from the Hopkinson bar induced by the impact of the bullets. The grating is mounted beside the base for measuring the base’s Doppler frequency shift due to acceleration. The reclamation tank embraces and recycles the accelerometer, the mounted base, and the grating after the impact.
The pressure control system comprises pressure chambers 1 and 2, valves 1 and 2, and a valve switch. Pressure chambers 1 and 2 are used as high-pressure resources, providing air with a pressure as high as 1 MPa. The switches are used to regulate the air pressure of chambers 1 and 2. Valves 1 and 2 can launch the inner and outer bullets separately or simultaneously to hit the Hopkinson bar.
The data acquisition system comprises a laser interferometer (HSLV-1000, Chang Cheng Institute, China), a voltage amplifier (Endevco 136 with its voltage gain of 100, Endevco, Irvine, CA, USA), and a computer. The laser interferometer converts the Doppler frequency shift from the grating to voltage, which is amplified by the voltage amplifier. The ultra-high-speed USB data acquisition (the acquisition accuracy is 12 bit and the acquisition rate is 40 MHz) and analysis from the amplifier is processed by the computer, yielding results concerning the acceleration and the impact duration.
When performing experiments for which the inner bullet (outer bullet) is launched, pressure chamber 1(2) is opened and regulated by the switch while keeping the air pressure constant at an interval of 0.005 MPa between 0.01 and 0.1 MPa. Then, valve 1(2) is opened, and the inner (outer) tube is pushed to launch the inner (outer) bullet with a high air pressure. The inner (outer) bullet impacts the Hopkinson bar, and a longitudinal elastic compression wave is generated propagating to the other side of the bar. The accelerometer mounted to the side of the bar flies out immediately because of the stretching wave induced by the quasi-half-sine acceleration pulse from the compression wave. The grating, which is mounted to the base, measures the Doppler frequency shift depending of the acceleration of the accelerometer and converts it into a voltage signal, which is finally imported into the OP amplifier and analyzed by the data acquisition system. The acceleration of the inner bullet, ainner (outer bullet, aouter) is obtained relative to the impact duration. When both bullets are launched simultaneously under the same condition, pressure chambers 1 and 2, the switches, and the inner and outer tubes are both worked in sequence, and the other procedures are performed just as in the case of one bullet. The acceleration of the inner and outer bullets, atotal, is obtained. The dynamic linearity of the impact system and accelerometer can consequently be calculated depending on Equation (10).
4. Experimental Results
In this section, firstly, the dynamic linearity of the impact system without the accelerometer is investigated by measuring the accelerations of the mounted base impacted by the inner bullet, outer bullet, or by both, simultaneously. Using this impact system with high dynamic linearity, the performance of the accelerometer is researched using its recorded outputs under all considered impacts.
4.1. The System Calibration Using a Laser Interferometer without an Accelerometer
The acceleration can be obtained using the differential laser Doppler interferometer method which is shown in
Figure 4 [
25,
26,
27].
The velocity of the object and the Doppler shift is given by [
24,
28]
where
kV is the velocity sensitivity (
ms−1/
Hz).
The grating velocity measured by the laser interferometer is given by [
29]
When the grating is moving, the Doppler frequency shift is given by
Therefore, substituting Equation (12) into Equation (13), the grating velocity can be given by
where
m,
n are the diffraction series of two interference beams in the interferometer, and
m = −
n = 2.
d, with a value of 1/150 mm, is the grating constant. Therefore, the velocity sensitivity coefficient of the interferometer is given by
Grating acceleration can thus be acquired:
For a given grating, when the light path is determined by the diffraction series, we can get the velocity and acceleration of the grating from Δf. Thereby, calibration of the test system using a laser interferometer without an accelerometer is achieved.
4.2. Dynamic Linearity Results of the Impact System
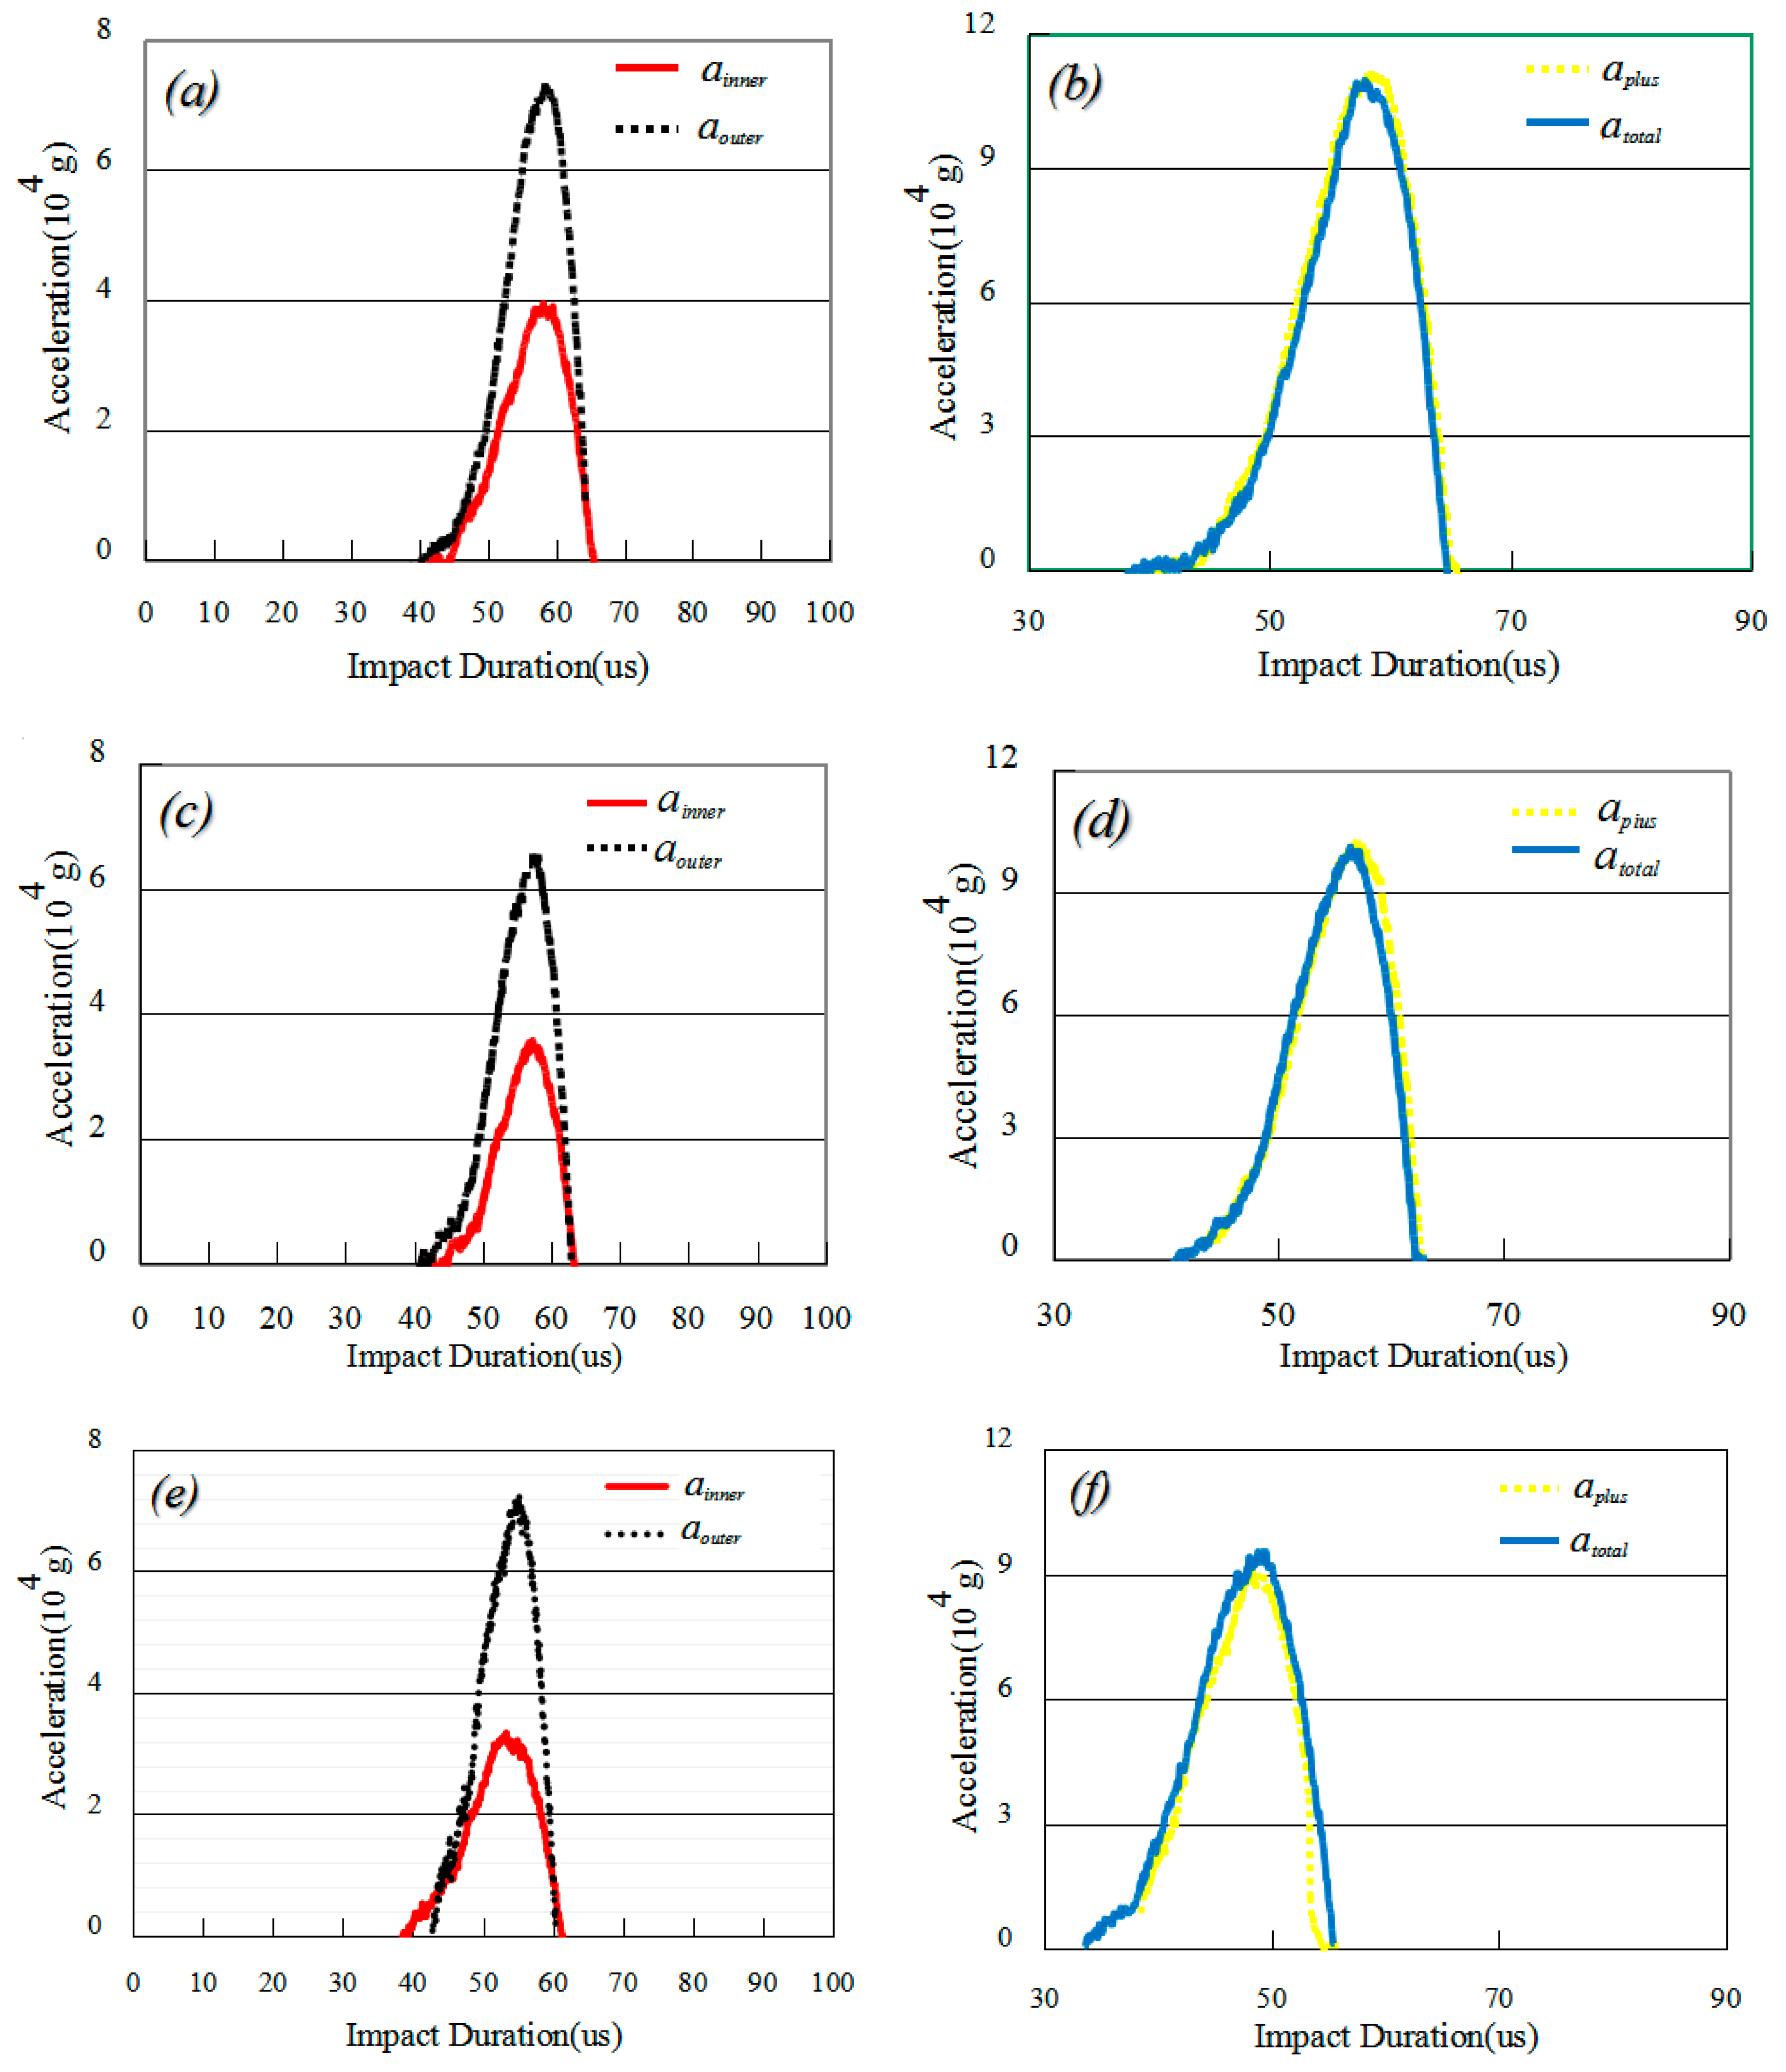
Figure 5 shows the experimentally determined accelerations under impact from the inner (
ainner,
solid lines) and outer (
aouter,
dotted lines) bullets as functions of the impact duration for the system without the accelerometer, as detected by the Doppler frequency shift of the mounted base. Here,
Figure 5a,c,e show the cases impacted by bullets separately, and
Figure 5b,d,f show the cases impacted by both bullets simultaneously (
atotal,
solid lines). The dotted lines in
Figure 5d, f represent the sums of the accelerations (
aplus) of the inner and outer bullets in
Figure 5a,c,e, respectively.
For the process of the inner bullet impact upon the Hopkinson bar, because of response delay, there are no accelerations (Doppler frequency shift) from 0 to 38 μs in
Figure 5a, from 0 to 40 μs in
Figure 5c, or from 0 to 42 μs in
Figure 5e (
solid lines) after the inner bullet impacts the bar. The accelerations then increase to the maximum with a value of 3.816 × 10
4 g at 52 μs, 3.524 × 10
4 g at 51 μs, and 3.240 × 10
4 g at 52 μs in
Figure 5a,c,e, respectively. Subsequently, the accelerations decrease to zero between 52 and 66 μs, 51 and 62 μs, and 52 and 62 μs in
Figure 5a,c,e, respectively.
For the process of the outer bullet impact upon the Hopkinson bar, we have similar experimental results. There are no accelerations between 0 and 38 μs, 0 and 40 μs, or 0 and 42 μs after the outer bullet impacts the bar in
Figure 5a,c,e (
dotted lines), respectively. The accelerations then increase to the maximum, with values of 7.204 × 10
4 g at 52 μs, 6.493 × 10
4 g at 51 μs, and 6.595 × 10
4 g at 52 μs in
Figure 5a,c,e, respectively. Subsequently, the accelerations decrease to zero between 52 and 66 μs, 51 and 62 μs, and 52 and 62 μs in
Figure 5a,c,e, respectively.
For the process of simultaneous inner and outer bullet impact upon the Hopkinson bar, the accelerations (
atotal) increase to the maximum values of 10.915 × 10
4 g at 52 μs, 10.248 × 10
4 g at 51 μs, and 9.436 × 10
4 g of 52 μs in
Figure 5b,d,f (
solid lines), respectively. The other experimental tendencies and phenomena are the same as the inner and outer bullets impacting the bar in
Figure 5a,c,e, respectively. In order to compare the experimental results, we sum the accelerations (
aplus) as functions of the impact durations induced by the inner and outer bullets in
Figure 5a,c,e. These results are shown by the dotted lines in
Figure 5b,d,f. The peak accelerations of
ainner and
aouter in
Figure 5a,c,e are also added together and summarized in
Table 2. Comparing
atotal with
aplus in
Figure 5b,d,f and
Table 2, we find that the accelerations,
aplus, are well-consistent with those of
atotal for the process of impacting upon the Hopkinson bar using the inner and outer bullets at the same air pressure, simultaneously.
The dynamic linearities
σ1,
σ2, and
σ3, were obtained from Equation (10) and are shown in
Table 2. The systematic dynamic linearity,
σtotal, was calculated from the averaged
σ1,
σ2, and
σ3 values as follows:
From these experimental results, it is concluded that the dynamic linearity of the impact system is considered acceptable and that this system is of relative high reliability and accuracy.
4.3. Dynamic Linearity Results for a High-g Accelerometer
In this experiment, the in-house manufactured piezoresistive accelerometer [
30] with a measuring range of 1.5 × 10
5 g and an anti-overload of 2.0 × 10
5 g combined with the holder is mounted to the end side of a Hopkinson bar. Three pressures—0.160 MPa, 0.156 MPa, and 0.152 MPa—are applied to the dual-bullets. The outputs of the accelerometer dependence of the impact duration are recorded and shown in
Figure 6a–f.
Figure 6 shows the experimental results of the inner (
Ainner) and outer (
Aouter) accelerations as functions of the impact duration for the accelerometer by detecting the output of the accelerometer impacted by the inner bullet (
solid lines), outer bullet (
dotted lines) (
Figure 6a,c,e), and by both simultaneously (
Atotal,
solid lines) in
Figure 6b,d,f. The dotted lines in
Figure 6b,d,f represent the sums of the accelerations (
Aplus) of the inner and outer bullets in
Figure 6a,c,e, respectively.
In
Figure 6a, between 0 and 42 μs, the acceleration is almost zero. At approximately 42 μs, the acceleration rises, increasing to a maximum of 3.836 × 10
4 g for the inner bullet and 7.256 × 10
4 g for the outer bullet at 56 μs. From 56 to 68 μs, the acceleration decreases to zero. In
Figure 6c, from 42 to 55 μs, the acceleration increases to a maximum of 3.462 × 10
4 g for the inner bullet and 7.134 × 10
4 g for the outer bullet. From 55 to 67 μs, the acceleration decreases to zero. In
Figure 6e, from 40 to 51 μs, the acceleration increases to a maximum of 3.215 × 10
4 g for the inner bullet and 6.753 × 10
4 g for the outer one. From 51 to 62 μs, the acceleration decreases to zero.
In
Figure 6b, from 0 to 42 μs, the acceleration is increased from zero to a maximum of 11.486 × 10
4 g for a simultaneous impact by both bullets (
solid line). From 56 to 68 μs, the acceleration decreases to almost zero. In
Figure 6d, from 42 to 55 μs, the acceleration increases to a maximum of 10.226 × 10
4 g under simultaneous impact. From 55 to 67 μs, the acceleration decreases to zero. In
Figure 6f, from 40 to 51 μs, the acceleration increases to a maximum of 9.542 × 10
4 g under the simultaneous impact. From 51 to 62 μs, the acceleration decreases to zero.
To compare the experimental results, we sum the accelerations (
Aplus) as functions of the impact durations induced by the inner and outer bullets. The dotted lines in
Figure 6b,d,f show these sums. The peaks of the accelerations of
Ainner and
Aouter in
Figure 6a,c,e are also added together and summarized in
Table 3. Comparing
Atotal with
Aplus in
Figure 6b,d,f and
Table 3, we find that the accelerations
Aplus are well-consistent with
Atotal for the process of impacting the Hopkinson bar using the inner and outer bullets at the same air pressure both simultaneously and separately.
The dynamic linearities of the accelerometer for each measurement—
σ’1,
σ’2, and
σ’3—are obtained and shown in
Table 3. The dynamic linearity
σ’total of the accelerometer is calculated from the average of
σ’1,
σ’2, and
σ’3, which is 3.88%.
From these results, it is concluded that the home-made accelerometers have high dynamic linearities. In particular, they can obtain higher accuracy of the acceleration than that of lower-dynamic linearity duration of a high-g impact.
5. Conclusions
In this paper, a novel method for measuring the dynamic linearity of a high-g accelerometer using an impact experiment with a dual-warhead Hopkinson bar with laser interference was proposed. We theoretically determined that the dynamic linearity of the high-g accelerometer can be detected directly by comparing accelerations due to impacts by outer and inner bullets under the same condition, both separately and simultaneously. We then verified that the dynamic linearity of the impact system without the accelerometer is 2.5% experimentally, and the dynamic linearity of the high-g accelerometer was shown to be 3.88% after calibrating the system with the accelerometer. All of these results confirmed the reliability and feasibility of the dynamic linearity for the impact system and the home-made high-g accelerometers used in this method.
Acknowledgments
This work was supported by the National Science Foundation of China(No. 61171056, 61503346, 91336110), the China Postdoctoral Science Foundation (No. 2011M500544), the Foundation of Key Laboratory (9140C1204021008), and the National Basic Research Program (973 Program, under grant: 2010CB327601).
Author Contributions
Y. S., Z. M. and J. L. conceived and designed the experiments; Z. Y., H. C. and Z. K. performed the experiments; Z.Y., D. Z., and Y.C. analyzed the data; H. F. contributed reagents/materials/analysis tools; Z.Y., Y. S., and Z. M. wrote the paper.
Conflicts of Interest
The authors declare no conflict of interest.
References
- Liu, J.; Shi, Y.B.; Li, P.; Tang, J.; Zhang, H. Experimental study on the package of high-g accelerometer. Sens. Actuators A 2012, 173, 1–5. [Google Scholar] [CrossRef]
- Zhao, Y.L.; Li, X.B.; Liang, J.; Jiang, Z.D. Design, fabrication and experiment of a MEMS piezoresistive high-g accelerometer. J. Mech. Sci. Technol. 2013, 27, 831–836. [Google Scholar] [CrossRef]
- Atwell, A.R.; Okojie, R.S.; Kornegay, K.T.; Roberson, S.L.; Beliveau, A. Simulation, fabrication and testing of bulk micromachined 6H-SiC high-g piezoresistive accelerometers. Sens. Actuators A 2003, 104, 11–18. [Google Scholar] [CrossRef]
- Bateman, V.I.; Brown, F.A.; Davie, N.T. The Use of a Beryllium Hopkinson Bar to Characterize a Piezoresistive Accelerometer in Shock Environments. J. Inst. Environ. Sci. 1996, 39, 33–39. [Google Scholar]
- Bateman, V.I.; Leisher, W.B.; Brown, F.A.; Davie, N.T. Calibration of a Hopkinson Bar with Transfer Standard. In Proceedings of the 62nd Shock and Vibration Symposium, Springfield, VA, USA, 29–31 October 1991.
- Umeda, A. Method and Device for Measuring Dynamic Linearity of Acceleration Sensor. U.S. Patent US20050160785, 23 October 2003. [Google Scholar]
- Cao, H.; Li, H. Investigation of vacuum packaged MEMS gyroscope architec-ture’s temperature robustness. Int. J. Appl. Electromagn. Mech. 2013, 41, 495–506. [Google Scholar]
- Davis, B.S.; Denison, T.; Kuang, J. A Monolithic High-g SOI-MEMS Accelerometer for measuring Projectile Launch and Flight Accelerations. Shock Vib. 2006, 13, 127–135. [Google Scholar] [CrossRef]
- Bateman, V.I.; Letterneau, J. Proven Sensor Performance for Emerging Shock Environments. Sound Vib. 2014, 48, 14–19. [Google Scholar]
- Bateman, V.I. “ISO 16063-22 Amendment,”-Part 22. In Proceedings of the SAVIAC 83rd Shock and Vibration Symposium, New Orleas, LA, USA, 4–8 November 2012.
- Lee, Y.H.; Kang, S.J. A Comparative Analysis of Motion Performance, Physical Activity, and Exercise Fatigue Degree during Inflatable Kayak and Hard Shall Kayak Sailing. Off. J. Korean Assoc. Certif. Exerc. Prof. 2013, 15, 15–22. [Google Scholar]
- Walraven, J.A. Failure analysis issues in microelectromechanical systems. Microelectron. Reliab. 2005, 45, 1750–1757. [Google Scholar] [CrossRef]
- Umeda, A. Dynamic Matrix Sensitivity Measuring Instrument for Inertial Sensors, and Measuring Method Therefor. WO 2004097433 A1, 11 November 2006. [Google Scholar]
- Brow, G. Accelerometer Calibration with the Hopkinson Pressure Bar. Instr. Soc. Am. Prepr. 1963, 49, 63. [Google Scholar]
- Cannon, J.; Rimbey, D. Transient Method of Calibrating a Piezoelectric Accelerometer for the High g-level Range. Am. Soc. Mech. Eng. 1971, 93, 52. [Google Scholar]
- Davies, R. A Critical Study of the Hopkinson Pressure Bar, Philosophical Transactions. Philos. Trans. R. Soc. Lond. A 1948, 240, 352–375. [Google Scholar] [CrossRef]
- Wang, Y.; Fan, J.B.; Xu, P.; Zu, J. Shock calibration of the high-g triaxial accelerometer. IEEE Int. Conf. Instrum. Meas. Technol. 2008, 741–745. [Google Scholar]
- Dong, P.; Li, X.; Bao, H.; Zhou, W.; Li, S.; Feng, S. High-performance mono-lithic triaxial piezoresistive shock accelerometers. Sens. Actuators A 2008, 141, 339–346. [Google Scholar] [CrossRef]
- Wang, L.L. Foundation of Stress Waves; National Defence Industry Press: Beijing, China, 2005; pp. 39–64. [Google Scholar]
- Ramiez, H.; Rubio-Gonzalez, C. Finite-element simulation of wave propagation and dispersion in Hopkinson bar test. Mater. Des. 2006, 27, 36–44. [Google Scholar] [CrossRef]
- Zukas, J.A. Impact Dynamics; Weapon Industry Press: Beijing, China, 1987. [Google Scholar]
- Ning, Y.; Loke, Y.; McKinnon, G. Fabrication and characterization of high g-force, silicon piezoresistive accelerometers. Sens. Actuators A 1995, 48, 55–61. [Google Scholar] [CrossRef]
- Shaoqun, S.; Jian, C.; Minhang, B. Analysis on twin-mass structure for a piezoresistive accelerometer. Sens. Actuators A 1992, 34, 101–107. [Google Scholar] [CrossRef]
- Wang, Y.; Fan, J.B.; Xu, P.; Zu, J.; Zhang, Z. Shock calibration of the high-g triaxial accelerometer. In Proceedings of the Instrumentation and Measurement Technology Conference, Victoria, BC, Canada, 12–15 May 2008; pp. 671–674.
- Li, Q.F. Research of The Shock Calibration with Laser-interferometry for High G Accelerometers. Master’s Thesis, North University of China, Taiyuan, Shanxi, China, 2008. [Google Scholar]
- Xia, L.F.; Gao, P.; Zhan, F.F.; Lv, G.T. Shock sensor calibration for high-g value based on Hopkinson bar. Electron. Des. Eng. 2009, 8, 68–70. [Google Scholar]
- Li, X.H.; Fan, J.B.; Wang, Y. Shock calibration of a high-g piezoresistive microaccelerometer. Sens. World 2010, 10, 11–13. [Google Scholar]
- Hu, S.L. Laser Velocity Interferometry; National Defence Industry Press: Beijing, China, 2001. [Google Scholar]
- Liang, Z.G.; Li, X.L.; Sun, J.Y.; Lian, D.H. Primary Shock Calibration of Dynamic Performance of Differential Acceleration of Accelerometers with a Laser Interferometer. Acta Metrol. Sin. 2005, 1, 34–39. [Google Scholar]
- Huan, Y.; Zhang, T.H.; Yang, Y.M.; Wang, Z.K.; Lu, D.R. Shock calibration of piezoresistve high-g microaccelerometer. J. Trans. Technol. 2003, 11, 78–80. [Google Scholar]
Figure 1.
Coaxial impact of a limited elastic bar by a bullet and a metal bar.
Figure 1.
Coaxial impact of a limited elastic bar by a bullet and a metal bar.
Figure 2.
Coaxial impact of the limited elastic bar by the inner and outer bullets and the metal bar.
Figure 2.
Coaxial impact of the limited elastic bar by the inner and outer bullets and the metal bar.
Figure 3.
Schematic diagram (a) and experimental setup (b) for the impact measurement system using a home-made dual-warhead Hopkinson bar for dynamic linearity increment with a high measurement range. (c) Close-up of the measured system comprising a target accelerometer, its mounted seat, and grating. (d) Close-up of the launch system comprising inner and outer bullets. The outer and inner launch tube and are marked by red circles in (b), respectively.
Figure 4.
The principle diagram of the differential laser Doppler interferometer.
Figure 4.
The principle diagram of the differential laser Doppler interferometer.
Figure 5.
Experimentally determined accelerations under impacts from the inner (ainner, solid lines) and outer (aouter, dotted lines) bullets as functions of impact duration, as detected by the Doppler frequency shift of the mounted base. (a), (c), and (e) show the cases impacted by the bullets separately; (b), (d), and (f) show the cases impacted by both bullets simultaneously (atotal, solid lines). The dotted lines in (b), (d), and (f) represent the sums of the accelerations (aplus) of the inner and outer bullets in (a), (c), and (e), respectively.
Figure 6.
Accelerations as a function of the impact duration for the impact system, determined from the outputs of the accelerometers impacted by inner (solid lines) and outer bullets (dotted lines) ((a), (c), and (e)), and by both simultaneously (solid line) in (b), (d), and (f). The dotted lines in (b), (d), and (f) represent the sums of the accelerations of the inner and outer bullets in (a), (c), and (e), respectively.
Table 1.
Parameters of the bullets.
Table 1.
Parameters of the bullets.
| Bullets | Inner Diameters (mm) | Outer Diameter (mm) | Length (mm) |
|---|
| Outer bullet | 19.4 | 25.4 | 30 |
| Inner bullet | — | 11.2 | 30 |
Table 2.
Peak accelerations of ainner, aouter, aplus, atotal, and the dynamic linearities of the impact system.
Table 2.
Peak accelerations of ainner, aouter, aplus, atotal, and the dynamic linearities of the impact system.
| Test Results | ainner (104 g) | aouter (104 g) | aplus (104 g) | atotal (104 g) | σi (i = 1, 2, 3) |
|---|
| Test No. | |
|---|
| 1 | 3.816 | 7.204 | 11.020 | 10.915 | 0.96% |
| 2 | 3.524 | 6.493 | 10.017 | 10.248 | 2.31% |
| 3 | 3.240 | 6.595 | 9.835 | 9.436 | 4.23% |
Table 3.
Peaks of the accelerations of Ainner, Aouter, Aplus, and Atotal, and the dynamic linearity of the measured accelerometer.
Table 3.
Peaks of the accelerations of Ainner, Aouter, Aplus, and Atotal, and the dynamic linearity of the measured accelerometer.
| Test Results | Ainner (104 g) | Aouter (104 g) | Aplus (104 g) | Atotal (104 g) | σ’I (i = 1, 2, 3) |
|---|
| Test No. | |
|---|
| 1 | 3.836 | 7.256 | 11.092 | 11.486 | 3.55% |
| 2 | 3.462 | 7.134 | 10.596 | 10.226 | 3.62% |
| 3 | 3.215 | 6.753 | 9.968 | 9.542 | 4.46% |
© 2016 by the authors; licensee MDPI, Basel, Switzerland. This article is an open access article distributed under the terms and conditions of the Creative Commons Attribution (CC-BY) license (http://creativecommons.org/licenses/by/4.0/).


