
Multi-Repeated Projection Lithography for High-Precision Linear Scale Based on Average Homogenization Effect

 ,
,
Abstract
:
1. Introduction
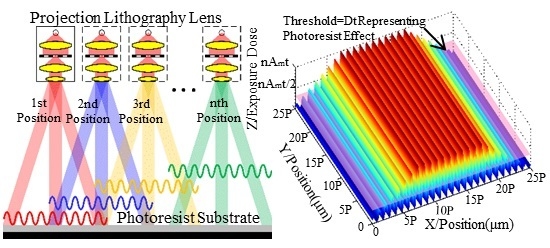
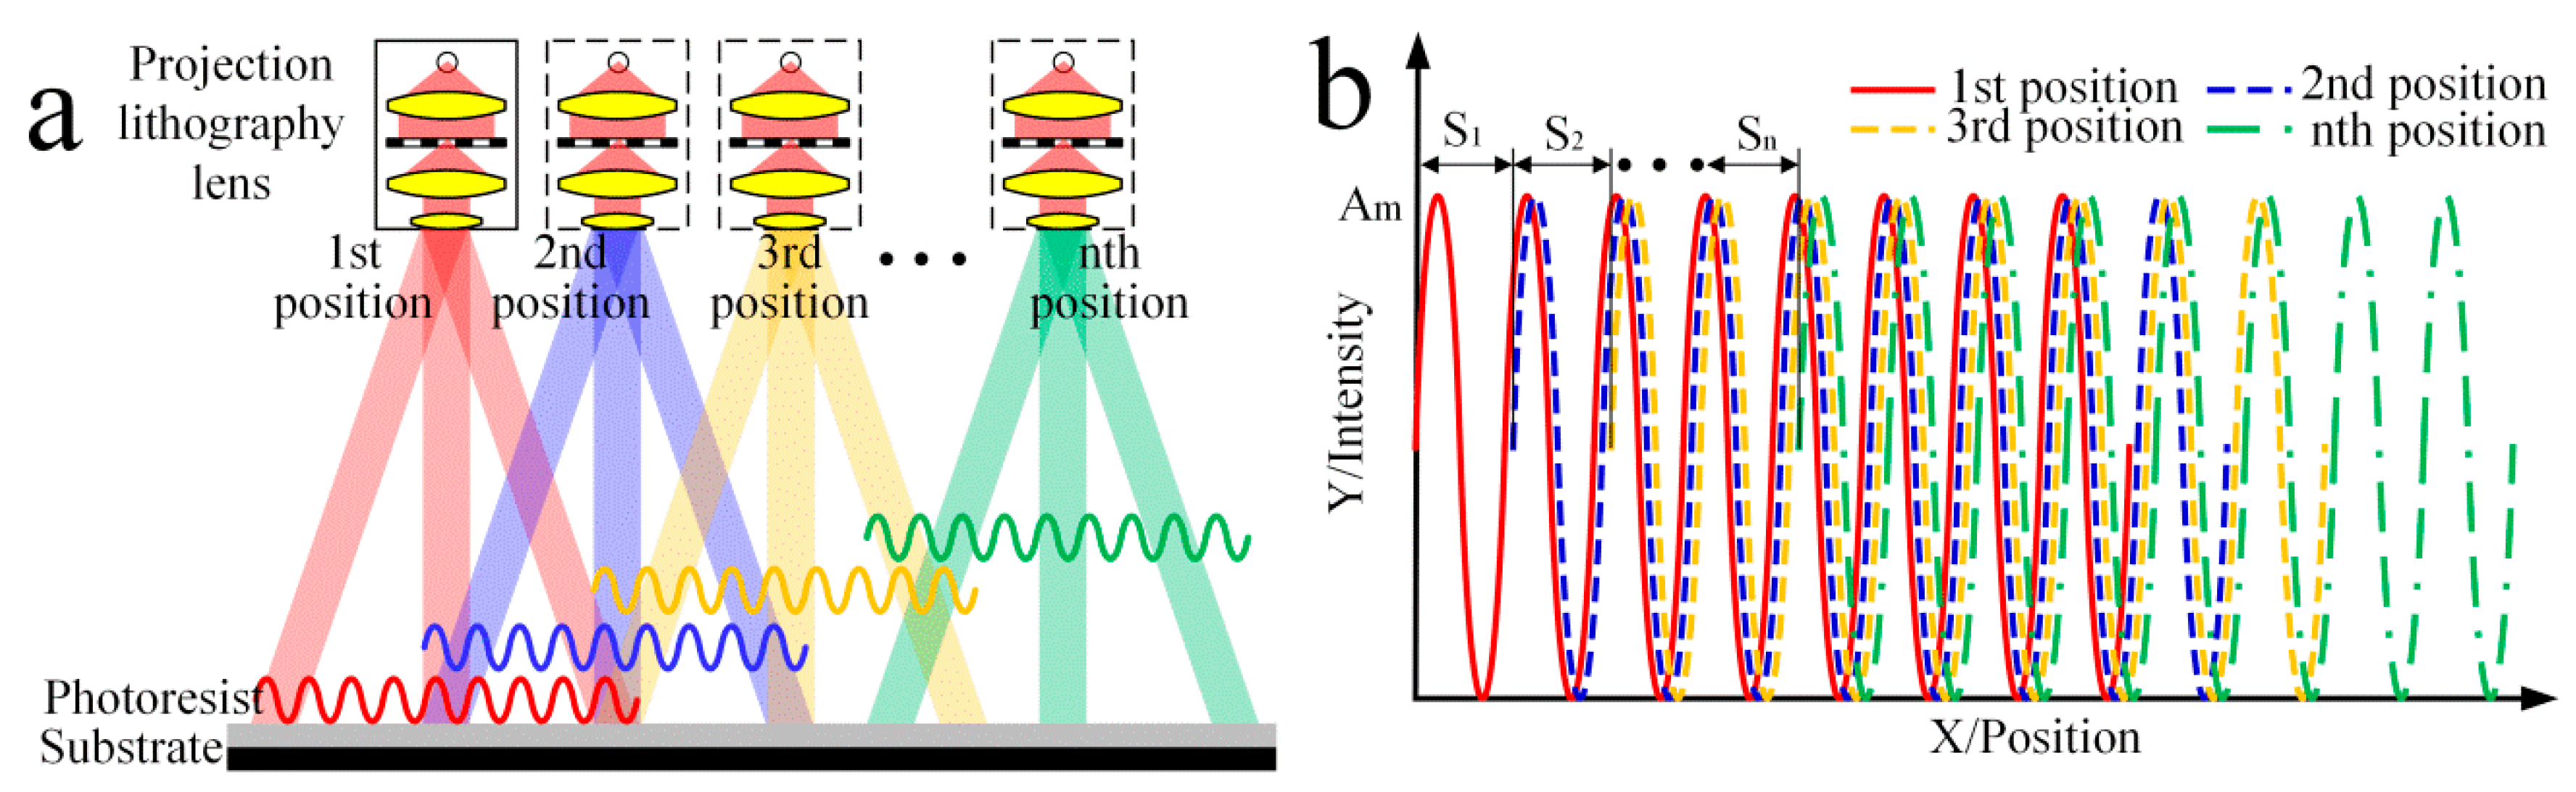
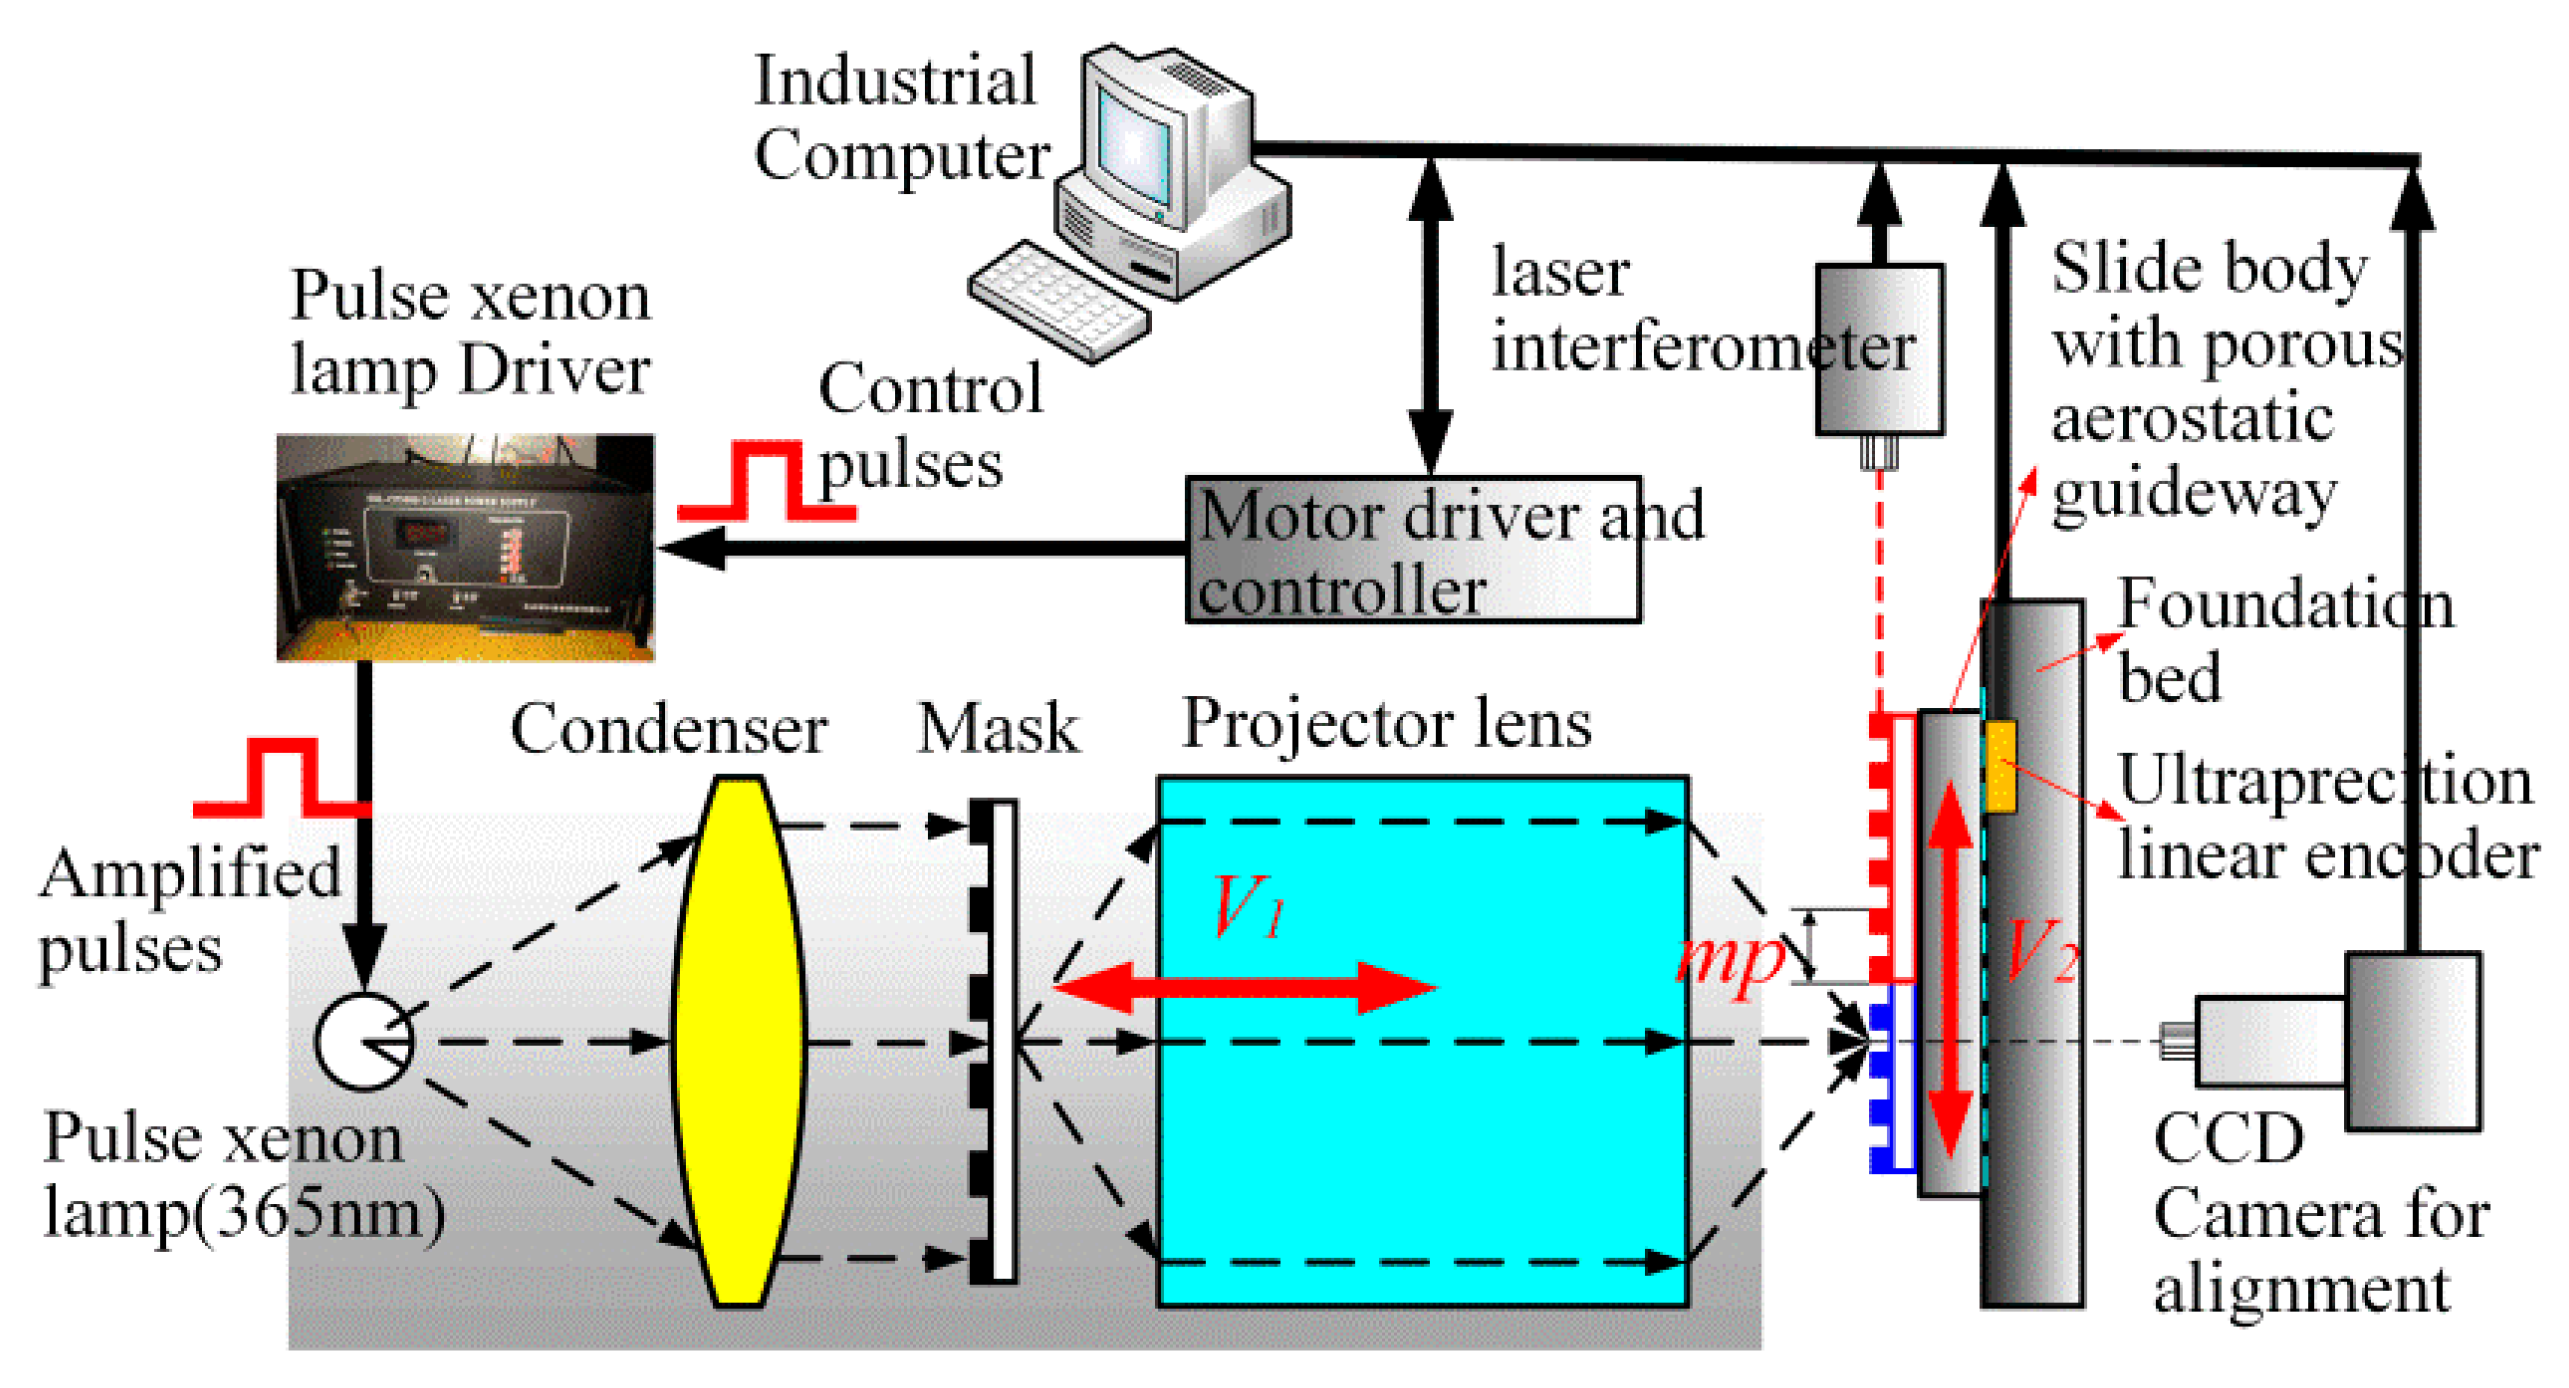
2. Photolithography Principle
3. Theory
3.1. Fundamental Theory
3.2. Mask Error Model
3.3. Exposure Repeated Number Model
3.4. Spacing Distance Model
4. Simulation
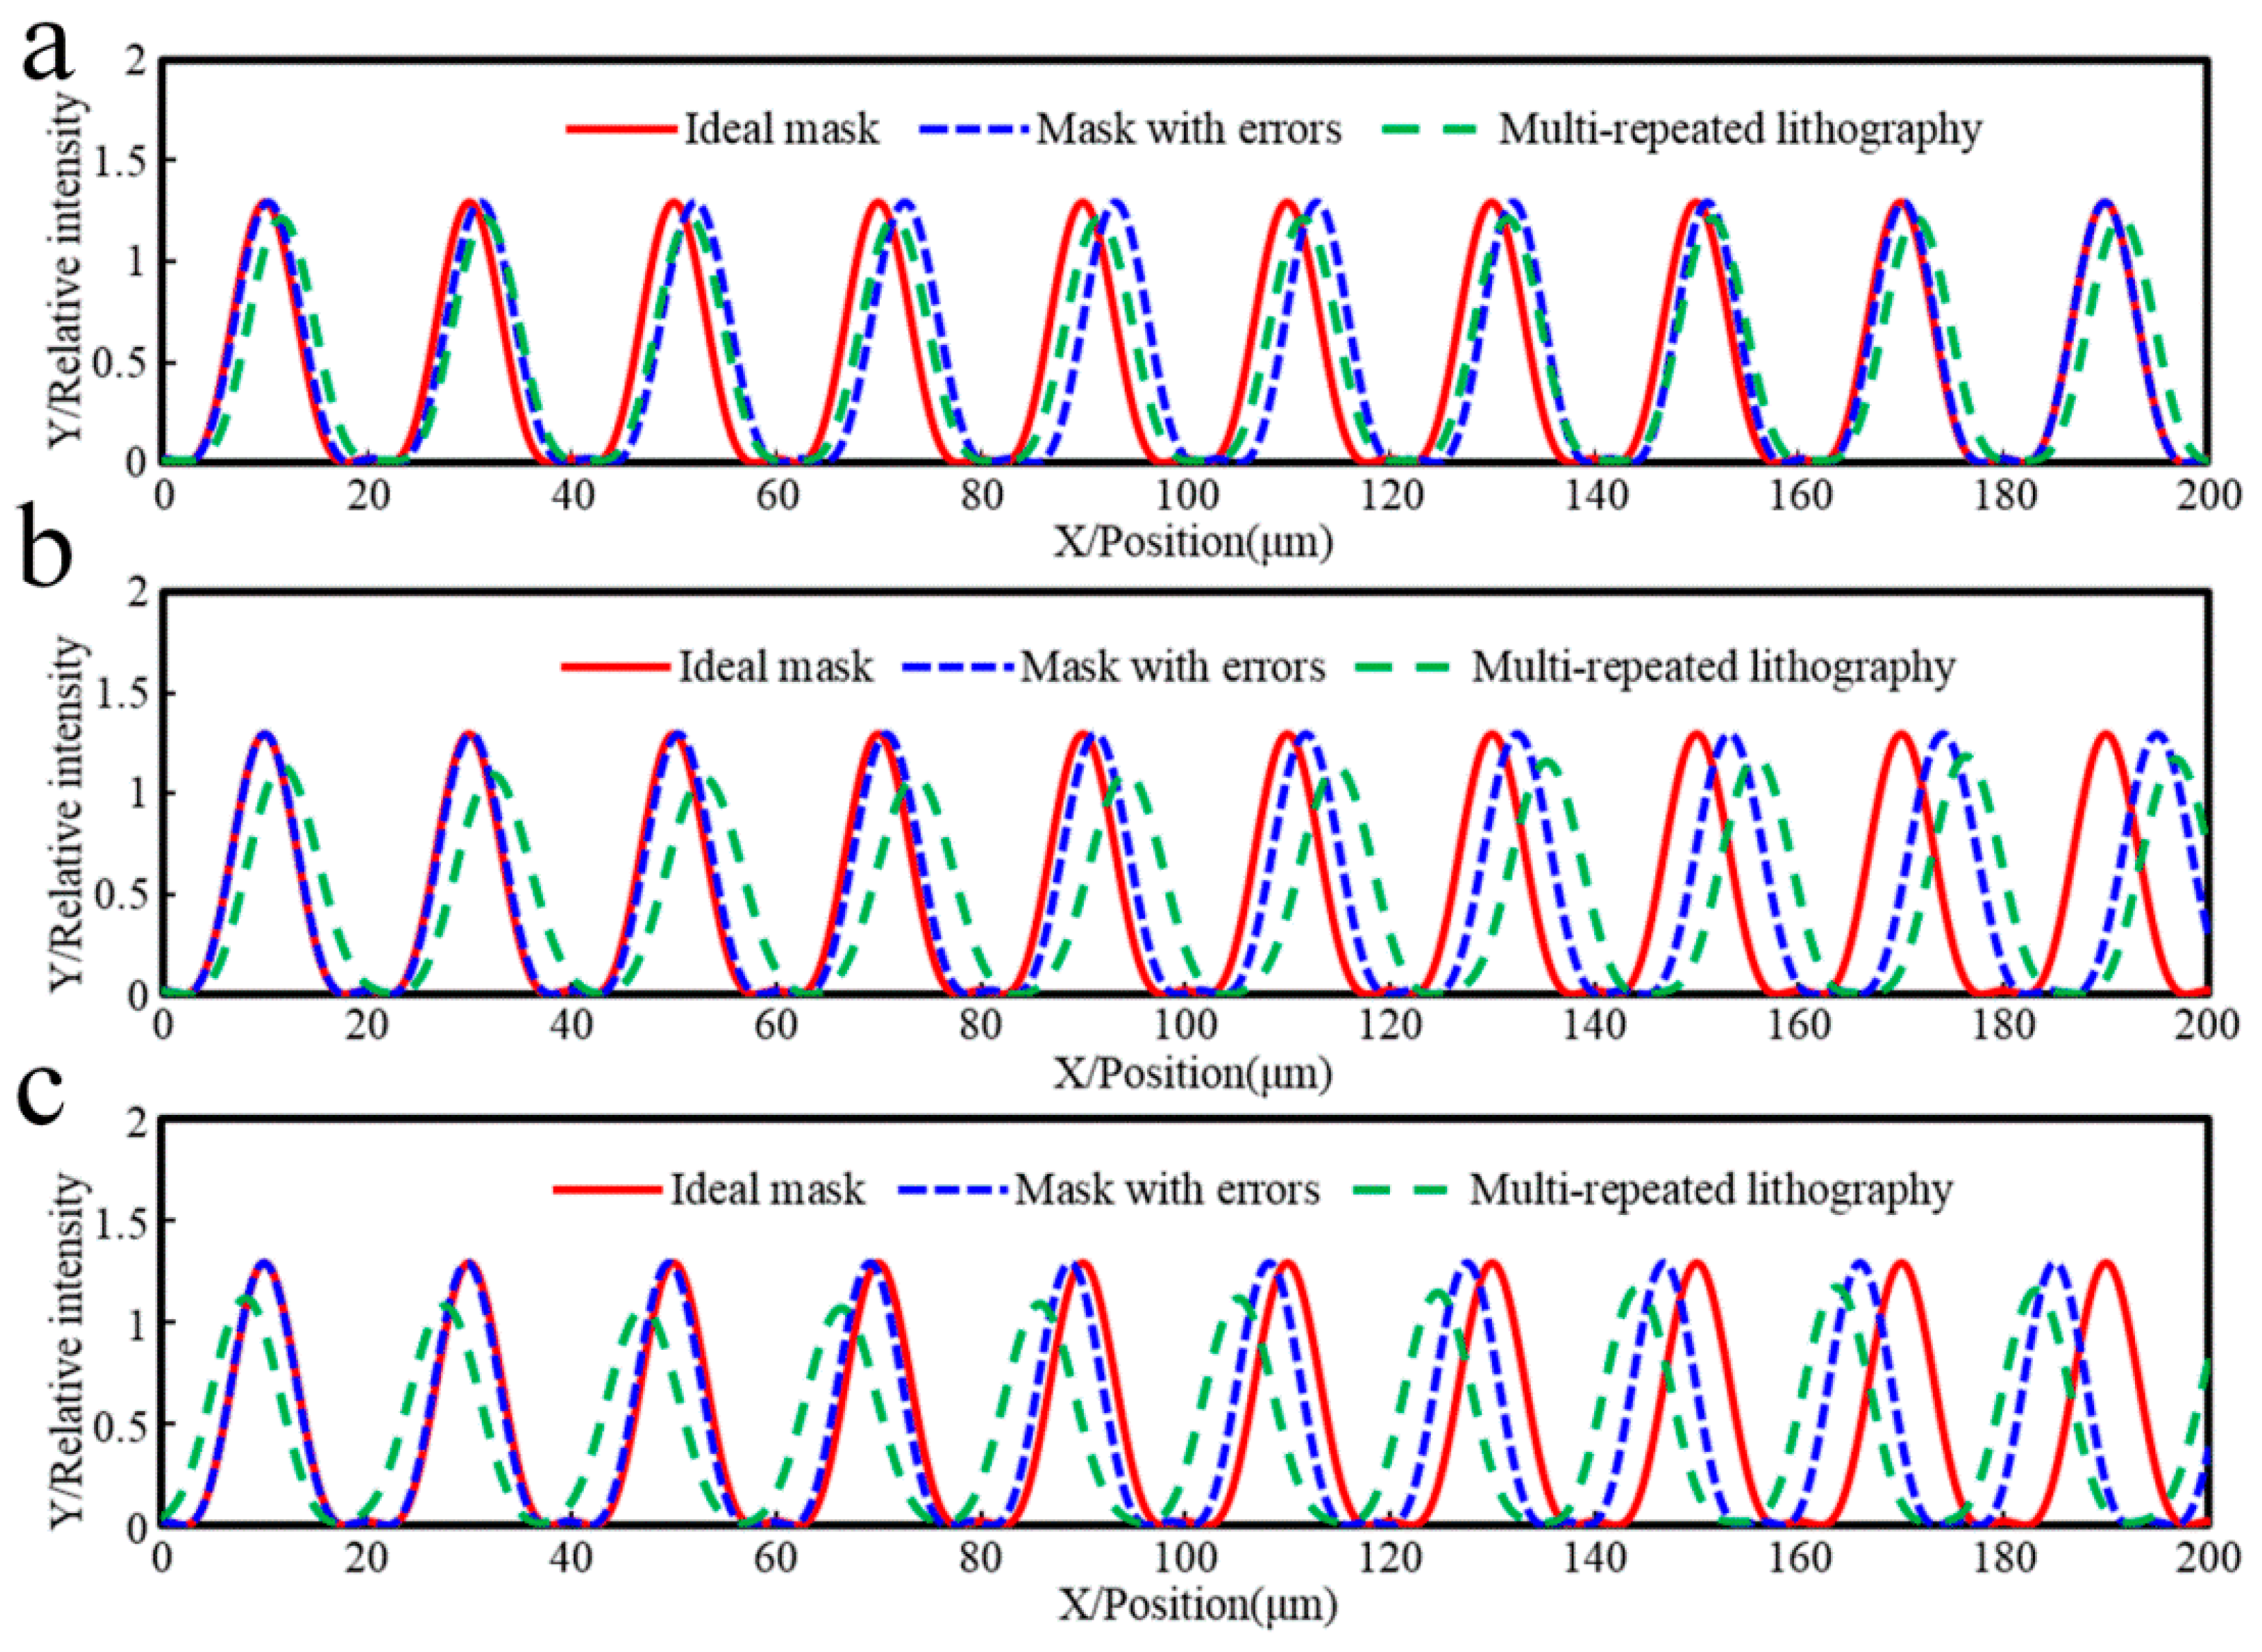
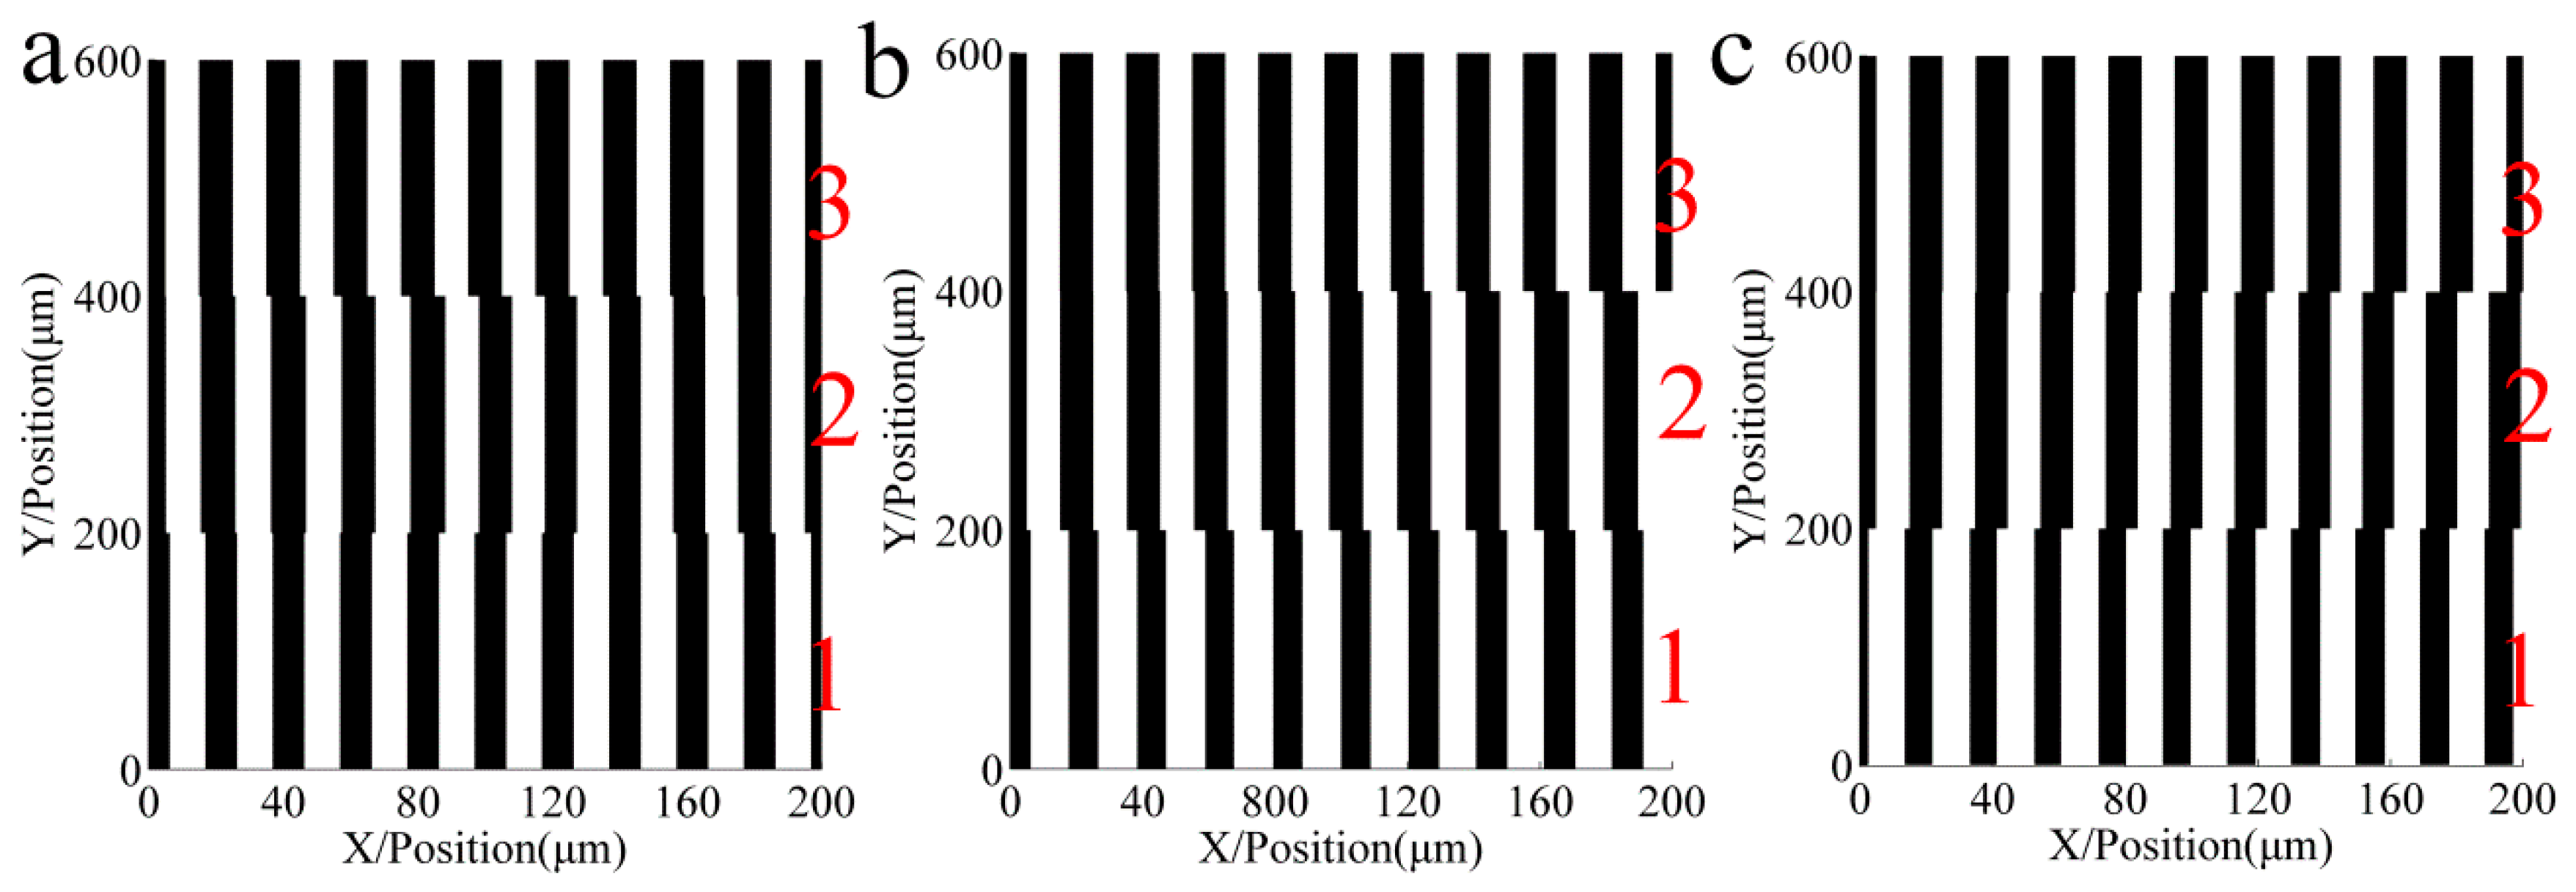
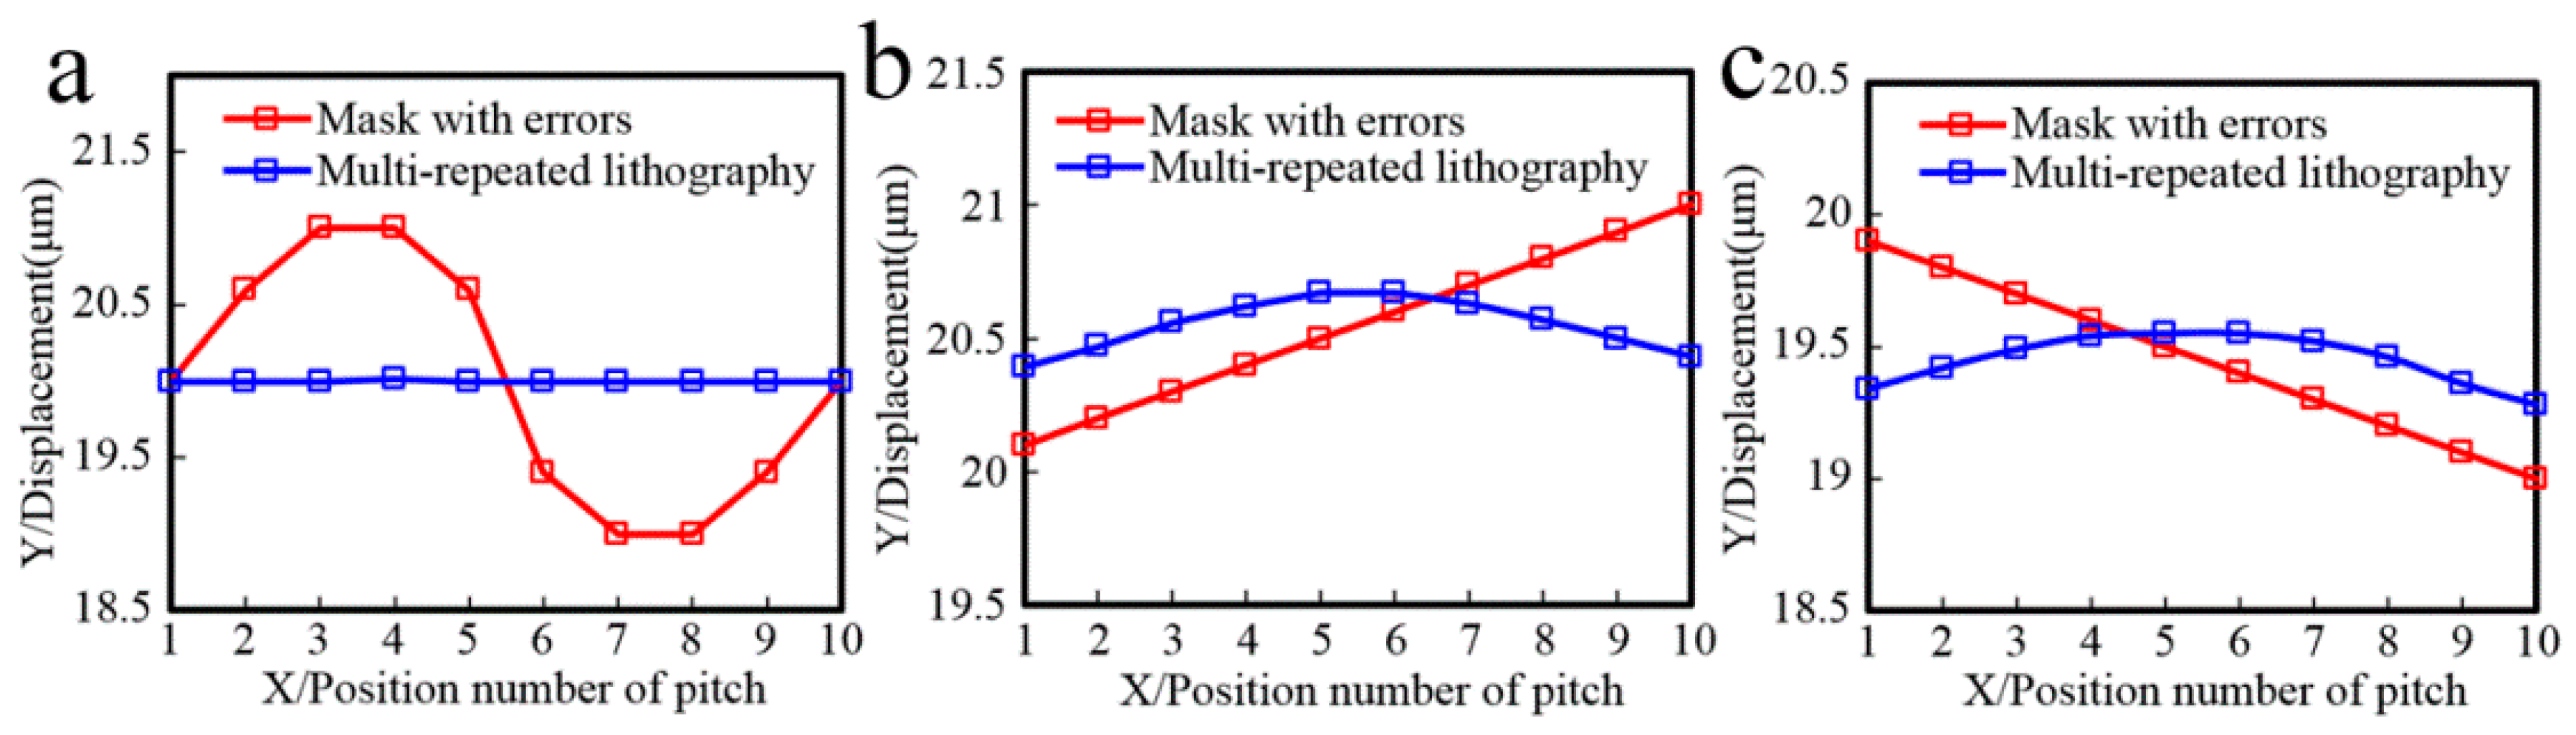
4.1. Influence of Mask Errors
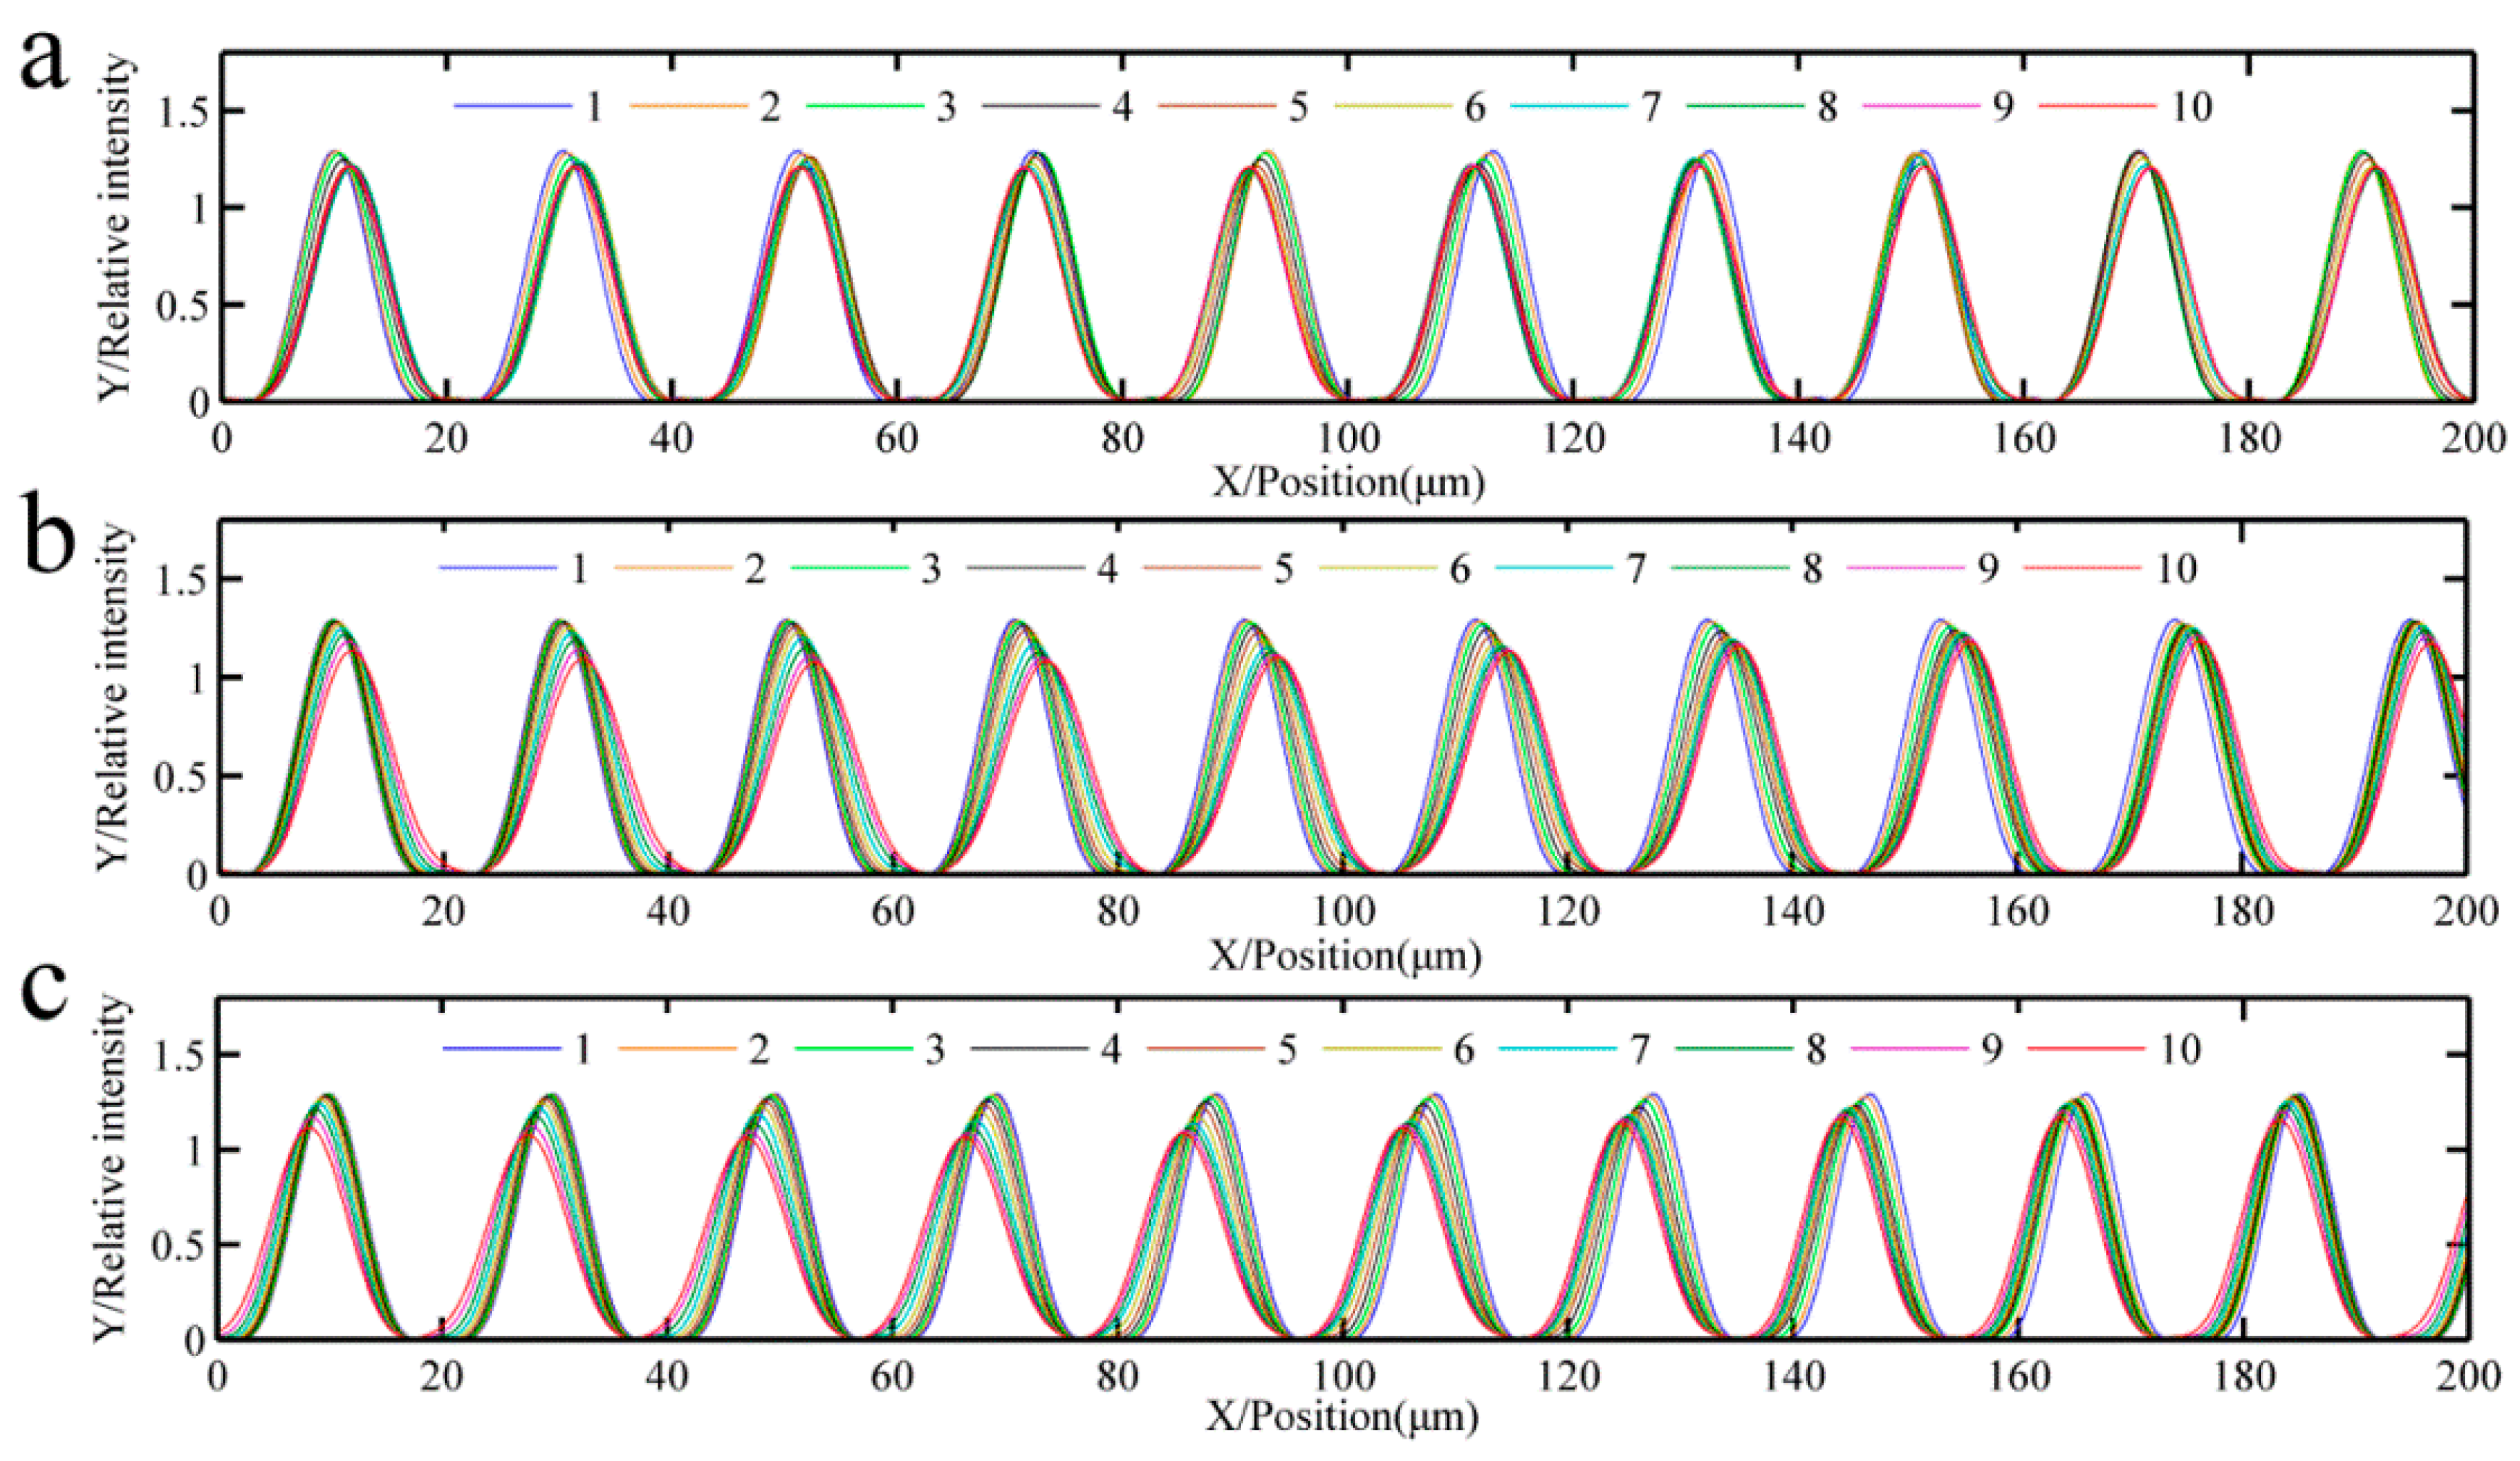
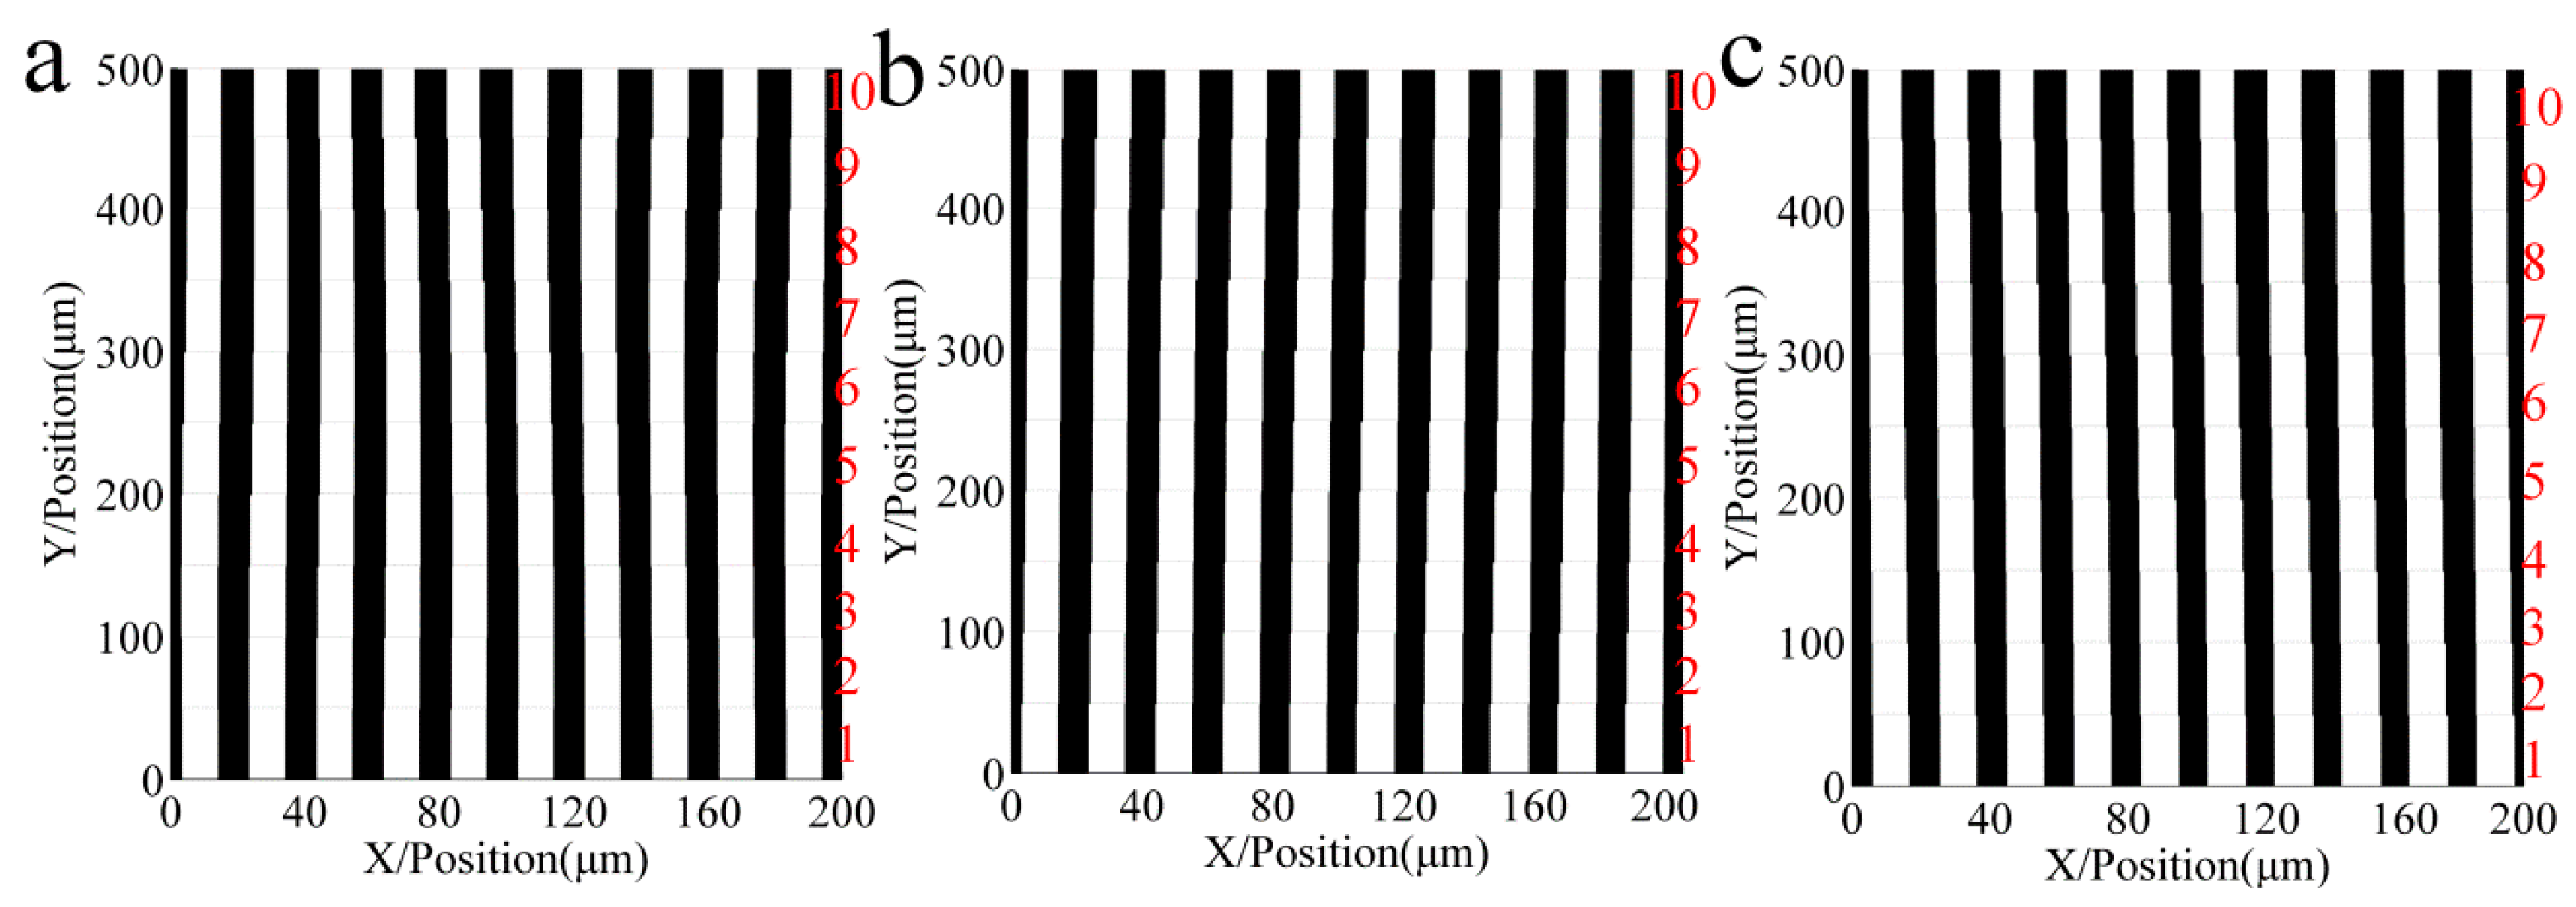
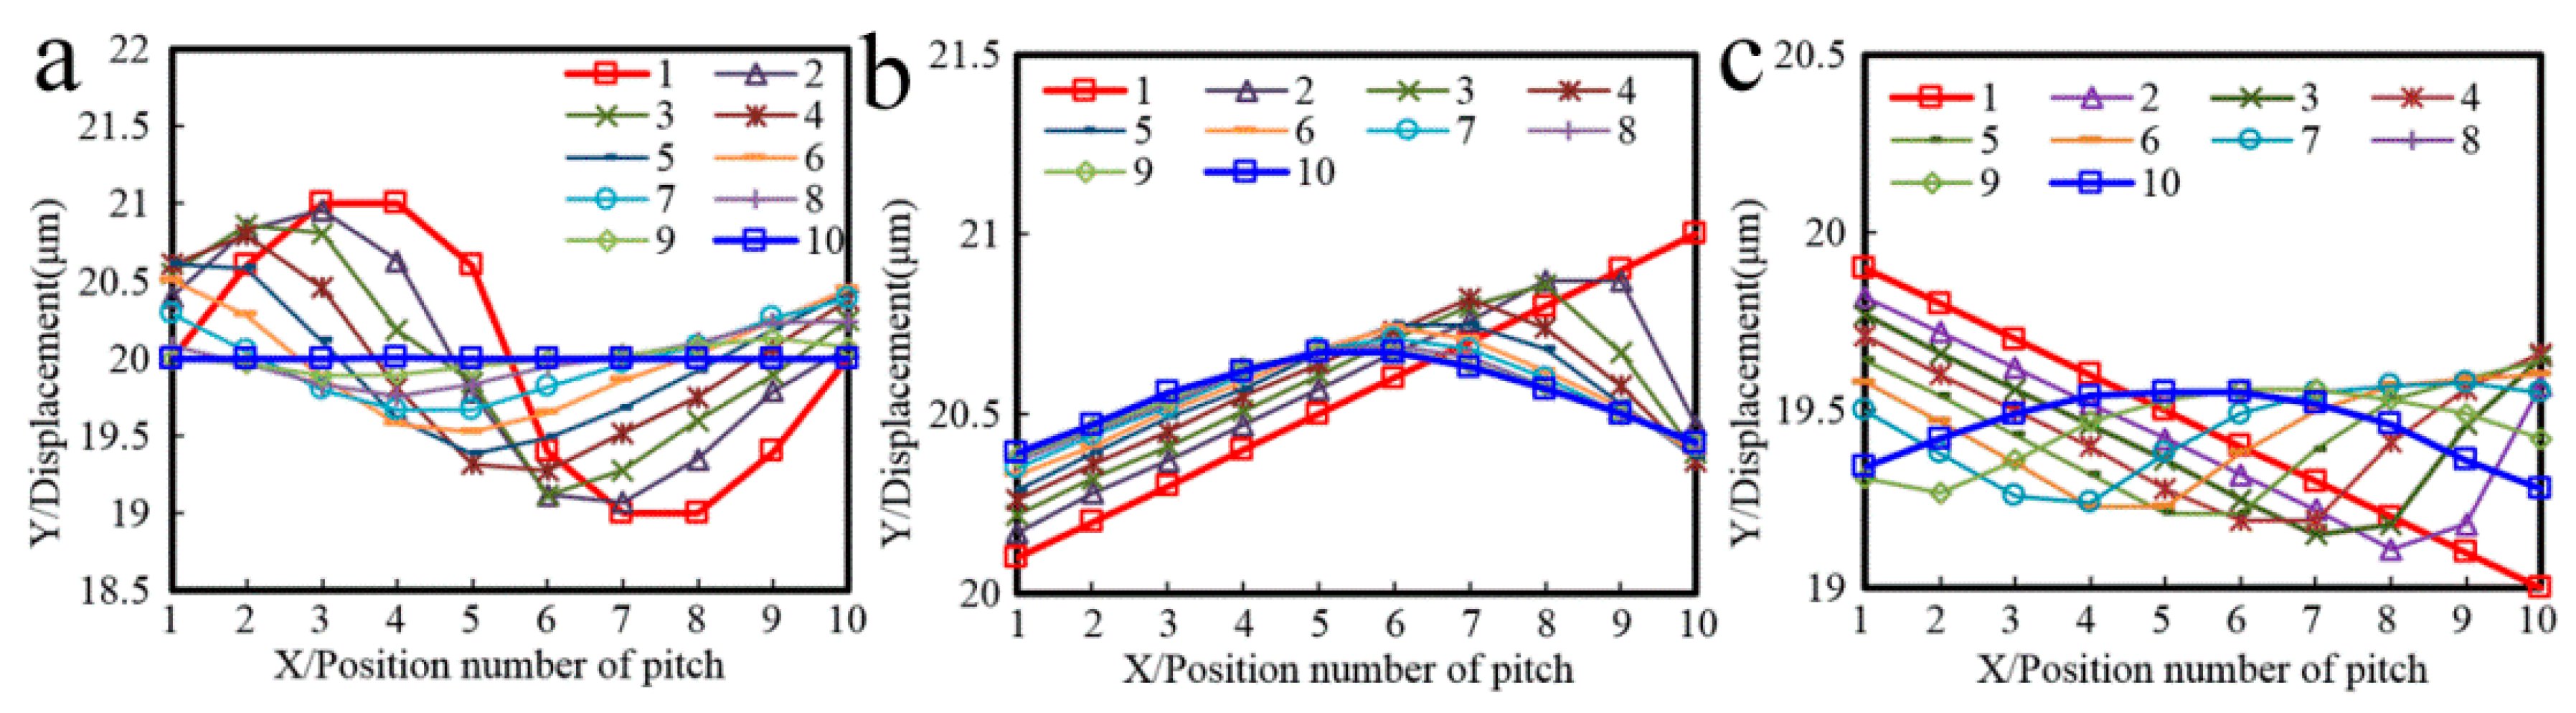
4.2. Influence of Repeated Exposure Number
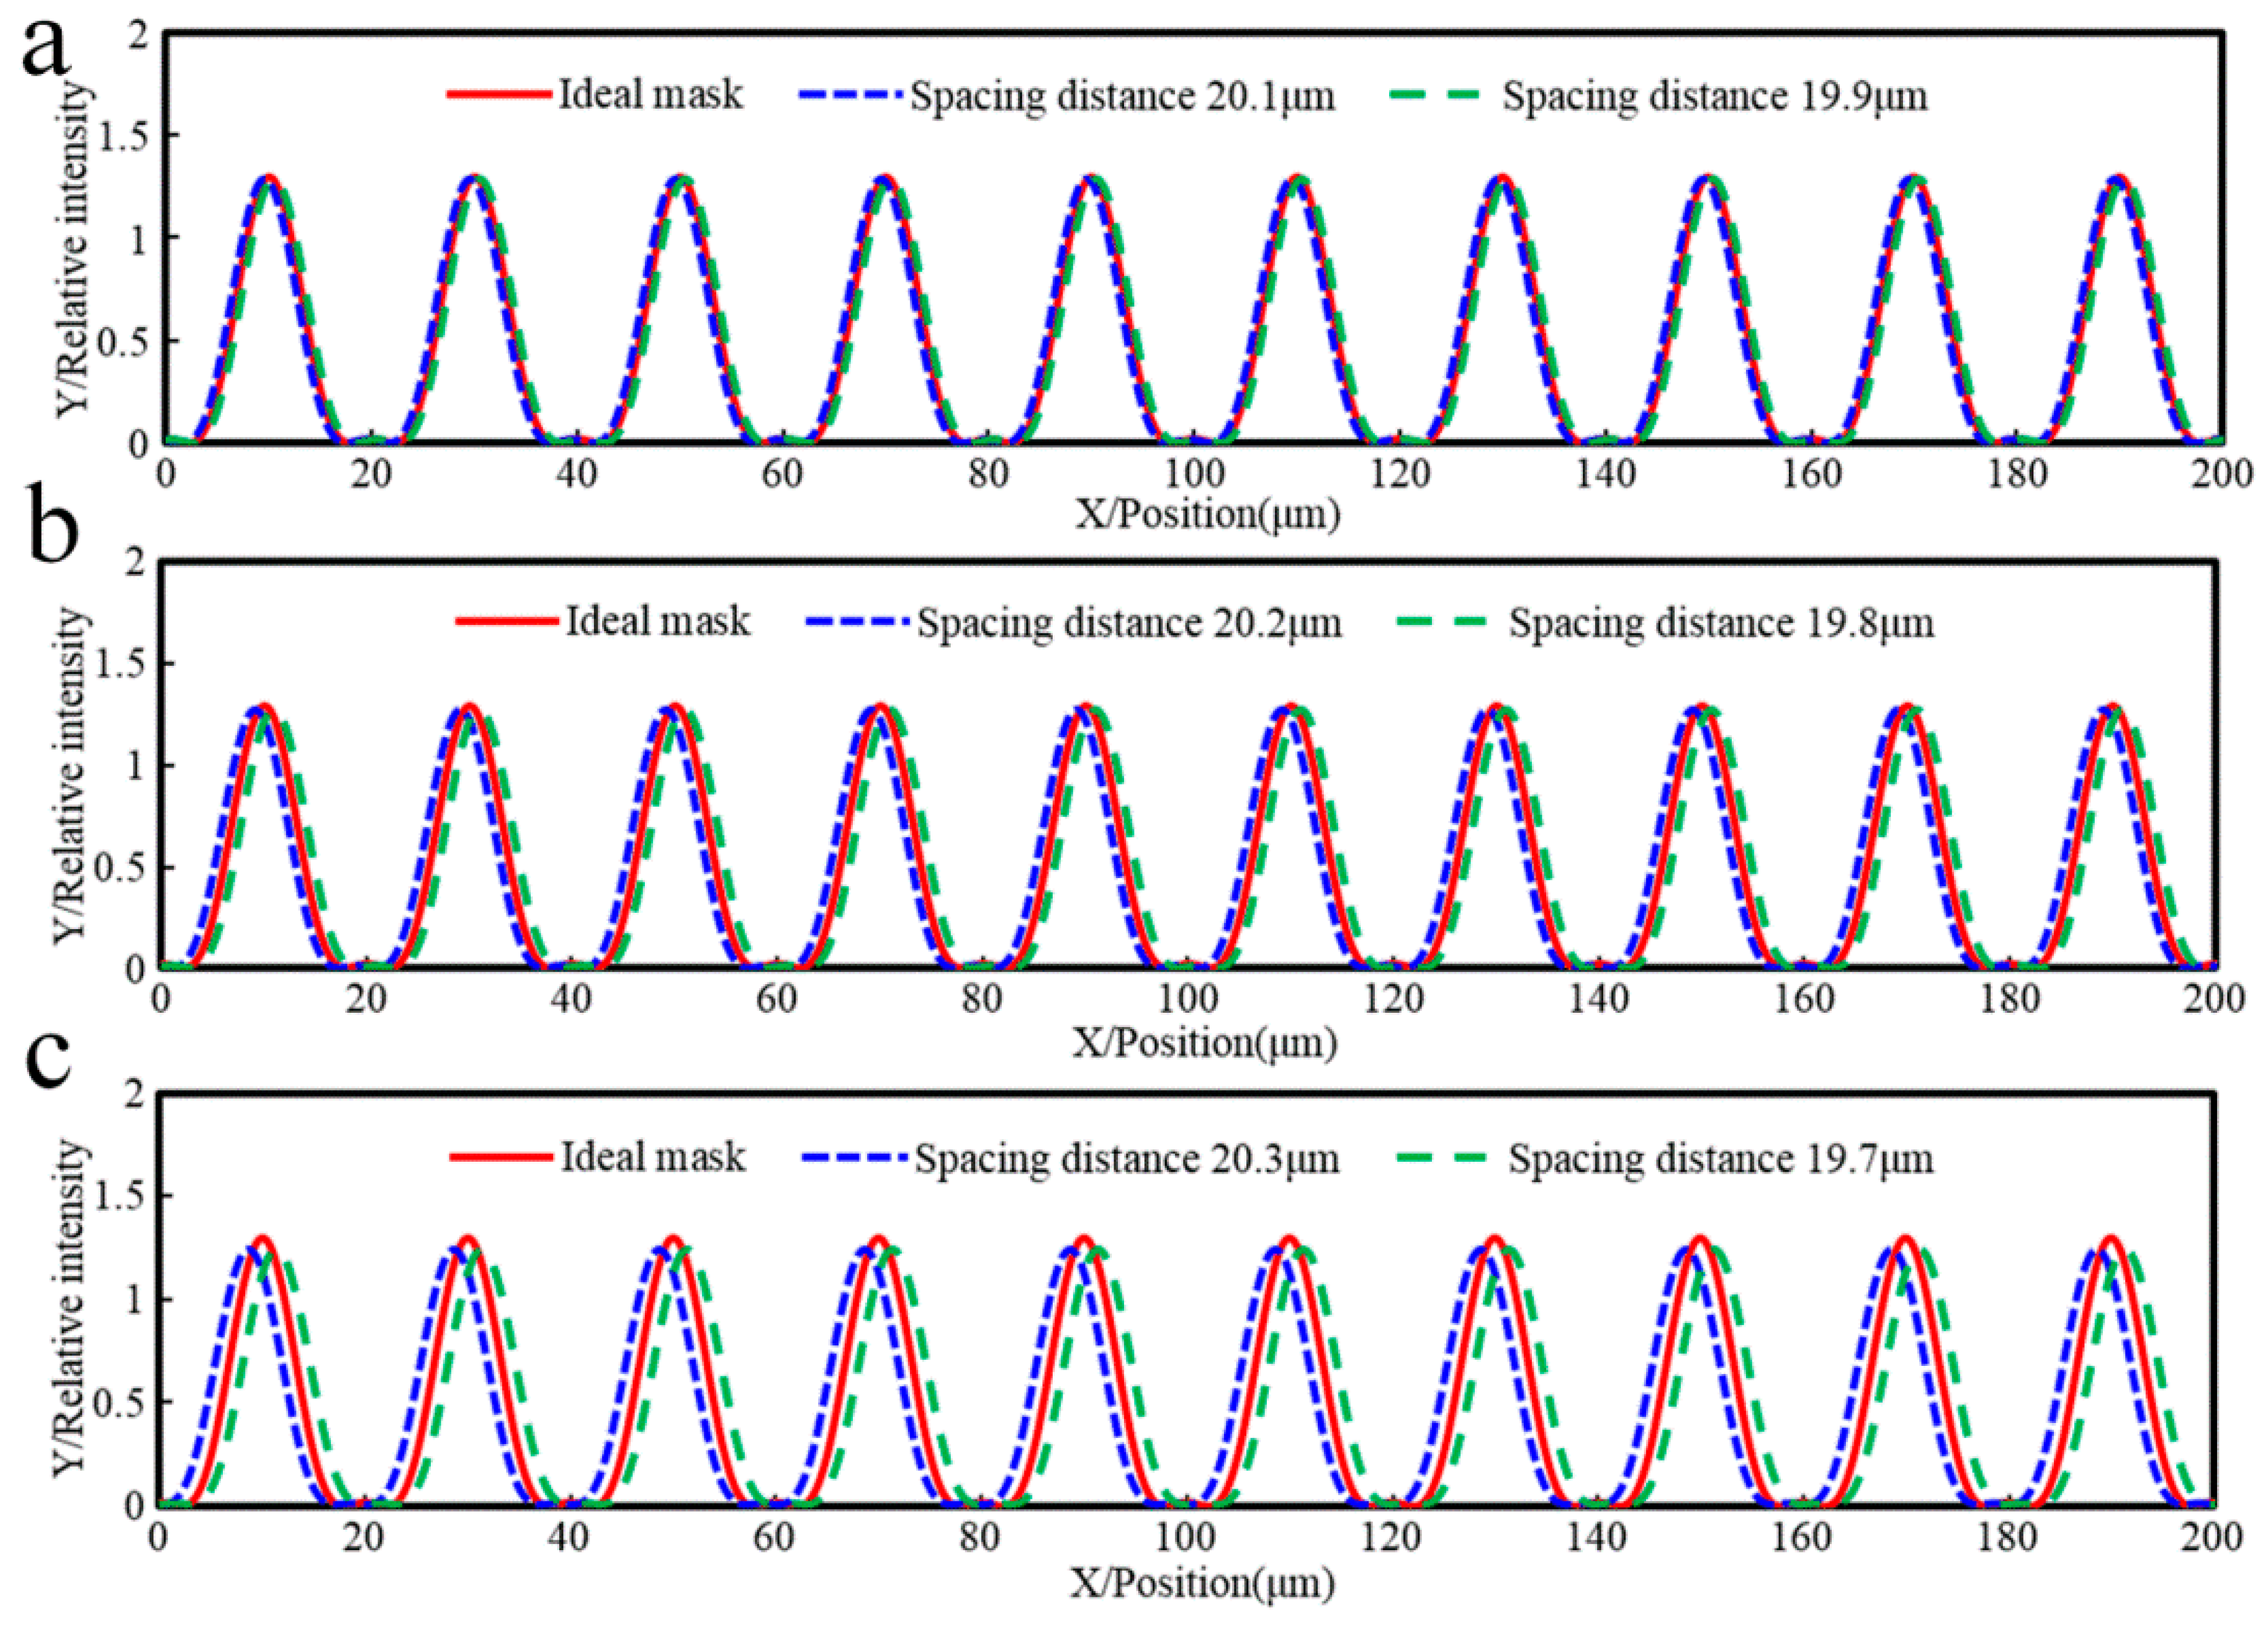
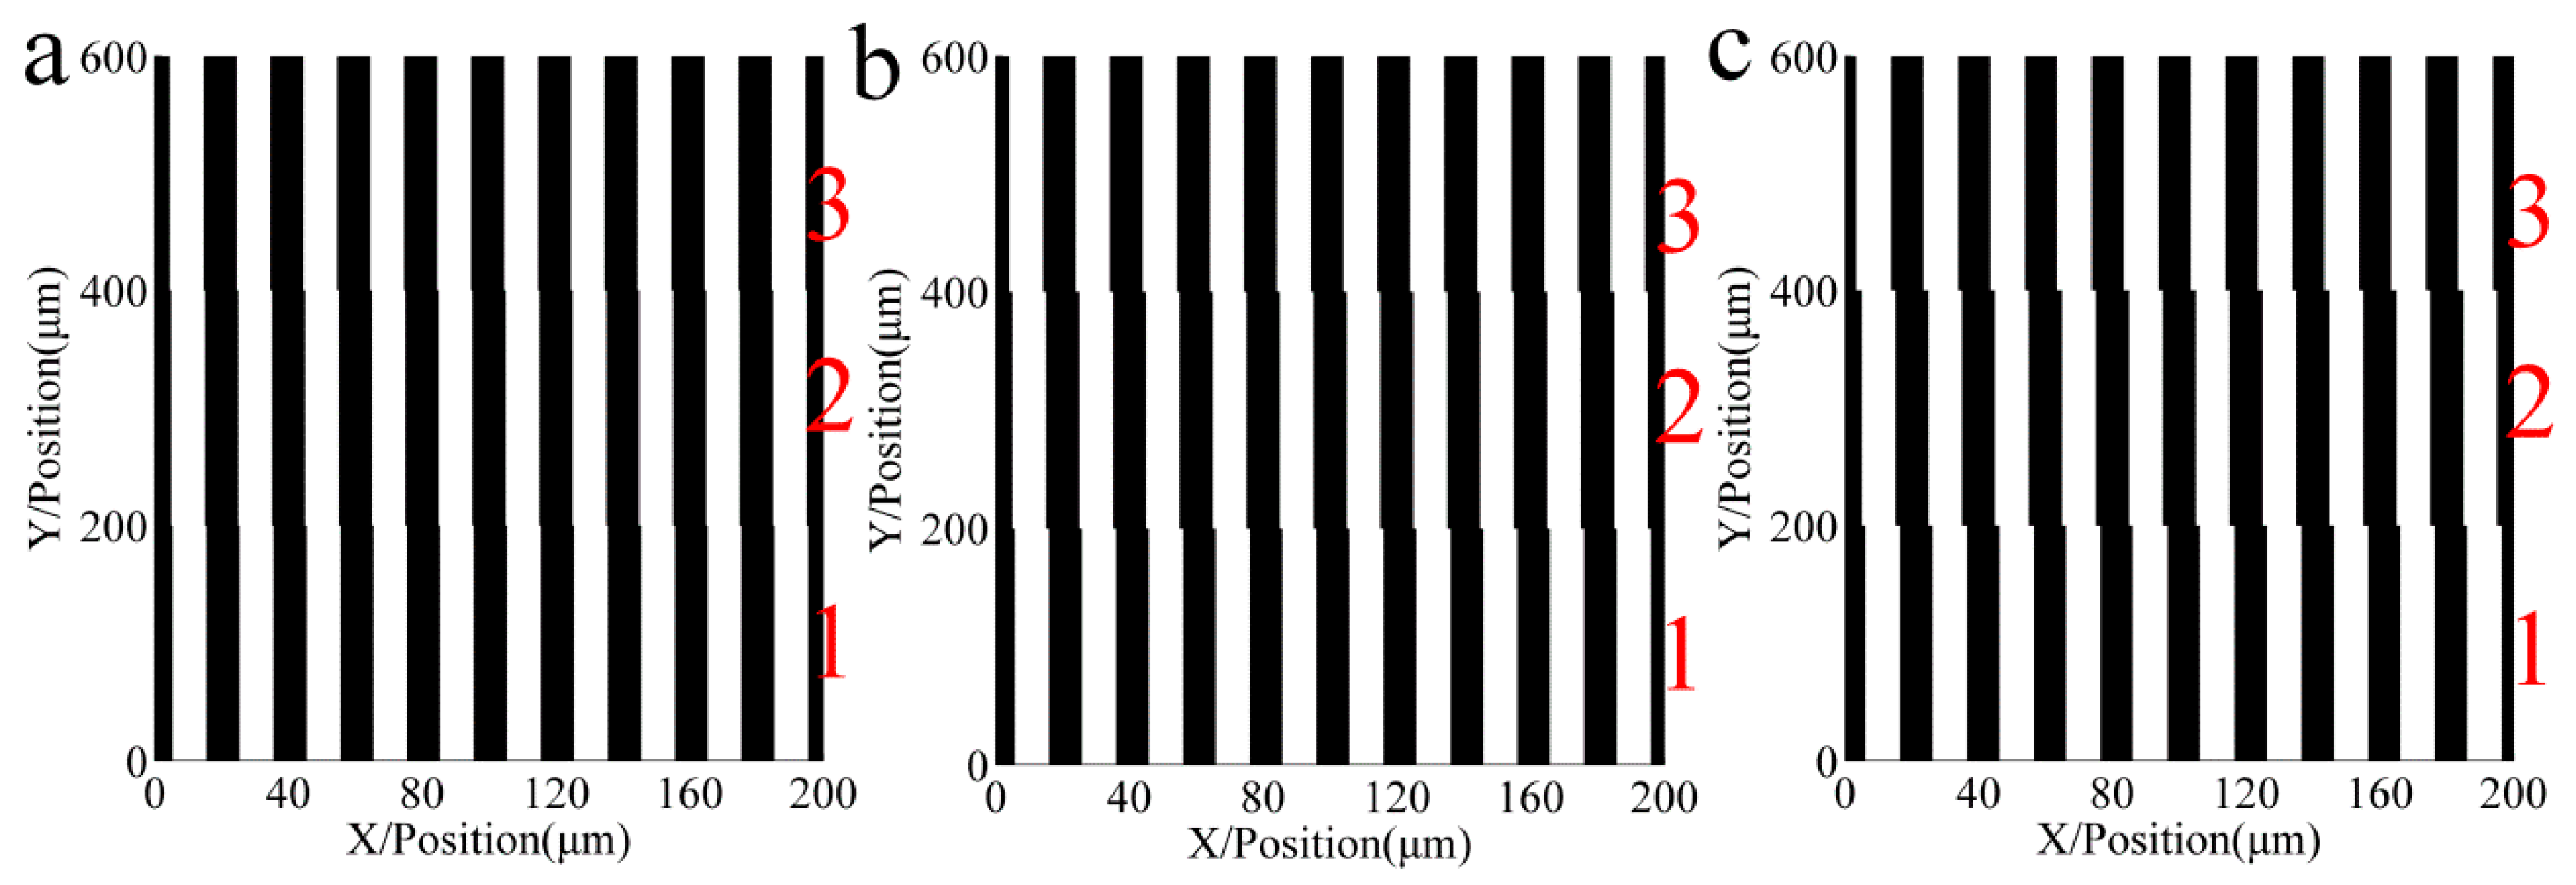
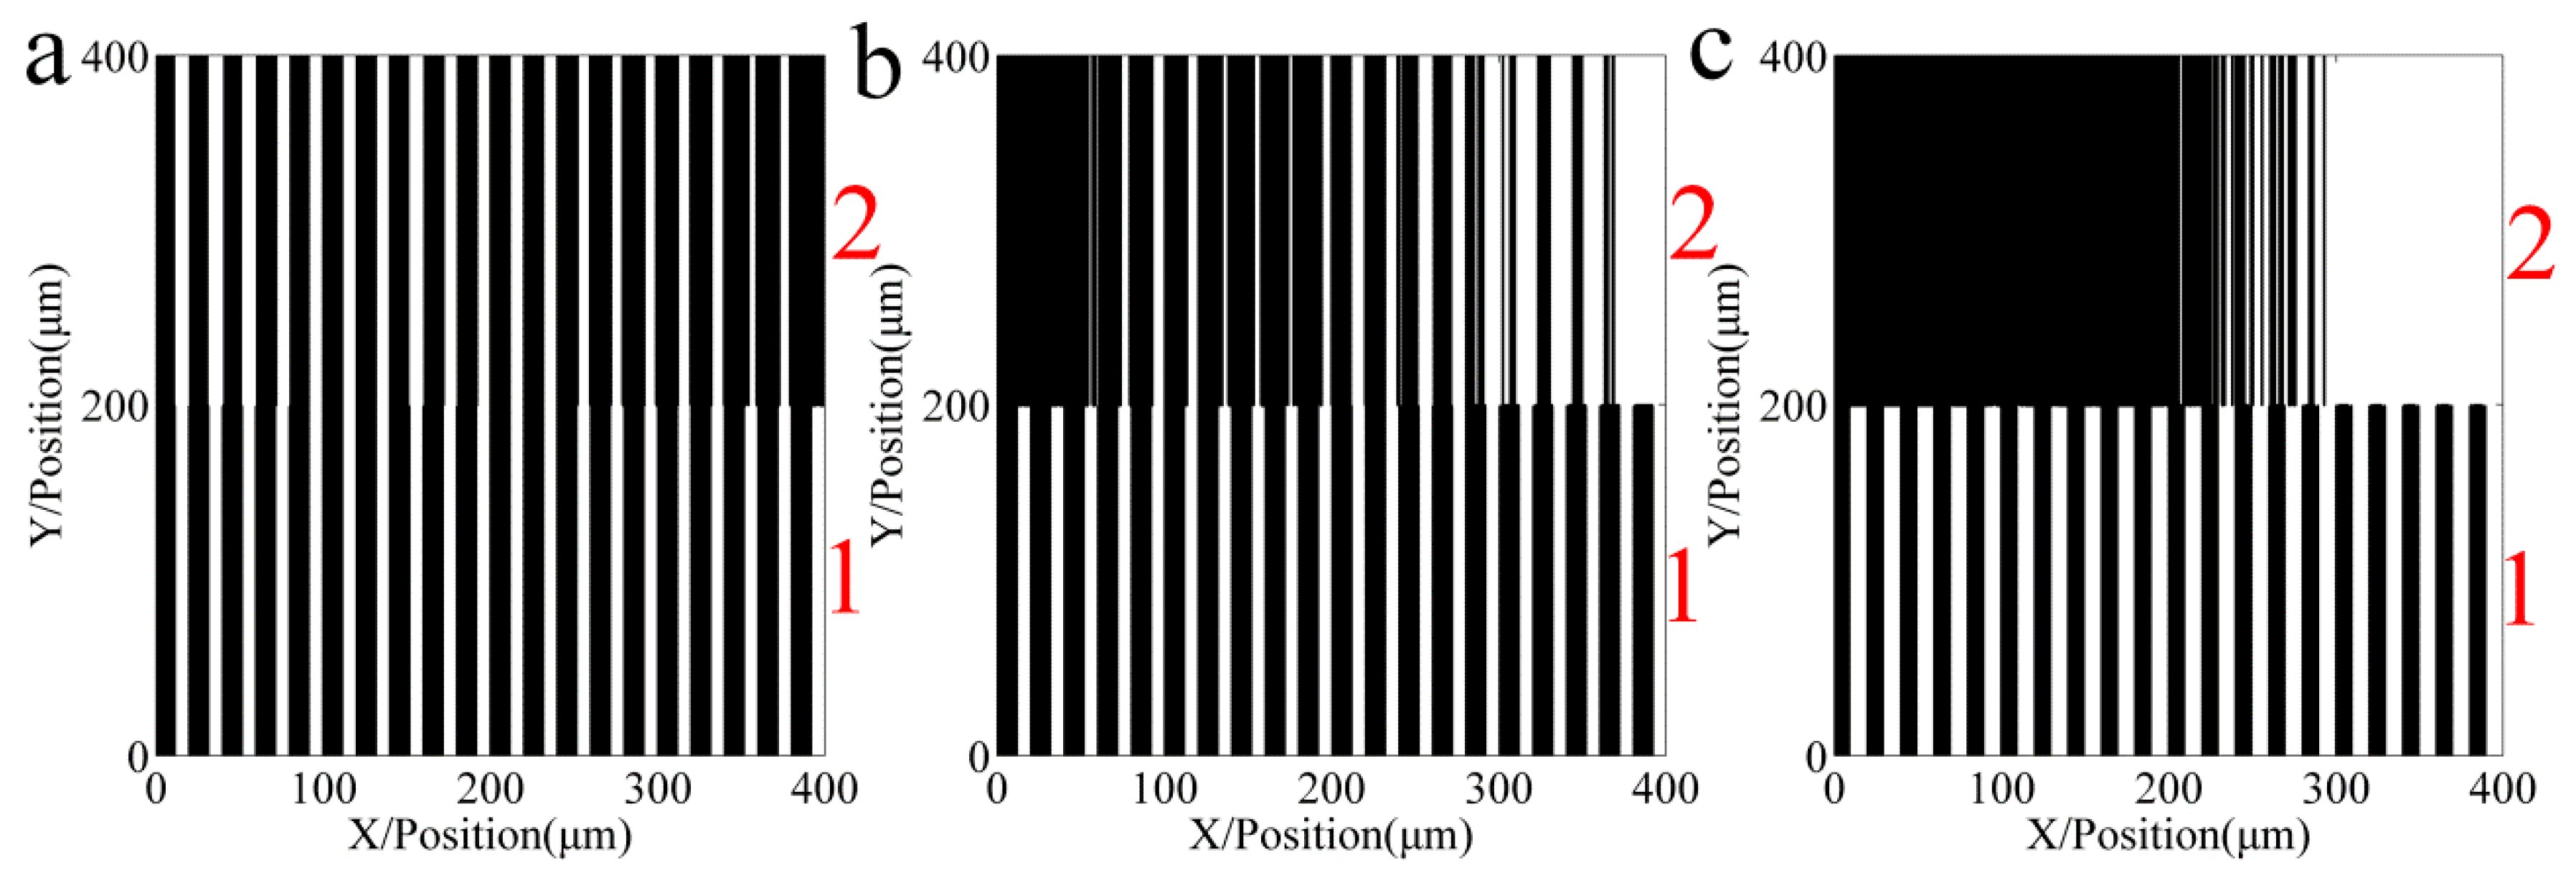
4.3. Influence of Spacing Distance Errors
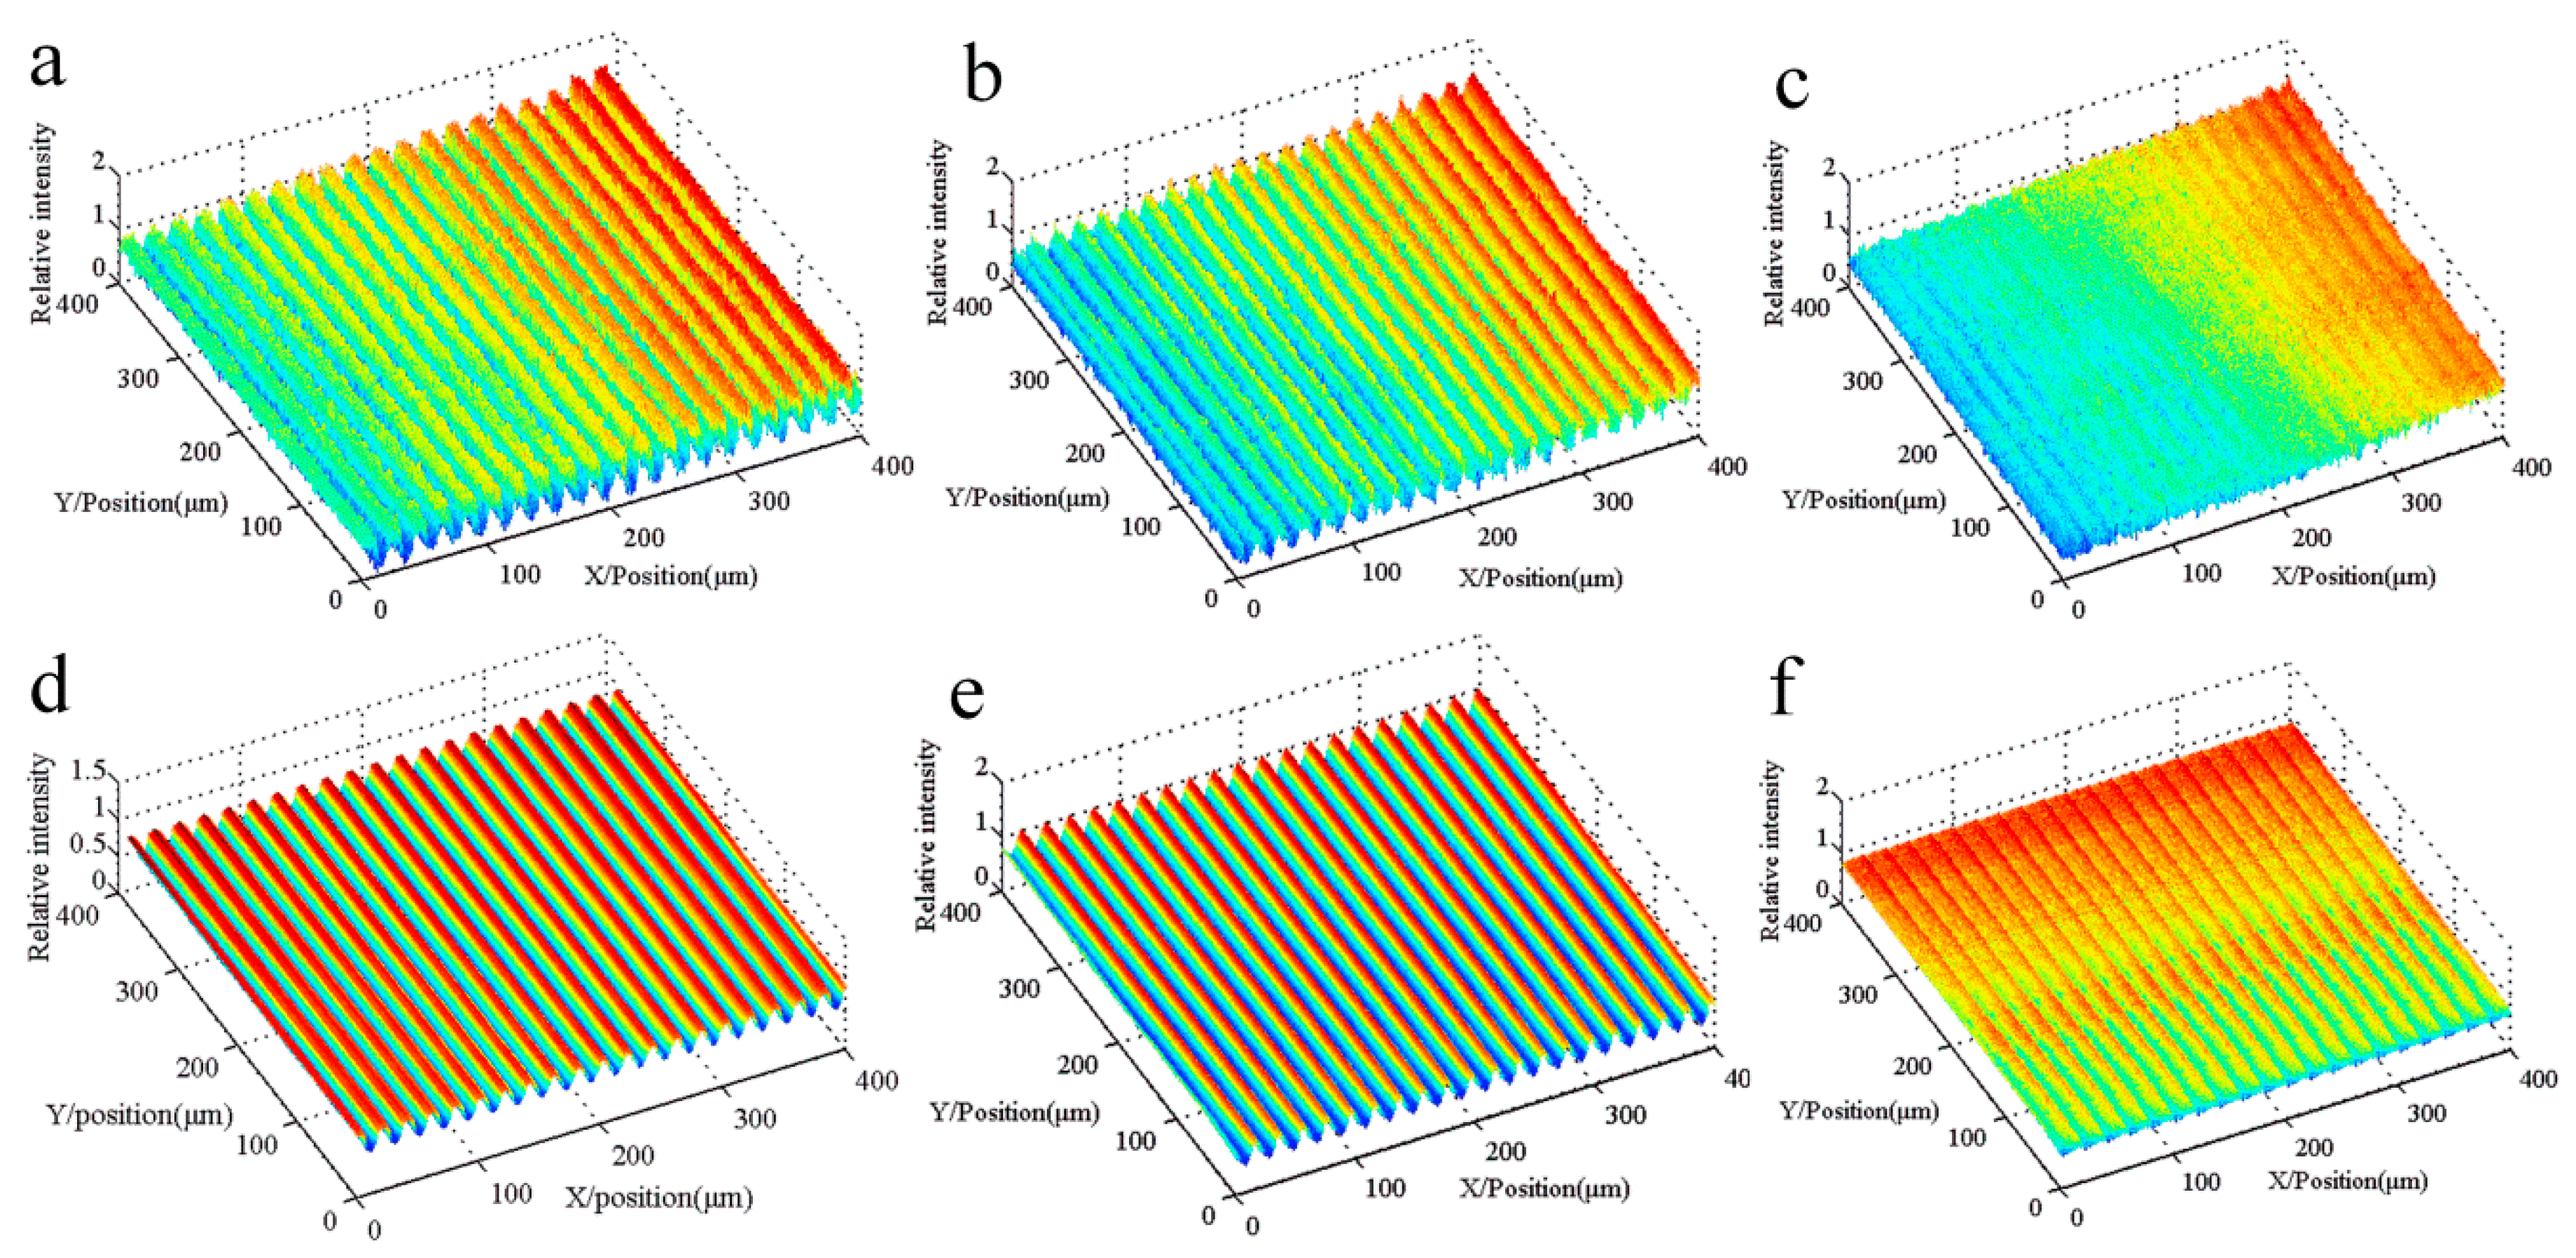
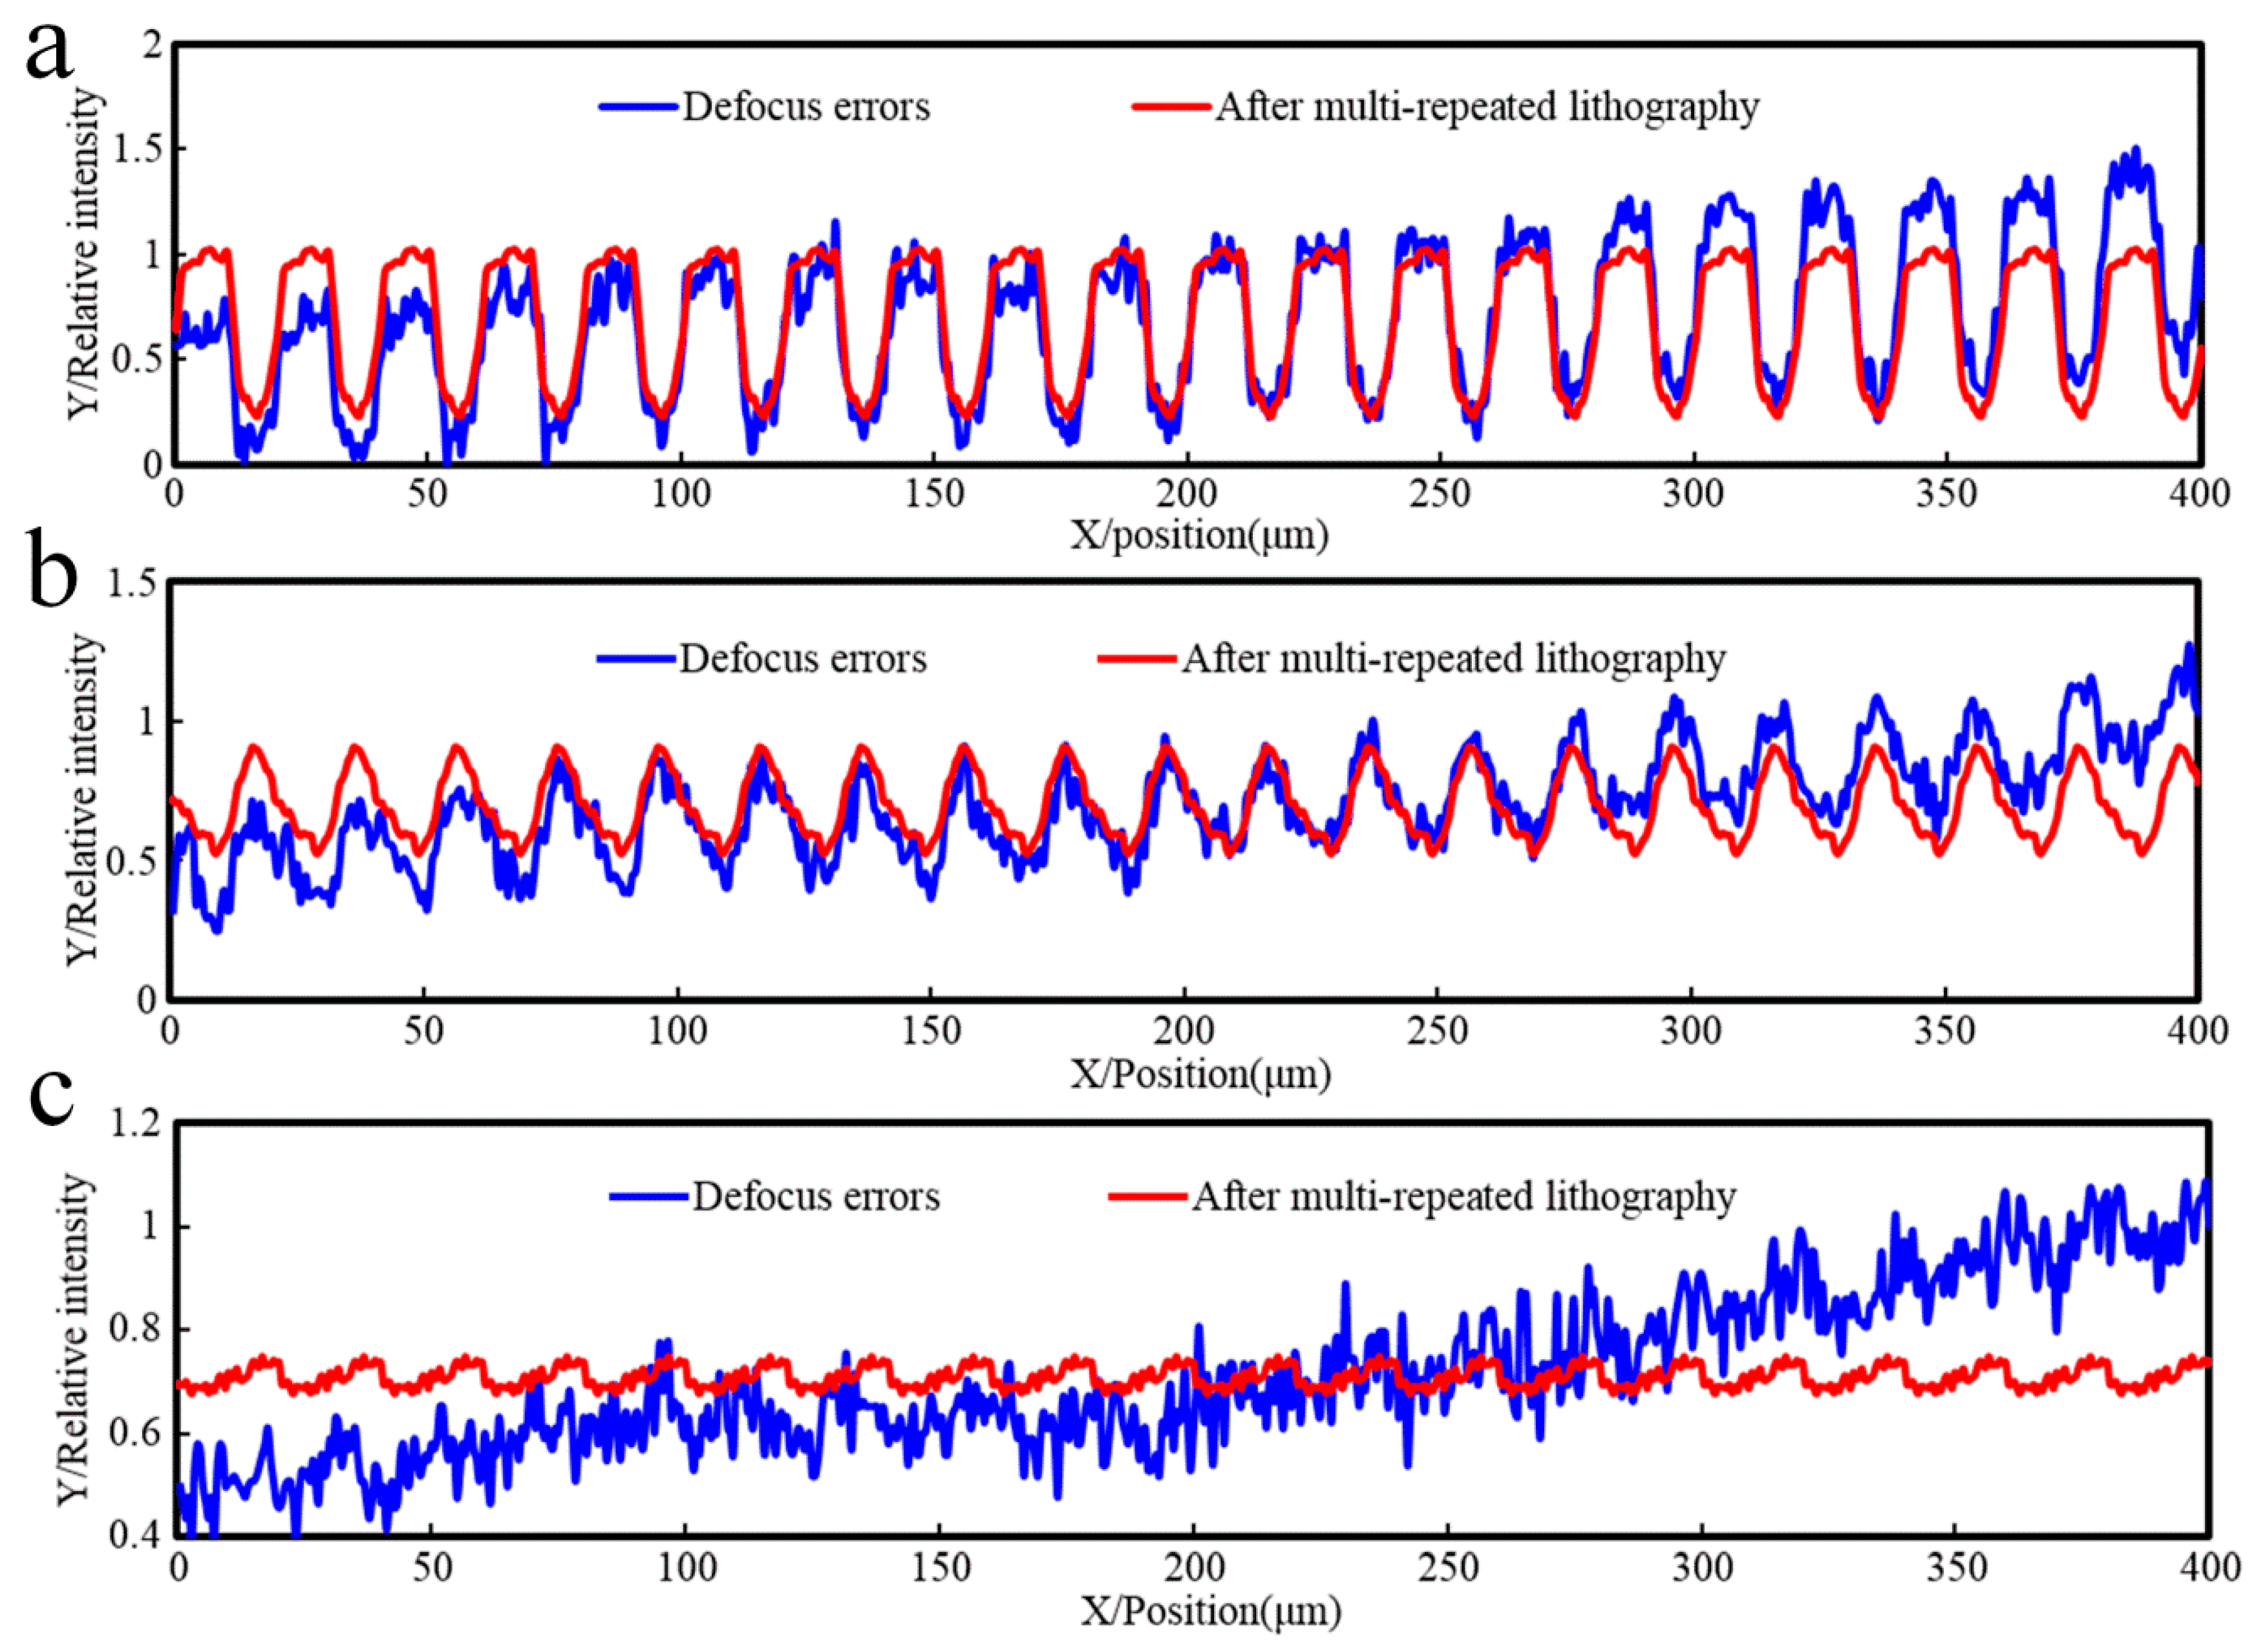
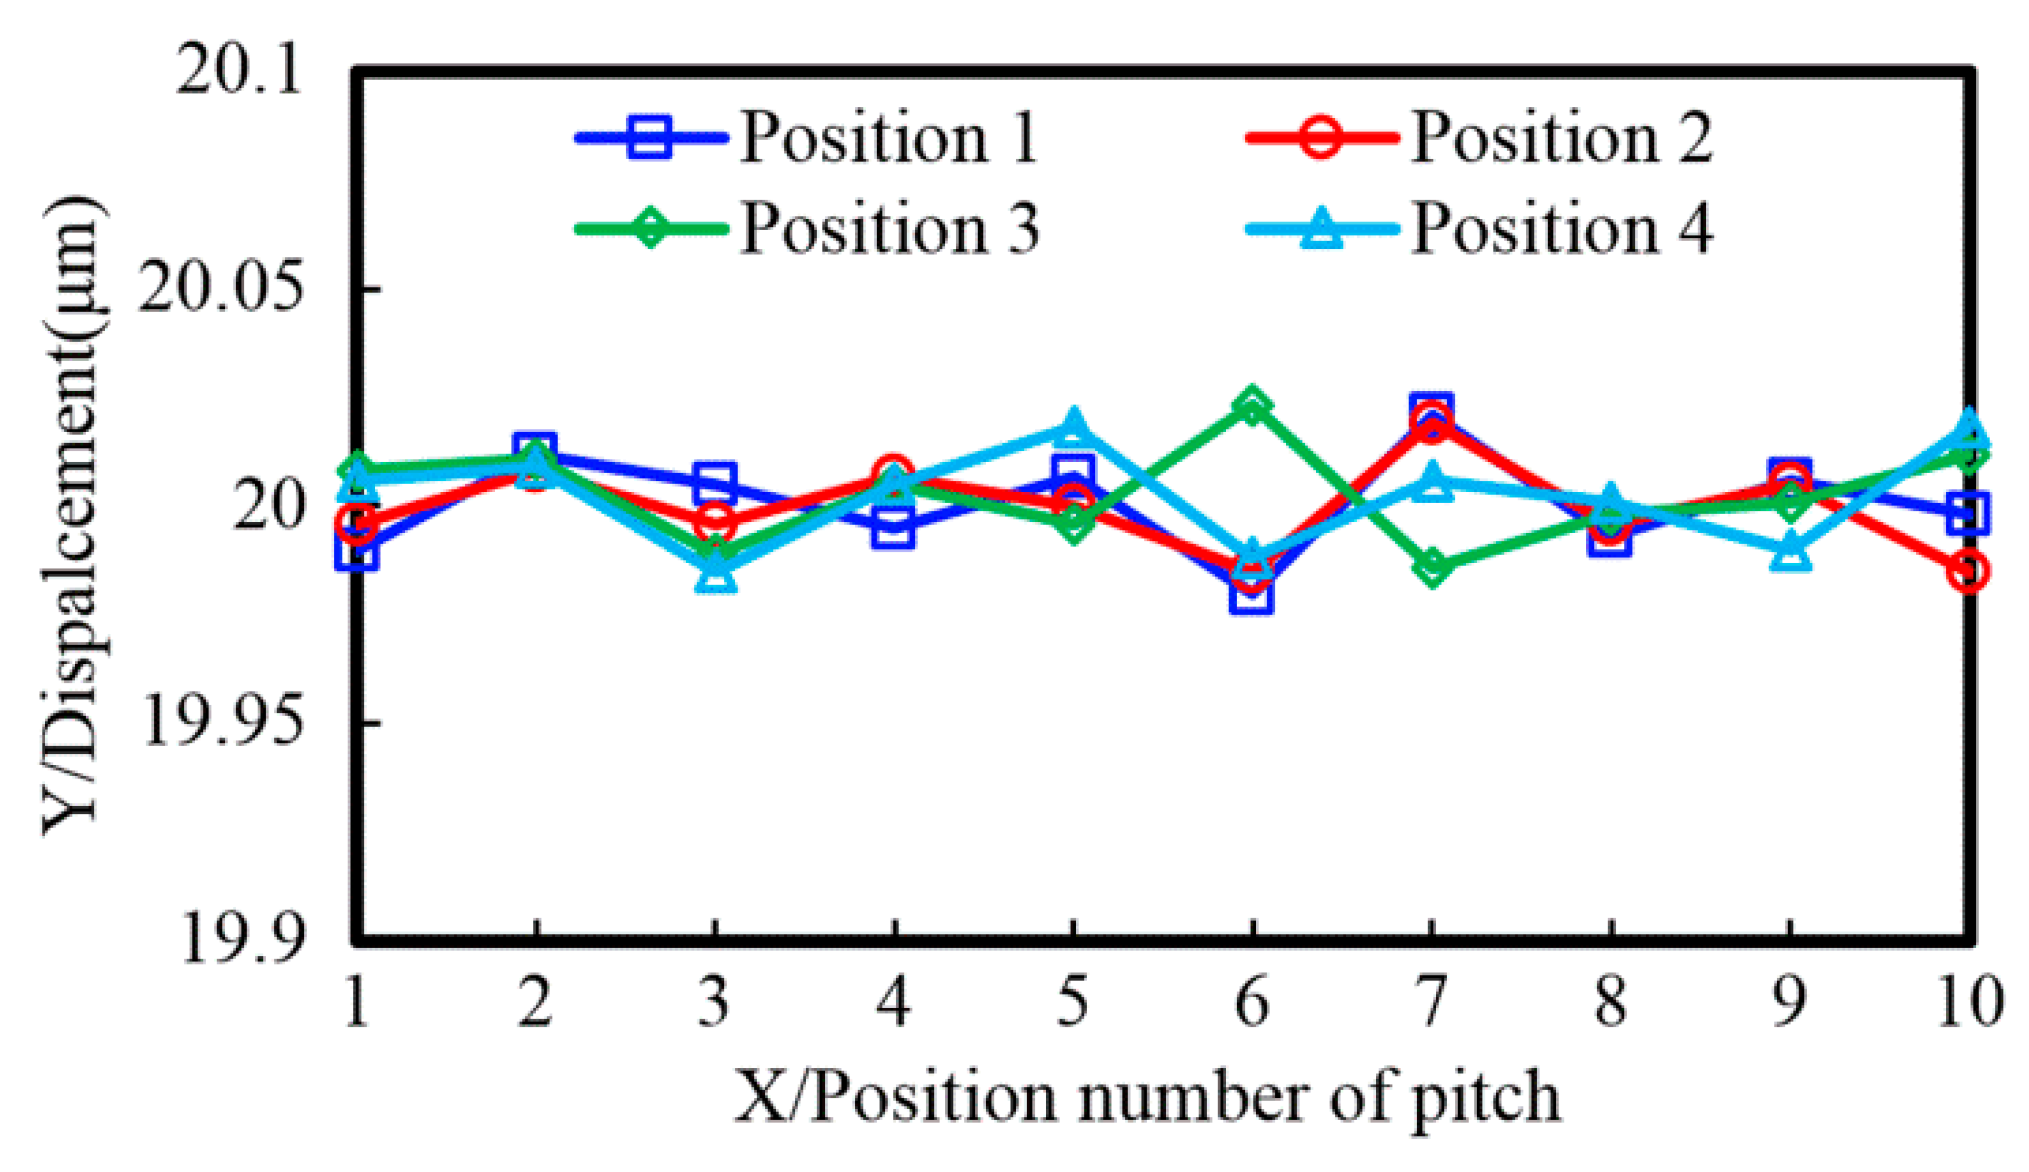
4.4. Influence of Focal Plane Alignment Errors
5. Experiment Results and Discussion
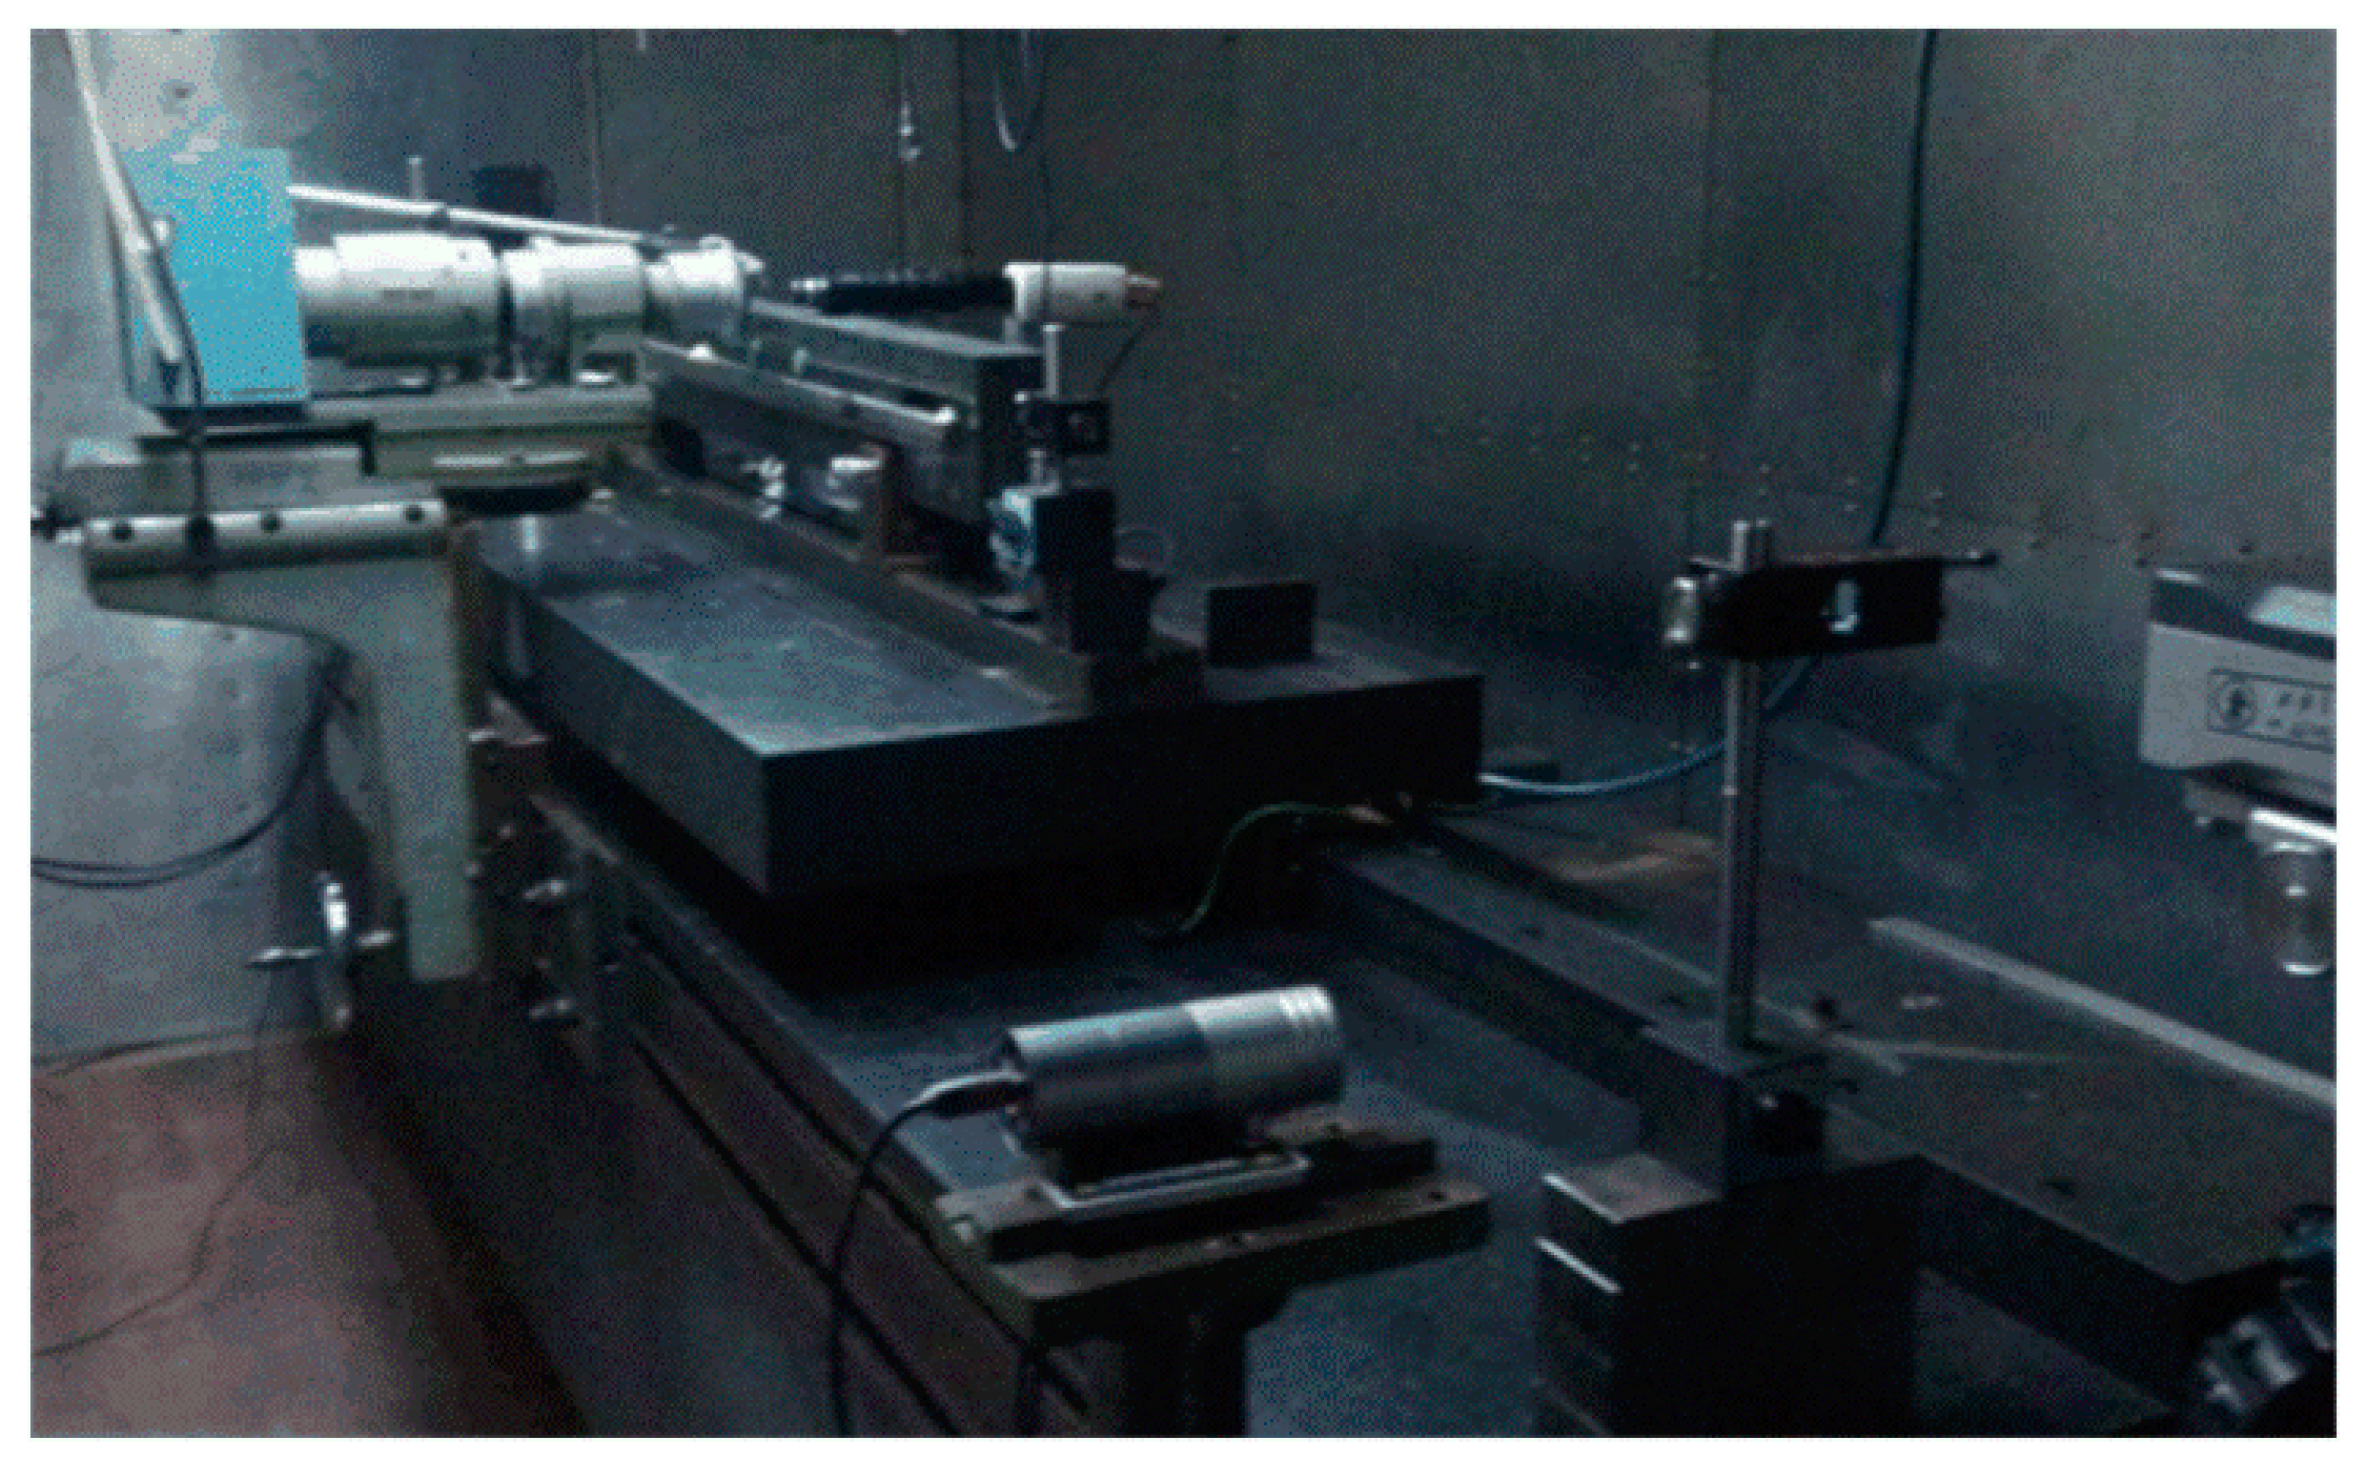
5.1. Experimental Setup
- (1)
- Abbe alignment criteria.
- (2)
- Ultra-precision porous aerostatic bearing technology.
- (3)
- Precision temperature sensor compensation.
- (4)
- Pulse number error compensation.
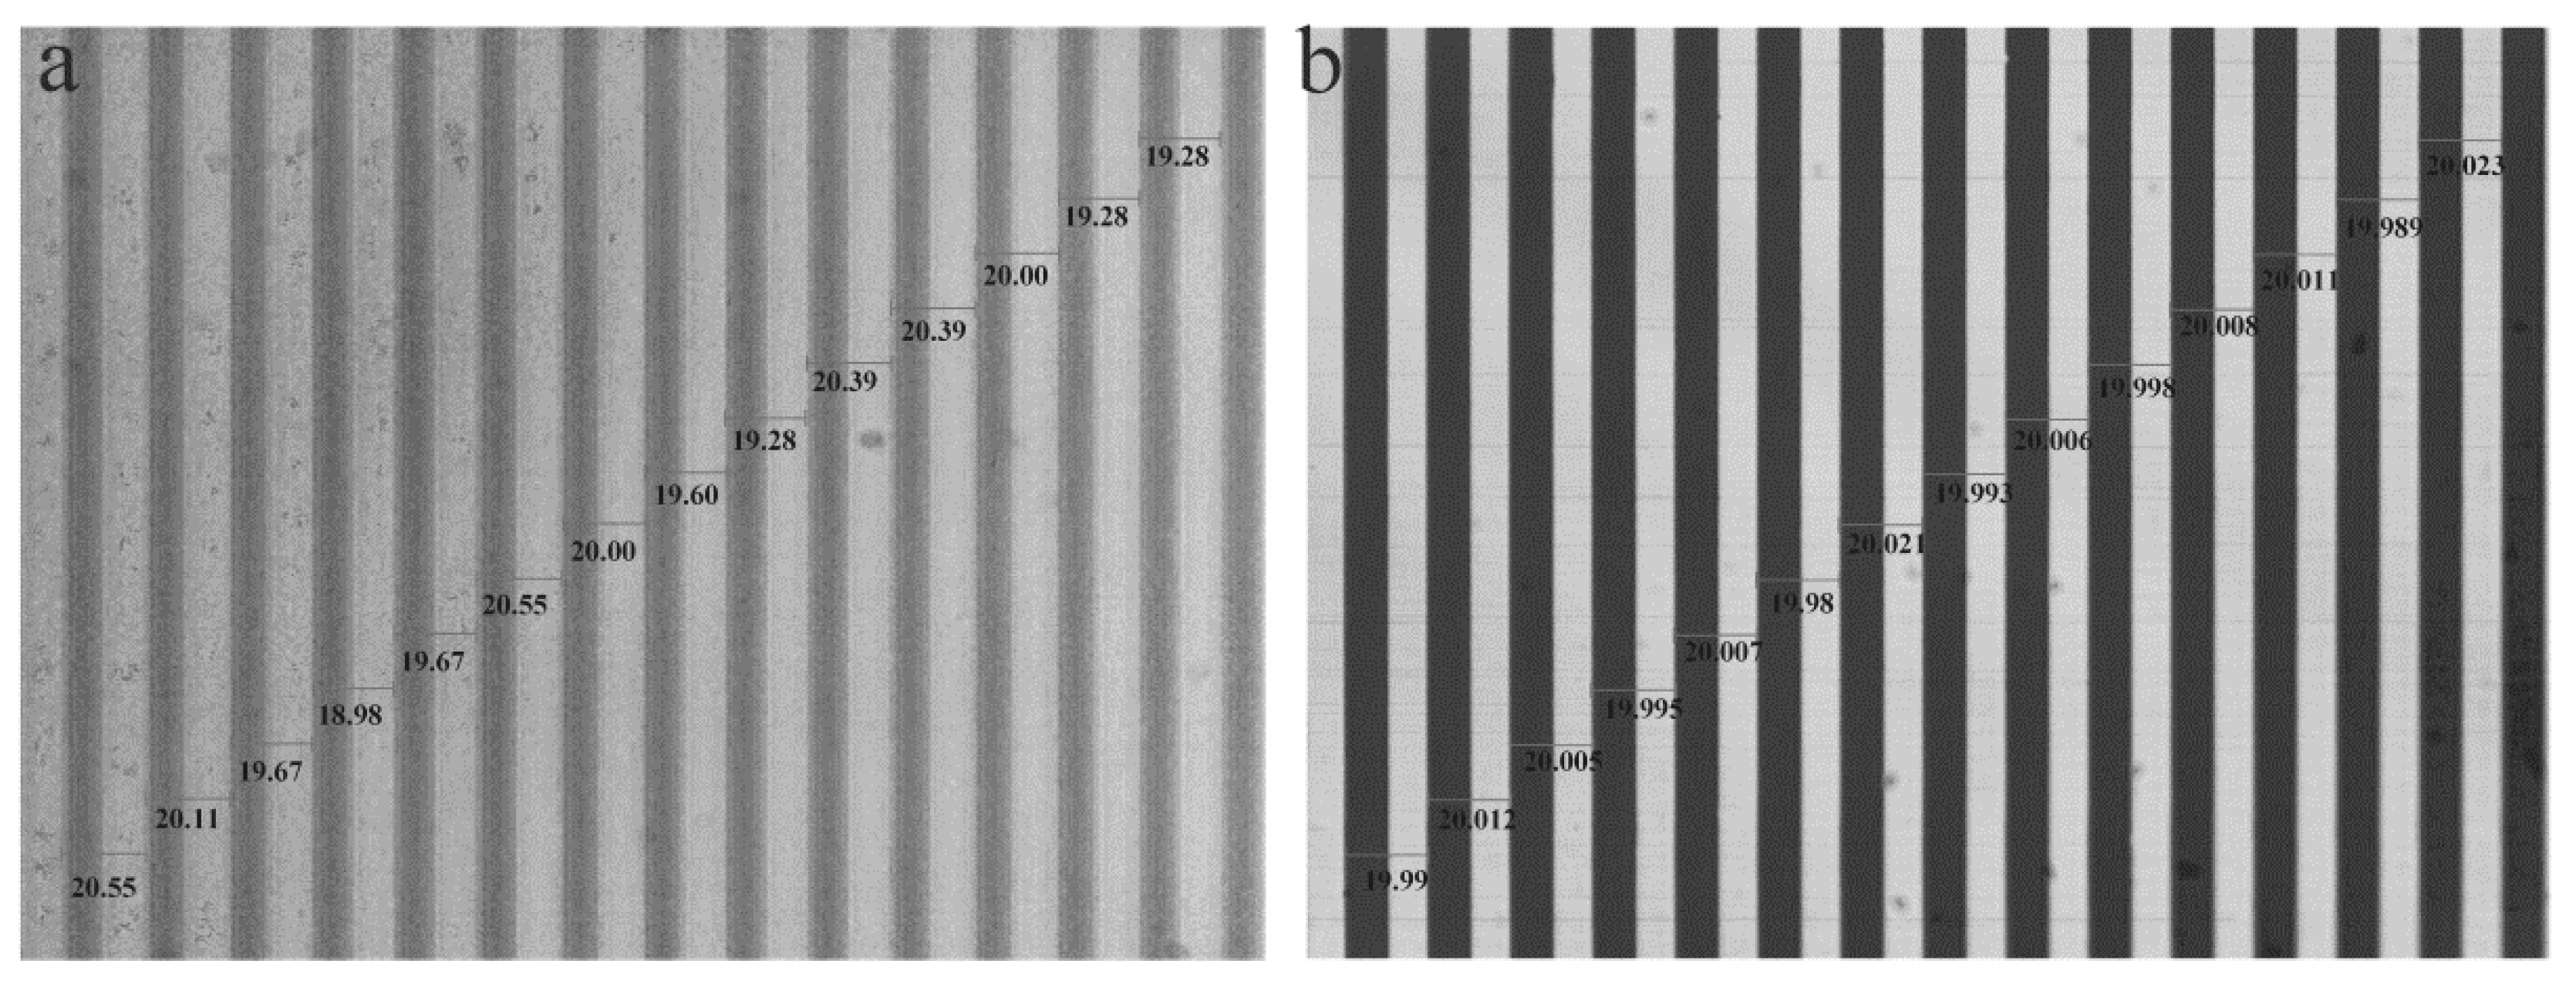
5.2. Pitch Accuracy
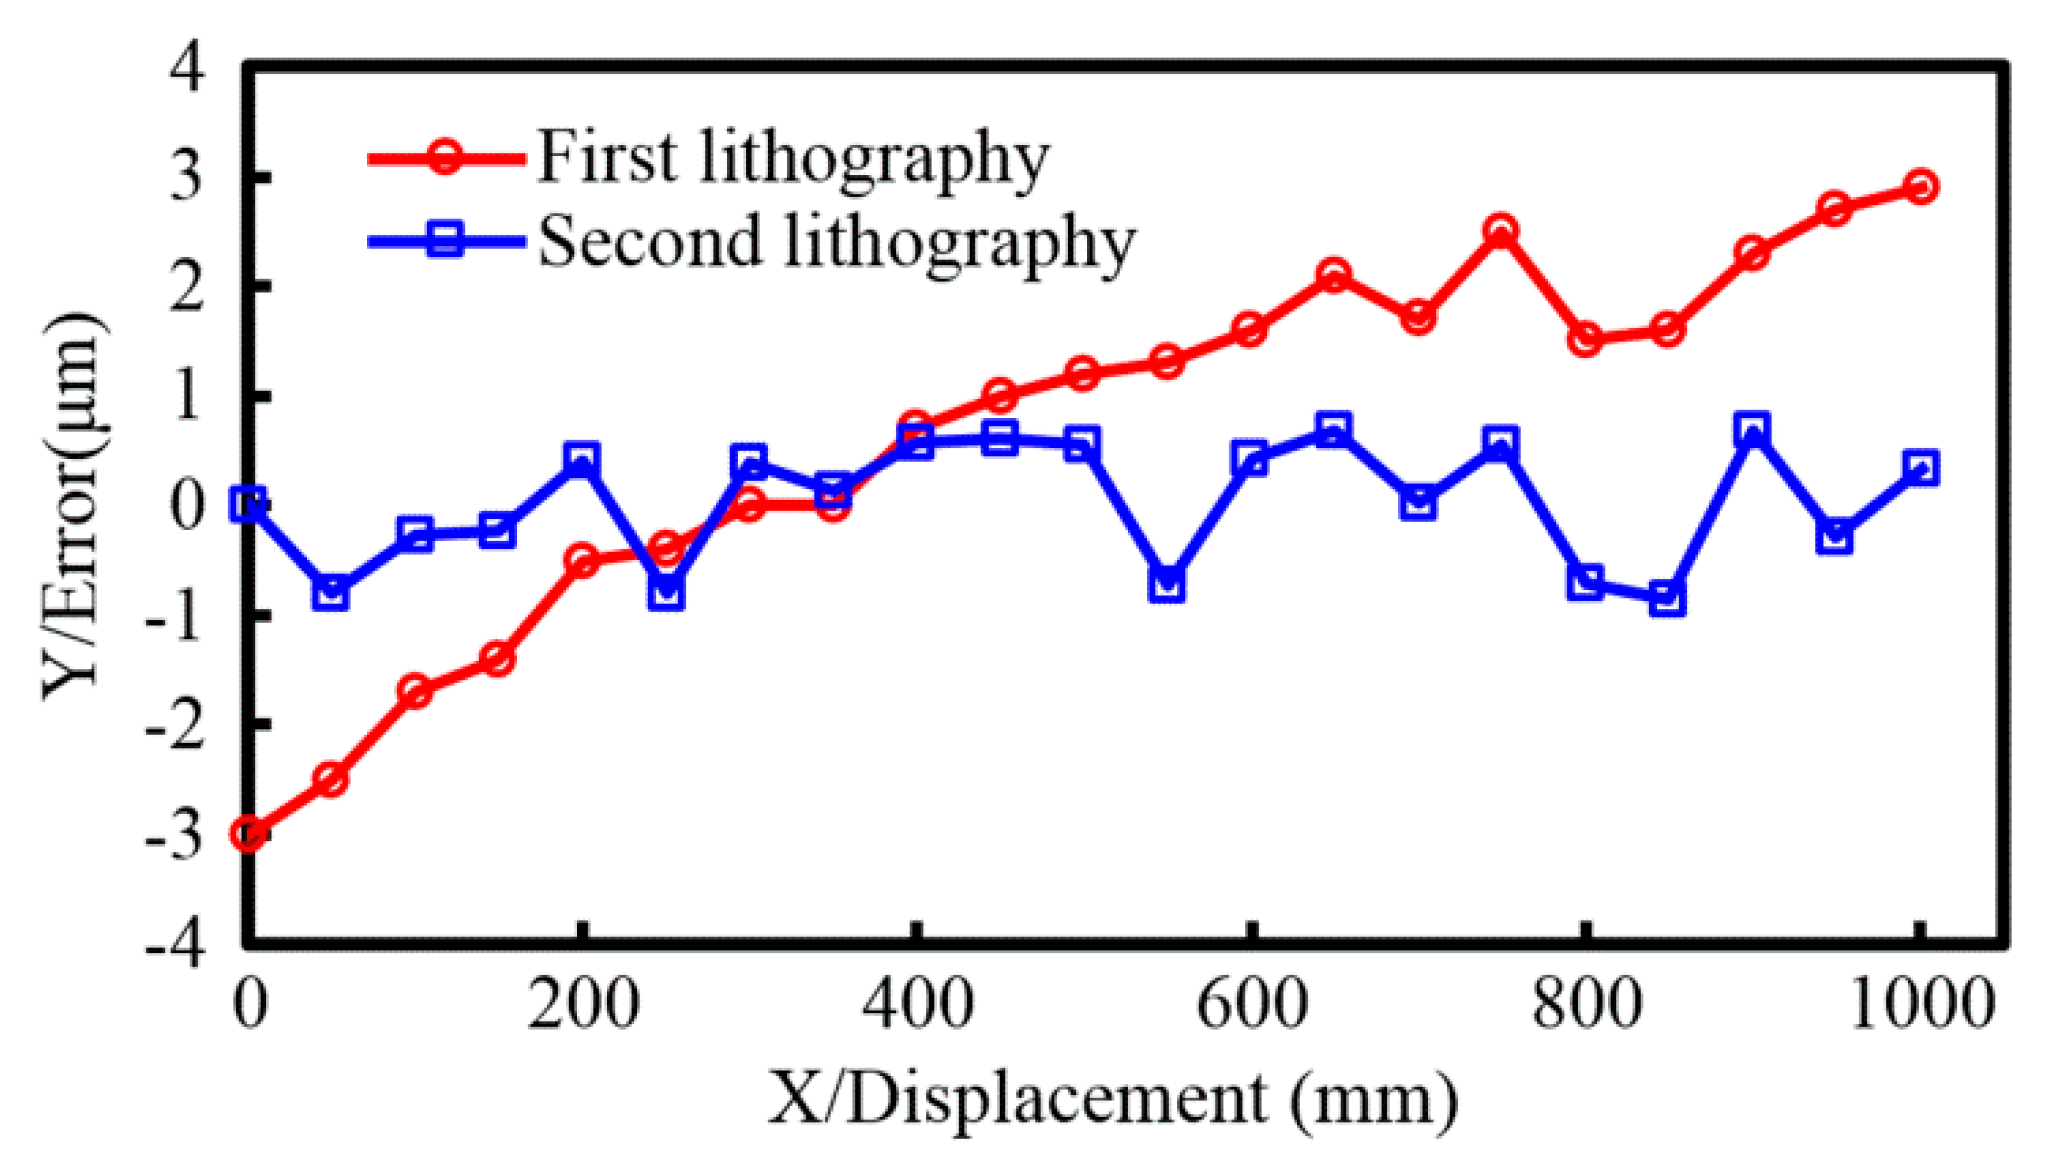
5.3. Accuracy of a Linear Scale
6. Conclusions
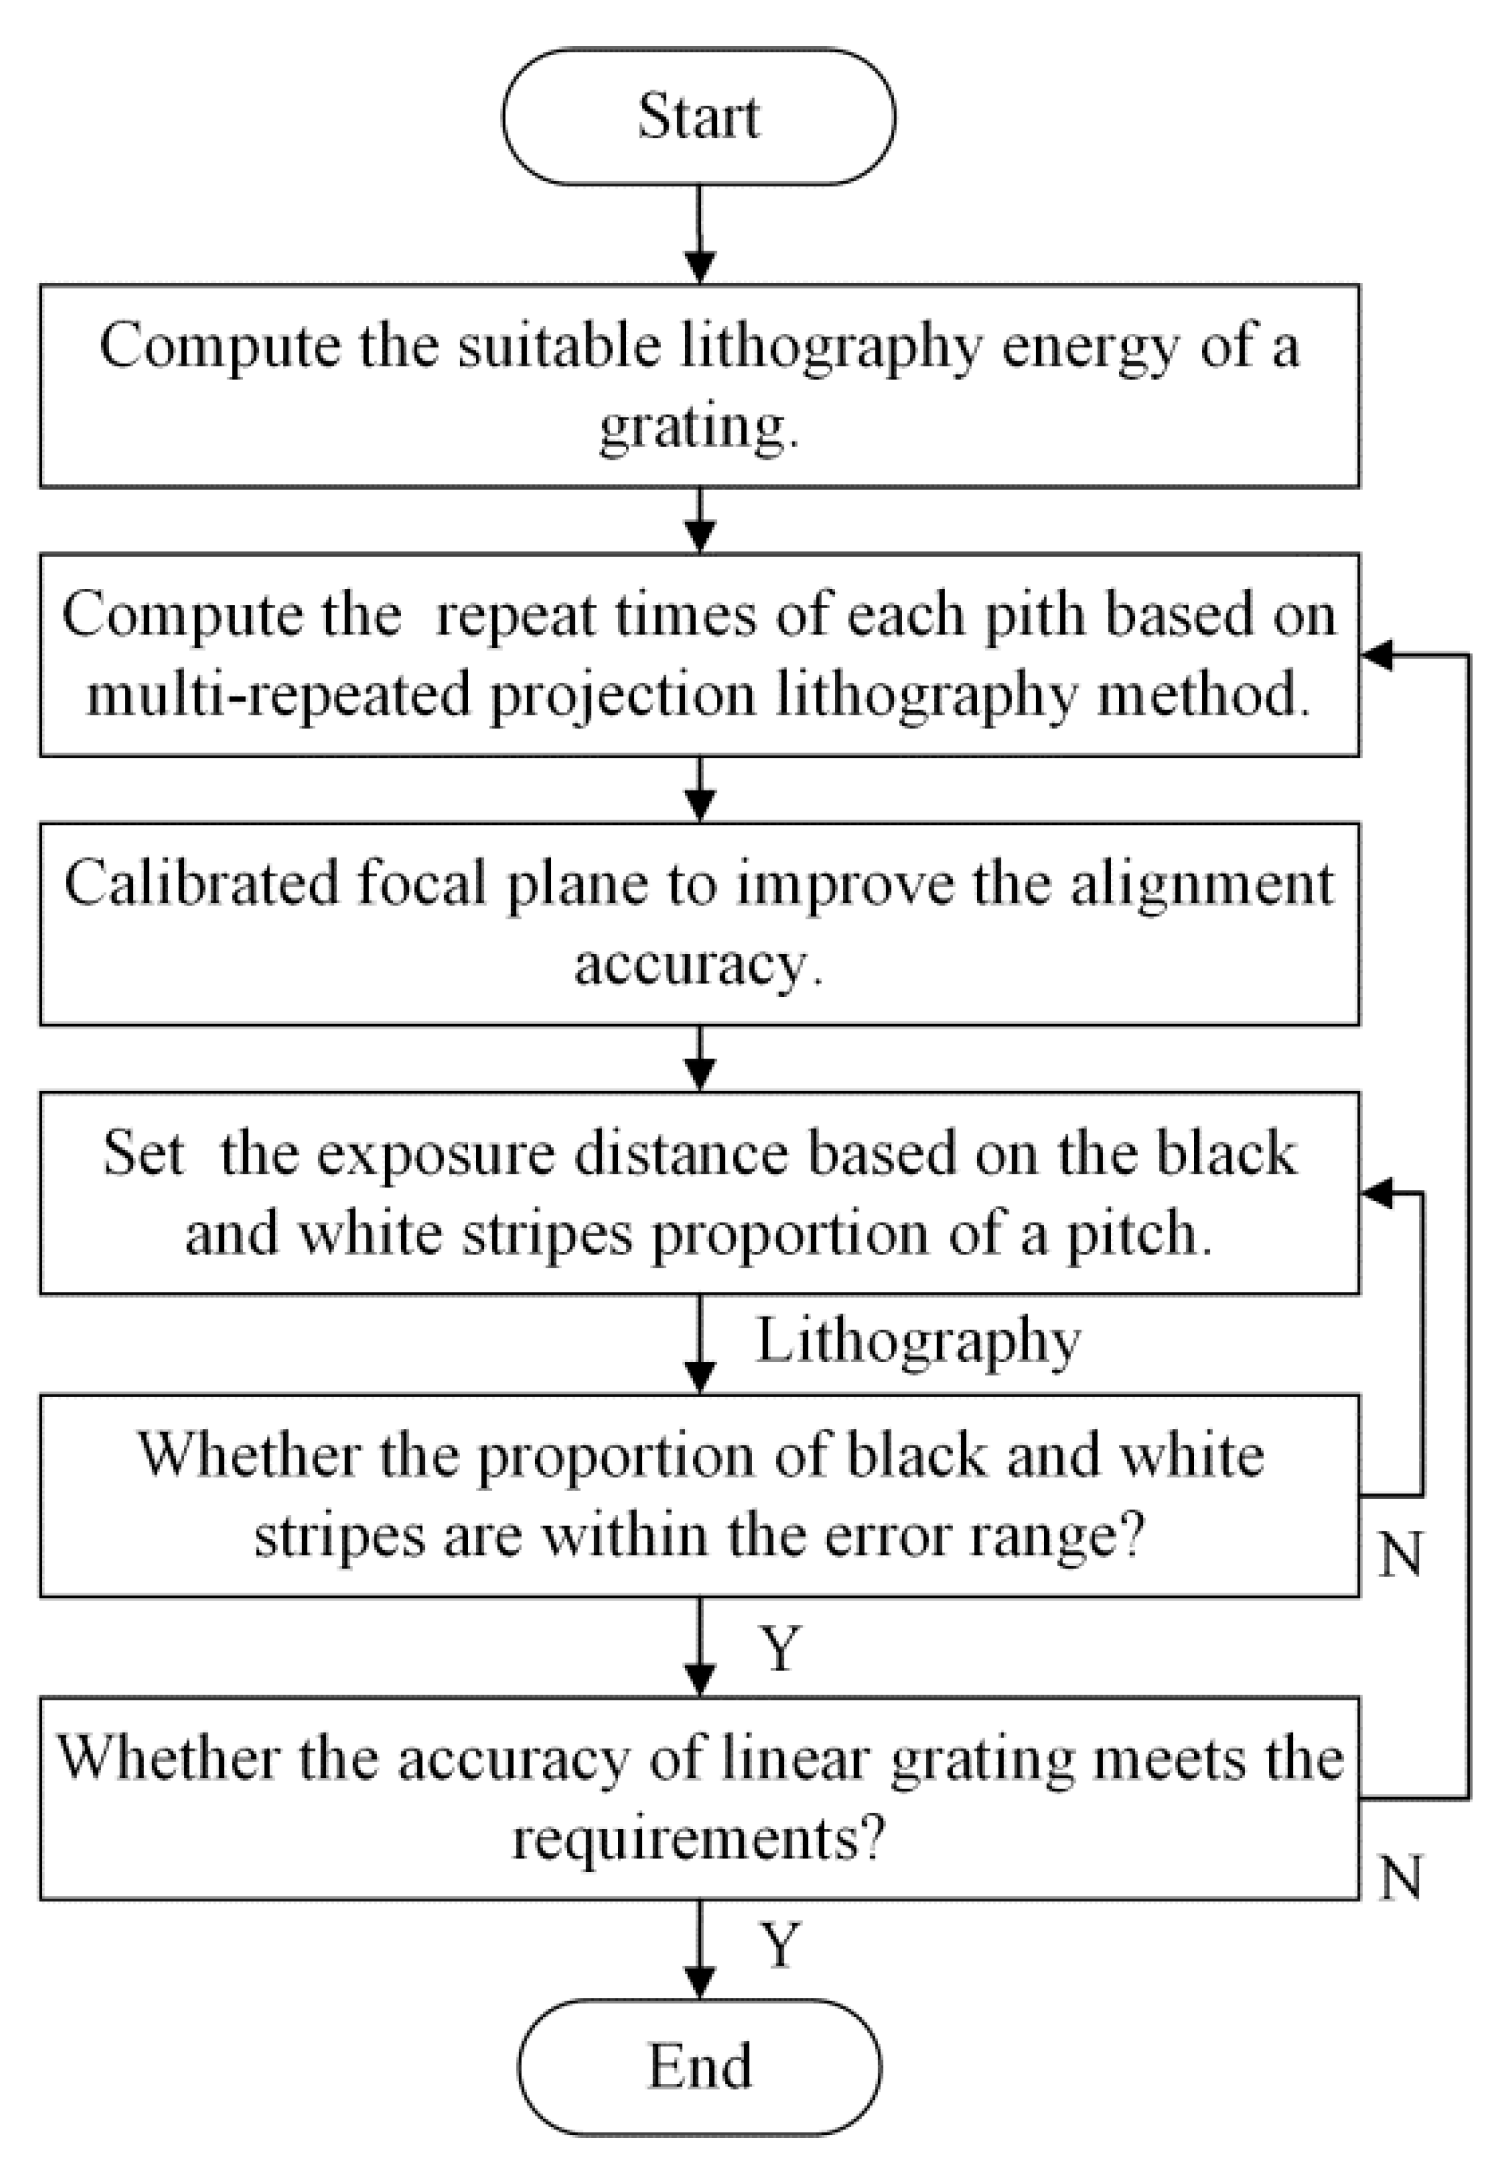
- (1)
- The multi-repeat of the different grating positions with pitch error achieved a uniform light intensity distribution, which realized the homogenized error compensation of the whole length grating, making it so the lithography system reduces the requirements of mask accuracy.
- (2)
- Increasing the exposure repetitions of the grating strips will reduce pitch errors, and when the exposure repetitions are equal to the number of pitches on the mask, the average homogenization error will be the minimum theoretically.
- (3)
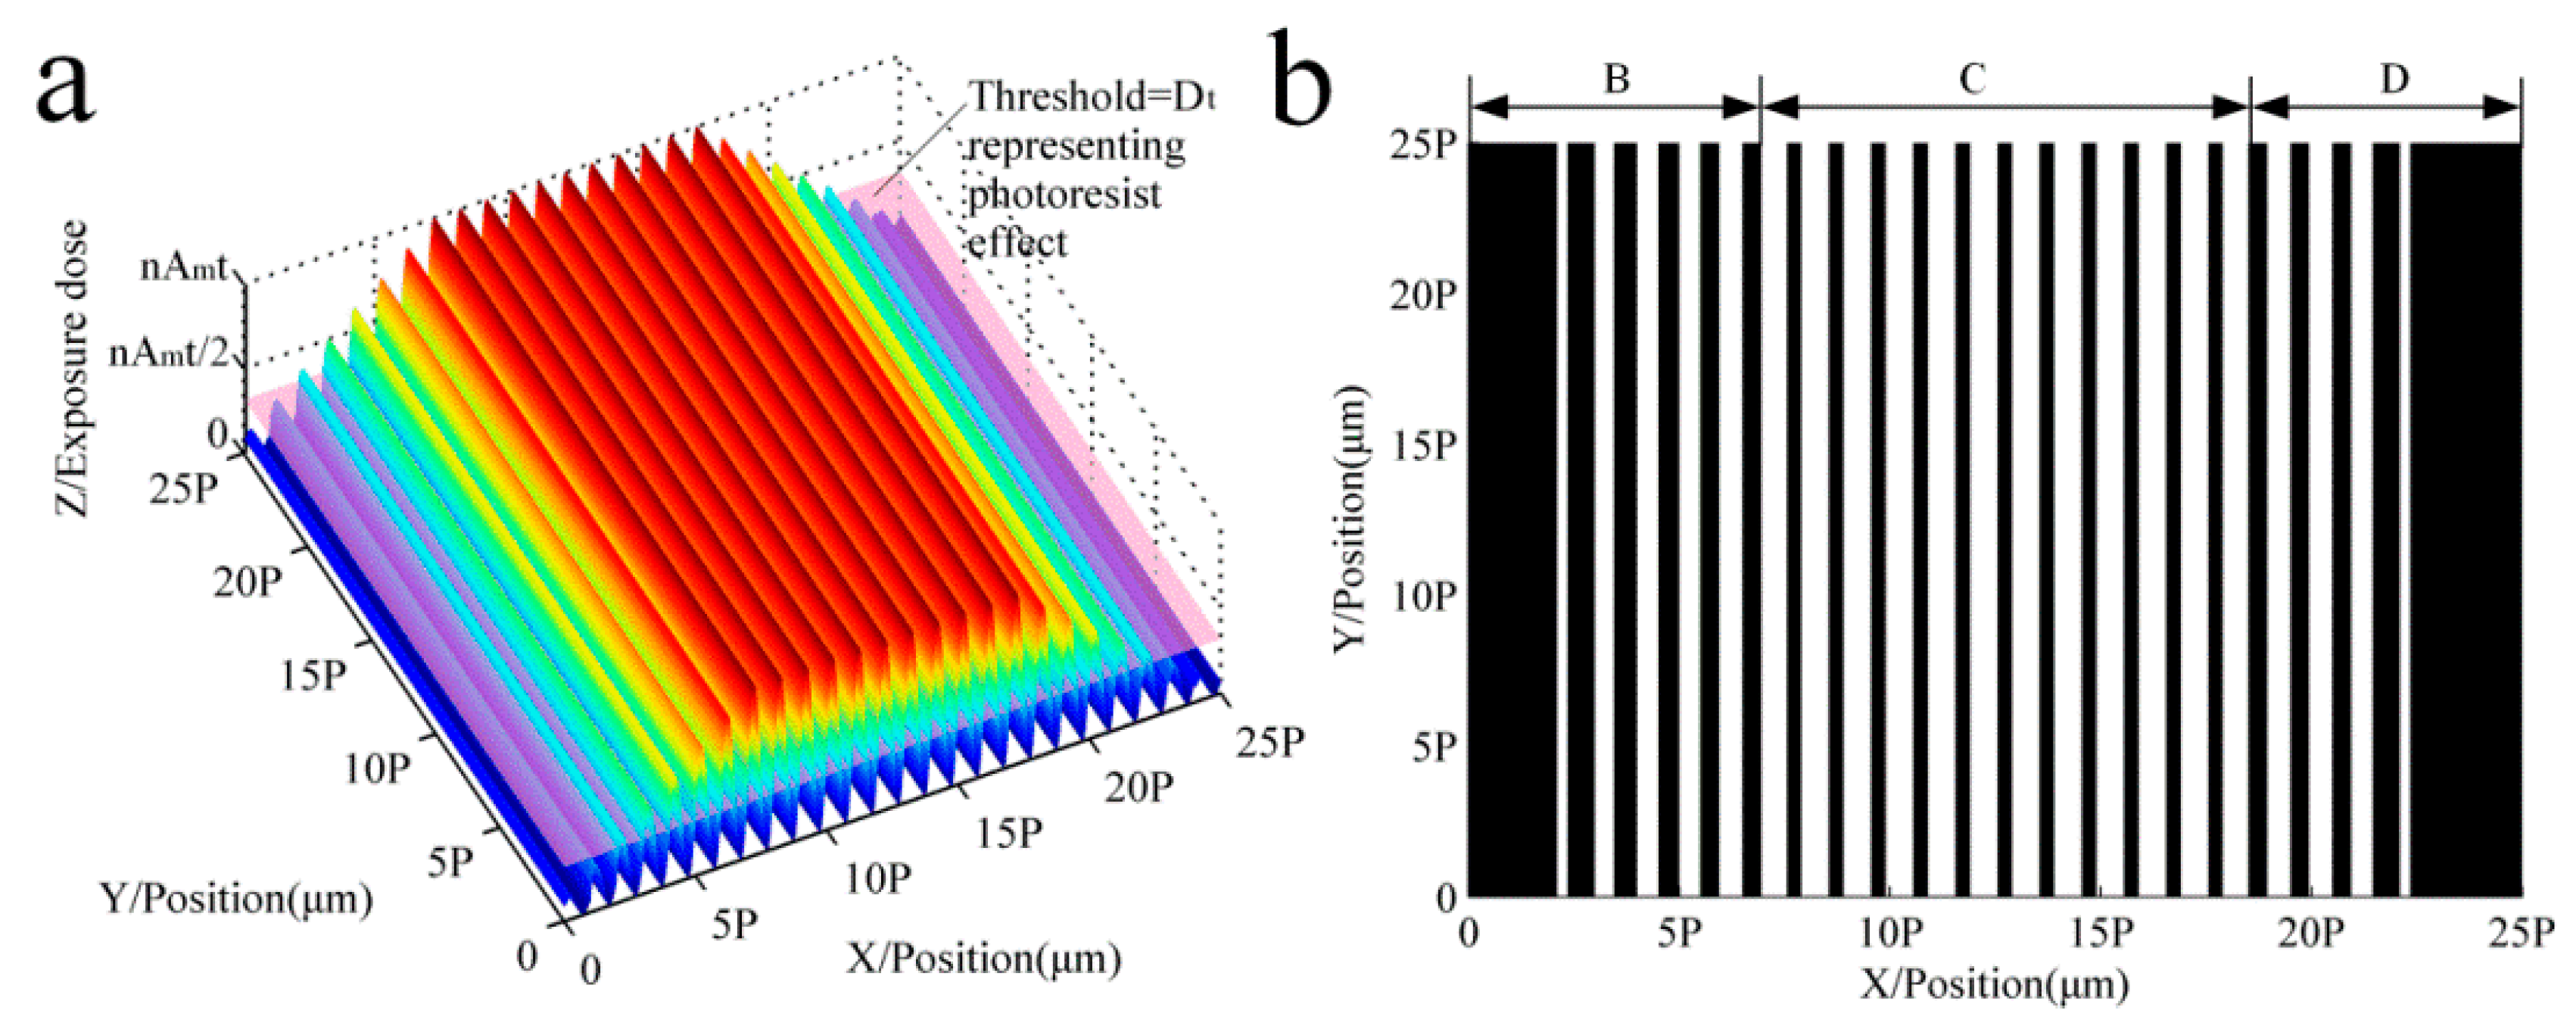
- The positioning error of the projection lithography motion system is considered to be one of the main factors affecting the exposed distance interval error, while the developing threshold of the exposure dose is constant, which is inversely proportional to the ratio of black stripes and white stripes, and the pitch is only slightly changed. It is necessary to adjust the developing threshold of exposure dose to make sure the ratio of black stripes and white stripes can reach the set value, which will directly affect the accuracy of the half cycle signal. On the other hand, the lithography control system needs the exposed distance interval error to be written in the control program, thus changing the ratio of black stripes and white stripes and achieve error compensation.
- (4)
- The simulation analysis results confirmed that the light intensity with alignment error became more uniformly distributed using the multi-repeated lithography. Increasing the alignment error would reduce the maximum peak value of light intensity after the proposed method; the uniformity of the light intensity still was only slightly changed, which greatly increased the requirements for the sensitivity and the developing threshold accuracy of the photoresist.
Acknowledgments
Author Contributions
Conflicts of Interest
References
- Gerasimov, F.M. Use of diffraction gratings for controlling a ruling engine. Appl. Opt. 1967, 6, 1861–1865. [Google Scholar] [CrossRef] [PubMed]
- Flamand, A.J.; Bonnemason, F.; Thevenon, A.; Lerner, J.M. The blazing of holographic gratings using ion-etching. Proc. SPIE 1989, 1055, 288–294. [Google Scholar]
- Yu, H.; Li, X.; Zhu, J.; Yu, H.; Qi, X.; Feng, S. Reducing the line curvature error of mechanically ruled gratings by interferometric control. Appl. Phys. B 2014, 117, 279–286. [Google Scholar] [CrossRef]
- Liu, H.; Shi, Y.; Yin, L.; Jiang, W.; Lu, B. Roll-to-roll imprint for high precision grating manufacturing. Eng. Sci. 2013, 11, 39–43. [Google Scholar]
- Lin, B.J. Optical lithography—Present and future challenges. Competes Rendus Phys. 2006, 7, 858–874. [Google Scholar] [CrossRef]
- Brunner, T.A. Pattern-dependent overlay error in optical step and repeat projection lithography. Microelectron. Eng. 1988, 8, 13–24. [Google Scholar] [CrossRef]
- Larramendy, F.; Blatche, M.C.; Mazenq, L.; Laborde, A.; Temple-Boyer, P.; Paul, O. Microchannel-connected SU-8 honeycombs by single-step projection photolithography for positioning cells on silicon oxide nanopillar arrays. J. Micromech. Microeng. 2015, 25, 1–9. [Google Scholar] [CrossRef]
- Bischoff, J.; Henke, W.; Werf, J.V.D.; Dirksen, P. Simulations on step-and-scan optical lithography. Proc. SPIE 1994, 2197, 953–964. [Google Scholar]
- Williamson, D.M.; Mcclay, J.A.; Andresen, K.W.; Gallatin, G.M.; Himel, M.D.; Ivaldi, J.; Mason, C.; McCullough, A.; Otis, C.; Shamaly, J.; et al. Micrascan III: 0.25-μm resolution step-and-scan system. Proc. SPIE 1996, 2726, 780–786. [Google Scholar]
- Ma, X.; Arce, G.R. Techniques in computational lithography. In Computational Lithography; John Wiley & Sons, Inc.: Hoboken, NJ, USA, 2010; pp. 13–14. [Google Scholar]
- Jain, K.; Zemel, M.; Klosner, M. Large-Area High-Resolution Lithography and Photoablation Systems for Microelectronics and Optoelectronics Fabrication Jain. IEEE Proc. 2002, 90, 1681–1688. [Google Scholar] [CrossRef]
- Lawes, R.A. Manufacturing tolerances for UV LIGA using SU-8 resist. J. Micromech. Microeng. 2005, 15, 2198–2203. [Google Scholar] [CrossRef]
- Mack, C. Imaging Example: Dense Array of Lines and Spaces. In Fundamental Principles of Optical Lithography: The Science of Microfabrication; John Wiley & Sons Ltd.: Chichester, UK, 2007; pp. 49–50. [Google Scholar]
- Chern, N.N.K.; Neow, P.A.; Ang, M.H. Practical issues in pixel-based autofocusing for machine vision. IEEE ICRA 2001, 3, 2791–2796. [Google Scholar]


| Spacing Distance | 19.7 | 19.8 | 19.9 | 20 | 20.1 | 20.2 | 20.3 |
| Pitch | 20 | 20 | 20 | 20 | 20 | 20 | 20 |
| Black grating | 9.69 | 9.87 | 9.97 | 10 | 9.97 | 9.87 | 9.69 |
| White grating | 10.31 | 10.13 | 10.03 | 10 | 10.03 | 10.13 | 10.31 |
© 2016 by the authors; licensee MDPI, Basel, Switzerland. This article is an open access article distributed under the terms and conditions of the Creative Commons by Attribution (CC-BY) license (http://creativecommons.org/licenses/by/4.0/).
Share and Cite
Ren, D.; Zhao, H.; Zhang, C.; Yuan, D.; Xi, J.; Zhu, X.; Ban, X.; Dong, L.; Gu, Y.; Jiang, C. Multi-Repeated Projection Lithography for High-Precision Linear Scale Based on Average Homogenization Effect. Sensors 2016, 16, 538. https://doi.org/10.3390/s16040538
Ren D, Zhao H, Zhang C, Yuan D, Xi J, Zhu X, Ban X, Dong L, Gu Y, Jiang C. Multi-Repeated Projection Lithography for High-Precision Linear Scale Based on Average Homogenization Effect. Sensors. 2016; 16(4):538. https://doi.org/10.3390/s16040538
Chicago/Turabian StyleRen, Dongxu, Huiying Zhao, Chupeng Zhang, Daocheng Yuan, Jianpu Xi, Xueliang Zhu, Xinxing Ban, Longchao Dong, Yawen Gu, and Chunye Jiang. 2016. "Multi-Repeated Projection Lithography for High-Precision Linear Scale Based on Average Homogenization Effect" Sensors 16, no. 4: 538. https://doi.org/10.3390/s16040538