Article

Measurements of Generated Energy/Electrical Quantities from Locomotion Activities Using Piezoelectric Wearable Sensors for Body Motion Energy Harvesting

1
Department of Engineering, University of Roma Tre, Via Vito Volterra, 62, Rome 00146, Italy
2
Department of Cybernetics and Biomedical Engineering, VSB-Technical University of Ostrava, 17 Listopadu 15, Ostrava-Poruba 70833, Czech Republic
*
Author to whom correspondence should be addressed.
Sensors 2016, 16(4), 524; https://doi.org/10.3390/s16040524
Submission received: 8 March 2016 / Revised: 1 April 2016 / Accepted: 6 April 2016 / Published: 12 April 2016
(This article belongs to the Special Issue Wearable Biomedical Sensors)

Abstract

:
In this paper, two different piezoelectric transducers—a ceramic piezoelectric, lead zirconate titanate (PZT), and a polymeric piezoelectric, polyvinylidene fluoride (PVDF)—were compared in terms of energy that could be harvested during locomotion activities. The transducers were placed into a tight suit in proximity of the main body joints. Initial testing was performed by placing the transducers on the neck, shoulder, elbow, wrist, hip, knee and ankle; then, five locomotion activities—walking, walking up and down stairs, jogging and running—were chosen for the tests. The values of the power output measured during the five activities were in the range 6 µW–74 µW using both transducers for each joint.

1. Introduction

Body motion energy harvesting (BMEH) means recovering energy from body movement. BMEH has been the object of study by researchers from around the world for the past twenty years.
Starner [1], who is considered one of the first researchers who studied energy harvesting from human motion, explored the possibility of recovering the energy produced by body movements, during everyday activities. He pointed out that human beings produce the highest amount of energy during walking. Thus, Shenck and Paradiso [2] developed an energy harvesting system, mounted on the shoes, that enables one to power a wide range of body-worn devices. Then, Gonzalez et al. [3] and Niu et al. [4] analyzed the feasibility of using the energy harvested from the human body to power wearable sensors, which include the functions of data processing and wireless communication [5,6].
Following the same logic, Rome et al. [7] developed a suspended-load backpack that converts mechanical energy of the vertical movement of the carried load into electrical energy. In addition, Donelan et al. [8] developed a biomechanical energy harvester mounted on the knee that provides power generation at the end of the swing phase, thus assisting deceleration of the knee joint during walking and jogging.
Mitcheson et al. [9] reviewed the principles in a motion-driven miniature energy harvester to introduce the basis for a wearable and comfortable body-worn energy harvesting system. Vullers et al. [10] published a review dealing with the techniques of micropower energy harvesting in order to confirm the theory, earlier discussed by Huang et al. [11] and Hanson et al. [12], about the wireless body sensor network (WBSN), according to which reliable energy harvesting has now become a reality for human conditions monitoring.
Nowadays, BMEH systems are becoming fundamental for sports [13], medical [14] and military [15] applications. The research trend is to develop smart clothes with incorporated BMEH systems. Stoppa and Chiolerio [16] presented a paper on recent progress in the field of smart textiles, and Misra et al. [17] presented a paper on flexible technologies that enable ultra-long battery lifetime and user comfort.
Despite a large body of literature focusing on the development and testing of BMEH systems, to the authors’ knowledge there is a notable lack of studies targeting the optimization of harvester kinds, and their placement, to be used in everyday life activities.
To fill this gap, in this work, piezoelectric transducers placed in a tight suit were tested and compared to find out the best location where the BMEH system can be placed, to maximize energy production in everyday life. To this end, individual body movements of single body joints were tested, and then five different locomotion activities were chosen to test the sensors in real-life conditions. The positions of the BMEH systems were chosen taking into account the wearability of the transducers and the user comfort during exercises, with the perspective of incorporating them into smart clothing.

2. Relevance of the Problem

BMEH is an energy harvesting subcategory that is a part of the broader category of energy harvesting from environmental vibrations. While environmental vibration energy harvesting has been extensively studied recently [9], BMEH is quite a new research field for scientists.
The mechanical energy from environmental vibrations can be converted into electrical energy by electromagnetic, electrostatic, magnetostrictive and piezoelectric transducers: in the studied literature, the electromagnetic, electrostatic and piezoelectric transducers dominate. The work presented by Roundy [18] provides a general theory that can be used to compare these different transduction approaches.
In conventional macro-scale engineering, environmental vibration transducers are mostly based on the electromagnetic technique, while in small-scale energy harvesting, electrostatic and piezoelectric transducers are more practical and better suited to microelectromechanical (MEMS) implementation [9]. The main difference between piezoelectric and electrostatic transducers is that the electrostatic transducer must be powered [19] to function, and therefore the piezoelectric transducers were chosen for our purpose.
The most common types of materials for piezoelectric transduction are lead zirconate titanate (PZT) and polyvinylidene fluoride (PVDF) [20]. Other piezoelectric materials are barium titanate (BaTiO3) presented by Koka et al. [21] and Zhang et al. [22], micro-fiber composites (MFC) illustrated by Kranz et al. [23], and active fiber composites (AFC) discussed by Dürager [24]. In addition, lead magnesium niobate-lead titanate (PMN-PT) presented by Halim et al. [25] and zinc oxide nanowires (ZnO-NWs) presented by Bai et al. [26] are materials with piezoelectric physical properties.
When comparing the PZT and PVDF transducers [27], the former is better in terms of transduction coefficients, while the latter is less expensive and more flexible, and it can add pyroelectric properties.
PZT transducers can be divided into two categories: hard PZT and soft PZT. Hard PZT are generally not suitable for BMEH because they are not flexible enough to accommodate body joint rotations. For this purpose, soft PZT and PVDF transducers were chosen for this work.
The fundamental purpose in this paper is to quantify the energy amount that can be recovered from body movements: to this end, the wearable piezoelectric transducers were incorporated into different slots within a tight body suit; the measurements of output voltage were collected during the execution of different activities, which will be specified in the following paragraph.

3. Materials and Methods

3.1. Piezoelectric Transducers Chosen

Piezoelectric transducers convert mechanical deformations into electrical energy, i.e., direct piezoelectric effect. Thanks to this property, the piezoelectric transducers can produce electrical energy from the movements of the body parts to which they adhere. The P-876.A12 sensor [28] and the LDT4-028k sensor [29] (Figure 1) were chosen to analyze the power output of a BMEH system, respectively based on soft PZT or on PVDF.
The features of both P-876.A12 and LDT4-028k are listed in Table 1.
While examining the piezoelectric transducers behavior, under conditions to approximate an open-circuit voltage, the generated voltage value from piezoelectric transducers is:
V = t ε 0 ε r d 31 Y Δ l l
In applications of BMEH, it is assumed that the piezoelectric transducer is vertically suspended to a support and that a force, F , is acting on its end. This force creates a variation in the length l of the sensor, Δ l .
The related applied stress on the transducer, X = Y Δ l l , is given by the force divided by the cross-sectional area, csa  =  wt (where w is the width and t is the thickness), so that:
Y Δ l l = F wt
In this way, it is possible to write the equation for the generated electrical energy, U e , in terms of the applied force [30]:
U e = 1 2 ε 0 ε r wl t V 2 = 1 2 ε 0 ε r l wt d 31 2 F 2

3.2. The Chosen Human Body Movements

Seven body joints were chosen in order to harvest energy from body movements. These joints were chosen in order to measure the most common human body rotations: neck, shoulder, elbow, wrist, hip, knee and ankle are the joints around which the transducers were placed.
The angle values were manually measured by a goniometer, for each range of motion of the performed tests. These results were accepted on the basis of the results presented in the work of Reese and Bandy [31]. In Table 2, the body joints, joint movements, range of motion and the frequencies of motion are summarized.

3.3. The Chosen Human Body Activity

Five common locomotion activities were chosen to find out if the two piezoelectric transducers were efficient enough to harvest energy from the body movement in practice. The mentioned activities were walking, going down and up the stairs, jogging and running. The body joints chosen for the comparison of the two piezoelectric transducers were a subset of the aforementioned ones: elbow, ankle, knee, shoulder and hip. The flexion-extension of the wrist and neck were excluded from the measurements because these movements were deemed as minor in terms of exerted forces during the chosen locomotion activities. In Table 3, the activities and their corresponding frequencies are summarized.

3.4. Elastic Cotton Fabric for a Tight Suit

Piezoelectric transducers must be placed directly onto the skin to transduce the movements of the joints in the most appropriate way. Thus, a tight elastic cotton suit was made. Elastic cotton ensures proper adjacency to the body and comfort, and it is easy to clean.
The piezoelectric transducers were placed in the pockets of the suit, around each chosen joint. Figure 2 shows the blue suit with the green pockets, and a green belt which was used to capture ankle rotations.
The positions of the transducers on the suit were chosen according to the value of their folding parameter, the minimum radius curvature. LDT4-028k is more flexible than P-876.A12, and therefore the former one was placed in the inner parts of the suit where the joints are at the maximum bending angle. The inner parts of the suit relate to the inner parts of the elbow, knee and shoulder. Conversely, P-876.A12 transducers were placed on the outer parts of those joints. The positions of transducers were the same for the measurements of the wrist, neck, ankle and hip joints. Table 4 shows the reference positions for the transducers referring to the numbers in Figure 2.

4. Experimental Section

4.1. Preliminary Measurements

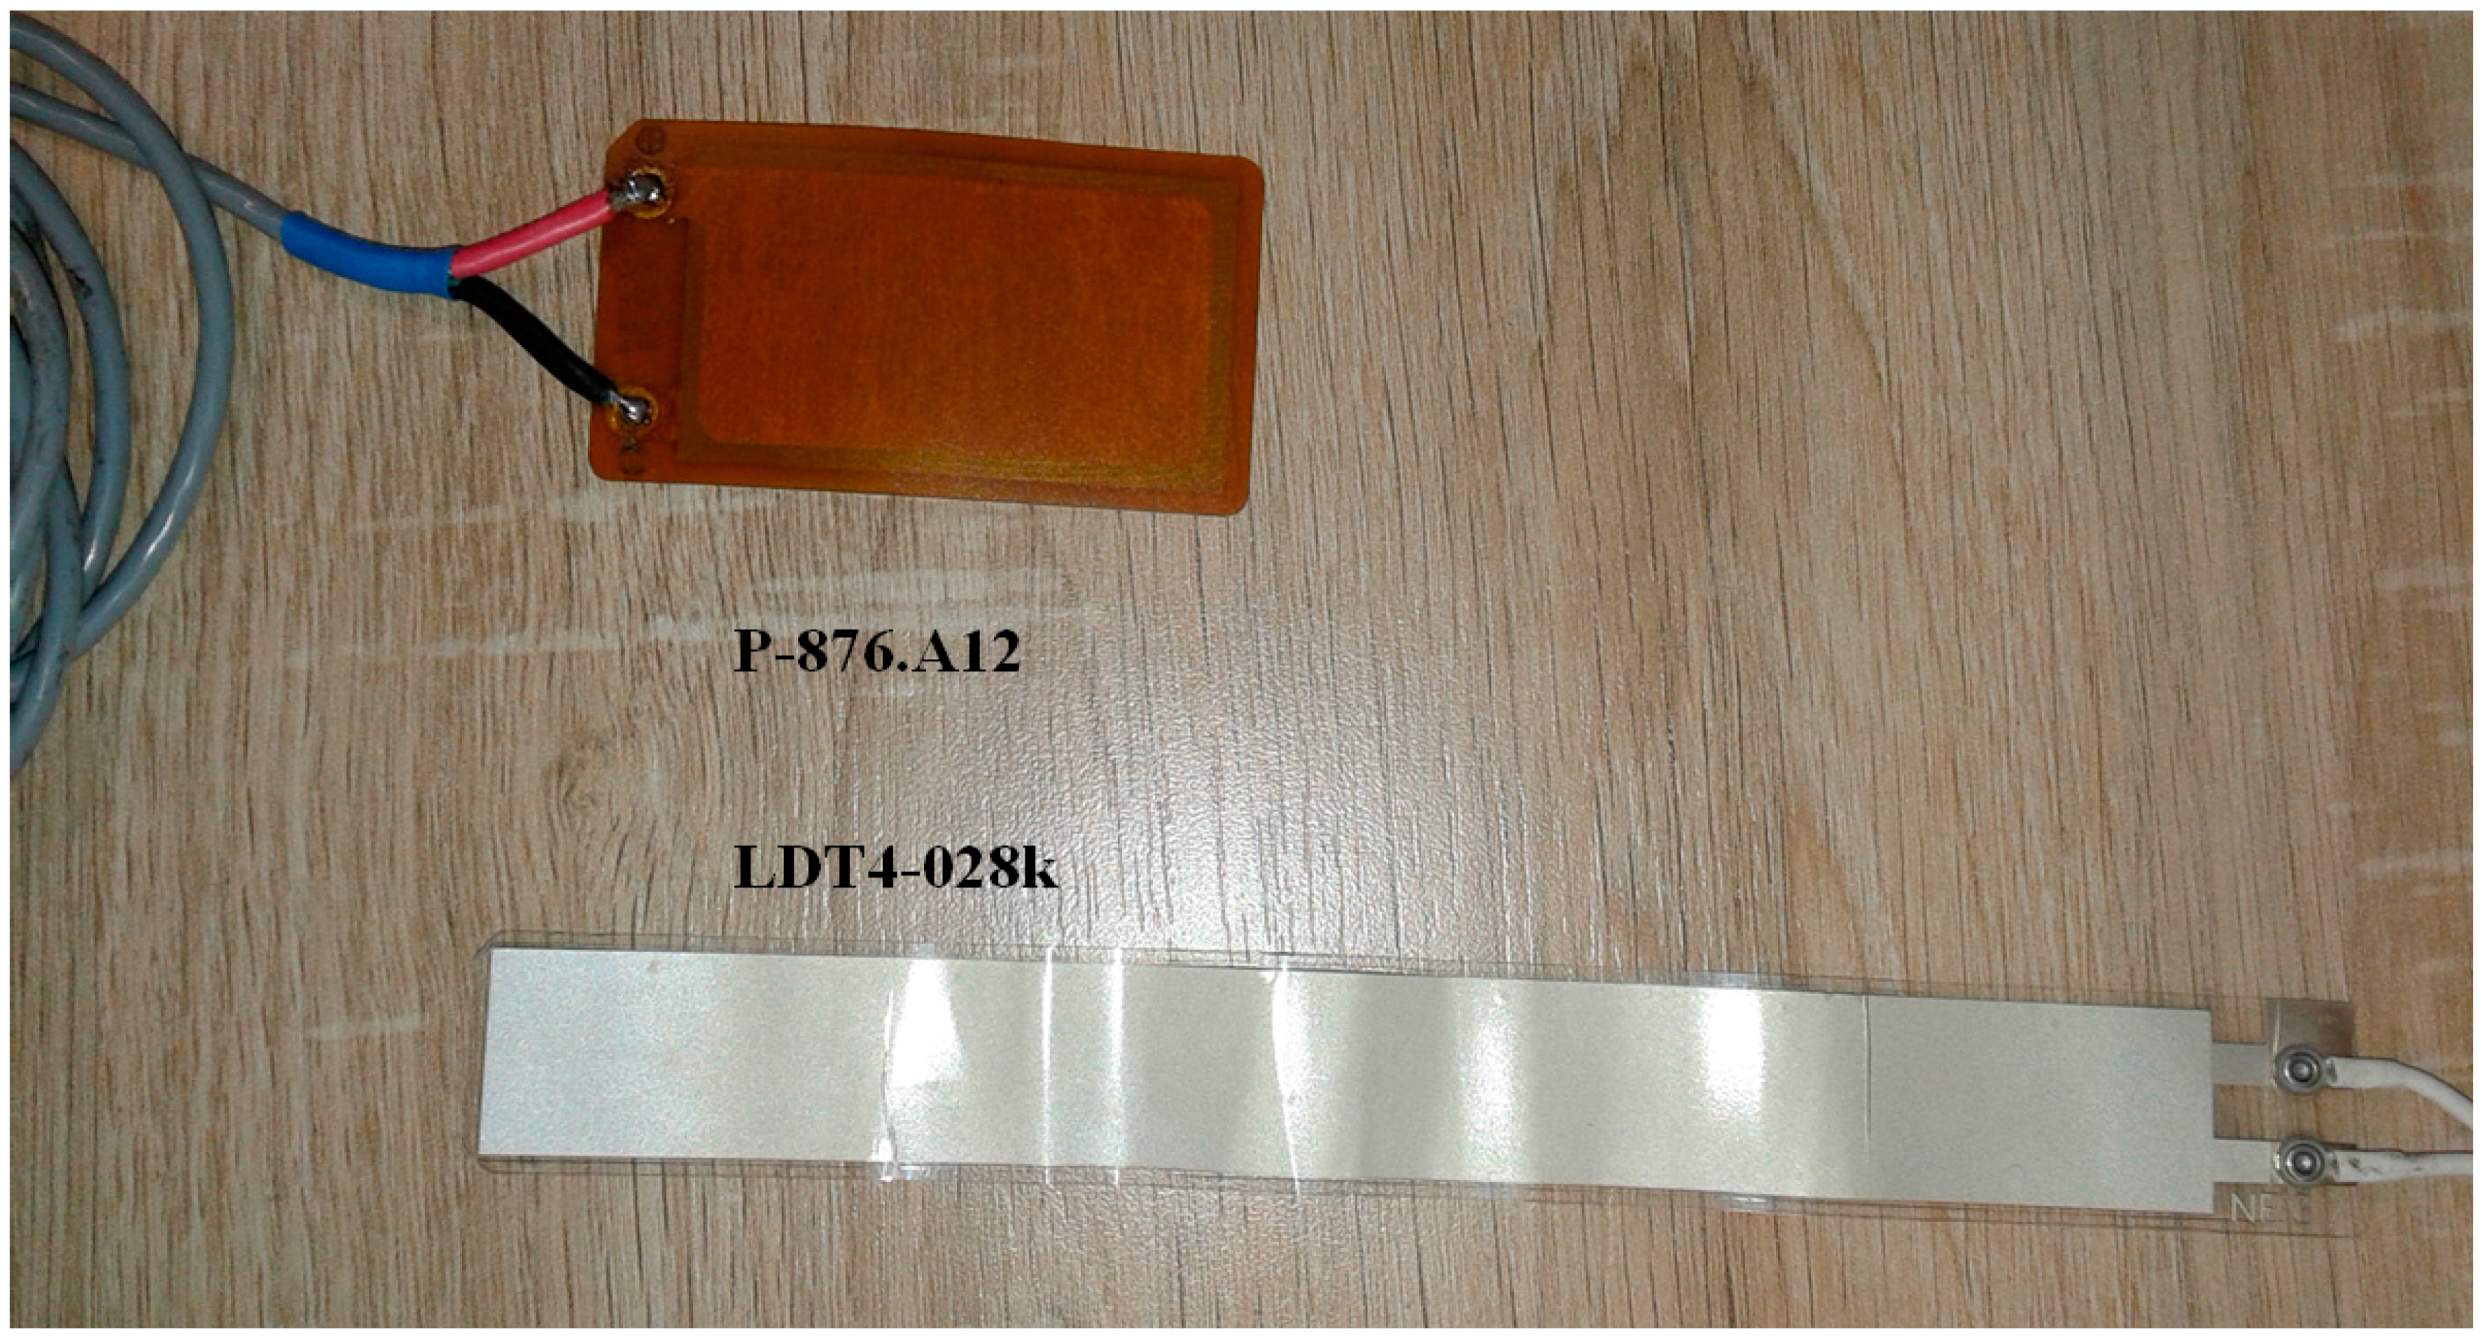
To find out the voltage output, the following measurement circuit (Figure 3) was used, and the values of the voltage output were measured and acquired by the NI USB-6210 data acquisition system (DAQ), National Instruments. A voltage divider circuit was used as the input stage of the NI USB-6210 DAQ in order to avoid the problem of saturation given by the range of voltage values at the input stage of the DAQ.
The voltage output for the circuit in Figure 3 is given by the following Equation (4) [32]:
V out = I R load 1 + ( 2 π fC p R load ) 2
The power values, based on a fixed value of the resistive load, were calculated. In order to optimize the power output, the ranges of fixed values of the resistors were carefully chosen based on the transducers datasheets [33,34] and on the motion frequency of the joint movements, so that the following relation is achieved:
dP out dR load = d ( V out 2 R load ) dR load = 0 R load = 1 2 π fC p
The range values of the resistor loads are shown in Table 5.
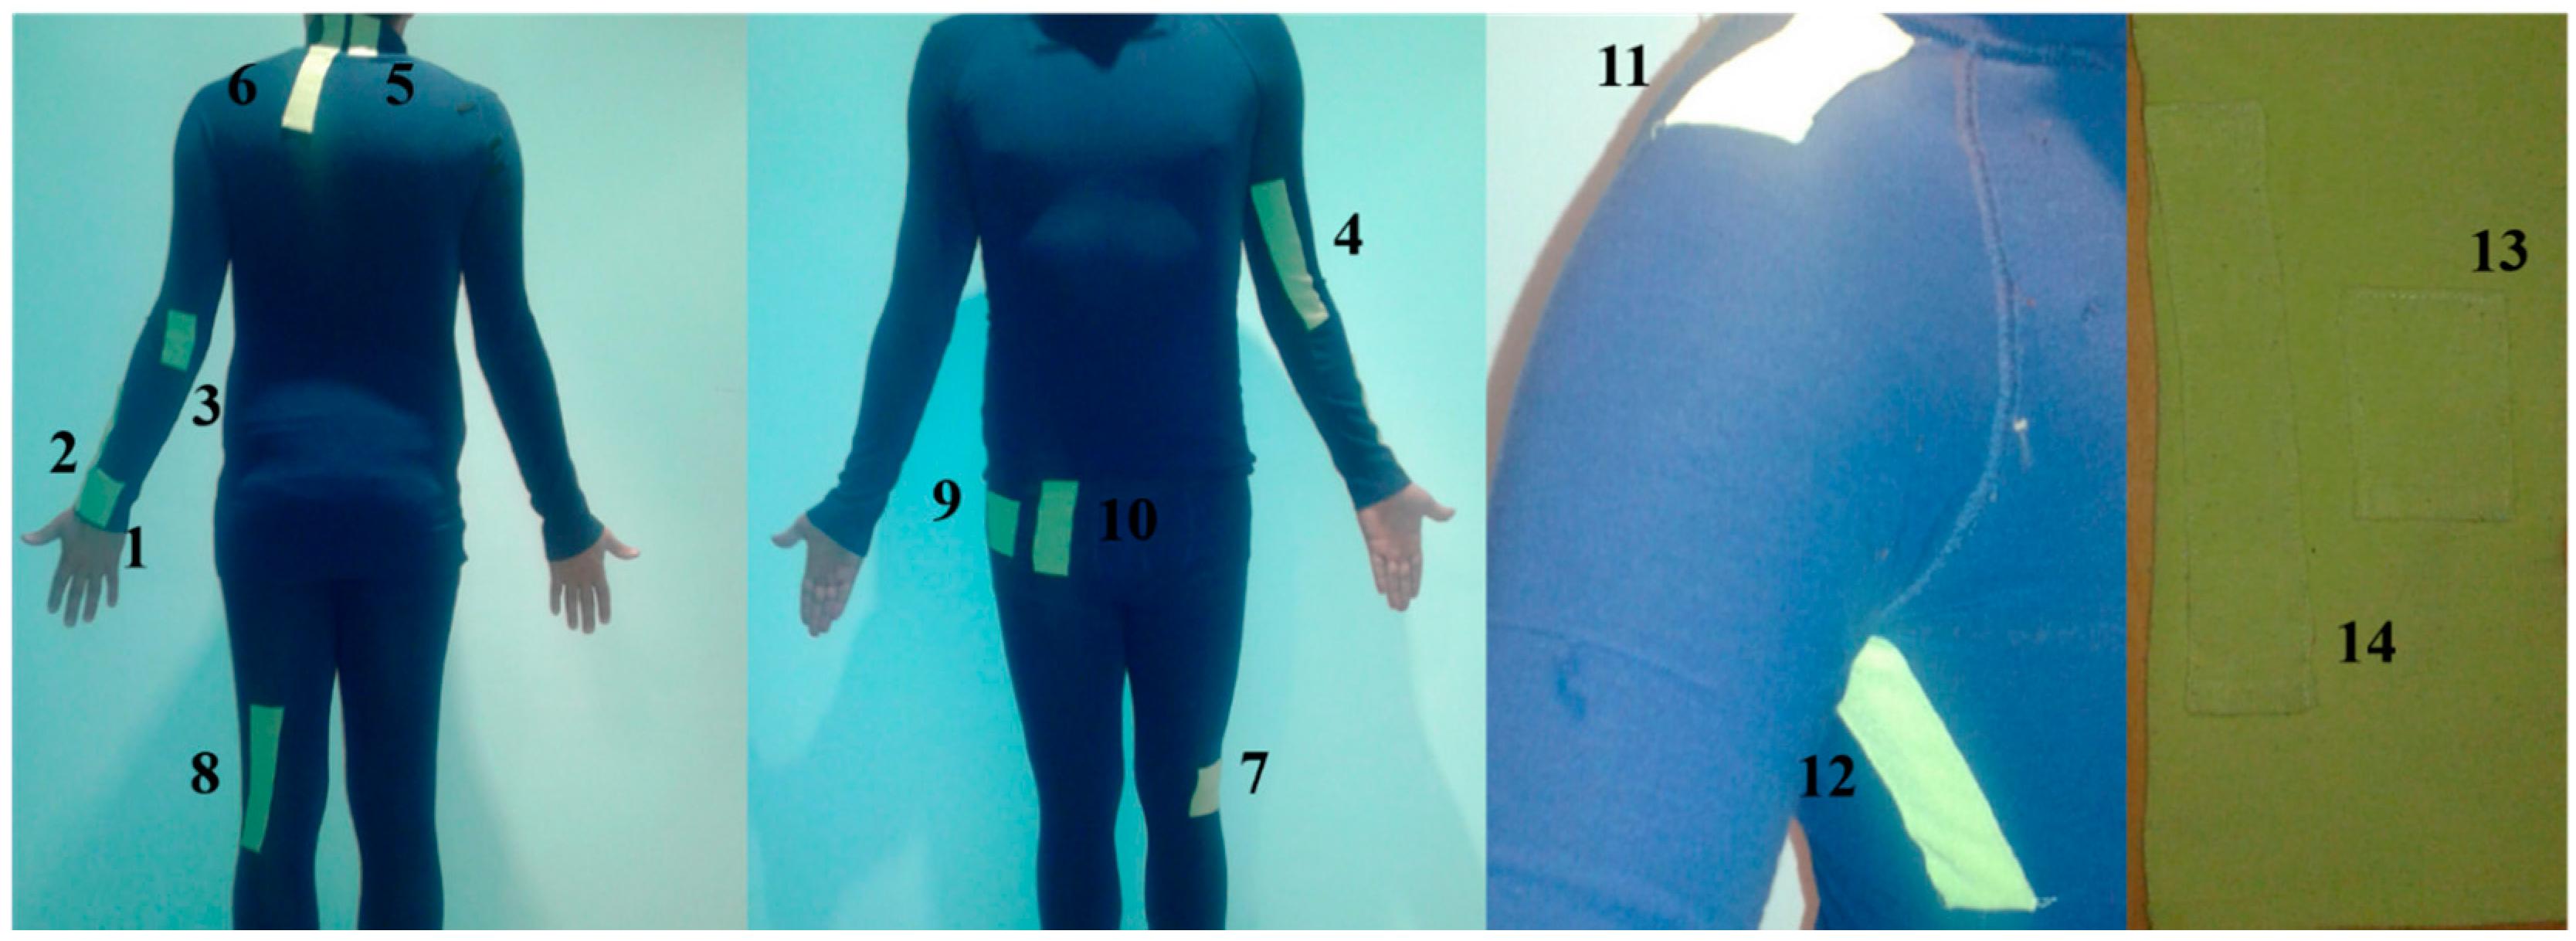
To ensure that the P-876.A12 transducer could be bent properly, perfectly following the whole movement of the joints, it was necessary to place an extra elastic band over the suit, to make the transducers adhere to the body part during movement. Conversely, the LDT4-028k transducers did not need any additional support to secure their placement, due to their higher flexibility and ability to follow the joint movements.
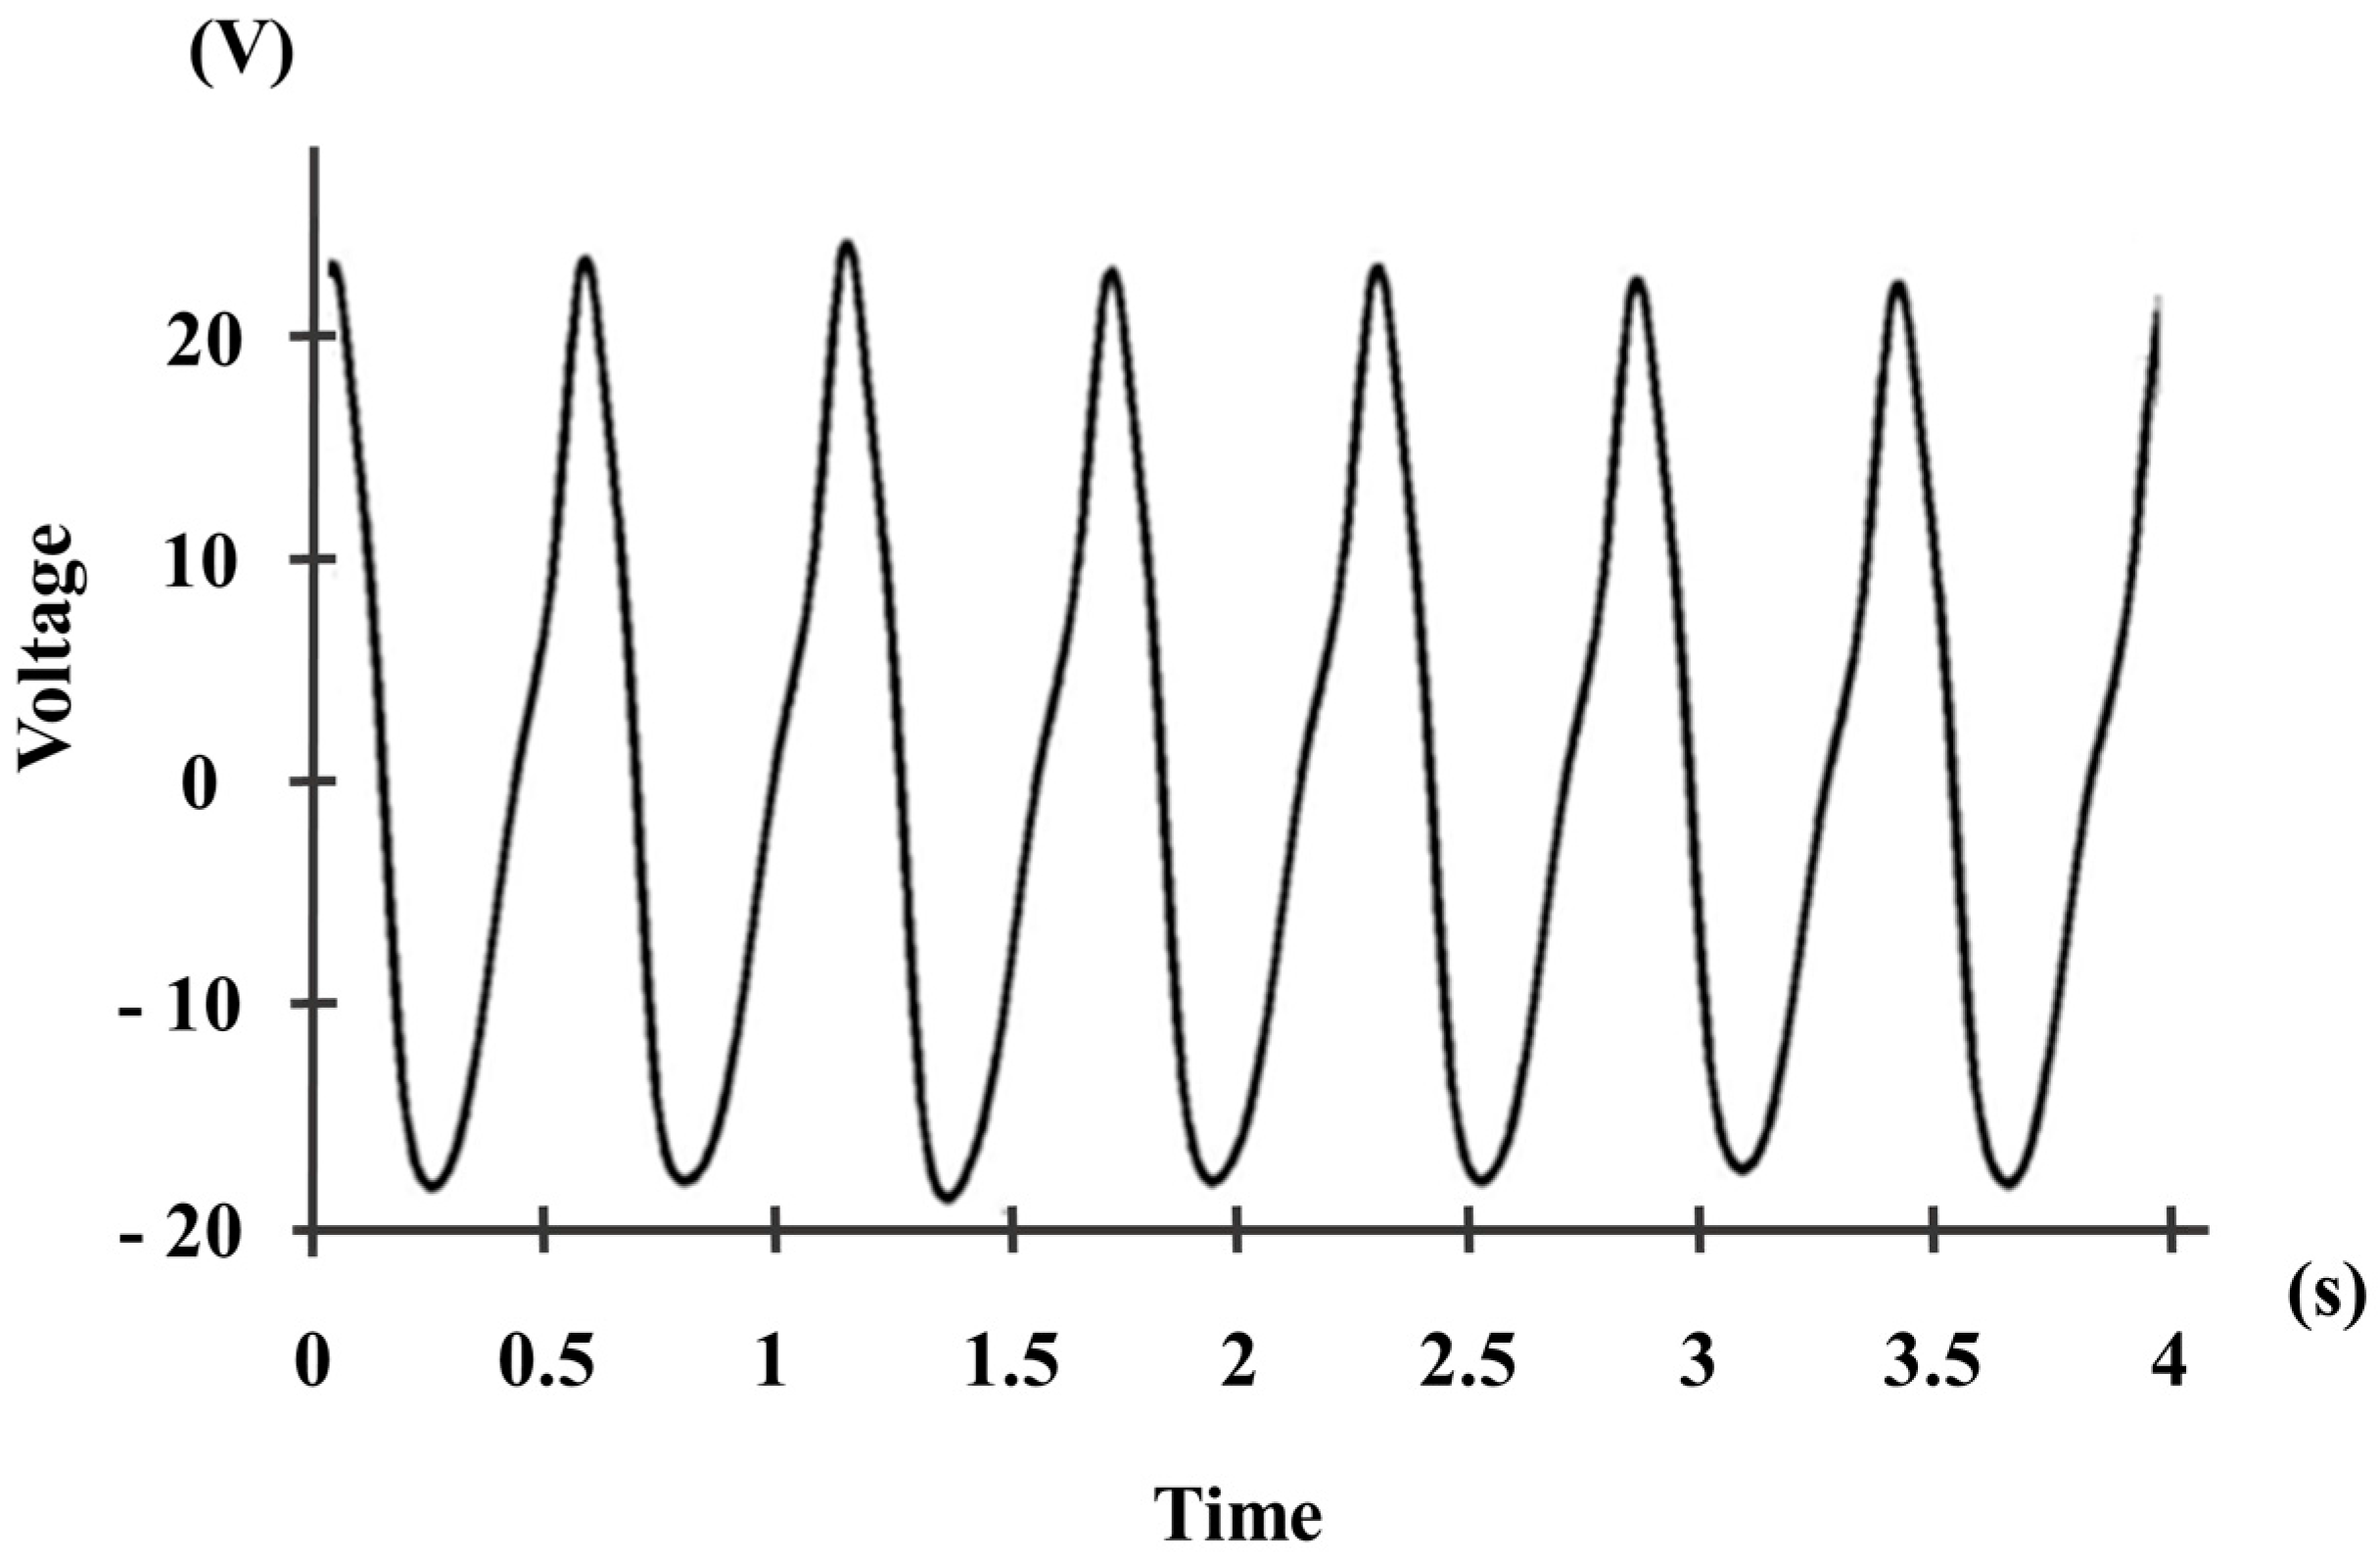
To obtain the root mean square values of the voltages, currents and powers, the measured values of the peak-to-peak voltage output were used in the following Equation (6).
V rms = V out 2 2 I rms = V rms R fixed P rms = V rms I rms
Equation (6) was used to find the RMS values from each performed movement repetition, shown in Table 2. In the case of these movements, the nature of the angular movements could be roughly approximated to Equation (6), even if it deviates from a pure sinusoidal tone, as it is shown in Figure 4.
Three healthy male volunteers (age: 34 ± 5 years; body weight: 76 ± 4 kg; height: 175 ± 5 cm) were recruited to perform the joint movements listed in Table 2. Each joint movement was repeated five times, and the measuring time for each test was around ten seconds.
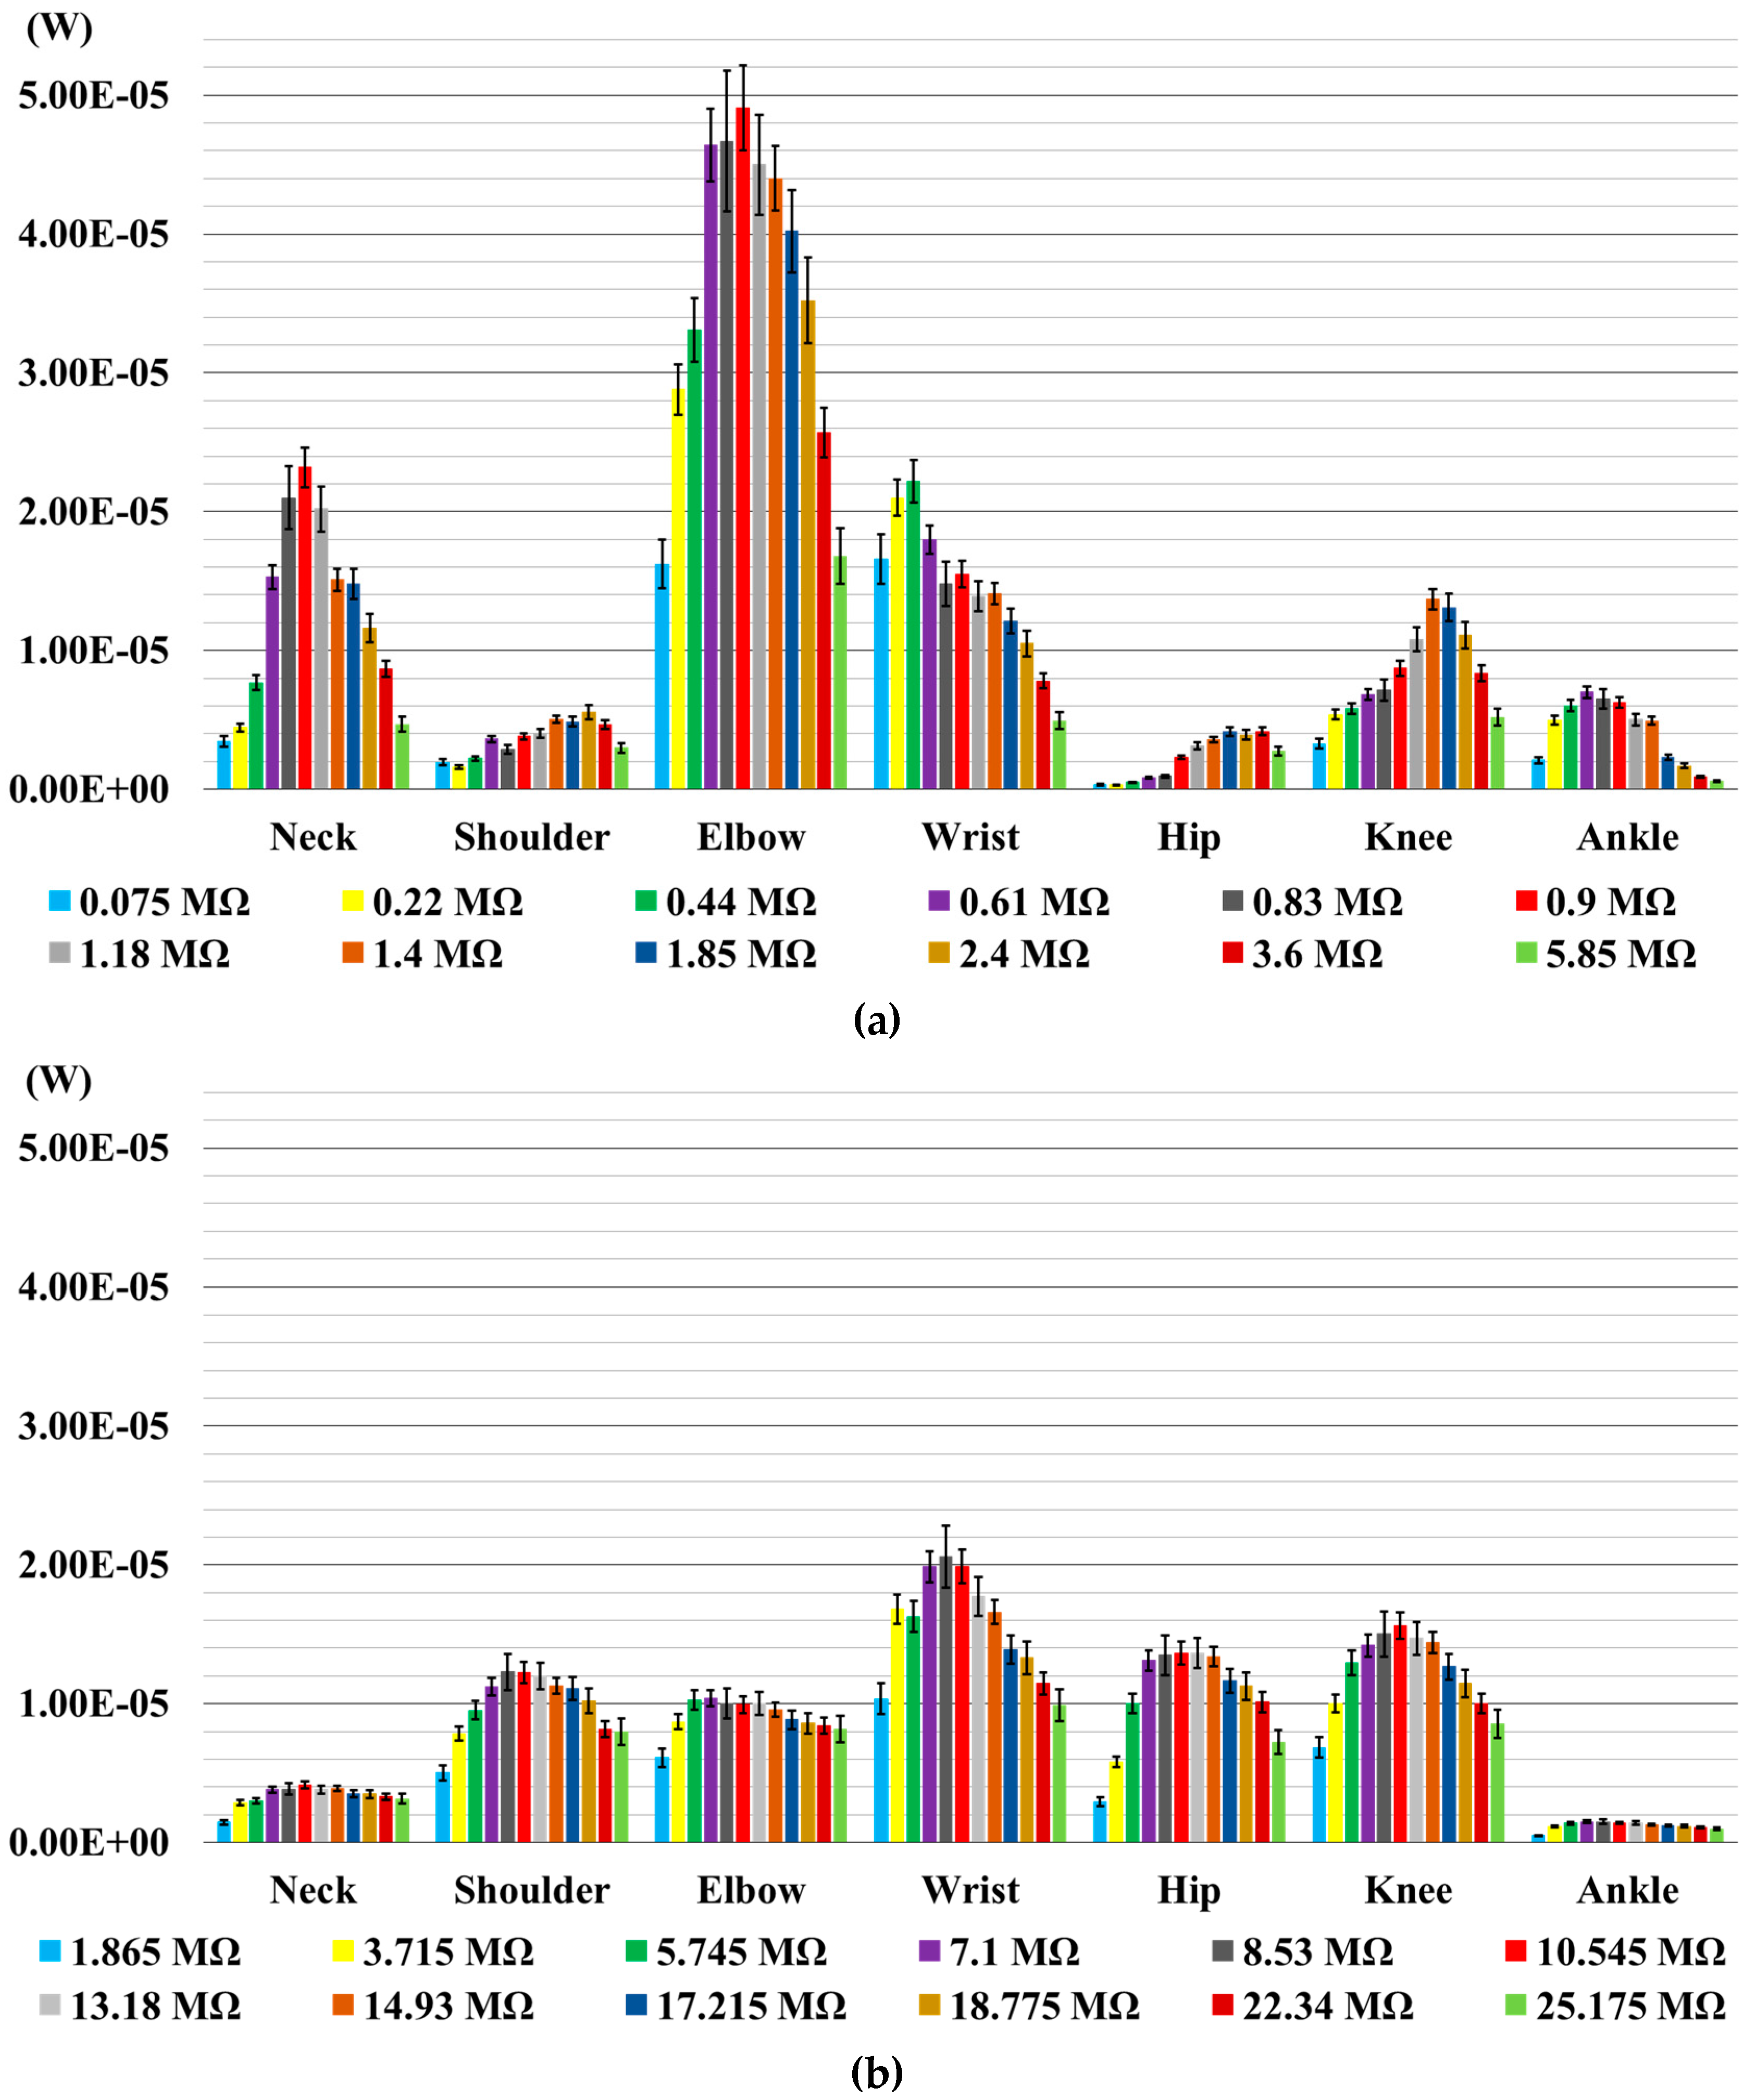
Figure 5 shows output RMS power values coming from the body joints for each value of the resistive load. Both transducers produce a signal output proportional to the folding movement and frequency of the performed test. To obtain the maximum value of the power output, the most important parameter is the proper positioning of the transducer on the suit close to the skin, so that it can be bent as much as possible. The inherent different nature of the transducers makes it difficult to use the same exact location for both sensors, since the rigidity of the P-876.A12 transducer makes it necessary to provide the user with a sustaining structure and a different placement as compared to the LDT4-028k transducer. This consideration makes it impossible to directly compare the power output of transducers, but since the focus of the work is on the applicability of the transducers in real-life conditions, the comparison between transducers needs to include the positioning choice, as well.
In the P-876.A12 transducer diagram (Figure 5a), the power outputs for the elbow joint are higher than those obtained for the other joints. In the graph of the LDT4-028k transducer (Figure 5b), the highest power output values are those related to wrist, knee and hip joints. For both transducers, the values of the power output increase with the increase of Rload to reach a maximum value, and then, they gradually decrease. Comparing the graphs in Figure 5a,b, the maximum values of the power output for P-876.A12 on the elbow (49.1 µW), ankle (4.94 µW), wrist (22.2 µW) and neck (7.68 µW) joints are higher than those obtained by LDT4-028k on the same joints. Conversely, the maximum values of the power output for LDT4-028k on the shoulder (12.3 µW), knee (15.9 µW) and hip (15.0 µW) joints are higher than those appearing for P-876.A12 placed on the same joints.

4.2. Measurements of the Power Output during Locomotion Activities

Five common activities were chosen to test the two piezoelectric transducers. The common activities were walking, walking down and up the stairs, jogging and running, and the chosen joints for the tests were the shoulder, elbow, hip, knee and ankle. For each activity, voltages were measured and acquired by the NI USB-6210 DAQ, National Instruments, while current and power values, based on a fixed value of the resistive load, were calculated using MATLAB software. A voltage divider circuit was used as the input stage of the NI USB-6210 DAQ to avoid saturation given by the range of voltage values at the input stage of the DAQ. The fixed values of the resistive load, based on the previous measurements (Figure 5), were carefully chosen for each joint, and they are shown in Table 6. These values were obtained through interpolation and approximation of the discrete values tested in the first experimentation.
The tests were repeated for each reported resistance value, and thus, the values of the power output were obtained in statistical terms as average values across multiple repetitions, to take into account the inherent variability of having different participant population samples repeating the mentioned activities.
Three healthy male volunteers (age: 34 ± 5 year; body weight: 76 ± 4 kg; height: 175 ± 5 cm) were recruited to perform the activities listed in Table 3. Each task was repeated four times. The measuring time of walking and walking down and up the stairs was one minute for each test, while the measuring time of the jogging activity was twenty seconds and for the running activity eight seconds.
Also for these tests, the inherent different nature of the transducers makes it difficult to use the same exact location for both sensors, since the rigidity of the P-876.A12 transducer makes it necessary to provide the user with a sustaining structure and a different placement as compared to the LDT4-028k transducer.
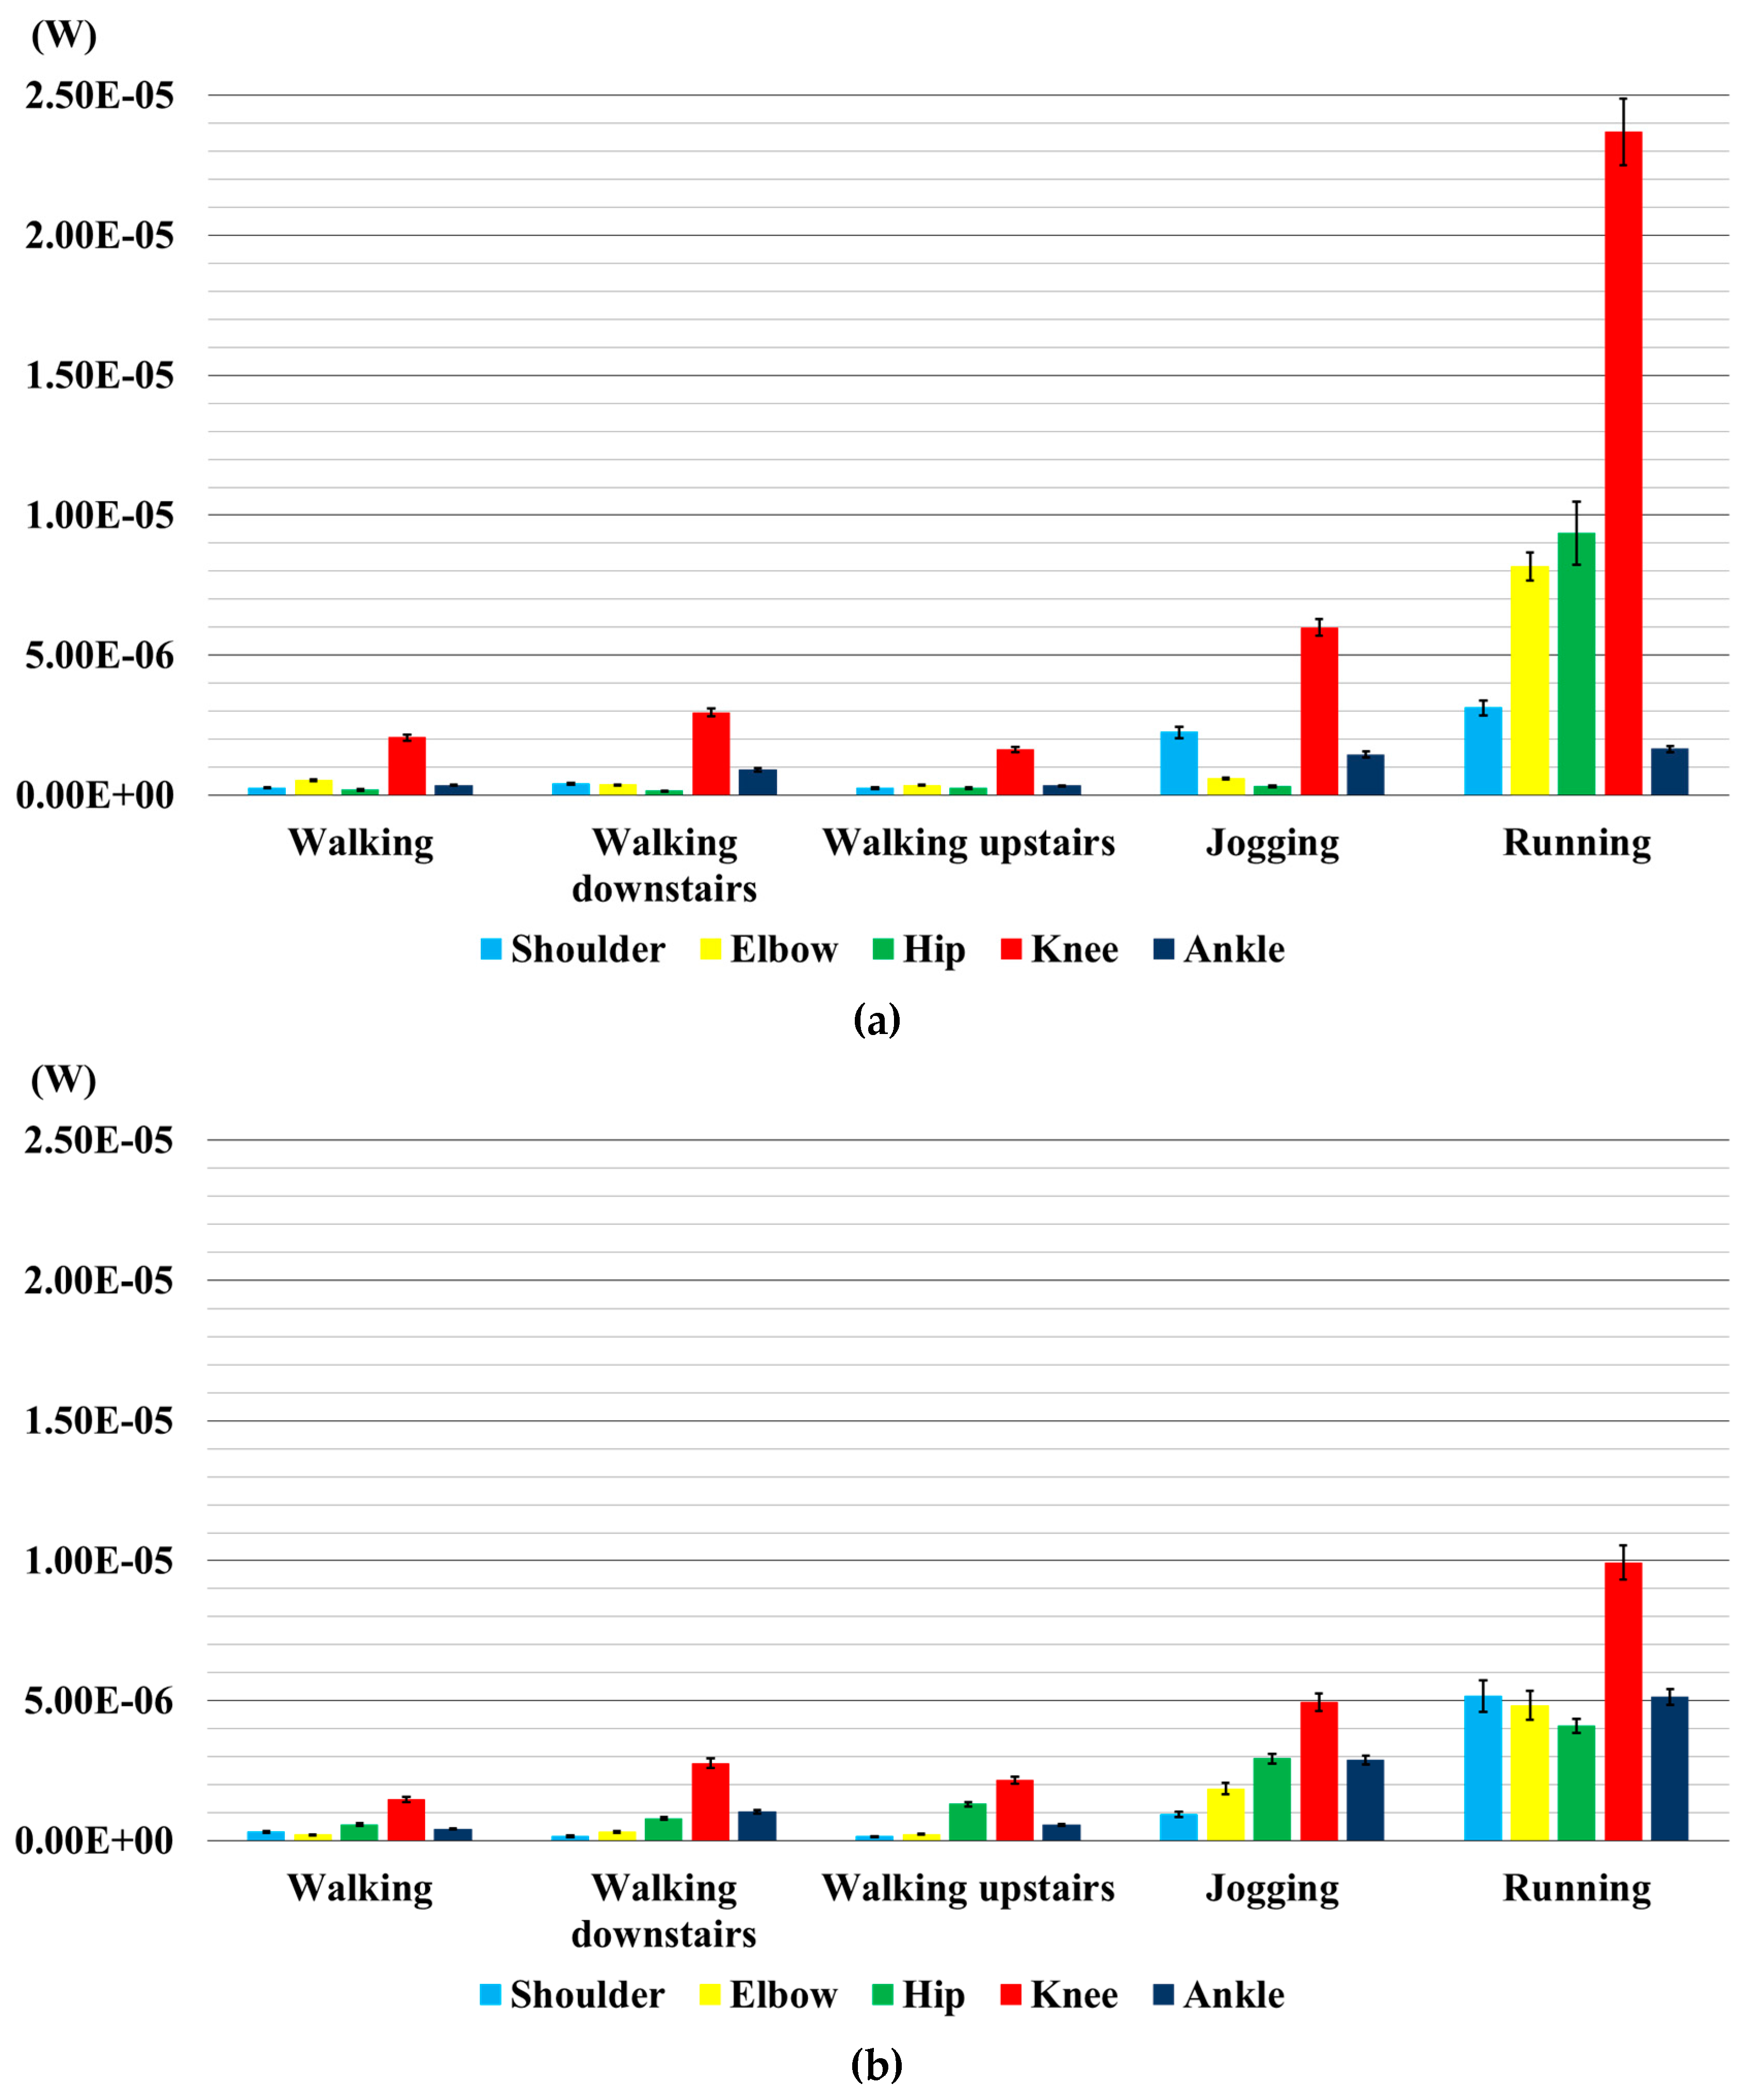
Figure 6 shows the measurements of the RMS power output values of the body joints, for each performed activity. Locomotion activities, such as walking and walking up stairs, produce the lowest values of the power output for both transducers, while running produces the highest values for both of them, followed by power output values of jogging and walking down stairs.
As it can be clearly seen in Figure 6a, walking, walking up stairs and walking down stairs, for P-876.A12, led to very similar power output. Out of these three activities, the knee joint produces the highest values of power output (2.21 µW) followed by the ankle (0.54 µW), elbow (0.41 µW), shoulder (0.31 µW) and hip (0.20 µW) joints. As for the jogging activity, the knee joint produces the highest value of power output (5.98 µW) followed by the shoulder (2.24 µW), ankle (1.45 µW), elbow (0.60 µW) and hip (0.31 µW) joints. As for running, the knee joint produces the highest value of the power output (23.70 µW) followed by hip (9.37 µW), elbow (8.16 µW), shoulder (3.12 µW) and ankle (1.65 µW) joints.
Similar considerations apply to the LDT4-028k transducer (Figure 6b), though with lower absolute values. In all activities, except running and jogging, the knee joint produces the highest value of power output (1.90 µW) followed by the hip (0.95 µW), ankle (0.67 µW), elbow (0.25 µW) and shoulder (0.21 µW) joints. As for jogging, the knee joint produces the highest value of power output (3.71 µW) followed by the ankle (2.88 µW), hip (2.43 µW), elbow (1.86 µW) and shoulder (4.46 µW) joints. As for running, the knee joint produces the highest value of power output (8.83 µW) followed by the shoulder (5.16 µW), ankle (5.13 µW), elbow (4.83 µW) and hip (4.46 µW) joints.
Table 7 breaks down the comparison between P-876.A12 (PZT) and LDT4-028k (PVDF) considering all the locomotion activities and all the joints, highlighting which transducer performed best for each activity and joint.
During walking, the values of the power output measured at each joint were very similar for both transducers: elbow (+0.31 µW) and knee (+0.47 µW) joints provide better results with P-876.A12, while the hip joint (+0.66 µW) is better with LDT4-028k.
Similar considerations apply to the case of walking down stairs, with slightly better results on the shoulder joint (+0.26 µW) for P-876.A12 and better on the hip joint (+0.52 µW) for LDT4-028k.
In the case of walking up stairs, LDT4-028k provides clearly better results than P-876.A12 at the hip joint (+1.08 µW). As for the jogging activity, P-876.A12 provides better results both at the shoulder (+1.30 µW) and at the knee (+2.27 µW) joints, while LDT4-028k resulted in being better for the elbow (+1.26 µW), hip (+2.12 µW) and ankle (+1.43 µW) joints. Finally, in the case of running, P-876.A12 performed better than LDT4-028k at the elbow (+3.33 µW), hip (+4.91 µW) and knee (+14.87 µW) joints, while the opposite applies to the shoulder (−2.04 µW) and ankle (−3.48 µW) joints.
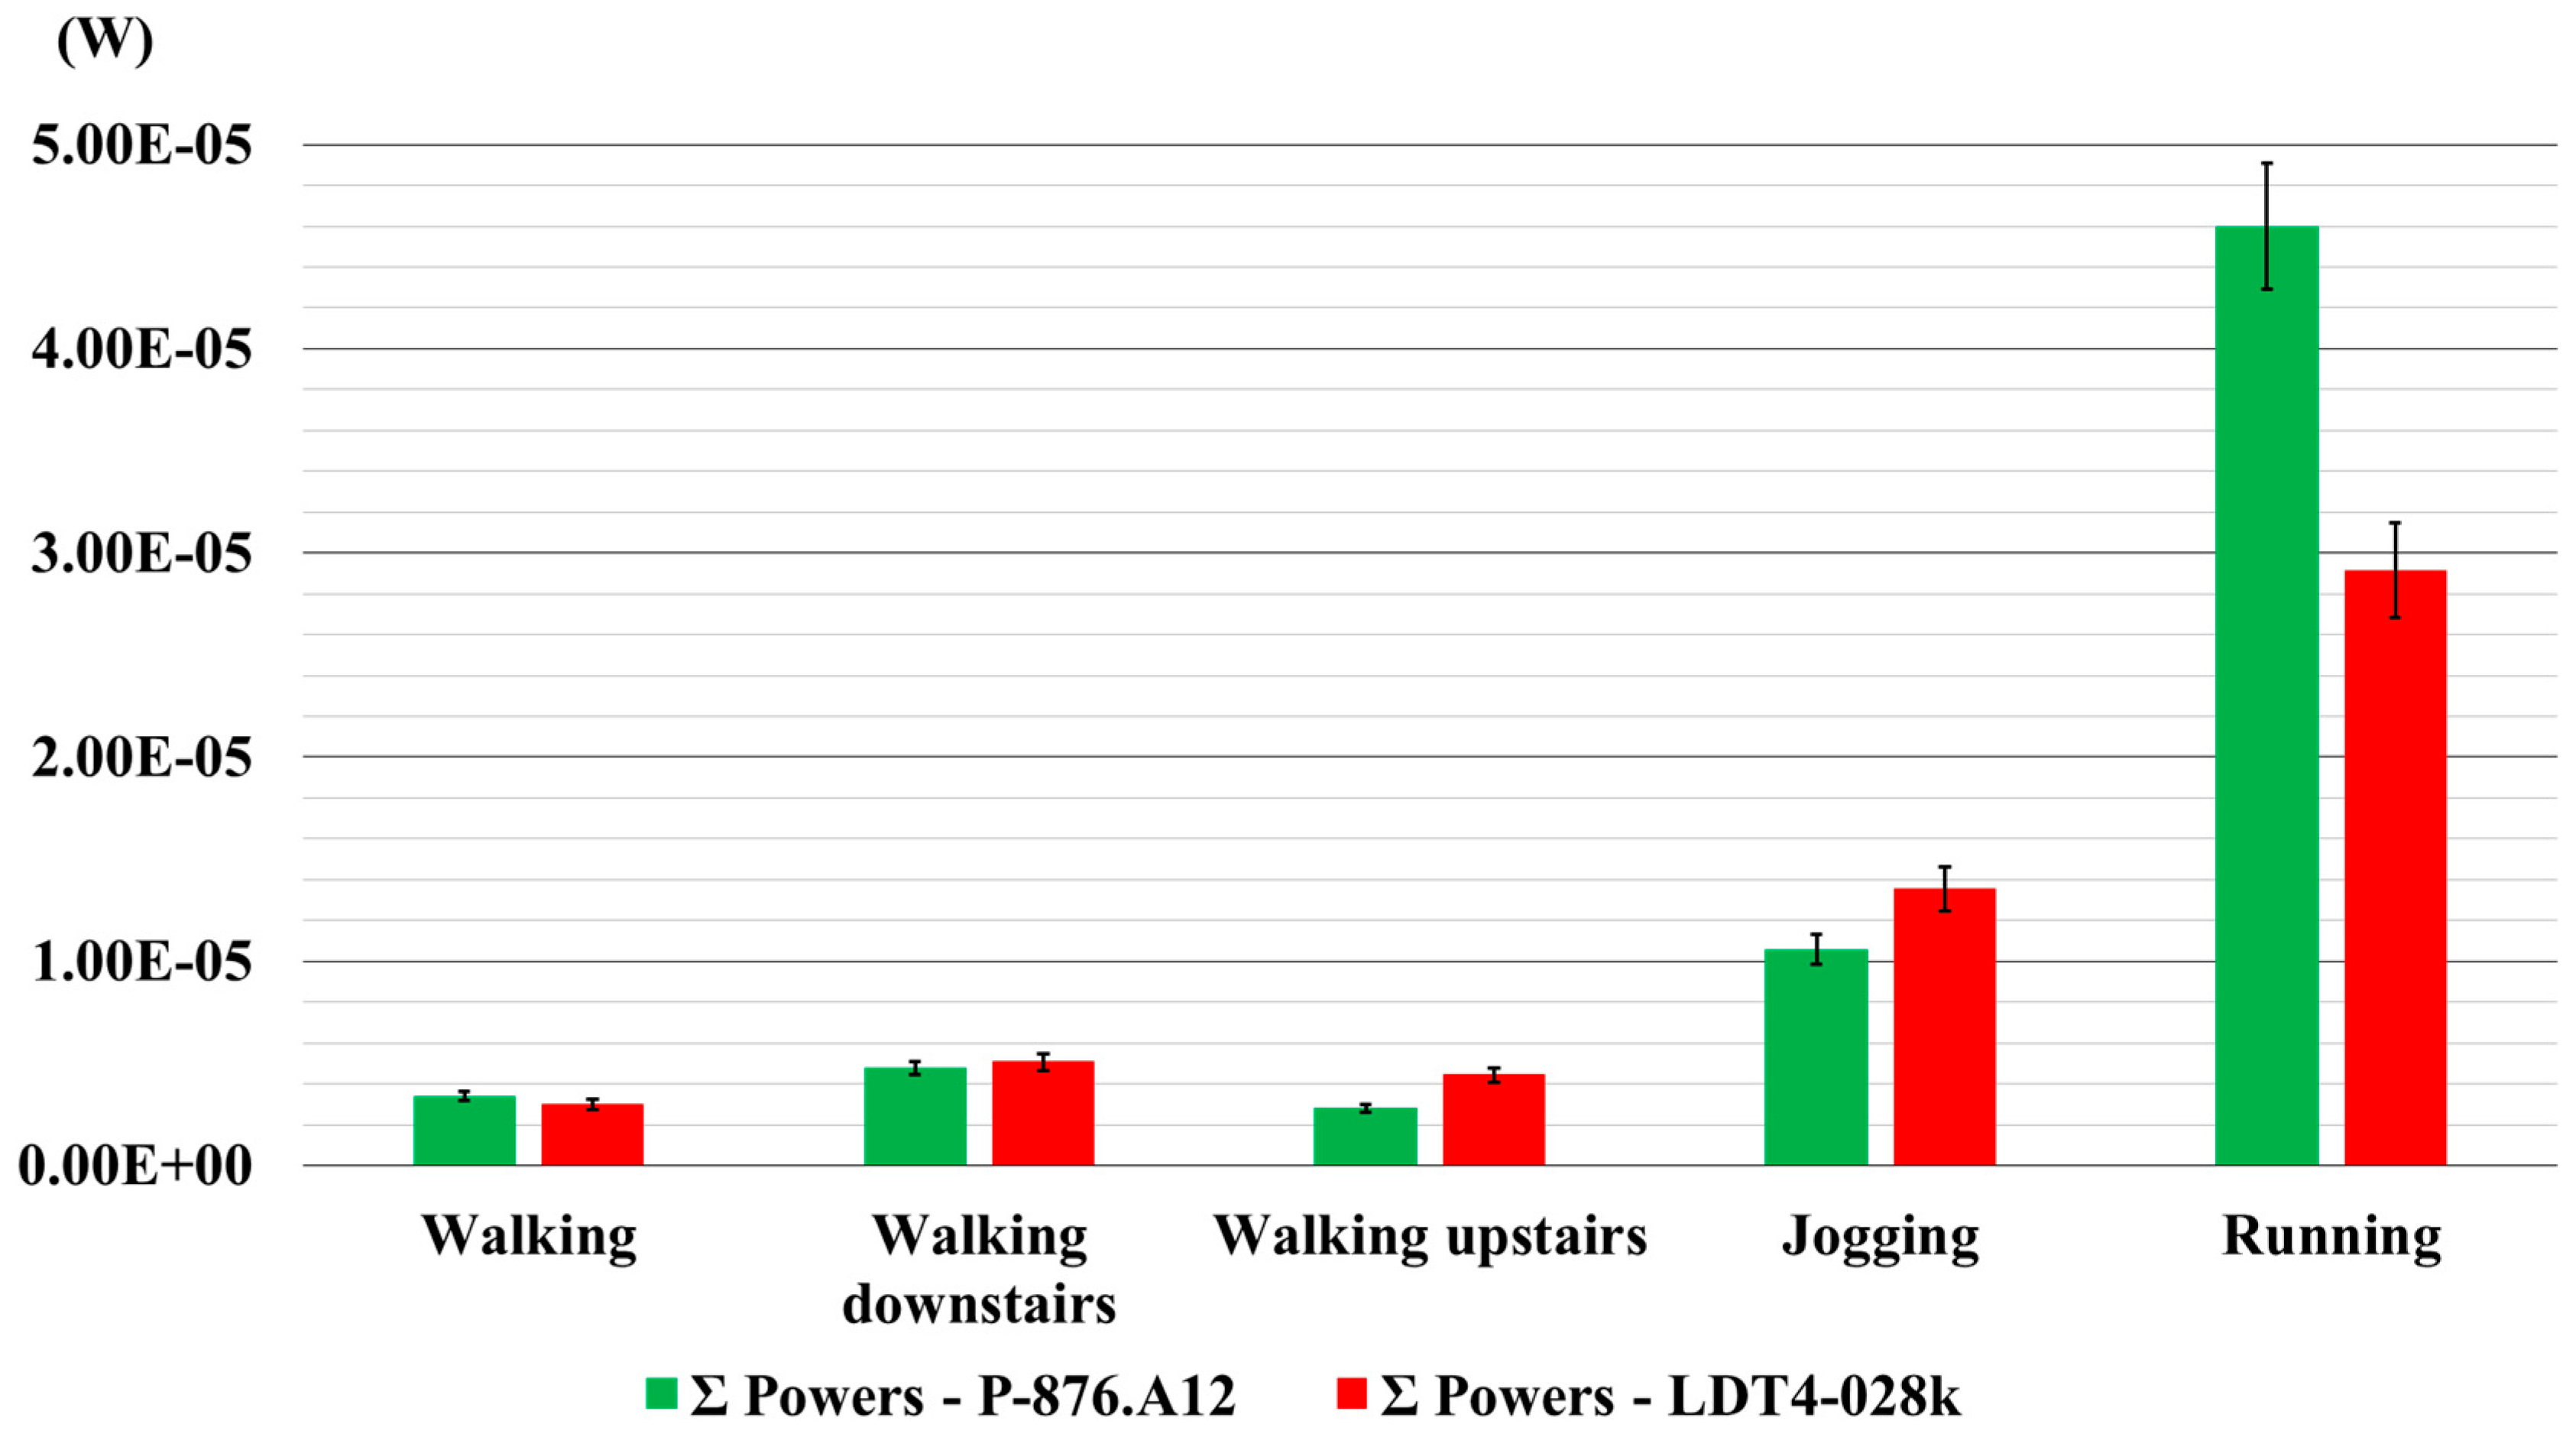
The graph in Figure 7 shows the results of the overall comparison between the transducers, by considering the sum of the power output values measured at each joint for each locomotion activity. From the overall comparison, transducers are similar in terms of power generation for both walking and walking down stairs; when walking upstairs and jogging, LDT4-028k is more efficient than P-876.A12. Finally, during running, even if both transducers are appropriate for use as energy harvesters, the PZT transducer performed better than PVDF. The numerical values are summarized in Table 8.
Table 9 breaks down the power generated by the ones that come from the upper body joints and the ones coming from the lower limb joints. The power contribution from the upper body joints is almost negligible for the three walking activities, while it can be considered as a significant source of power generation for both jogging and running.

5. Discussion

As it can be clearly seen from the tests shown in the previous section, the power output measured at each joint is sufficient enough to consider both transducers suitable to be used as energy harvesters for BMEH applications.
When comparing the performed tests, it resulted that soft PZT technology is more efficient than PVDF in terms of generated power output; however, PVDF technology is more comfortable in terms of user wearability.
The results obtained in this work are in line with the results of the current wearable fabrics for BMEH found in the present scientific literature and reported below as follows: Zhang et al. [22] developed a fabric nanogenerator able to produce 10.02 nW when it is attached on an elbow pad and bent by human arms. Yang and Yun [35] prepared three fabrics in the form of a band for wearing on elbow joint, measuring 0.21 mW for a bending velocity of 5 rad/s. Dhakar et al. [36] presented a triboelectric nanogenerator able to generate voltages up to 90 V with a mild finger touch, and Yang et al. [37] developed a flexible triboelectric nanogenerator for energy harvesting from various types of mechanical motions, able to deliver an open-circuit voltage of 700 V and a short-circuit current of 75 µA. Pu et al. [38] developed a textile triboelectric nanogenerator able to generate 20, 2 and 0.8 µA rectified output currents by foot pressing, arm swinging and elbow bending, respectively. Yun et al. [39] presented a very flexible harvester design that can elastically stretch to 1.6-times its normal length, allowing it to be used on a large range of motion body areas. Li et al. [40] developed a power shirt based on triboelectrification and the electrostatic induction effect, able to achieve a maximum peak power density of 4.65 µW/cm2, and Wu et al. [41] produced a wearable nanogenerator able to produce 6 V of output voltage and 45 nA of output current.
The results of the power output harvested from the transducers in this paper represent the power output generated by the five locomotion activities and, thus, may represent an added value to the results found in the current scientific literature, which represent values of the power output generated only from individual body movements.

6. Conclusions

In this paper, two piezoelectric transducers were placed inside a tight wearable suit in proximity to the main human body joints, neck, shoulder, elbow, wrist, hip, knee and ankle, respectively, in order to harvest energy generated by common body movements in the form of casual walking, walking down and up stairs, jogging and running.
In order to work at its best, it is very important for a BMEH system using the piezoelectric transducers to ensure as close contact as possible between the transducers and the skin; therefore, a special manufactured body suit was produced to be worn during the activities executed in this work.
When examining the user wearability of the two transducers, PVDF technology is more adequate than soft PZT, because the value of its folding parameter is higher: as a result, it is more comfortable for the user and can better adhere to body movements.
When examining the power output measured during the five common activities, the values of the power output are in the range of 2–46 µW/cm3 for a single transducer for a joint, while using both transducers for a joint, the values of the power output are in the range of 6 µW–74 µW, thus confirming the possibility to include these harvesters into more general systems for long-term monitoring.
In order to continue the work on the development of a system for BMEH, PVDF material has produced the best results. The soft PZT technology produced higher values of power output, but its lack of comfort makes it difficult to be worn in long-term activities, to adequately follow the body segment movements.

Acknowledgments

The work and the contributions were supported by the project SP2015/179 “Biomedicínské inženýrské systémy XI”, and this paper has been elaborated in the framework of the project “Support research and development in the Moravian-Silesian Region 2014 DT 1—Research Teams” (RRC/07/2014); financed by the budget of the Moravian-Silesian Region and by the Italian Ministry of Education and Research. The suit was made by 3M MANIFATTURE S.R.L., Pomarico (MT) 75016, Basilicata, Italy.

Author Contributions

Antonino Proto led the experimentation, performed data analysis and drafted the manuscript. Marek Penhaker and Daniele Bibbo designed the study and contributed to the setup of the system for data recording. David Vala prepared the measurement system for the experiment and contributed to the work organization. Silvia Conforto and Maurizio Schmid contributed to the study methodology of the work and to the manuscript critical revision.

Conflicts of Interest

The authors declare no conflict of interest.

References

  1. Starner, T. Human-powered wearable computing. IBM Syst. J. 1996, 35, 618–629. [Google Scholar] [CrossRef]
  2. Shenck, N.S.; Paradiso, J.A. Energy scavenging with shoe-mounted piezoelectrics. IEEE Micro 2001, 21, 30–42. [Google Scholar] [CrossRef]
  3. Gonzalez, J.L.; Rubio, A.; Moll, F. Human powered piezoelectric batteries to supply power to wearable electronic devices. Int. J. Soc. Mater. Eng. Resour. 2002, 10, 34–40. [Google Scholar] [CrossRef]
  4. Niu, P.; Chapman, P.; Riemer, R.; Zhang, X.D. Evaluation of Motions and Actuation Methods for Biomechanical Energy Harvesting. In Proceedings of the 35th Annual IEEE Power Electronics Specialists Conference (PESC 04), Aachen, Germany, 20–25 June 2004; Volume 3, pp. 2100–2106.
  5. Fida, B.; Bibbo, D.; Bernabucci, I.; Proto, A.; Conforto, S.; Schmid, M. Real Time Event-Based Segmentation to Classify Locomotion Activities through a Single Inertial Sensor. In Proceedings of the 5th EAI International Conference on Wireless Mobile Communication and Healthcare, London, UK, 14–16 October 2015.
  6. Fida, B.; Bernabucci, I.; Bibbo, D.; Conforto, S.; Proto, A.; Schmid, M. The Effect of Window Length on the Classification of Dynamic Activities through a Single Accelerometer. In Proceedings of the 11th IASTED International Conference on Biomedical Engineering (BioMed 2014), Zurich, Switzerland, 23–25 June 2014.
  7. Rome, L.C.; Flynn, L.; Goldman, E.M.; Yoo, T.D. Generating electricity while walking with loads. Science 2005, 309, 1725–1728. [Google Scholar] [CrossRef] [PubMed]
  8. Donelan, J.M.; Li, Q.; Naing, V.; Hoffer, J.A.; Weber, D.J.; Kuo, A.D. Biomechanical energy harvesting: Generating electricity during walking with minimal user effort. Science 2008, 319, 807–810. [Google Scholar] [CrossRef] [PubMed]
  9. Mitcheson, P.D.; Yeatman, E.M.; Rao, G.K.; Holmes, A.S.; Green, T.C. Energy harvesting from human and machine motion for wireless electronic devices. IEEE Proc. 2008, 96, 1457–1486. [Google Scholar] [CrossRef] [Green Version]
  10. Vullers, R.J.M.; van Schaijk, R.; Doms, I.; van Hoof, C.; Mertens, R. Micropower energy harvesting. Solid-State Electron. 2009, 53, 684–693. [Google Scholar] [CrossRef]
  11. Huang, L.; Ashouei, M.; Yazicioglu, F.; Penders, J.; Vullers, R.; Dolmans, G.; Merken, P.; Huisken, J.; de Groot, H.; van Hoof, C.; et al. Ultra-Low Power Sensor Design for Wireless Body Area Networks: Challenges, Potential Solutions, and Applications. J. Digit. Content Technol. Appl. 2011, 3, 136–148. [Google Scholar] [CrossRef]
  12. Hanson, M.A.; Powell, H.C., Jr.; Barth, A.T.; Ringgenberg, K.; Calhoun, B.H.; Aylor, J.H.; Lach, J. Body area sensor networks: Challenges and opportunities. Computer 2009, 42, 58–65. [Google Scholar] [CrossRef]
  13. Proto, A.; Bibbo, D.; Conforto, S.; Schmid, M. A New Microcontroller-Based System to Optimize the Digital Conversion of Signals Originating from Load Cells built-in into Pedals. In Proceedings of the IEEE Conference on Biomedical Circuits and Systems (BioCAS 2014), Lausanne, Switzerland, 22–24 October 2014; pp. 300–303.
  14. Bonato, P.; Cutolo, F.; de Rossi, D.; Hughes, R.; Patel, S.; Schmid, M.; Stein, J.; Tognetti, A. Wearable Technologies to Monitor Motor Recovery and Facilitate Home Therapy in Individuals Post-Stroke. In Proceedings of the ISEK XVII Congress, Niagara Falls, ON, Canada, 18–21 June 2008.
  15. Shukla, R.; Bell, A.J. PENDEXE: A novel energy harvesting concept for low frequency human waistline. Sens. Actuators A 2015, 222, 39–47. [Google Scholar] [CrossRef]
  16. Stoppa, M.; Chiolerio, A. Wearable electronics and smart textiles: A critical review. Sensors 2014, 14, 11957–11992. [Google Scholar] [CrossRef] [PubMed]
  17. Misra, V.; Bozkurt, A.; Calhoun, B.; Jackson, T.N.; Jur, J.S.; Lach, J.; Lee, B.; Muth, J.; Oralkan, O.; Oeztuerk, M.; et al. Flexible technologies for self-powered wearable health and environmental sensing. Proc. IEEE 2015, 103, 665–681. [Google Scholar] [CrossRef]
  18. Roundy, S. On the effectiveness of vibration-based energy harvesting. J. Intel. Mater. Syst. Struct. 2005, 16, 809–823. [Google Scholar] [CrossRef]
  19. Wang, L.; Yuan, F.G. Vibration energy harvesting by magnetostrictive material. Smart Mater. Struct. 2008, 17. [Google Scholar] [CrossRef]
  20. Caliò, R.; Rongola, U.B.; Camboni, D.; Milazzo, M.; Stefanini, C.; de Petris, G.; Oddo, C.M. Piezoelectric Energy Harvesting Solutions. Sensors 2014, 14, 4755–4790. [Google Scholar] [CrossRef] [PubMed] [Green Version]
  21. Koka, A.; Zhou, Z.; Sodano, H.A. Vertically aligned BaTiO3 nanowire arrays for energy harvesting. Energy Environ. Sci. 2014, 7, 288–296. [Google Scholar] [CrossRef]
  22. Zhang, M.; Gao, T.; Wang, J.; Liao, J.; Qiu, Y.; Yang, Q.; Xue, H.; Shi, Z.; Zhao, Y.; Xiong, Z.; et al. A hybrid fibers based wearable fabric piezoelectric nanogenerator for energy harvesting application. Nano Energy 2015, 13, 298–305. [Google Scholar] [CrossRef]
  23. Kranz, B.; Benjeddou, A.; Drossel, W.-G. Numerical and experimental characterizations of longitudinally polarized piezoelectric d(15) shear macro-fiber composites. Acta Mech. 2013, 224, 2471–2487. [Google Scholar] [CrossRef]
  24. Dürager, C. Energy harvesting for wireless sensors by using piezoelectric transducers. In Proceedings of the 6th European Workshop on Structural Health Monitoring, Dresden, Germany, 3–6 July 2012; Volume 1, pp. 217–223.
  25. Halim, M.A.; Khym, S.; Park, J.Y. Frequency up-converted wide bandwidth piezoelectric energy harvester using mechanical impact. J. Appl. Phys. 2013, 114. [Google Scholar] [CrossRef]
  26. Bai, S.; Zhang, L.; Xu, Q.; Zheng, Y.; Qin, Y.; Wang, Z.L. Two dimensional woven nanogenerator. Nano Energy 2013, 2, 749–753. [Google Scholar] [CrossRef]
  27. Sirohi, J.; Chopra, I. Fundamental understanding of piezoelectric strain sensors. J. Intel. Mater. Syst. Struct. 2000, 11, 246–257. [Google Scholar] [CrossRef]
  28. P-876 DuraAct Patch Transducer. Available online: http://www.piceramic.com/product-detail-page/p-876-101790.html (accessed on 16 September 2015).
  29. Piezo Sensor—LDT Series. Available online: http://www.meas-spec.com/product/t_product.aspx?id=2484 (accessed on 16 September 2015).
  30. Piezo Technical Manual. Available online: http://www.meas-spec.com/downloads/Piezo_Technical_Manual.pdf (accessed on 18 January 2016).
  31. Reese, N.B.; Bandy, W.D. Joint Range of Motion and Muscle Length Testing, 9th ed.; W.B. Saunders Company: Philadelphia, PA, USA, 2002; pp. 44–45. [Google Scholar]
  32. Ottman, G.K.; Hofmann, H.F.; Bhatt, A.C.; Lesieutre, G.A. Adaptive piezoelectric energy harvesting circuit for wireless remote power supply. IEEE Trans. Power Electron. 2002, 17, 669–676. [Google Scholar] [CrossRef]
  33. LDT1–028K Piezo Sensor with Lead Attachment. Available online: http://www.meas-spec.com/downloads/LDT1-028K_Application_Note.pdf (accessed on 22 September 2015).
  34. Whitepaper: Energy Harvesting Uses the Piezo Effect. Available online: http://www.piceramic.com/applications/piezo-energy-harvesting.html (accessed on 22 September 2015).
  35. Yang, B.; Yun, K.S. Piezoelectric shell structures as wearable energy harvesters for effective power generation at low-frequency movement. Sens. Actuators A Phys. 2012, 188, 427–433. [Google Scholar] [CrossRef]
  36. Dhakar, L.; Tay, F.E.H.; Lee, C. Skin based flexible triboelectricnanogenrators with motion sensing capability. In Proceedings of the 28th IEEE International Conference on Micro Electro Mechanical Systems, Estoril, Portugal, 18–22 January 2015; pp. 106–109.
  37. Yang, P.-K.; Lin, L.; Yi, F.; Li, X.; Pradel, K.C.; Zi, Y.; Wu, C.-I.; He, J.-H.; Zhang, Y.; Wang, Z.L. A flexible, stretchable and shape-adaptive approach for versatile energy conversion and self-powered biomedical monitoring. Adv. Mater. 2015, 27, 3817–3824. [Google Scholar] [CrossRef] [PubMed]
  38. Pu, X.; Li, L.; Song, H.; Du, C.; Zhao, Z.; Jiang, C.; Cao, G.; Hu, W.; Wang, Z.L. A self-charging power unit by integration of a textile triboelectricnanogenerator and a flexible lithium-ion battery for wearable electronics. Adv. Mater. 2015, 27, 2472–2478. [Google Scholar] [CrossRef] [PubMed]
  39. Yun, D.; Park, J.; Yun, K.S. Power in motion. Electron. Lett. 2015, 51, 193–193. [Google Scholar]
  40. Li, S.; Zhong, Q.; Zhong, J.; Cheng, X.; Wang, B.; Hu, B.; Zhou, J. Cloth-based power shirt for wearable energy harvesting and clothes ornamentation. ACS Appl. Mater. Interfaces 2015, 7, 14912–14916. [Google Scholar] [CrossRef] [PubMed]
  41. Wu, W.; Bai, S.; Yuan, M.; Qin, Y.; Wang, Z.L.; Jing, T. Lead zirconate titanate nanowire textile nanogenerator for wearable energy-harvesting and self-powered devices. ACS Nano 2012, 6, 6231–6235. [Google Scholar] [CrossRef] [PubMed]
Figure 1. The P-876.A12 sensor [28] and LDT4-028k sensor [29].
Sensors 16 00524 g001
Figure 2. The blue suit with the green pockets and a green belt (please see Table 4 for denotation).
Sensors 16 00524 g002
Figure 3. Measurement circuit.
Sensors 16 00524 g003
Figure 4. Sample of the signal of the voltage output measured by using the LDT4-028k transducer placed on the elbow joint for the movement of flexion-extension. The calculated RMS value corresponds to 13.78 V, slightly less than the value that could have been obtained if Equation (6), for sinusoidal waves, had been applied (14.62 V).
Sensors 16 00524 g004
Figure 5. The calculated mean values of the power output for each value of the load resistor. Error bars represent standard deviations. (a) P-876.A12; (b) LDT4-028k.
Sensors 16 00524 g005
Figure 6. Comparison of the calculated grand mean values of power output on each joint for each activity. Error bars represent standard deviations. (a) P-876.A12; (b) LDT4-028k.
Sensors 16 00524 g006
Figure 7. The sums of the mean values of the calculated power output on each joint for the activity performed. Error bars represent the standard deviation.
Sensors 16 00524 g007
Table 1. Properties of the P-876.A12 and LDT4-028k transducers.
PropertiesP-876.A12LDT4-028k
Density, ρ (g/cm3)7.81.8
Curié temperature, Tc (°C)350100
Relative permittivity, εr1650–175012–13
Dielectric loss factor, σ0.020.02
Coupling factor, kt0.470.14
Coupling factor, k310.350.12
Coupling factor, k330.69-
Piezo charge coefficient, |d31| (10−12 C/N)18023
Piezo charge coefficient, |d33| (10−12 C/N)40033
Piezo voltage coefficient,|g31| (10−3 V m/N)11.3216
Piezo voltage coefficient,|g33| (10−3 V m/N)25330
Young’s modulus, Y (109 N/m2)55.53.1
Minimum radius curvature, rc (mm)205
Active vol. dimensions (l × w × t) (mm)(50 × 30 × 0.2)(156 × 19 × 0.028)
Electrical capacitance, C (10−9 F)9012
Table 2. Body joints, body joint movements, range of motion [31] and frequency of tests.
Body JointJoint MovementRange of Motion (°)Motion Frequency (Hz)
Neckflexion-extension58 ± 121.40± 0.10
Shoulderadduction-abduction140 ±91.10 ± 0.10
Elbowflexion-extension141 ± 81.25 ± 0.10
Wristflexion-extension129 ± 141.90 ± 0.10
Hipflexion-extension138 ± 211.05 ± 0.10
Kneeflexion-extension135 ± 111.15 ± 0.10
Ankleplantar-dorsiflexion66 ± 51.75 ± 0.10
Table 3. Summary of the common activities and their frequencies.
Common ActivityFrequency of the Activity (Hz)
Walking1.15 ± 0.10
Walking downstairs1.65 ± 0.10
Walking upstairs1.05 ± 0.10
Jogging1.60 ± 0.10
Running2.10 ± 0.10
Table 4. Positions of the transducers on the suit and on the belt.
Numbers in Figure 2Joint, TransducerReference Position for the Measurements
1Wrist, P-876.A12Top of wrist
2Wrist, LDT4-028kTop of wrist
3Elbow, P-876.A12Outer elbow
4Elbow, LDT4-028kInner elbow
5Neck, P-876.A12Back of the neck
6Neck, LDT4-028kBack of the neck
7Knee, P-876.A12Outer knee
8Knee, LDT4-028kInner knee
9Hip, P-876.A12Front hip
10Hip, LDT4-028kFront hip
11Shoulder, P-876.A12Outer shoulder
12Shoulder, LDT4-028kInner shoulder
13Ankle, P-876.A12The ankle plantar
14Ankle, LDT4-028kThe ankle plantar
Table 5. The chosen fixed values of the resistors.
Rload → P-876.A12 TransducerRload → LDT4-028k Transducer
0.075 MΩ1.865 MΩ
0.220 MΩ3.715 MΩ
0.440 MΩ5.745 MΩ
0.610 MΩ7.100 MΩ
0.830 MΩ8.530 MΩ
0.900 MΩ10.545 MΩ
1.180 MΩ13.180 MΩ
1.400 MΩ14.930 MΩ
1.850 MΩ17.215 MΩ
2.400 MΩ18.775 MΩ
3.600 MΩ22.340 MΩ
5.850 MΩ25.175 MΩ
Table 6. The fixed values of the resistors for each joint.
JointRload → P-876.A12Rload → LDT4-028k
Shoulder2.000 MΩ8.880 MΩ
Elbow0.952 MΩ7.880 MΩ
Hip2.000 MΩ10.565 MΩ
Knee1.430 MΩ10.565 MΩ
Ankle0.952 MΩ7.080 MΩ
Table 7. Comparison between the two transducers based on the five locomotion activities: lead zirconate titanate (PZT) and polyvinylidene fluoride (PVDF).
JointWalkingWalking down StairsWalking up StairsJoggingRunning
PZTPVDFPZTPVDFPZTPVDFPZTPVDFPZTPVDF
Shoulder==+-==+--+
Elbow+-====-++-
Hip-+-+-+-++-
Knee+-====+-+-
Ankle======-+-+
Differences in power harvesting between transducers: the symbol “+” represents the transducer with the highest value of power output, and conversely, the symbol “-” represents the transducer with the lowest value of power output. The symbol “=” represents transducers of very similar values of power output.
Table 8. Results of the sum of the power grand mean values measured at all of the joints for each activity.
Activity∑ Power, P-876.A12∑ Power, LDT4-028k
Walking3.39 µW3.38 µW
Walking downstairs4.79 µW4.38 µW
Walking upstairs2.81 µW4.18 µW
Jogging10.60 µW11.81 µW
Running46.00 µW28.41 µW
Table 9. Results shown in Table 8 divided by joint position: upper body and lower body.
Activity∑ Power, P-876.A12∑ Power, LDT4-028k
Upper BodyLower BodyUpper BodyLower Body
Walking0.78 µW2.61 µW0.52 µW2.86 µW
Walking downstairs0.78 µW4.01 µW0.47 µW3.91 µW
Walking upstairs0.60 µW2.21 µW0.39 µW3.79 µW
Jogging2.84 µW7.74 µW2.81 µW9.00 µW
Running11.28 µW34.72 µW9.99 µW18.42 µW

