
Next Generation Air Quality Platform: Openness and Interoperability for the Internet of Things

 , , , , and
Abstract
:1. Introduction
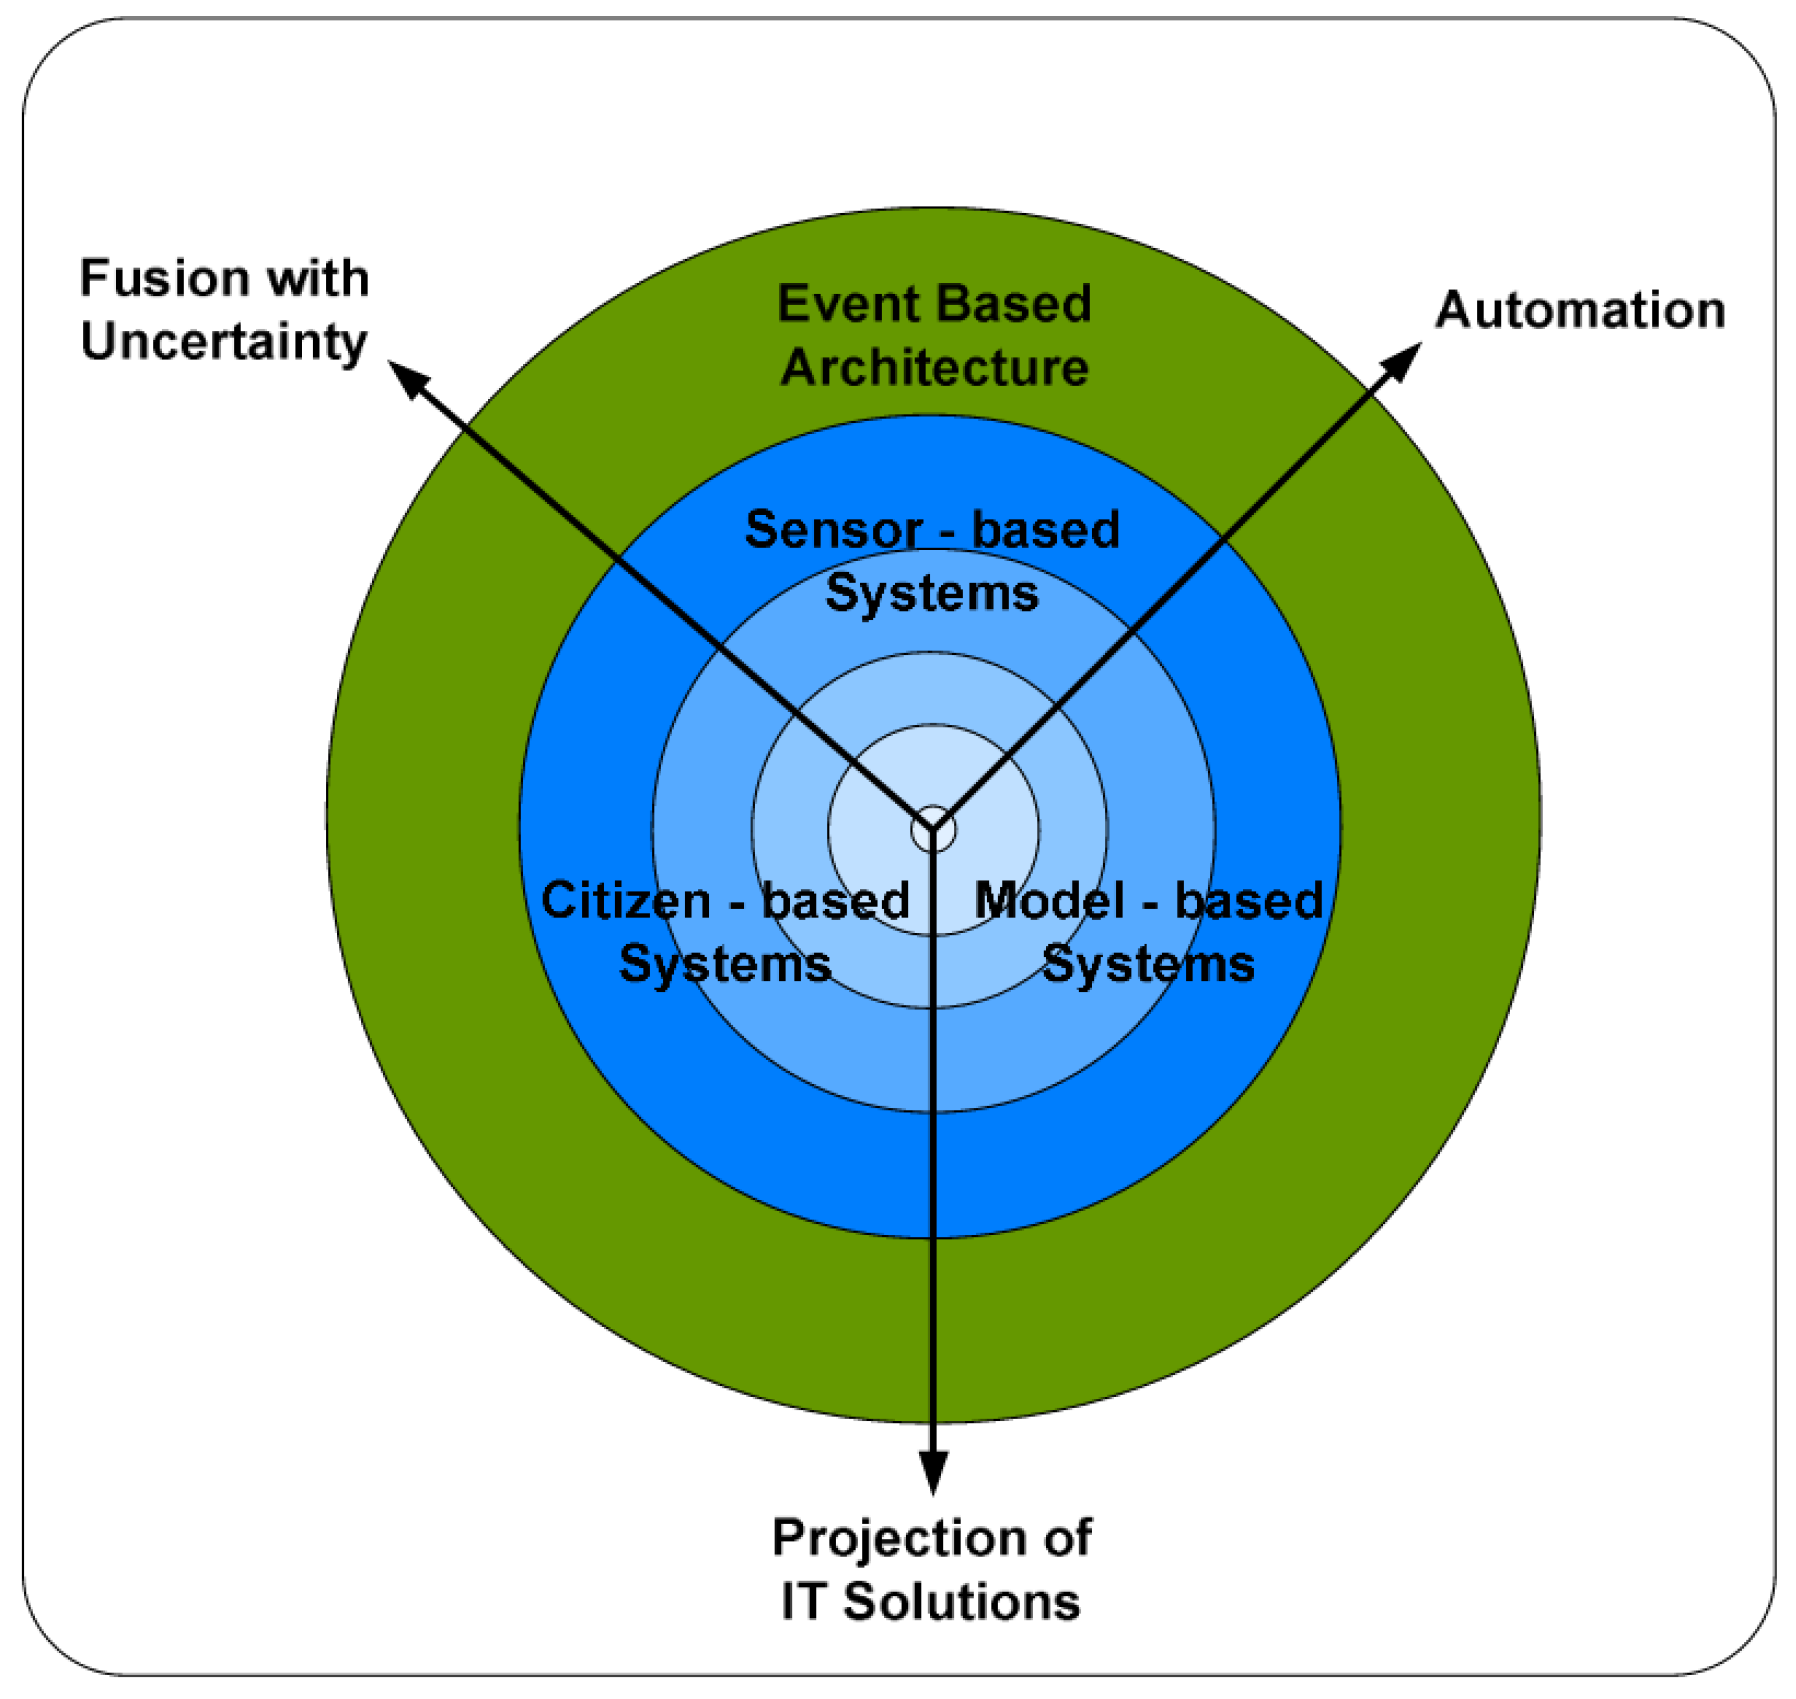
2. Context
2.1. Citizen-Based Systems
- Difficult discovery of environmental sensor devices and networks, due to the lack of metadata and services that expose them;
- Spatial/temporal mismatch of observations and measurements deriving data from unevenly-distributed monitoring stations that do not always form networks causing difficulties in data reuse for initially-unintended purposes;
- Lack of interoperability between components (e.g., measurement devices, protocols for data collection and services) of acquisition and dissemination systems;
- Information silos, created by the use of standalone vocabularies that are bound to particular environmental domains, such as hydrology and air quality;
- Proprietary solutions for logging sensor measurements, which require custom code to be wrapped around the manufacturer’s software development kit;
- Accuracy of the pollution sensors, which, as described in [14], is the major fault in any environmental network of sensors due to their low sensitivity to ambient levels of air pollutants.
2.2. International Standards
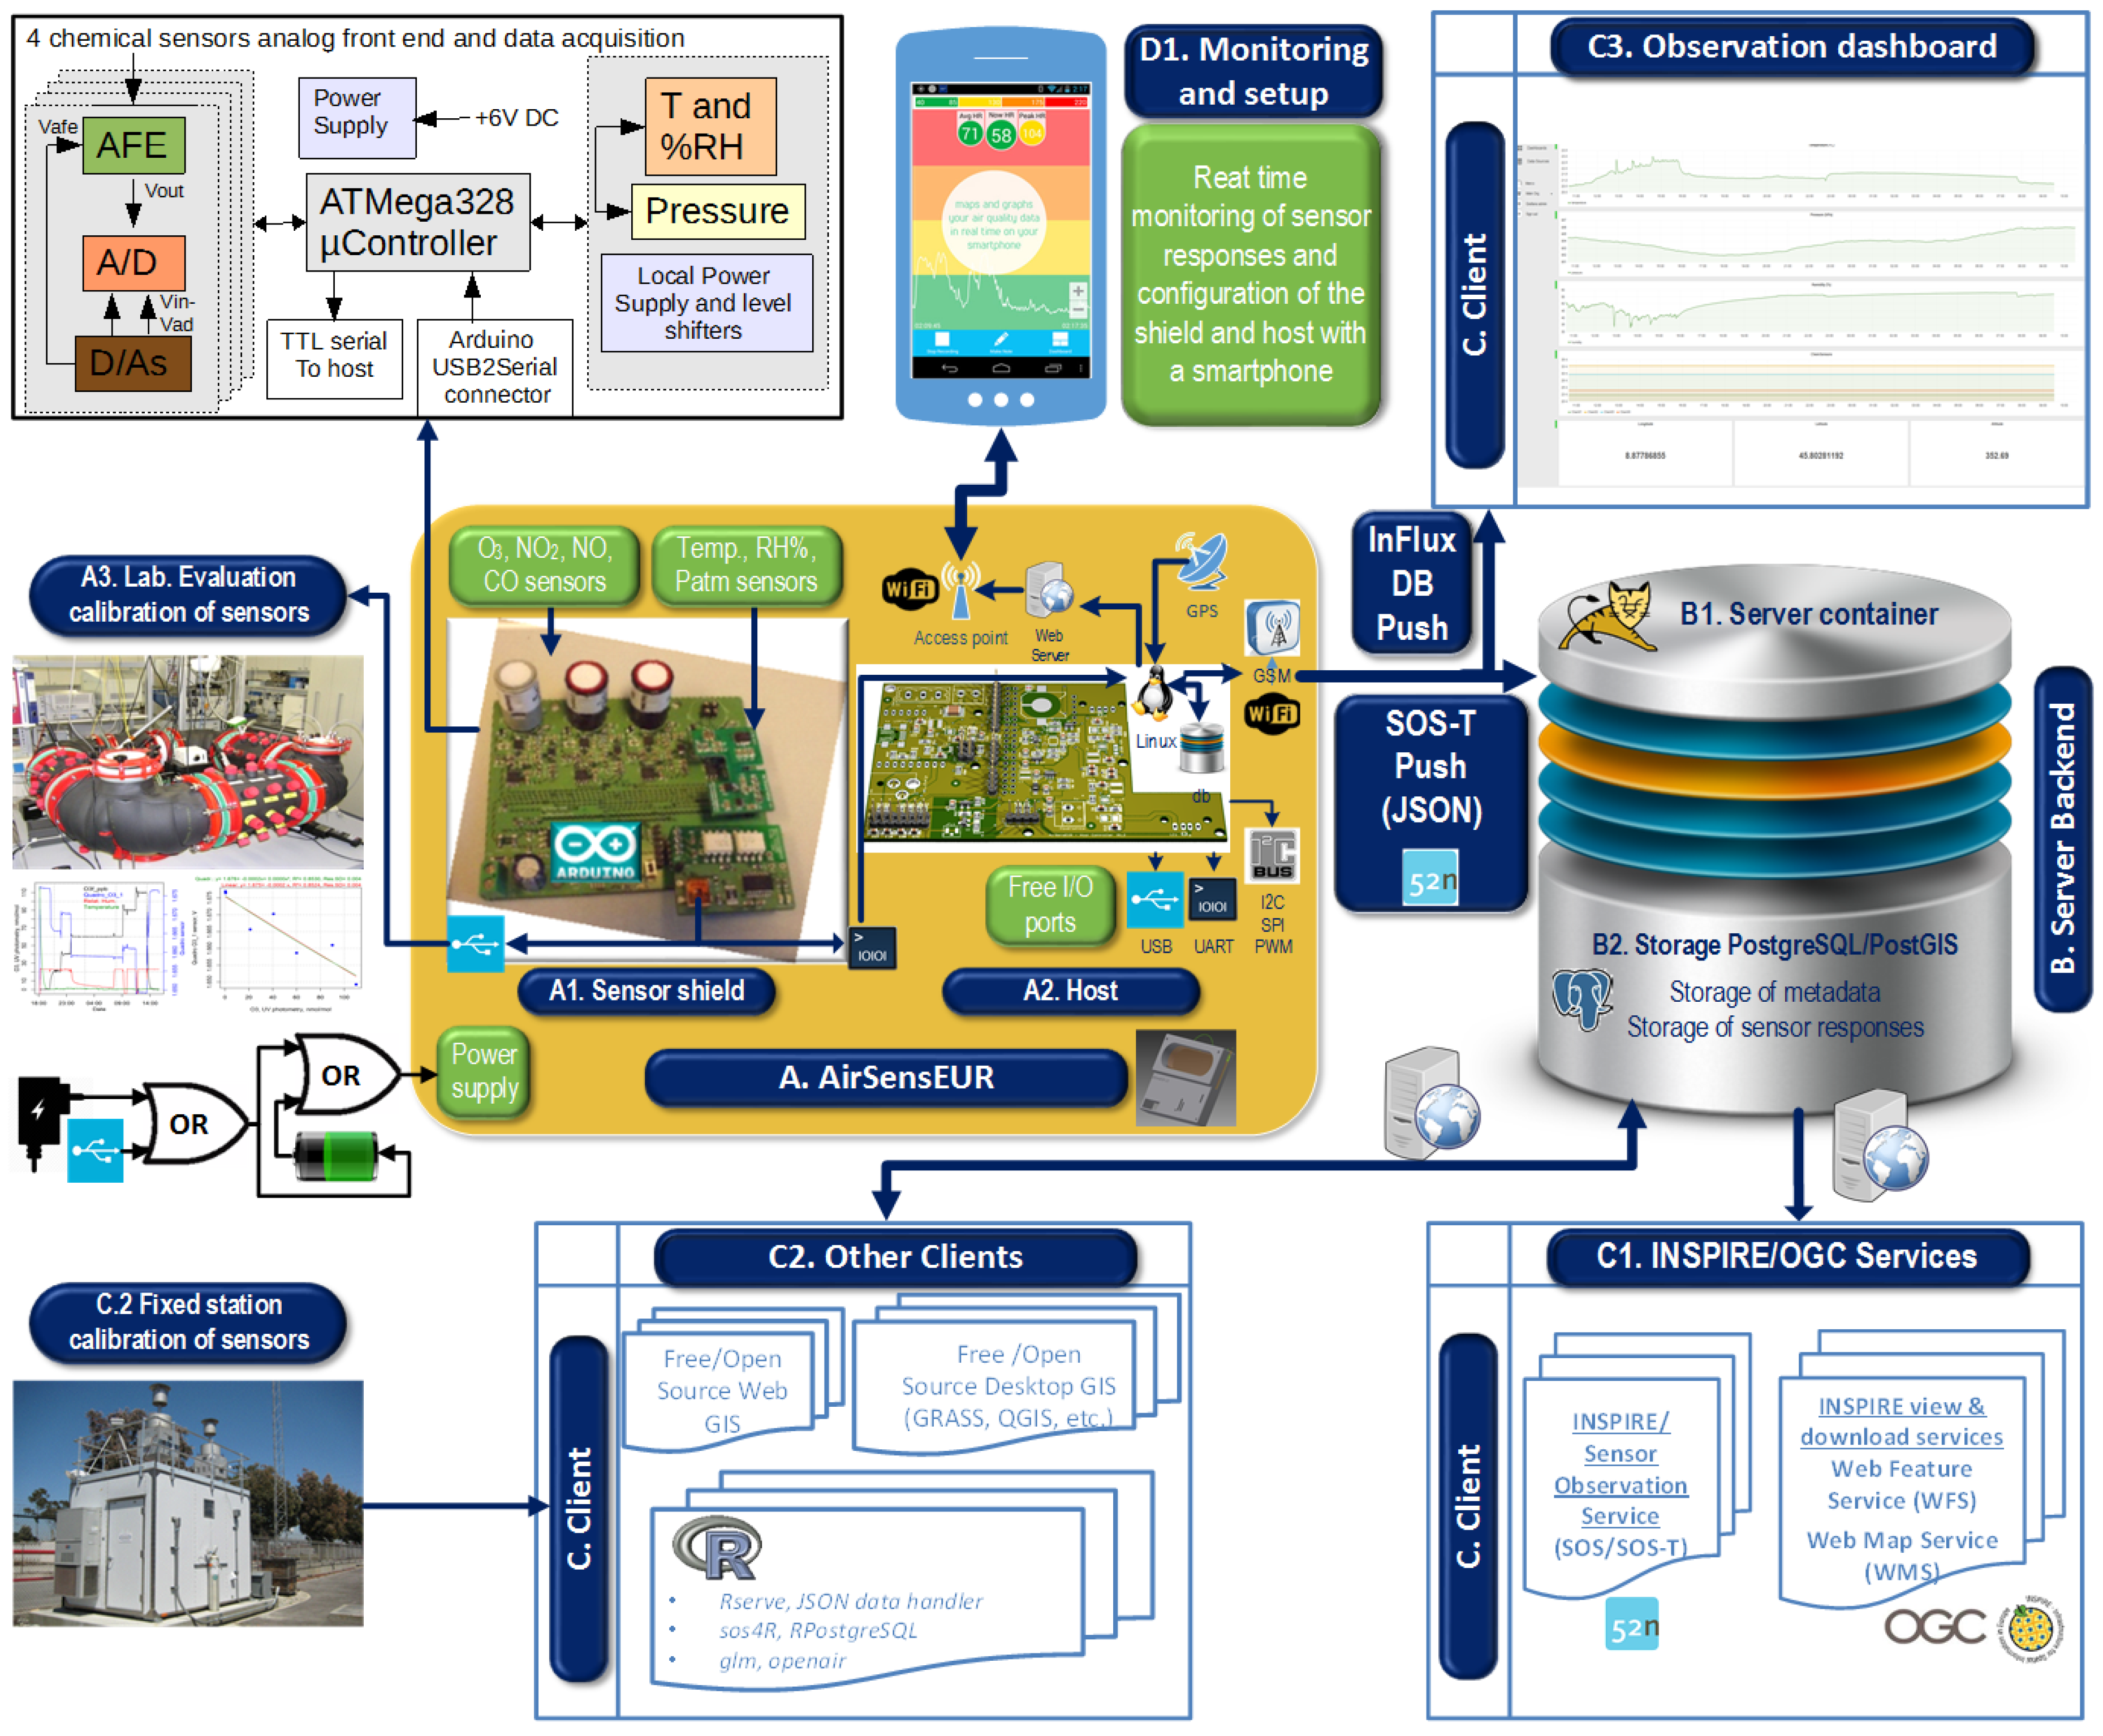
3. AirSensEUR: An Interoperable Plug-and-Play Sensor Node
3.1. Open Hardware
- the Sensoric model (diameter of 16 mm, mounted with a TO5 connector),
- and sensors with a 32-mm diameter: e.g., the 7 series of City Technology or SGX Sensortech, the Membrapor “Compact” sensor series or the “B” sensor series of Alphasense.
3.2. Open Source Software
3.2.1. Sensor Host
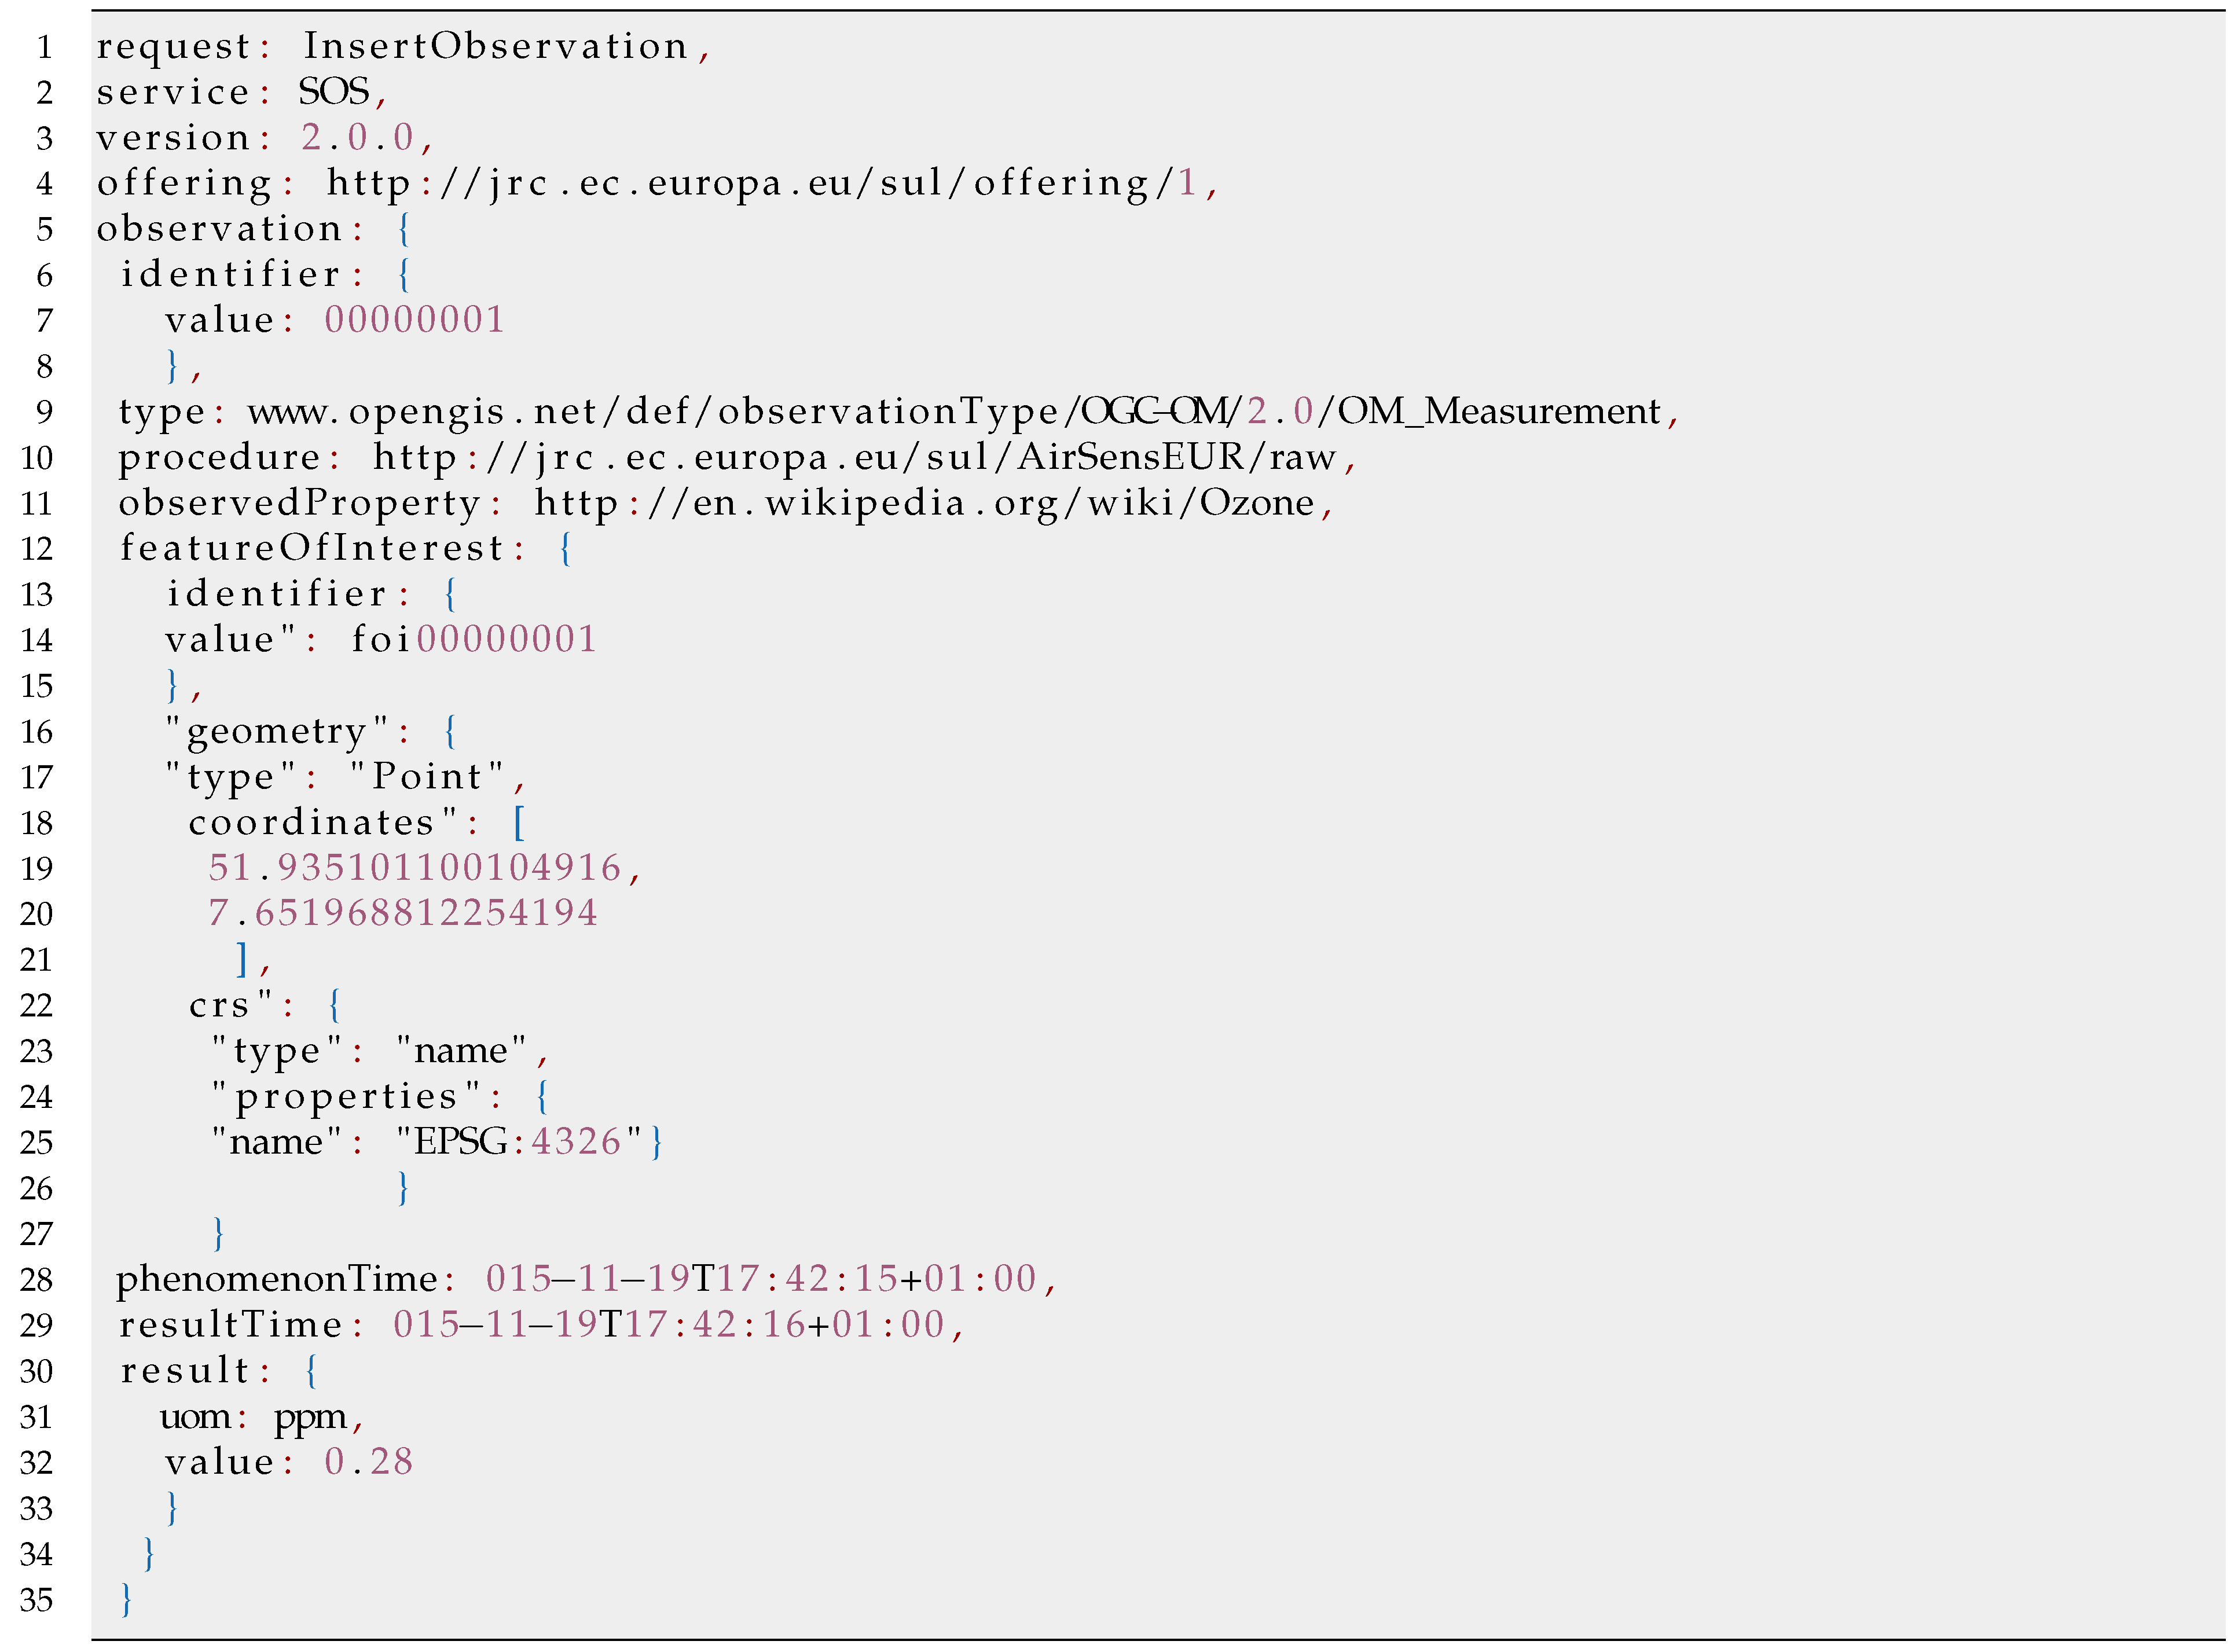
3.2.2. Server Components
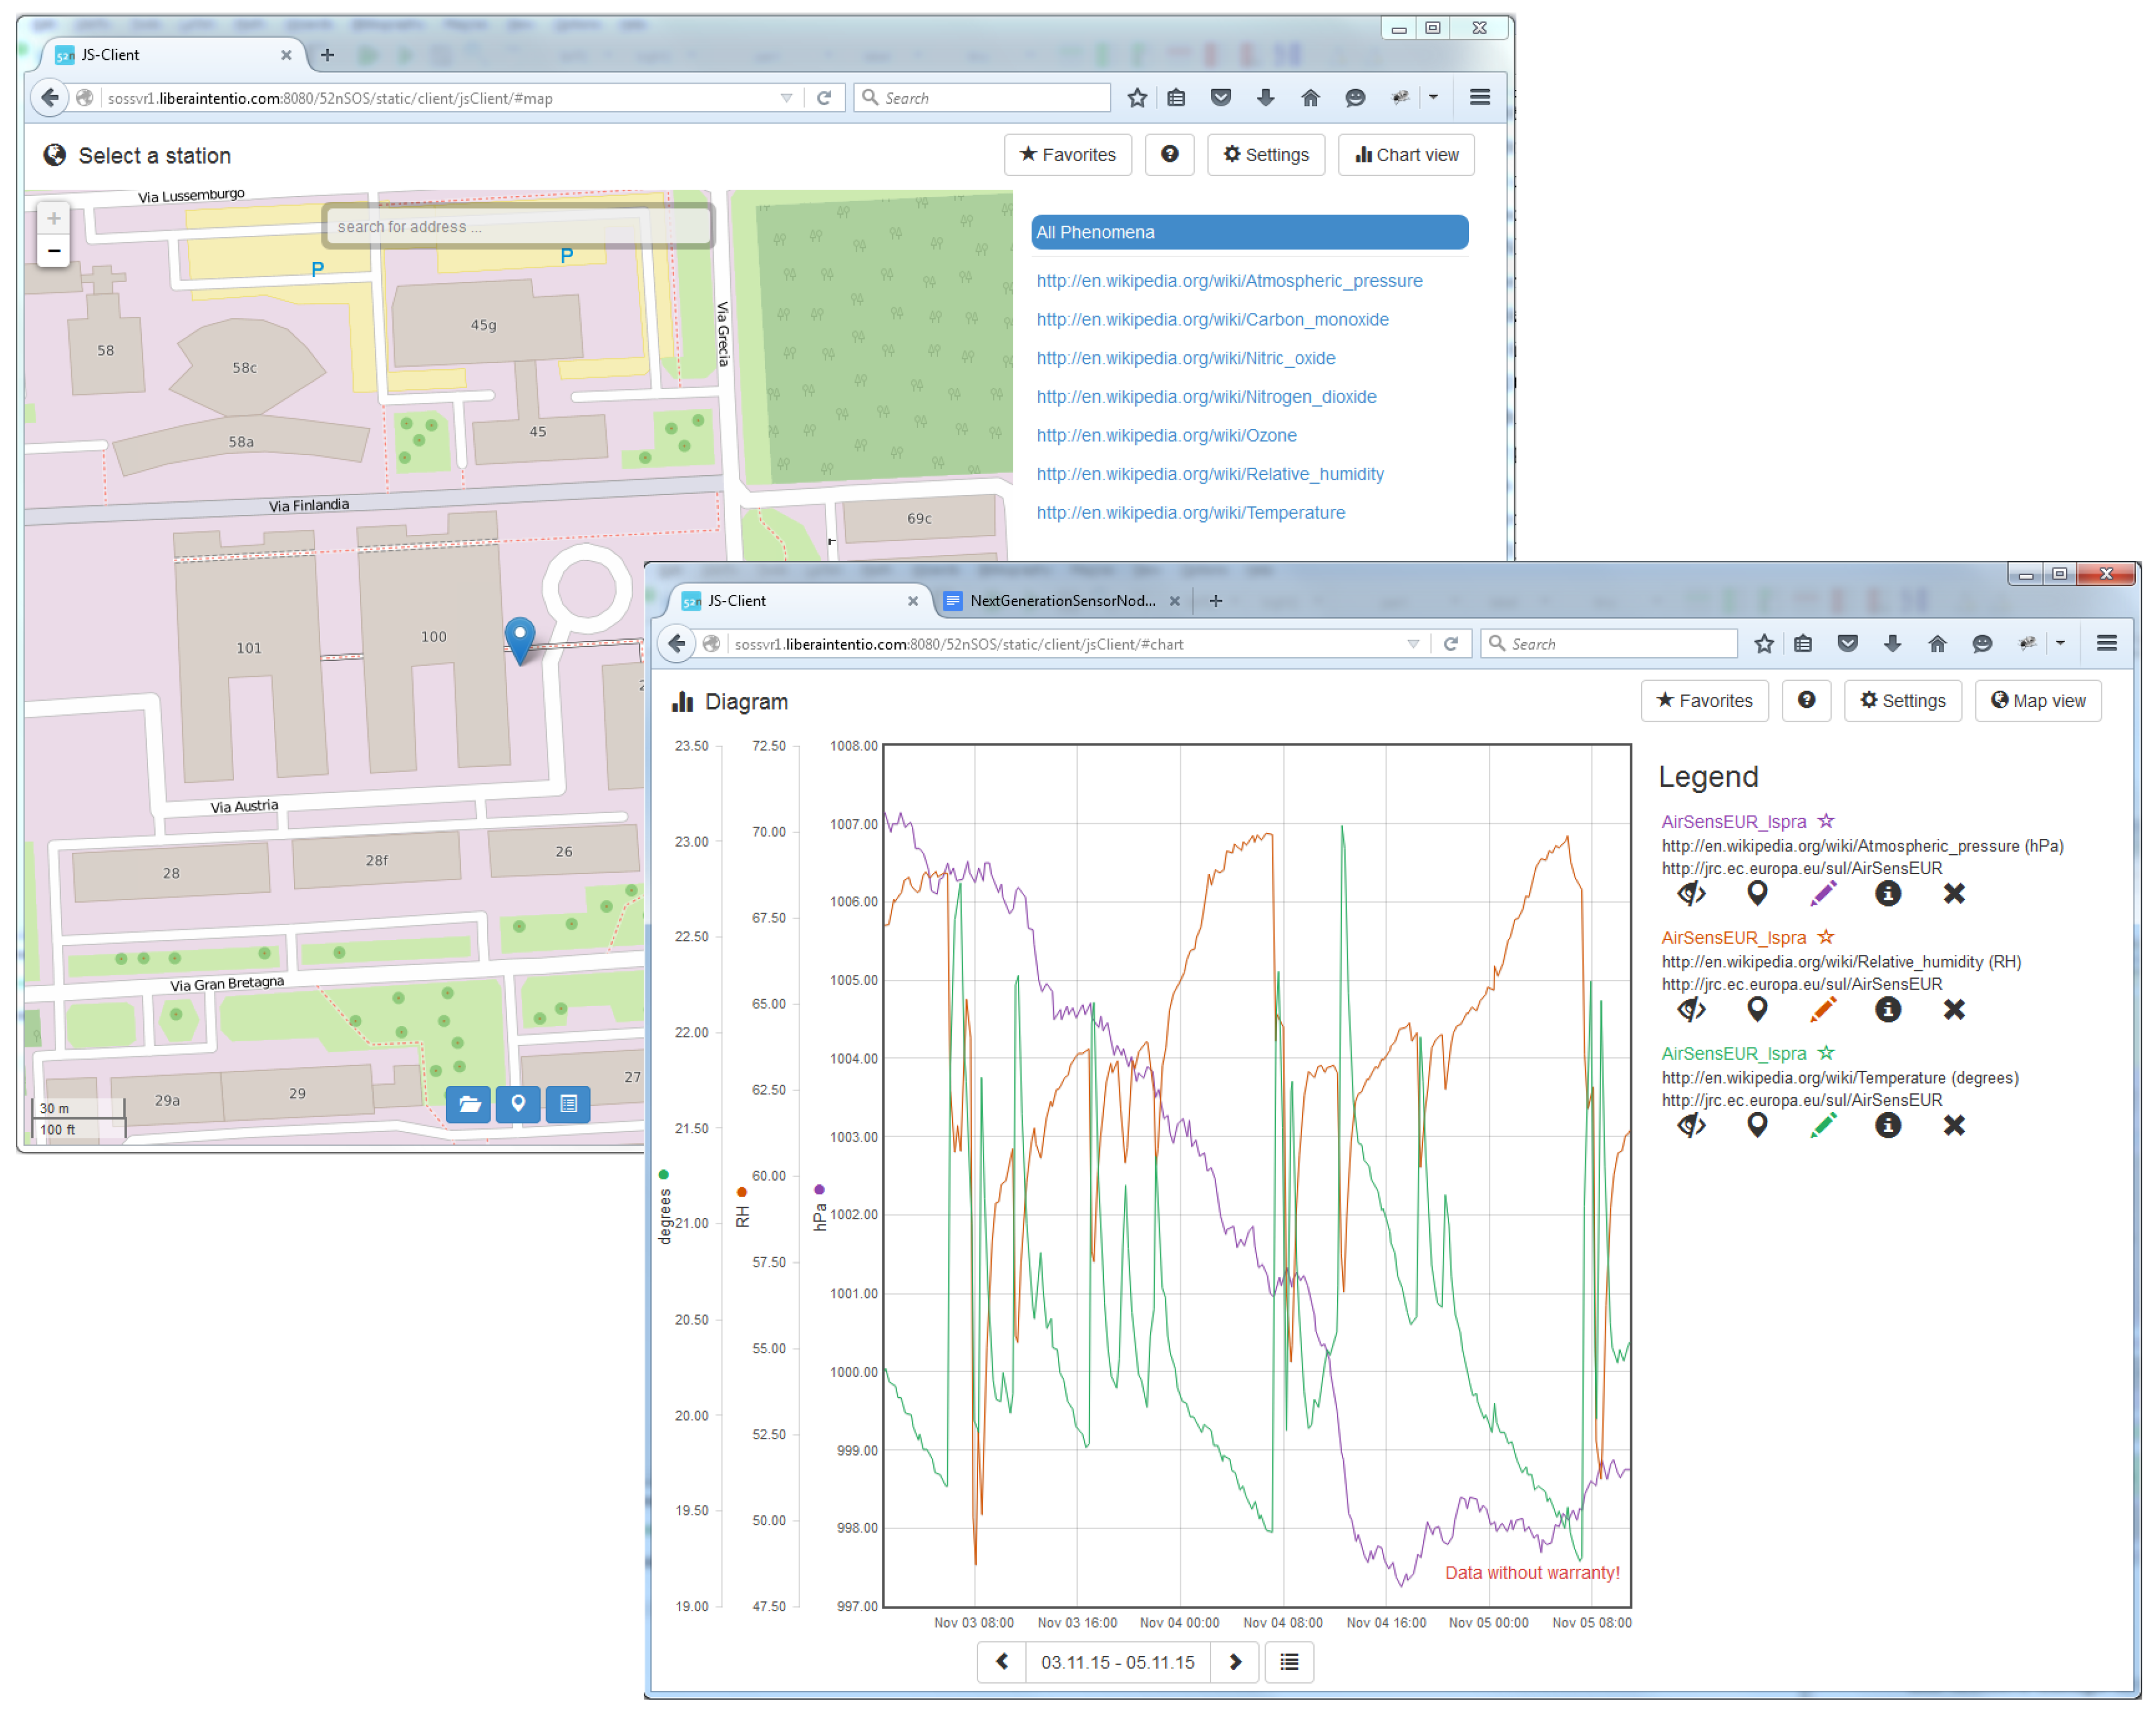
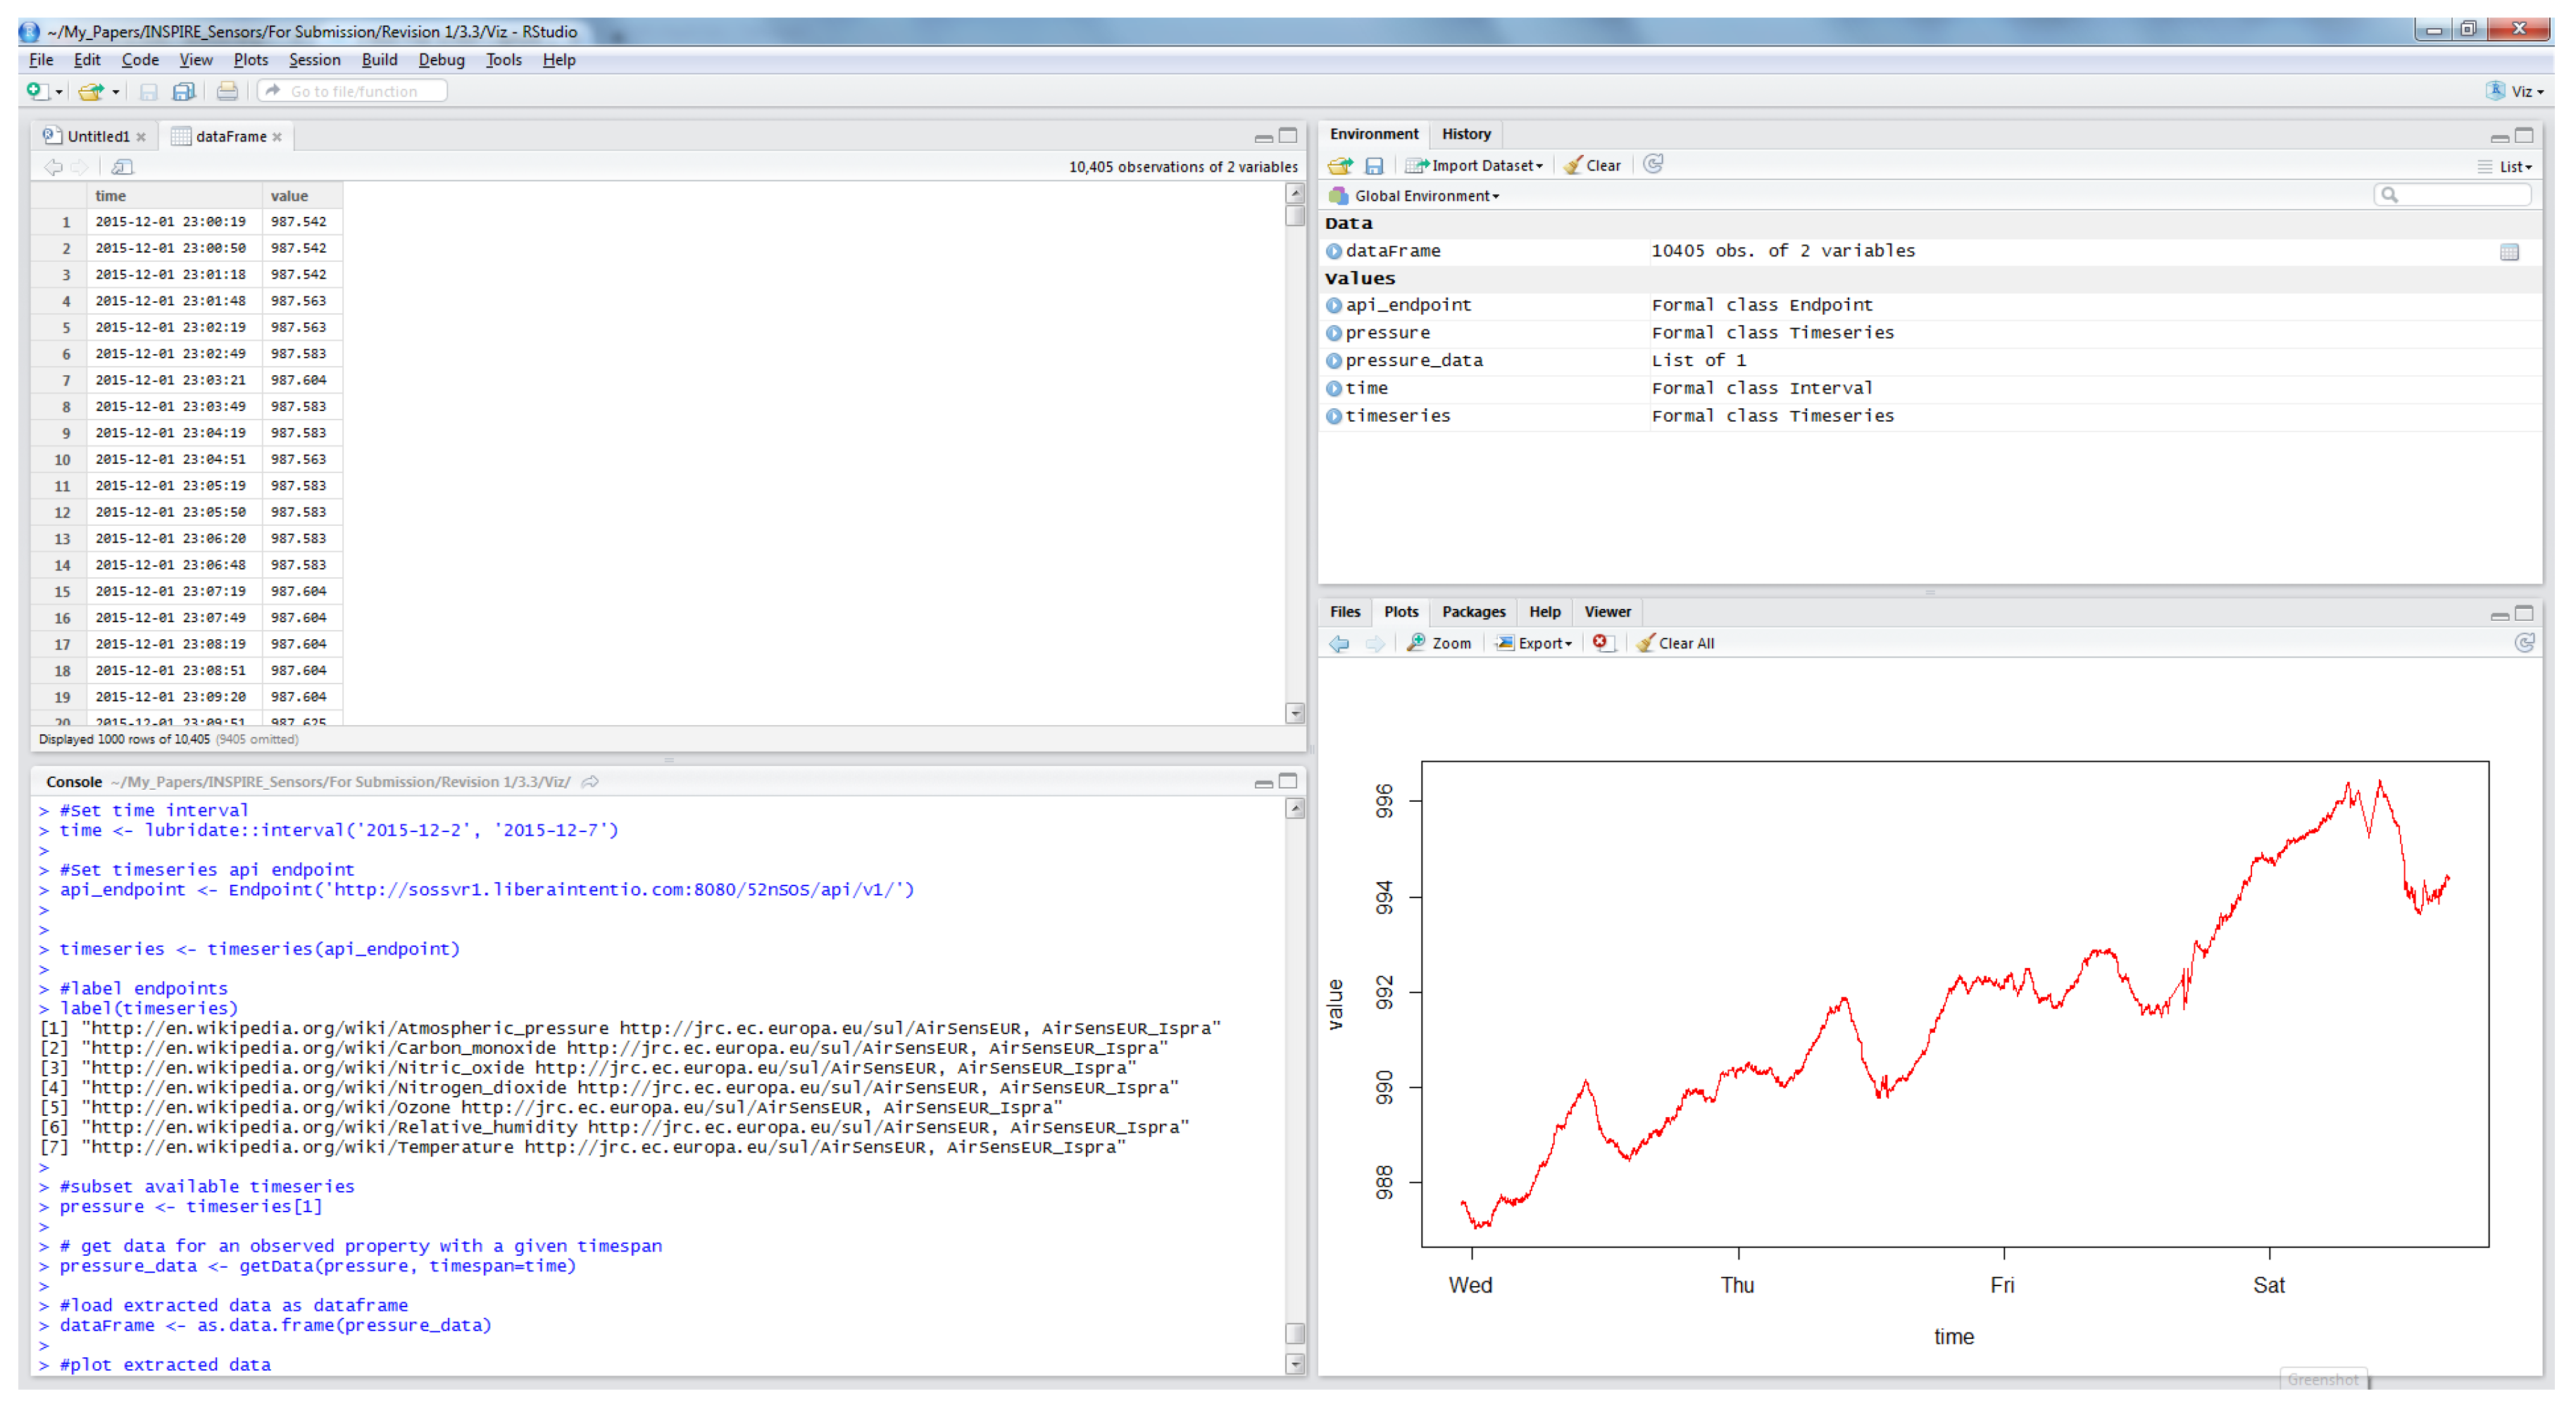
3.2.3. Clients
4. Use Cases
4.1. Monitoring for Regulatory Purposes
- reference methods that can be applied everywhere and for all purposes with a maximum measurement uncertainty of 15% for O, NO, NO and CO;
- indicative methods that can be applied in areas where a defined level, the upper assessment threshold (UAT), is not exceeded, and they permit a reduction of 50% of the minimum reference measurements where the UAT is exceeded, thus allowing one to diminish the cost of monitoring by reducing the mandatory number of reference methods. Indicative methods are associated with a DQO of 25% for NO, NO and CO, 30% for O;
- objective estimation that can only be implemented in an area of low levels of air pollution with a DQO of 75% for O, NO, NO and CO.
4.2. Monitoring for Informative Purposes
4.2.1. Fixed Measurements
4.2.2. Mobile Measurements, Outdoor/Indoor Environments and Citizen Observatories
4.3. Strategies to Ensure Data Quality of AirSensEUR
- establishing a deterministic model based on laboratory and field experiments based on a strict protocol of the sensor test [32];
- as the AirSensEUR includes seven sensors, cross sensitivities may be solved in a multivariate system of equations;
- design of an active sampling system on top of the sensors to easily control the humidity of the air beam and to filter the gaseous interfering compounds;
- calibration at the field monitoring station using co-located pair of reference and sensor data. The types of calibration methods can include linear, multi-linear equations, sensor cluster coupled with artificial neural network (ANN), etc. A good comparison of these techniques is given in [38]. ANN was found to be the most effective technique though requiring additional metal oxide (MOx) sensors not yet present on the AirSensEUR shield;
- future development of calibration facilities (including zero and span) directly on the sensor platform can be imagined. This solution, likely expensive, may only be adopted in association with the active sampling system a few points above. Both of them would use the same pneumatic system. While designing zero air using selective chemical filters seems possible, for example thriethanolamine (TEA) for NO, 1,2-di(4-pyridil)-ethylene (DPE) or indigo for O, the development of a span gas generator appears quite challenging.
5. Discussion and Conclusions
- “Plug-and-play” architecture, which is transparent, allows configuration of each individual component and can be adapted to different mobile and in situ use cases;
- First low cost sensor, expected to provide indicative measures, which would be within the bounds of the requirements of European Union’s Air Quality Directive [19];
- Interoperable architecture, which is aligned by design with the legal requirements of the European Union INSPIRE Directive [16], thus being able to “plug” data into the rapidly evolving pan-European spatial data infrastructure;
- Possibility for the establishment of an open software/hardware/data community around the project through the adoption of a transparent approach, combined with the broad use of well-established open source technology;
- Technical capability for the implementation of on-the-fly calibration through the possibility to push data directly from each sensor node to the “R” statistical package, where calibration curves and other post-processing can be done.
Author Contributions
Conflicts of Interest
References and Notes
- Hart, J.K.; Martinez, K. Environmental Sensor Networks: A revolution in the earth system science? Earth-Sci. Rev. 2006, 78, 177–191. [Google Scholar] [CrossRef]
- Swan, M. Sensor mania! the internet of things, wearable computing, objective metrics, and the quantified self 2.0. J. Sens. Actuator Netw. 2012, 1, 217–253. [Google Scholar] [CrossRef]
- Silvertown, J. A new dawn for citizen science. Trends Ecol. Evol. 2009, 24, 467–471. [Google Scholar] [CrossRef] [PubMed]
- Elen, B.; Theunis, J.; Ingarra, S.; Molino, A.; van den Bossche, J.; Reggente, M.; Loreto, V. The EveryAware SensorBox: A tool for Community-Based Air Quality Monitoring. Available online: www.everyaware.eu/resources/publications/Elen-2012.pdf (accessed on 30 October 2015).
- Bröring, A.; Remke, A.; Lasnia, D. SenseBox—A Generic Sensor Platform for the Web of Things. In Mobile and Ubiquitous Systems: Computing, Networking, and Services; Springer: Berlin/Heidelberg, Germany, 2012; pp. 186–196. [Google Scholar]
- AirQuality Egg. Available online: http://airqualityegg.wikispaces.com/AirQualityEgg (accessed on 30 October 2015).
- Kotsev, A.; Pantisano, F.; Schade, S.; Jirka, S. Architecture of a Service-Enabled Sensing Platform for the Environment. Sensors 2015, 15, 4470–4495. [Google Scholar] [CrossRef] [PubMed] [Green Version]
- Gerboles, M.; Spinelle, L.; Kotsev, A.; Signorini, M.; Srl, L. AirSensEUR: An Open-Designed Multi-Sensor Platform for Air Quality Monitoring. In Proceedings of the Fourth Scientific Meeting EuNetAir, Linkoping, Sweden, 3–5 June 2015. [CrossRef]
- Gerboles, M.; Spinelle, L.; Kotsev, A.; Signorini, M. AirSensEUR: An Open Data/software/hardware Multi-Sensor Platform For Air Quality Monitoring. Part A: Sensor shield. Available online: http://www.ama-science.org/proceedings/details/2118 (accessed on 30 October 2015).
- European Interoperability Framework for Pan-European eGovernment Services. Available online: http://ec.europa.eu/idabc/servlets/Docd552.pdf?id=19529 (accessed on 30 October 2015).
- Schade, S.; Craglia, M. A future sensor web for the environment in Europe. In Proceedings of the 24th International Conference on Informatics for Environmental Protection-Enviroinfo2010, Aachen, Germany, 6–8 October 2010.
- Havlik, D.; Schade, S.; Sabeur, Z.A.; Mazzetti, P.; Watson, K.; Berre, A.J.; Mon, J.L. From sensor to observation web with environmental enablers in the future internet. Sensors 2011, 11, 3874–3907. [Google Scholar] [CrossRef] [PubMed]
- Schade, S.; Ostermann, F.; Spinsanti, L.; Kuhn, W. Semantic observation integration. Future Int. 2012, 4, 807–829. [Google Scholar] [CrossRef]
- Moltchanov, S.; Levy, I.; Etzion, Y.; Lerner, U.; Broday, D.M.; Fishbain, B. On the feasibility of measuring urban air pollution by wireless distributed sensor networks. Sci. Total Environ. 2015, 502, 537–547. [Google Scholar] [CrossRef] [PubMed]
- Miorandi, D.; Sicari, S.; Pellegrini, F.D.; Chlamtac, I. Internet of things: Vision, applications and research challenges. Ad Hoc Netw. 2012, 10, 1497–1516. [Google Scholar] [CrossRef]
- Directive 2007/2/EC of the European Parliament and of the Council of 14 March 2007 Establishing an Infrastructure for Spatial Information in the European Community (INSPIRE). Available online: http://eur-lex.europa.eu/eli/dir/2007/2/oj (accessed on 30 October 2015).
- Guidelines for the use of Observations and Measurements and Sensor Web Enablement-Related Standards in INSPIRE Annex II and III Data Specification Development. Available online: inspire.jrc.ec.europa.eu/documents/Data_Specifications/D2.9_O&M_Guidelines_v2.0.pdf (accessed on 30 October 2015).
- Bröring, A.; Jirka, S.; Kotsev, A.; Spinsanti, L. Making the sensor observation service INSPIRE compliant. In Proceedings of the INSPIRE Conference 2013, Florence, Italy, 23–27 June 2013.
- Directive 2008/50/EC of the European Parliament and of the Council of 21 May 2008 on Ambient Air Quality and Cleaner Air for Europe. Available online: http://eur-lex.europa.eu/legal-content/EN/TXT/?uri=celex%3A32008L0050 (accessed on 30 October 2015).
- AirSensEUR website. Available online: http://www.AirSensEUR.org (accessed on 18 December 2015).
- AirSensEUR GIT repository. Available online: https://webgate.ec.europa.eu/CITnet/stash/projects/AIRSENSEUR (accessed on 18 December 2015).
- Durai, R. Digital Signal Processing; Laxmi Publications: New Delhi, India, 2005. [Google Scholar]
- City Technology: City Sensors. Available online: http://www.citytech.com/ (accessed on 30 October 2015).
- SGX Sensortech. Available online: http://www.sgxsensortech.com/sensor-selector (accessed on 30 October 2015).
- Membrapor—Gas Sensors Manufacturer. Available online: http://www.membrapor.ch (accessed on 30 October 2015).
- Alphasense: Alphasense—The Sensor Technology People: Company Profile. Available online: http://www.alphasense.com/index.php/air/ (accessed on 30 October 2015).
- OSGEO-Live Bundle of Open Source Geospatial Software. Available online: http://live.osgeo.org/en/index.html (accessed on 20 November 2015).
- Brovelli, M.A.; Mitasova, H.; Neteler, M.; Raghavan, V. Free and open source desktop and Web GIS solutions. Appl. Geomat. 2012, 4, 65–66. [Google Scholar] [CrossRef]
- Jirka, S.; Hollmann, C.; Rieke, M.; Blomgren, H.; Grothe, M.; Berkhout, H.; Bush, T.; Peeters, O.; Ross-Jones, M. Using the OGC SOS Interface for Reporting Ambient Air Quality Data. In Proceedings of the 29th EnviroInfo and 3rd ICT4S Conference 2015, Copenhagen, Denmark, 7–9 September 2015.
- Botts, M.; Percivall, G.; Reed, C.; Davidson, J. OGC® sensor web enablement: Overview and high level architecture. In GeoSensor Networks; Springer: Heidelberg, Germany, 2008; pp. 175–190. [Google Scholar]
- Sensorweb4R GITHub Repository. Available online: https://github.com/52North/sensorweb4R (accessed on 10 December 2015).
- Spinelle, L.; Gerboles, M.; Aleixandre, M. Report of Laboratory and in-Situ Validation of Micro-Sensor for Monitoring Ambient Air Pollution—NO9: CairClipNO2 of CAIRPOL (F); JRC Technical Report; European Commission: Rue Robert Stumper, Luxembourg, 2013. [Google Scholar]
- Spinelle, L.; Gerboles, M.; Aleixandre, M. Report of Laboratory and in-Situ Validation of Micro-Sensor for Monitoring Ambient O12: CairClipO3/NO2 of CAIRPOL (F); JRC Technical Report; European Commission: Rue Robert Stumper, Luxembourg, 2013. [Google Scholar]
- Spinelle, L.; Gerboles, M.; Aleixandre, M. Report of Laboratory and in-Situ Validation of Micro-Sensor for Monitoring Ambient Air—Ozone Micro-Sensors, ÎśSense, Model B4 O3 Sensors; JRC Technical Report; European Commission: Rue Robert Stumper, Luxembourg, 2013. [Google Scholar]
- Sensor Evaluation Report. Office of Research and Development National Exposure Research Laboratory EPA/600/R-14/143. Available online: https://cfpub.epa.gov/si/si_public_record_report.cfm?dirEntryId=277270 (accessed on 30 October 2015).
- Spinelle, L.; Gerboles, M.; Aleixandre, M. Protocol of Evaluation and Calibration of Low-Cost Gas Sensors for the Monitoring of Air Pollution; JRC Technical Report; European Commission: Rue Robert Stumper, Luxembourg, 2013. [Google Scholar]
- South Coast Air Quality Management District. Air Quality Sensor Performance Evaluation Reports. Available online: http://www.aqmd.gov/aq-spec/evaluations (accessed on 30 October 2015).
- Spinelle, L.; Gerboles, M.; Villani, M.G.; Aleixandre, M.; Bonavitacola, F. Field calibration of a cluster of low-cost available sensors for air quality monitoring. Part A: Ozone and nitrogen dioxide. Sens. Actuators B Chem. 2015, 215, 249–257. [Google Scholar] [CrossRef]
- Jolliff, J.K.; Kindle, J.C.; Shulman, I.; Penta, B.; Friedrichs, M.A.; Helber, R.; Arnone, R.A. Summary diagrams for coupled hydrodynamic-ecosystem model skill assessment. J. Mar. Syst. 2009, 76, 64–82. [Google Scholar] [CrossRef]
- RESCATAME—Pervasive Air-quality Sensors Network for an Environmental Friendly Urban Traffic Management, LIFE08 ENV/E/000107. Available online: http://ec.europa.eu/environment/life/project/Projects/index.cfm?fuseaction=search.dspPage&n_proj_id=3485 (accessed on 30 October 2015).
- Popoola, O.; Mead, I.; Bright, V.; Baron, R.; Saffell, J.; Stewart, G.; Kaye, P.; Jones, R. A Portable Low-Cost High Density Sensor Network for Air Quality at London Heathrow Airport. In Proceedings of the EGU General Assembly 2013, Vienna, Austria, 7–12 April; Volume 15, p. 1907.
- Steinle, S.; Reis, S.; Sabel, C.E. Quantifying human exposure to air pollution—Moving from static monitoring to spatio-temporally resolved personal exposure assessment. Sci. Total Environ. 2013, 443, 184–193. [Google Scholar] [CrossRef] [PubMed] [Green Version]
- Dons, E.; Panis, L.I.; van Poppel, M.; Theunis, J.; Willems, H.; Torfs, R.; Wets, G. Impact of time–activity patterns on personal exposure to black carbon. Atmos. Environ. 2011, 45, 3594–3602. [Google Scholar] [CrossRef]
- Kwan, M.P. The Uncertain Geographic Context Problem. Ann. Assoc. Am. Geogr. 2012, 102, 958–968. [Google Scholar] [CrossRef]
- Citi-Sense Project Website. Available online: http://www.citi-sense.eu/ (accessed on 16 December 2015).
- Aoki, P.M.; Honicky, R.; Mainwaring, A.; Myers, C.; Paulos, E.; Subramanian, S.; Woodruff, A. Common Sense: Mobile Environmental Sensing Platforms to Support Community Action and Citizen Science. Available online: http://repository.cmu.edu/hcii/201 (accessed on 15 March 2016).
- Willett, W.; Aoki, P.; Kumar, N.; Subramanian, S.; Woodruff, A. Common sense community: scaffolding mobile sensing and analysis for novice users. In Pervasive Computing; Springer: Berlin/Heidelberg, Germany, 2010; pp. 301–318. [Google Scholar]
- Ziftci, C.; Nikzad, N.; Verma, N.; Zappi, P.; Bales, E.; Krueger, I.; Griswold, W. Citisense: Mobile air quality sensing for individuals and communities. In Proceedings of the 3rd Annual Conference on Systems, Programming, and Applications: Software for Humanity, San Diego, CA, USA, 21–24 May 2012; pp. 23–24.
- Nikzad, N.; Verma, N.; Ziftci, C.; Bales, E.; Quick, N.; Zappi, P.; Patrick, K.; Dasgupta, S.; Krueger, I.; Rosing, T.Š.; et al. CitiSense: Improving Geospatial Environmental Assessment of Air Quality Using a Wireless Personal Exposure Monitoring System. In Proceedings of the Conference on Wireless Health, La Jolla, CA, USA, 22–25 October 2012; p. 11.
- Castell, N.; Viana, M.; Minguillón, M.C.; Guerreiro, C.; Querol, X. Real-World Application of New Sensor Technologies for Air Quality Monitoring; European Topic Centre on Air Pollution and Climate Change Mitigation: Bilthoven, The Netherlands, 2013. [Google Scholar]
- Citi-Sense-Mob Website. Available online: www.citi-sense-mob.eu (accessed on 15 December 2015).
- Saukh, O.; Hasenfratz, D.; Thiele, L. Reducing multi-hop calibration errors in large-scale mobile sensor networks. In Proceedings of the 14th International Conference on Information Processing in Sensor Networks, Seattle, WA, USA, 13–16 April 2015; pp. 274–285.
- Lerner, U.; Yacobi, T.; Levy, I.; Moltchanov, S.A.; Cole-Hunter, T.; Fishbain, B. The effect of ego-motion on environmental monitoring. Sci. Total Environ. 2015, 533, 8–16. [Google Scholar] [CrossRef] [PubMed]
- Hasenfratz, D.; Saukh, O.; Thiele, L. On-the-fly calibration of low-cost gas sensors. In Wireless Sensor Networks; Springer: Berlin/Heidelberg, Germany, 2012; pp. 228–244. [Google Scholar]


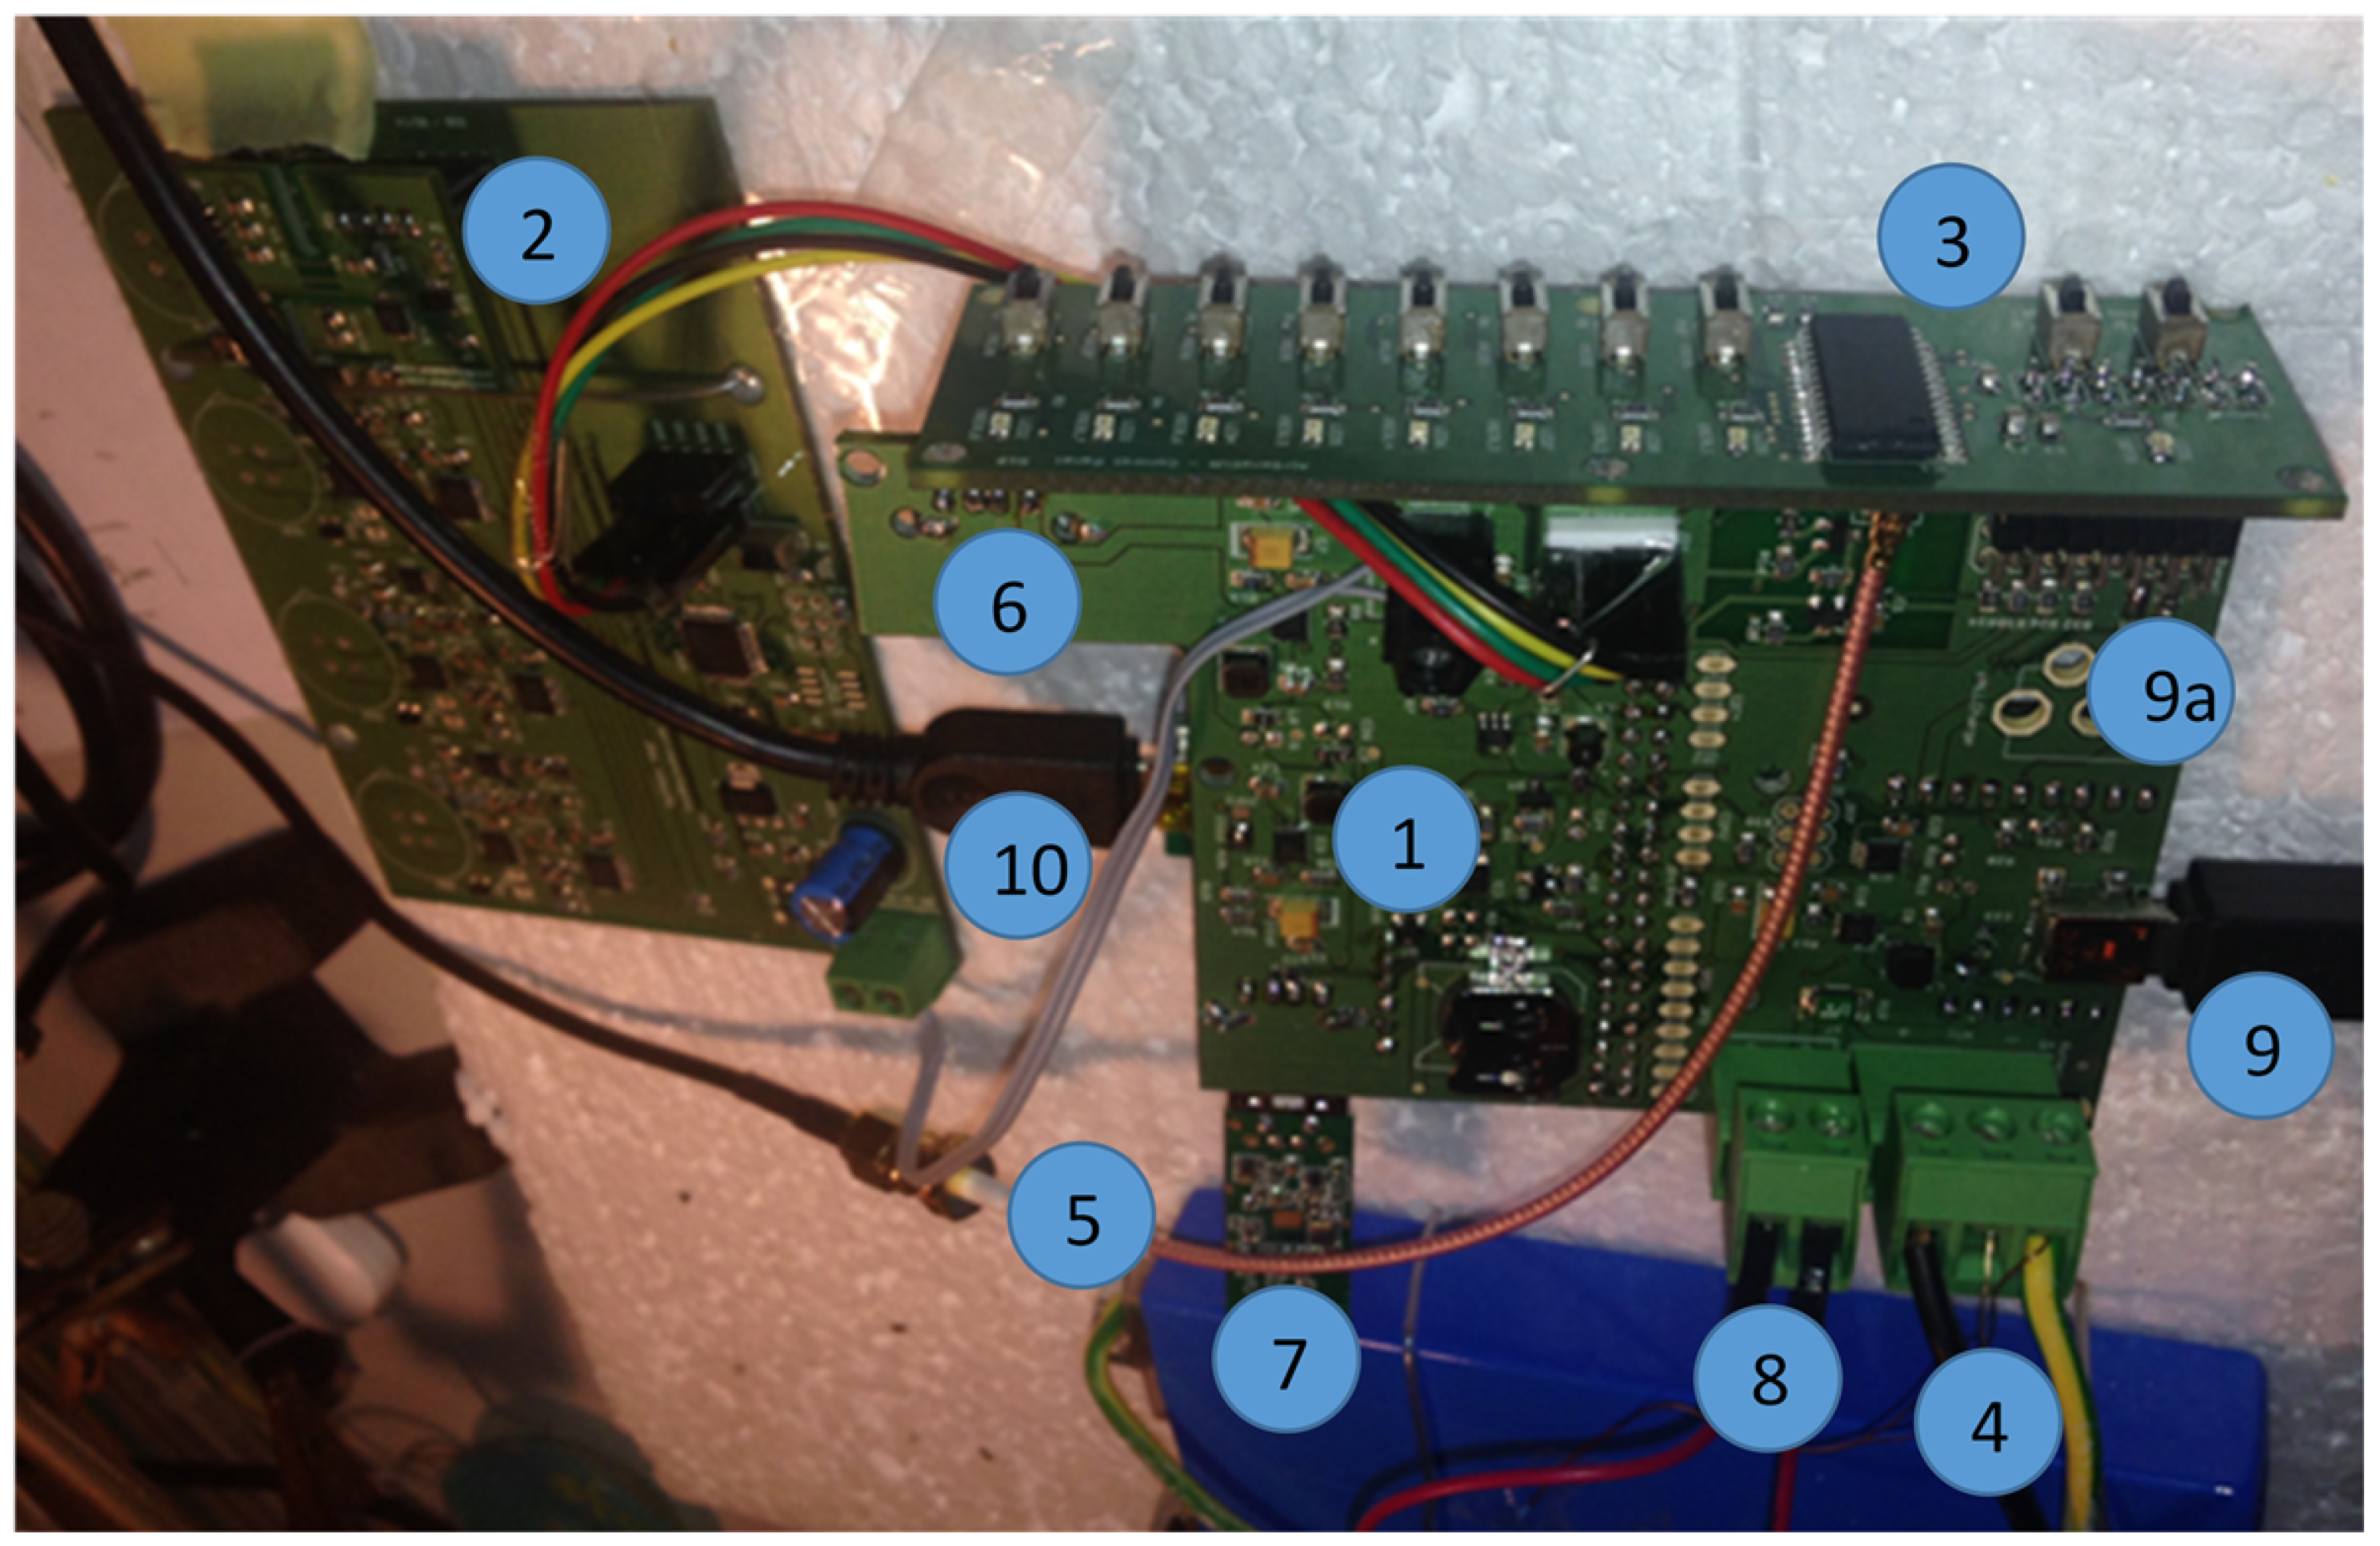
| 1. Host with CPU at the back side | 2. Sensor shield |
| 3. Control panel | 4. Battery |
| 5. GPS Antenna | 6. USB for GSM/GPS key |
| 7. USB WiFi key | 8. On/Off switch |
| 9. USB power supply and battery recharging | 9a. Wall power supply (220 V) |
| 10. USB to Linux console to control CPU |
| Functionality | Products | Overview |
|---|---|---|
| 1. Web transactions | AirSensEUR SOS-T client | Java application, pushing data (JSON POST transactions) from the host to a server when an Internet connection is available. |
| 2. Storage | sqlite3 | Local data storage on the sensor host. |
| PostgreSQL/PostGIS | Server-side storage, with a database schema suitable for the SOS implementation | |
| 3. Web services | SOS | Implementation of an INSPIRE-compliant SOS |
| TimeSeriesAPI | RESTful interface on top of the SOS web service | |
| 4. Clients | SensorWeb client | Mobile-friendly web client for interaction with observation data |
| Geoserver | Mash-up with other geospatial data and implementation of INSPIRE discovery and view services | |
| RStudio (including Shiny and sensorweby) | JavaScript SOS client with functionality to process and analyze air quality data with R [29] | |
| 5. Visualization | R | Post-processing of data (e.g., for calibration or further statistical analysis) |
© 2016 by the authors; licensee MDPI, Basel, Switzerland. This article is an open access article distributed under the terms and conditions of the Creative Commons by Attribution (CC-BY) license (http://creativecommons.org/licenses/by/4.0/).
Share and Cite
Kotsev, A.; Schade, S.; Craglia, M.; Gerboles, M.; Spinelle, L.; Signorini, M. Next Generation Air Quality Platform: Openness and Interoperability for the Internet of Things. Sensors 2016, 16, 403. https://doi.org/10.3390/s16030403
Kotsev A, Schade S, Craglia M, Gerboles M, Spinelle L, Signorini M. Next Generation Air Quality Platform: Openness and Interoperability for the Internet of Things. Sensors. 2016; 16(3):403. https://doi.org/10.3390/s16030403
Chicago/Turabian StyleKotsev, Alexander, Sven Schade, Massimo Craglia, Michel Gerboles, Laurent Spinelle, and Marco Signorini. 2016. "Next Generation Air Quality Platform: Openness and Interoperability for the Internet of Things" Sensors 16, no. 3: 403. https://doi.org/10.3390/s16030403