1. Introduction
Gyroscopes are sensors that are appropriate for a wide variety of applications in the inertial navigation scope. The fiber optic gyroscope (FOG), which has become mainstream in inertial navigation systems, is utilized to determine altitude for satellites and missiles [
1]. The Ring Laser gyroscope is the ideal angular sensor for high-precision and long-endurance inertial navigation systems [
2]. The MEMS (Micro-electromechanical systems) gyroscope is widely used in cheap and small applications, such as unmanned aerial vehicles [
3]. The measurement stability of gyroscopes can vary over time due to several factors, such as temperature, humidity, radiation, and ageing [
4]. A slight instability in the gyroscopes will lead to an increase in measurement error. FOGs in measurement while drilling (MWD) systems work even in poor conditions. Their temperature increases as the drilling depth increases [
5]. Additionally, FOGs withstand shock when drilling the oil hole. Therefore, it is fundamental to evaluate how the measurement stability of gyroscopes behaves over time. Allan variance is a common and standard method to analyze gyroscopes [
6], but it cannot describe the dynamic characteristic. In 2003, in order to track and reveal the anomaly in the atom clock behavior, Galleani and Tavella developed Dynamic Allan Variance (DAVAR) [
7]. Although it is an extension of Allan variance, DAVAR is a new method that can track and describe the non-stationary characteristics of time series [
8,
9,
10,
11,
12,
13]. Li, Zhang, and Wei extended the DAVAR to diagnose the non-stationary of gyroscope [
14,
15,
16,
17,
18]. Since the DAVAR requires instant calculation of Allan variance, its calculation burden is a critical shortcoming [
19,
20,
21,
22]. Wang and Zhang developed a fast algorithm for DAVAR to simply the DAVAR algorithm and accelerate the calculation speed [
23].
An MWD system keeps working for several days underground. The output signal of the gyroscopes in the MWD system would be interrupted due to error in the mud pulse communication or sudden power outages. In this case, both the classical DAVAR and the fast DAVAR algorithms are unable to deal with discontinuous time series. Hence, in order to deal with the discontinuous gyroscope data, a further improvement is made on the basis of the fast DAVAR. The recursion characteristic of the fast DAVAR will judge whether the data contains unreadable code or not. It makes the fast DAVAR available to deal with discontinuous gyroscope data. Thus, the improved fast algorithm of the DAVAR is more valuable in engineering applications.
This article is organized as follows. In
Section 2, the structure of the FOG-based MWD and its working characteristics are introduced. In
Section 3, the theory of Allan variance is briefly presented. In
Section 4, we sum up the calculation process of the classical DAVAR. In addition, a 2D diagram illustrating the noise characteristics of FOGs is reported. In
Section 5, the fast algorithm of the DAVAR is derived step by step. In
Section 6, a further improvement has been made and the improved fast DAVAR is extended to discontinuous data. In
Section 7, in order to test that the improved fast DAVAR is superior to the classical method, three sets of simulation data have been analyzed by the two methods. In
Section 8, a set of discontinuous time series collected from a vibration experiment with the FOGs-based MWD is analyzed by the fast DAVAR. The conclusions are presented in
Section 9.
2. Structure of the FOG-Based MWD
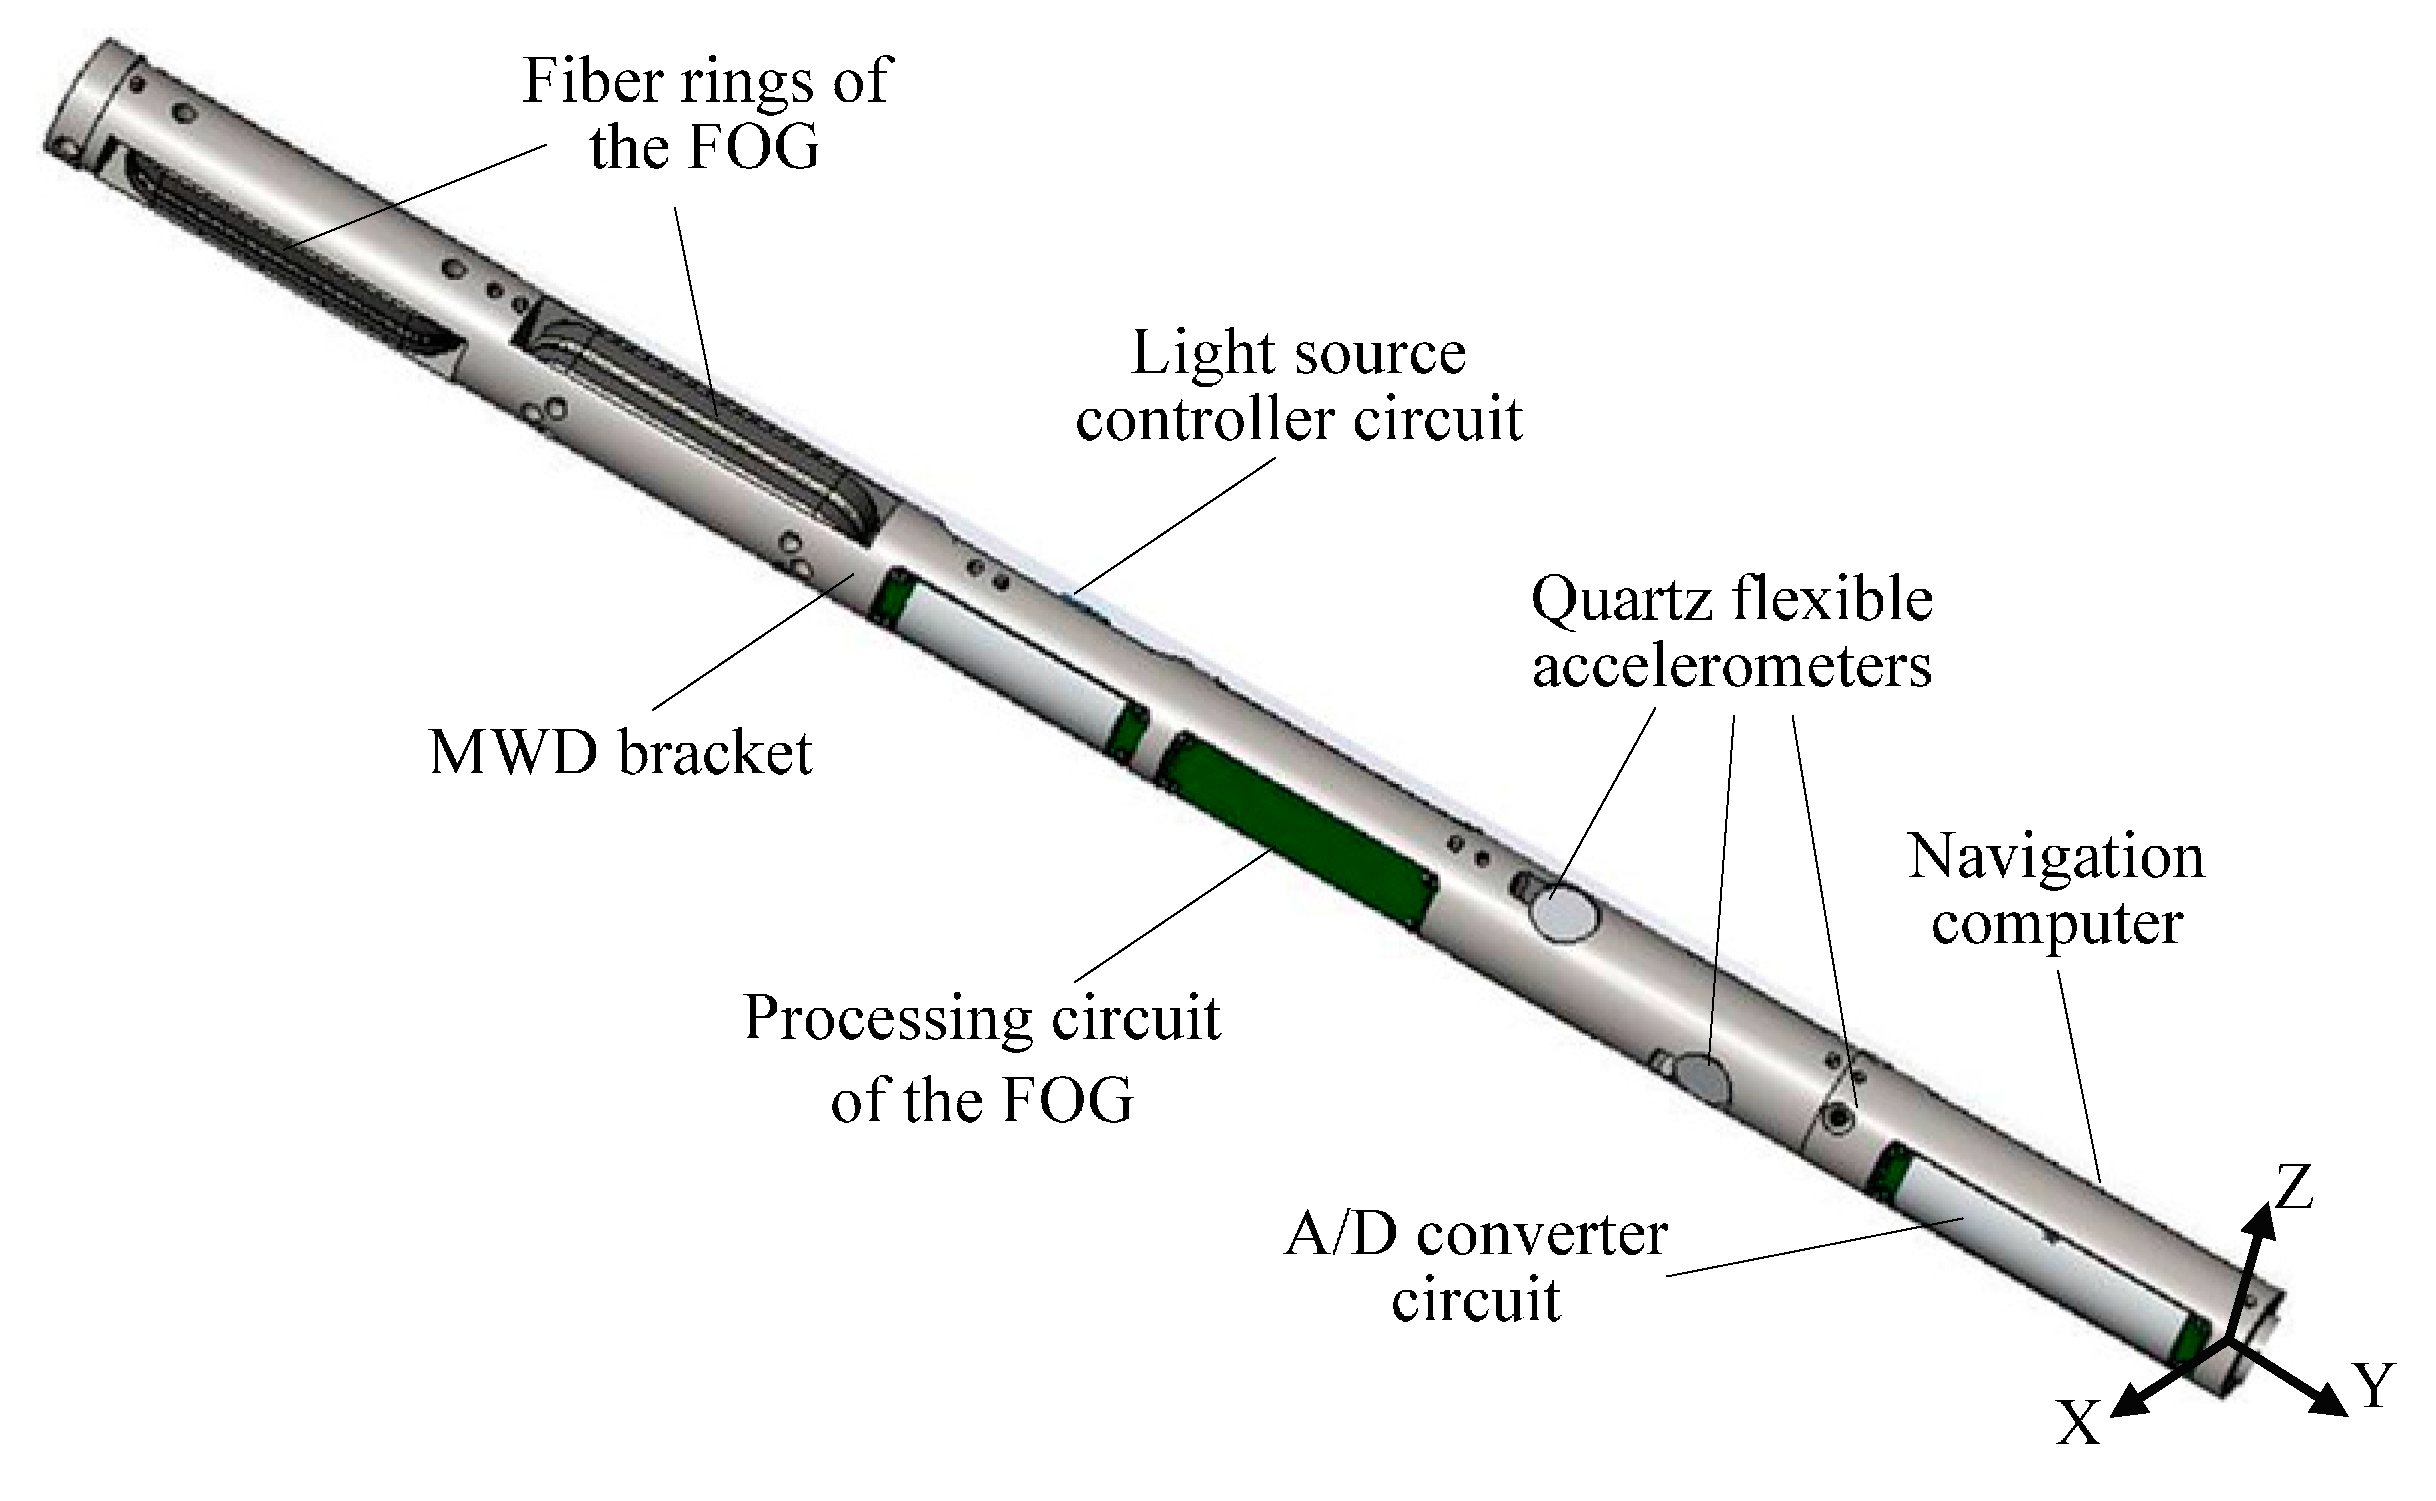
The MWD prototype utilizes a FOG-based IMU, as shown in
Figure 1. MWD is composed of three-axis FOGs sharing one laser light source, three quartz flexible accelerometers with one A/D converter circuit, a navigation computer, and a mechanical bracket to support the above units [
24]. All the components are orthogonally mounted along the lengthwise axis of the MWD so that the diameter can be minimized to satisfy the demands of a borehole environment. The FOGs and accelerometers are arranged in three mutually orthogonal directions, as shown in
Figure 2. The three-axis FOGs measure the angular velocity of the carrier, while three-axis accelerometers provide the 3D acceleration measurements of the body. The navigation computer is mainly utilized to collect all sensor data, pre-process the data, and run the navigation algorithm.
Due to the particularity of the working environment in oil wells, the FOGs-based MWD working manner and characteristics are different from other application fields such as aerospace, aviation, and land navigation. Comprehensive analysis shows that the detection and location of oil wells have the following characteristics:
- (1)
Long working hours: the FOGs-based MWD system keeps working underground for more than 200 h. Putting the MWD system down into the well and pulling it up to the ground costs too much time and money [
25].
- (2)
Strong vibration: FOGs in MWD system hold up to strong shocks due to the obstruction of the underground stone.
- (3)
High rotation speed. FOGs in MWD systems work with a high-speed rotation up to 300 rounds per second.
- (4)
High Temperature. The temperature of the working environment increases with the increase in the drilling depth at a rate of 30 °C/km.
- (5)
Data loss. The data transmission method of the MWD system is mud pulse. When drilling the oil well, the mud pulse transmits the data collected downhole to the monitoring equipment on the ground. Its transfer rate is low. Its bit error rate is high and the reliability is very low.
- (6)
Eclectic battery-powered. A battery provides power to support the MWD system working underground.
When drilling the oil well, FOGs’ signal in MWD system is non-stationary, since the FOGs can be easily influenced by the increasing temperature, humidity, radiation, and sudden power failure. Occasionally, the data received aboveground appears to be discontinuous. Even a slight variation in the gyroscope stability can generate significant measurement error. Accordingly, it is crucial to identify the dynamic instability of the FOGs in MWD.
3. Allan Variance
FOGs sense the angle velocity. Their output signal is the angle velocity
. Allan variance [
26] has commonly been used to evaluate the stability of FOG signal
. The standard concept of the Allan variance is:
where
is the observation interval and
indicates a time averaging. The average of
is given by
where
is the integral variable. Equation (1) is the definition of Allan variance for continuous data. If the Allan variance is to be estimated on discrete samples
whose total number is
N,
t is sampled as
where
is the sampling interval. Consequently, the observation interval
is discretized is
For the discrete data, the Allan variance becomes
The average of
is given by
Therefore, according to the different observation interval , the corresponding Allan variance can be obtained.
Ng [
26] shows that a unique relationship existing between
and the power spectral density (PSD) of the intrinsic random processes. This relationship is
where
is the PSD of the random process
, namely the instantaneous output rate of the gyro.
Equation (7) is the focal point of the Allan variance technique. The PSD of any physically meaningful random process can be substituted in the integral and an expression for the Allan variance
as a function of cluster length
is identified [
26,
27]. Equation (7) states that the Allan variance is proportional to the total power output of the random process when passed through a filter with the transfer function
. This particular transfer function is the result of the method used to create and operate on the cluster. It is seen from Equation (7) that the filter bandpass depends on
. This suggests that different types of random processes can be examined by adjusting the filter bandwidth, namely by varying
[
28].
Consequently, since
is a measurable quantity, a plot of
versus
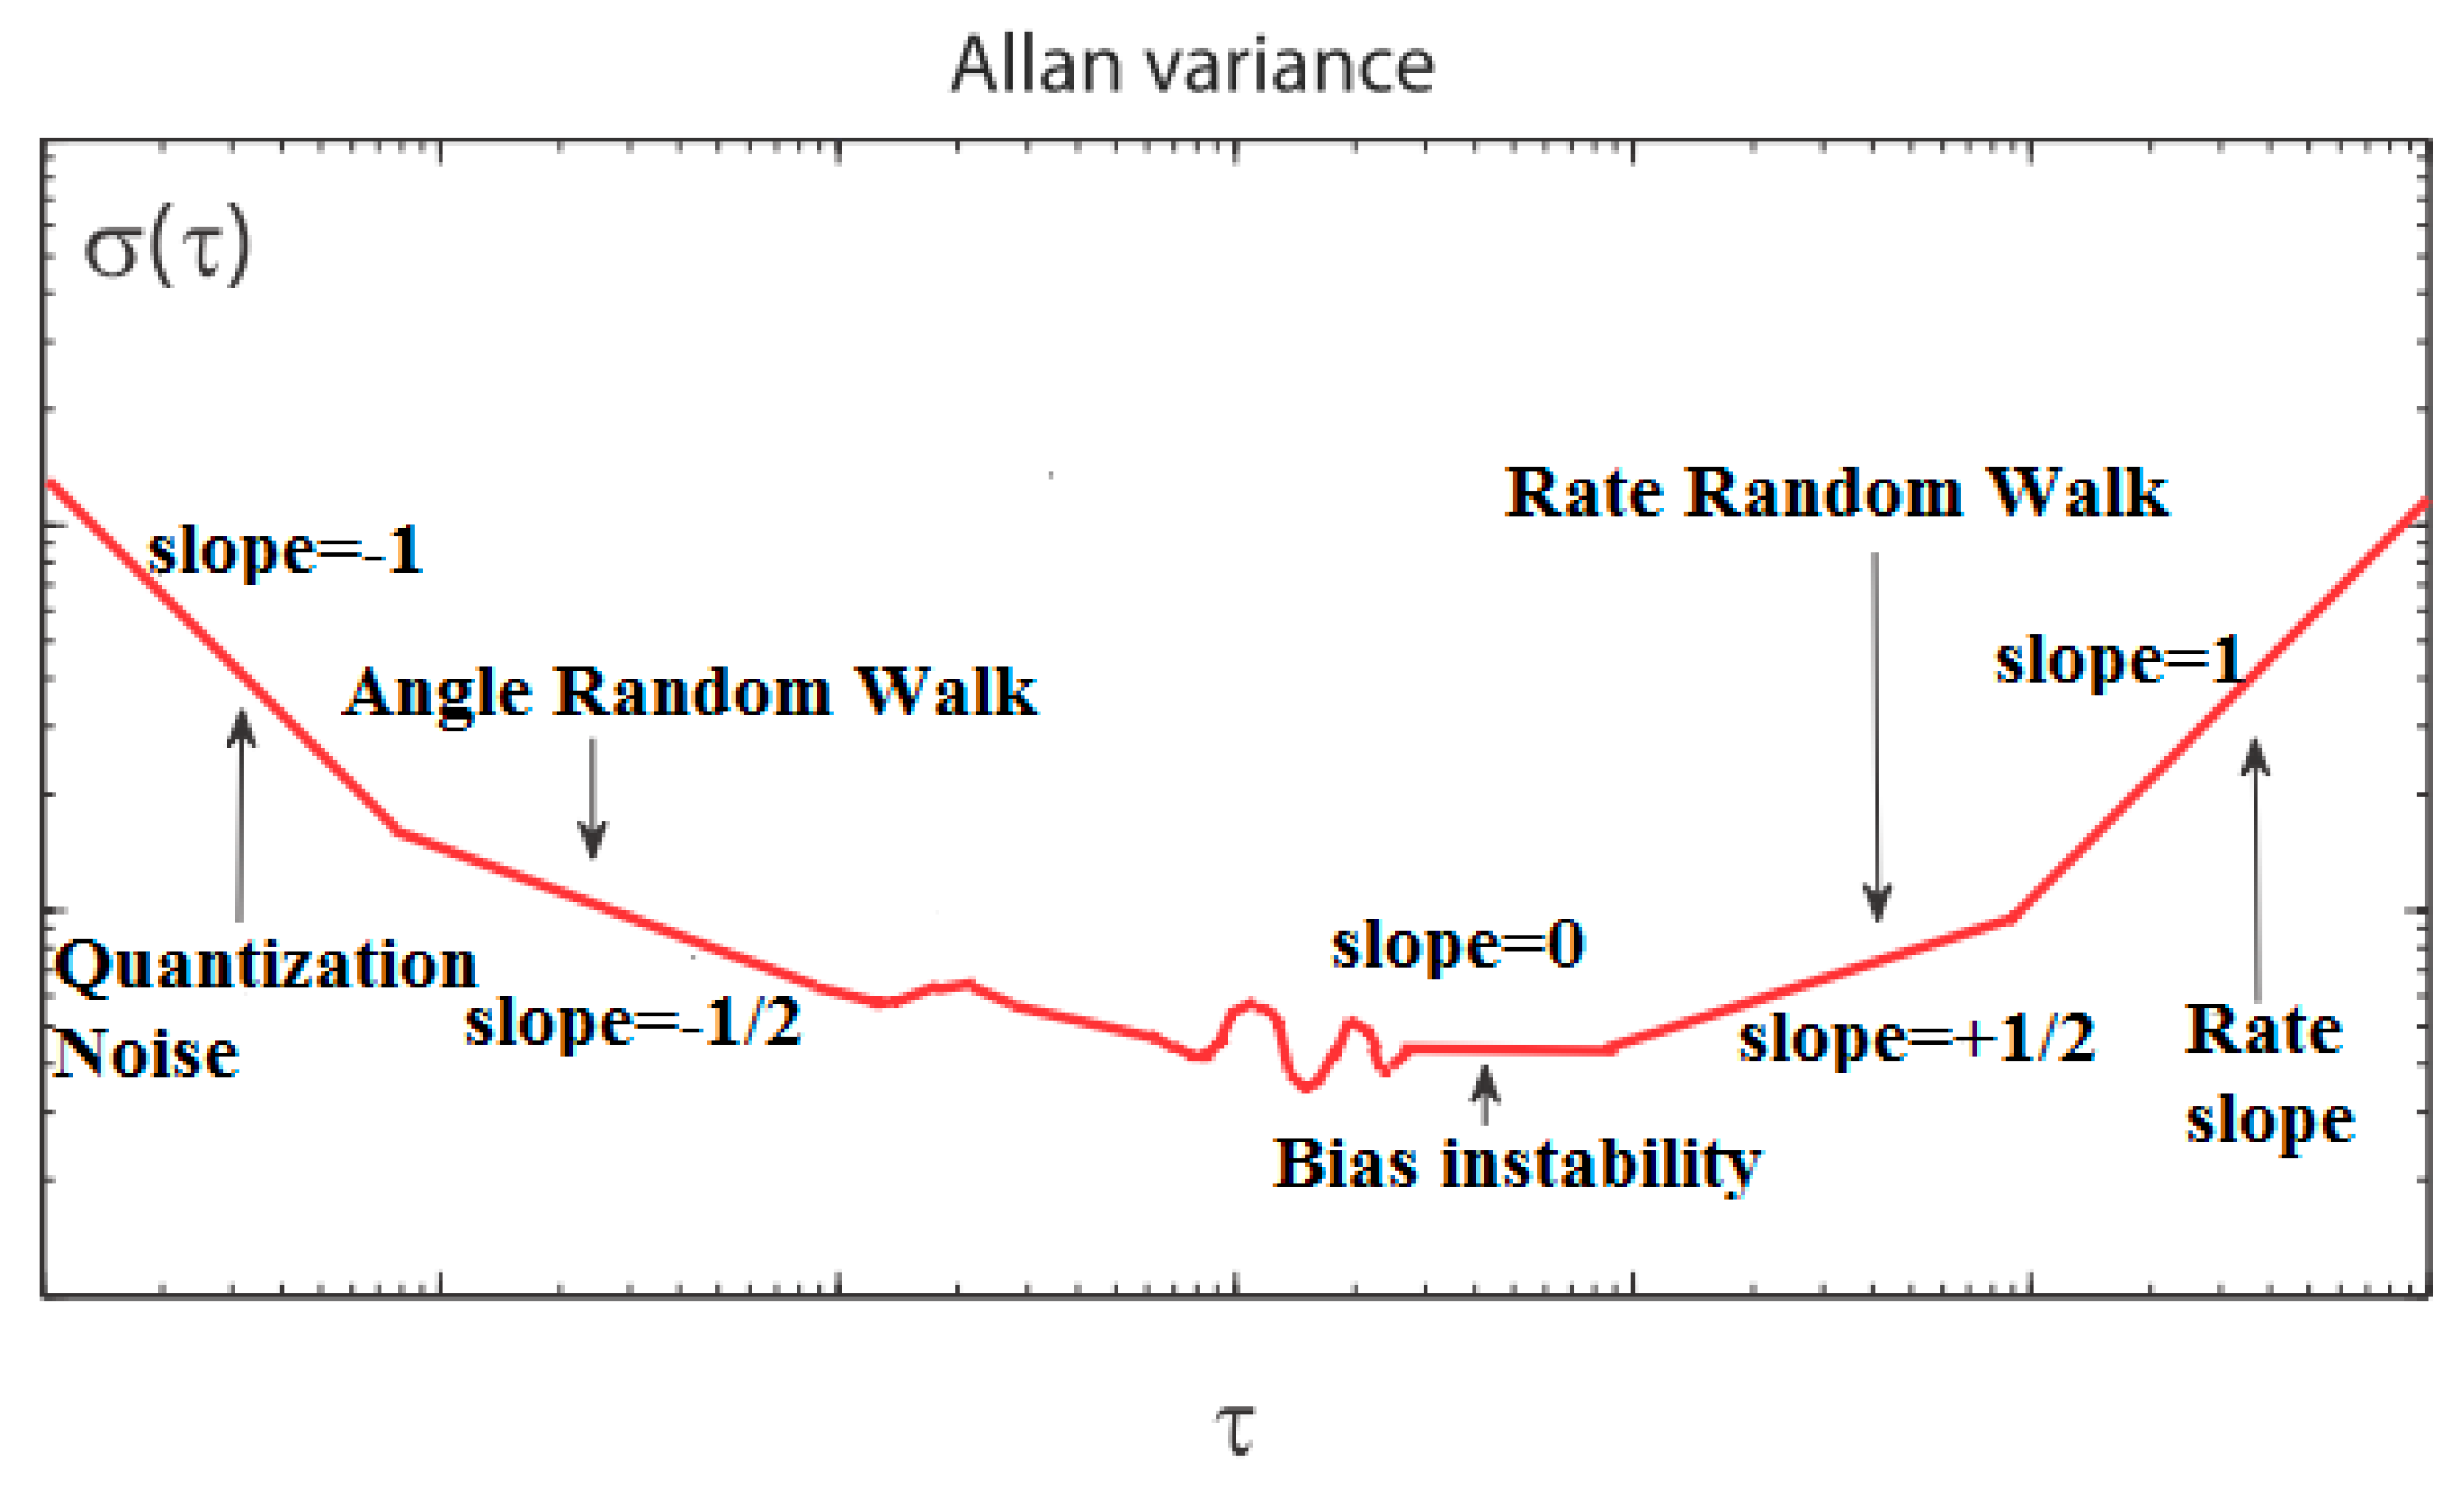
provides a direct indication of the types of random processes that exist in the gyro data. A log-log plot of the square root of the Allan variance
provides a means of identifying and quantifying various noise terms that exist in the gyro sensor data, as
Figure 3 shows.
Table 1 gives a representation of noise terms using Allan variance.
In general, any number of the random processes discussed above can be present in the data. Thus, a typical Allan variance plot looks like the one shown in
Figure 3. Different noise terms appear in different regions of
. This allows for easy identification of the various random processes that exist in the gyro data. If it can be assumed that the existing random processes are all statistically independent, then it can be shown that the Allan variance at any given
is the sum of the Allan variances due to the individual random processes at the same
[
27]. In other words,
where
represent Allan variance due to the individual random processes. Then the noise coefficient of the five noise terms can be obtained by a data fitting algorithm. When the dimension of FOG output data is in degrees per hour (°/h), the different noise terms are as follows:
5. Fast Dynamic Allan Variance
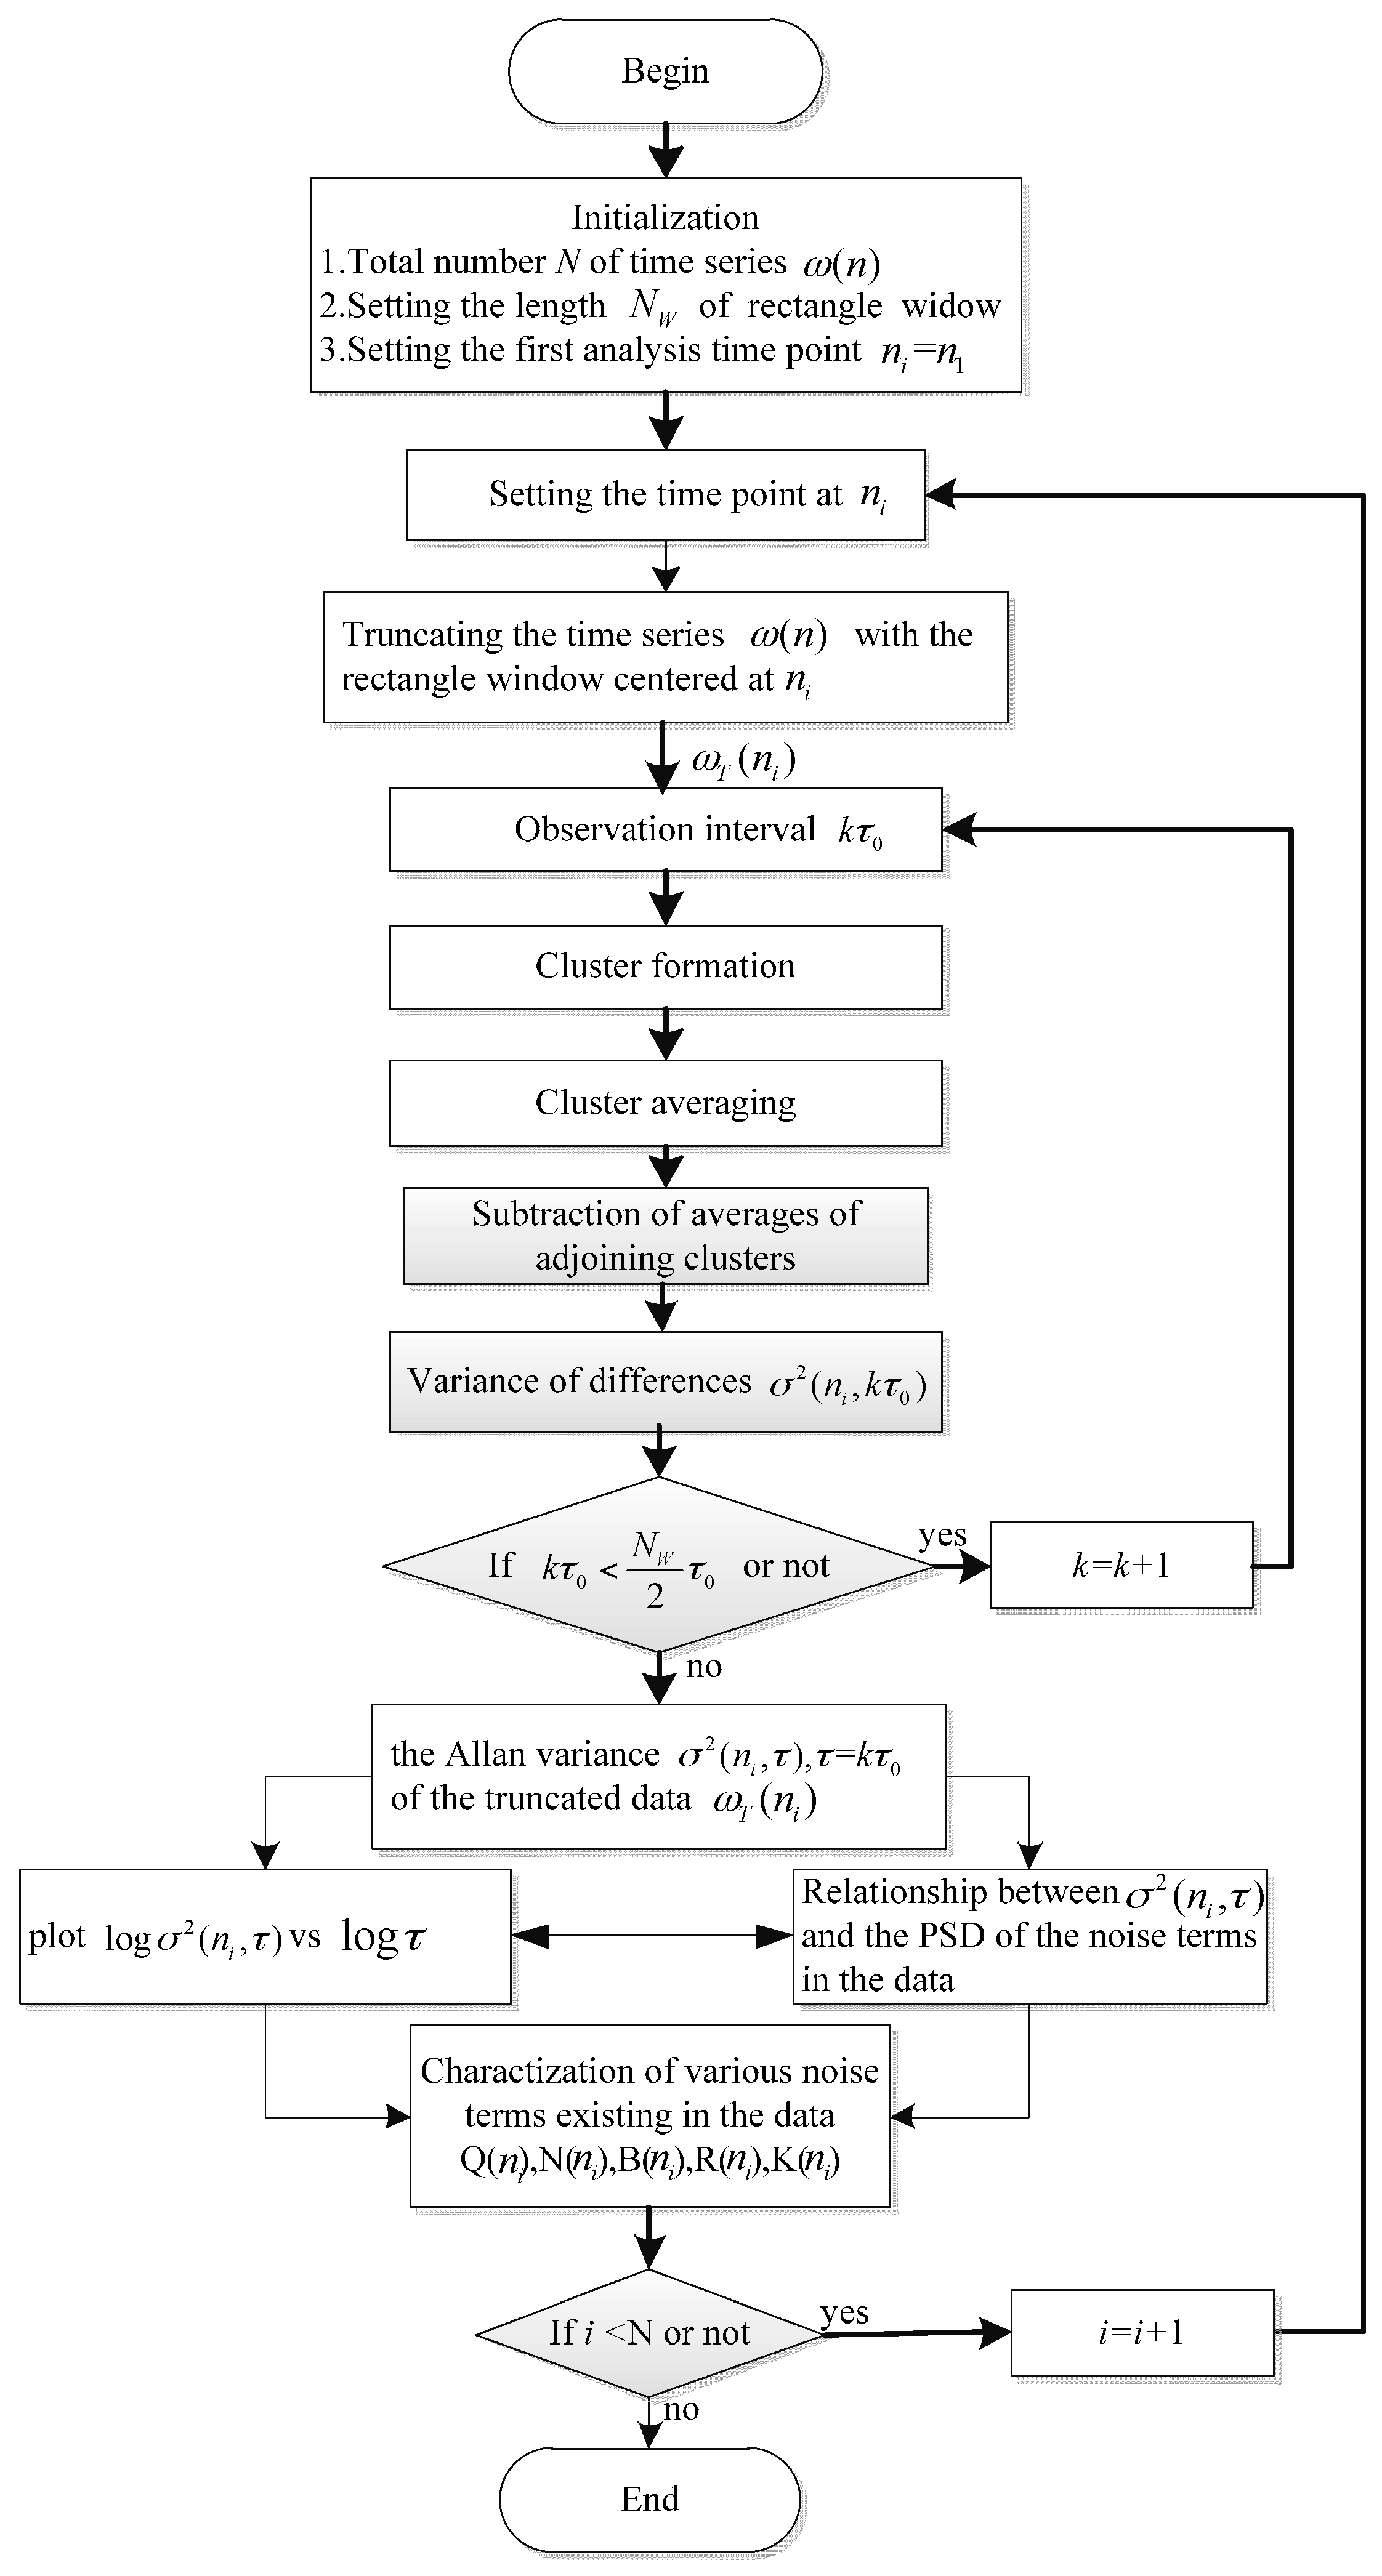
Figure 4 shows that the DAVAR is obtained by computing the Allan variance at each analysis time epoch
t. With the length of
increasing, it can result in a large computational burden. Therefore it is necessary to develop a fast algorithm for DAVAR. On the basis of the recursive characteristic of Allan variance, the recursive property of the DAVAR was found [
29]. With this special characteristic, we can develop a recursive algorithm for the normal DAVAR, i.e., the fast DAVAR.
First define another time-series
connected to
. The relationship between them is
denotes the angle, for which the dimension is given in degrees. Both
and
are random quantities. Then, substituting Equations (2) and (14) into Equation (10), Equation (10), which is the normal DAVAR, can be rewritten as
Using Equation (11), we can obtain the DAVAR for the discrete time gyro signal
as in Equation (16):
In order to describe the derivation simply, we name
as the discrete second order difference. Therefore Equation (16) can be rewritten as Equation (17):
Using Equation (17), we can obtain the DAVAR at time point
n + 1 as follows:
can also be written with
, as Equation (19) shows.
At time n, the limit of m in discrete second-order difference lies in . At time n + 1, the limit of m lies in . Therefore, when we compute the based on the , we just need to add the discrete second-order difference and subtract the discrete second-order difference . Equation (19) shows that the DAVAR at time n + 1 can be written as a function of the DAVAR at time n.
Since Equation (19) is a recursive algorithm for DAVAR, the initial value is required before the computation. On the assumption that the analysis starts at time
, the starting value is as in Equation (20):
In conclusion, with the recursive formula, it is not necessary to compute the Allan variance at every time epoch. The new DAVAR can be obtained based on the previous DAVAR. This can reduce the computation time dramatically. We named the recursive algorithm fast DAVAR and the ordinary one classical DAVAR.
Figure 5 gives a flowchart of fast DAVAR.
6. Extension to Discontinuous Time Series
At present, when drilling oil wells, the MWD system utilizes the mud pulse to send the data from underground to the monitoring equipment on the ground. Its transfer rate and reliability are low while its bit error rate is high. Consequently, the data received on the ground often appears to be abnormal, such as with unreadable words or showing a loss of data in a certain period of time. So the data are discontinuous in the timeline. However, when meeting the discontinuous gyroscope data, both the classical DAVAR and the fast DAVAR are invalid. It is critical to further improve the algorithm of the DAVAR to deal with discontinuous time series. Based on the recursive character of the fast DAVAR algorithm, we make a further advance to extend the fast DAVAR to discontinuous time series.
Before computing
, we need to compute the discrete second-order difference
and
. For the given
n and
k,
and
can be obtained by Equations (21) and (22):
At this time, we can judge whether , and are unreadable words or not. If one of them is an unreadable word, we set to zero and then continue the computation. could be obtained in the same way.
The recursion characteristic of the fast DAVAR will judge whether the data contains unreadable code or not. So the fast DAVAR could be extended to deal with discontinuous time series. We call this modified algorithm improved fast DAVAR.
7. Models and Simulations
In order to testify the proposal algorithm, two sets of simulation data are created. The model of the simulation data is shown as follows:
where
is the white Gaussian noise [
5],
is the standard deviation of
, and
is simulating data of gyroscopes whose unit is °/h. The sampling interval of the two sets of simulation data is 0.01 s. The first simulation dataset
is stationary white Gaussian noise, whose standard deviation
is always equal to 1. The number of
is
samples. So the time length of
is 60 s. The second one
is also white Gaussian noise, whose variance
increases with time linearly as Equation (24) shows. The number of
is
samples. Thus the time length of
is 6000 s.
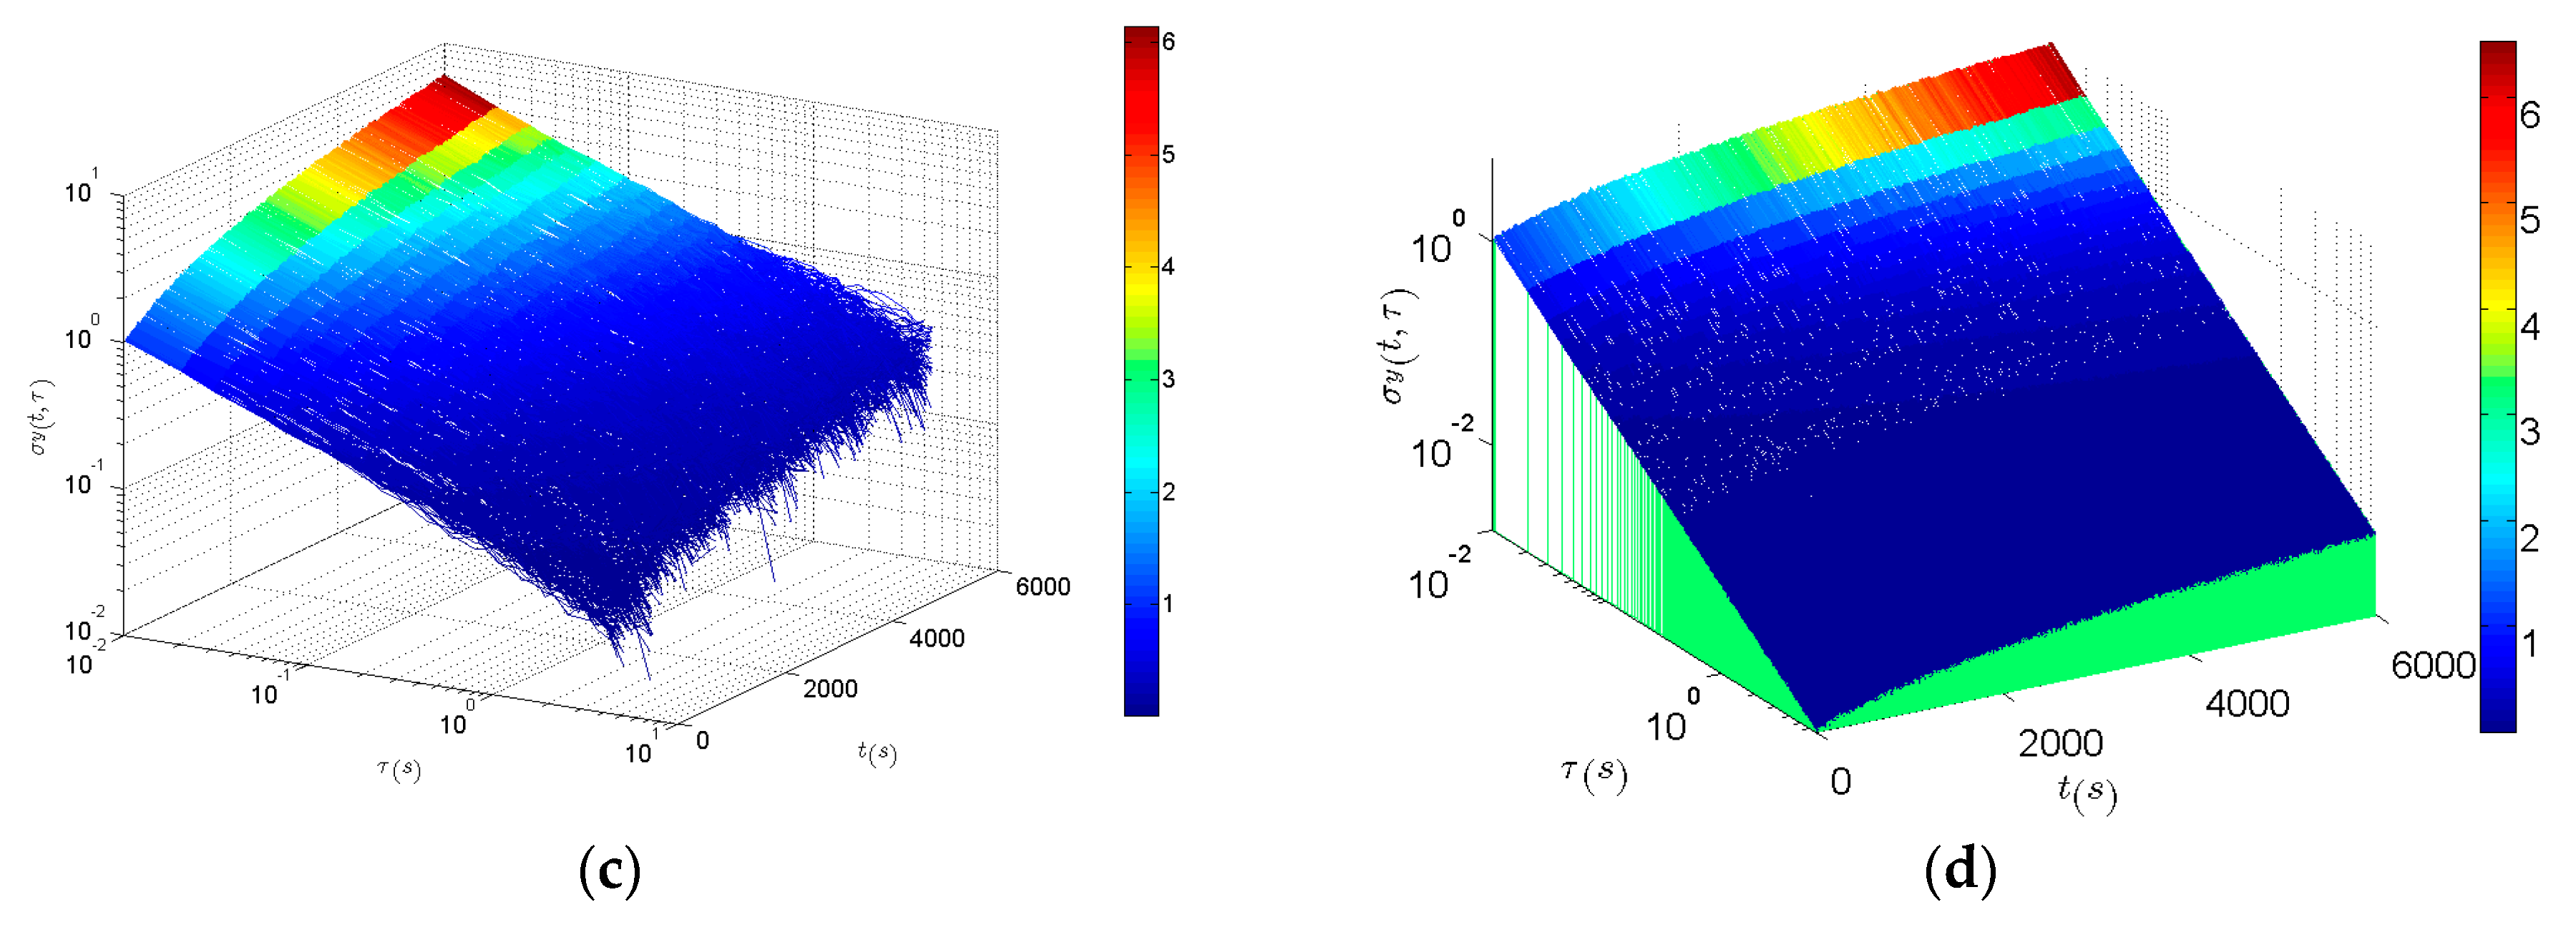
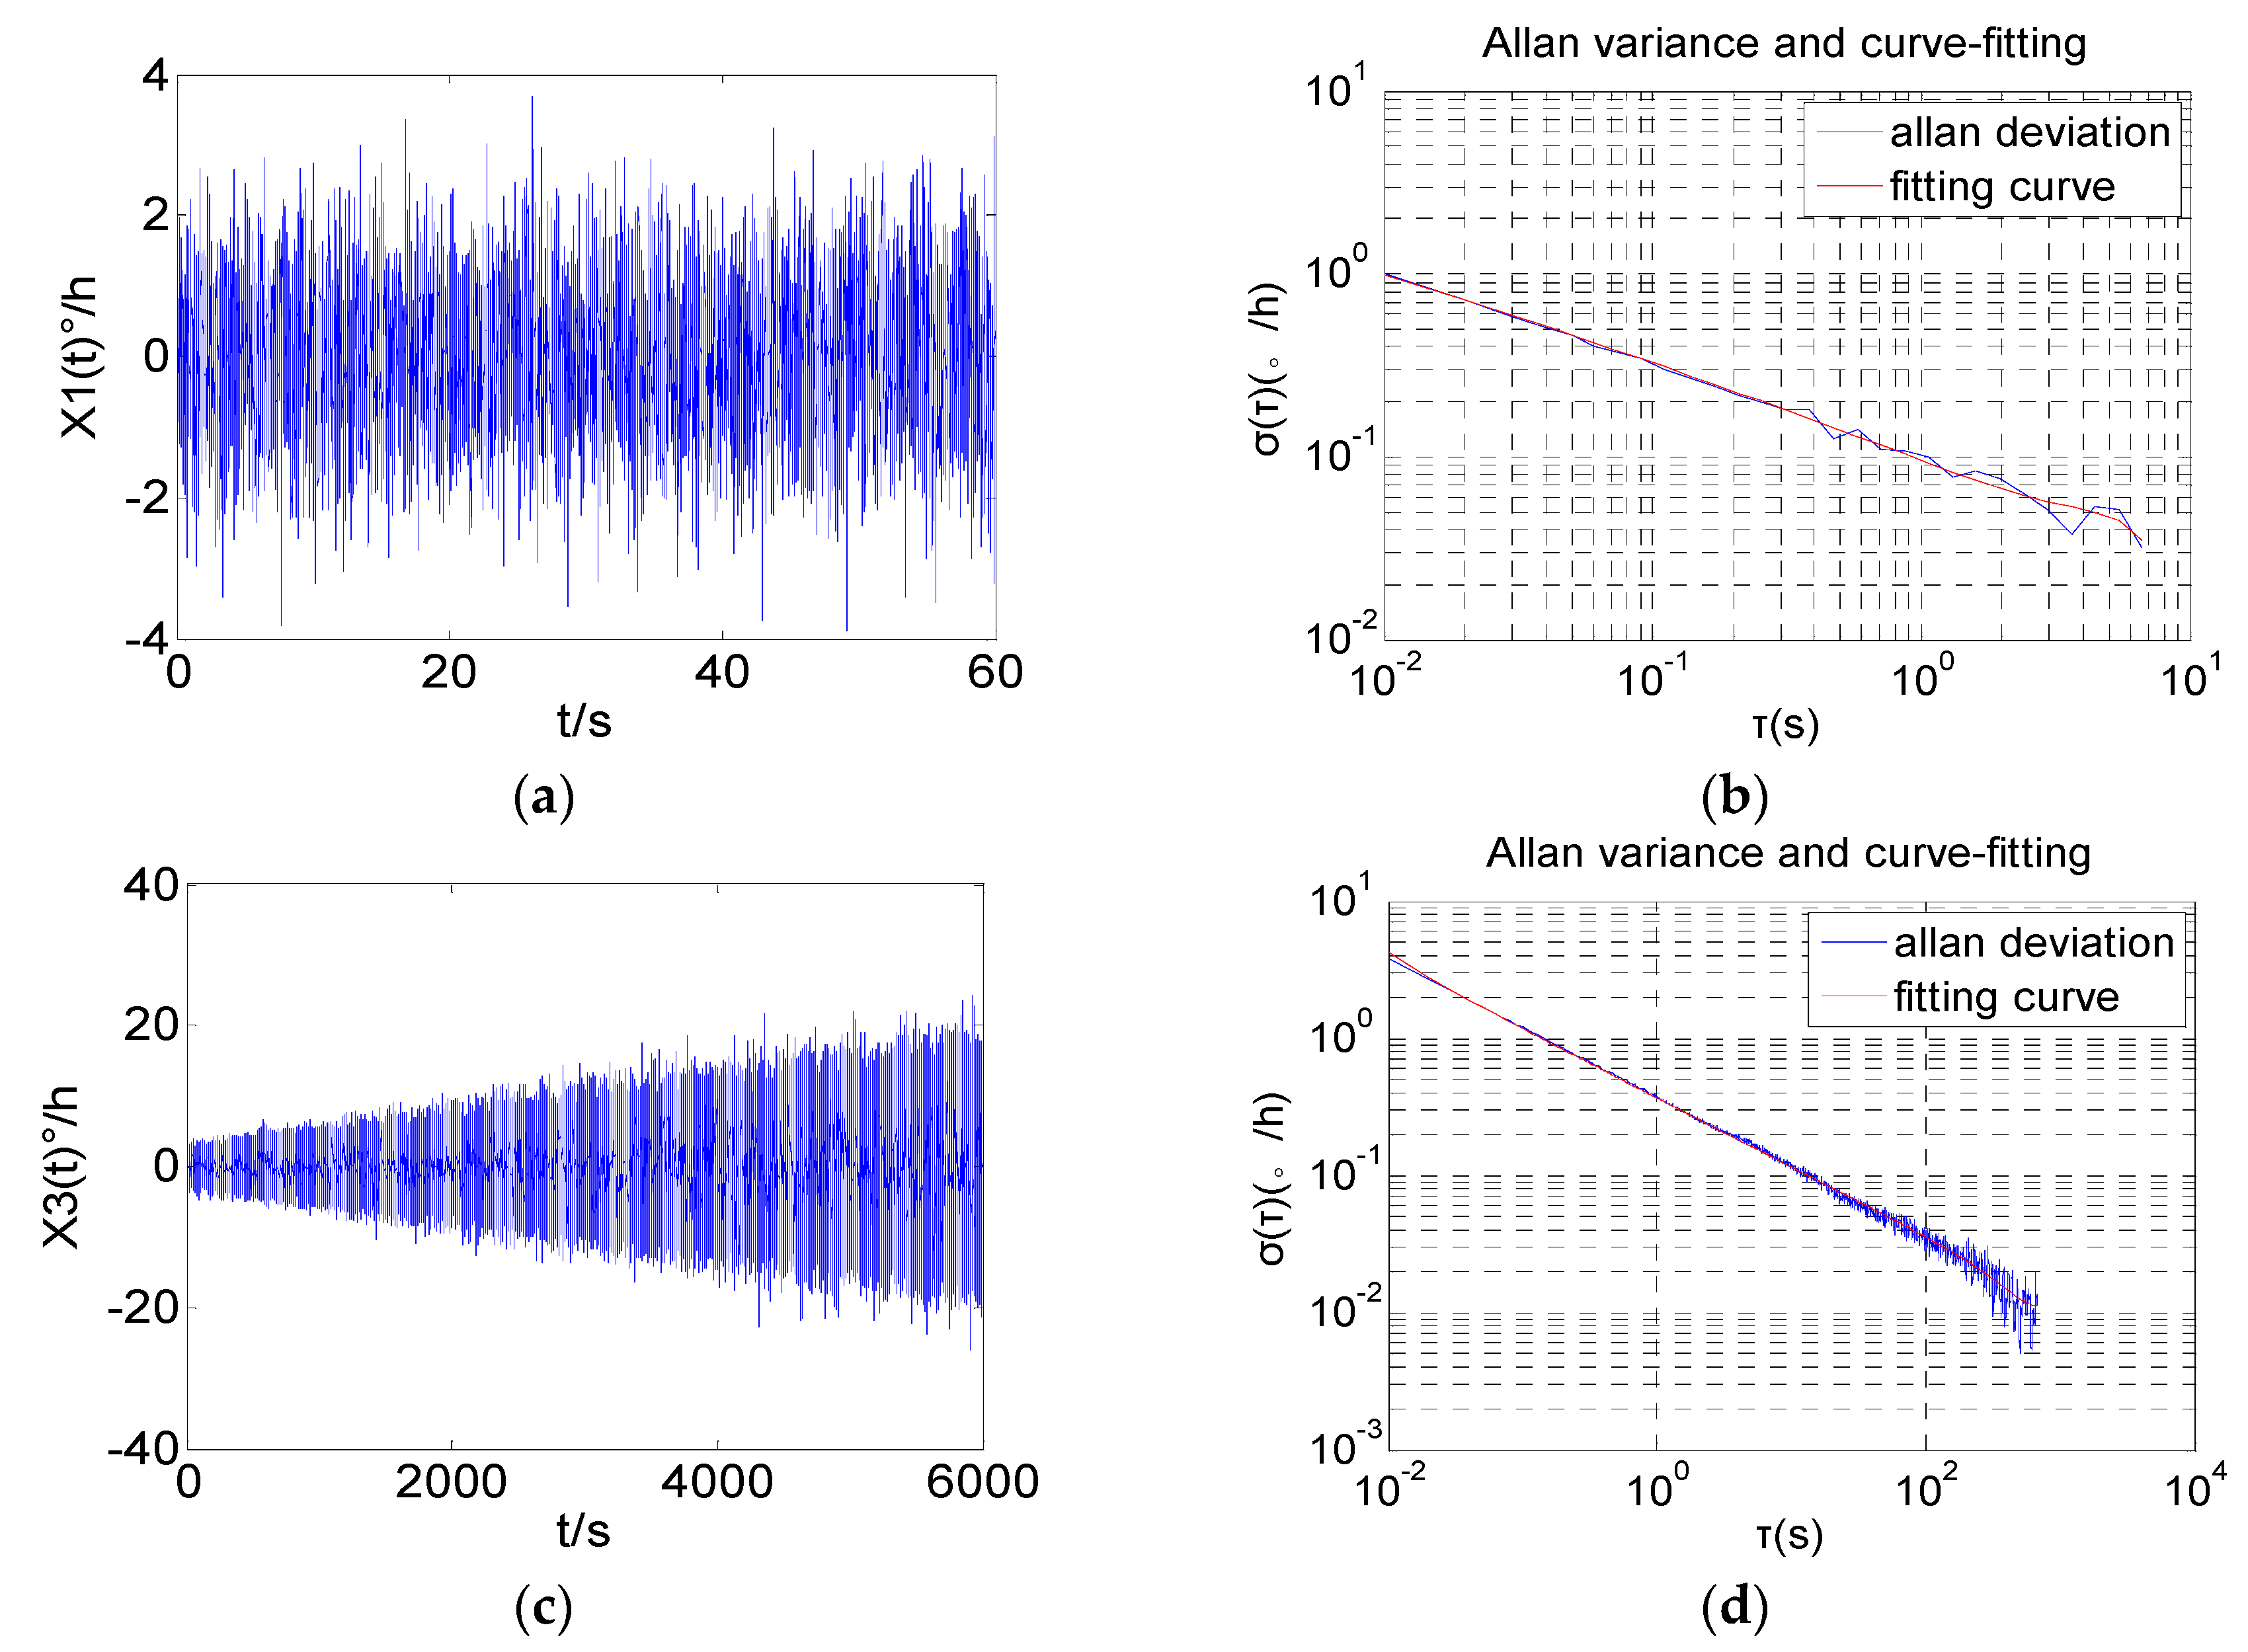
Two sets of simulation data are represented in
Figure 6a,c.
is stationary. The amplitude of
increases with time.
Figure 6b,d exhibits the Allan variance of the two sets of simulated data. Because
is stationary white Gaussian noise, its slope is approximately −1/2 for all
[
30].
is non-stationary white noise, but the shapes and slopes of Allan variance are the same as for the stationary white noise
. Obviously, the Allan variance cannot track and reveal the non-stationary characteristics.
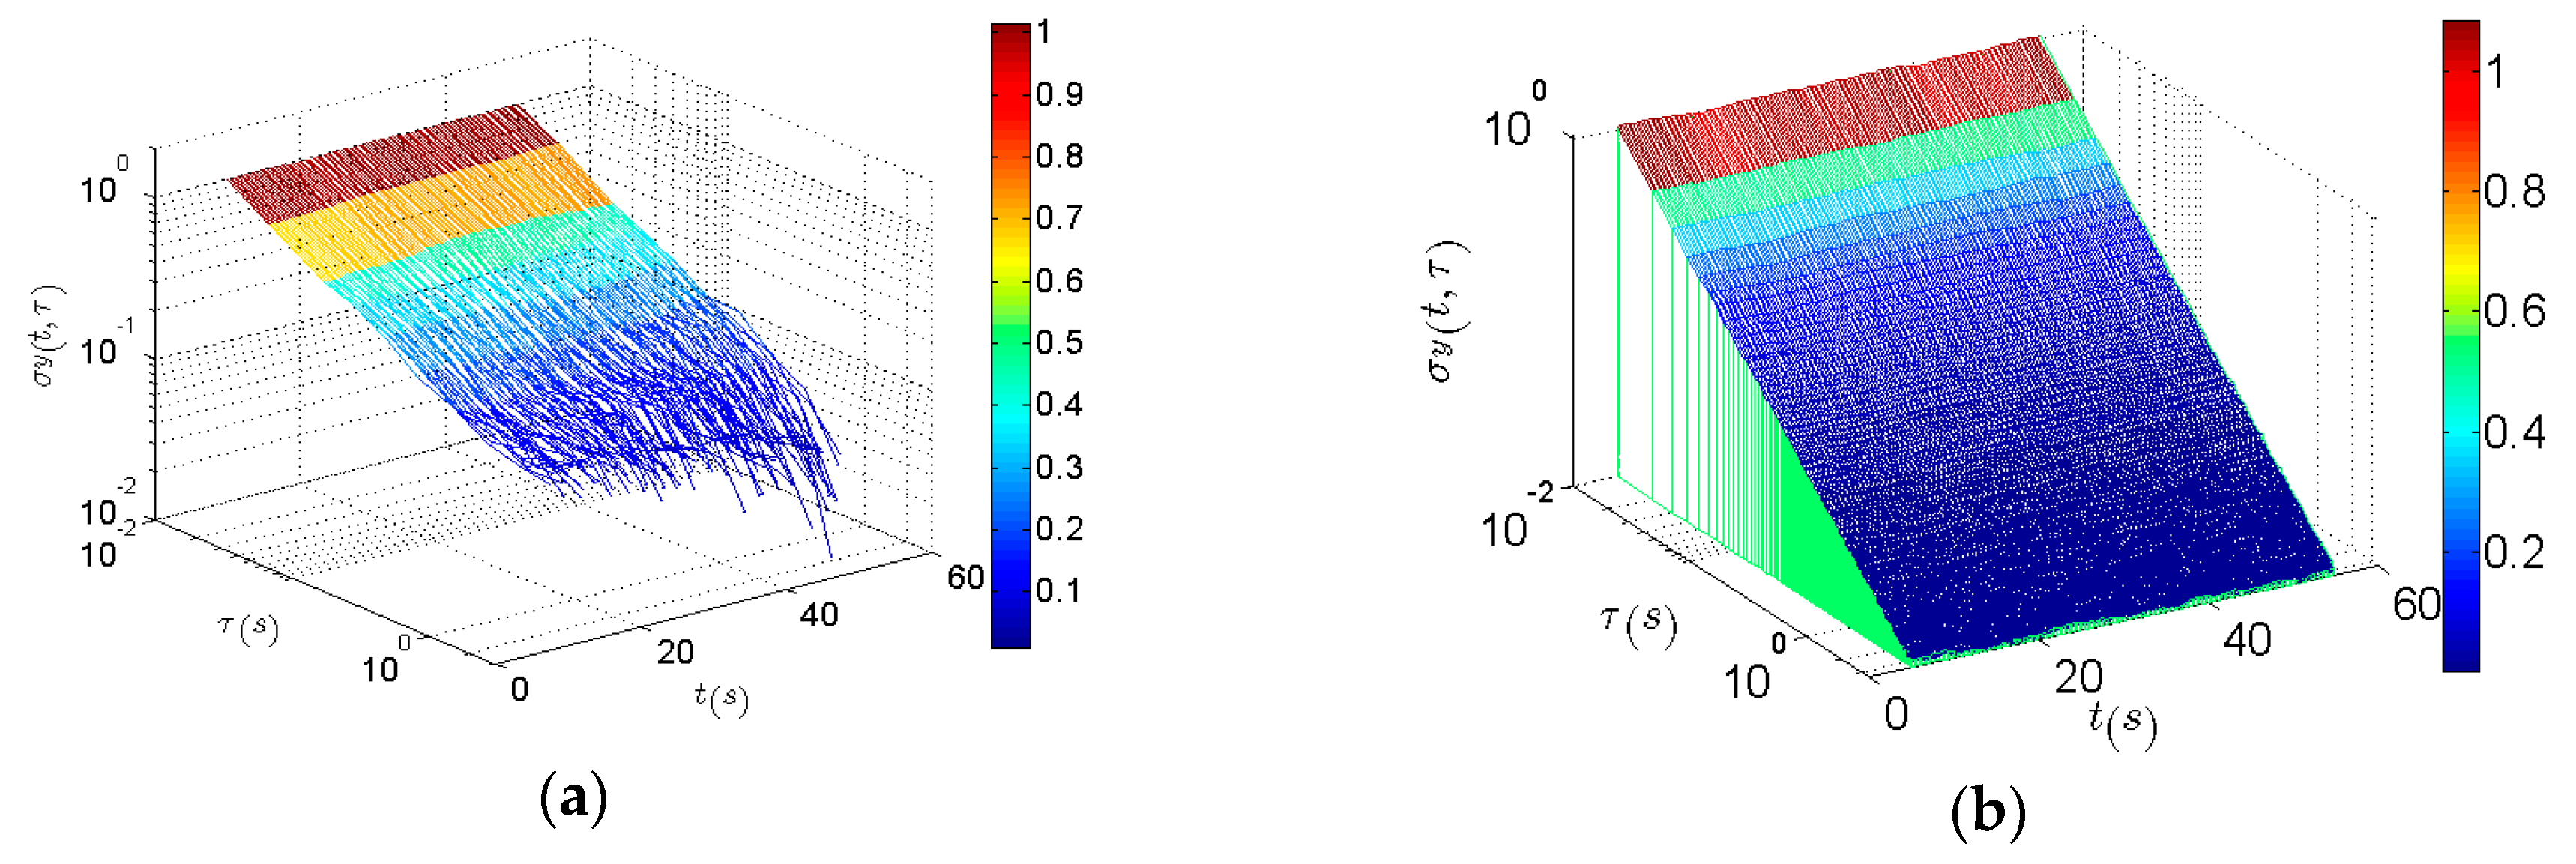
Then the classical DAVAR and the improved fast DAVAR are applied to analyze the simulation data. The analysis results of the classical DAVAR
Figure 6a,c and the improved fast DAVAR
Figure 6b,d are shown in
Figure 7.
With a rectangular window of
L = 1000 samples and a step whose width is 30 samples, the analysis results of
are obtained. As can be seen in
Figure 7a, both DAVAR methods are constant over time and have a typical white noise slope. The value of the improved fast DAVAR is similar to that of the classical DAVAR at fixed
t and
. The analysis results of
are obtained by a rectangular window of number
= 2000 samples and a step whose width is 300 samples. In
Figure 7b, the improved fast DAVAR and classical DAVAR reveal that noise increases linearly with time.
The coefficient of the angle random walk (
N) denotes the magnitude of the white noise [
30]. According to the 2D description method of noise terms mentioned in
Section 4.2, the coefficient
N(
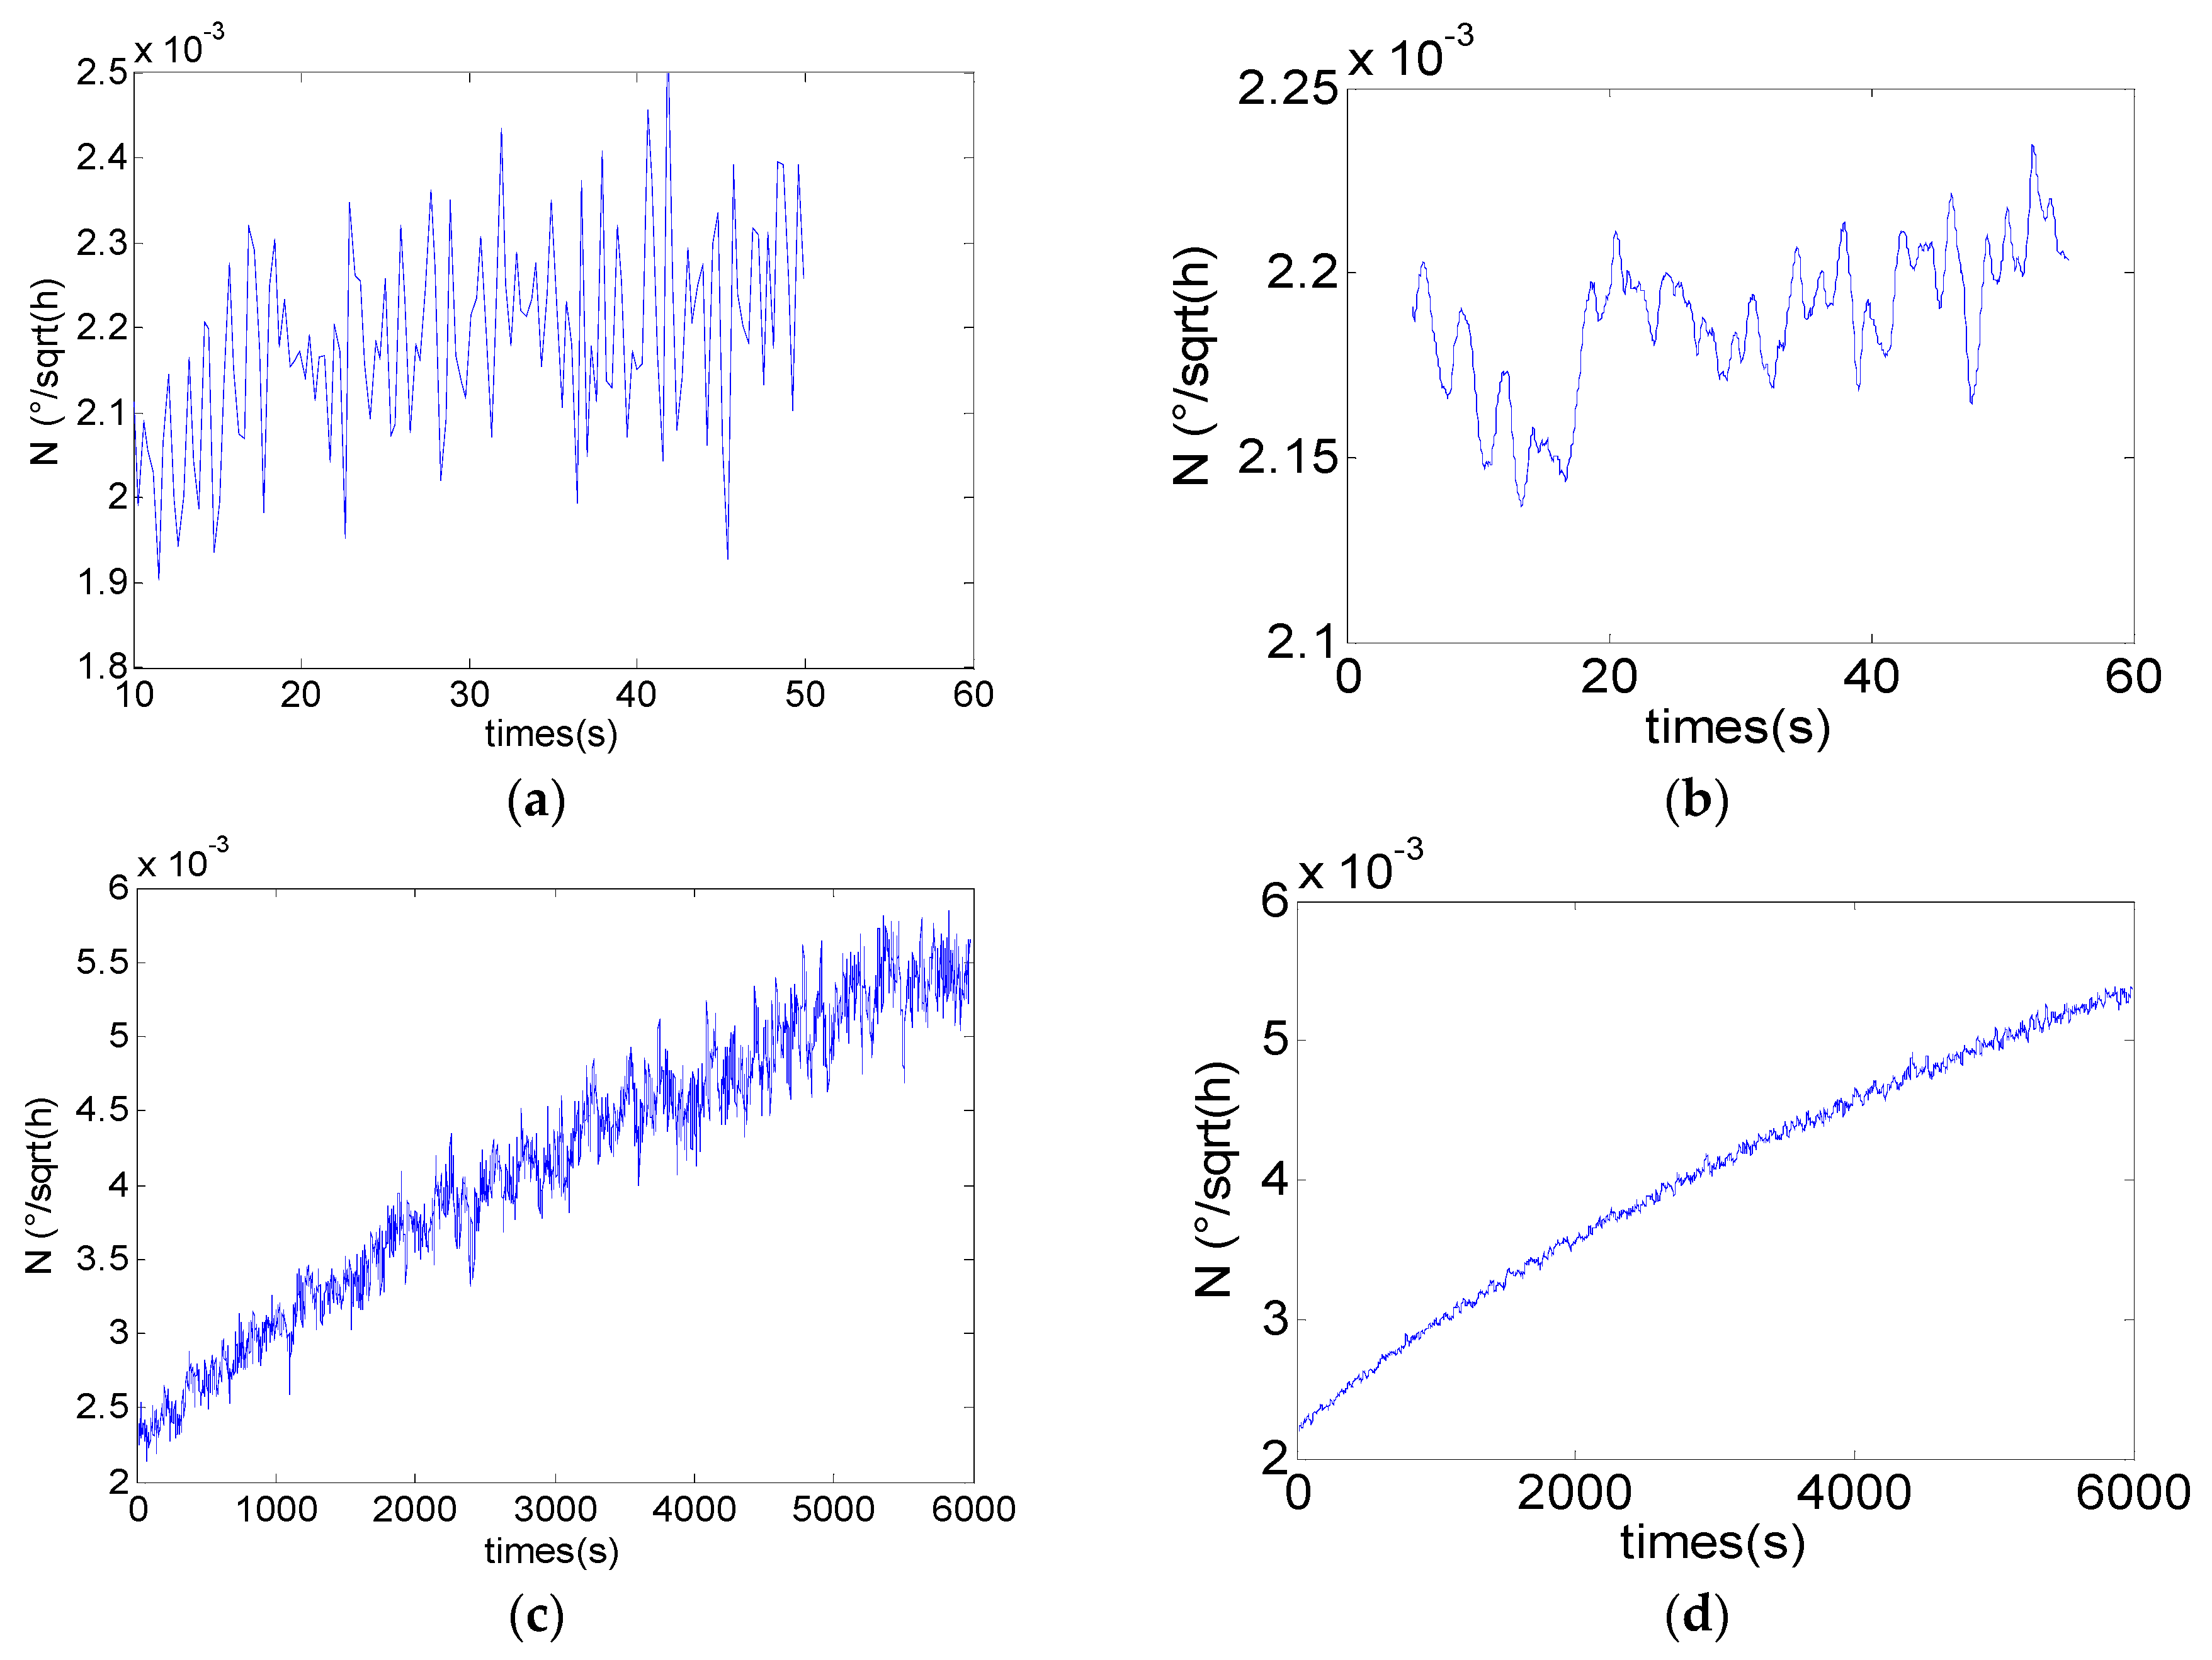
t) of the Angle random walk can be acquired.
Figure 8 shows the time-varying parameter
N(
t) of the two sets’ simulation data.
Figure 8a,c shows the results of the classical DAVAR while
Figure 8b,d shows the results of the improved fast DAVAR. The coefficient
N(
t) of
fluctuates around a constant while
increases linearly with time. The results prove that the improved fast DAVAR is correct.
Both the results are obtained by the Matlab program on an Intel(R) Core(TM) i7-3770 CPU with a 3.4 GHz clock.
Table 2 shows a computational comparison of the classical DAVAR and the improved fast DAVAR.
In the second column, the number of simulation data points is reported. The third column shows the length of the truncation window and the fourth column shows the step width. The fifth column represents the computational time. The last column indicates the calculation times of the Allan variance in the whole calculation process.
When the length of the time series is short ( samples), the improved fast DAVAR saves 78.93% of computing time. When the length of the time series is long ( samples), the improved fast DAVAR costs only 27.92727 s while the classical DAVAR costs 960.422362 s. The improved fast DAVAR reduces 97.09% of computing time. The last column reports the reason. With the time series increasing, the classical DAVAR needs to calculate the Allan variance more and more times while the improved fast DAVAR just needs to compute it one time (the initial value of the DAVAR). Thus, the improved fast DAVAR could shorten the calculation time. When the time series is long, the improved fast DAVAR is meaningful and significant.
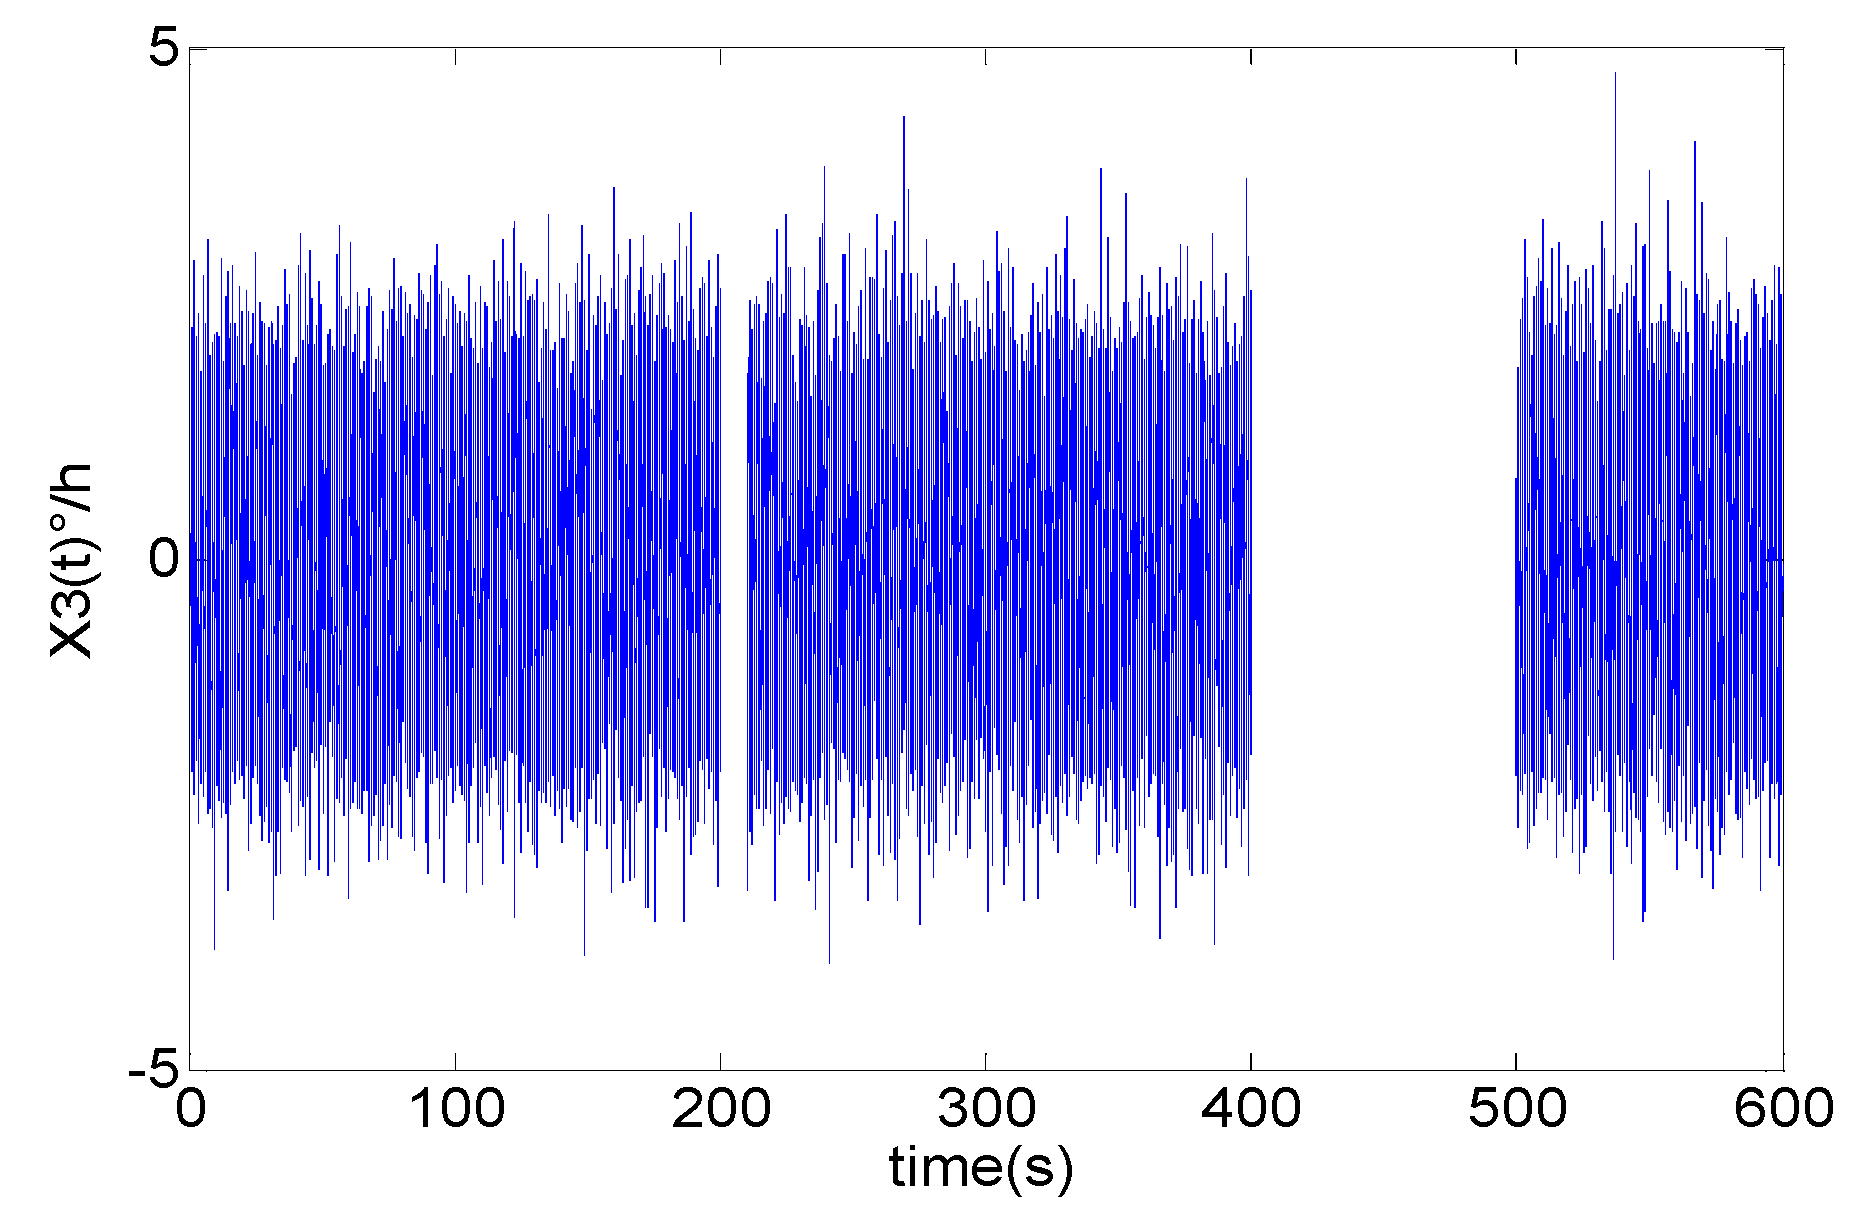
Now we extend the improved fast DAVAR to discontinuous time series. On the basis of the simulation data
, we created simulation dataset
using the same noise model as
, but it is longer than
. Two pieces of data in
are deleted. One piece of data is between 200 s and 220 s and the other piece of data is between 400 s and 500 s. The discontinuous simulation data is represented in
Figure 9.
Then the classical DAVAR and the improved fast DAVAR are applied to analyzing the simulation data. The classical DAVAR is forced to stop because the program could not identify the NaN. However, the improved fast DAVAR could successfully analyze the data.
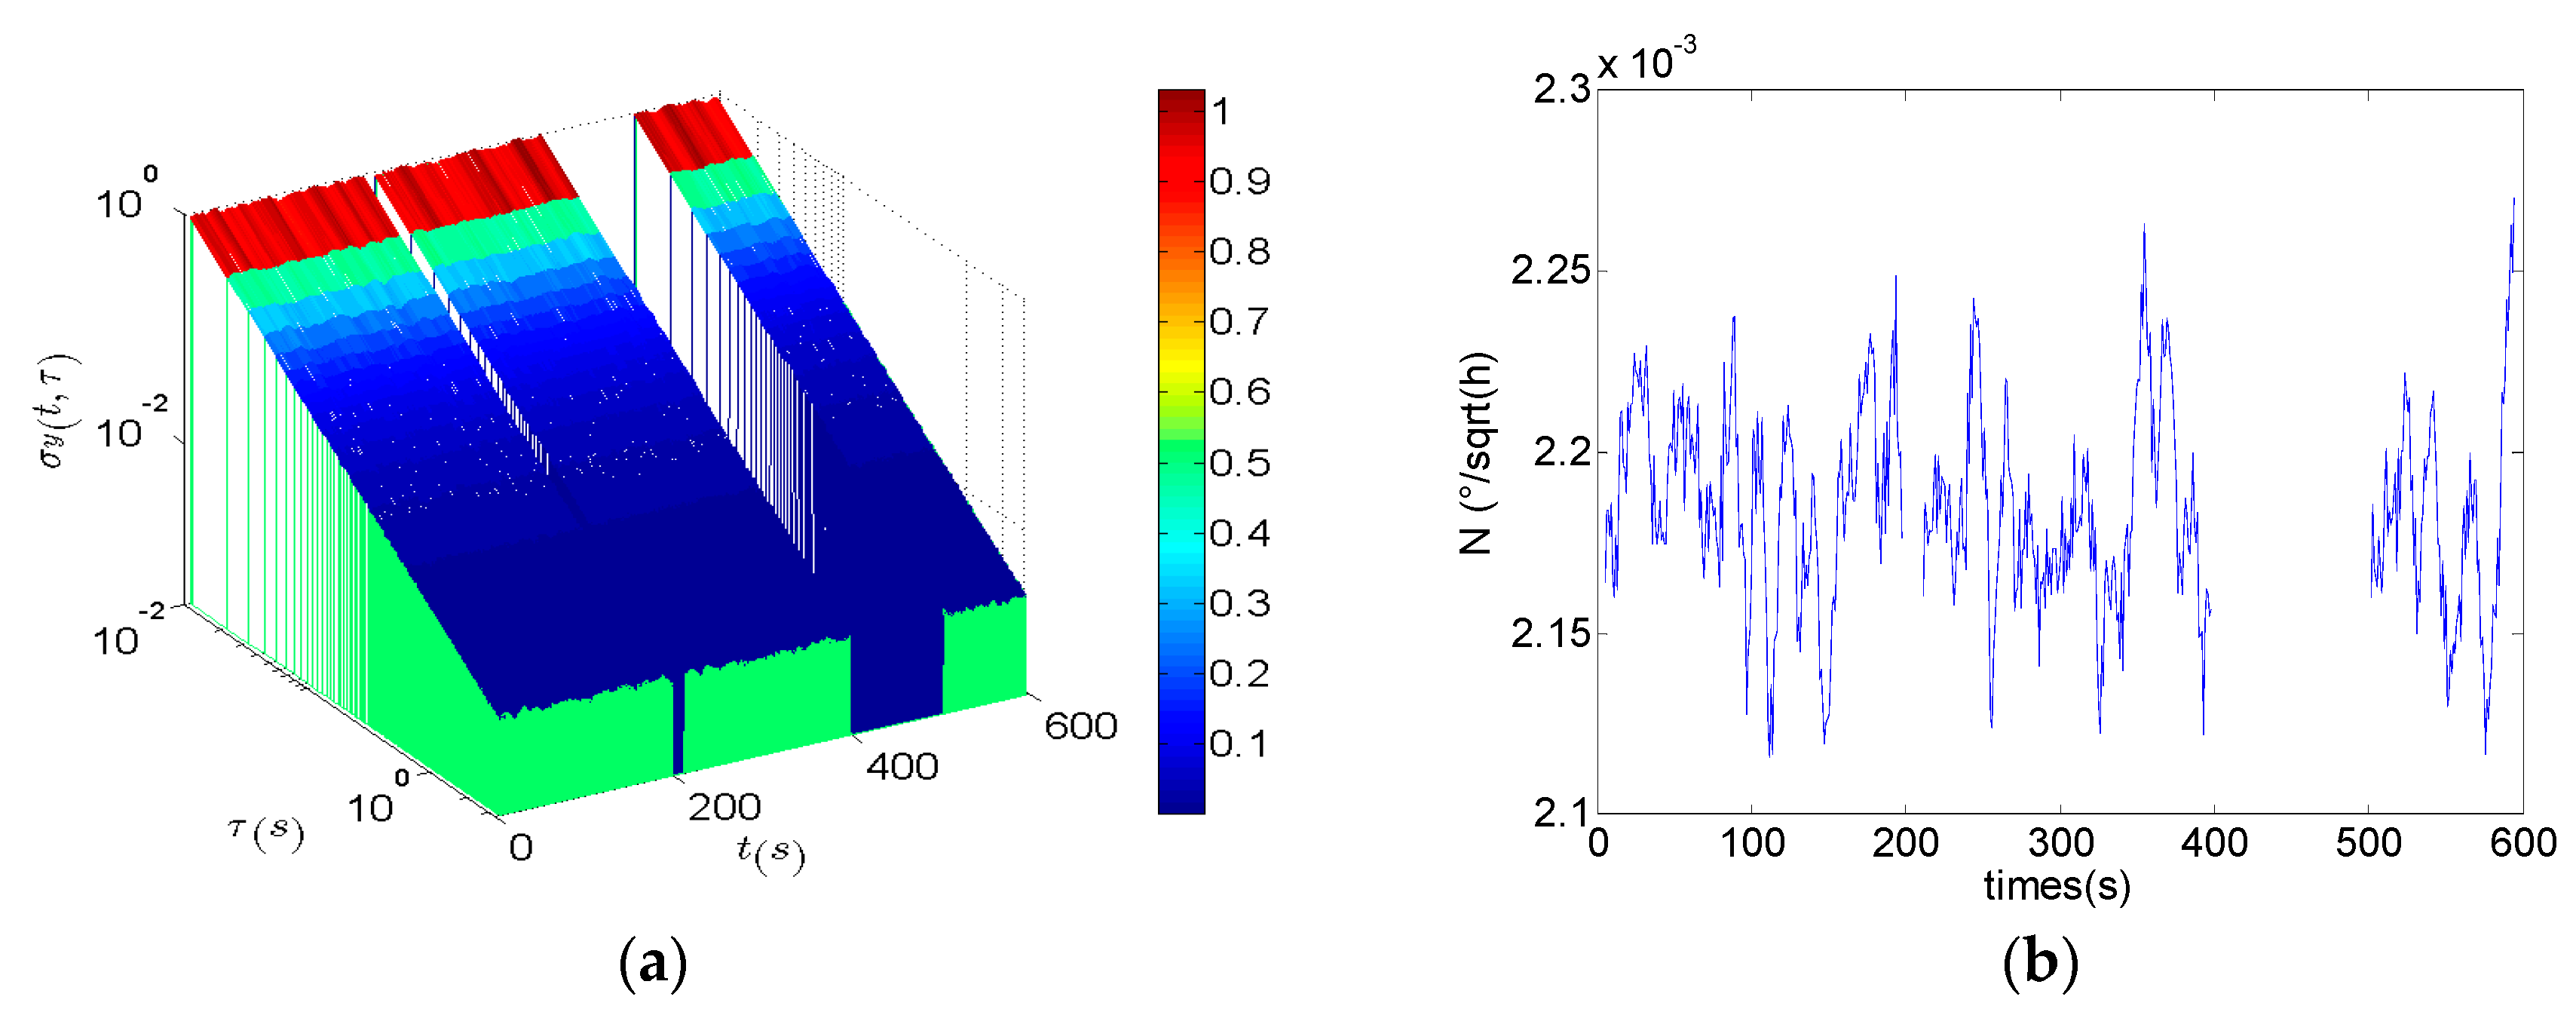
Figure 10a represents fast DAVAR obtained with a window of
samples and a step whose width is 30 samples. When
t < 200 s, the DAVAR is essentially stationary. The slope of the DAVAR surface correctly indicates the presence of white phase noise. In the time interval 200 s <
t < 220 s, the DAVAR shows a little canyon corresponding to a few areas of missing data. In the region of the large gap 400 s <
t < 500 s, the surface of the DAVAR exhibits a large canyon corresponding to a greater amount of missing data.
Figure 10b shows the coefficient of the angle random walk noise. The coefficient
N(
t) of
is similar to
Figure 8a. Moreover, it has the same order of magnitude and the same shape as that of the continuous data besides the two canyons. With this geometrical representation, the fast DAVAR clearly describes the dynamic instability of a gyroscope with missing data.
8. Experiments
Aiming to further verify the proposal algorithm, a vibration experiment was implemented with a ready-made FOGs-based MWD. The accuracy of FOGs in MWD system is 0.03
/h. The vibration experiment is carried out at the high temperature of 65 °C. The x-axis FOG is mounted along with the vibration direction of the vibration platform. The PSD of the vibration is reported in
Figure 11. Its vibration level is high, which simulates the drilling vibration underground. When the vibration frequency is between 700 Hz and 800 Hz, the PSD of the vibration is up to 1 g
2/Hz. The root-mean-square value of the whole vibration is 13.39 g.
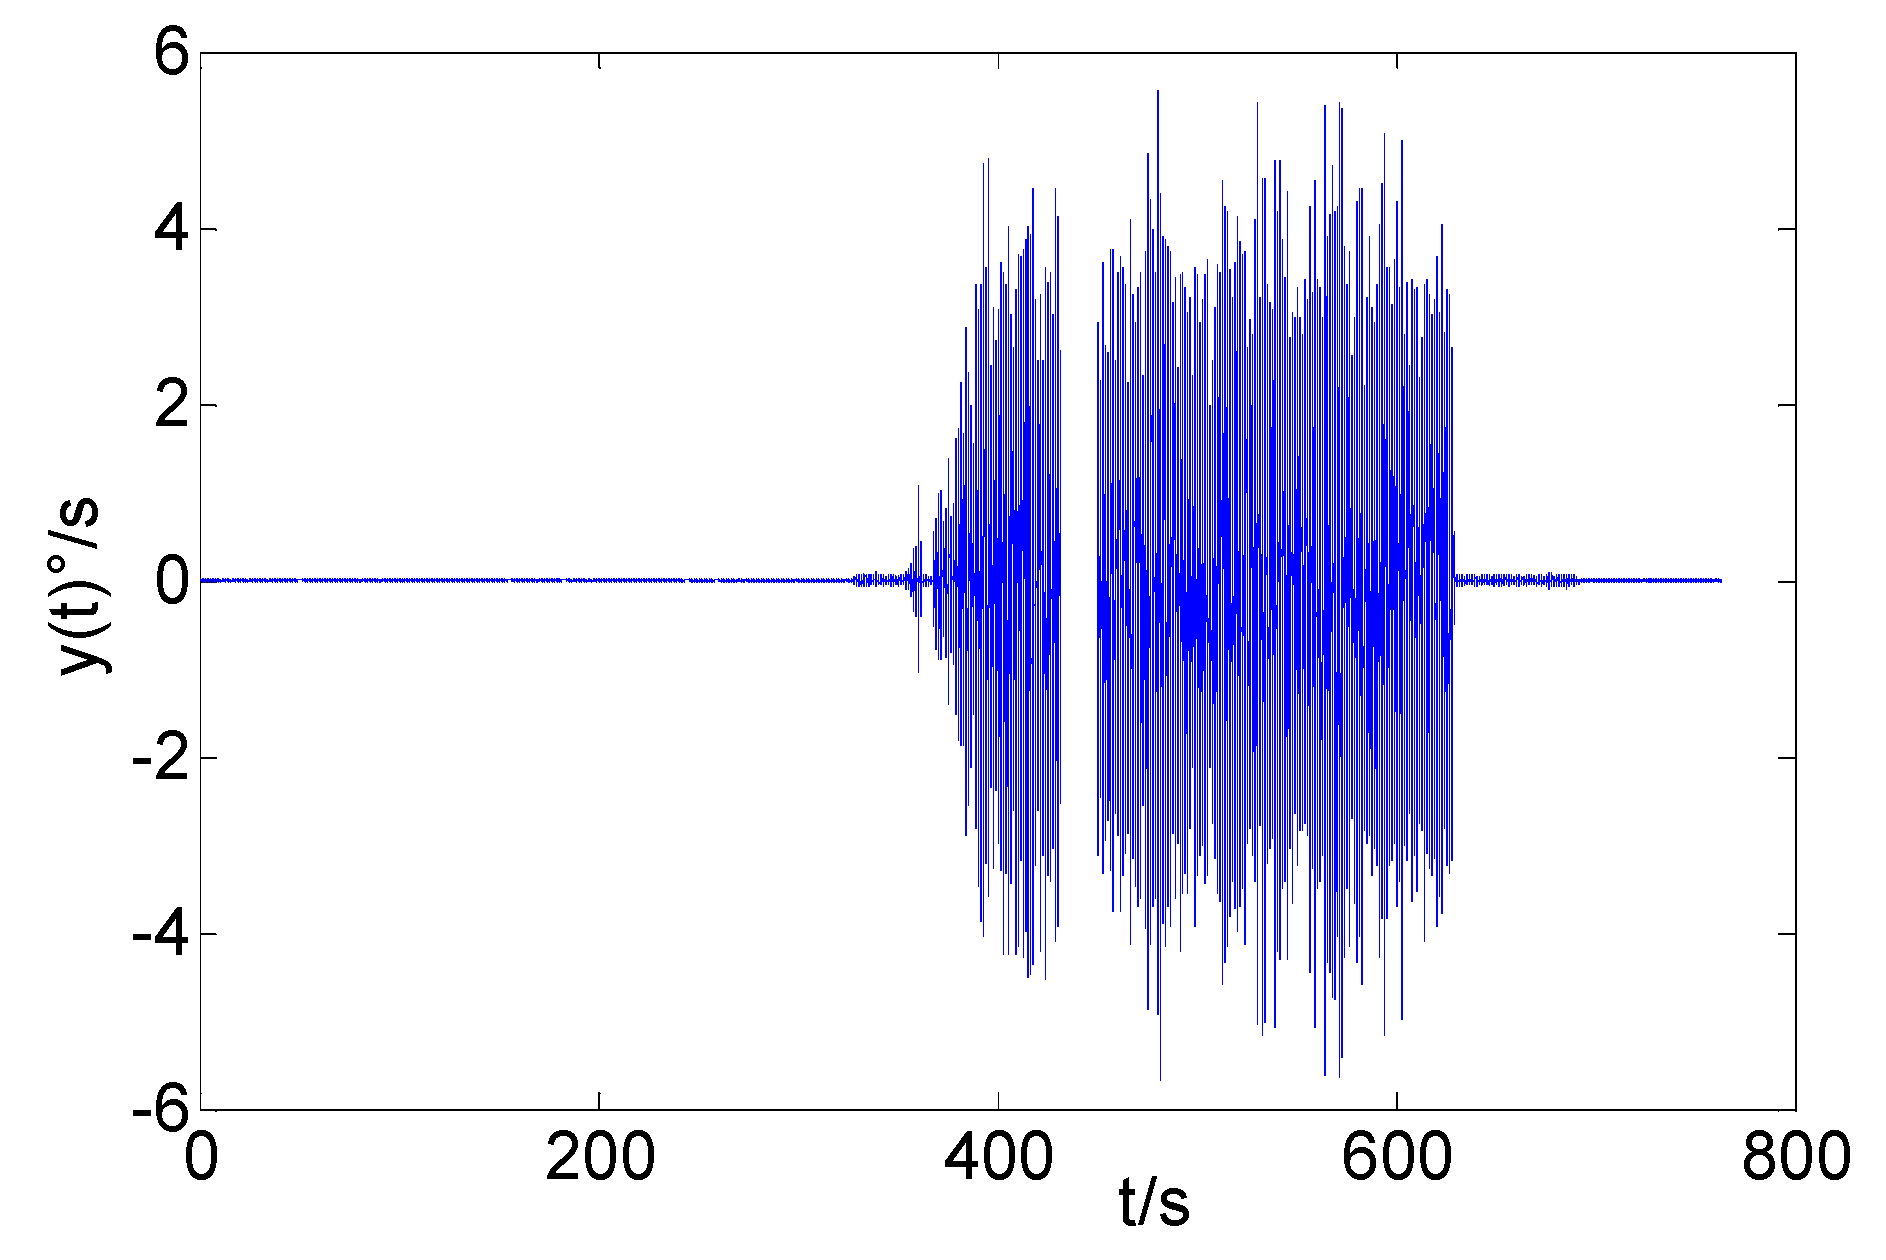
The vibration experiment was conducted via the following steps. First, the vibration platform was kept static (0–330 s). Secondly, the vibration platform began to vibrate and kept vibrating for 5 min (330 s–630 s). Finally the vibration platform returned to static state (630 s–930 s). The movement of the MWD system was in accordance with the movement of the vibration platform. We collected the output signal of the x-axis FOG in the MWD system. The sampling interval is 2.5 ms. Hence, the total value of this gyro data is
. The primary signal is shown in
Figure 12. It shows that the platform began to vibrate at
t = 330 s and stopped at
t = 630 s. In addition, we must pay attention to a piece of lost data when 432 s <
t < 450 s.
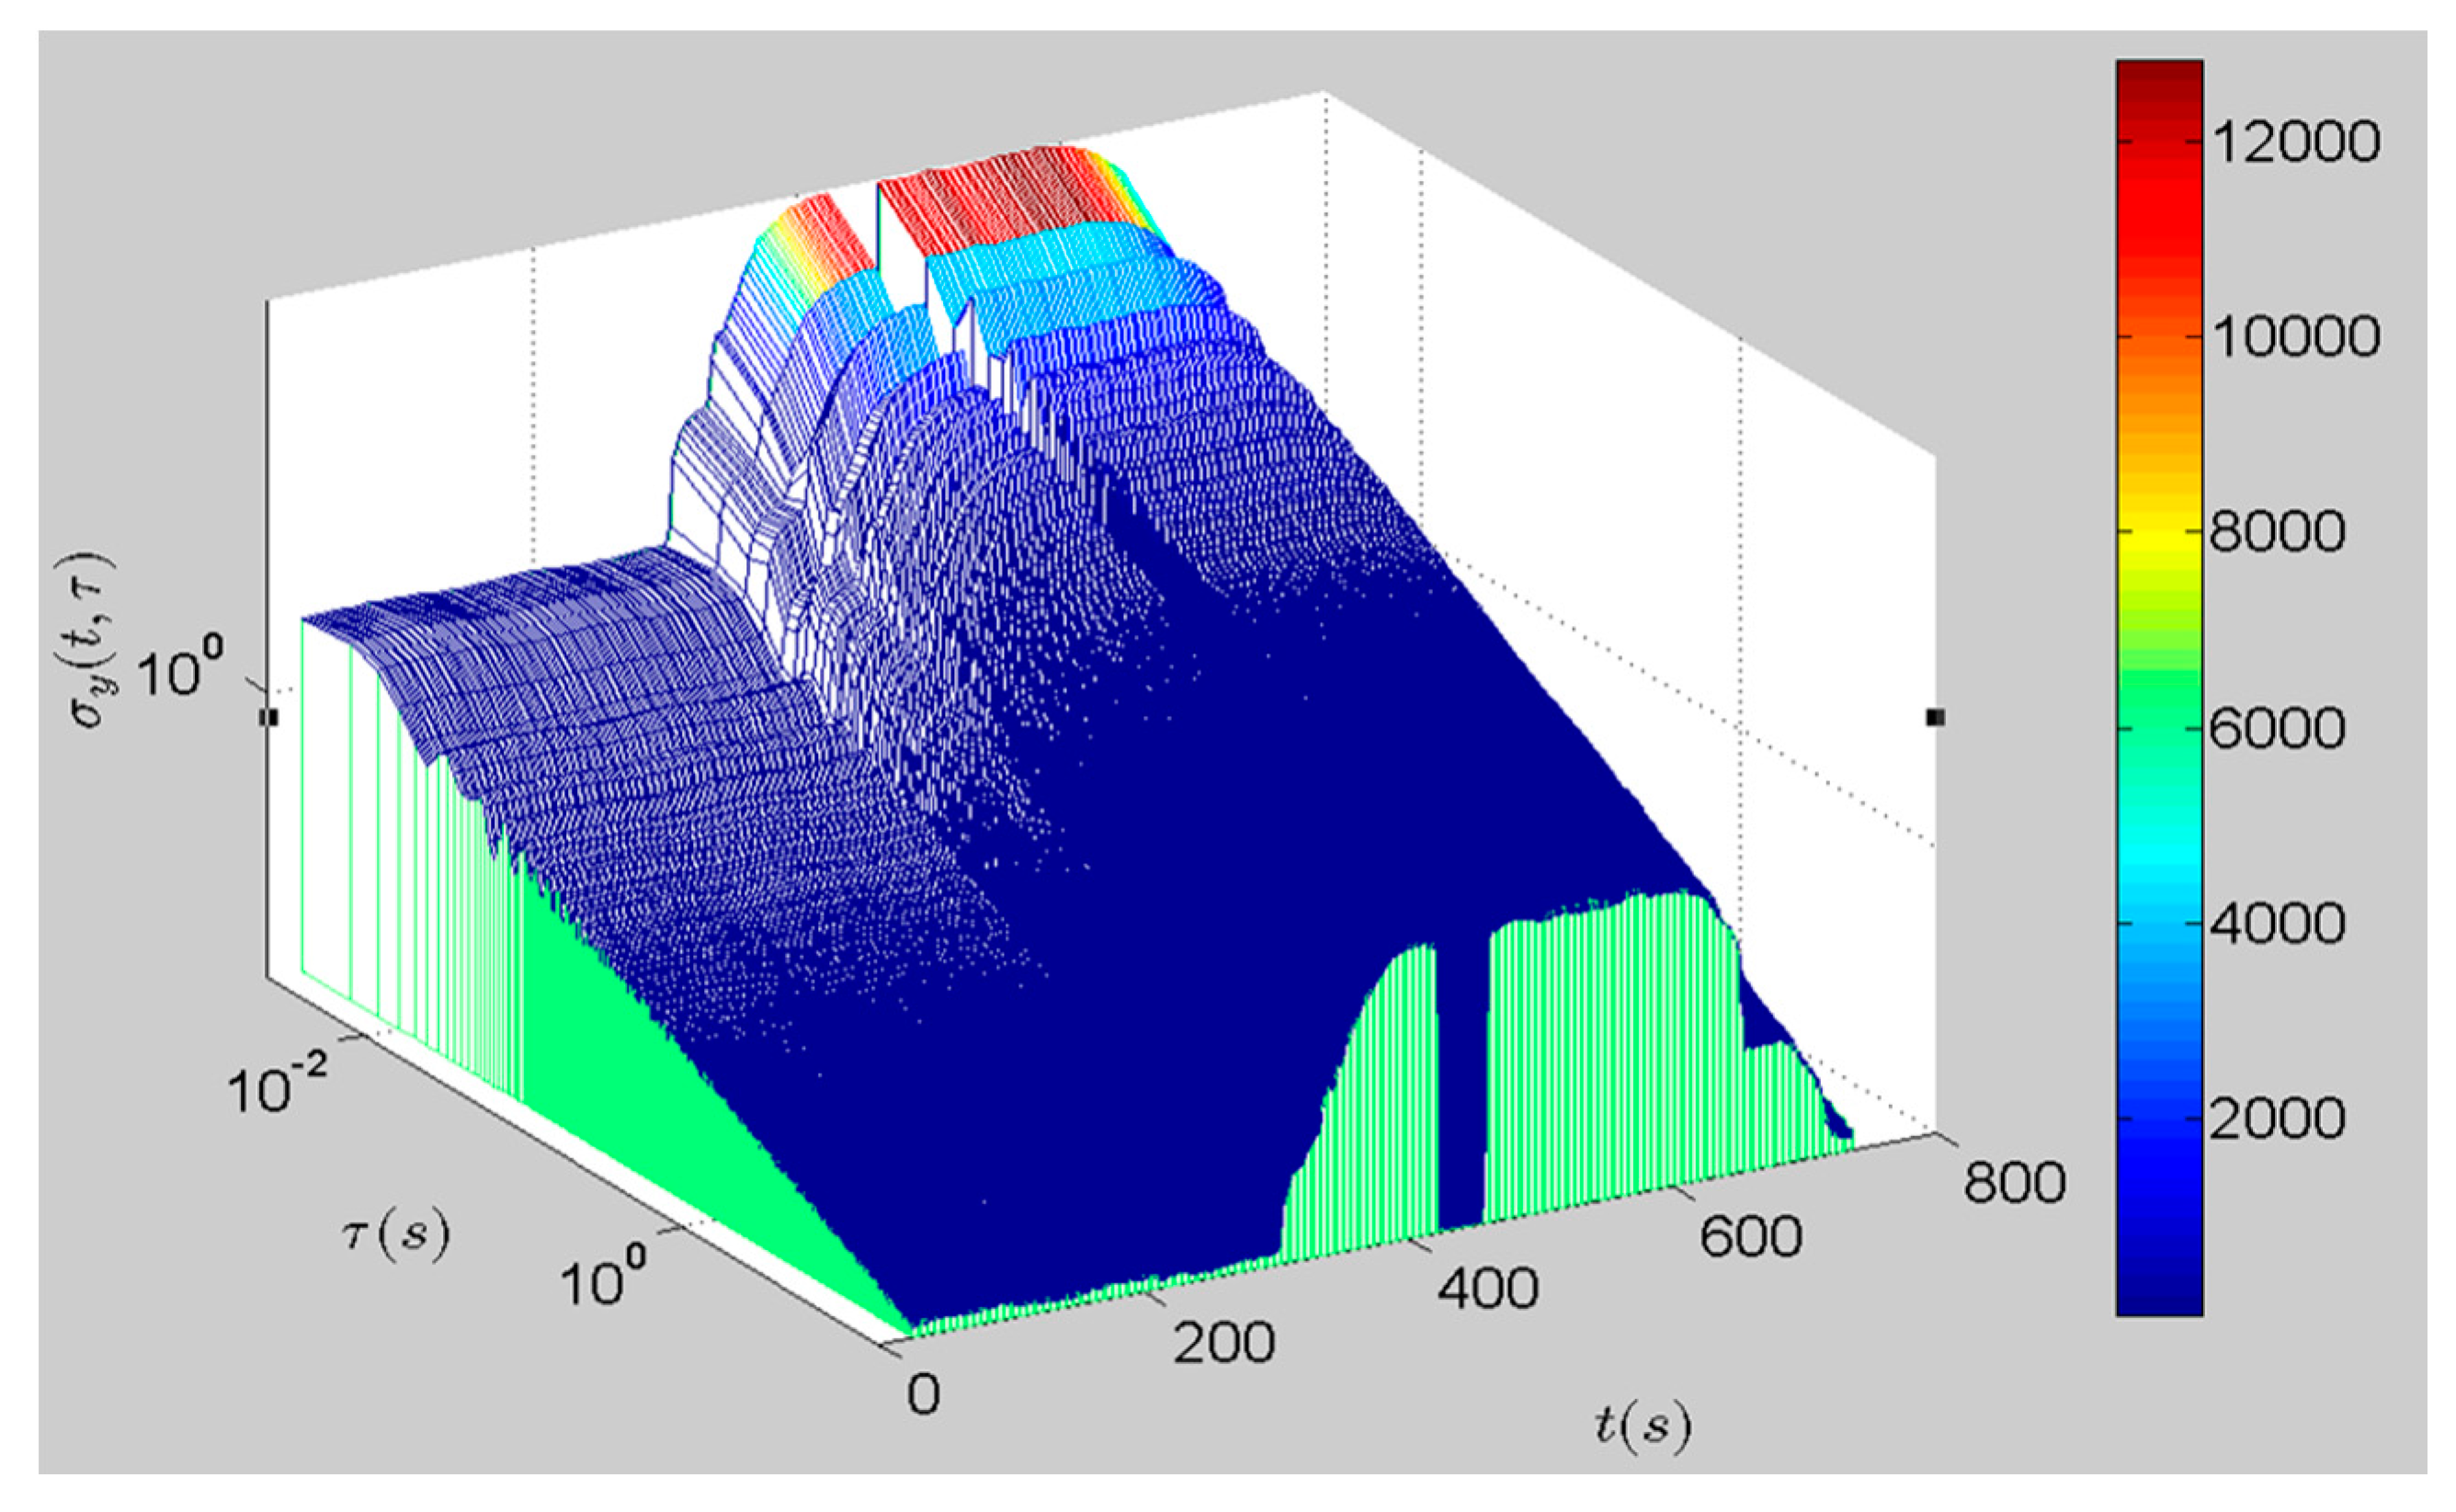
Then the improved fast DAVAR has been applied to analyzing this discontinuous vibration data. Its result is obtained with a truncation window of length samples, and a step width of 1000 samples. The Matlab program calculation is carried out on an Intel (R) Core (TM) i7-3770 CPU with a 3.4 GHz clock. The improved fast DAVAR costs only 28.616520 s to deal with this long time series.
Figure 13 is the improved fast DAVAR result. It can be seen that the DAVAR surface is stationary at the beginning. Then there appears a large crest that starts at
t = 330 s and stops at
t = 630 s. In the end it goes back to being stationary. Obviously, the canyon (430 s <
t < 450 s) is the graphical representation of the missing data in the time series. The changing process of the DAVAR surface is consistent with
Figure 12. In conclusion, the improved fast DAVAR could track and reveal the non-stationary characteristics in a clear way.
Fitting the double logarithmic curve
at any given time
t, the time-varying coefficients of noise terms can be obtained [
27,
28].
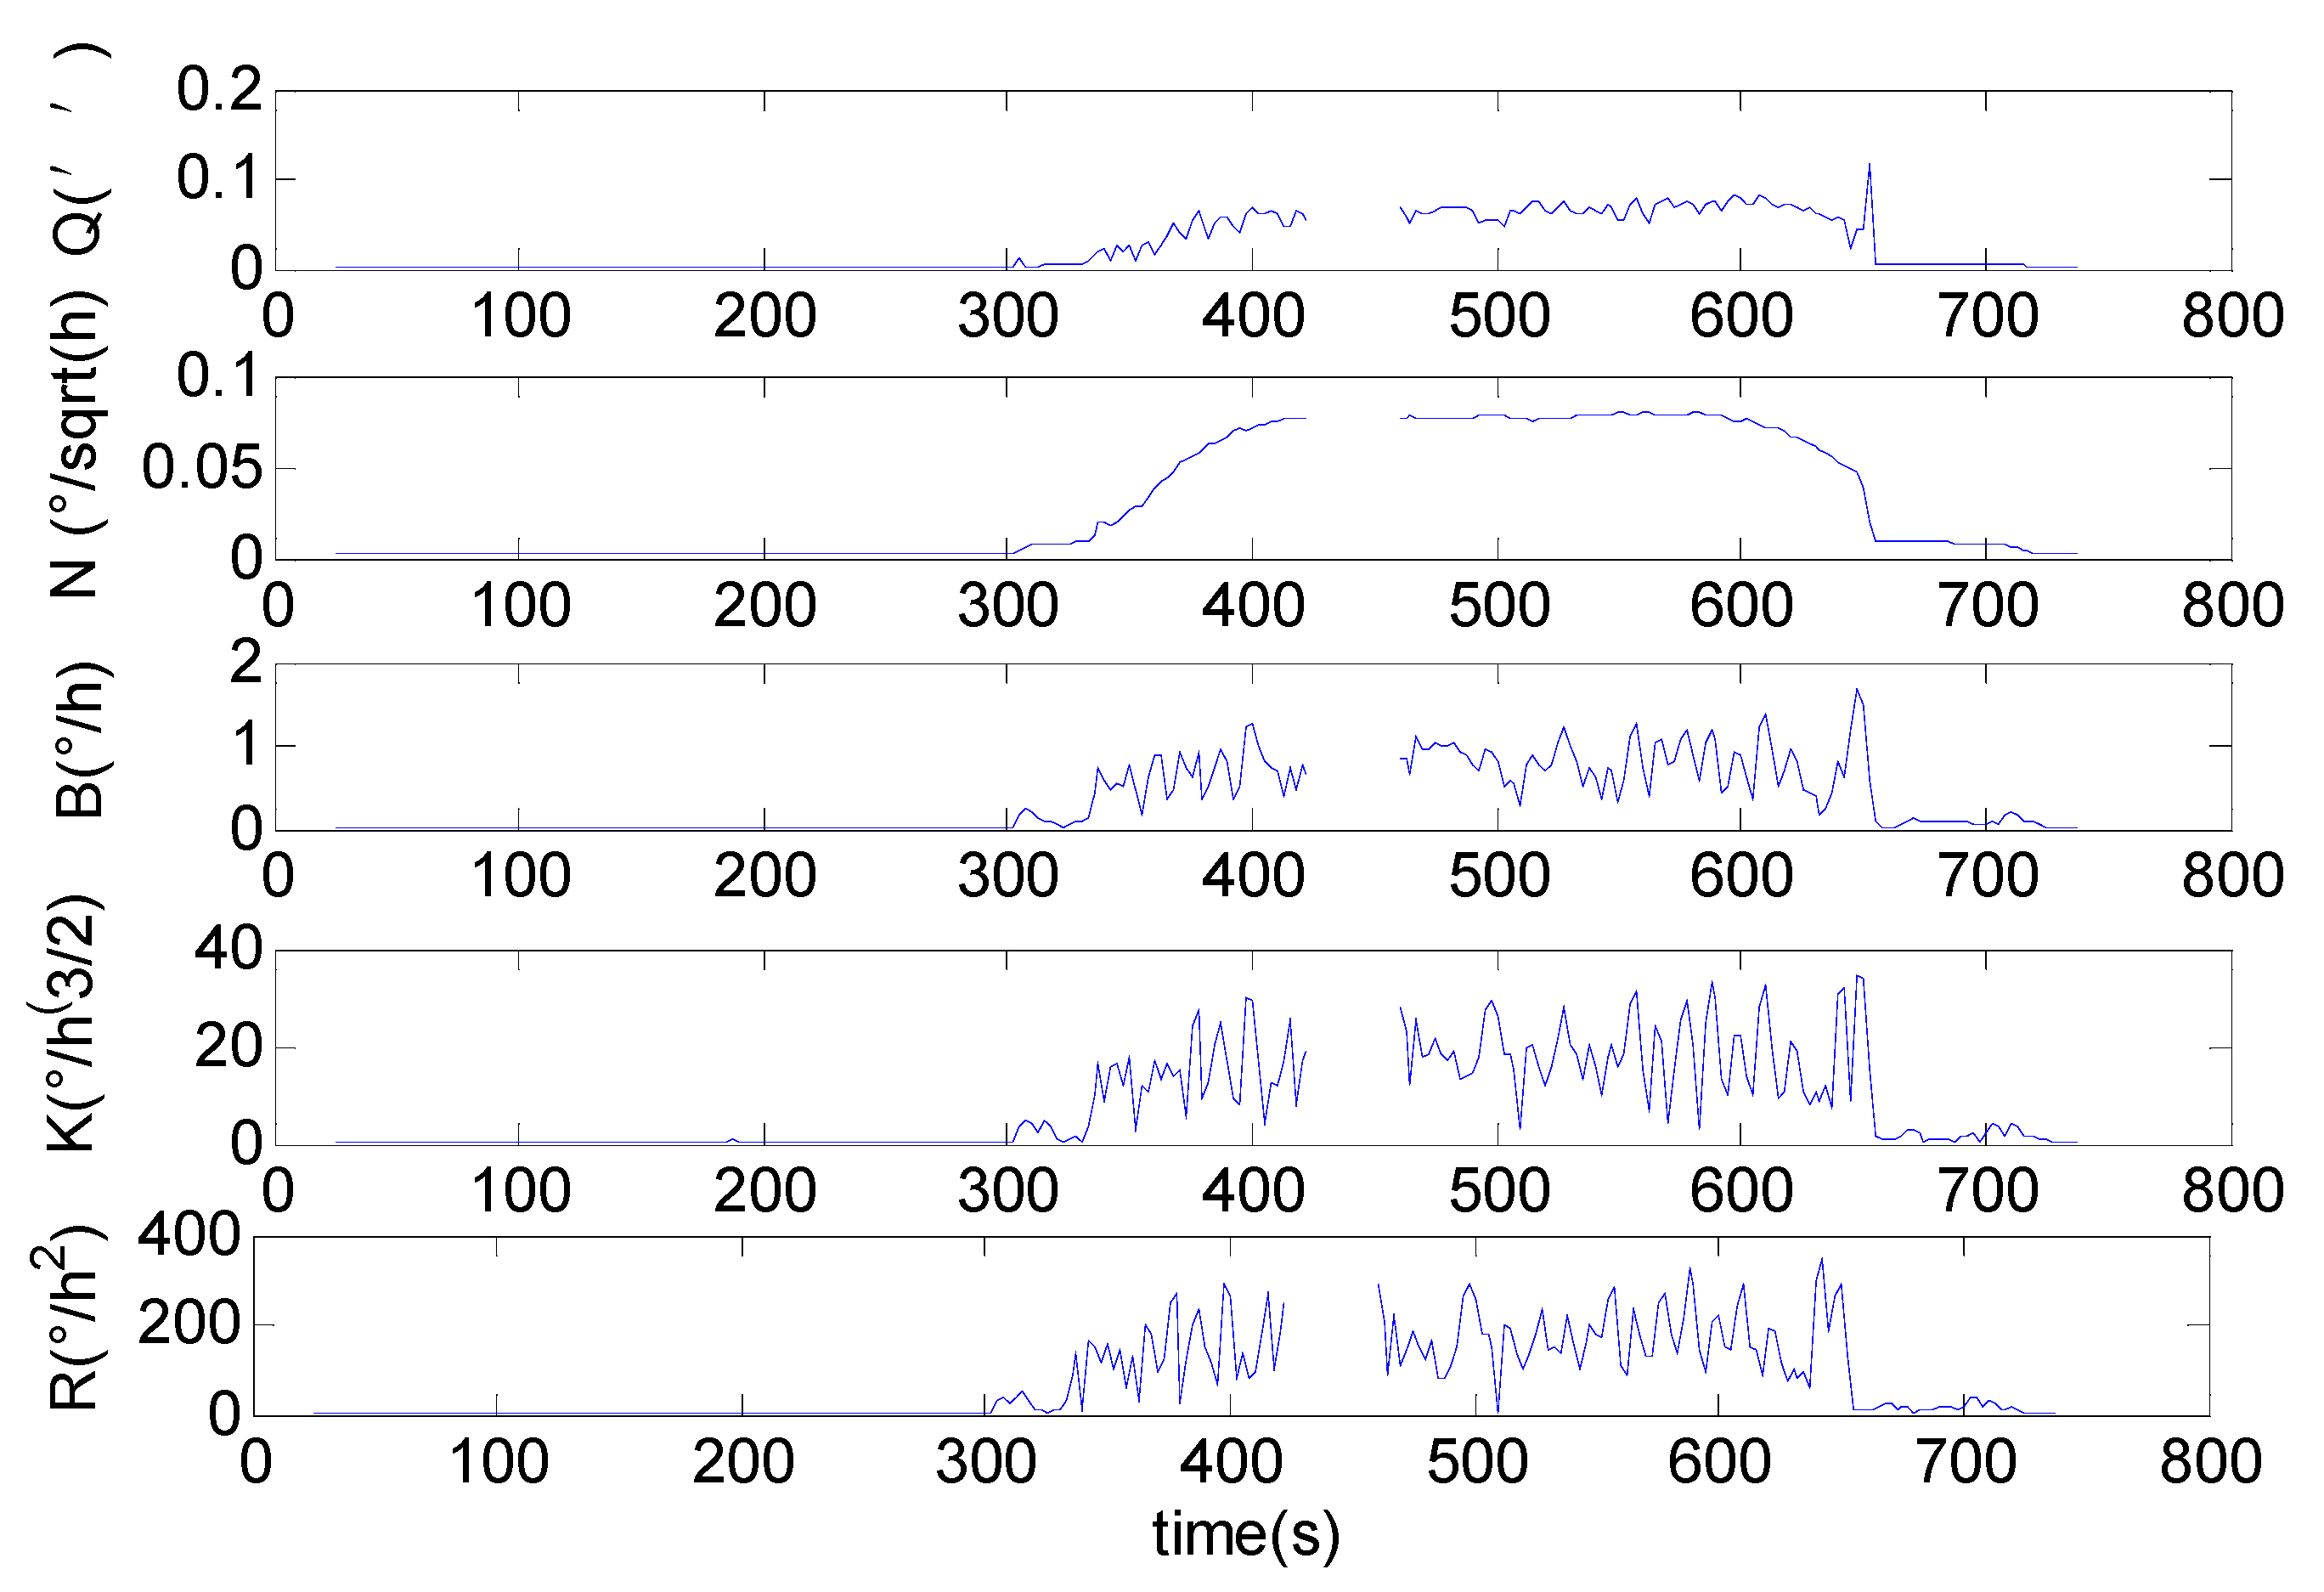
Figure 14 shows the changing coefficients of each noise terms evaluated by the improved fast DAVAR.
Aside from the canyon at t = 432 s, it is easy to distinguish the change in the noise. Before vibration (t < 330 s), since the FOG is static, the coefficient of each noise is small without evident change. When the platform starts to vibrate (t = 432 s), the noise terms of the FOG change dramatically, especially the Rate Random walk, which is affected by the vibration. Meanwhile, the coefficient of the quantization noise increases when the FOG is vibrating. The data acquisition circuit of FOG has better aseismic performance. After vibration, all confidents of noise terms are back to the previous state. We can make a conclusion that the FOG could endure the drilling vibration. In conclusion, the improved fast algorithm of the DAVAR could successfully analyze the discontinuous gyroscope data. The improved fast DAVAR identifies and reveals the highly dynamic instability in the FOG’s discontinuous time series.
9. Conclusions
The working environment of FOGs-based MWD is hostile: the vibration is very strong and the temperature is very high. The gyroscope is heavily influenced by factors such as temperature, vibration, aging, and sudden breakdowns. A slight variation of the gyroscope stability can turn into a measurement error. Hence, it is important to monitor the behavior of gyroscopes through the use of DAVAR.
The DAVAR is a representative of the time-varying stability of the gyroscope. The fast DAVAR is a fast algorithm for the classical DAVAR. However, both the fast DAVAR and the classical DAVAR could not analyze the discontinuous gyroscope data. What is worse, in many applications, the gyroscope often gives discontinuous data, for example in a FOGs-based MWD system.
In this paper, utilizing the recursive characteristic of the fast DAVAR, we make a further advance on the fast algorithm to extend the fast DAVAR to discontinuous gyroscope data. This not only dramatically reduces the computation time, but could also allow us to analyze the discontinuous gyroscope data. Both the simulation results and the experimental results show that the improved fast DAVAR could not only save more than 90% of the computational time, but also deal successfully with discontinuous data.


