
Electrochemical Behavior and Determination of Chlorogenic Acid Based on Multi-Walled Carbon Nanotubes Modified Screen-Printed Electrode

Abstract
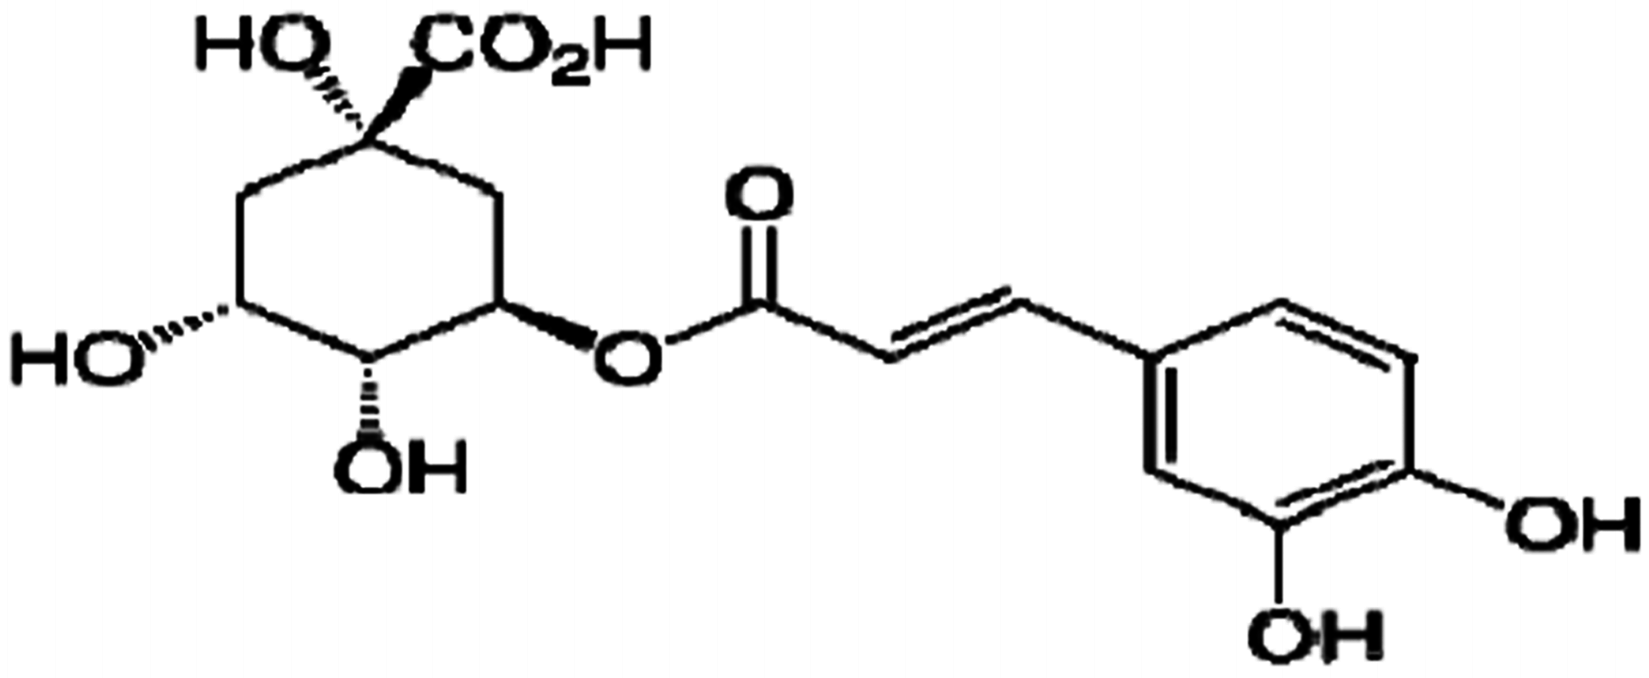
:1. Introduction
2. Materials and Methods
2.1. Instruments, Materials and Reagents
2.2. Experimental Methods
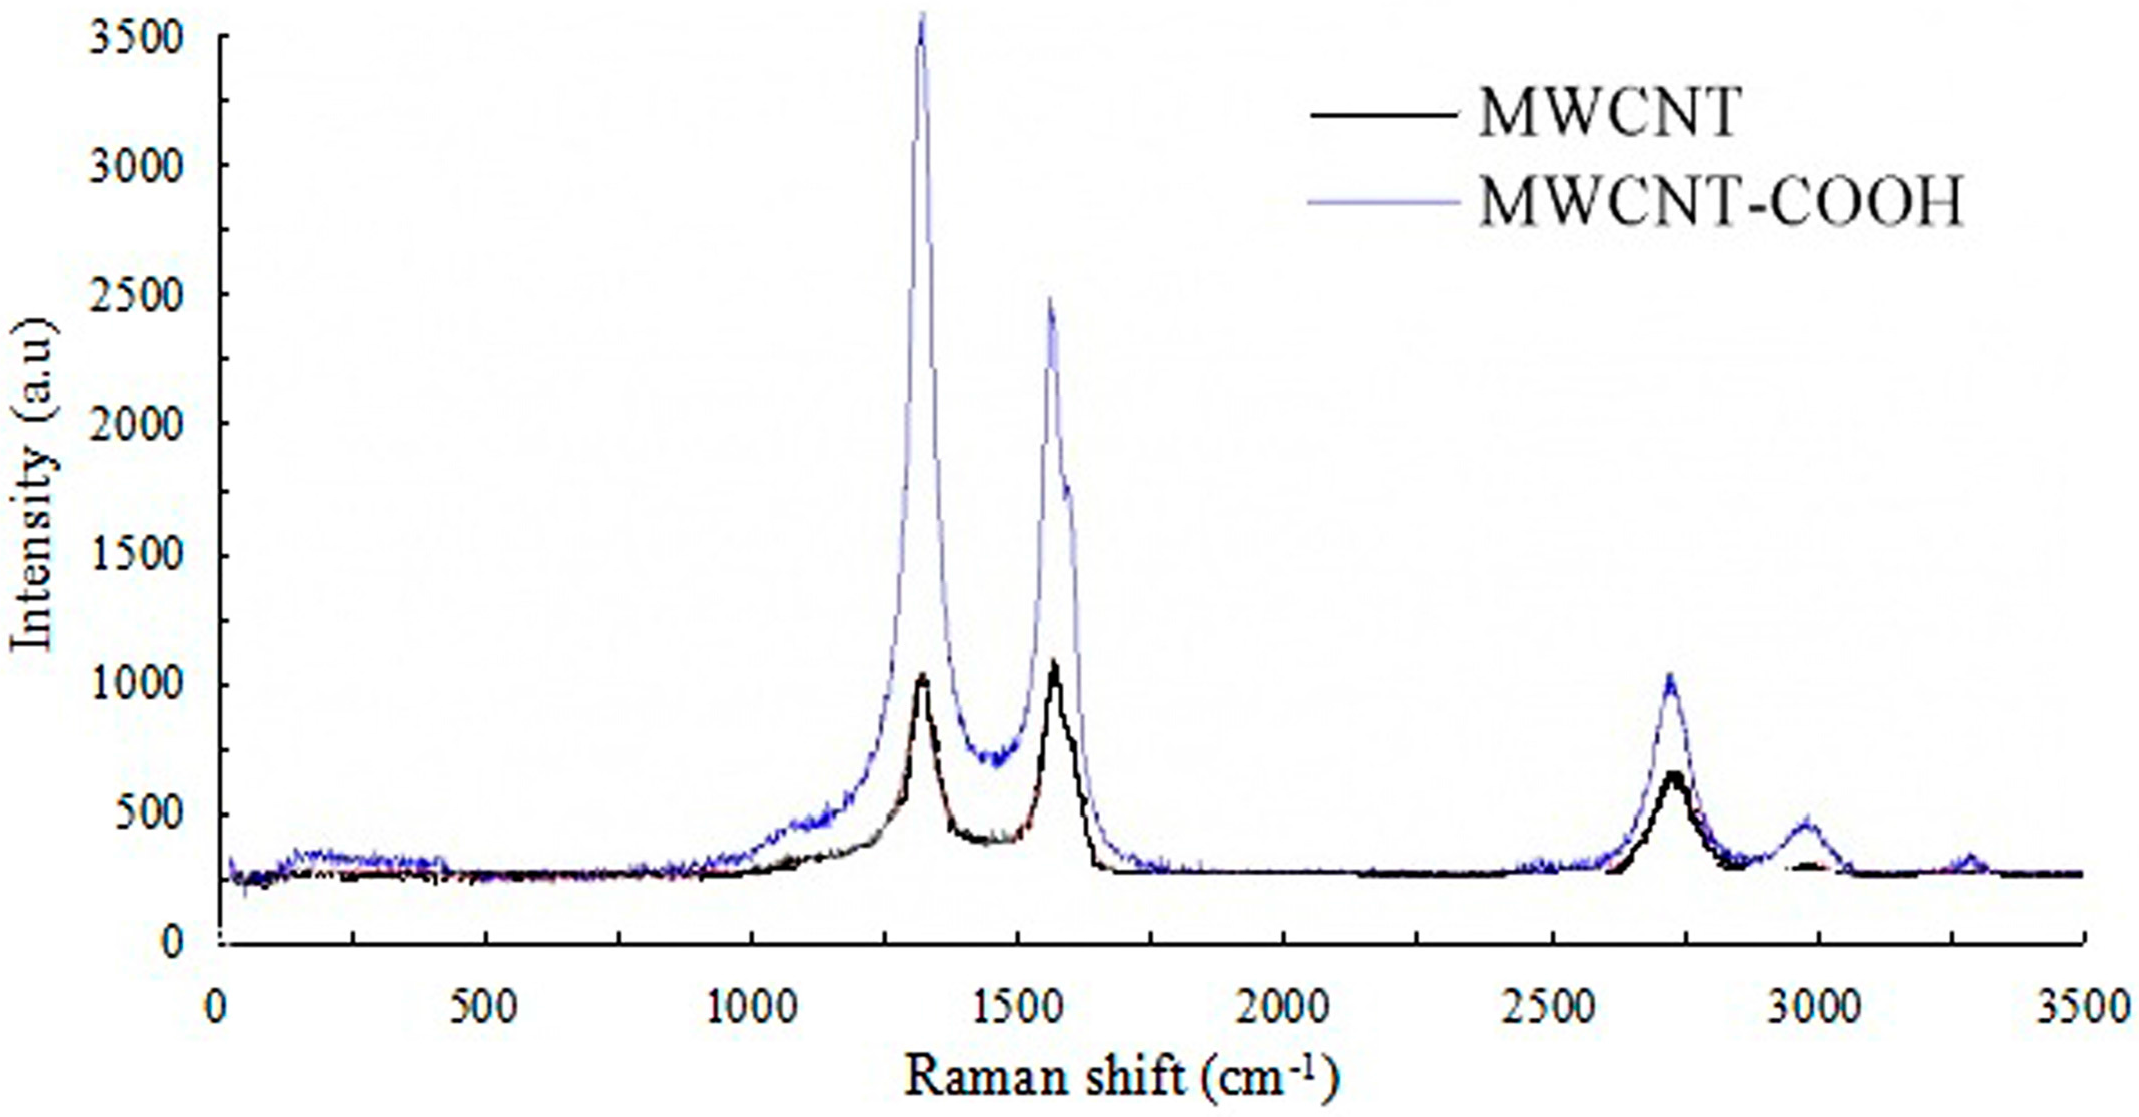
2.2.1. Purification and Functionalization of the Multi-Walled Carbon Nanotubes
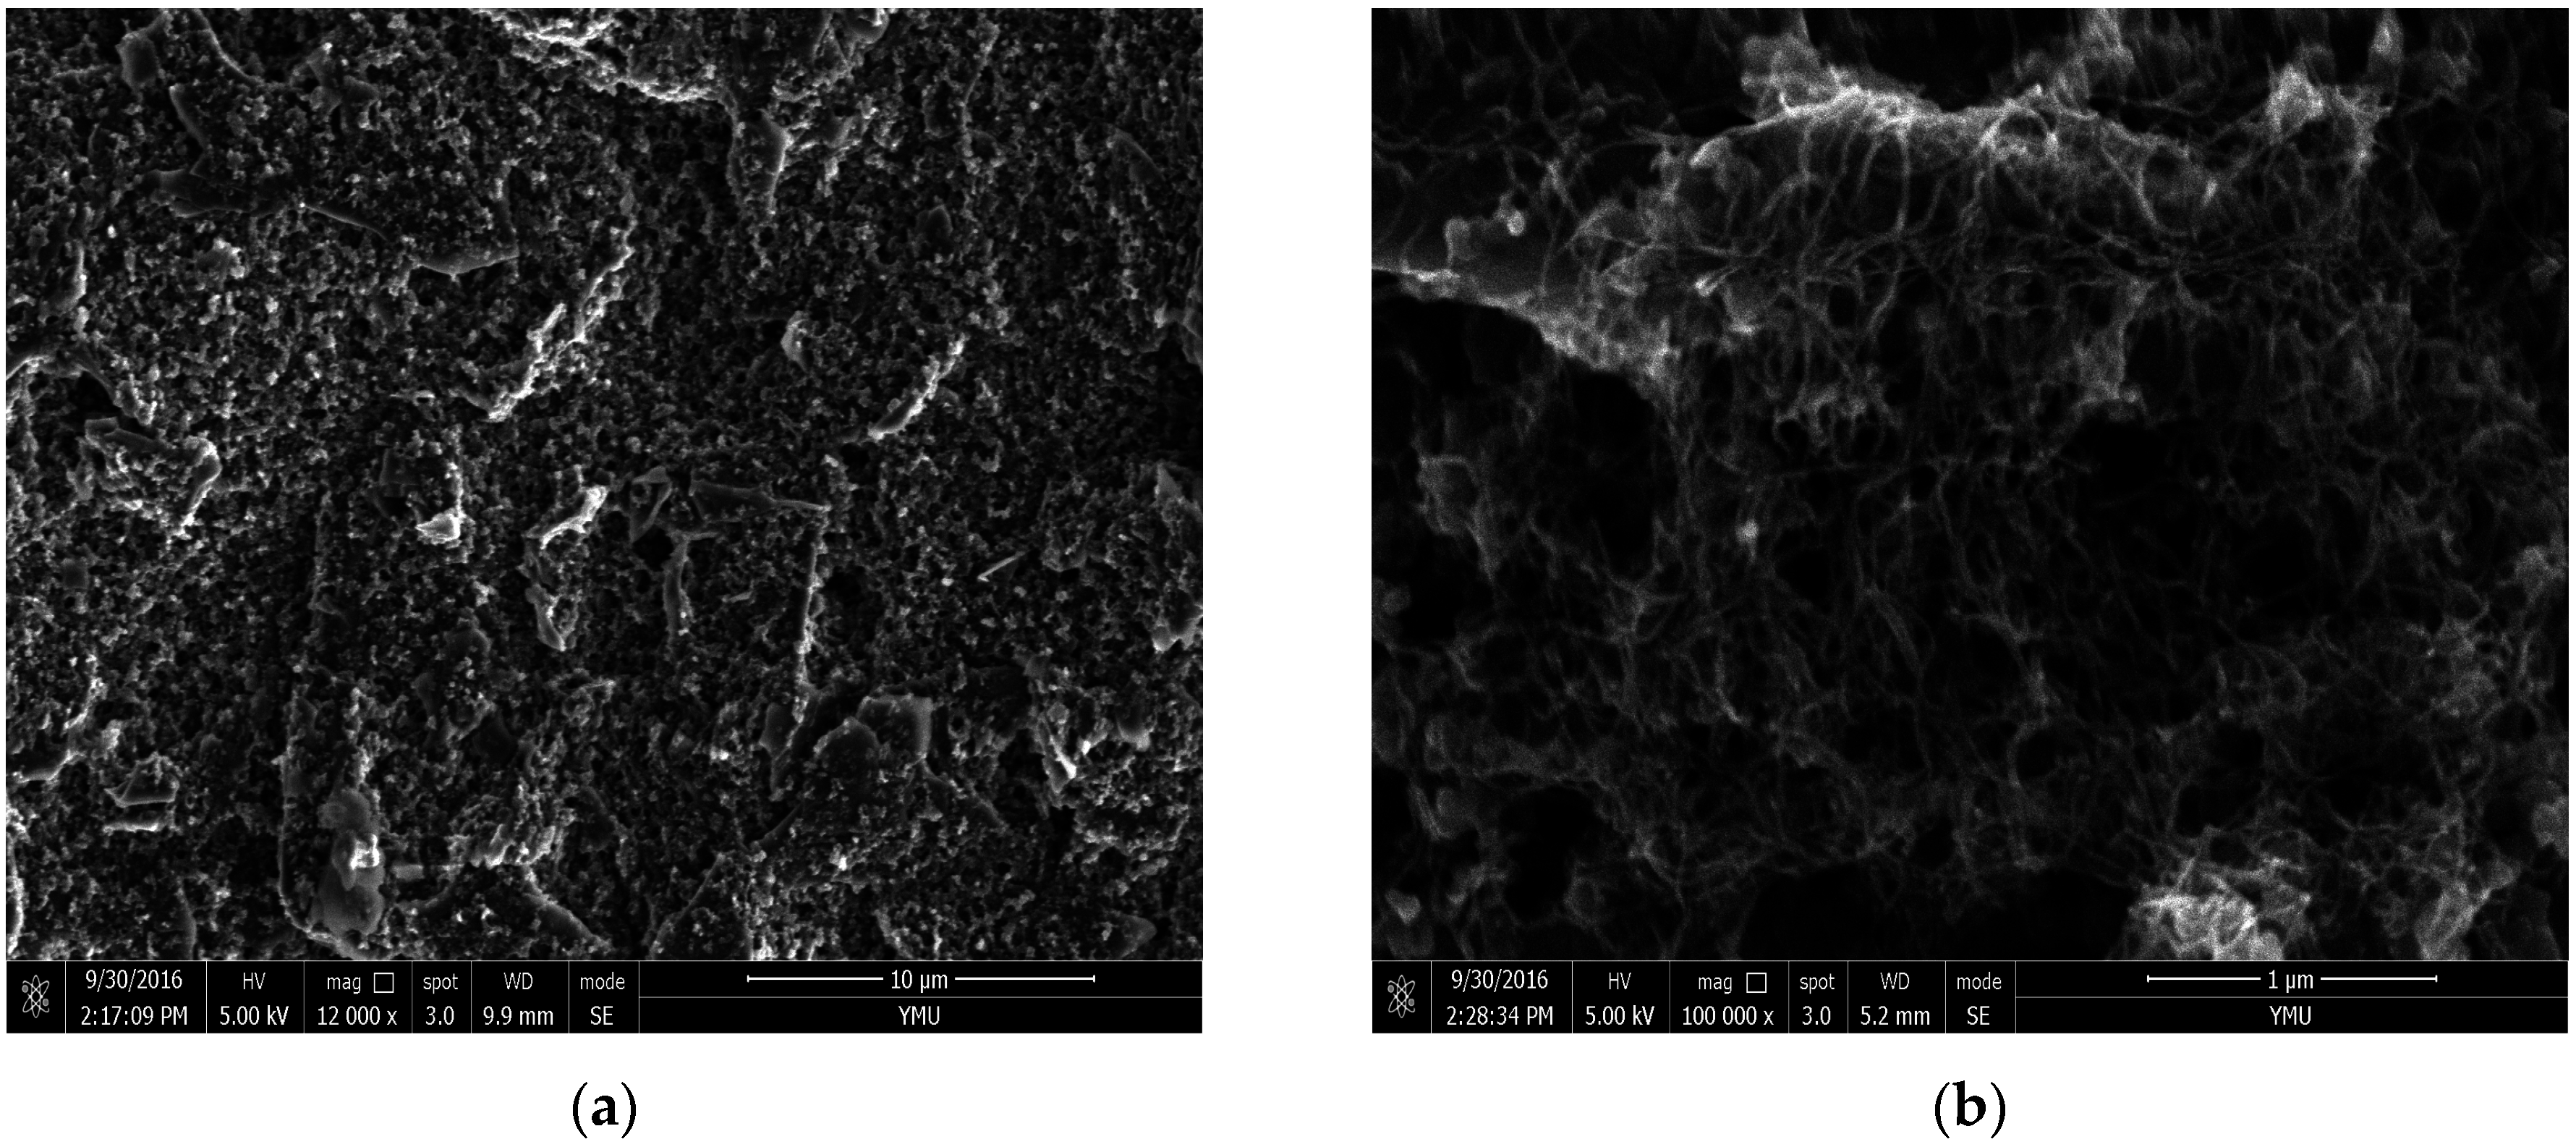
2.2.2. Preparation and Characteration of the Multi-Walled Carbon Nanotubes Modified Screen-Printed Electrode
2.2.3. Electrochemical Analysis
3. Results and Discussion
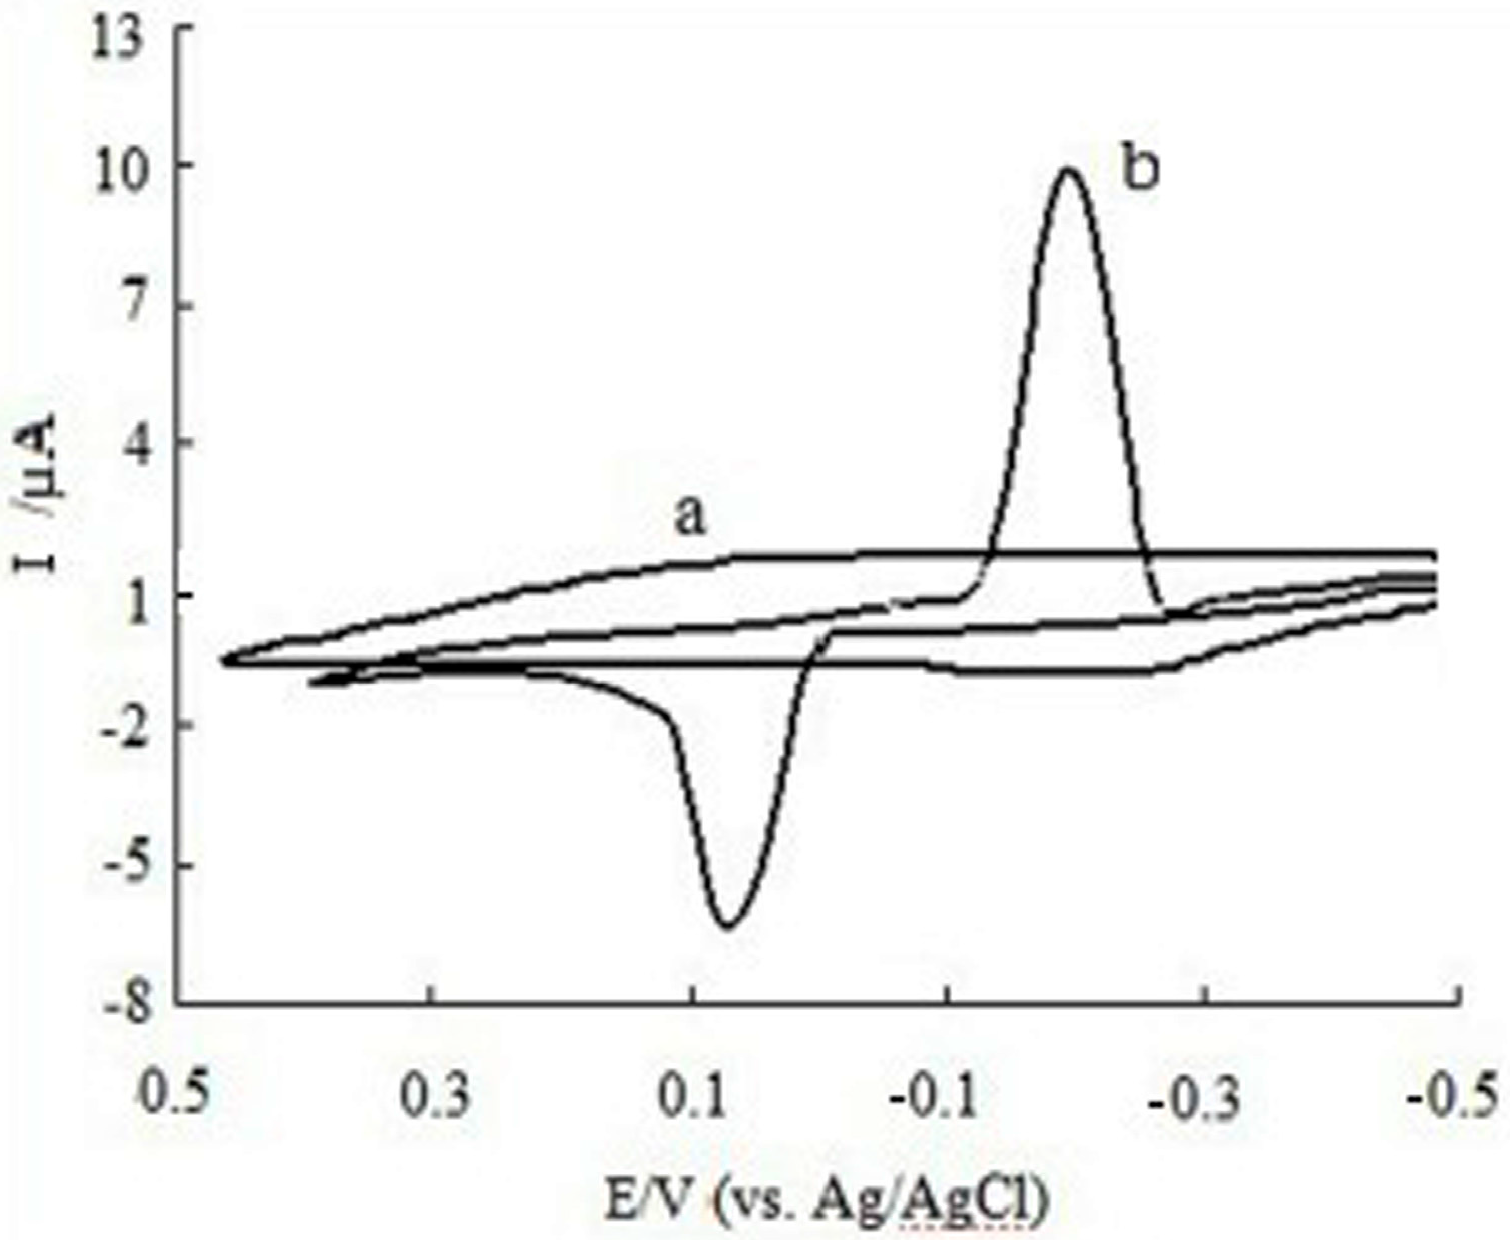
3.1. Cyclic Voltammetry and Differential Pulse Voltammetry Behaviors of CGA at MWCNTs/SPE
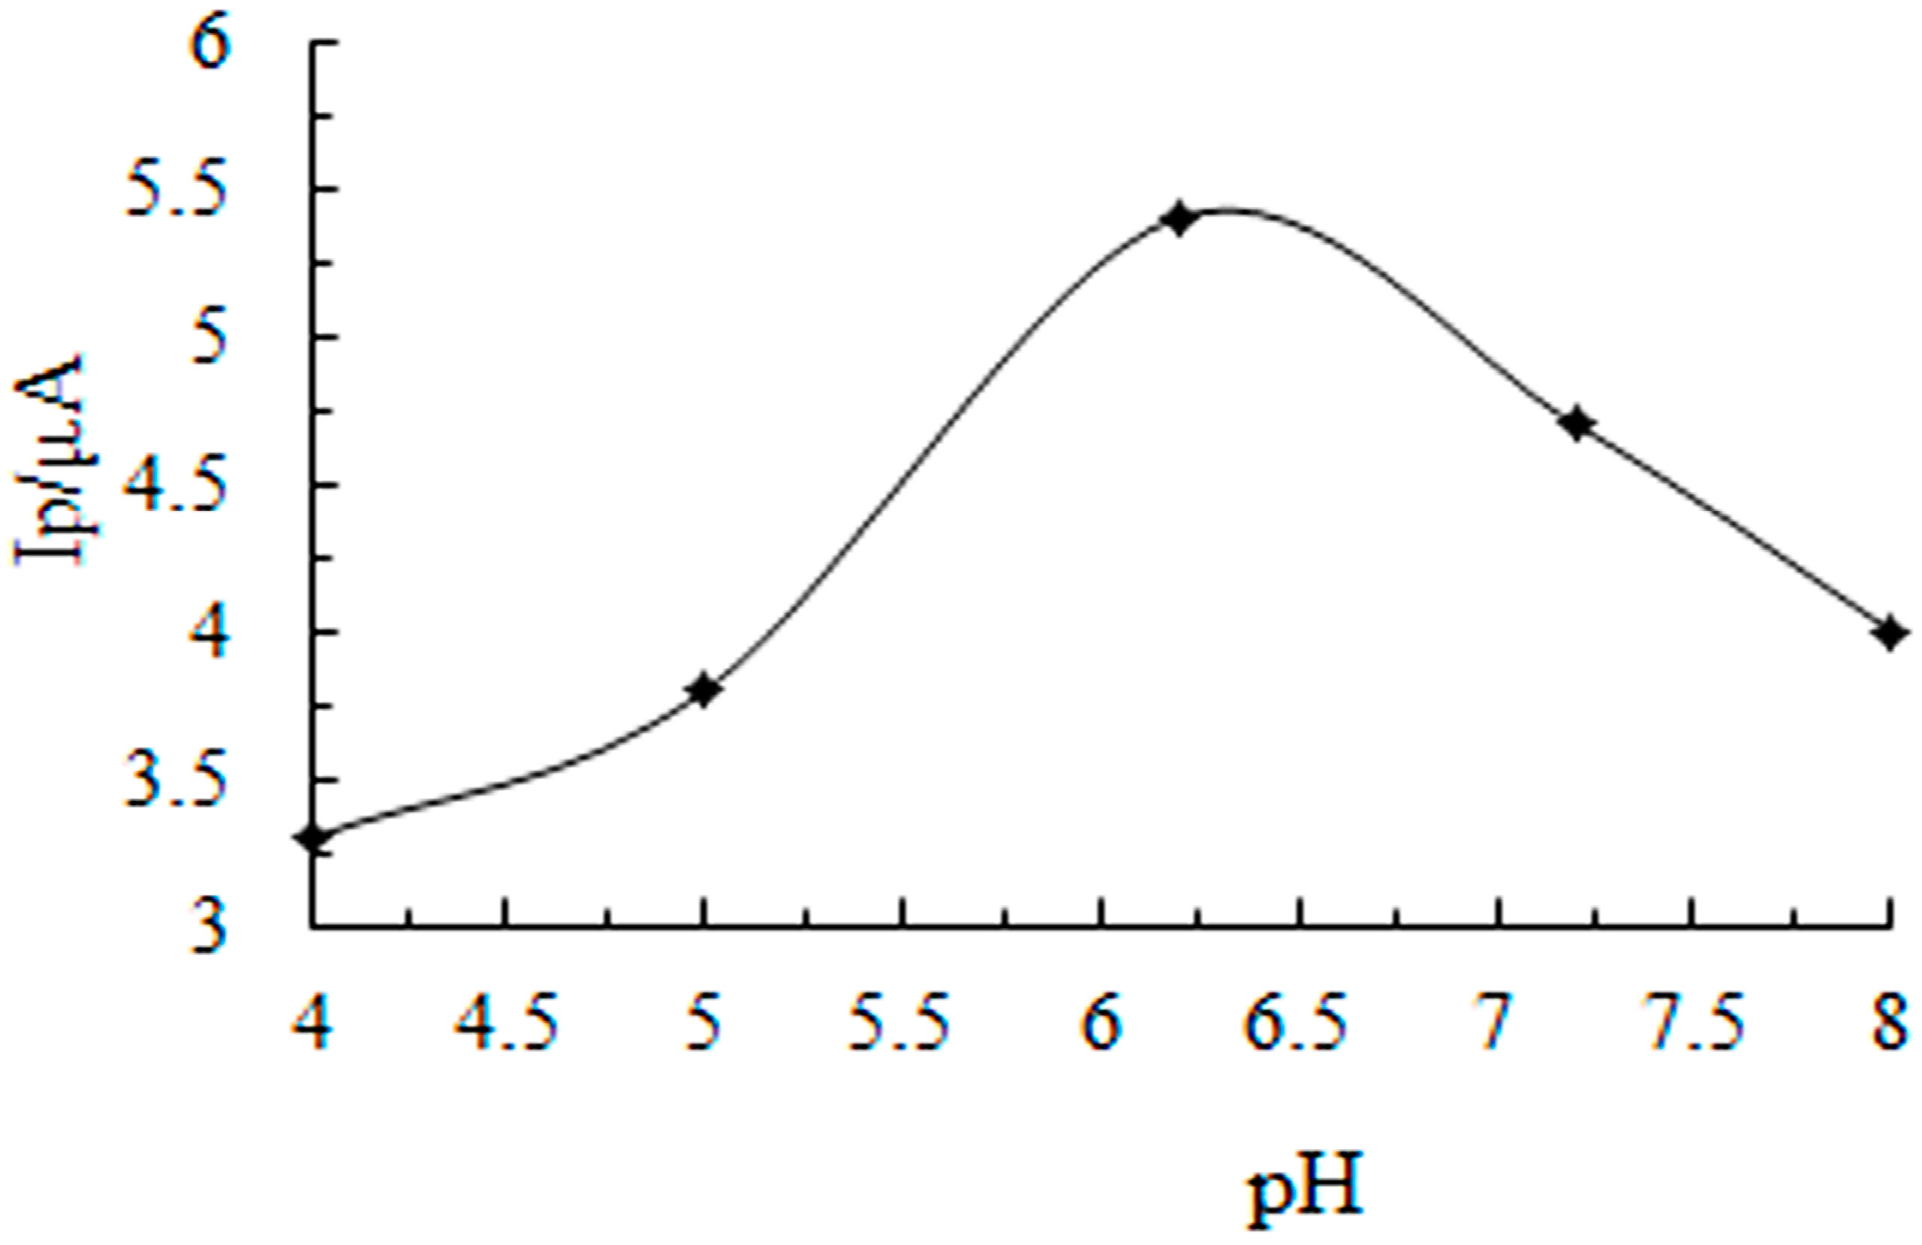
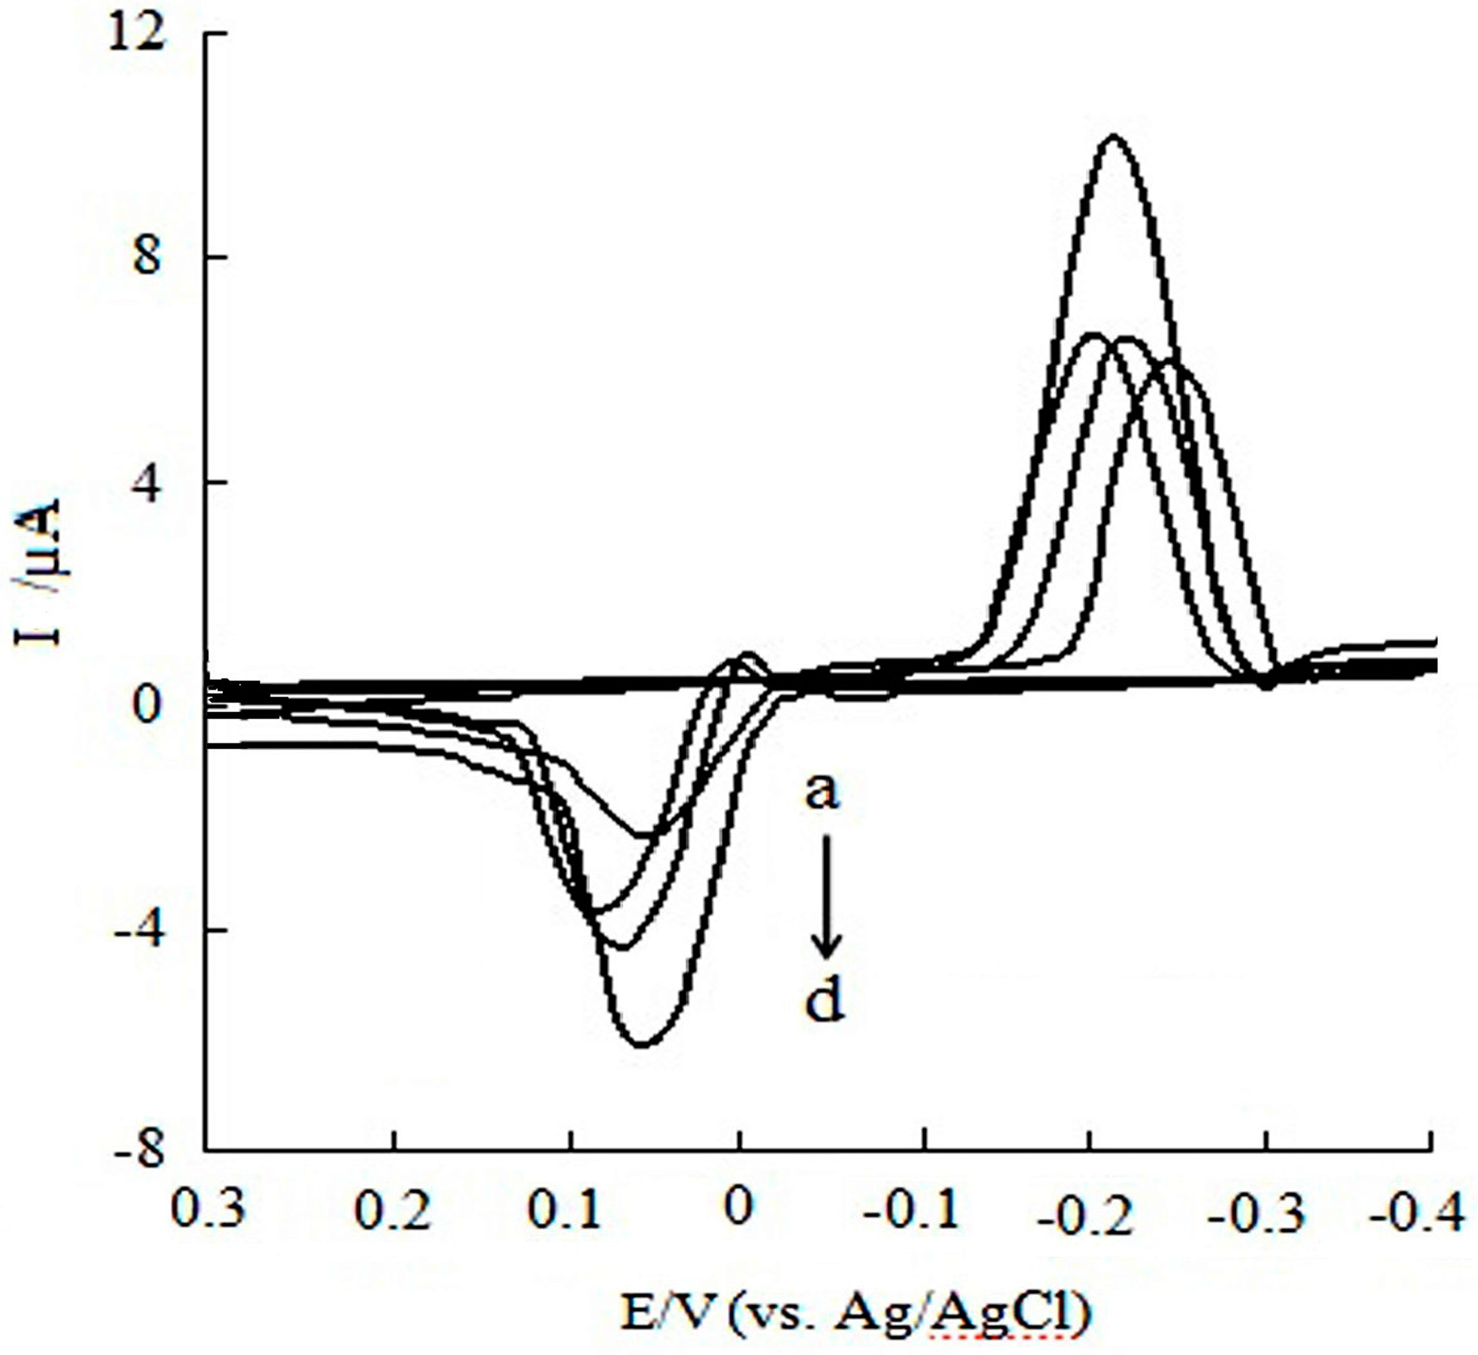
3.2. Influence of Supporting Electrolyte and pH
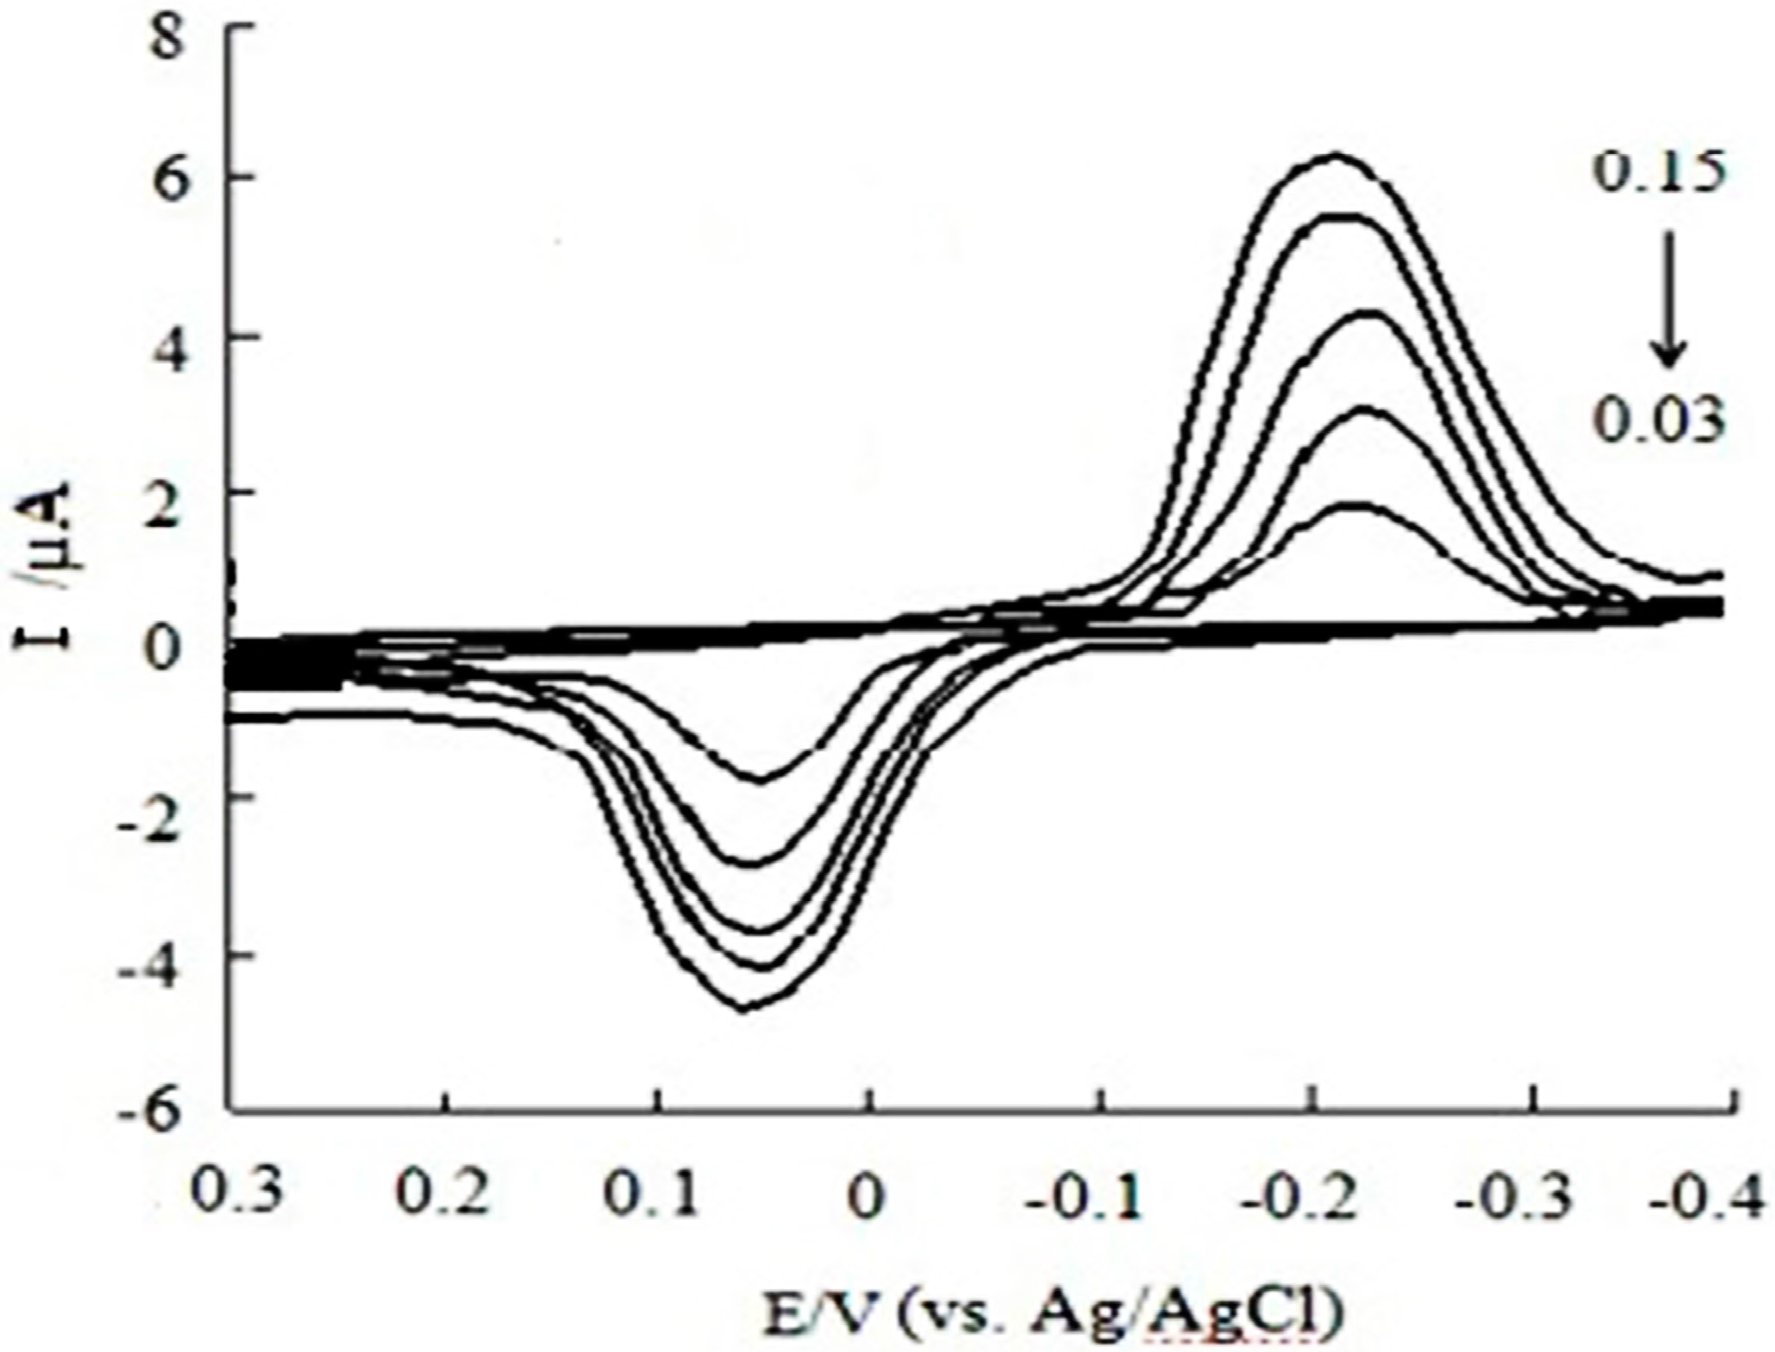
3.3. Influence of the Scan Rate
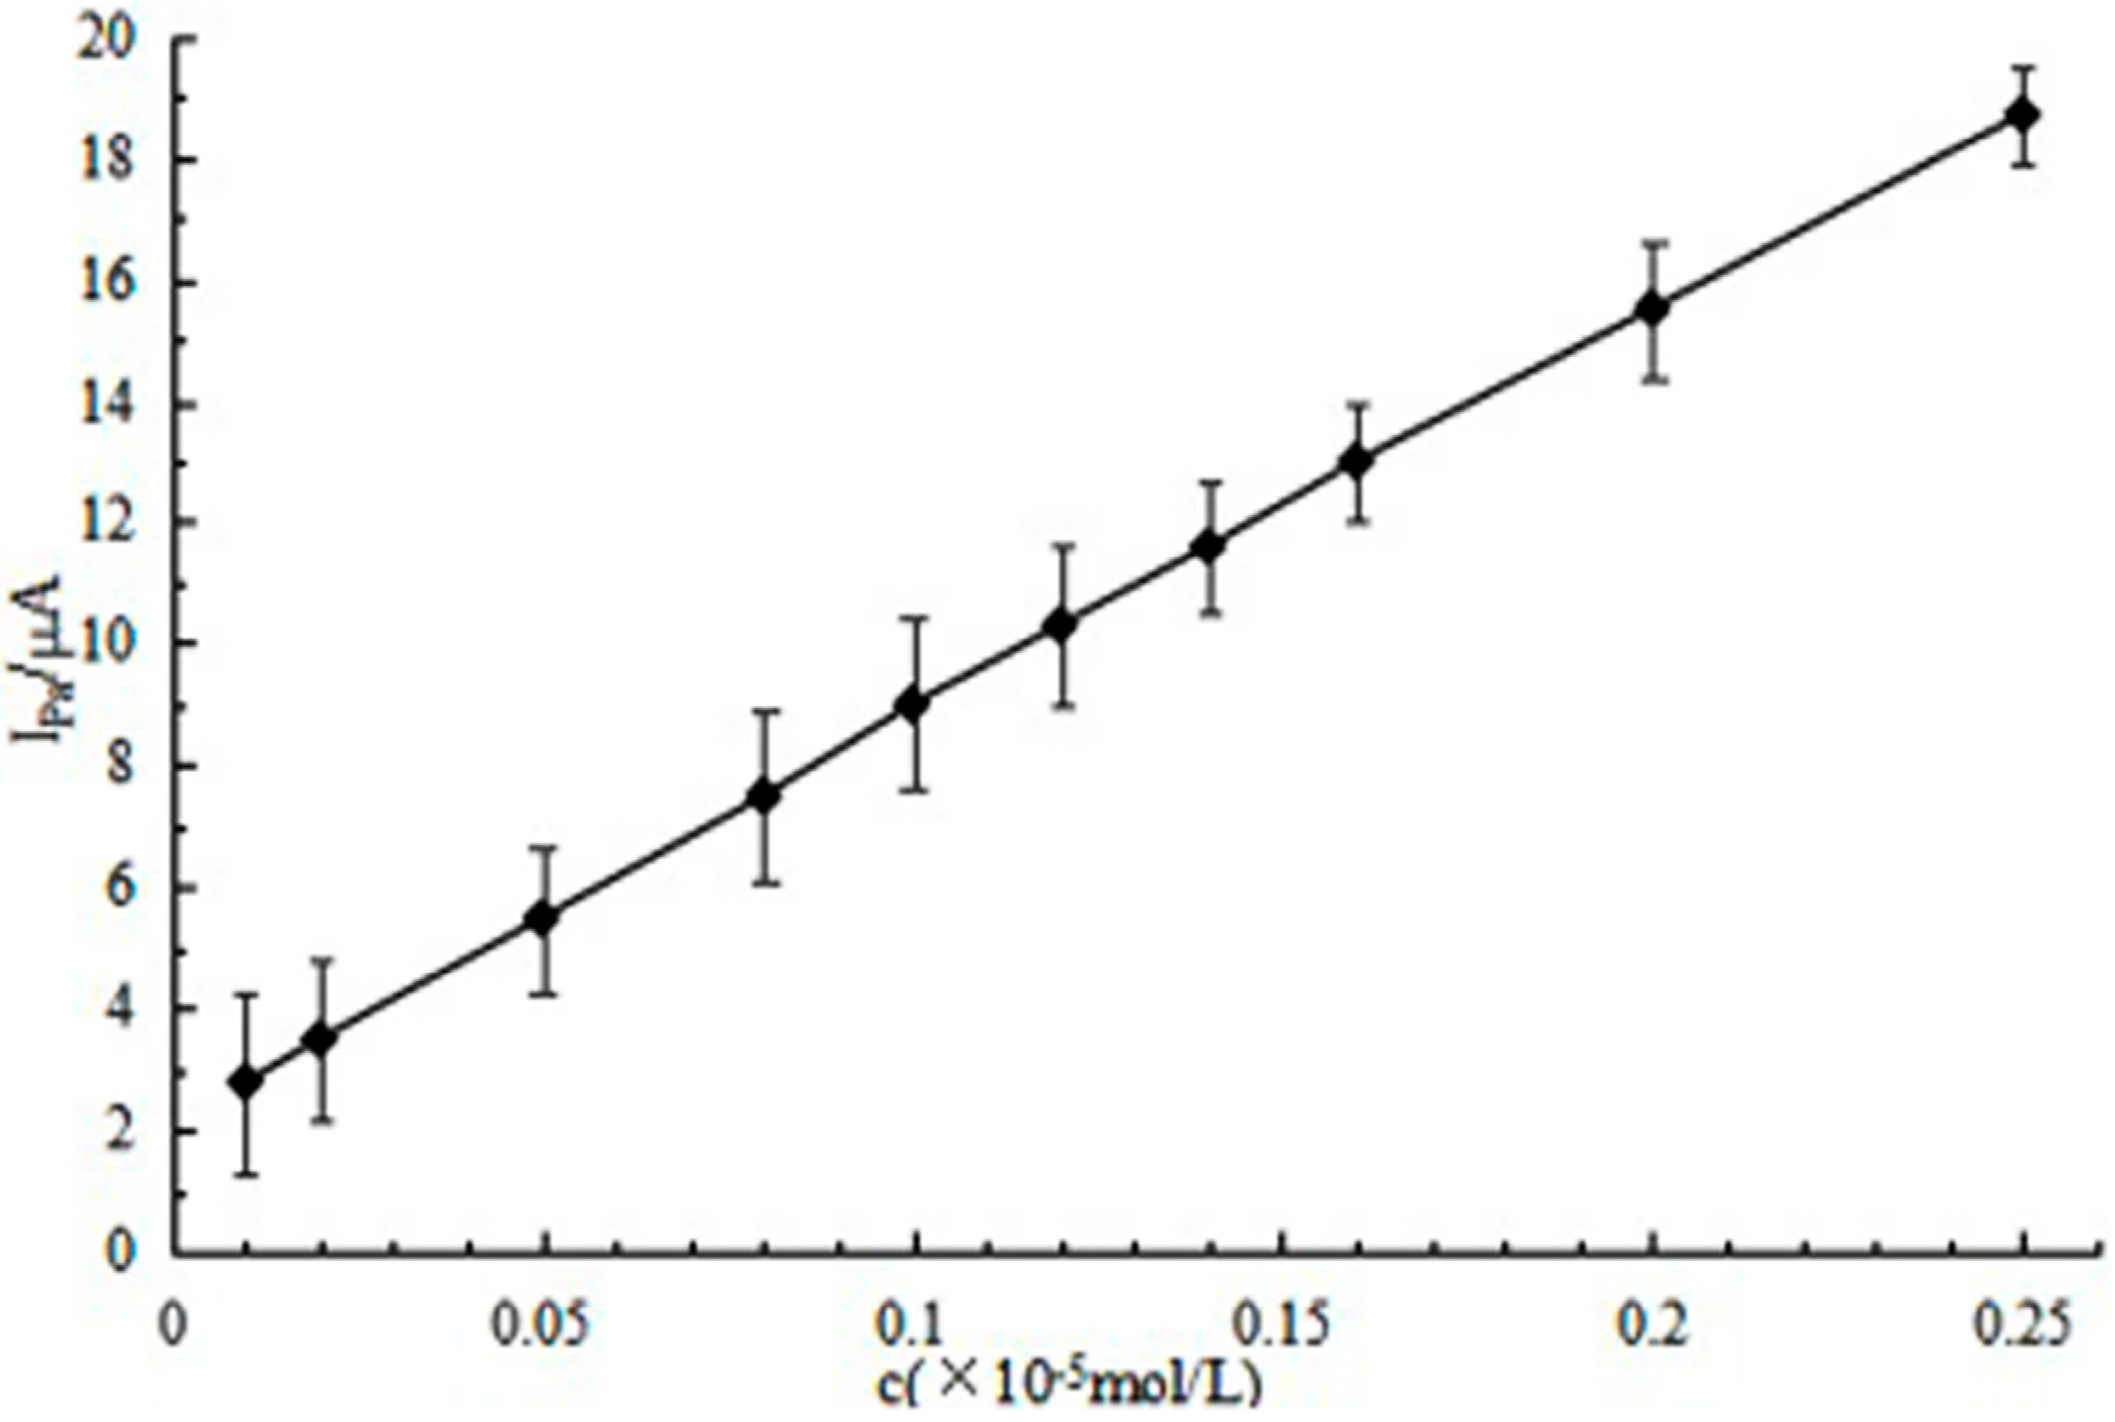
3.4. The Linear Range and Detection Limit
3.5. Determination of CGA in Green Coffee Bean
4. Conclusions
Acknowledgments
Author Contributions
Conflicts of Interest
References
- Leopoldini, M.; Russo, N.; Toscano, M. The molecular basis of working mechanism of natural polyphenolic antioxidants. Food Chem. 2011, 125, 288–306. [Google Scholar] [CrossRef]
- Adriana, F.; Tomas, D.O. Effect of roasting on the formation of chlorogenic acid lactones in coffee. J. Agric. Food Chem. 2005, 53, 1505–1513. [Google Scholar]
- Alvarez, J.L.; Wijngaard, H.; Arendt, E.K. Polyphenol composition and in vitro, antioxidant activity of amaranth, quinoa buckwheat and wheat as affected by sprouting and baking. Food Chem. 2010, 119, 770–778. [Google Scholar] [CrossRef]
- Mussatto, S.I.; Machado, E.M.S.; Martins, S.; Teixeira, J.A. Production, Composition, and Application of Coffee and Its Industrial Residues. Food Bioprocess Technol. 2011, 4, 661–672. [Google Scholar] [CrossRef] [Green Version]
- Weisz, G.M.; Schneider, L.; Schweiggert, U.; Kammerer, D.R.; Carleal, R. Sustainable sunflower processing—I. Development of a process for the adsorptive decolorization of sunflower [Helianthus annuus, L.] protein extracts. Innov. Food Sci. Emerg. Technol. 2010, 11, 733–741. [Google Scholar] [CrossRef]
- Upadhyay, R.; Mohan, R.L.J. An outlook on chlorogenic acids-occurrence, chemistry, technology, and biological activities. Crit. Rev. Food Sci. Nutr. 2013, 53, 968–984. [Google Scholar] [CrossRef] [PubMed]
- Butt, M.S.; Sultan, M.T. Coffee and its Consumption: Benefits and Risks. Crit. Rev. Food Sci. Nutr. 2011, 51, 363–373. [Google Scholar] [CrossRef] [PubMed]
- Hurtado-Fernández, E.; Gómez-Romero, M.; Carrasco-Pancorbo, A.; Fernández-Gutiérrez, A. Application and potential of capillary electroseparation methods to determine antioxidant phenolic compounds from plant food material. J. Pharm. Biomed. Anal. 2010, 53, 1130–1160. [Google Scholar] [CrossRef] [PubMed]
- Dmitrienko, S.G.; Kudrinskaya, V.A.; Apyari, V.V. Methods of extraction, preconcentration, and determination of quercetin. J. Anal. Chem. 2012, 67, 299–311. [Google Scholar] [CrossRef]
- Zarrin, E.; Golsefidi, M.A.; Saify, A.; Tanha, A.A.; Rezaeifaral, Z. Carbon nanotube reinforced hollow fiber solid/liquid phase microextraction: A novel extraction technique for the measurement of caffeic acid in Echinacea purpurea, herbal extracts combined with high-performance liquid chromatography. J. Chromatogr. A 2010, 1217, 2768–2775. [Google Scholar]
- Barroso, M.F.; De-Los-Santos-Álvarez, N.; Delerue-Matos, C.; Oliveira, M.B.P.P. Towards a reliable technology for antioxidant capacity and oxidative damage evaluation: Electrochemical (bio)sensors. Biosens. Bioelectron. 2011, 30, 1–12. [Google Scholar] [CrossRef] [PubMed]
- Yola, M.L.; Atar, N.; Üstündağ, Z.; Solak, A.O. A novel voltammetric sensor based on p-aminothiophenol functionalized graphene oxide/gold nanoparticles for determining quercetin in the presence of ascorbic acid. J. Electroanal. Chem. 2013, 698, 9–16. [Google Scholar] [CrossRef]
- Apetrei, C.; Alessio, P.; Constantino, C.J.L.; Saja, J.A.D.; Rodriguez-Mendez, M.L. Biomimetic biosensor based on lipidic layers containing tyrosinase and lutetium bisphthalocyanine for the detection of antioxidants. Biosens. Bioelectron. 2011, 26, 2513–2519. [Google Scholar] [CrossRef] [PubMed] [Green Version]
- Abou Samra, M.; Sanda Chedea, V.; Economou, A.; Calokerinos, A.; Kefalas, P. Antioxidant/prooxidant properties of model phenolic compounds: Part I. Studies on equimolar mixtures by chemiluminescence and cyclic voltammetry. Food Chem. 2011, 125, 622–629. [Google Scholar] [CrossRef]
- Rawson, F.J.; Jackson, S.K.; Hart, J.P. Voltammetric Behavior of DNA and Its Derivatives Using Screen Printed Carbon Electrodes and Its Possible Application in Genotoxicity Screening. Anal. Lett. 2010, 43, 1790–1800. [Google Scholar] [CrossRef]
- Honeychurch, K.C.; Hart, J.P.; Cowell, D.C.; Arriganal, D.W.M. Voltammetric studies of lead at calixarene modified screen-printed carbon electrodes and its trace determination in water by stripping voltammetry. Sens. Actuators B Chem. 2001, 77, 642–652. [Google Scholar] [CrossRef]
- Tan, F.; Metters, J.P.; Banks, C.E. Electroanalytical applications of screen printed microelectrode arrays. Sens. Actuators B Chem. 2013, 181, 454–462. [Google Scholar] [CrossRef]
- Wang, J.; Pedrero, M.; Pamidi, P.V.A.; Caial, X. Metal-dispersed screen-printed carbon electrodes. Electroanalysis 1995, 7, 1032–1034. [Google Scholar] [CrossRef]
- Bandodkar, A.J.; Hung, V.W.; Jia, W.; Valdés-Ramírez, G.; Windmiller, J.R. Tattoo-based potentiometric ion-selective sensors for epidermal pH monitoring. Analyst 2013, 138, 123–128. [Google Scholar] [CrossRef] [PubMed]
- Washe, A.P.; Lozano, P. Facile and versatile approaches to enhancing electrochemical performance of screen printed electrodes. Electrochim. Acta 2013, 91, 166–172. [Google Scholar] [CrossRef]
- Gao, J. The Electrochemical Analysis of Cadmium in Choline Chloride/Urea Deep Eutectic Solvent Electrolyte at Carbon Nanotubes Modified Electrode. Int. J. Electrochem. Sci. 2016, 11, 6306–6314. [Google Scholar] [CrossRef]
- Zhu, J.; Xi, Q.; Yangal, W. A high performance electrochemical sensor for acetaminophen based on single-walled carbon nanotube–graphene nanosheet hybrid films. Sens. Actuators B Chem. 2012, 161, 648–654. [Google Scholar]
- Jain, R.; Rather, J.A. Voltammetric determination of antibacterial drug gemifloxacin in solubilized systems at multi-walled carbon nanotubes modified glassy carbon electrode. Colloids Surf. B 2011, 83, 340–346. [Google Scholar] [CrossRef] [PubMed]
- Dogan-Topal, B.; Bozal-Palabıyık, B.; Uslu, B.; Ozkanal, S.A. Multi-walled carbon nanotube modified glassy carbon electrode as a voltammetric nanosensor for the sensitive determination of anti-viral drug valganciclovir in pharmaceuticals. Sens. Actuators B Chem. 2013, 177, 841–847. [Google Scholar] [CrossRef]
- Liu, M.; Xiang, J.; Zhou, J.; Ding, H. A disposable amperometric sensor for rapid detection of serotonin in the blood and brain of the depressed mice based on Nafion membrane-coated colloidal gold screen-printed electrode. J. Electroanal. Chem. 2010, 640, 1–7. [Google Scholar] [CrossRef]
- Lee, G.W.; Kim, J.; Yoon, J.; Bae, J.S.; Shin, B.C. Structural characterization of carboxylated multi-walled carbon nanotubes. Thin Solid Films 2008, 516, 5781–5784. [Google Scholar] [CrossRef]
- Tan, P.; Zhang, S.L.; Yue, K.T.; Huang, F.; Shi, Z. Comparative Raman Study of Carbon Nanotubes Prepared by D.C. Arc Discharge and Catalytic Methods. J. Raman Spectrosc. 1997, 28, 369–372. [Google Scholar] [CrossRef]
- Li, W.; Zhang, H.; Wang, C.; Zhang, Y.; Xu, L. Raman characterization of aligned carbon nanotubes produced by thermal decomposition of hydrocarbon vapor. Appl. Phys. Lett. 1997, 70, 2684–2686. [Google Scholar] [CrossRef]
- Zhang, L.; Li, Y.; Zhang, L.; Li, D.W.; Karpuzoval, D. Electrocatalytic Oxidation of NADH on Graphene Oxide and Reduced Graphene Oxide Modified Screen-Printed Electrode. Int. J. Electrochem. Sci. 2011, 6, 819–829. [Google Scholar]
- Ye, L.; Xiang, M.; Zhang, Y.; Luo, L.; Gao, Y. A Novel Electrochemical Method for Sensitive Detection of Anticancer Drug Picoplatin with Graphene Multi-walled Carbon Nanotubes Modified Glassy Carbon Electrode. Int. J. Electrochem. Sci. 2013, 8, 12726–12734. [Google Scholar]
- Belay, A.; Gholap, A.V. Characterization and determination of chlorogenic acid (CGA) in coffee beans by UV-Vis spectroscopy. Afr. J. Pure Appl. Chem. 2009, 3, 234–240. [Google Scholar]
- Han, S. Capillary electrophoresis with chemiluminescence detection of rutin and chlorogenic acid based on its enhancing effect for the luminol-ferricyanide system. Anal. Sci. 2005, 21, 1371–1374. [Google Scholar] [CrossRef] [PubMed]
- Zhang, Q.; Li, J.; Wang, C.; Sun, W.; Zhang, Z. A gradient HPLC method for the quality control of chlorogenic acid, linarin and luteolin in Flos Chrysanthemi Indici, suppository. J. Pharm. Biomed. Anal. 2007, 43, 753–757. [Google Scholar] [CrossRef] [PubMed]
- Ludwig, I.A.; Peña, M.P.; Cid, C.; Crozier, A. Catabolism of coffee chlorogenic acids by human colonic microbiota. Biofactors 2013, 39, 623–632. [Google Scholar] [CrossRef] [PubMed]
- Upadhyay, R.; Ramalakshmi, K.; Rao, L.J.M. Microwave-assisted extraction of chlorogenic acids from green coffee beans. Food Chem. 2012, 130, 184–188. [Google Scholar] [CrossRef]


| Measurement Methods | Linear Range (μg/mL) | Detection Limit (μg/mL) | References |
|---|---|---|---|
| UV-Vis spectroscopy | 10.7−39.0 | 16 | [29] |
| Capillary electrophoresis with chemiluminescence | 1.10−110 | 0.5 | [30] |
| HPLC | 0.8−20.0 | 0.32 | [31] |
| Square-wave voltammetry | 1.77−17.7 | 0.27 | [32] |
| Differential pulse voltammetry (DPV) using a MWCNTs/SPE | 0.17−15.8 | 0.12 | this method |
| CGA Sample | By This Method | Added (mg/g) | Found (mg/g) | Recovery (%) | By HPLC * (mg/g) | |
|---|---|---|---|---|---|---|
| (mg/g) | RSD (%) | |||||
| 1 | 13.23 | 4.77 | 10.00 | 24.11 | 106.65 | 14.71 |
| 2 | 21.12 | 3.14 | 10.00 | 30.01 | 94.74 | 19.78 |
| 3 | 25.21 | 2.47 | 10.00 | 36.03 | 103.25 | 23.92 |
| 4 | 18.74 | 1.33 | 10.00 | 28.92 | 100.96 | 19.03 |
© 2016 by the authors; licensee MDPI, Basel, Switzerland. This article is an open access article distributed under the terms and conditions of the Creative Commons Attribution (CC-BY) license (http://creativecommons.org/licenses/by/4.0/).
Share and Cite
Ma, X.; Yang, H.; Xiong, H.; Li, X.; Gao, J.; Gao, Y. Electrochemical Behavior and Determination of Chlorogenic Acid Based on Multi-Walled Carbon Nanotubes Modified Screen-Printed Electrode. Sensors 2016, 16, 1797. https://doi.org/10.3390/s16111797
Ma X, Yang H, Xiong H, Li X, Gao J, Gao Y. Electrochemical Behavior and Determination of Chlorogenic Acid Based on Multi-Walled Carbon Nanotubes Modified Screen-Printed Electrode. Sensors. 2016; 16(11):1797. https://doi.org/10.3390/s16111797
Chicago/Turabian StyleMa, Xiaoyan, Hongqiao Yang, Huabin Xiong, Xiaofen Li, Jinting Gao, and Yuntao Gao. 2016. "Electrochemical Behavior and Determination of Chlorogenic Acid Based on Multi-Walled Carbon Nanotubes Modified Screen-Printed Electrode" Sensors 16, no. 11: 1797. https://doi.org/10.3390/s16111797