
Performance Evaluation and Community Application of Low-Cost Sensors for Ozone and Nitrogen Dioxide

Abstract
:1. Introduction
2. Materials and Methods
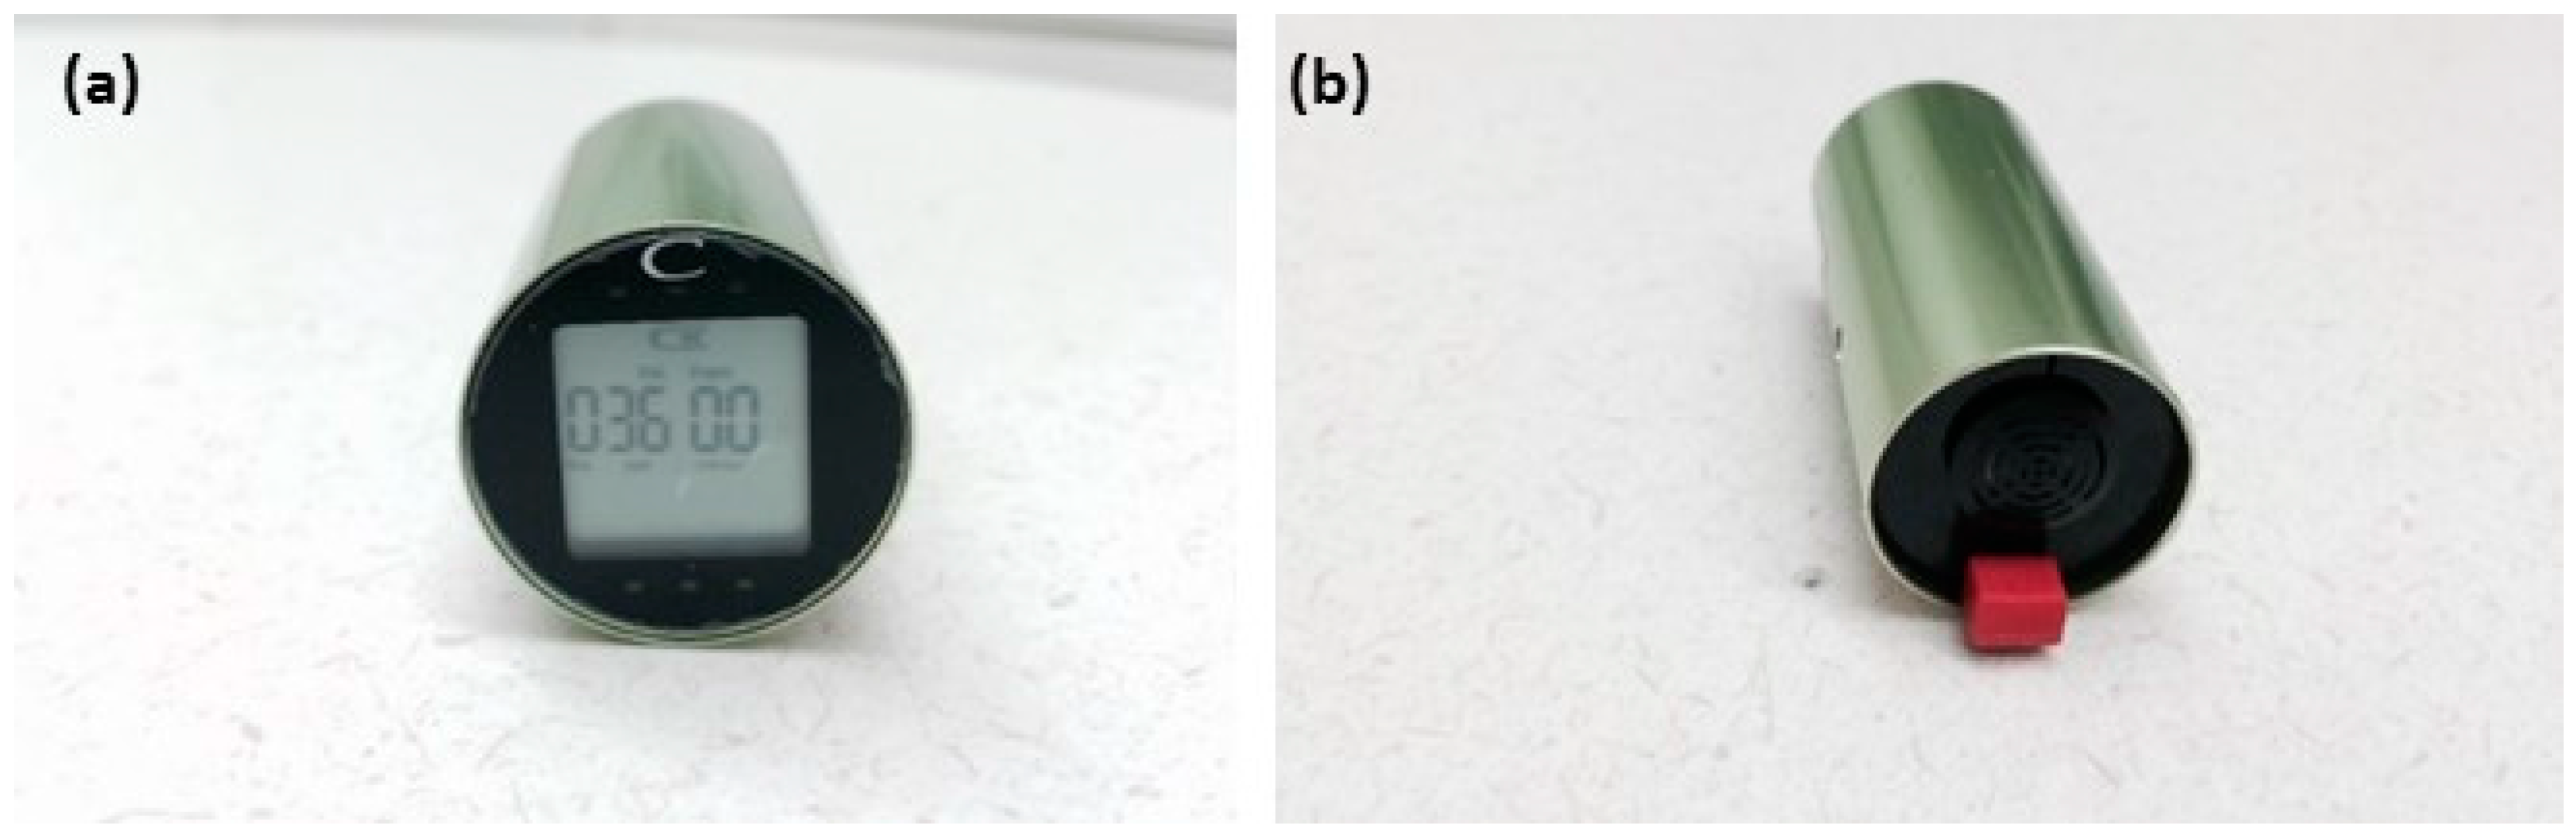
2.1. Instrumentation
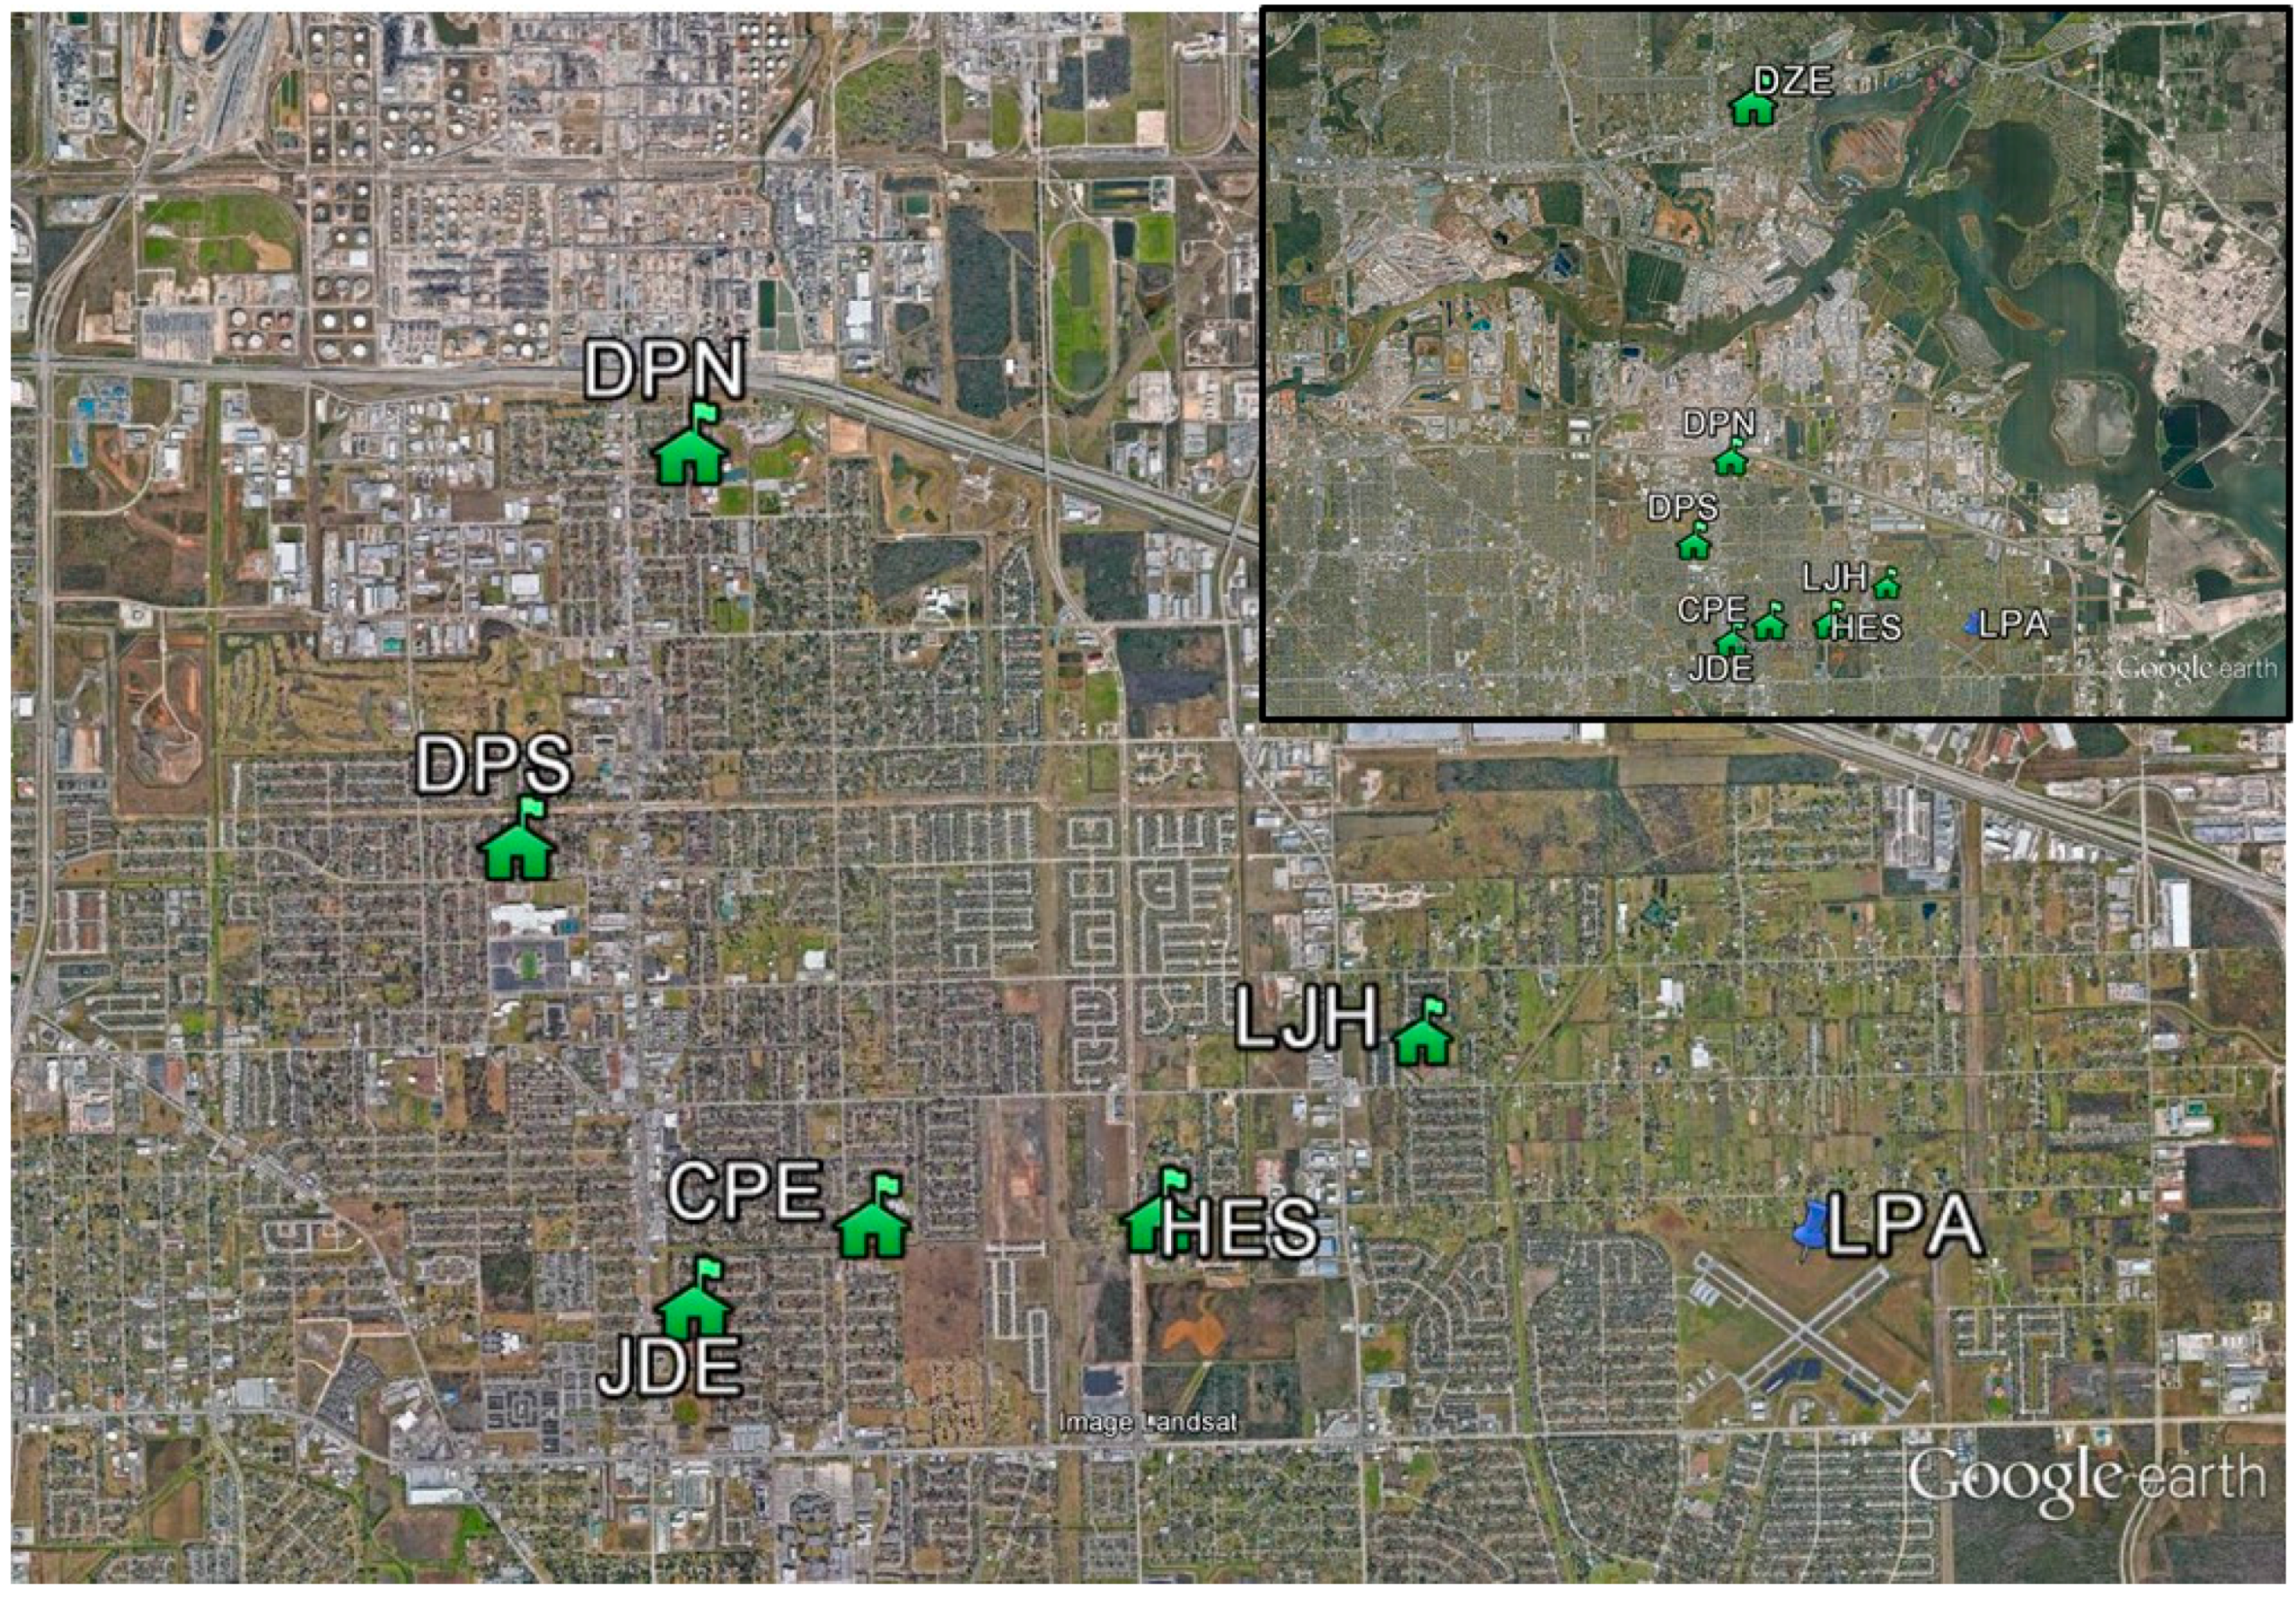
2.2. Measurement Sites During the Houston Campaign
2.2.1. Performance Evaluation Site
2.2.2. Citizen Science Sites
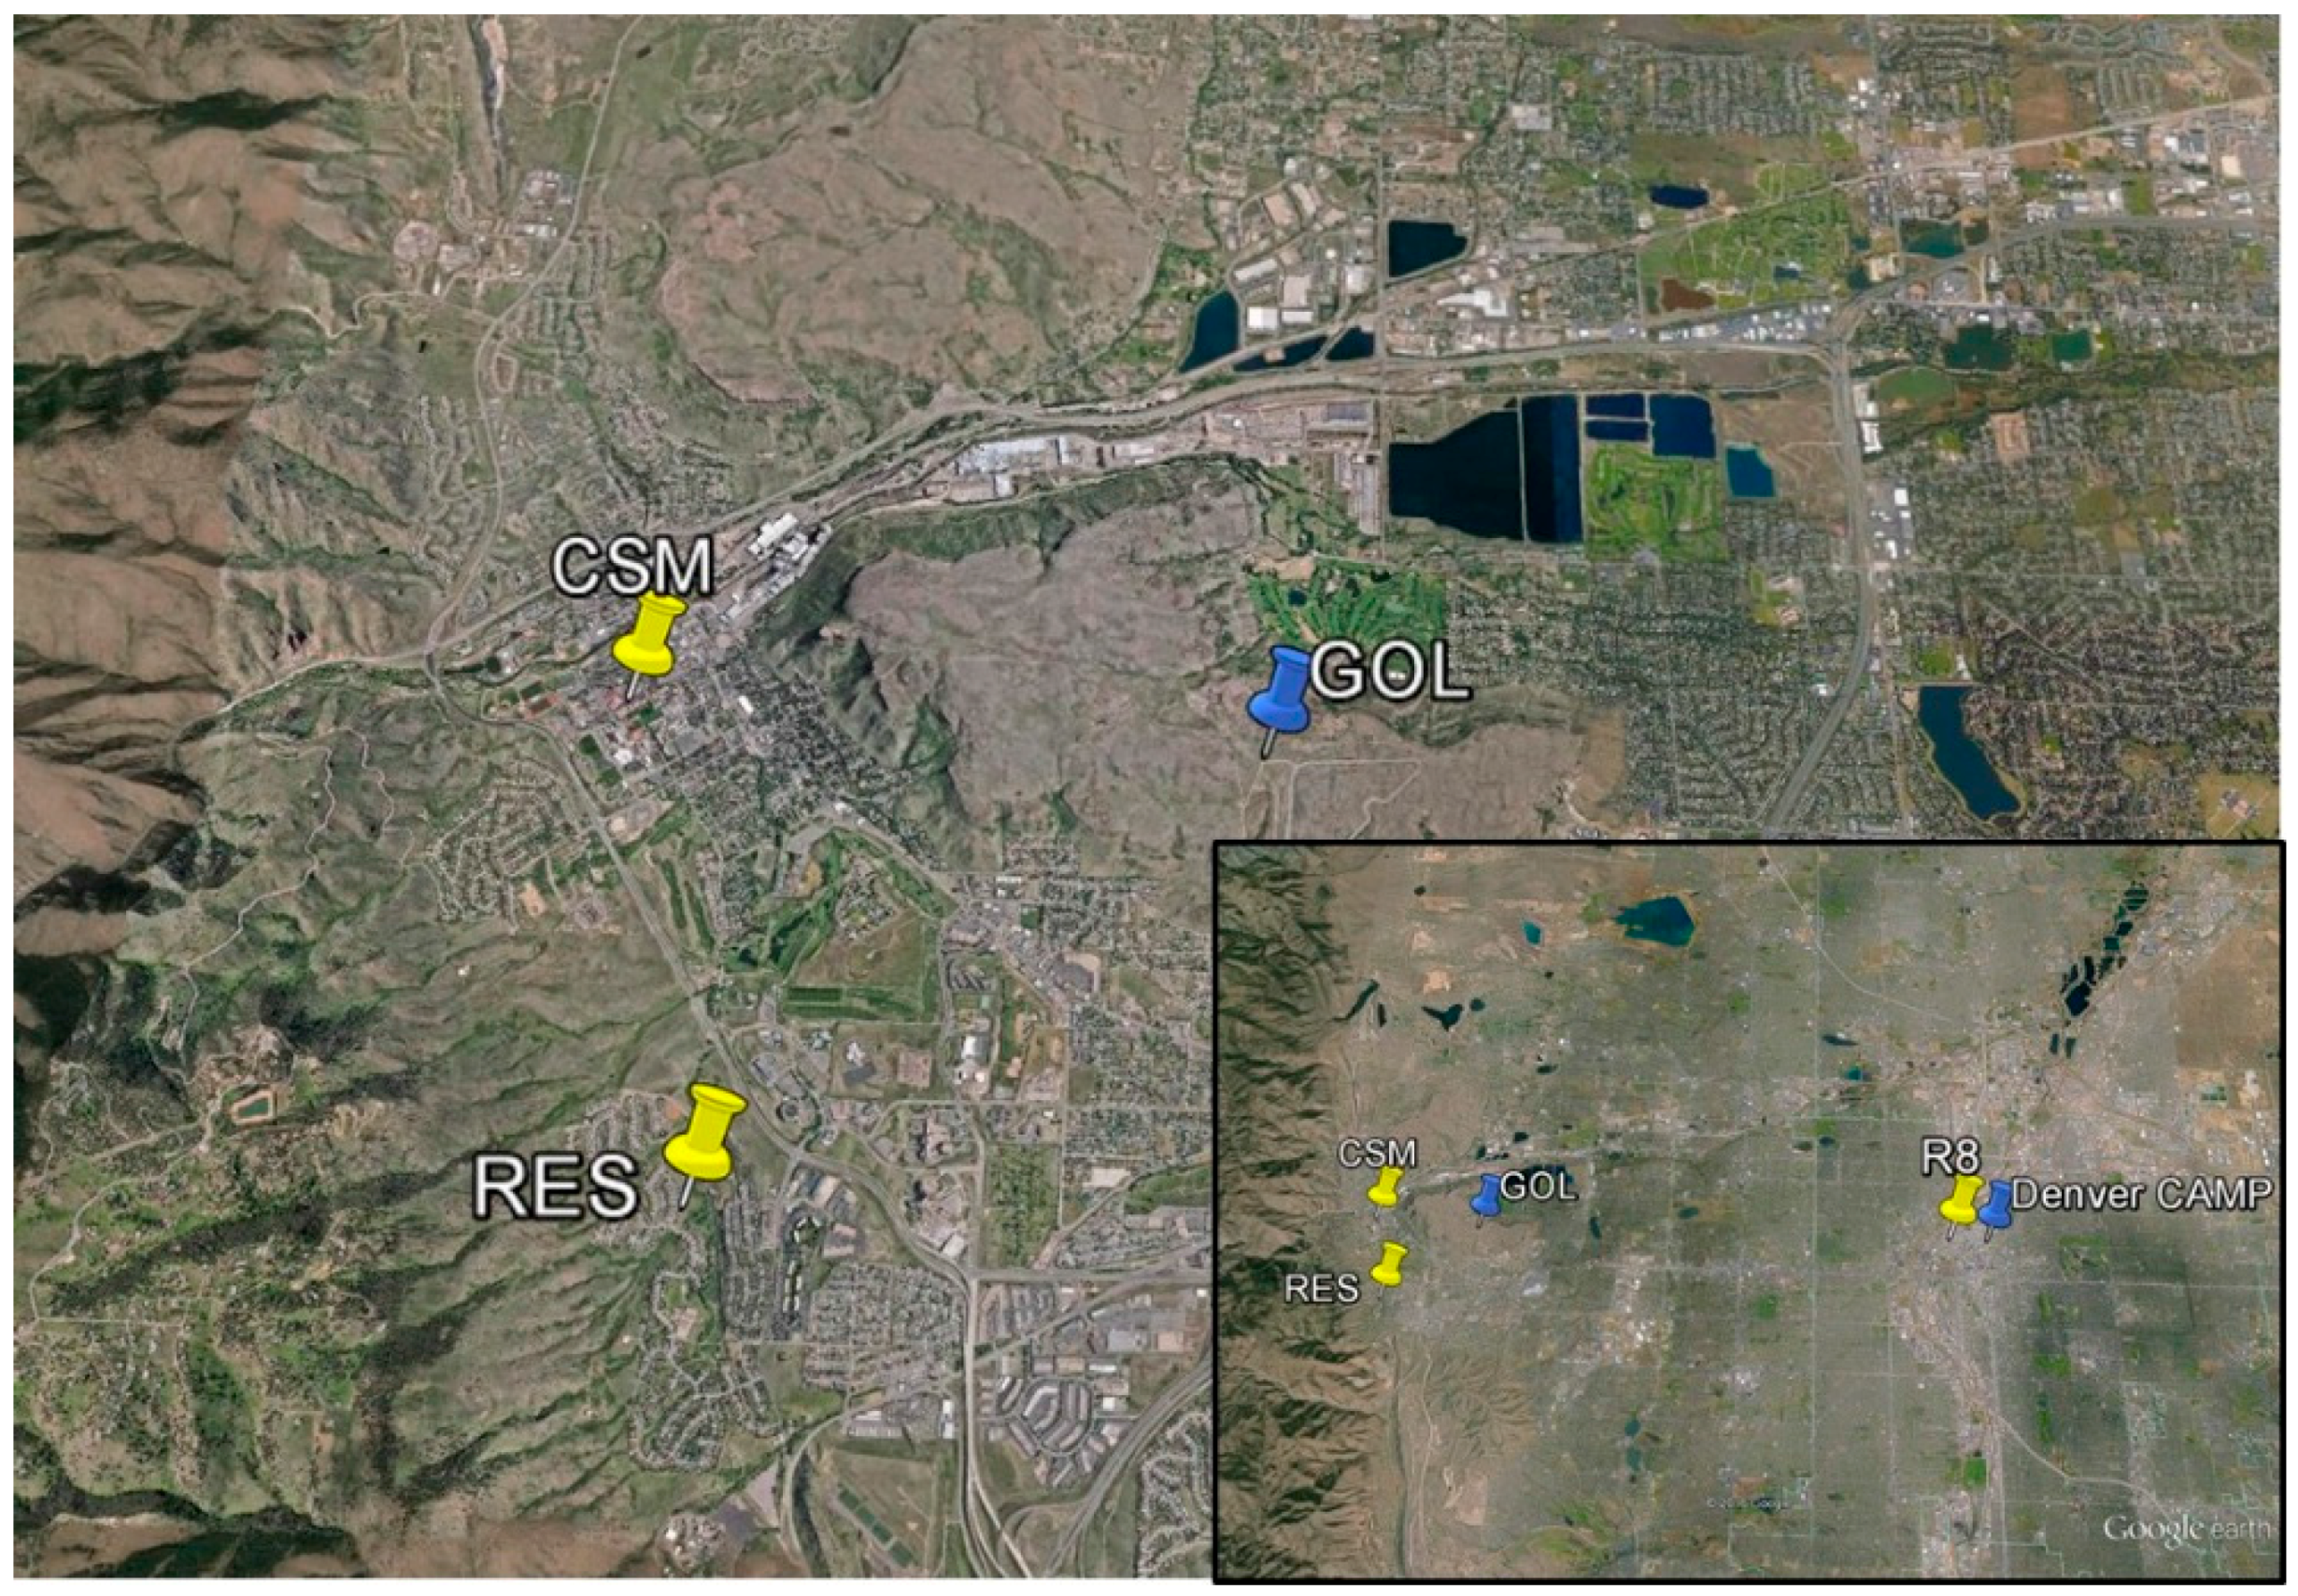
2.3. Measurement Sites During the Denver Campaign
2.3.1. Performance Evaluation Site
2.3.2. Citizen Science Sites
2.4. Data Analysis
3. Results and Discussion
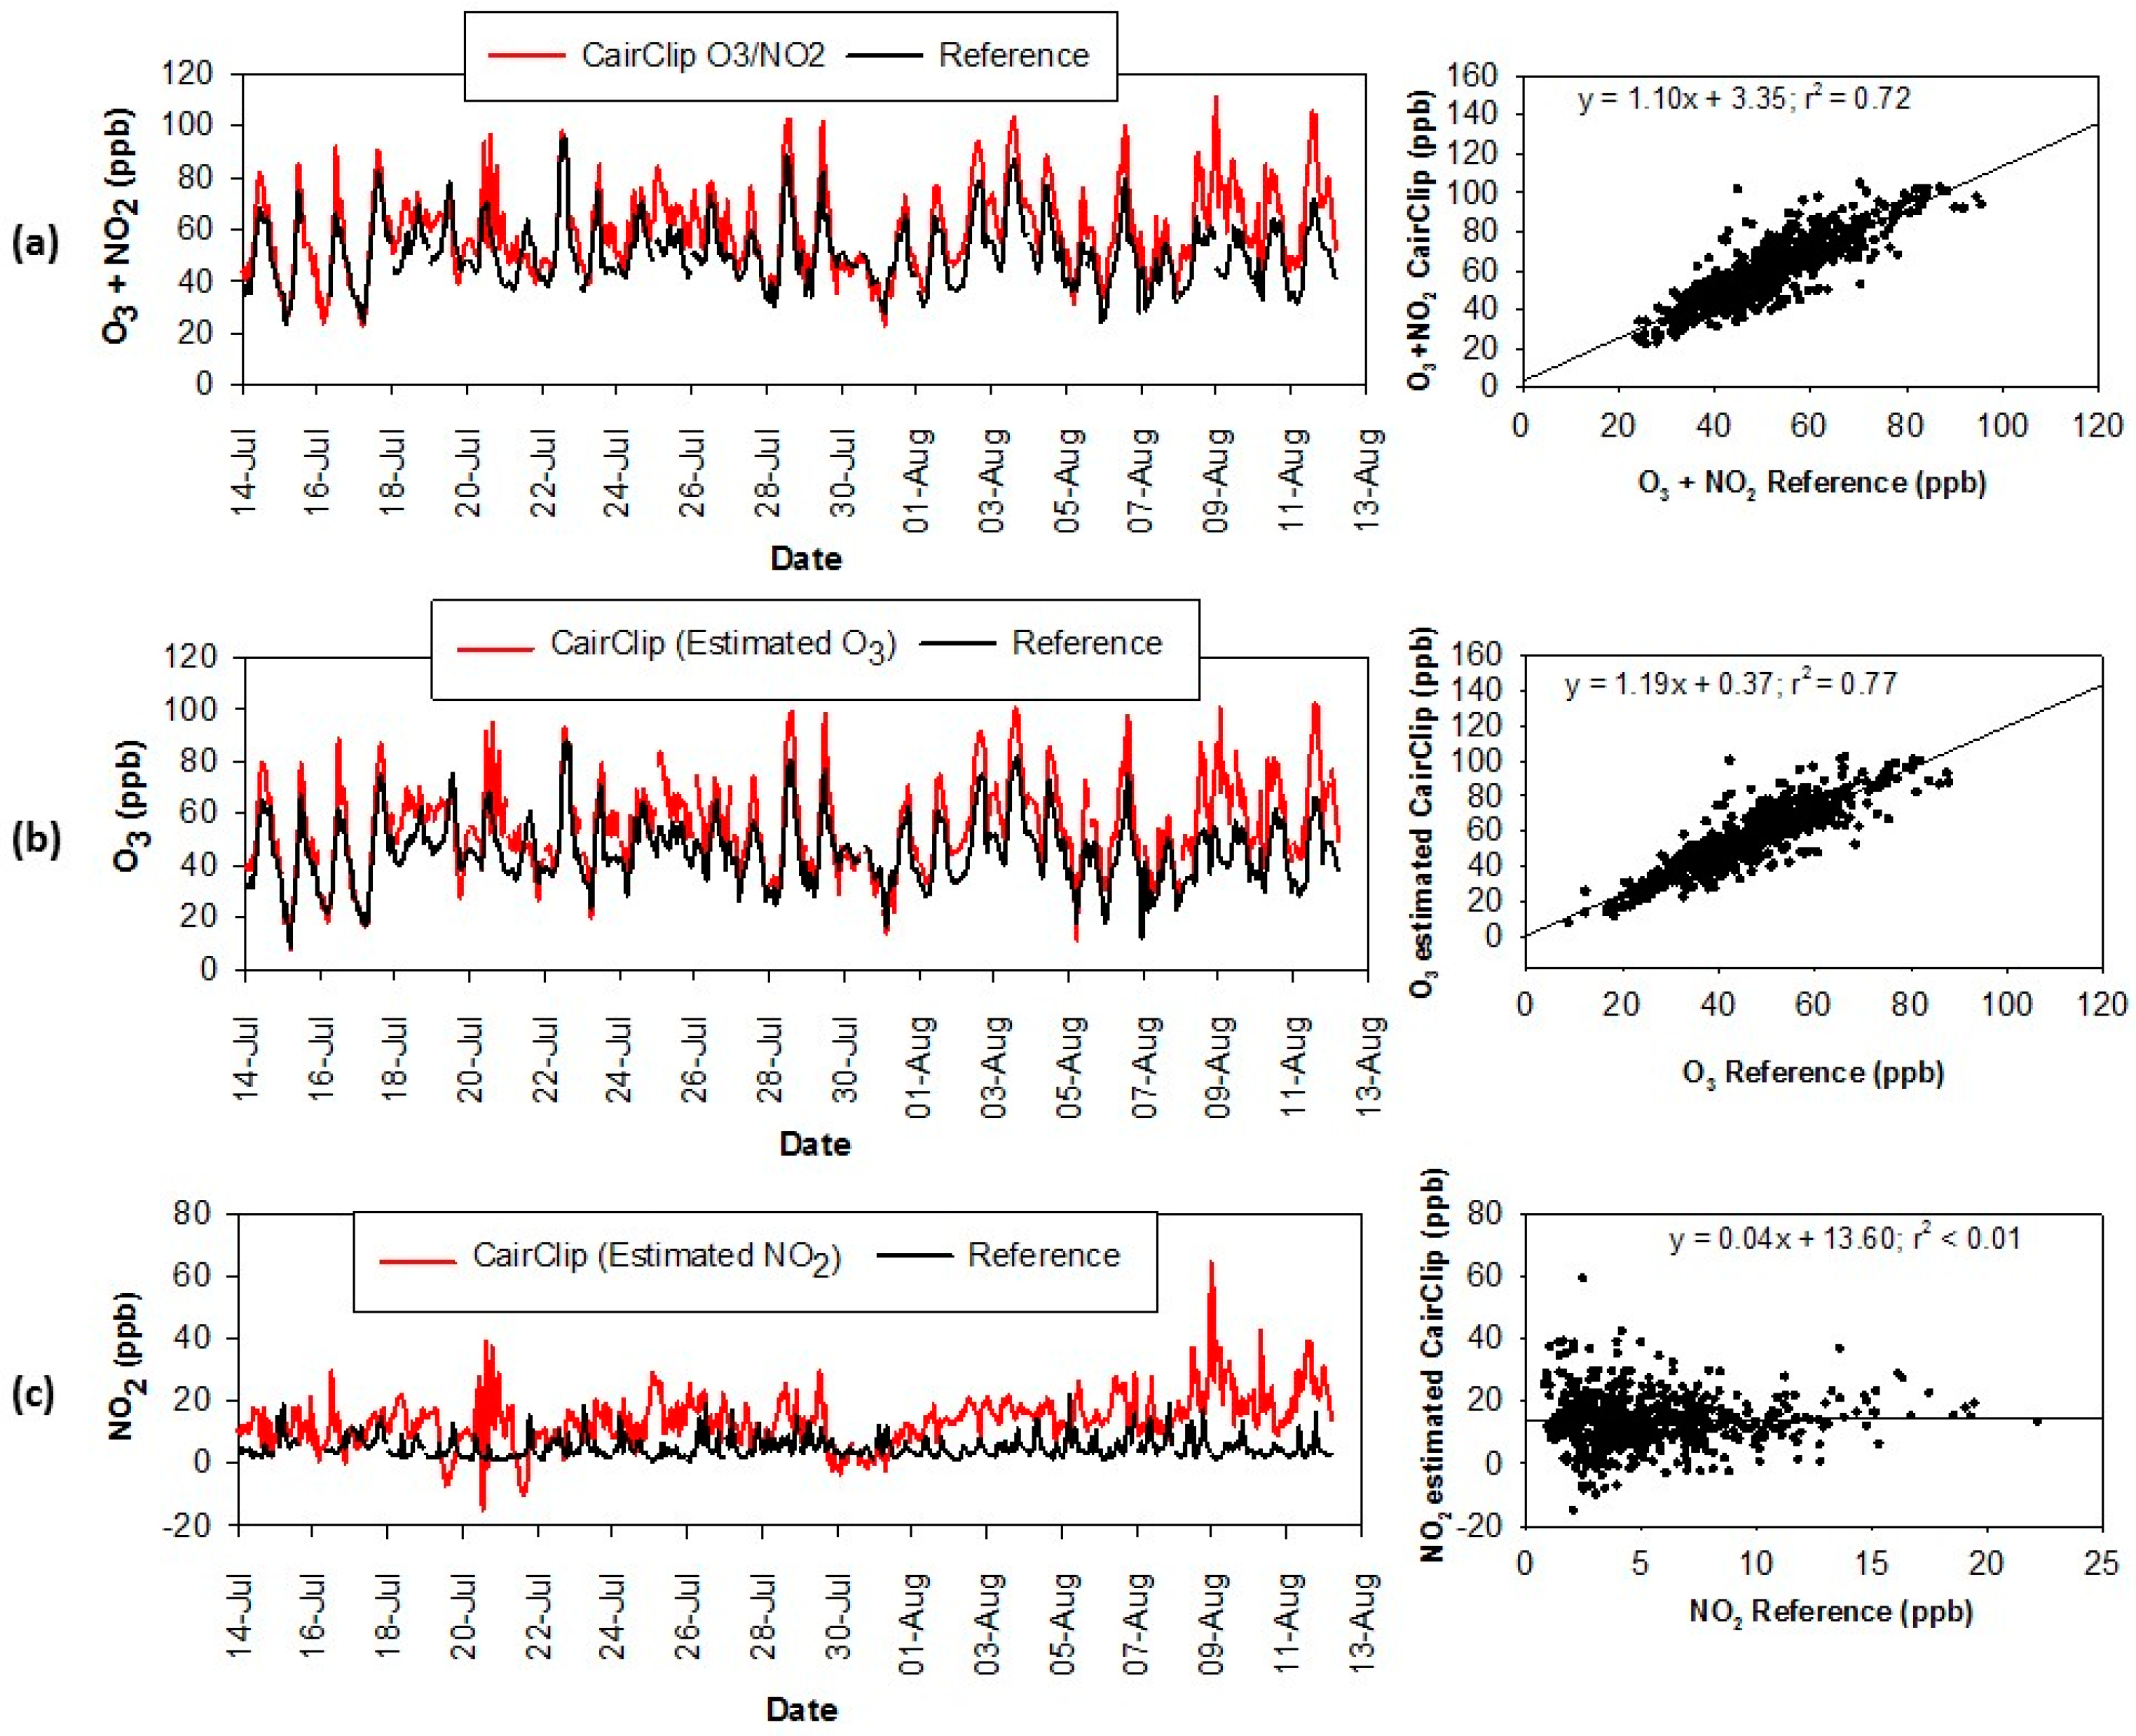
3.1. Performance Evaluation
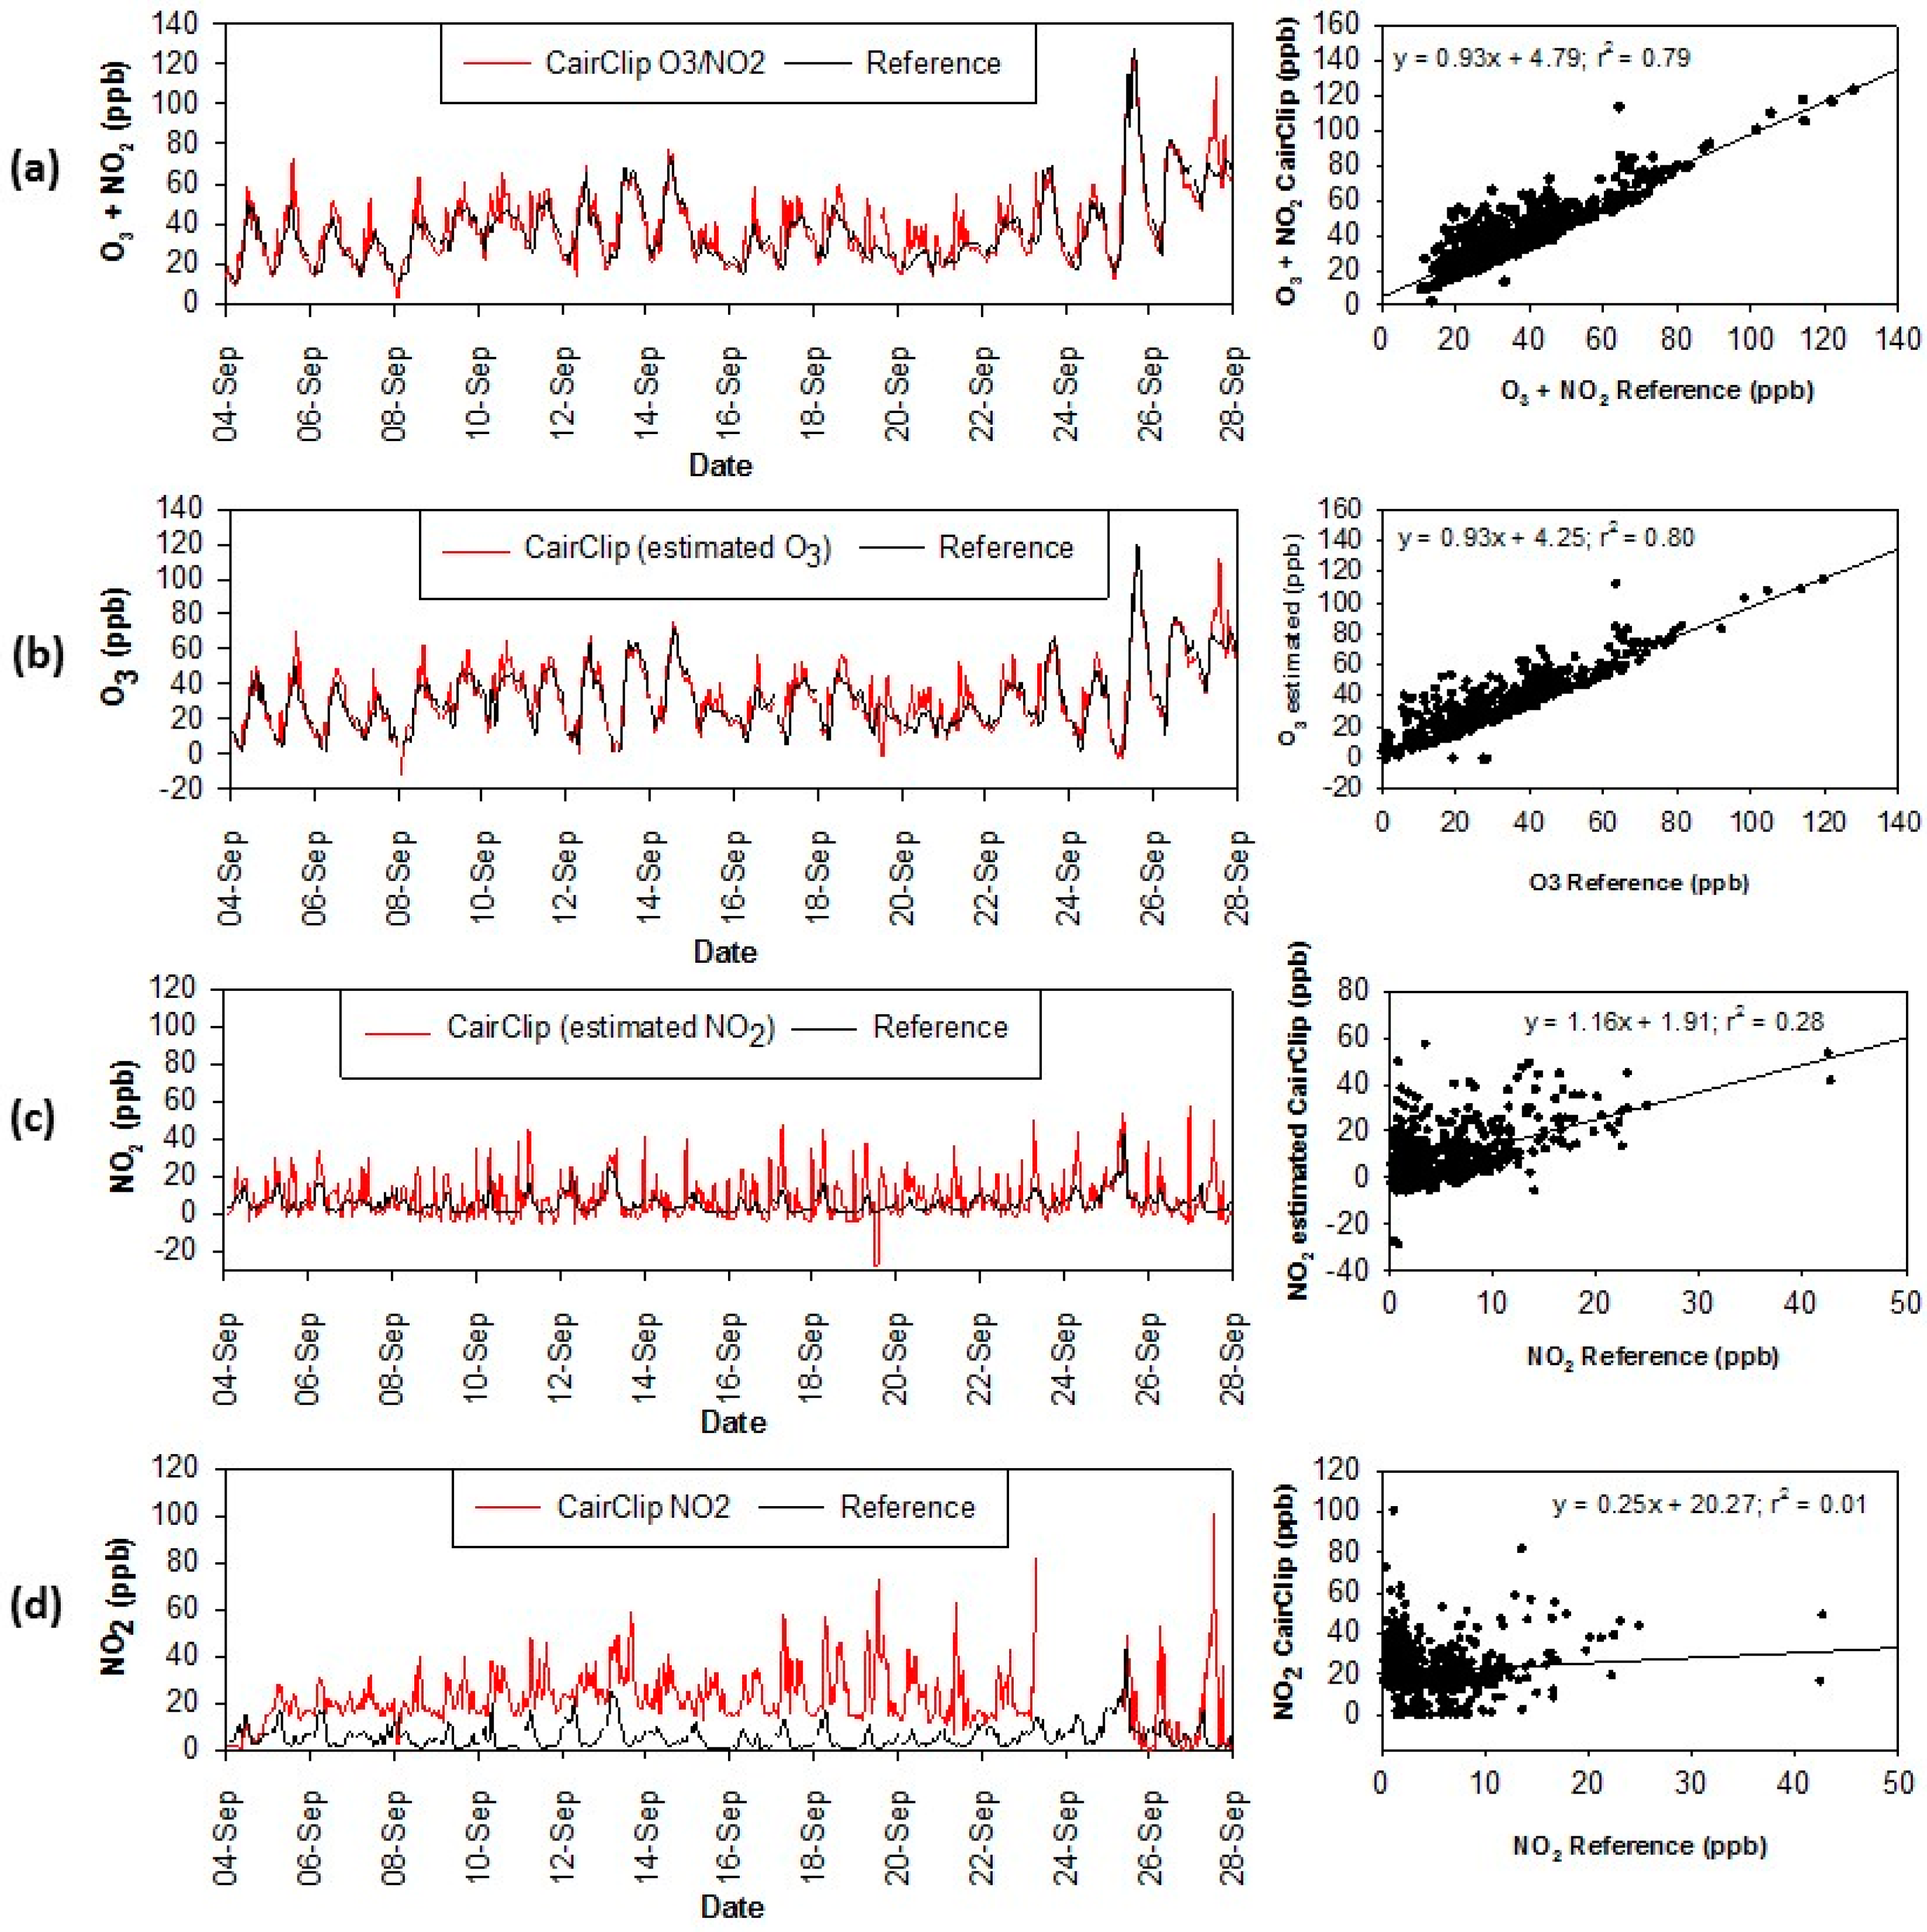
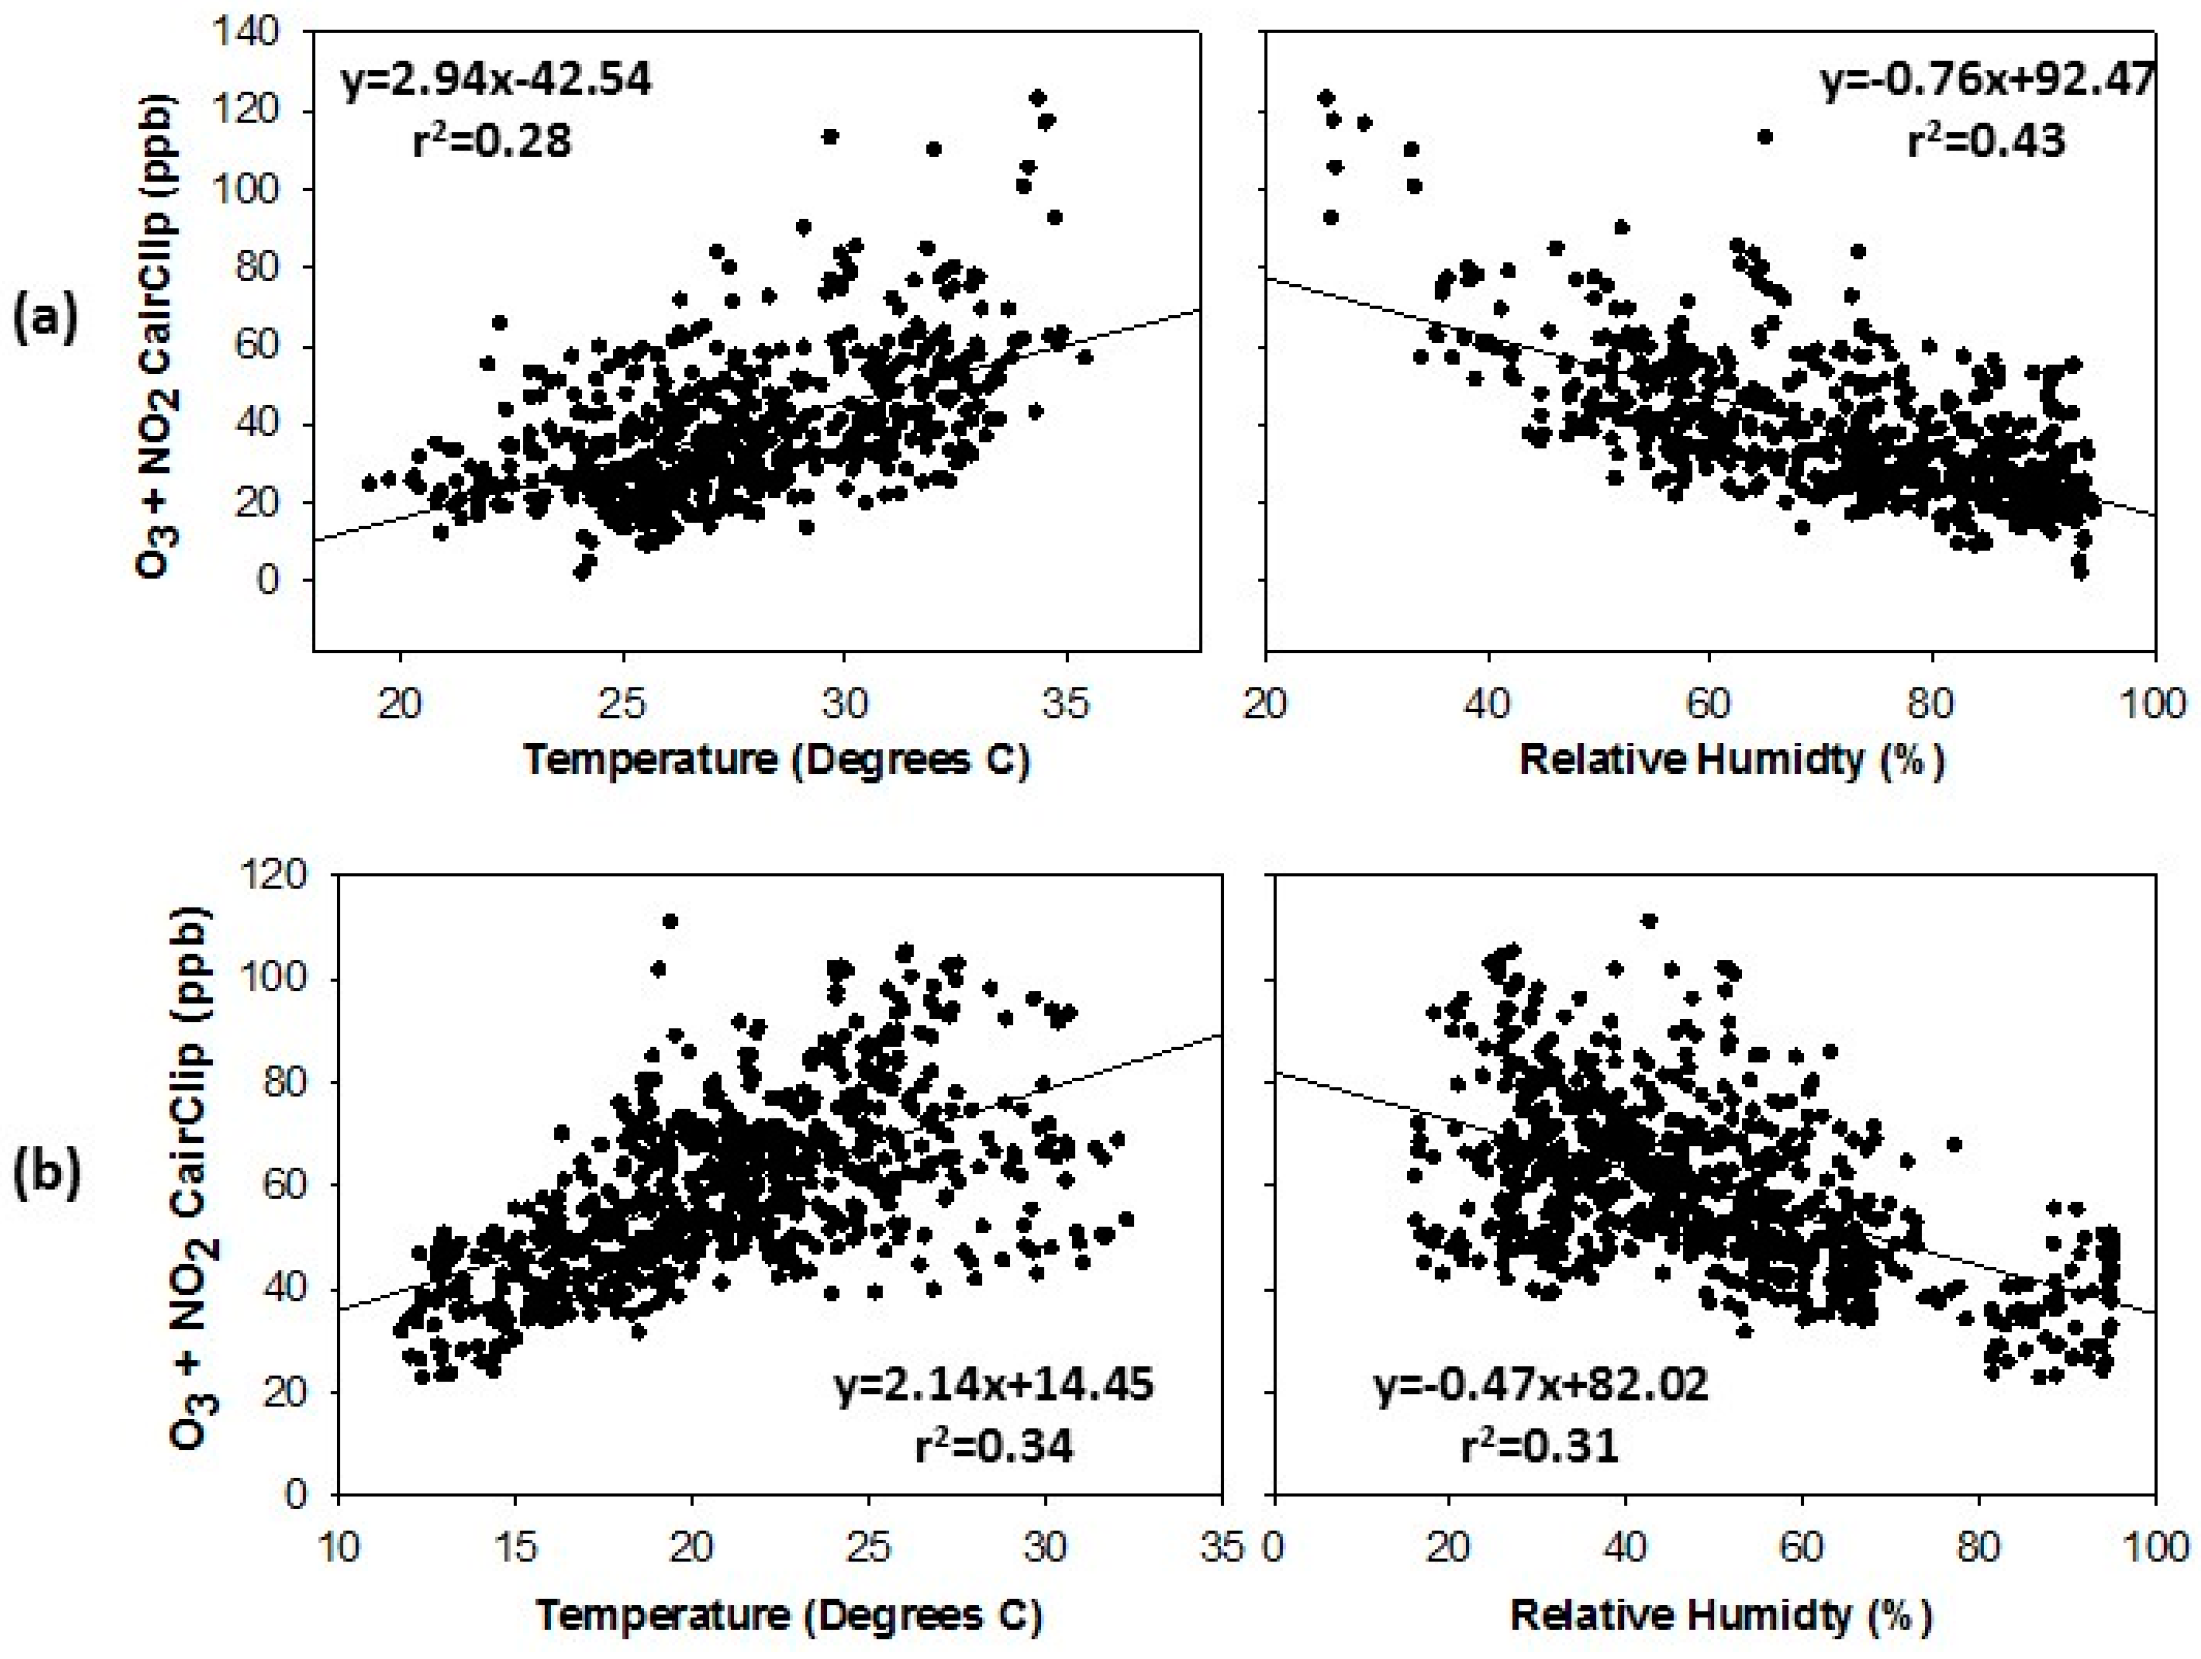
3.1.1. Houston Campaign
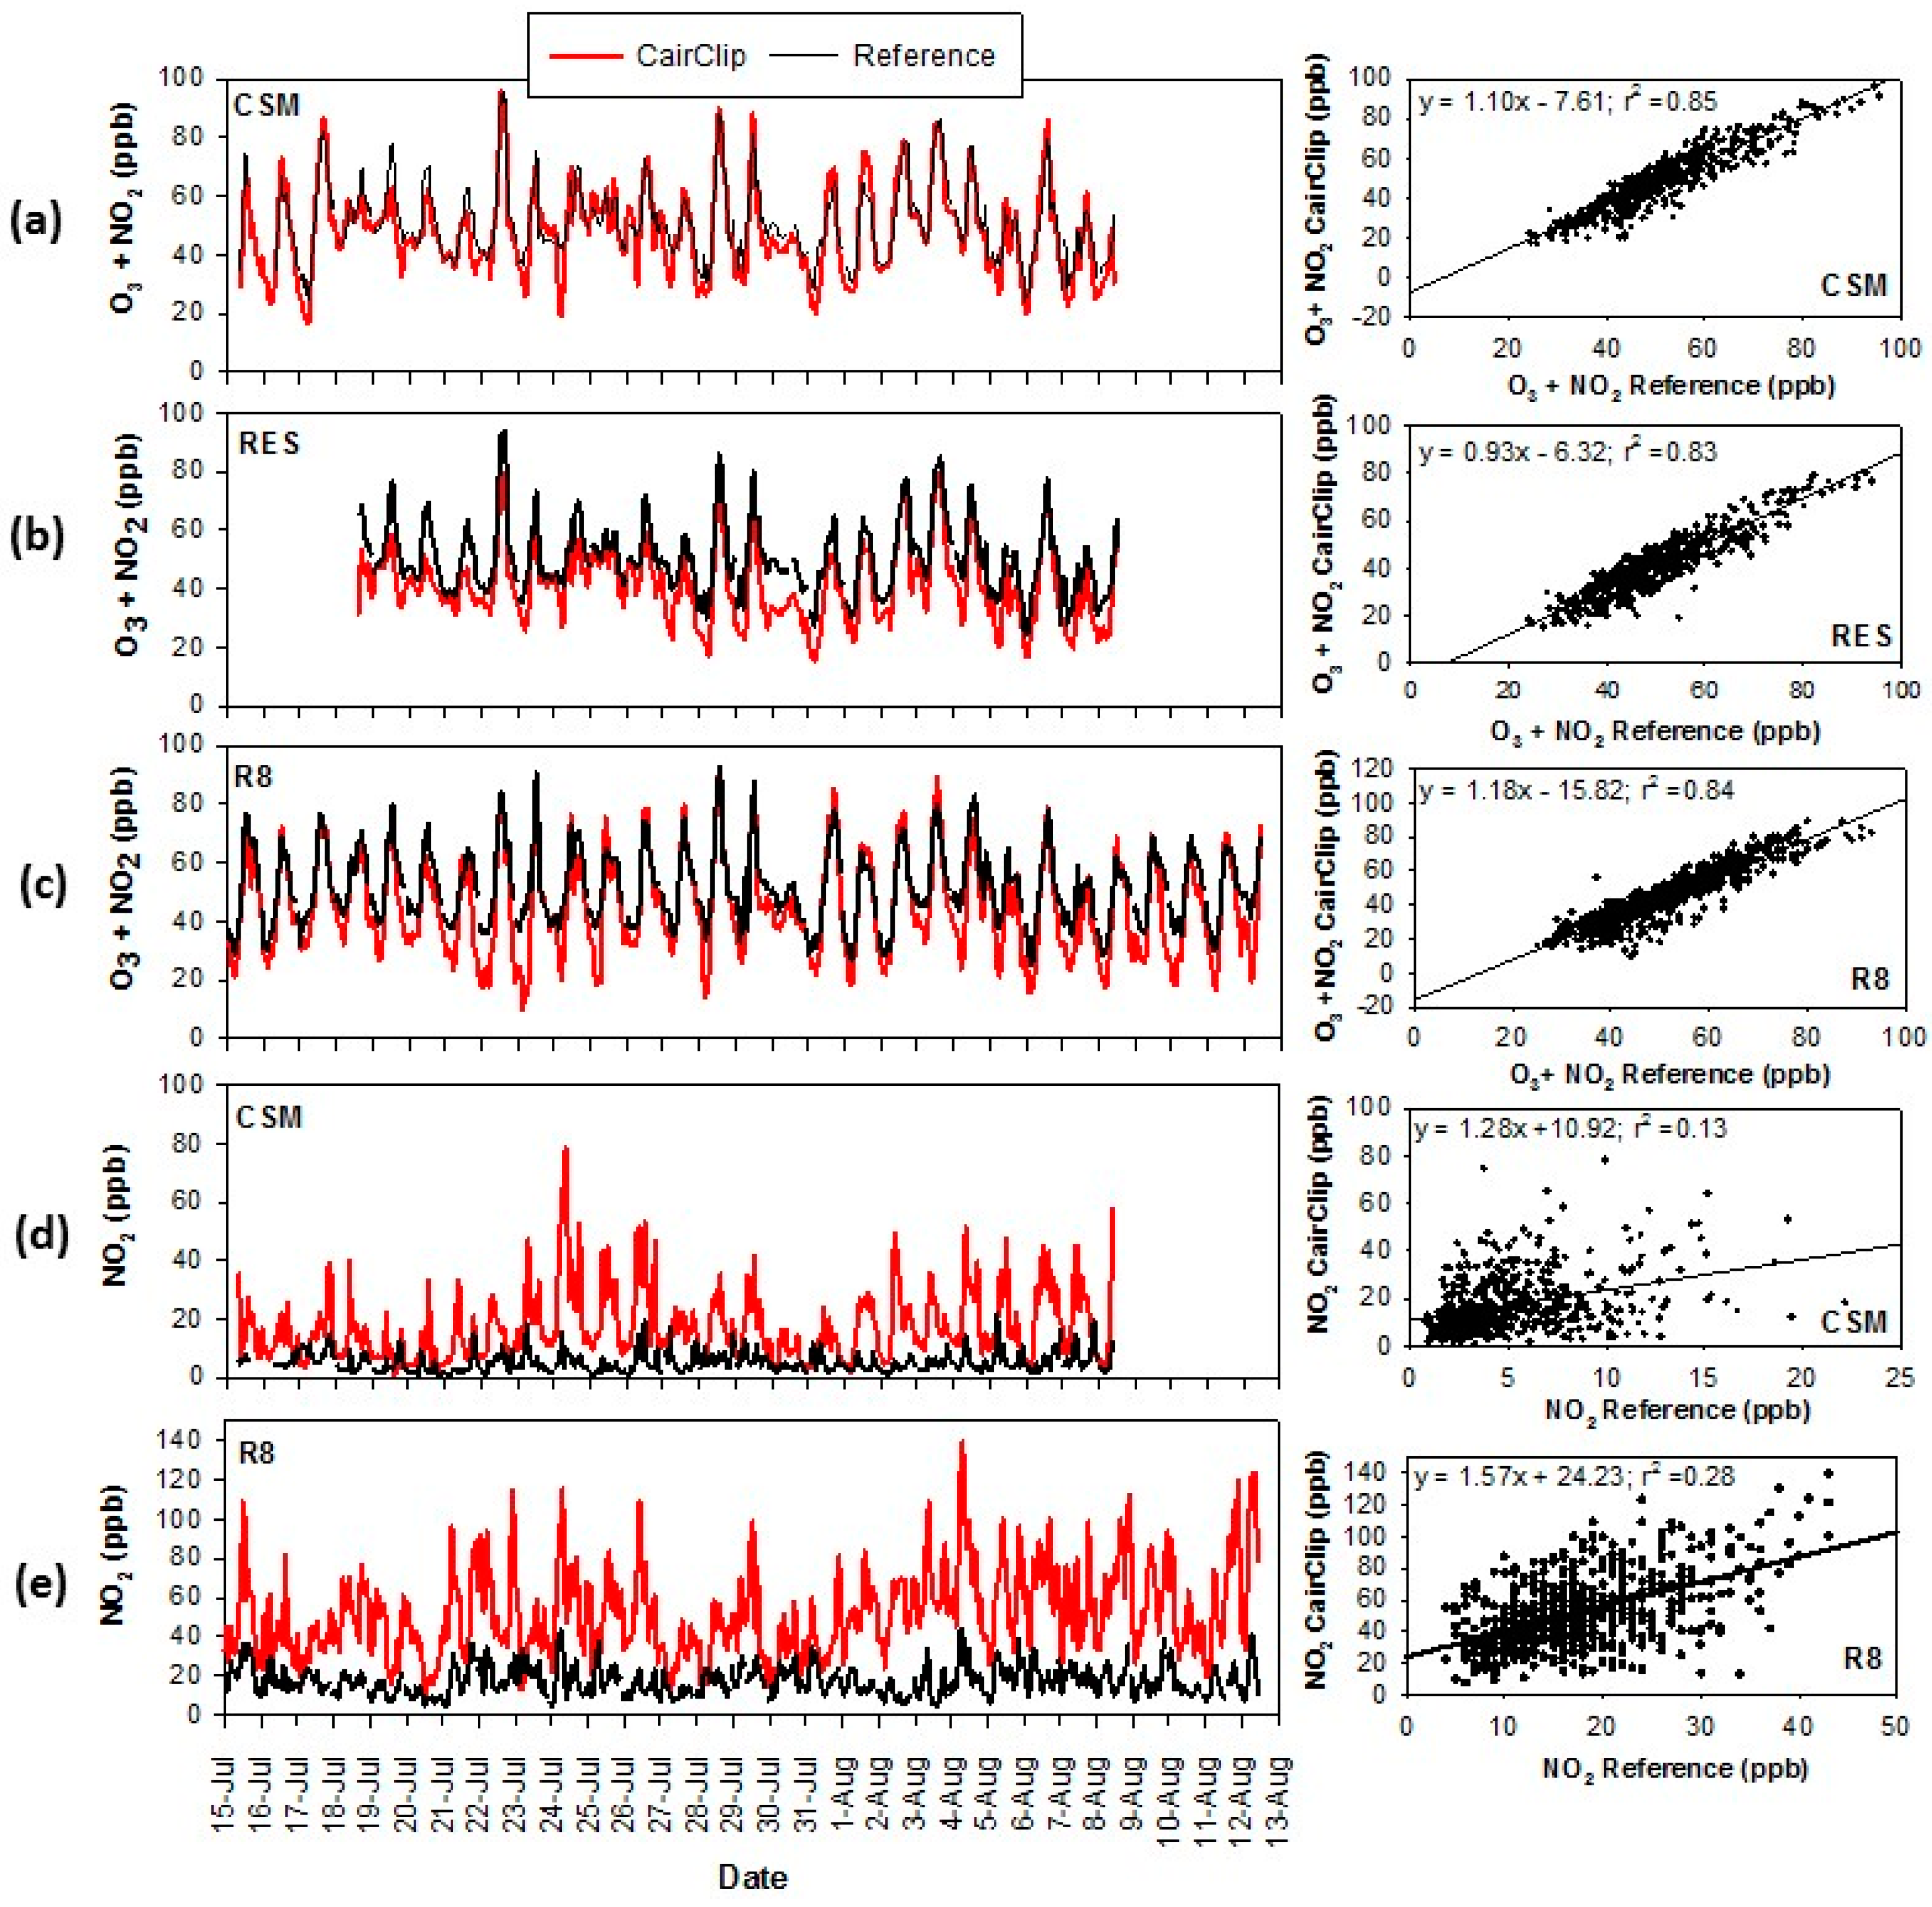
3.1.2. Denver Campaign
3.2. Citizen Science Application
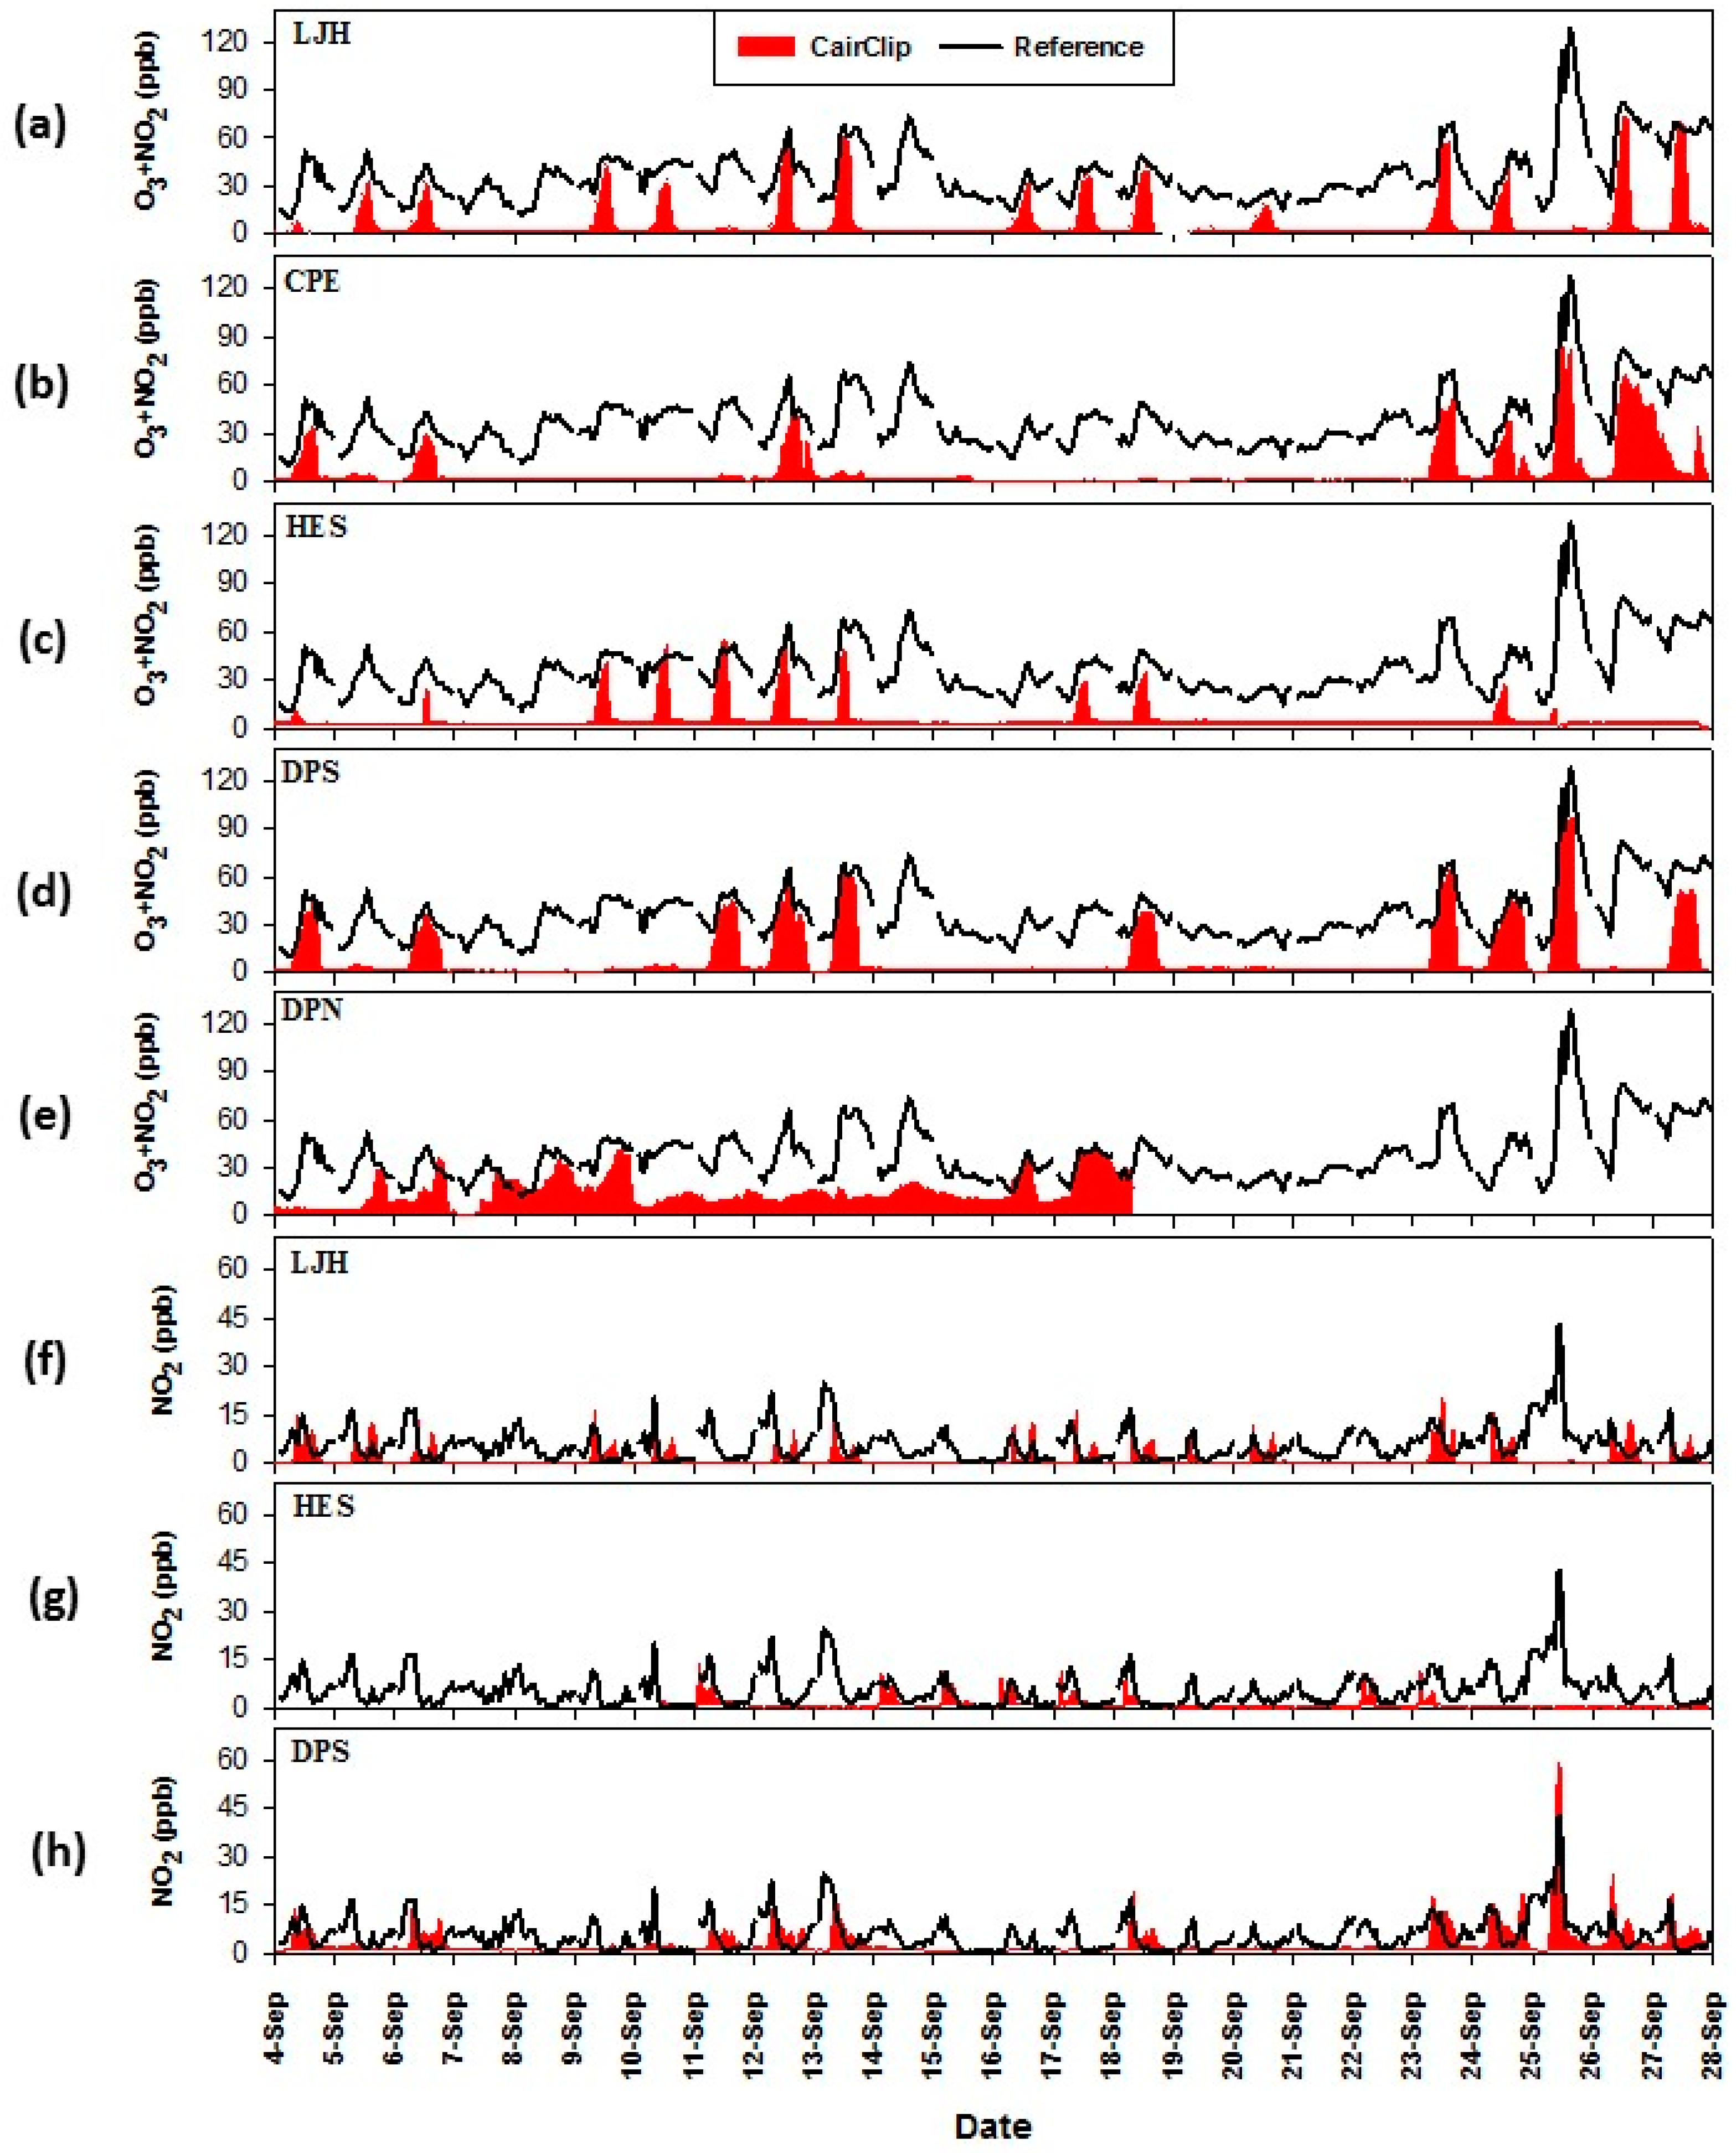
3.2.1. Citizen Science Data from the Houston Campaign
3.2.2. Citizen Science Data from the Denver Campaign
3.3. Experiences with Citizen Scientists
3.3.1. Lessons Learned
3.3.2. Recommendations for Collaborating with Citizen Scientists
- (1)
- Discuss the time commitment involved and expectations. Citizen scientists kindly offer their time to assist with a study, therefore it is important to clearly outline the time commitment that is expected of them. Based on this information they can decide whether or not they would like to participate in a study and know upfront how much time they need to devote to collecting measurements.
- (2)
- Provide clear and easy-to-follow instructions for data collection. It is critical to provide instructions in laymen’s terms for citizen scientist groups who may be collecting an observation or operating equipment. These groups have a variety of backgrounds and experiences and may not necessarily be familiar with how to accurately capture and document a scientific observation. Providing a face-to-face demo, either in person or via voice over internet protocol applications (such as Skype) is ideal but one could also utilize other types of communications such as conference calls, webinars or instructional videos. Hand-outs should contain step-by-step, clearly labeled directions with pictures if available. Depending on the activity, the instructions should include details on how to operate and maintain a measurement device, how to collect data, and/or how to properly record information related to a measurement (e.g., outdoor weather conditions, irregular events). Providing clear instructions will help encourage collection of high quality data.
- (3)
- Maintain frequent communication. Communicating with citizen scientists regularly ensures that questions or problems are addressed and that data collection runs smoothly. In some cases, citizens may have to download data from a measurement device and frequent communication can serve as a reminder to retrieve the data and/or conduct maintenance on a device.
- (4)
- Interact with the citizen science community. Studies that include citizen science offer a unique opportunity to visit the citizens that are helping collect data as well as the local community. Citizens are often eager to learn about the studies they are contributing to and enjoy interacting with scientists. In particular, teachers find these opportunities invaluable in supplementing their curriculum and keeping students engaged in learning. During both DISCOVER-AQ campaigns, we presented hands-on science activities at schools and local community events reaching out to about 1500 individuals. These interactions were well-received and enjoyable for the community members.
4. Conclusions
Acknowledgments
Author Contributions
Conflicts of Interest
Disclaimer
Appendix A

References
- Hall, E.S.; Beaver, M.R.; Long, R.W.; Vanderpool, R.W. EPA’s reference and equivalent methods research program: Supporting NAAQS implementation through research, development, and analysis. EM Air Waste Manag. Assoc. 2012, 5, 8–12. [Google Scholar]
- Snyder, E.G.; Watkins, T.H.; Solomon, P.A.; Thoma, E.D.; Williams, R.W.; Hagler, G.S.W.; Shelow, D.; Hindin, D.A.; Kilaru, V.J.; Preuss, P.W. The changing paradigm of air pollution monitoring. Environ. Sci. Technol. 2013, 47, 11369–11377. [Google Scholar] [CrossRef] [PubMed]
- Kumar, P.; Morawska, L.; Martani, C.; Biskos, G.; Neophytou, M.; Sabatino, S.; Bell, M.; Norford, L.; Britter, R. The rise of low-cost sensing for managing air pollution in cities. Environ. Int. 2015, 75, 199–205. [Google Scholar] [CrossRef] [PubMed]
- Jiao, W.; Hagler, G.S.W.; Williams, R.W.; Sharpe, R.N.; Weinstock, L.; Rice, J. Field assessment of the village green project: An autonomous community air quality monitoring system. Environ. Sci. Technol. 2015. [Google Scholar] [CrossRef] [PubMed]
- Bonney, R.; Shirk, J.L.; Phillips, T.B.; Wiggins, A.; Ballard, H.L.; Miller-Rushing, A.J.; Parrish, J.K. Next steps for citizen science. Science 2014, 343, 1436–1437. [Google Scholar] [CrossRef] [PubMed]
- Spinelle, L.; Gerboles, M.; Villani, M.G.; Aleixandre, M.; Bonavitacola, F. Field calibration of a cluster of low-cost available sensors for air quality monitoring. Part A: Ozone and nitrogen dioxide. Sens. Actuators B Chem. 2015, 215, 249–257. [Google Scholar] [CrossRef]
- Report of Laboratory and In-Situ Validation of Micro-Sensor for Monitoring Ambient Air Pollution, O12: CairClipO3/NO2 of CAIRPOL (F). European Commission, Joint Research Centre: Luxembourg, 2013. Available online: https://ec.europa.eu/jrc/en/publication/eur-scientific-and-technical-research-reports/report-laboratory-and-situ-validation-micro-sensors-monitoring-ambient-air-pollution-O12 (accessed on 8 August 2016).
- Report of Laboratory and In-Situ Validation of Micro-Sensor for Monitoring Ambient Air Pollution, NO9: CairClipNO2 of CAIRPOL (F). European Commission, Joint Research Centre: Luxembourg, 2013. Available online: http://publications.jrc.ec.europa.eu/repository/bitstream/JRC86499/lbna26394enn.pdf (accessed on 8 August 2016).
- Mead, M.I.; Popoola, O.A.M.; Stewart, G.B.; Landshoff, P.; Calleja, M.; Hayes, M.; Baldovi, J.J.; McLeod, M.W.; Hodgson, T.F.; Dicks, J.; et al. The use of electrochemical sensors for monitoring urban air quality in low-cost, high-density networks. Atmos. Environ. 2013, 70, 186–203. [Google Scholar] [CrossRef]
- Sensor Evaluation Report. U.S. Environmental Protection Agency: USA, 2014; EPA 600/R-14/143. Available online: https://cfpub.epa.gov/si/si_public_record_report.cfm?dirEntryId=277270&simpleSearch=1&searchAll=sensor+evaluation+report (accessed on 8 August 2016).
- Jiao, W.; Hagler, G.; Williams, R.; Sharpe, R.; Brown, R.; Garver, D.; Judge, R.; Caudill, M.; Rickard, J.; Davis, M.; et al. Community air-sensor network (CAIRSENSE) project: Evaluation of low-cost sensor performance in a suburban environment in the southeastern United States. Atmos. Meas. Tech. Discuss. 2016. [Google Scholar] [CrossRef]
- Lin, C.; Gillespie, J.; Schuder, M.D.; Duberstein, W.; Beverland, I.J.; Heal, M.R. Evaluation and calibration of Aeroqual series 500 portable gas sensors for accurate measurement of ambient ozone and nitrogen dioxide. Atmos. Environ. 2015, 100, 111–116. [Google Scholar] [CrossRef]
- Bart, M.; Williams, D.E.; Ainslie, B.; McKendry, I.; Salmond, J.; Grange, S.K.; Alavi-Shoshtari, M.; Steyn, D.; Henshaw, G.S. High density ozone monitoring using gas sensitive semi-conductor sensors in the lower fraser valley, British Columbia. Environ. Sci. Technol. 2014, 48, 3970–3977. [Google Scholar] [CrossRef] [PubMed]
- Sun, L.; Wong, K.C.; Wei, P.; Ye, S.; Huang, H.; Yang, F.; Westerdahl, D.; Louie, P.K.K.; Luk, C.W.Y.; Ning, Z. Development and application of a next generation air sensor network for the Hong Kong marathon 2015 air quality monitoring. Sensors 2016, 16. [Google Scholar] [CrossRef] [PubMed]
- Masson, N.; Piedrahita, R.; Hannigan, M. Quantification method for electrolytic sensors in long-term monitoring of ambient air quality. Sensors 2015, 15, 27283–27302. [Google Scholar] [CrossRef] [PubMed]
- Duvall, R.M.; Long, R.W.; Beaver, M.R.; Szykman, J.J.; Kronmiller, K.G.; Wheeler, M.L. Use of air quality sensors during DISCOVER-AQ. EM Air Waste Manag. Assoc. 2016. [Google Scholar]
- Brienza, S.; Galli, A.; Anastasi, G.; Bruschi, P. A low-cost sensing system for cooperative air quality monitoring in urban areas. Sensors 2015, 15, 12242–12259. [Google Scholar]
- Citizen Science Air Monitoring in the Ironbound Community. U.S. Environmental Protection Agency: USA, 2016; EPA/600/R-16/049. Available online: https://cfpub.epa.gov/si/si_public_record_report.cfm?dirEntryId=315154 (accessed on 28 June 2016).
- Dye, T.S.; Gordon, B.J.; Roberts, P.T. Air sensors: Quality data for the right application. EM: Air Waste Manag. Assoc. 2014, 8, 22–27. [Google Scholar]
- Crawford, J.H.; Pickering, K.E. Advancing strategies for air quality observations in the next decade. EM Air Waste Manag. Assoc. 2014, 9, 4–7. [Google Scholar]
- Stetter, J.; Li, J. Amperometric gas sensors—A review. Chem. Rev. 2008, 108, 352–366. [Google Scholar] [CrossRef] [PubMed]
- The R Project for Statistical Computing. Available online: http://www.R-project.org/ (accessed on 12 October 2016).


| Field Campaign | Site Name (Abbreviation) | City | Distance 1 (km) | CairClip Version |
|---|---|---|---|---|
| Lomax Junior High School (LJH) | La Porte | 3.2 | NO2, O3/NO2 | |
| Heritage Elementary School (HES) | La Porte | 5.6 | NO2, O3/NO2 | |
| College Park Elementary School (CPE) | Deer Park | 7.2 | O3/NO2 | |
| Houston, TX | JP Dabbs Elementary School (JDE) | Deer Park | 8.0 | NO2 |
| Deer Park High School South (DPS) | Deer Park | 9.0 | NO2, O3/NO2 | |
| Deer Park High School North (DPN) | Deer Park | 9.7 | O3/NO2 | |
| DeZavala Elementary School (DZE) | Channelview | 29.0 | O3/NO2 | |
| La Porte Airport Reference Site (LPA) | La Porte | - | NO2, O3/NO2 | |
| Colorado School of Mines (CSM) | Golden | 5.8 | NO2, O3/NO2 | |
| Local Residence (RES) | Golden | 8.5 | O3/NO2 | |
| Denver, CO | EPA Region 8 (R8) | Denver | 1.8 | NO2, O3/NO2 |
| Golden Reference Site (GOL) | Golden | - | NO2, O3/NO2 | |
| Denver CAMP Reference Site (CAMP) | Denver | - | - |
| CairClip Version | Site Name | Sampling Days | Hourly Average (ppb) CairClip | Hourly Average (ppb) Reference | CairClip/Reference |
|---|---|---|---|---|---|
| O3/NO2 | LPA | 24 | 38.40 | 37.53 1 | 1.02 |
| GOL | 30 | 59.10 | 51.13 1 | 1.16 | |
| NO2 | LPA | 24 | 21.45 | 5.54 | 3.87 |
| GOL | 30 | - | 5.10 | - |
| CairClip Version | Site | Sampling Days | Hourly Average (ppb) CairClip | Hourly Average (ppb) Reference | CairClip/Reference |
|---|---|---|---|---|---|
| O3/NO2 | CSM | 25 | 48.25 | 51.48 1 | 0.94 |
| RES | 22 | 41.33 | 51.48 1 | 0.80 | |
| R8 | 29 | 45.01 | 51.70 1 | 0.87 | |
| NO2 | CSM | 25 | 17.01 | 5.14 | 3.31 |
| R8 | 29 | 51.79 | 17.29 | 3.00 |
© 2016 by the authors; licensee MDPI, Basel, Switzerland. This article is an open access article distributed under the terms and conditions of the Creative Commons Attribution (CC-BY) license (http://creativecommons.org/licenses/by/4.0/).
Share and Cite
Duvall, R.M.; Long, R.W.; Beaver, M.R.; Kronmiller, K.G.; Wheeler, M.L.; Szykman, J.J. Performance Evaluation and Community Application of Low-Cost Sensors for Ozone and Nitrogen Dioxide. Sensors 2016, 16, 1698. https://doi.org/10.3390/s16101698
Duvall RM, Long RW, Beaver MR, Kronmiller KG, Wheeler ML, Szykman JJ. Performance Evaluation and Community Application of Low-Cost Sensors for Ozone and Nitrogen Dioxide. Sensors. 2016; 16(10):1698. https://doi.org/10.3390/s16101698
Chicago/Turabian StyleDuvall, Rachelle M., Russell W. Long, Melinda R. Beaver, Keith G. Kronmiller, Michael L. Wheeler, and James J. Szykman. 2016. "Performance Evaluation and Community Application of Low-Cost Sensors for Ozone and Nitrogen Dioxide" Sensors 16, no. 10: 1698. https://doi.org/10.3390/s16101698