Article

Design and Analysis of a Sensor System for Cutting Force Measurement in Machining Processes

1
College of Electric and Information Technology, Hunan University, Changsha 410082, Hunan, China
2
State Key Laboratory of Advanced Design and Manufacturing for Vehicle Body, Hunan University, Changsha 410082, Hunan, China
3
Lassonde School of Engineering, York University, Toronto, ON M3J 1P3, Canada
4
Institute of Intelligent Machines, Chinese Academy of Science, Hefei 230031, Anhui, China
*
Authors to whom correspondence should be addressed.
These authors contributed equally to this work.
Sensors 2016, 16(1), 70; https://doi.org/10.3390/s16010070
Submission received: 22 November 2015 / Revised: 30 December 2015 / Accepted: 4 January 2016 / Published: 7 January 2016
(This article belongs to the Special Issue Sensors for Robots)

Abstract

:
Multi-component force sensors have infiltrated a wide variety of automation products since the 1970s. However, one seldom finds full-component sensor systems available in the market for cutting force measurement in machine processes. In this paper, a new six-component sensor system with a compact monolithic elastic element (EE) is designed and developed to detect the tangential cutting forces Fx, Fy and Fz (i.e., forces along x-, y-, and z-axis) as well as the cutting moments Mx, My and Mz (i.e., moments about x-, y-, and z-axis) simultaneously. Optimal structural parameters of the EE are carefully designed via simulation-driven optimization. Moreover, a prototype sensor system is fabricated, which is applied to a 5-axis parallel kinematic machining center. Calibration experimental results demonstrate that the system is capable of measuring cutting forces and moments with good linearity while minimizing coupling error. Both the Finite Element Analysis (FEA) and calibration experimental studies validate the high performance of the proposed sensor system that is expected to be adopted into machining processes.

1. Introduction

Computer Numerical Control (CNC) machines are operated by precisely programmed commands and widely used in modern manufacturing industry, enabling the manufacture of complex-shaped products or parts that cannot be produced by manually operated machines.
Nowadays, every manufacturer in the global market is pitted against worldwide competitors with consistently improving product quality, enhanced manufacturing productivity, elimination of inspections, and shrinking total machining costs.
The condition of cutting tools and the cutting process should be identified without human assistance and/or interrupting the manufacturing process operation, which is one of the most important operating criteria that influences the manufacturing quality and productivity. An automated machining process with a successful machining condition monitoring system could allow increased principal equipment utilization, hence achieving considerable cost savings for the manufacturing industry [1,2].
As precise estimation and determination of cutting force at tool tips in manufacturing processes is the most effective method for monitoring machine tools and the machining processes, it is indispensable in many research and application fields for monitoring the tool conditions, analyzing of machining methods and tools, estimating real-time tool wear [3], designing proper machining tools, characterizing and optimizing manufacturing process and cutting parameters, etc. Consequently, sensor systems for measuring cutting force are receiving widespread attention within the equipment manufacturing and other related industries community.
The cutting forces during machining process are dependent on many parameters such as depth of cut, configuration of the cutting tool, feed rate, material of the workpiece and the tool, and some unknown factors such as cooling method. Therefore, theoretical cutting force calculations are hardly applicable to monitor practical machining processes in a factory environment.
A great number of sensor systems with many sophisticated signal and information processing techniques proposed for the pertinent applications can be found in the literature. Additionally, a lot of commercial devices capable of measuring the cutting force during milling, turning, drilling or grinding have been developed by many companies such as Kistler TLC (Technische Lehrmittel Construktion, Unna, Germany), etc.
Conveniently, the cutting force measurement systems could be separated into at least two groups, consisting of indirect and direct approaches. The direct measurement approach refers to detecting and quantifying the cutting force by using force dynamometers directly. This is done by relying on some specific effects such as mechano-magnetic, mechano-electric, and mechano-optic conversions, while the indirect measuring approach refers to a cutting force that is estimated by dynamic parameters associated with cutting force such as acceleration, acoustic emission, vibration, and spindle motor current. The most common indirect approaches to cutting force measurement or monitoring are based upon motor current and power measurement [4,5]. Shin et al. [6] designed an indirect approach for measuring cutting force in end-milling process with a three-axis acceleration sensor and Hall-effect current sensors. An indirect approach for detecting cutting force for an Adaptive Control with Constraints (ACC) system for machining centers by using the currents of a.c. feed-drive servo drives was reported in [7]. A novel approach for measuring cutting force via command voltages drawn by electro-magnetic bearing was proposed by Auchet et al. [8], and the experimental results show that the calculated cutting forces are in good agreement with commercial Kistler measurement system. The static accuracy and bandwidth of the Altintas et al. presented a comprehensive model that evaluates the cutting force in normal and tangential directions through modeling the cutting mechanics, feed variation and tool indentation effect [9]. In recent years, different methods for evaluating or predicting cutting forces based on tool indentation effect [10], nonlinear cutting force coefficients [11], and rotational DOF (Degrees of Freedom) of the multi-axis kinematics effect on mechanics of the cutting process [12] are considerably attracting the attentions of researchers. Within most environments the indirect approach is easier to achieve, but has several limitations such as high computation time, unsuitable for multi-axis cutting process, does not consider the frictional behavior of the machine tools.
On the other hand, direct measuring approaches have been widely employed because they can provide more accurate measurement of cutting forces. Although, they have their limitations like high cost, layout constraints, fragility to overload, etc. Rao, Gao, and Friedrich presented an integrated force measurement method for on-line cutting geometry inspection, and a piezoelectric force sensor with high resolution (0.44 mN) and sensitivity (7 mV/gm) which was adopted to measure the feed force combined with thrusts during the diamond-cutting process [13]. A novel cylindrical capacitive displacement sensor and a magnetic exciter for monitoring end milling processes were proposed by Kim et al. [14]. It was verified by cutting experiments that the proposed sensory system was suitable in the monitoring of high speed cutting conditions on various machine tools. A strain gauge based tool dynamometer and a piezo-film accelerometer, with a natural frequency of 2.35 kHz, was developed to detect dynamic and static cutting force for ultra-precision machine tools [15]. Jin, Venuvinod, and Wang proposed an approach for detecting cutting force with an optical fiber sensor, and the results of calibration experiment and manufacturing tests show the proposed system obtains satisfactory performances (Its static sensitivity and linearity of the system are 2.51 mV/N and 1.2% Full Scale (F.S.), respectively, with a natural frequency of 950 Hz) [16]. The pros and cons as well as typical designs of the mentioned intrinsic transduction techniques are summarized in the Table 1. These transduction techniques are commonly interconnected in practical cutting forces measurement systems [17,18].
Table 1. Intrinsic transduction techniques for cutting force measurement.
Measuring TechnologyDirect/Indirect MeasurementProsConsTypical Designs
Currentindirect
  • easier to achieve
  • time-consuming
[5]
  • cost effective
  • unsuitable for multi-axis cutting process
  • without consideration of the frictional behavior of the machine tools
Voltageindirect
  • wide bandwidth (up to 4 kHz)
  • Limited to stable conditions
[8]
  • easy to conversion and processing
  • susceptible to electromagnetic interference
Strain gaugedirect
  • simple construction
  • higher power consumption
[15]
  • high and adjustable resolution
  • rigid and fragile
  • high reliability
  • scarce reproducibility
Capacitivedirect
  • high sensitivity and resolution
  • temperature sensitive
[14]
  • long-time stability
  • stray capacitance
  • Adaptability to Environment
  • Edge effect
Optoelectronicdirect
  • good reliability
  • non-conformable
[16]
  • wide measurement range
  • hard to construct dense arrays
  • good adaptability to workshop conditions
Piezoelectricdirect
  • high frequency response and high dynamic range
  • rangeability
  • higher accuracy and finer resolution
  • high sensitivity and stiffness
  • charge leakages
[13]
  • poor spatial resolution
  • deteriorations of voltages or drifts in the presence of static forces
Many different sensory systems for cutting force measurement have been developed for specific tasks. However, many tasks such as monitoring and controlling of high speed machining processes require reliable and practical sensing methods to measure the cutting force, which cannot be achieved by the majority of the present sensory systems. This is partially due to limited workpiece sizes, low frequency bandwidths, mounting constraints, wiring complexities, and susceptibility to harsh machining environments [19]. In this paper, a novel six-component Force/Moment (F/M) sensor is designed to detect the normal and tangential cutting force (Fx, Fy and Fz), as well as the cutting moments (Mx, My and Mz), simultaneously.

2. System Configuration

The experimental setup for implementing the sensor system for cutting force measurement is shown in Figure 1. The six-component cutting F/M sensor is sandwiched between the adapter and the moving platform of a 5-axis parallel kinematic machining center. After calibration, the multi-component F/M sensor is capable of measuring the normal and tangential cutting force (Fx, Fy and Fz), as well as the cutting moments (Mx, My and Mz), simultaneously.
Raw signals from the sensor are processed, stored and transmitted to the host-computer by the integrated electrical circuit board as shown in Figure 2. Feature extraction of signals with the appropriate signal processing algorithms is adopted to obtain a simplified signal and specific characteristic features related to the cutter conditions. Decision-making strategies analyze the characteristic features and perform a pattern association task. Artificial neural networks, fuzzy logic system, expert systems, and other hybrid intelligent systems are proving their effectiveness in decision making of condition monitoring systems to make sure efficient removal of metals and taking correct action to prevent harm in the event of breakages or accidents. The input signals were also used to modify the part of the program that is used in the second pass with alternative tool path, feed rate, cutting speed, stock removal.
Figure 1. Experimental setup for implementing the sensor system for cutting force measurement.
Sensors 16 00070 g001
Figure 2. Schematic illustration of strategy of the system.
Sensors 16 00070 g002

3. Design and Construction of the Sensor

The most common technique to detect cutting F/M relies on resistive measurement approach with strain gauges. This is due to its advantages such as high reliability with time, excellent linearity over wide range, simplicity, wide operating temperature range, adjustable resolution, maintenance free and relatively low in cost, etc. [20]. The sensing system based on resistive approach consists of four functional elements: strain gauges, Elastic element (EE) with a specially designed shape, measuring bridges, and electric circuit.

3.1. Sensing Principle

The strain gauges bonded onto the EE are sensitive to dimensional changes when a cutting force is applied to the sensor, and their resistances change according to:
Δ R i R i = G ε i
where ΔRi/Ri is the variation of relative resistance ratio of the ith strain gauge. G and εi are the gauge factor of the strain gauge and specific strain, respectively. Provided that the EE behaves within the elastic range of the material, the strains and the applied cutting load are related by the following equation:
ε i = f i ( F )
where F 6 is the cutting load vector that contains the forces Fs and the moments Ms applied onto the sensor.
Wheatstone Bridge arrangements are generally employed as measuring bridges via electrically connecting several strain gauges (generally 4, 8, or a still greater number) to measure the small resistive changes with high sensitivity and inherent linearity. Therefore, there is a relation between the output voltage variation of the measuring bridges and the strains due to the applied cutting load:
Δ V 0 = V E G W ε = T F
where Δ V 0 6 , VE is the voltage excitation source of the bridges, W 6 × 24 and T 6 × 6 represent the bridge transformation matrix and the transducer matrix, respectively. The transducer matrix is a constant matrix that depends on the configuration of the measuring bridges, the structure of the EE, and the specific location of the strain gauges on the EE. After calibration or structural analysis, the applied cutting load can be determined and calculated:
F = T # Δ V 0 + ( I T # T ) z
where T # is the generalized inversion of T. z is an arbitrary 6 × 1 vector, and usually set as z = o.
Multi-component cutting F/M sensor should be designed to be equally sensitive or accurate among its all force and moment components. As a consequence, the sensor and its electrical circuit should be characterized with simple but effective decoupling methods, identical amplification among components associated with a considerable degree of integration. The transducer matrix is normalized to avoid the unit inconsistency problem:
T ¯ = N V N 1 T N F N
with normalization compensates:
Ν V N = diag { Δ V 1 M , Δ V 2 M , Δ V 3 M , Δ V 4 M , Δ V 5 M , Δ V 6 M }
Ν F N = diag { F x M , F y M , F z M , M x M , M y M , M z M }
where △ViM and FiM (or MiM) are maximal voltage variation of the ith measuring bridge and pre-specified maximal cutting forces (or moments). The anisotropy index of the sensor can be obtained by the condition number of T ¯ [21]:
C o ( T ¯ ) = σ max ( T ¯ ) σ min ( T ¯ )
where σ max and σ min represent the largest and the smallest singular values of T ¯ , respectively.
The absolute sensitivity of the sensor can be evaluated by [22]:
S o = trace ( T ¯ T T ¯ ) = i = 1 6 σ i 2
or:
S o = det ( T ¯ T T ¯ ) = i = 1 6 σ i
The obtained cutting load is respect to the sensor’s coordinate frame {S}, and should be transformed to the tool’s coordinate frame {T} as:
F t = J t F
where:
J t = [ R t O S ( r t ) R t R t ]
Here, rt is the location vector of the frame {S} with respect to the frame {T}, Rt is the is the orientation matrix of frame {S} relative to the frame {T}, O is the null matrix, and S(rt) represents skew-symmetric matrix operator of vector rt.

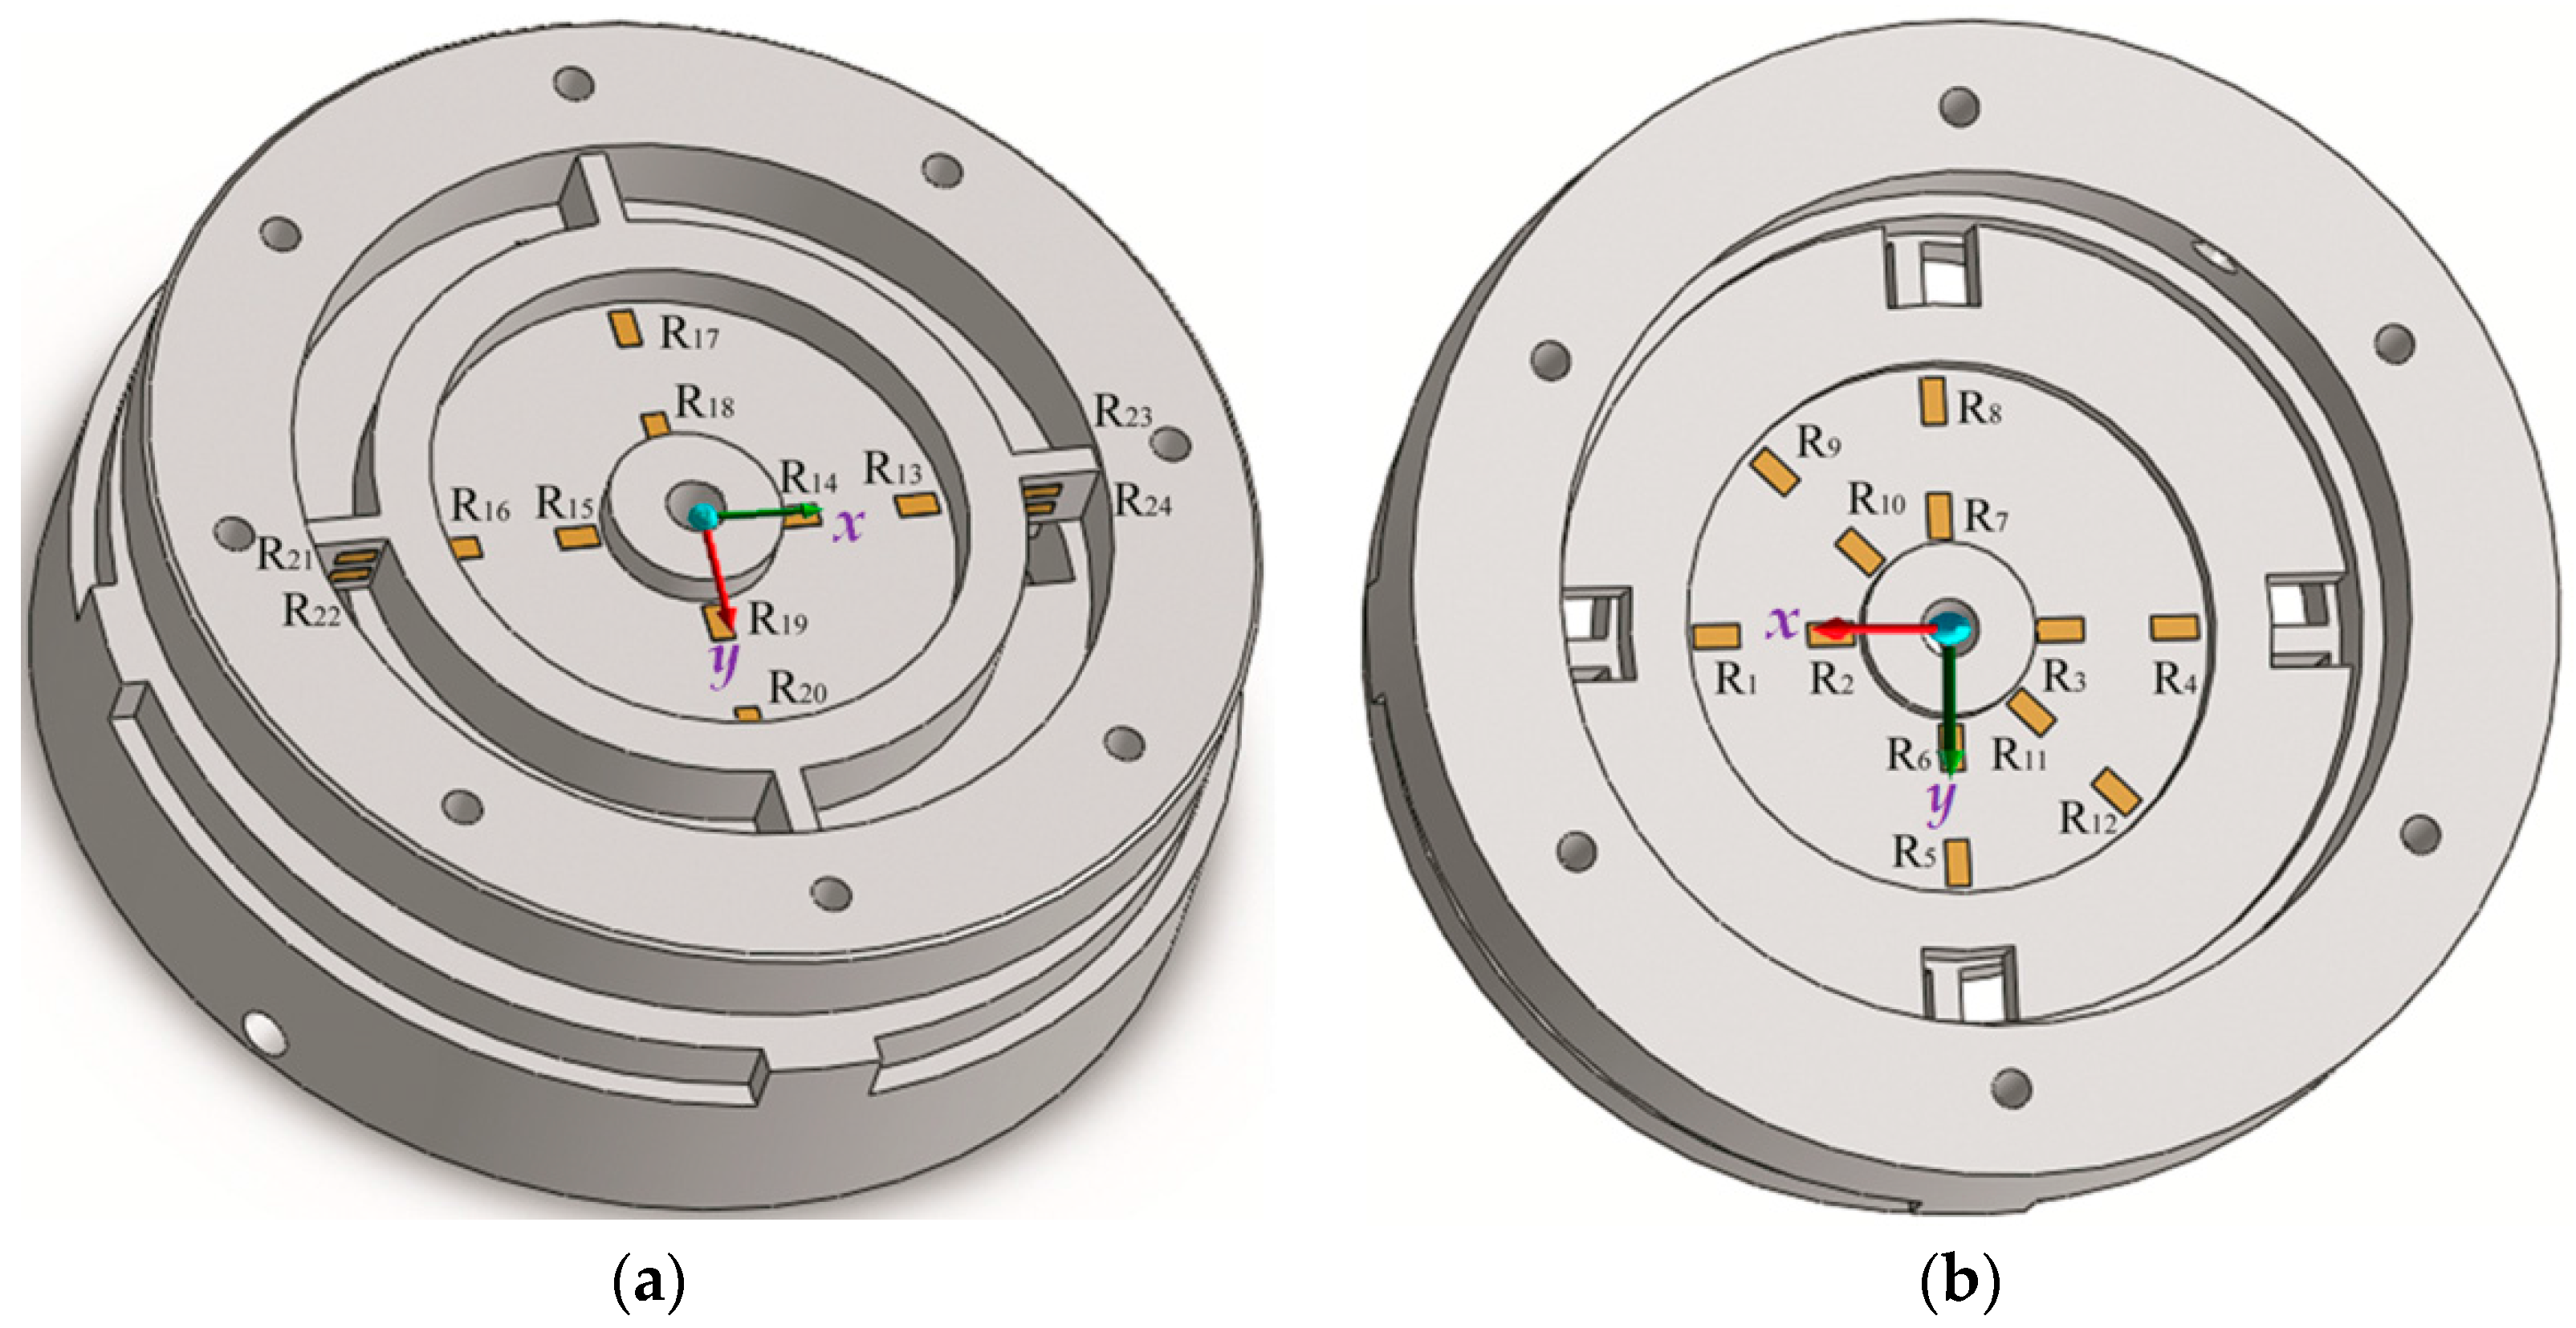
3.2. Structure of the Proposed Six-Component Cutting F/M Sensor

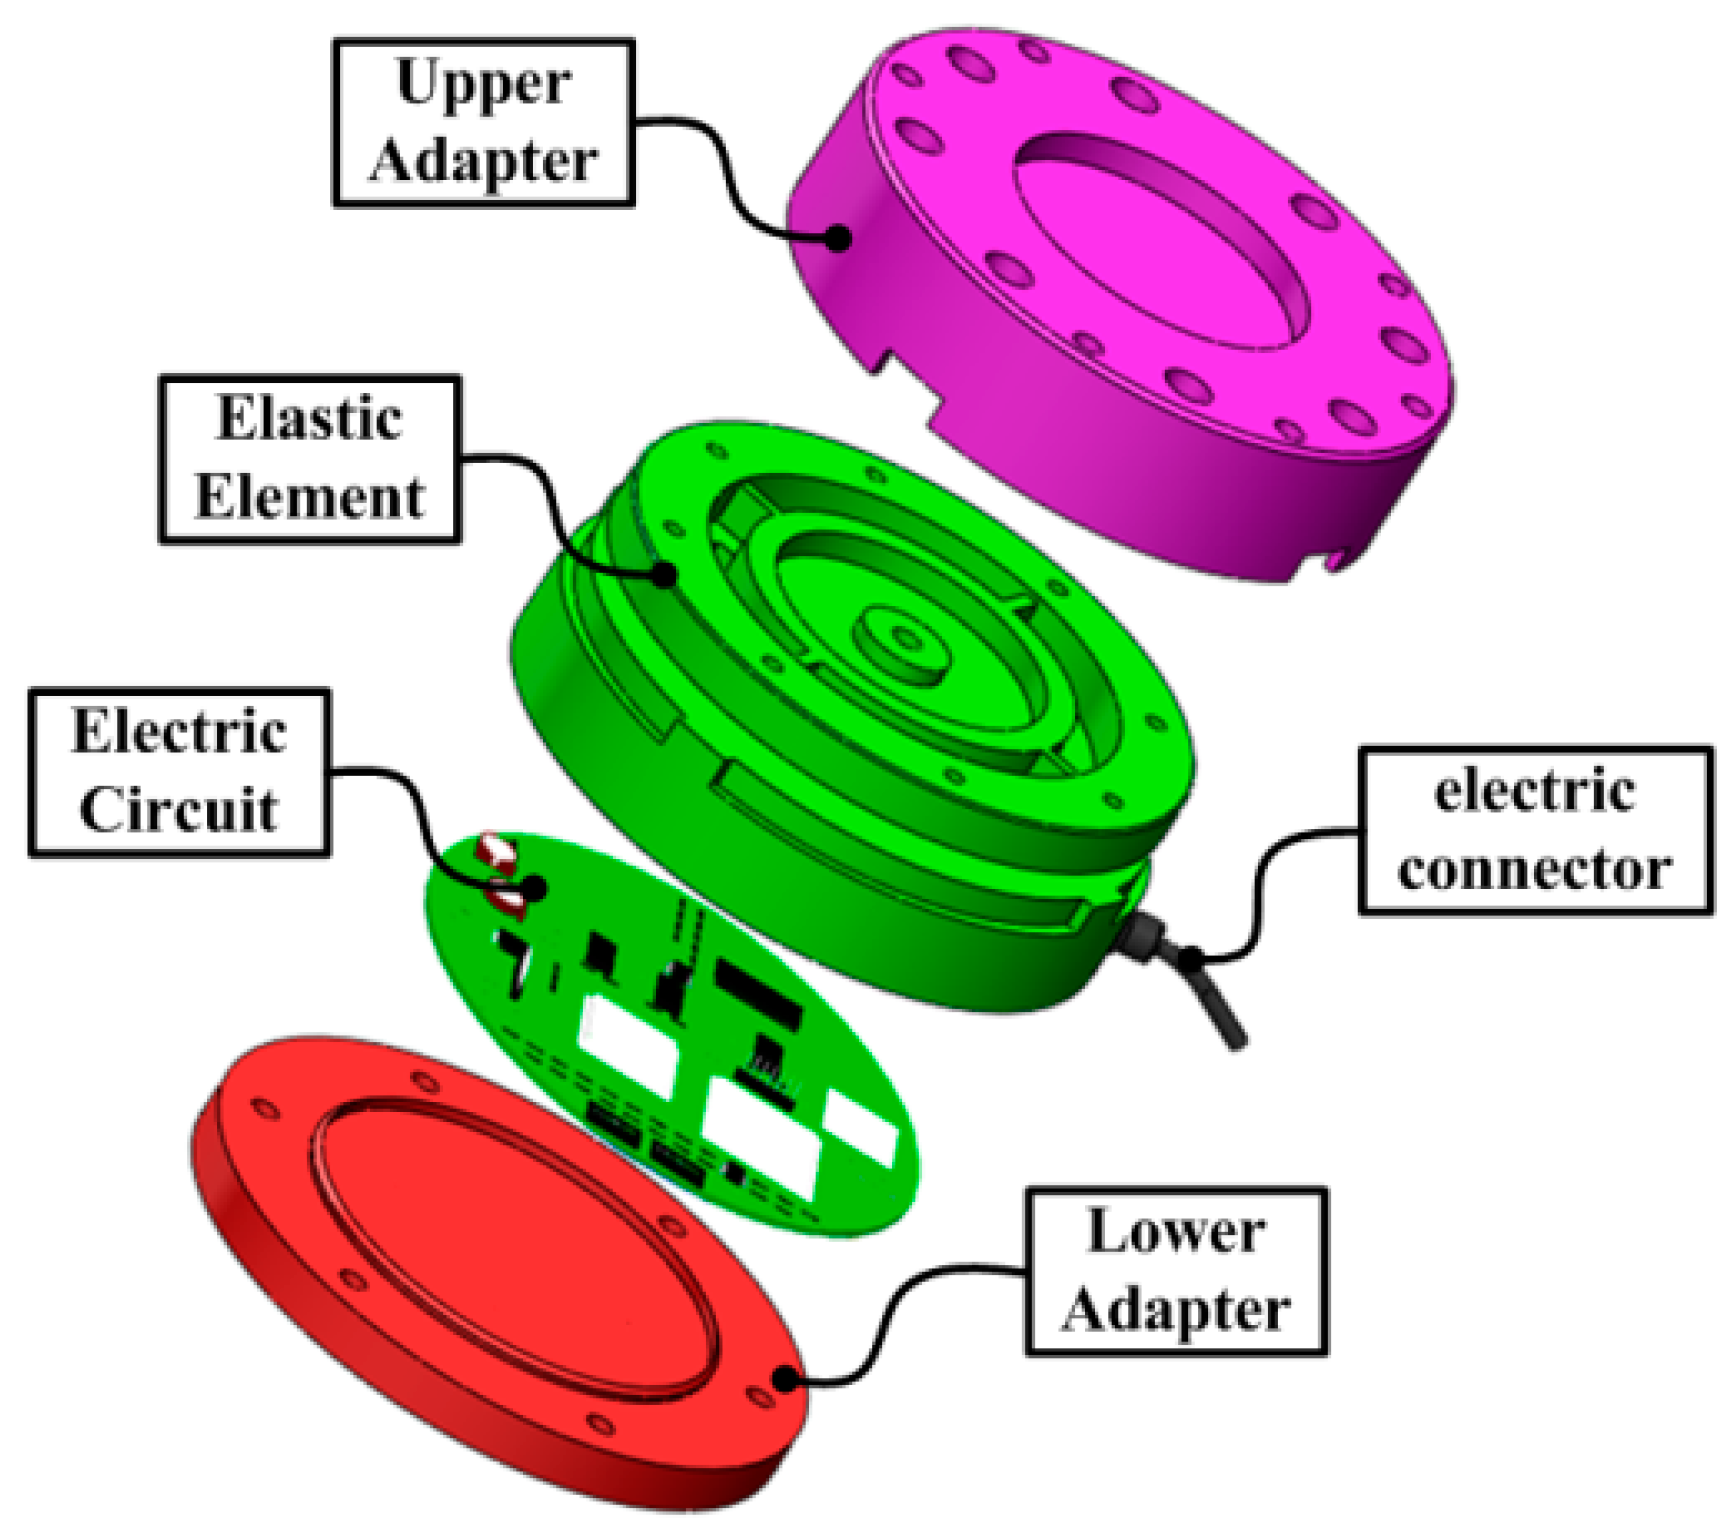
The distinctive design of the proposed six-component cutting F/M sensor consists of four parts as illustrated in 
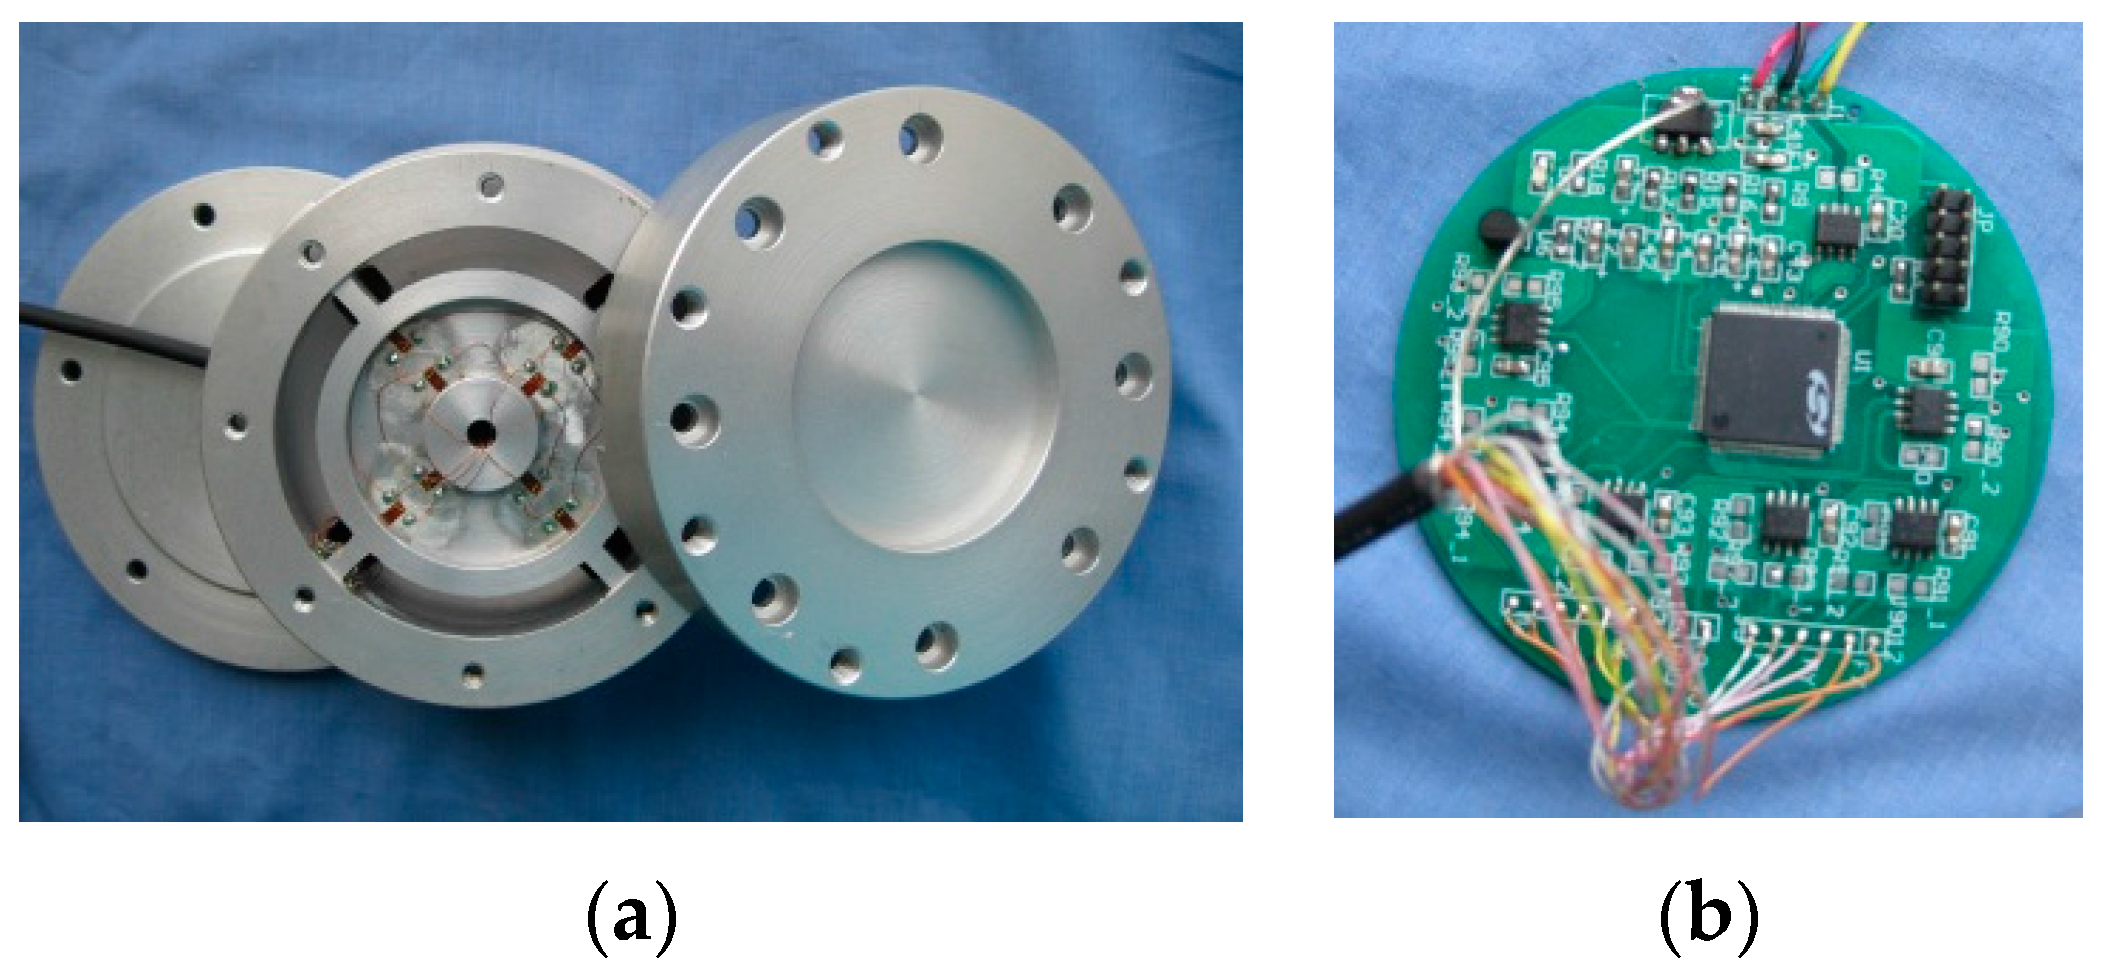
Figure 3. In particular, the upper and lower adapters are connected to the upper and lower portions of the EE by stainless steel screws with controlled torque, respectively. The integrated electric circuit is mounted in the EE, and electrically connected to host computer via the electric connector. The sensor is mounted to the spindle and the machine center via the upper and lower adapters, respectively.
Figure 3. Structure of the proposed sensor.
Sensors 16 00070 g003

3.3. Structure of Elastic Force-Sensing Elements

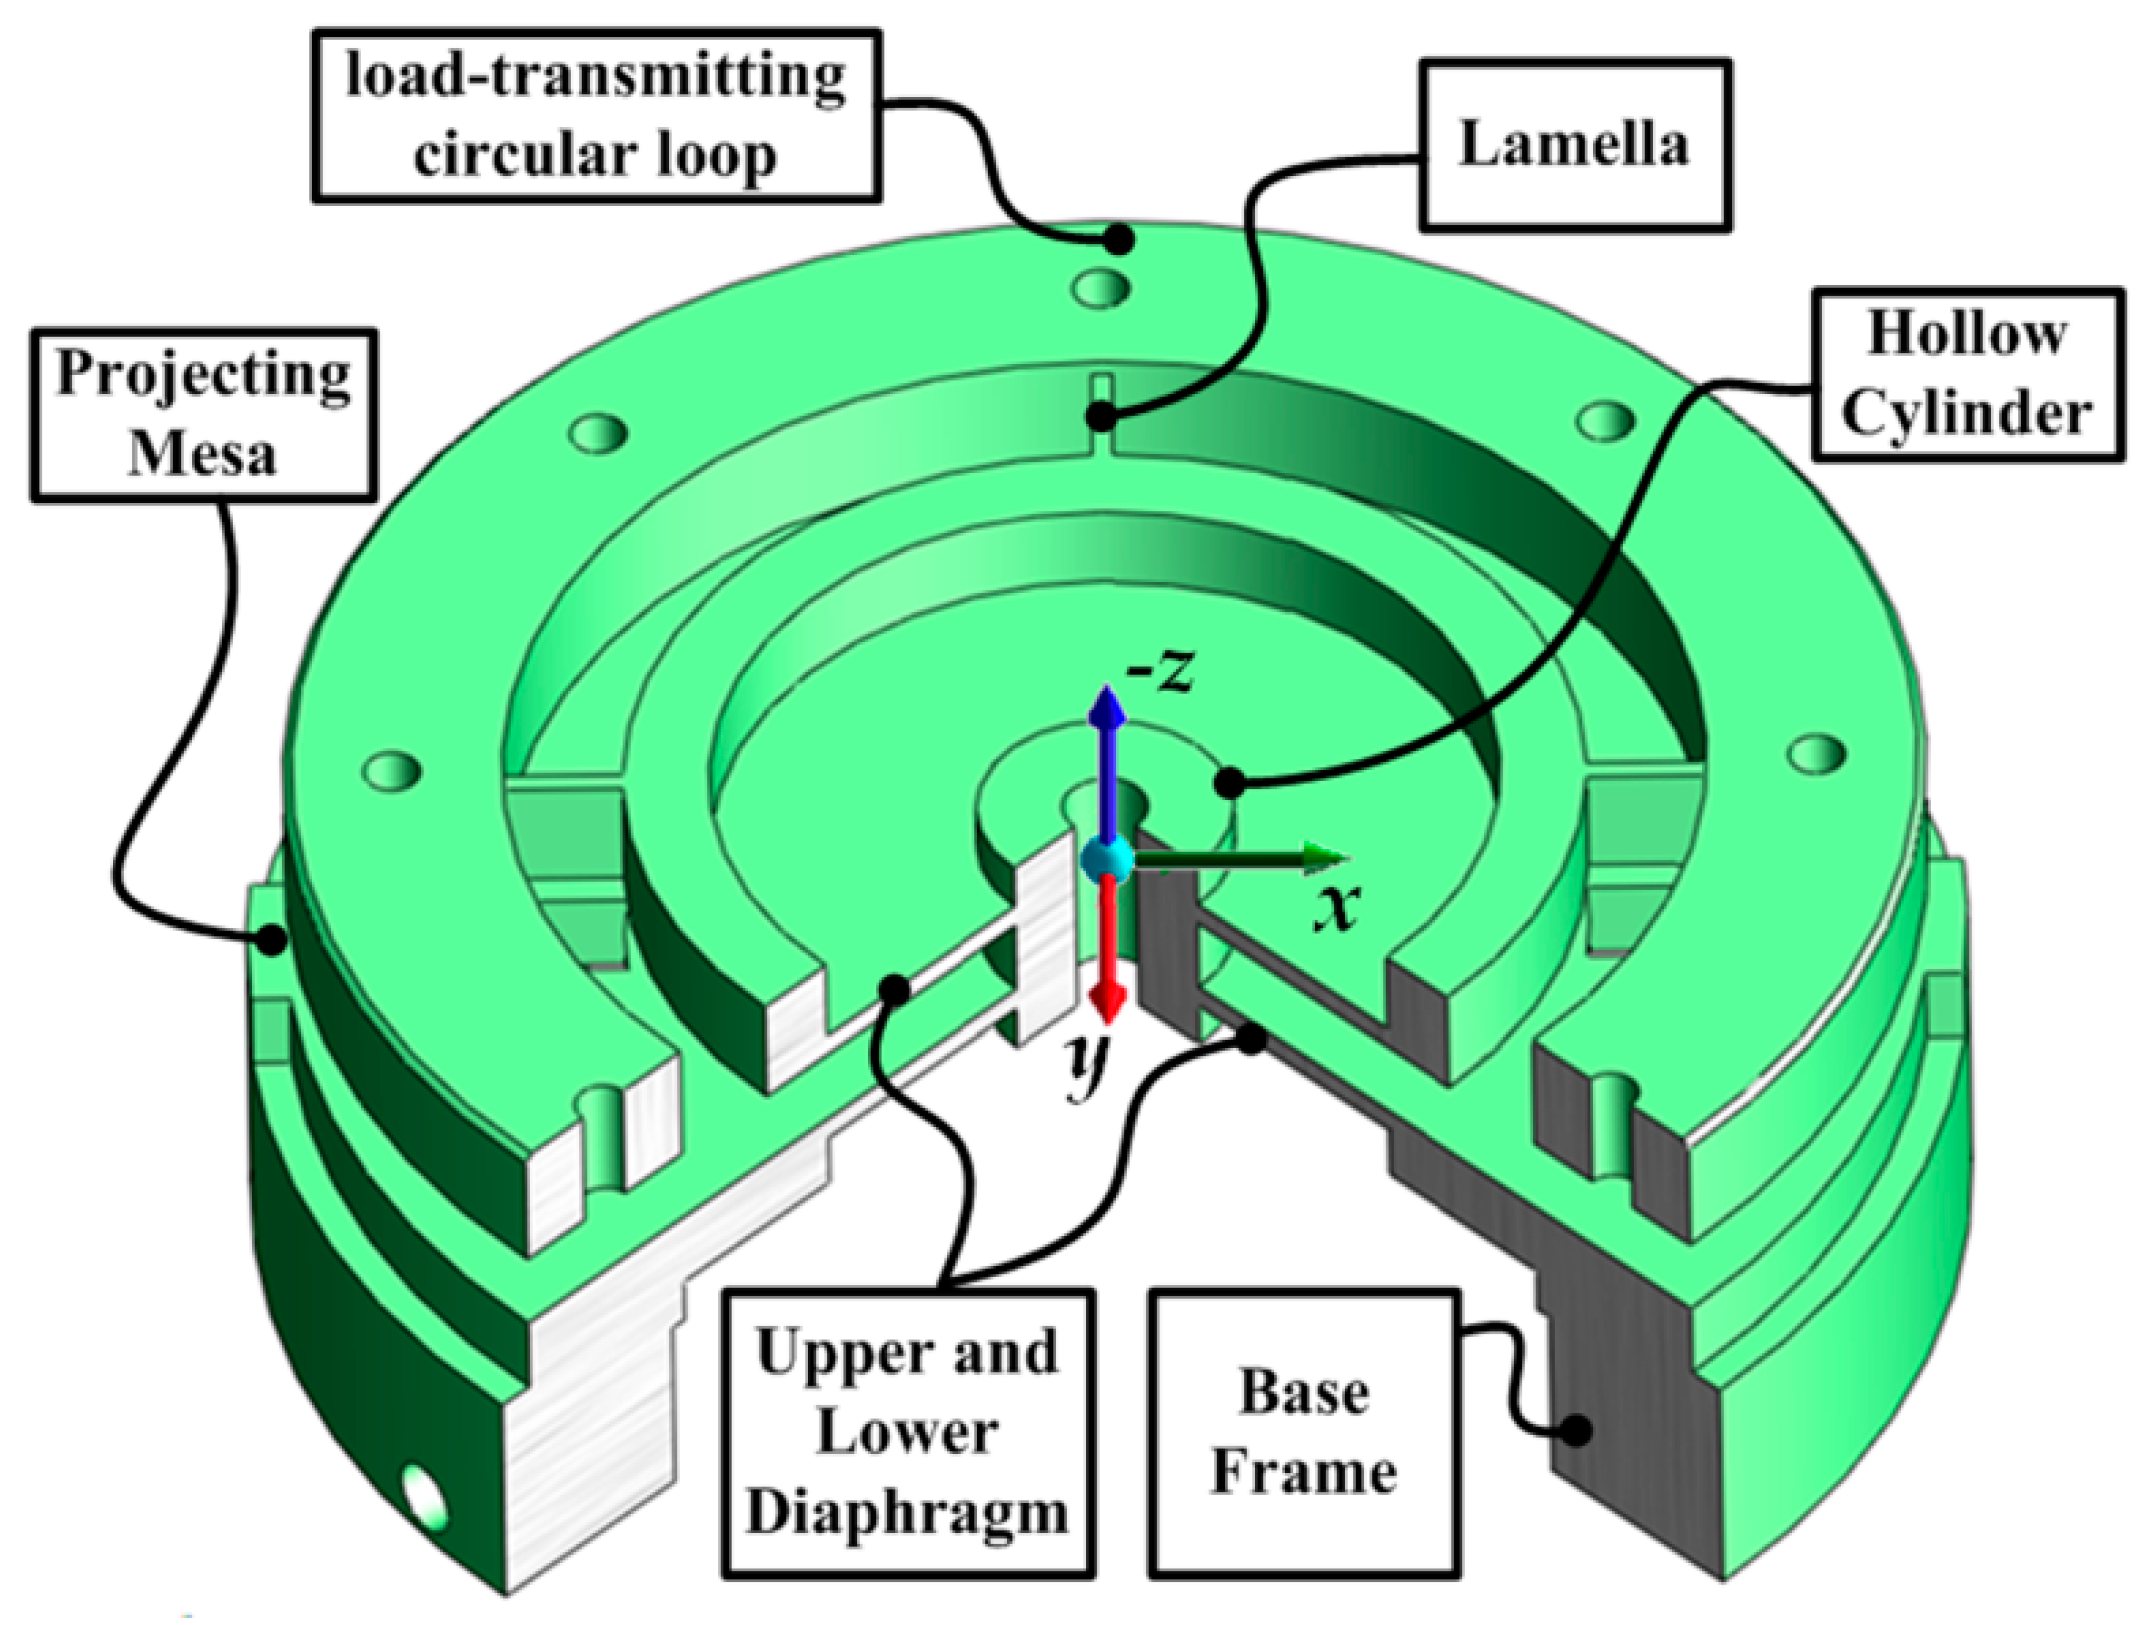
Briefly, the monolithic EE consists of double circular diaphragms, connected by a center hollow cylinder, four lamellas whose axes are perpendicular to each other in a cross-shape, a load-transmitting circular loop that transmits the cutting load, and a base frame (as indicated in Figure 4). The base frame and the circular loop connect with the upper and lower adapters by bolts, respectively.
Practically, the EE transmits the applied cutting load into deformations of its flexible sensing portions through its double diaphragms and lamellas. In particular, the upper diaphragm that serves as an elastic portion is bonded with two groups of strain gauges, and it is responsive to the applied moment to be measured Mx, My. Similarly, the lower diaphragm that serves as an elastic portion is bonded with three groups of strain gauges, and it is responsive to the applied force Fx, Fy, and Fz. Additionally, the lamellas that act as elastic portions are bonded with four strain gauges, and they are sensitive to the moment Mz.
Figure 4. 3D model of the monolithic EE structure.
Sensors 16 00070 g004
When the forces to be measured Fx, Fy or Fz act on the sensor, the circular loop connected with the upper adapter floats, while the base frame conneted with the lower adapter acts as a fixed support. Consequently, corresponding elastic deformation and strain will take place on the lower diaphragm. Accordingly, when the moment to be measured Mx (or My) act on the sensor, elastic deformations mainly take place on the upper and lower circular diaphragms. When the moment to be measured, Mz, acts on the load-transmitting circular loop, the inner borders of the lamellas provide fixed support while the outer borders of the lamellas float. Corresponding elastic deformation and strain consequently take place on the lamellas.

4. Optimal Determination of the Elastic Element Dimensions

4.1. Theoretical Analysis

The radial and tangential strains on the diaphragms induced by the applied cutting force can be expressed by:
ξ r ( r ) = h 2 d 2 ζ d r 2 = 3 F ( ς + 2 ) ( 1 μ 2 ) 4 π E h 2
ξ t ( r ) = h 2 d ζ d r = 3 ς F ( 1 μ 2 ) 4 π E h 2
where:
ς = 2 ln 2 r d ι ι d 2 4 r 2
ι = 4 D 2 d 2 D 2 ln D 2 d
where E and µ are the Young’s modulus and the Poisson’s ratio, respectively. d, D, and h are the inner circle diameter, the extended circle diameter, and the thickness of the diaphragm, respectively.
The corresponding radial and tangential stresses that occur on the diaphragm can be obtained by the expressions below:
ϑ r ( r ) = E 1 μ 2 ( ξ r + μ ξ t ) = 3 F 4 π h 2 [ ( μ + 1 ) ς + 2 ]
ϑ t ( r ) = E 1 μ 2 ( ξ t + μ ξ r ) = 3 F 4 π h 2 [ ( μ + 1 ) ς + 2 μ ]
The radial strain and stress on the lamellas (of dimensions l, b, and h) induced by the applied cutting force can be expressed by:
ξ r ( x ) = h 2 d 2 ζ d x 2 = 6 F b h 2 E ( 3 2 l x )
ξ t ( x ) = E h 2 d 2 ζ d x 2 = 6 F b h 2 ( 3 2 l x )

4.2. Simulation-Driven Optimization (SDO)

In general, multi-component force sensors always suffer from a critical drawback in the form of tradeoffs. These tradeoffs are typical in mechanical design and consist of a compromise between different performance characteristics such as sensitivity and stiffness, isotropy and coupling, static and dynamic performances. For example, optimum absolute sensor sensitivity corresponds to the desire of generating as much elastic strain as possible in the EE. However, both sensor sensitivity and general stiffness strongly depend on the geometrical parameters of the EE structure. More specifically, maximizing the sensor sensitivity is in contradiction with maximizing the general stiffness. Consequently, the optical design and development of a multi-component cutting F/M sensor is complicated and cannot be realized through direct optimization methods.
The SDO makes the procedure of new product development faster and more efficient. Design Exploration (DE) is a useful tool supplied by ANSYS Inc. (Pittsburgh, PA, USA), which could be performed to simulate the part response according to input parameter changes. Moreover, associated with response surface tools and optimization approaches, it can provide the most appropriate choices of input parameters to fulfill the system requirements. A design parameters study was performed via SDO to yield a set of feasible complete designs and make sure that the proposed sensor meets given performance requirements. A set of design parameters is defined by the independent geometric dimensions of the lamellas, the upper and lower diaphragms. Additionally, the max-deformation, the min-strain, the max-stress, and the primary response are set as output parameters. Table 2 shows the ranges for design parameters and objectives for output variables considered in the design parameter study. Each objective is set with the identical importance weight. Specifically, the first and third objectives about deformation and stress are adopted to enable that the EE works in the region below its elastic limit and at the same time enables cutting force measurement with satisfying stiffness, accuracy and linearity. Additionally, the second and fourth objectives related to the strain and the primary response frequency are considered to make sure that the system has superior performances such as high resolution and sensitivity, as well as satisfying dynamic performance.
Table 2. Design parameters and output variables.
Design ParametersOutput Variables
ParameterExtended Circle DiameterDiaphragm ThicknessLamella ThicknessLamella LengthMaximum Total Deformation (mm)Minimum Elastic Strain (10−6 mm/mm)Maximum Equivalent Stress (MPa)The Primary Response Frequency (Hz)
VariableP1P2P3P4P5P6P7P8
Bound/Objective40 < P1 < 501 < P2 < 41 < P3 < 37 < P4 < 12P5 < 0.03P6 > 100P7 < 60P8 > 500
Candidate 149.551.05511.1191.3780.0273159.88439.572744.3
Candidate 246.351.0317.3342.4020.0265134.27254.7191210.4
Candidate 347.951.14910.2972.6580.0192130.07240.9161043.7
Figure 5 shows a graphical display of design parameters that demonstrate particular configurations of EE model associated with the corresponding output variables. Additionally, it also illustrates what each objective could achieve and if it entails sacrificing the objective of another output variable. Three best candidate sets with corresponding output variables that are most in alignment with all objectives are listed in the Table 2. Candidate set 1 is adopted in this design.
Figure 5. Parameters chart of SDO: design points with different colors generated via varied combination of the input parameters.
Sensors 16 00070 g005
The influence ranks of input parameters over the output variables are calculated and shown in the Figure 6, and the greater positive sensitivity indicates greater impact on output variables positively, while more negative sensitivity means greater negative impact on output variables. From the sensitivity plot, it can be seen that the most noticeable parameter to each output variable are the membrane thickness as well as the lamella thickness.
Figure 6. Sensitivity of the input parameters with respect to each output variables.
Sensors 16 00070 g006
The relationships between design parameters and the variation of the output variables are illustrated in Figure 7. One can view the sensing system performances vary with respect to the design parameters intuitively, which is helpful to identify and understand specific changes to meet the corresponding requirements for the sensing system.
Figure 7. Relationships between design parameters and output variables: (a) Maximum deformation versus P1 and P3; (b) Minimum strain versus P1 and P2; (c) Maximum equivalent stress versus P1 and P3; (d) The first response frequency versus P4 and P5.
Sensors 16 00070 g007

4.3. Dynamic Properties of the Sensor

The cutting force sensing system will respond dynamically when it is subject to applied cutting force in machining processes. Therefore, the identification of dynamic properties of the sensor is important both for dynamic measurement and control implementation thereafter.
A modal analysis is performed to measure and analyze the dynamic response of the sensor, e.g., vibration characteristics. A stiff support is set to the sensor base frame, and the interest responding frequencies is limited from the first to sixth frequencies, which are evaluated and displayed in Table 3. Moreover, the result also illustrate that the first two natural frequencies are almost the identical due to the symmetric structure of the sensor.
Table 3. The first six natural frequencies of the sensor.
Mode123456
Responding Frequency (Hz)744.3748.41291.81317.72869.92999.5
Furthermore, a harmonic analysis is performed with ANSYS to identify and predict the sustained dynamic behavior of the sensor subjected to harmonically varying loads. When a load and a fixed support are applied at the circular loop and base frame of the sensor(see Figure 4) respectively, the corresponding output normal elastic strain of the diaphragms are obtained (as illustrated in Figure 8) to verify whether the design can successfully withstand forced vibration and not undergo resonance.
Figure 8. Harmonic response of the diaphragm under the measuring force component Fx (a) and Fz (b).
Sensors 16 00070 g008

5. Cutting Force Sensor Fabrication

5.1. The Arrangement Strategy of the Strain Gauges

Six groups of strain gauges are mounted in the areas of highest strain on the EE with considerations of maximizing the sensitivity to various components of cutting force and moment. 24 strain gauges (LY11, manufactured by HNM GmbH Inc., Balgheim, Germany) are bonded on the EE as shown in the Figure 9. Specifically, active strain gauges R1, R2, R3, and R4 (R5, R6, R7, and R8) are arranged on the lower diaphragm along the x-axis (y-axis) to detect force Fx (force Fy). Another four 45-degree active gauges R9, R10, R11, and R12 are bonded on the lower diaphragm along its radial axis to measure cutting force along z-axis Fz. Also, four active strain gauges R13, R14, R15, and R16 (R17, R18, R19, and R20) are instrumented on the upper diaphragm along the x-axis (y-axis) to detect cutting moment about y-axis My (cutting moment about x-axis Mx). Additionally, four active gauges R21, R22, R23, and R24 are bonded on the lamella along its longitudinal direction to detect cutting moment about z-axis Mz.
Figure 9. Arrangement strategy of the strain gauges: (a) Gauges emplacement on the upper diaphragm; (b) Gauges emplacement on the lower diaphragm.
Sensors 16 00070 g009
The bonded gauges resistances will vary when the external cutting forces are applied to the sensor. Table 4 summarizes the variations of the each gauge resistance due to six components of the cutting force with the FEA. In addition, the symbols “+” and “−” in the table indicate an increase and decrease of the gauge resistance, respectively. While the symbols “=” and “0” represent identical and no variation, respectively. It is revealed that the strains obtained from the derived equations are in agreement with the results from the FEA.
Table 4. Variations of resistances of strain gauges.
FxFyFzMxMyMz FxFyFzMxMyMz
Fx-bridgeR1+0+00+Mx-bridgeR170+++0+
R2-0-00+R180+--0+
R3+0-00+R190--+0+
R4-0+00+R200-+-0+
Fy-bridgeR50++00+My-bridgeR13-0+0++
R60--00+R14-0-0-+
R70+-00+R15+0-0++
R80-+00+R16+0+0-+
Fz-bridgeR9+++00+Mz-bridgeR21==+0+-
R10---00+R22==+0+-
R11++-00+R23==+0++
R12--+00+R24==+0++

5.2. The Measuring Circuit

In practice, strain gauges measurements always involve quantities smaller than a few milli-strain (10−3 mm/mm), and their corresponding changes in resistance are extremely minute. Therefore, strain gauges are electrically connected to form six full-bridge configuration Wheatstone bridge circuits to detect six components of cutting load with high accuracy independently, as shown in Figure 10. The excitation diagonals of the Wheatstone bridges are connected to a voltage excitation, and the corresponding outputs voltage ΔVi will appear on the measurement diagonals of the bridges.
Figure 10. Electrical circuits of the strain gauges.
Sensors 16 00070 g010

5.2.1. Subjected to a Cutting Force Fx

While the system is individually applied with the tangential cutting force Fx (similar to Fy), the resistances changes in the way as defined in the Table 4. Therefore, the output signals can be expressed as follows:
Δ V 1 = V E 4 ( Δ R 1 R 1 Δ R 2 R 2 + Δ R 3 R 3 Δ R 4 R 4 ) = V E 4 [ 2 ( Δ R 1 R 1 ) ε 2 ( Δ R 2 R 2 ) ε ] = V E 4 [ 2 | ( Δ R 1 R 1 ) ε | + 2 | ( Δ R 2 R 2 ) ε | ]
Δ V 2 = V E 4 ( Δ R 5 R 5 Δ R 6 R 6 + Δ R 7 R 7 Δ R 8 R 8 ) = 0
Δ V 3 = V E 4 ( Δ R 9 R 9 Δ R 10 R 10 + Δ R 11 R 11 Δ R 12 R 12 ) = 0
Δ V 4 = V E 4 ( Δ R 17 R 17 Δ R 18 R 18 + Δ R 19 R 19 Δ R 20 R 20 ) = 0
Δ V 5 = V E 4 ( Δ R 13 R 13 Δ R 14 R 14 + Δ R 15 R 15 Δ R 16 R 16 ) = 0
Δ V 6 = V E 4 ( Δ R 21 R 21 Δ R 22 R 22 + Δ R 23 R 23 Δ R 24 R 24 ) = 0
where the ( Δ R i / R i ) ε represents the resistance variation rate of the gauge Ri, caused by the strain change. The above analysis shows that only the Fx-bridge is dependent on the applied cutting force Fx, and the outputs of else bridge circuits are independent.

5.2.2. Under the Normal Cutting Force Fz

Under a cutting force Fz action the corresponding output voltages of the sensor can be written as follows:
Δ V 3 = V E 4 ( Δ R 9 R 9 Δ R 10 R 10 + Δ R 11 R 11 Δ R 12 R 12 ) = V E 4 [ 2 ( Δ R 9 R 9 ) ε 2 ( Δ R 10 R 10 ) ε ] = V E 4 [ 2 | ( Δ R 9 R 9 ) ε | + 2 | ( Δ R 10 R 10 ) ε | ]
Δ V 1 = Δ V 2 = Δ V 4 = Δ V 5 = Δ V 6 = 0

5.2.3. Under the Cutting Moment about the Tangential Axis Mx (Similar to My)

Under the cutting moment Mx action the sensor output signals can be derived as:
Δ V 4 = V E 4 ( Δ R 17 R 17 Δ R 18 R 18 + Δ R 19 R 19 Δ R 20 R 20 ) = V E 4 [ 2 ( Δ R 17 R 17 ) ε 2 ( Δ R 18 R 18 ) ε ] = V E 4 [ 2 | ( Δ R 17 R 17 ) ε | + 2 | ( Δ R 18 R 18 ) ε | ]
Δ V 1 = Δ V 2 = Δ V 3 = Δ V 5 = Δ V 6 = 0

5.2.4. Subjected to a Cutting Moment Mz

Under a cutting moment an Mz action the lamellas with strain gauges will be subjected to a tensile/compressive stress. As a result, the output signals of the sensor can be expressed as:
Δ V 6 = V E 4 ( Δ R 21 R 21 Δ R 23 R 23 + Δ R 22 R 22 Δ R 24 R 24 ) = V E 4 [ 2 ( Δ R 21 R 21 ) ε 2 ( Δ R 23 R 23 ) ε ] = V E 4 [ 2 | ( Δ R 21 R 21 ) ε | + 2 | ( Δ R 23 R 23 ) ε | ]
Δ V 1 = Δ V 2 = Δ V 3 = Δ V 4 = Δ V 5 = 0
Hence, each force/moment component of the cutting load can only generate an output voltage of the corresponding bridge circuit, which means the coupling among the sensor components is negligible in theory. In addition, it is seen that the electrical circuits characterized with intrinsic compensation for temperature drift.

6. Calibration and Characterization of the Sensor

A prototype of the sensor system for cutting force measurement in machining processes with an integrated electric circuit has been constructed, as shown in Figure 11. The sensor has a total size of Φ 80 mm × 42 mm. The measurement range of the system is set to 0–250 N for cutting force Fz, ±200 N for cutting forces in shear directions (Fx and Fy), and ±10 Nm for cutting moments around normal axis, and ±8 Nm for cutting moments around the shear axis.
Figure 11. Prototype of the sensor system for cutting force measurement: (a) the upper adapter, EE and the lower adapters; (b) the integrated electric circuit.
Sensors 16 00070 g011
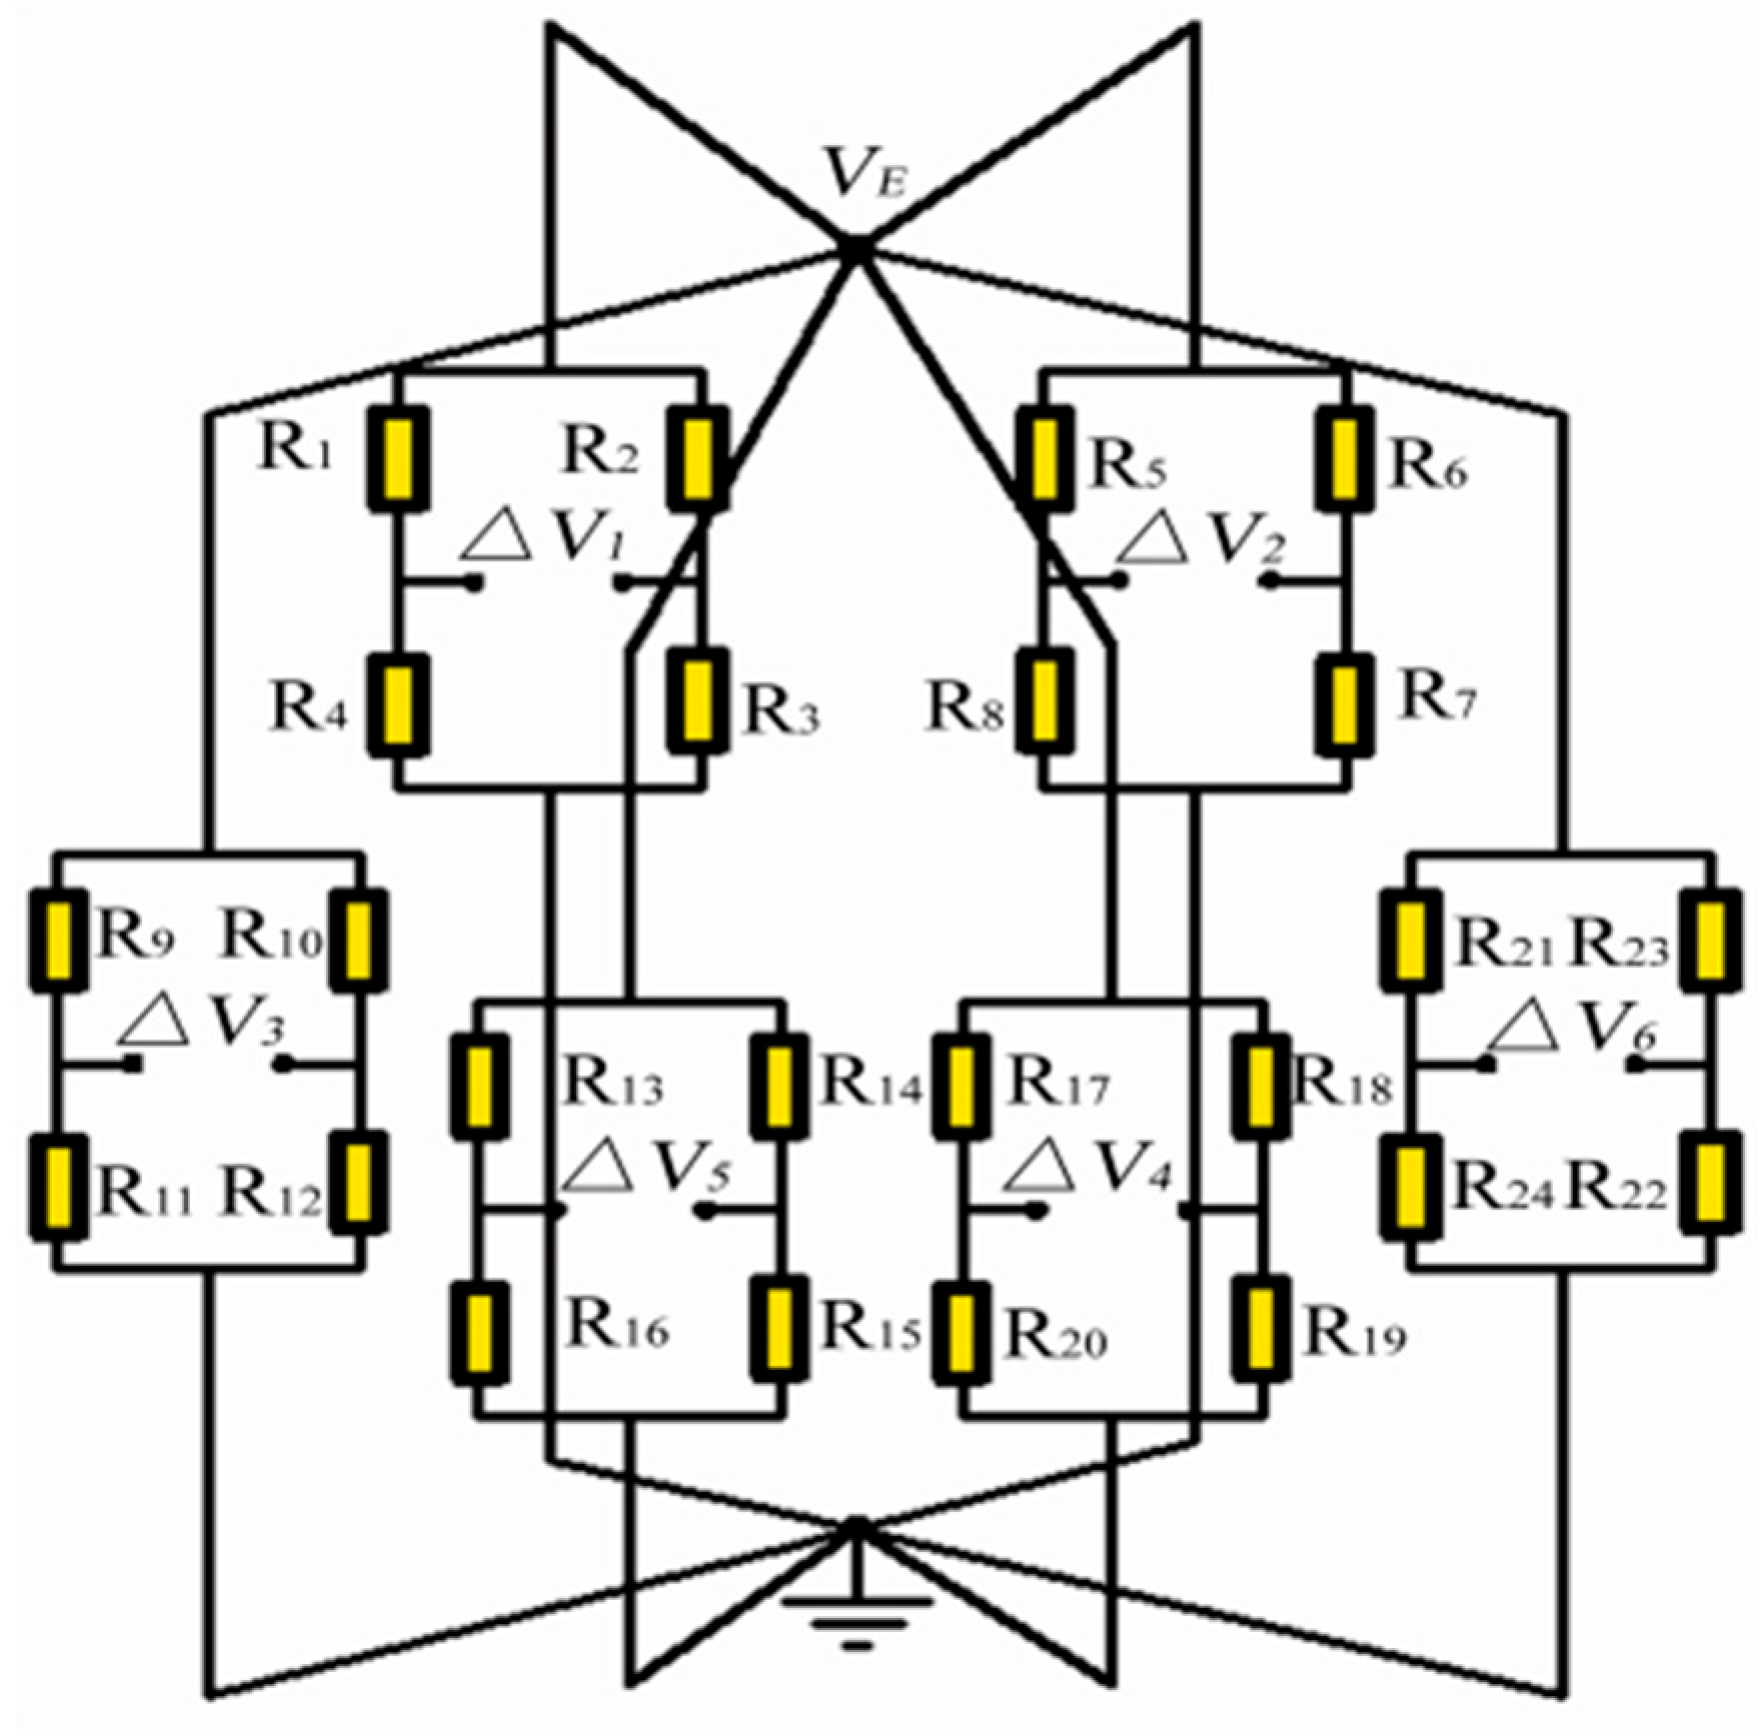
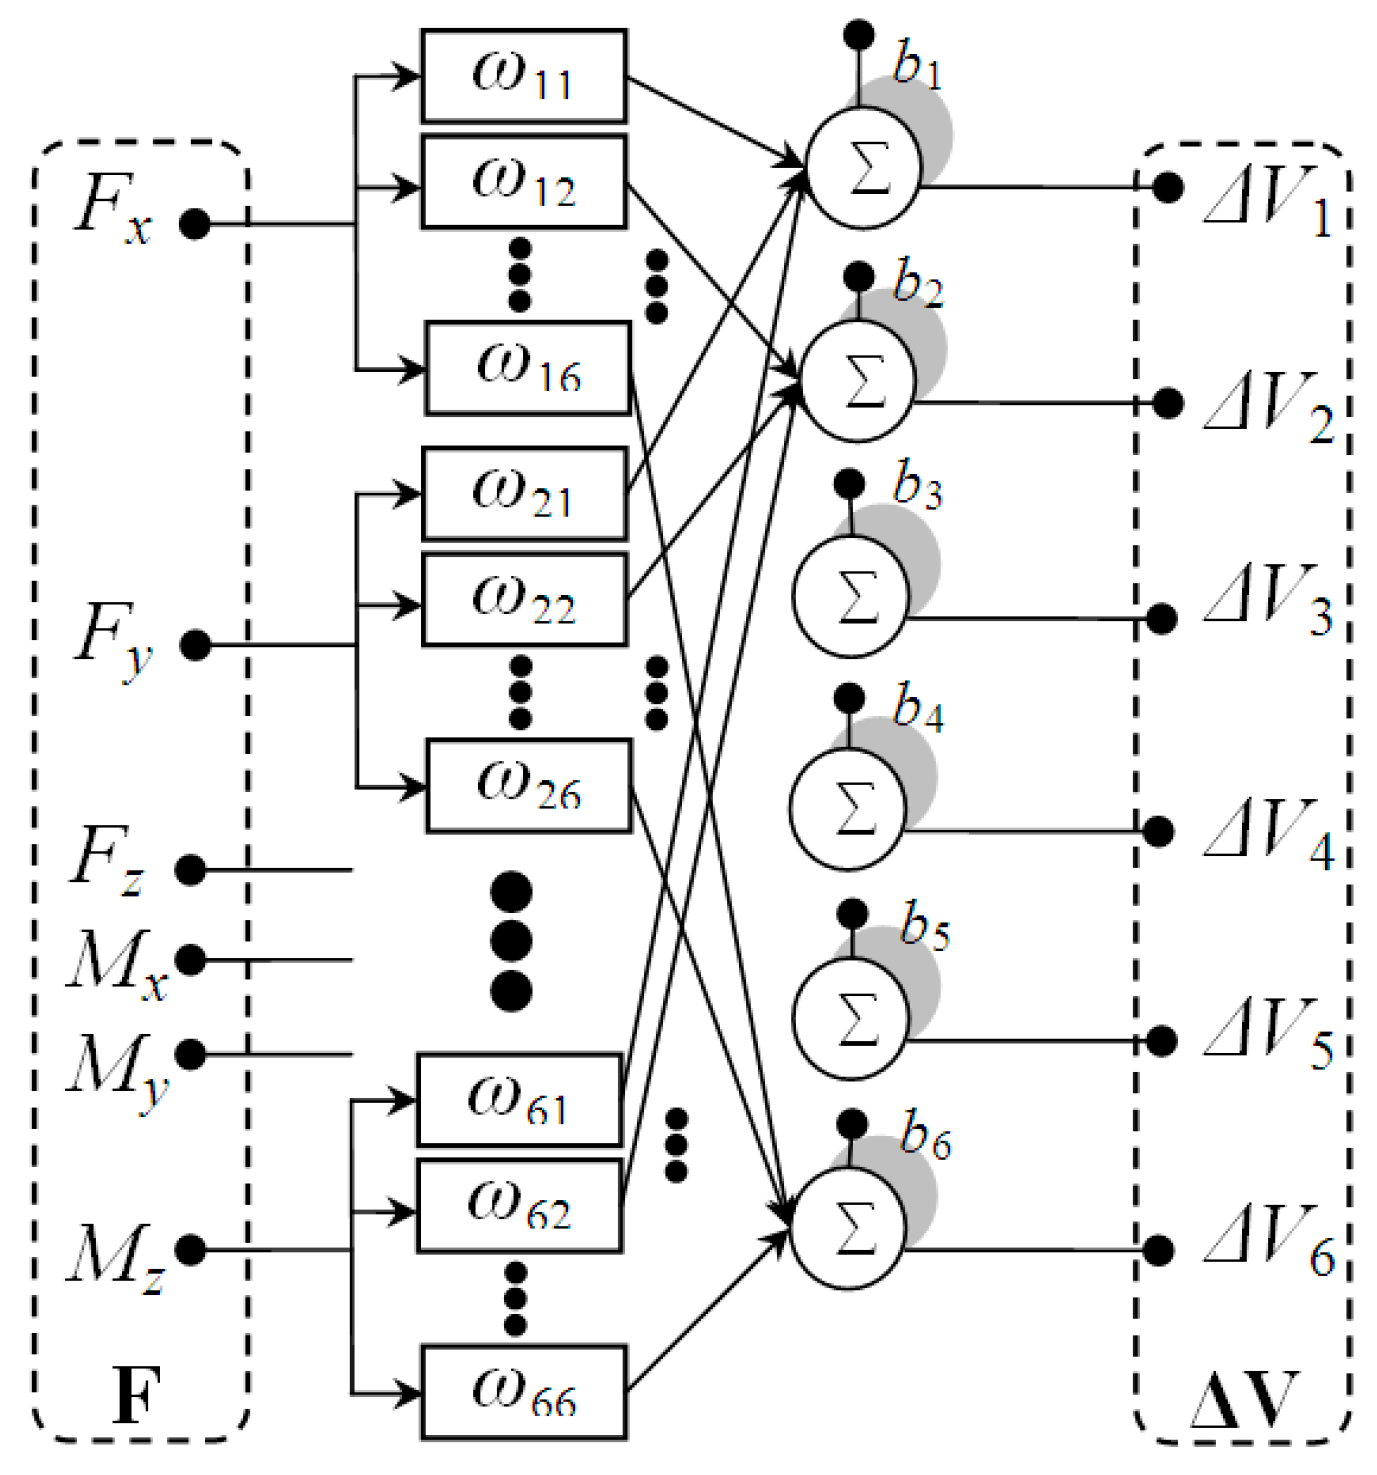
Precise calibration and decoupling of multi-dimensional cutting force sensor system is critical and must be addressed. The coupling effects among cutting force and moment components are depicted in Figure 12. The relationship between the applied cutting load and output of the system could be expressed as:
Δ V = F W + b
With the method and procedure previously proposed in [17], calibration and decoupling experiment of the proposed system are carried out. Table 5 shows the outputs of the sensor under different applied cutting forces and moments. Specifically, the outputs of the components have a good symmetry about the zero point.
Table 5. The outputs of the sensor.
ComponentFxFyFzMxMyMz
Applied load-----−10 Nm
Corresponding output-----−3.40 V
Applied load−200 N−200 N0 N−8 Nm−8 Nm−8 Nm
Corresponding output−4.48 V−4.35 V−0.0034 V−4.03 V−3.91 V−2.72 V
Applied load−150 N−150 N50 N−6 Nm−6 Nm−6 Nm
Corresponding output−3.41 V−3.31 V0.73 V−3.08 V−2.98 V−2.04 V
Applied load−100 N−100 N100 N−4 Nm−4 Nm−4 Nm
Corresponding output−2.35 V−2.28 V1.40 V−2.12 V−2.06 V−1.36 V
Applied load−50 N−50 N150 N−2 Nm−2 Nm−2 Nm
Corresponding output−1.27 V−1.25 V2.07 V−1.15 V−1.10 V−0.68 V
Applied load0 N0 N200 N0 Nm0 Nm0 Nm
Corresponding output−0.00153 V−0.00168 V2.72 V0.0006 V0.00229 V0.0032 V
Applied load50 N50 N250 N2 Nm2 Nm2 Nm
Corresponding output1.28 V1.26 V3.35 V1.15 V1.11 V0.66 V
Applied load100 N100 N-4 Nm4 Nm4 Nm
Corresponding output2.40 V2.28 V-2.11 V2.05 V1.37 V
Applied load150 N150 N-6 Nm6 Nm6 Nm
Corresponding output3.43 V3.32 V-3.09 V2.99 V2.08 V
Applied load200 N200 N-8 Nm8 Nm8 Nm
Corresponding output4.5 V4.37 V-4.03 V3.91 V2.80 V
Applied load-----10 Nm
Corresponding output-----3.50 V
Table 6 shows the performance of the proposed cutting force measurement system. From the table, these values show that the proposed system is superior in the maximum coupling and nonlinearity errors. Besides, the system still suffers from slight coupling due to the monolithic EE structure and the attachment error of the strain gauges.
Figure 12. Coupling model of multi-dimensional cutting force sensor system.
Sensors 16 00070 g012
Table 6. The performance of the system.
ComponentFxFyFzMxMyMz
Sensitivity0.02245 V·N−10.02180 V·N−10.0134 V·N−10.5038 V·(Nm)−10.4888 V·(Nm)−10.345 V·(Nm)−1
Maximum coupling error1.07%1.38%0.41%1.47%1.09%0.39%
Maximum nonlinearity error1.75%1.94%1.87%−1.77%−1.69%1.15%

7. Conclusions

In the present study, a new sensor system for cutting force measurement with a novel decoupling EE has been proposed. The sensor is intended to be used in machining processes for measuring tangential and normal forces Fx, Fy and Fz as well as the moments terms Mx, My and Mz simultaneously. By performing a Simulation-Driven Optimization in conjunction with the FEA, the best combination of design parameters is efficiently and scientifically determined. It is revealed that the proposed EE structure with double circular diaphragms may be adopted by other force/moment sensors. As shown in the Table 7, the obtained results demonstrate that the proposed system has satisfied performance and can be utilized to detect static cutting F/M.
Table 7. The performance comparisons with some proven reference sensors.
DeveloperApproach & Measurement PrincipleSize (mm)No. of AxesSensitivityMaximum Relative Error
Tuysuz, Altintas, Feng [9]Indirect & prediction modeln.a.5n.a.8.5%
Rao, Gao, Friedrich [13]Direct & Piezoelectric Integrated into system17 mV/gm9.8%
Kim, Kim [15]Direct & strain gauge and piezo-film accelerometer40 × 70 × 2623 mV·N−1n.a.
Yaldız, Ünsaçar [23]Direct & strain gauge and piezoelectric accelerometer100 × 100 × 5030.1 mV·N−1<5%
Liu, Zhou, Tao, Tan [24]Direct & strain gauge and fiber Bragg grating sensorn.a.3n.a.6.23%
Our approachDirect & strain gaugeΦ 80 × 4260.0134 V·N−1 and 0.345 V (Nm)−1<5%
The sensor system is now being applied to measure cutting loads in machining processes, and reliable results are expected based on the findings reported in this manuscript. For more information about the dynamic cutting F/M measurement and actual cutting experiments, readers should look to our future work with this sensor system.

Acknowledgments

This work was supported in part by the National Nature Science Foundation of China (NSFC 61203207 and 61573134), the Young Core Instructor Foundation of Hunan Provincial Institutions of Higher Education, the Hunan Provincial Natural Science Foundation of China (14JJ1011), the Changsha Science and Technology Program (k1501009-11), and State Key Laboratory of Advanced Design and Manufacturing for Vehicle Body (31565006).

Author Contributions

Qiaokang Liang designed the research, Dan Zhang and Gianmarc Coppola designed the decoupling method. Yaonan Wang and Wei Sun decoupled and characterized the sensors. Jianxu Mao and Yunjian Ge analyzed and interpreted the data. Qiaokang Liang and Gianmarc Coppola co-wrote the manuscript.

Conflicts of Interest

The authors declare no conflict of interest.

References

  1. Elbestawi, M.A.; Dumitrescu, M. Tool condition monitoring in machining-neural networks. Inf. Technol. Balanced Manuf. Syst. 2006, 220, 5–16. [Google Scholar]
  2. Matsushima, K.; Bertok, P.; Sata, T. In process detection of tool breakage by monitoring the spindle current of a machine tool. Meas. Control Batch Manuf. 1982, 1, 145–154. [Google Scholar]
  3. Penedo, F.; Haber, R.E.; Gajate, A. Hybrid incremental modeling based on least squares and Fuzzy-NN for monitoring tool wear in turning processes. IEEE Trans. Ind. Inform. 2012, 8, 811–818. [Google Scholar] [CrossRef]
  4. Zhou, J.H.; Pang, C.K.; Lewis, F.L. Intelligent diagnosis and prognosis of tool wear using dominant feature identification. IEEE Trans. Ind. Inform. 2009, 5, 454–464. [Google Scholar] [CrossRef]
  5. Constantinides, N.; Bennett, S. An investigation of methods for the on-line estimation of tool wear. Int. J. Mach. Tool. Manuf. 1987, 27, 225–237. [Google Scholar] [CrossRef]
  6. Shin, B.C.; Ha, S.J.; Cho, M.W.; Seo, T.I.; Yoon, G.S.; Heo, Y.M. Indirect cutting force measurement in the micro end-milling process based on frequency analysis of sensor signals. J. Mech. Sci. Technol. 2010, 24, 165–168. [Google Scholar] [CrossRef]
  7. Kim, T.Y.; Kim, J. Adaptive cutting force control for a machining center by using indirect cutting force measurements. Int. J. Mach. Tool. Manuf. 1996, 36, 925–937. [Google Scholar] [CrossRef]
  8. Auchet, S.; Chevrier, P.; Lacour, M.; Lipinski, P. A new method of cutting force measurement based on command voltages of active electro-magnetic bearings. Int. J. Mach. Tool. Manuf. 2004, 44, 1441–1449. [Google Scholar] [CrossRef]
  9. Tuysuz, O.; Altintas, Y.; Feng, H.Y. Prediction of cutting forces in three and five-axis ball-end milling with tool indentation effect. Int. J. Mach. Tool. Manuf. 2013, 66, 66–81. [Google Scholar] [CrossRef]
  10. Tsai, C.; Liao, Y. Cutting force prediction in ball-end milling with inclined feed by means of geometrical analysis. Int. J. Adv. Manuf. Technol. 2010, 46, 529–541. [Google Scholar] [CrossRef]
  11. Fussell, B.K.; Jerard, R.B.; Hemmett, J.G. Modeling of cutting geometry and forces for 5-axis sculptured surface machining. Comput. Aided Des. 2003, 35, 333–346. [Google Scholar] [CrossRef]
  12. Ferry, W.B.; Altintas, Y. Virtual five-axis flank milling of jet engine impellers—Part I: Mechanics of five-axis flank milling. J. Manuf. Sci. Eng. 2008, 130. [Google Scholar] [CrossRef]
  13. Rao, B.C.; Gao, R.X.; Friedrich, C.R. Integrated force measurement for on-line cutting geometry inspection. IEEE Trans. Instrum. Meas. 1995, 44, 977–980. [Google Scholar] [CrossRef]
  14. Kim, J.H.; Chang, H.K.; Han, D.C.; Jang, D.Y.; Oh, S.I. Cutting force estimation by measuring spindle displacement in milling process. CIRP Ann-Manuf. Technol. 2005, 54, 67–70. [Google Scholar] [CrossRef]
  15. Kim, J.D.; Kim, D.S. Development of a combined-type tool dynamometer with a piezo-film accelerometer for an ultra-precision lathe. J. Mater. Process. Technol. 1997, 71, 360–366. [Google Scholar] [CrossRef]
  16. Jin, W.L.; Venuvinod, P.K.; Wang, X. An optical fibre sensor based cutting force measuring device. Int. J. Mach. Tools Manuf. 1995, 35, 877–883. [Google Scholar] [CrossRef]
  17. Liang, Q.; Zhang, D.; Ge, Y.; Song, Q. A novel miniature four-dimensional force/torque sensor with overload protection mechanism. IEEE Sens. J. 2009, 9, 1741–1747. [Google Scholar] [CrossRef]
  18. Liang, Q.; Zhang, D.; Coppola, G.; Wang, Y.; Sun, W.; Ge, Y. Multi-Dimensional MEMS/Micro Sensor for Force and Moment Sensing: A Review. IEEE Sens. J. 2014, 14, 2643–2657. [Google Scholar] [CrossRef]
  19. Park, S.S. High Frequency Bandwidth Cutting Force Measurements in Milling Using the Spindle Integrated Force Sensor System. Ph.D. Thesis, University of British Columbia, Vancouver, BC, Canada, 2003. [Google Scholar]
  20. Jantunen, E. A summary of methods applied to tool condition monitoring in drilling. Int. J. Mach. Tools Manuf. 2002, 42, 997–1010. [Google Scholar] [CrossRef]
  21. Bayo, E.; Stubbe, J.R. Six-axis force sensor evaluation and a new type of optimal frame truss design for robotic applications. J. Robot. Syst. 1989, 6, 191–208. [Google Scholar] [CrossRef]
  22. Svinin, M.M.; Uchiyama, M. Optimal geometric structures of force/torque sensors. Int. J. Robot. Res. 1995, 14, 560–573. [Google Scholar] [CrossRef]
  23. Yaldız, S.; Ünsaçar, F. A dynamometer design for measurement the cutting forces on turning. Measurement 2006, 39, 80–89. [Google Scholar] [CrossRef]
  24. Liu, M.; Zhou, Z.; Tao, X.; Tan, Y. A dynamometer design and analysis for measurement the cutting forces on turning based on optical fiber Bragg Grating sensor. In Proceedings of the 2012 10th World Congress on Intelligent Control and Automation (WCICA), Beijing, China, 6–8 July 2012.

