
Inertial Sensor Technology for Elite Swimming Performance Analysis: A Systematic Review

 and
and
Abstract
:1. Introduction

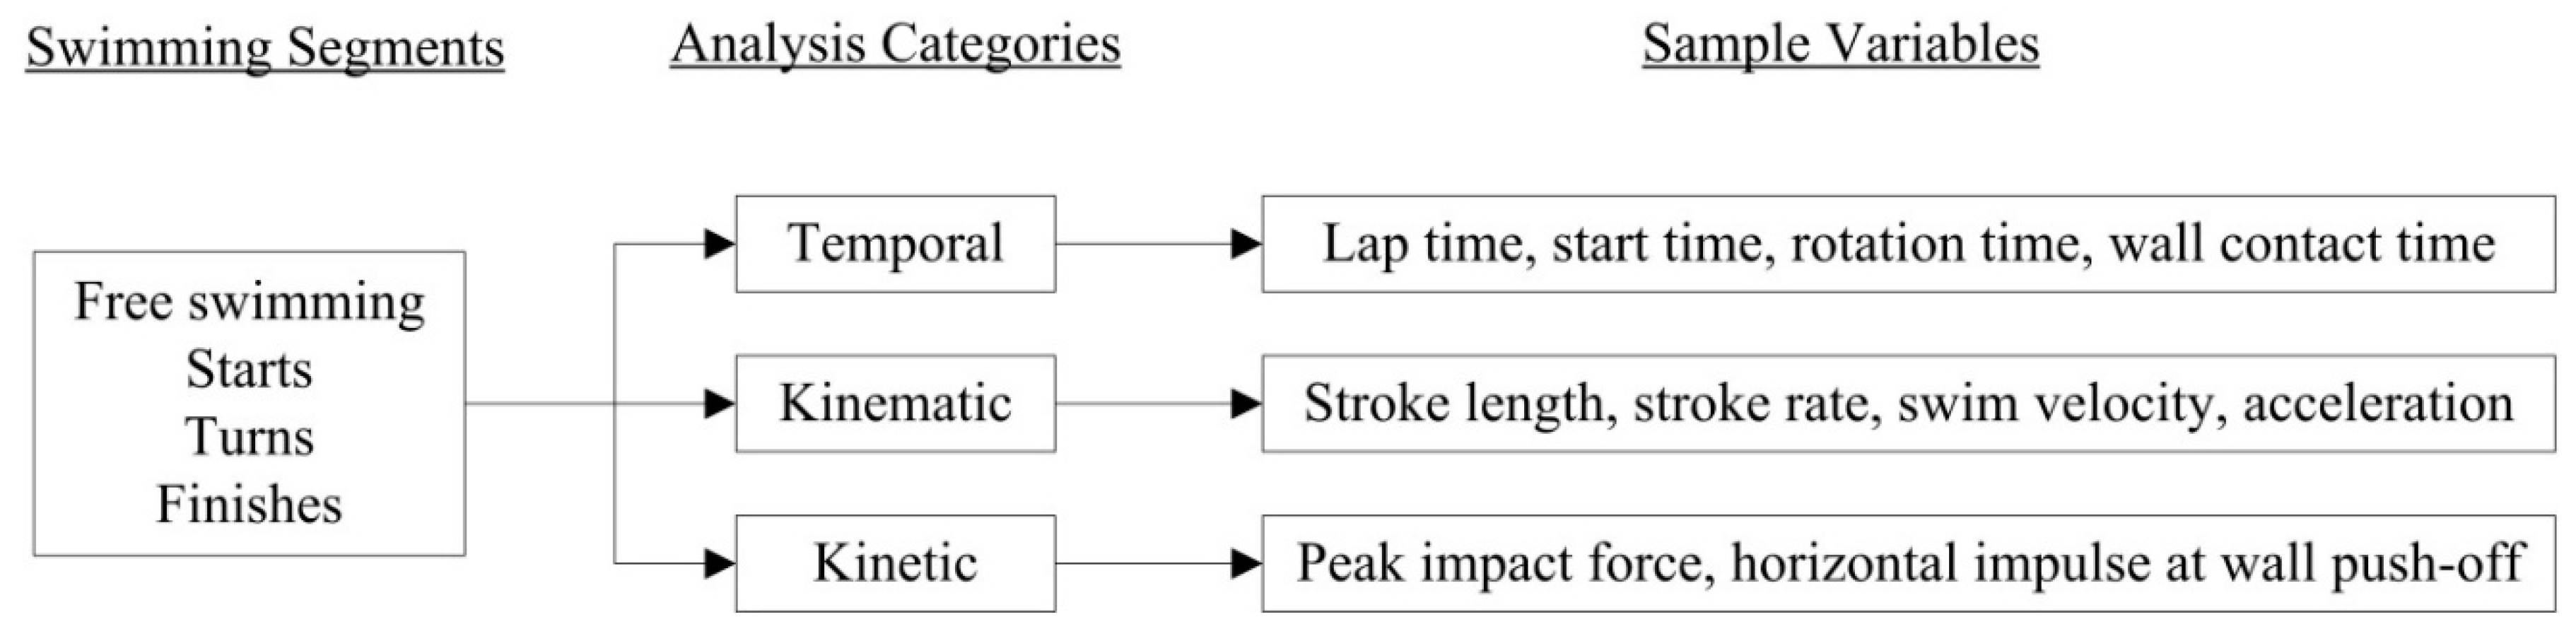
2. Methods
2.1. Review Questions
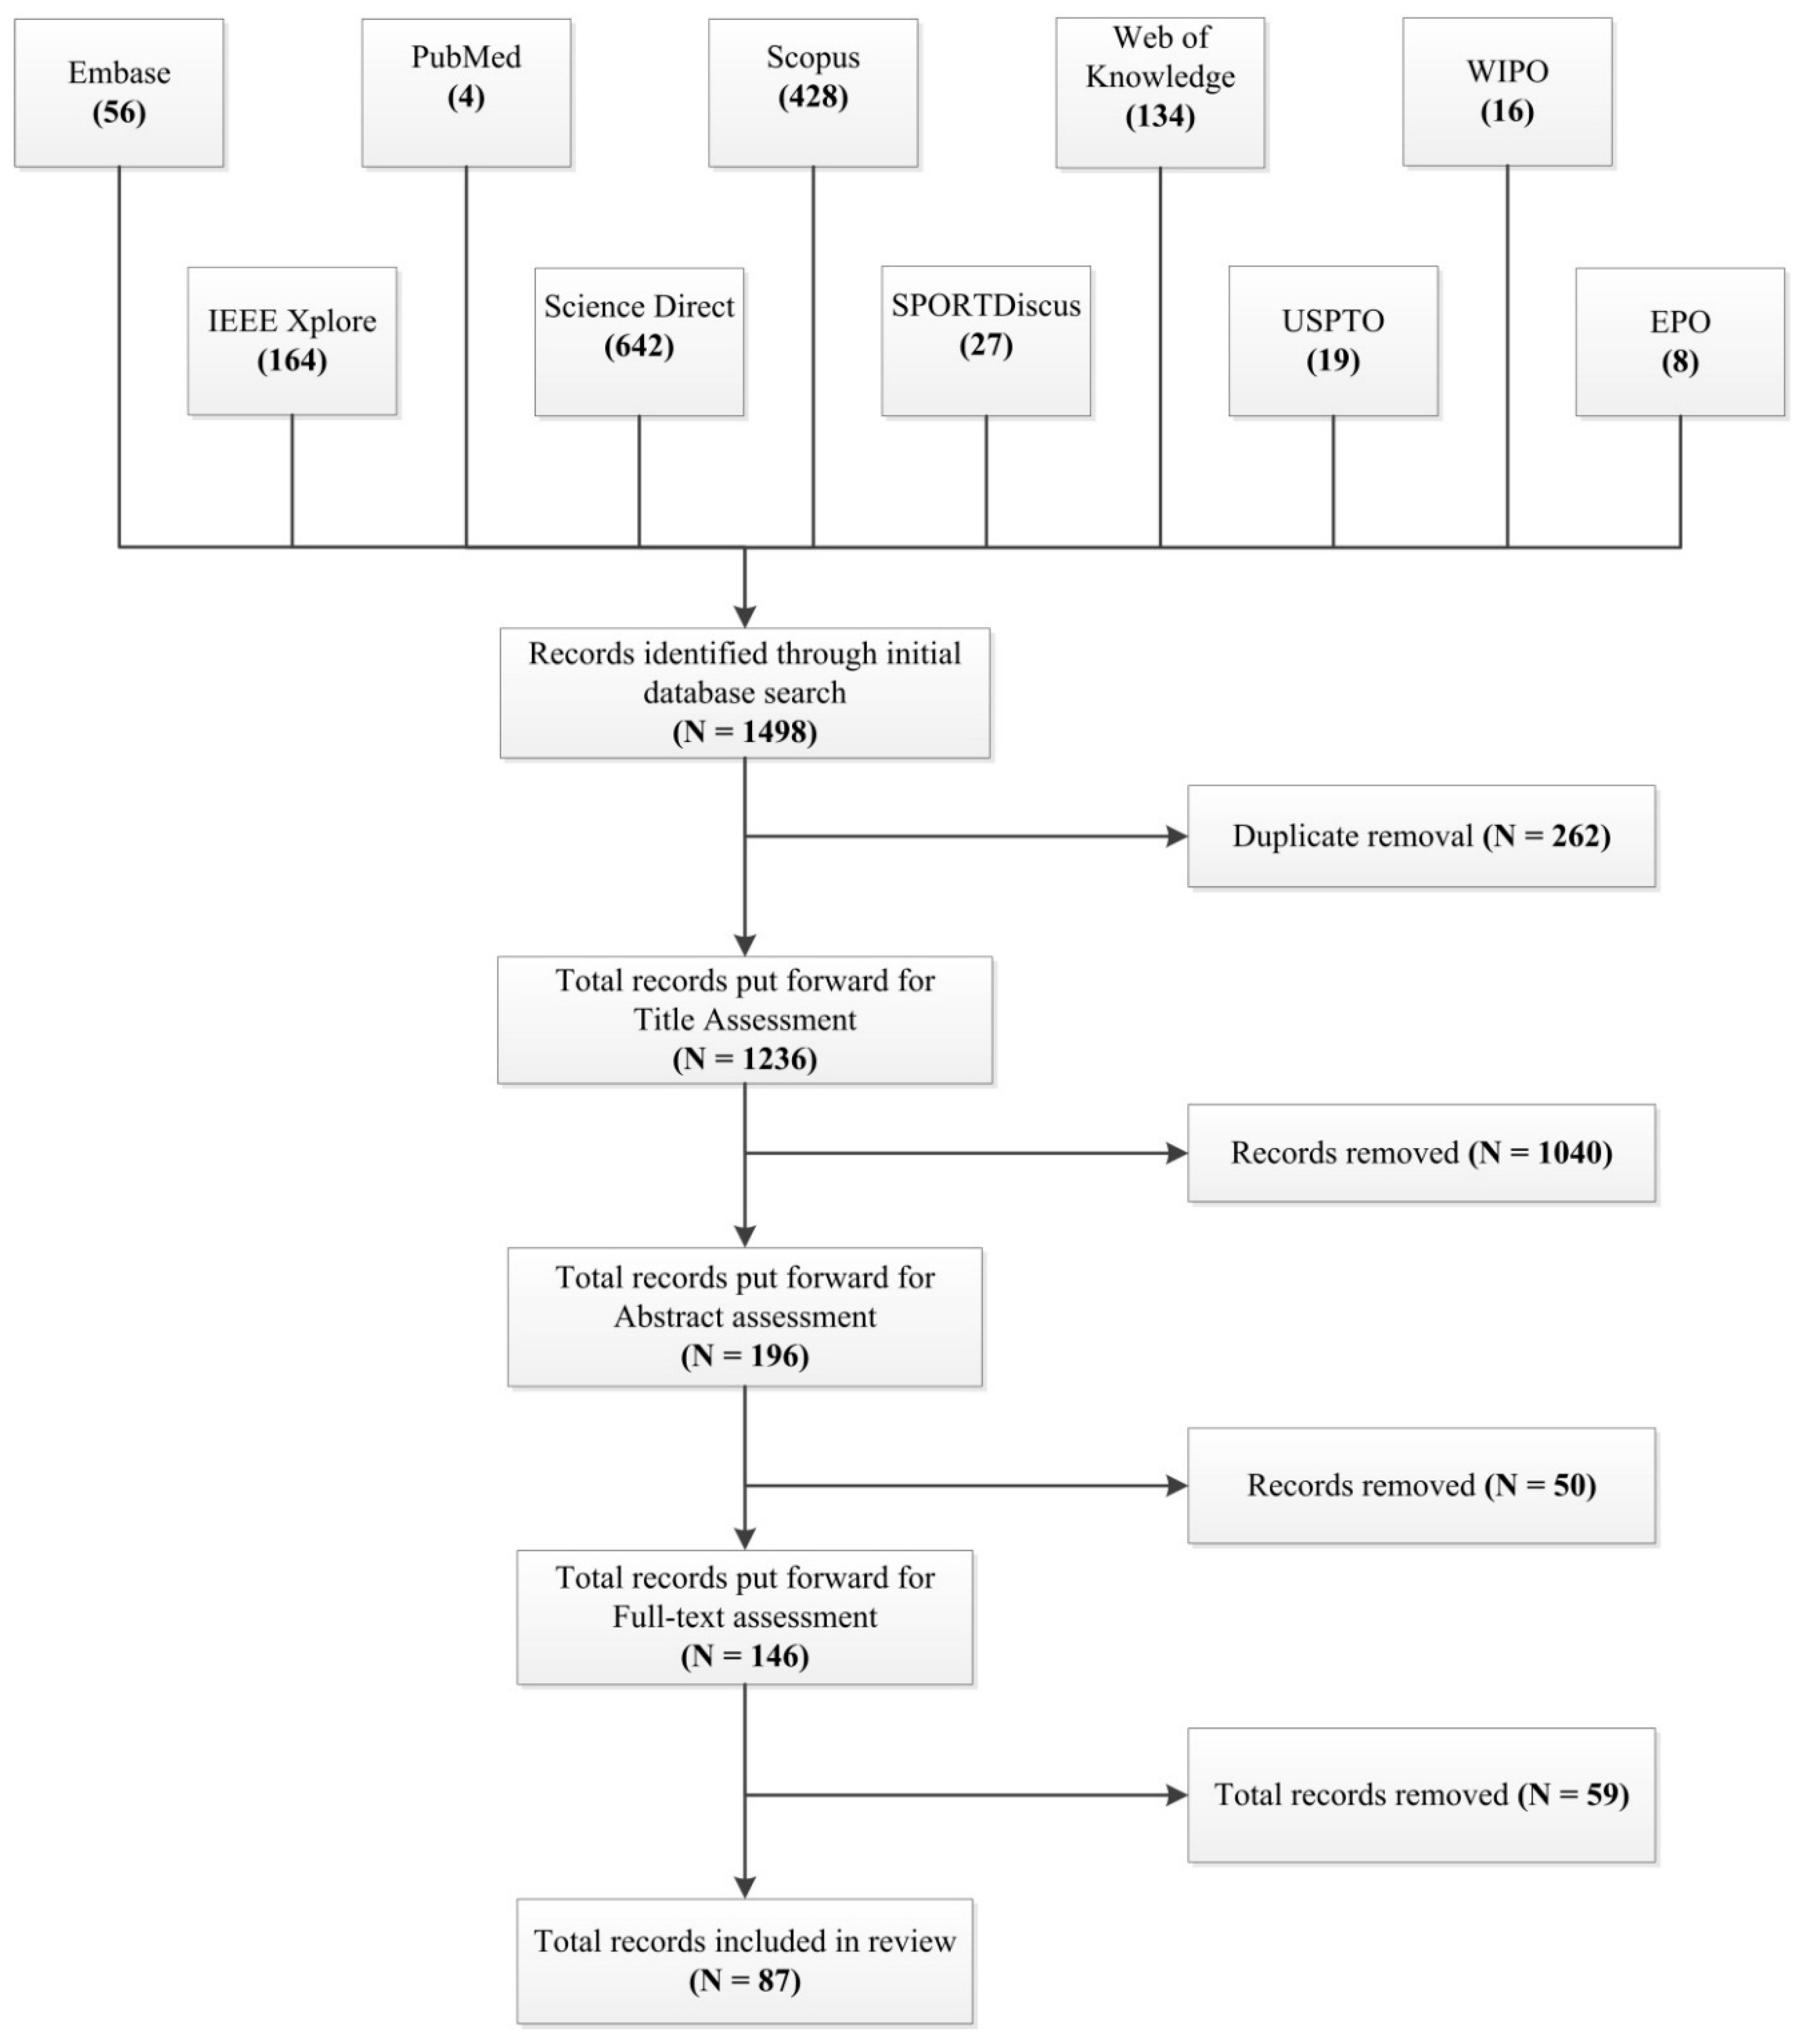
2.2. Article Selection
3. Results

| Ref. | Year | Participants | Swim Strokes | Sensor Range | Size & Mass | Volume | Sample Rate | Filter Design | Data Storage | Data Trans. | Output Variables | Swim Phase | Validation Methods | ||||||||
|---|---|---|---|---|---|---|---|---|---|---|---|---|---|---|---|---|---|---|---|---|---|
| E | C | R | Fc | Br | Bk | Bf | Accel. (m·s-2) | Gyro. (rad·s−1) | Size (m × 10-3) | (m3) | (Hz) | (MB) | F | S | T | ||||||
| Mass (kg × 10-3) | |||||||||||||||||||||
| [15] | 2000 | - | 2 | - | • | ±490.5 | N/A | Unrep | Unrep | Unrep | LP BW | Unrep | Unrep | stroke phase acceleration patterns | • | Video | |||||
| 62 | |||||||||||||||||||||
| [16] | 2002 | - | 5 | - | • | • | ±98.1 | ±26.2 | 142.8 × 23 | Unrep | 128 | Unrep | 128 | Unrep | stroke phase acceleration & angular velocity patterns, effect of fatigue | • | Video | ||||
| 78 | |||||||||||||||||||||
| [17] | 2002 | - | 5 | - | • | ±98.1 | N/A | 88 × 21 | Unrep | 128 | LP BW | 32 | Unrep | stroke phase acceleration patterns, effect of fatigue | • | Video | |||||
| 50 | |||||||||||||||||||||
| [12] | 2003 | - | 2 | - | • | ± 490.5 | N/A | Unrep | Unrep | Unrep | LP BW (10 Hz) | Unrep | Unrep | stroke phase acceleration patterns | • | Video | |||||
| 62 | |||||||||||||||||||||
| [18] | 2004 | - | 1 | - | • | • | • | • | ±19.62 | N/A | Unrep | Unrep | 150 | LP HW (0.5 Hz) | Unrep | IR | stroke id, lap time, stroke count | • | Video& observation | ||
| Unrep | |||||||||||||||||||||
| [19] | 2004 | 6 | - | - | • | Unrep | Unrep | Unrep | Unrep | 250 | Unrep | Unrep | Unrep | Stroke id, stroke count | • | Video & observation | |||||
| Unrep | |||||||||||||||||||||
| [20] | 2004 | - | 5 | - | • | • | • | • | ±98.1 | ±26.2 | 142 × 23 | Unrep | 128 | Unrep | 128 | Unrep | stroke phase acceleration patterns | • | Video | ||
| 78 | |||||||||||||||||||||
| [21] | 2005 | - | 1 | - | • | ±19.6 | N/A | Unrep | Unrep | 150 | LP HW (0.5 Hz) | Unrep | IR | Lap time, stroke count, stroke rate | • | Video & manual | |||||
| Unrep | |||||||||||||||||||||
| [22] | 2006 | - | 4 | - | • | ±98.1 | N/A | 88 × 21 | Unrep | 128 | LP BW | Unrep | Unrep | stroke phase patterns, arm joint angles | • | Video | |||||
| 50 | |||||||||||||||||||||
| [23] | 2007 | - | - | - | • | • | • | • | N/A | N/A | Unrep | Unrep | 32 | LP (5 Hz) | Unrep | Unrep | lap count, lap time, stroke count, swim speed, distance | • | Unrep | ||
| Unrep | |||||||||||||||||||||
| [24] | 2007 | - | - | - | - | - | - | - | Unrep | N/A | Unrep | Unrep | Unrep | Unrep | Unrep | Unrep | Hip rotation | • | Unrep | ||
| Unrep | |||||||||||||||||||||
| [25] | 2008 | - | 4 | 4 | • | Unrep | N/A | Unrep | Unrep | 256 | LP BW (0.01 Hz) | 1000 Flash | Unrep | Velocity, distance per stroke | • | Manual | |||||
| Unrep | |||||||||||||||||||||
| [26] | 2008 | 1 | - | 3 | • | ±14.7–±58.9 | N/A | Unrep | Unrep | 200 | LP BW (10 Hz) | 128 Flash | USB | stroke count, stroke rate, temporal stroke phase analysis | • | Video | |||||
| Unrep | |||||||||||||||||||||
| [11] | 2008 | 6 | - | - | • | • | • | • | ±19.6 | N/A | Unrep | Unrep | 150 | LP HW (0.5 Hz) | Unrep | IR | stroke id, lap time, stroke count, stroke rate | • | Video & manual | ||
| Unrep | |||||||||||||||||||||
| [27] | 2008 | - | 2 | - | • | • | • | ±19.6 | ±2.6 | 52 × 34 × 12 | 2.12 × 10⁻⁵ | 150 | LP HW (0.5 Hz) | 128 Flash | RF, USB | acceleration, velocity | • | Tethered speed meter | |||
| 22 | |||||||||||||||||||||
| [28] | 2008 | - | - | - | • | • | • | • | Unrep | N/A | Unrep | Unrep | 100 | LP BW (2.5 Hz) | Unrep | 2.4 GHz RF | velocity, stroke rate, distance per stroke, intra stroke velocity | • | Unrep | ||
| Unrep | |||||||||||||||||||||
| [29] | 2008 | - | 1 | - | • | • | • | • | Unrep | Unrep | Unrep | Unrep | Unrep | Unrep | Unrep | Unrep | Acceleration profile recognition | • | Video | ||
| Unrep | |||||||||||||||||||||
| [30] | 2009 | - | 1 | - | • | Unrep | N/A | 36 × 42 × 12 | 5.14 × 10⁻⁵ | 256 | Unrep | 1000 Flash | Unrep | Acceleration | • | Unrep | |||||
| 34 | |||||||||||||||||||||
| [31] | 2009 | 7 | - | 15 | • | ±29.4 | N/A | 36 × 42 × 12 | 5.14 × 10⁻⁵ | 256 | LP BW (0.01 Hz) | 1000 Flash MMC | USB | velocity, lap time, time per stroke, stroke length, orientation | • | Video & observation | |||||
| 34 | |||||||||||||||||||||
| [32] | 2009 | - | - | - | • | • | • | • | Unrep | Unrep | Unrep | Unrep | Unrep | Unrep | Unrep | Wi-Fi, Bluetooth, ANT or RF | stroke id, average speed, pace, distance, stroke count, swim distance, lap count | • | Unrep | ||
| Unrep | |||||||||||||||||||||
| [33] | 2009 | 12 | - | - | • | ±19.6 | >600 | 52 × 33 × 11 | 1.89 × 10⁻⁵ | 100 | LP BW (0.5 Hz) | 256 | USB | kick rate, kick count | • | Video | |||||
| 20.7 | |||||||||||||||||||||
| [34] | 2009 | 14 | - | - | • | ±19.6 | >600 | 52 × 33 × 11 | 1.89 × 10⁻⁵ | 100 | LP BW (0.5 Hz) | 256 | USB | kick rate, kick count | • | Stopwatch | |||||
| 20.7 | |||||||||||||||||||||
| [35] | 2009 | - | 1 | - | • | Unrep | N/A | Unrep | Unrep | 128 | Unrep | Unrep | 2.4 GHz RF | Arm acceleration and timing profiles | • | Video | |||||
| Unrep | |||||||||||||||||||||
| [36] | 2009 | - | - | - | • | Unrep | Unrep | Unrep | Unrep | Unrep | Unrep | Unrep | Bluetooth, ZigBee or Wi-Fi | lap counter, lap time, stroke count, stroke length | • | Unrep | |||||
| Unrep | |||||||||||||||||||||
| [37] | 2009 | - | - | - | • | • | • | • | Unrep | N/A | Unrep | Unrep | Unrep | Unrep | Unrep | Unrep | lap count, stroke count | • | Unrep | ||
| Unrep | |||||||||||||||||||||
| [38] | 2010 | - | - | - | • | • | • | • | Unrep | Unrep | Unrep | Unrep | 30 | LP (1 Hz) | Unrep | USB | stroke id, stroke count, stroke rate, stroke length, lap time, speed, force | • | Unrep | ||
| Unrep | |||||||||||||||||||||
| [39] | 2010 | - | - | - | • | • | • | Unrep | Unrep | Unrep | Unrep | Unrep | Unrep | Unrep | Unrep | stroke count, lap count | • | Unrep | |||
| Unrep | |||||||||||||||||||||
| [40] | 2010 | - | 1 | - | • | • | • | • | ±29.4 | ±8.7 | 150 × 90 | Unrep | 50 | LP BW (5 Hz) | 4 | RF | stroke count, stroke rate, lap count | • | Video | ||
| Unrep | |||||||||||||||||||||
| [41] | 2010 | - | 1 | - | • | ±29.4 | ±8.7 | 150 × 90 | Unrep | 50 | LP BW (5 Hz) | 4 | RF | stroke count, stroke rate, lap count, start and turn phase analysis | • | • | • | Video | |||
| Unrep | |||||||||||||||||||||
| [42] | 2010 | - | - | - | • | Unrep | Unrep | Unrep | Unrep | Unrep | LP | Unrep | Unrep | body orientation, speed, lap time | • | Unrep | |||||
| Unrep | |||||||||||||||||||||
| [43] | 2010 | - | - | 1 | • | • | Unrep | Unrep | Unrep | Unrep | 190 | Unrep | Unrep | Wireless | stroke phase acceleration and angular velocity profiles | • | Unrep | ||||
| Unrep | |||||||||||||||||||||
| [44] | 2010 | - | - | 1 | • | • | • | Unrep | N/A | Unrep | Unrep | Unrep | LP (5 Hz) | 2 | 2.4 GHz RF | pitch and roll angles, breathing patterns | • | Unrep | |||
| 7 | |||||||||||||||||||||
| [45] | 2010 | - | 1 | - | • | ±29.4 | ±8.7 | 150 × 90 | Unrep | 50 | LP BW (5 Hz) | 4 | RF | acceleration profile during turns | • | Video | |||||
| Unrep | |||||||||||||||||||||
| [46] | 2010 | 3 | - | - | • | • | • | • | Unrep | N/A | Unrep | Unrep | 100 | Unrep | Unrep | Unrep | stroke id | • | Video | ||
| Unrep | |||||||||||||||||||||
| [47] | 2010 | 8 | - | - | • | • | • | • | Unrep | Unrep | 88 × 51 × 25 | 1.1 × 10⁻⁴ Unrep | 100 | Unrep | Unrep | Unrep | angular velocity, temporal phase assessment, stroke rate, r index | • | • | Video & stopwatch | |
| 93 | |||||||||||||||||||||
| [48] | 2010 | - | 53 | - | • | Unrep | N/A | Unrep | Unrep | Unrep | Unrep | Unrep | Unrep | speed, swim distance | • | Manual | |||||
| Unrep | |||||||||||||||||||||
| [49] | 2010 | - | - | - | • | • | • | • | Unrep | Unrep | Unrep | Unrep | Unrep | Unrep | Unrep | RF | stroke id, lap time, stroke count | • | Unrep | ||
| Unrep | |||||||||||||||||||||
| [50] | 2011 | - | 1 | - | • | ±14.7–±58.9 | Unrep | Unrep | Unrep | 200 | LP BW (0.6 Hz) | 512 Flash | USB | acceleration, angular velocity, pitch angle | • | Video | |||||
| Unrep | |||||||||||||||||||||
| [51] | 2011 | 12 | - | - | • | ±19.6 | >600 | 52 × 33 × 11 | 1.89 × 10⁻⁵ | 100 | LP BW (0.5 Hz) | 256 | USB | kick rate | • | Video | |||||
| 20.7 | |||||||||||||||||||||
| [52] | 2011 | - | - | 1 | • | Unrep | N/A | Unrep | Unrep | 50 | Unrep | Unrep | RF | stroke phases | • | Unrep | |||||
| Unrep | |||||||||||||||||||||
| [53] | 2011 | 1 | - | - | • | ±78.5 | ±26.2 | 52 × 33 × 10 | 1.72 × 10⁻⁵ | 100 | LP HW (0.5 Hz) | 1000 | 2.4 GHz RF | temporal stroke phase analysis | • | Video | |||||
| 20 | |||||||||||||||||||||
| [54] | 2011 | - | - | - | • | Unrep | Unrep | Unrep | Unrep | 100 | Unrep | Unrep | 2.4 GHz RF | Unrep | • | Unrep | |||||
| Unrep | |||||||||||||||||||||
| [55] | 2011 | - | - | 6 | • | Unrep | Unrep | Unrep | Unrep | 200 | Unrep | Unrep | Unrep | simulated arm stroke patterns | • | Video | |||||
| Unrep | |||||||||||||||||||||
| [56] | 2011 | 2 | - | - | • | ±78.5 | ±26.2 | 52 × 33 × 10 | 1.72 × 10⁻⁵ | 100 | LP HW (0.5 Hz) | 1000 | 2.4 GHz RF | turn phase acceleration patterns | • | Video | |||||
| 20 | |||||||||||||||||||||
| [57] | 2011 | - | 2 | - | • | • | • | • | ±29.4 | ±8.7 | 150 × 90 | Unrep | 50 | LP BW (5 Hz) | 4 | RF | stroke count, stroke rate, stroke duration, lap count | • | Video | ||
| Unrep | |||||||||||||||||||||
| [58] | 2011 | - | - | - | • | • | • | Unrep | N/A | Unrep | Unrep | 50 | Unrep | Unrep | Unrep | stroke id | • | Unrep | |||
| 18 | |||||||||||||||||||||
| [59] | 2011 | - | 11 | - | • | • | • | Unrep | N/A | Unrep | Unrep | 50 | MA | Unrep | Unrep | stroke id, stroke count, swimming intensity | • | Unrep | |||
| Unrep | |||||||||||||||||||||
| [60] | 2011 | - | 1 | - | • | • | • | Unrep | Unrep | 57 × 91 × 24 | 1.24 × 10⁻⁴ | 50 | Unrep | Unrep | 2.4 GHz RF | stroke id | • | Unrep | |||
| 65.6 | |||||||||||||||||||||
| [61] | 2011 | - | - | 1 | • | ±78.5 | ±26.2 | 53 × 33 × 10 | 1.75 × 10⁻⁵ | 100 | LP HW (0.5 Hz) | 1000 | 2.4 GHz RF | mean velocity | • | Tethered speed meter | |||||
| 20 | |||||||||||||||||||||
| [62] | 2012 | 7 | - | 11 | • | ±29.4 | N/A | 36 × 42 × 12 | 1.81 × 10⁻⁵ | 256 | LP BW (0.01 Hz) | 1000 Flash MMC | USB | velocity, lap time, time per stroke, stroke length, orientation | • | Video & observation | |||||
| 34 | |||||||||||||||||||||
| [63] | 2012 | 12 | - | - | • | ±19.6 | >600 | 52 × 33 × 11 | 1.89 × 10⁻⁵ | 100 | LP BW (0.5 Hz) | 256 | USB | kick rate, kick count, breathing patterns | • | Video | |||||
| 20.7 | |||||||||||||||||||||
| [64] | 2012 | 11 | - | 19 | • | ±107.9 | ±15.7 | Unrep | Unrep | 500 | Unrep | Unrep | Unrep | instantaneous velocity, mean velocity | • | Tethered speed meter | |||||
| Unrep | |||||||||||||||||||||
| [65] | 2012 | - | - | - | • | • | • | • | Unrep | Unrep | Unrep | Unrep | Unrep | Unrep | Unrep | Unrep | lap count, swim distance | • | Unrep | ||
| Unrep | |||||||||||||||||||||
| [66] | 2012 | - | - | - | • | • | • | • | Unrep | N/A | Unrep | Unrep | Unrep | Unrep | Unrep | Unrep | stroke rate | • | Unrep | ||
| Unrep | |||||||||||||||||||||
| [67] | 2012 | - | - | - | • | • | • | • | Unrep | Unrep | Unrep | Unrep | Unrep | LP 0.5–5.0 Hz | Unrep | Unrep | stroke id | • | Unrep | ||
| Unrep | |||||||||||||||||||||
| [68] | 2012 | - | 1 | - | • | ±29.4 | ±8.7 | 150 × 90 | Unrep | 50 | LP BW (1 Hz) | 4 | RF | start and turn phase acceleration patterns, stroke count, stroke duration | • | • | • | Video | |||
| Unrep | |||||||||||||||||||||
| [69] | 2012 | 1 | - | - | • | ±29.4 | ±8.7 | 150 × 90 | Unrep | 50 | LP BW (1 Hz) | 4 | RF | turn phase acceleration patterns, temporal analysis | • | Video | |||||
| Unrep | |||||||||||||||||||||
| [70] | 2012 | 9 | - | - | • | ±78.5 | ±26.2 | 52 × 33 × 10 | 1.72 × 10⁻⁵ | 100 | HW FIR (0.5 Hz) | 1000 | 2.4 GHz RF | arm symmetry, stroke rate | • | Video | |||||
| 20 | |||||||||||||||||||||
| [71] | 2013 | - | 2 | - | • | • | • | • | ±29.4 | ±8.7 | 150 × 90 | Unrep | 50 | LP BW (1 Hz) | 4 | RF | stroke count, stroke rate, lap count | • | Video | ||
| Unrep | |||||||||||||||||||||
| [72] | 2013 | - | 20 | - | • | ±107.9 | ±15.7 | 50 × 40 × 16 | 3.2 × 10⁻⁵ | 500 | LP (100Hz) | Unrep | microSD | mean velocity | • | Tethered speed meter | |||||
| 36 | |||||||||||||||||||||
| [73] | 2013 | - | 6 | 6 | • | ±107.9 | ±15.7 | 50 × 40 × 16 | 3.2 × 10⁻⁵ | 500 | LP (100Hz) | Unrep | microSD | energy expenditure, velocity, cycle velocity variation | • | Indirect calorimetry, lactate | |||||
| 36 | |||||||||||||||||||||
| [74] | 2013 | - | 7 | - | • | ±98.1 | ±15.7 | 50 × 40 × 16 | 3.2 × 10⁻⁵ | 100 | Unrep | Unrep | Unrep | stroke phase acceleration patterns | • | Video | |||||
| 36 | |||||||||||||||||||||
| [75] | 2013 | - | - | 1 | • | • | • | • | Unrep | N/A | Unrep | Unrep | 50 | Unrep | 2 | RF | stroke rate | • | Unrep | ||
| Unrep | |||||||||||||||||||||
| [76] | 2013 | - | - | 1 | • | Unrep | N/A | Unrep | Unrep | 50 | Unrep | 2 | 2.4 GHz RF | stroke count, stroke length, stroke rate, velocity | • | Unrep | |||||
| Unrep | |||||||||||||||||||||
| [77] | 2013 | - | - | 1 | • | • | • | • | Unrep | N/A | Unrep | Unrep | 50 | Unrep | 2 | 2.4 GHz RF | stroke rate | • | Unrep | ||
| Unrep | |||||||||||||||||||||
| [78] | 2013 | - | 12 | - | • | • | • | • | ±14.7 | ±8.7 | Unrep | Unrep | 200 | MA | Unrep | SD | stroke id | • | Video | ||
| Unrep | |||||||||||||||||||||
| [79] | 2013 | - | - | 1 | • | ±29.4 | ±8.7 | 150 × 90 | Unrep | 50 | LP BW (5 Hz) | 4 | RF | block time, entry time, kick initiation time, stroke initiation time, kick rate, stroke rate, stroke count | • | Video | |||||
| Unrep | |||||||||||||||||||||
| [80] | 2013 | - | - | - | • | • | • | • | Unrep | Unrep | Unrep | Unrep | 200 | Unrep | Unrep | Bluetooth | stroke id | • | Unrep | ||
| Unrep | |||||||||||||||||||||
| [81] | 2013 | 1 | 1 | - | • | Unrep | ±1500 | Unrep | Unrep | 100 | LP BW (2 Hz) | Unrep | Unrep | body roll velocity | • | Video | |||||
| Unrep | |||||||||||||||||||||
| [82] | 2013 | 1 | 2 | 4 | • | ±58.9 | N/A | 69 × 28 × 07 | 1.59 × 10⁻⁵ | 100 | HW FIR (0.5 Hz) | Unrep | Unrep | push-off velocity | • | Tethered speed meter | |||||
| 15 | |||||||||||||||||||||
| [83] | 2013 | 8 | 9 | - | • | ±78.5 | ±26.2 | 53 × 33 × 10 | 1.75 × 10⁻⁵ | 100 | LP HW (0.5 Hz) | 1000 | 2.4 GHz RF | mean velocity, stroke rate | • | Tethered speed meter | |||||
| 20 | |||||||||||||||||||||
| [84] | 2013 | - | 53 | - | • | Unrep | N/A | 29 × 37 × 11 | 1.18 × 10⁻⁵ | 32 | Unrep | Unrep | Unrep | speed, distance | • | Stopwatch | |||||
| 34 | |||||||||||||||||||||
| [85] | 2014 | - | - | 3 | • | • | • | ±19.6 | N/A | 5 × 58 × 25 | 7.25 × 10⁻⁶ | Unrep | Unrep | Unrep | Bluetooth | stroke count, kick count, symmetry | • | Unrep | |||
| Unrep | |||||||||||||||||||||
| [86] | 2014 | - | 21 | - | • | • | • | Unrep | N/A | Unrep | Unrep | 100 | Unrep | Unrep | 2.4 GHz RF | stroke count, mean velocity | • | Video | |||
| Unrep | |||||||||||||||||||||
| [87] | 2014 | 9 | 9 | • | ±107.9 | ±15.7 | 50 × 40 × 16 | 3.20 × 10⁻⁵ | 500 | LP (100 Hz) | Unrep | microSD | energy expenditure, velocity, kick rate | • | Indirect calorimetry, lactate | ||||||
| 36 | |||||||||||||||||||||
| [88] | 2014 | - | - | - | • | • | • | • | Unrep | Unrep | Unrep | Unrep | Unrep | Unrep | Unrep | Unrep | stroke count, stroke id, lap count, lap time | • | Unrep | ||
| Unrep | |||||||||||||||||||||
| [89] | 2014 | - | 2 | - | • | • | • | • | ±19.6 | ±4.4 | 16 × 12 × 10 | 1.92 × 10⁻⁶ | 100 | MA | NOR flash memory 64 | 433 MHz RF | stroke id, breathing patterns | • | Unrep | ||
| Unrep | |||||||||||||||||||||
| [90] | 2014 | - | - | - | • | • | • | • | Unrep | Unrep | Unrep | Unrep | Unrep | Unrep | Unrep | 2.4 GHz RF | lap count | • | Unrep | ||
| Unrep | |||||||||||||||||||||
| [91] | 2014 | - | - | - | • | • | • | • | Unrep | Unrep | Unrep | Unrep | Unrep | Unrep | Unrep | Unrep | swim distance, lap count, lap time, stroke id | • | Unrep | ||
| Unrep | |||||||||||||||||||||
| [92] | 2014 | - | - | 60 | • | Unrep | N/A | Unrep | Unrep | Unrep | Unrep | Unrep | Unrep | energy expenditure | • | Cosmed | |||||
| Unrep | |||||||||||||||||||||
| [93] | 2014 | - | 45 | - | • | • | • | • | ±19.6 | N/A | Unrep | Unrep | 32 | Unrep | Unrep | Unrep | stroke id | • | Video | ||
| Unrep | |||||||||||||||||||||
| [94] | 2014 | - | 1 | - | • | ±9.8 | ±8.7 | 53 × 32 × 19 | 3.22 × 10⁻⁵ | Unrep | Unrep | Unrep | Blue-tooth | joint angles during fly kick | • | Video | |||||
| Unrep | |||||||||||||||||||||
| [95] | 2014 | - | 1 | 1 | • | Unrep | Unrep | Unrep | Unrep | Unrep | LP Fourier (8 Hz) | Unrep | Unrep | joint angles | • | Video | |||||
| Unrep | |||||||||||||||||||||
| [96] | 2014 | 10 | - | - | • | • | • | • | Unrep | N/A | 30 × 30 | Unrep | 100 | LP (2 Hz) | Unrep | Unrep | stroke id | • | Manual | ||
| 33 | |||||||||||||||||||||
| [97] | 2015 | - | 8 | 7 | • | ±107.9 | ±15.7 | 50 × 40 × 16 | 3.2 × 10⁻⁵ | 500 | LP (100Hz) | Unrep | microSD | mean velocity | • | Tethered speed meter | |||||
| 36 | |||||||||||||||||||||
| [98] | 2015 | - | - | 3 | • | Unrep | Unrep | Unrep | Unrep | 50 | Unrep | Unrep | Unrep | Positioning | • | Video | |||||
| Unrep | |||||||||||||||||||||

4. Discussion
4.1. Parameters for Analysing Free-Swimming
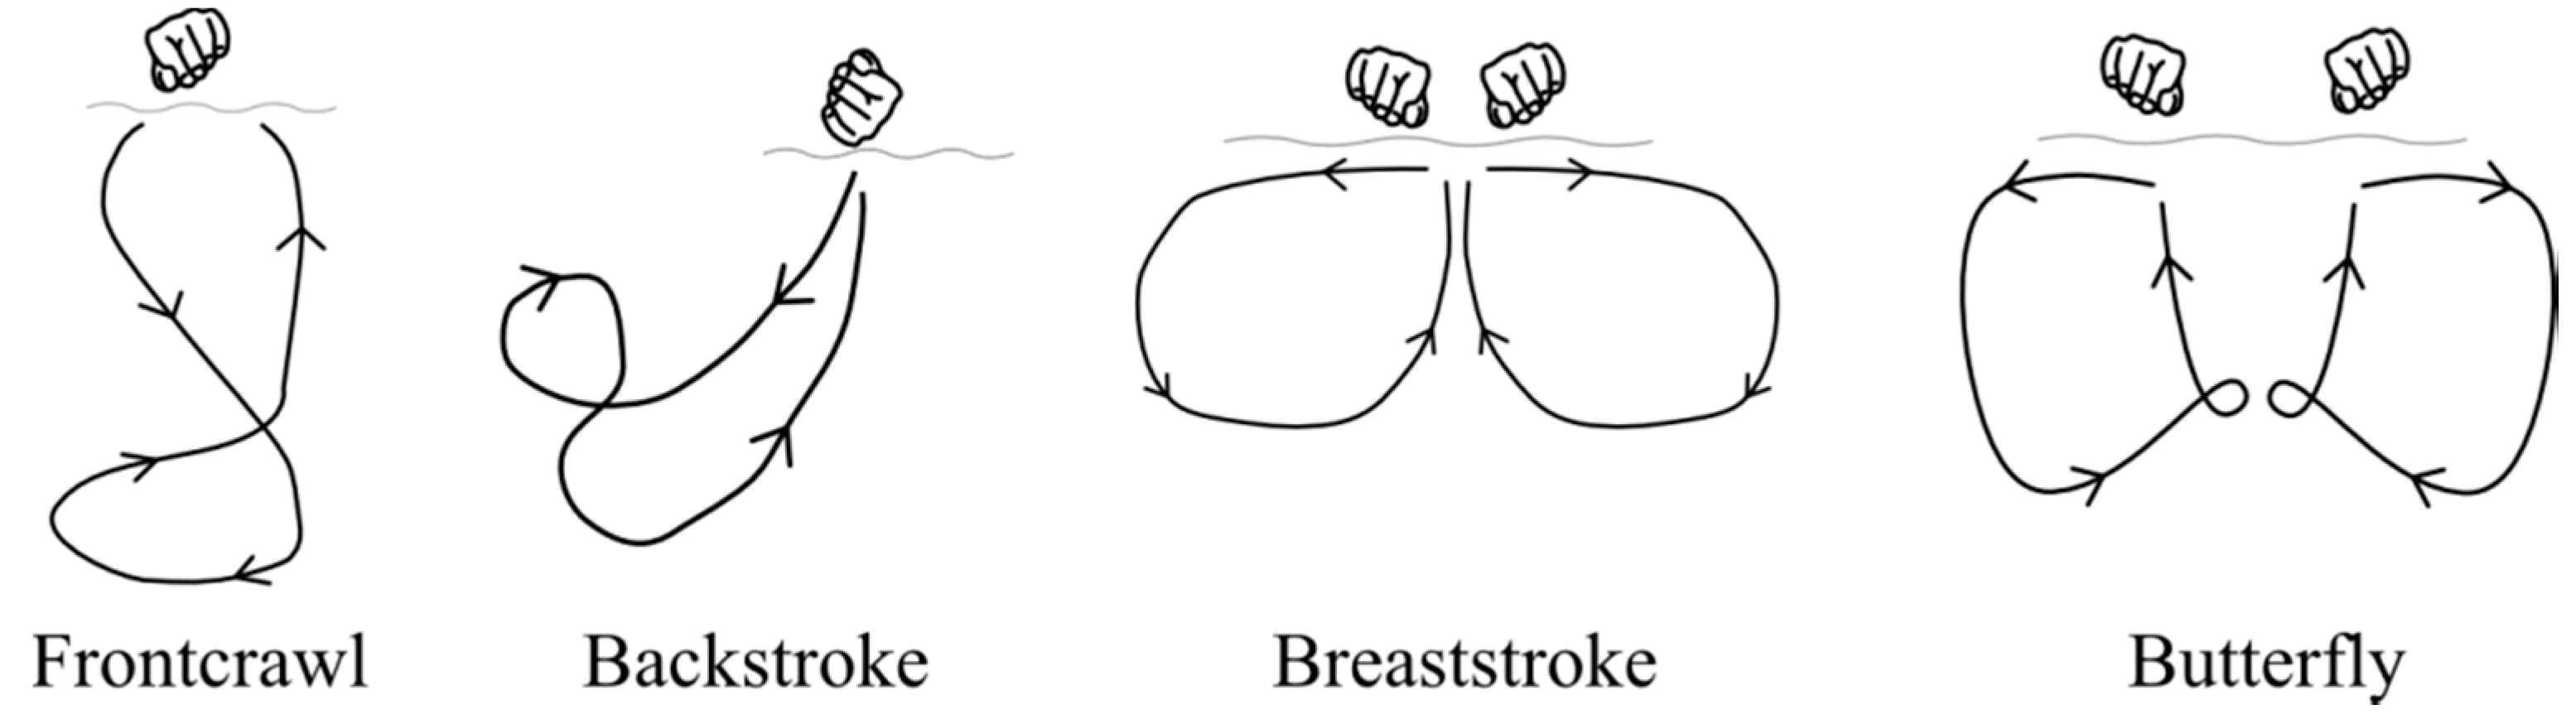
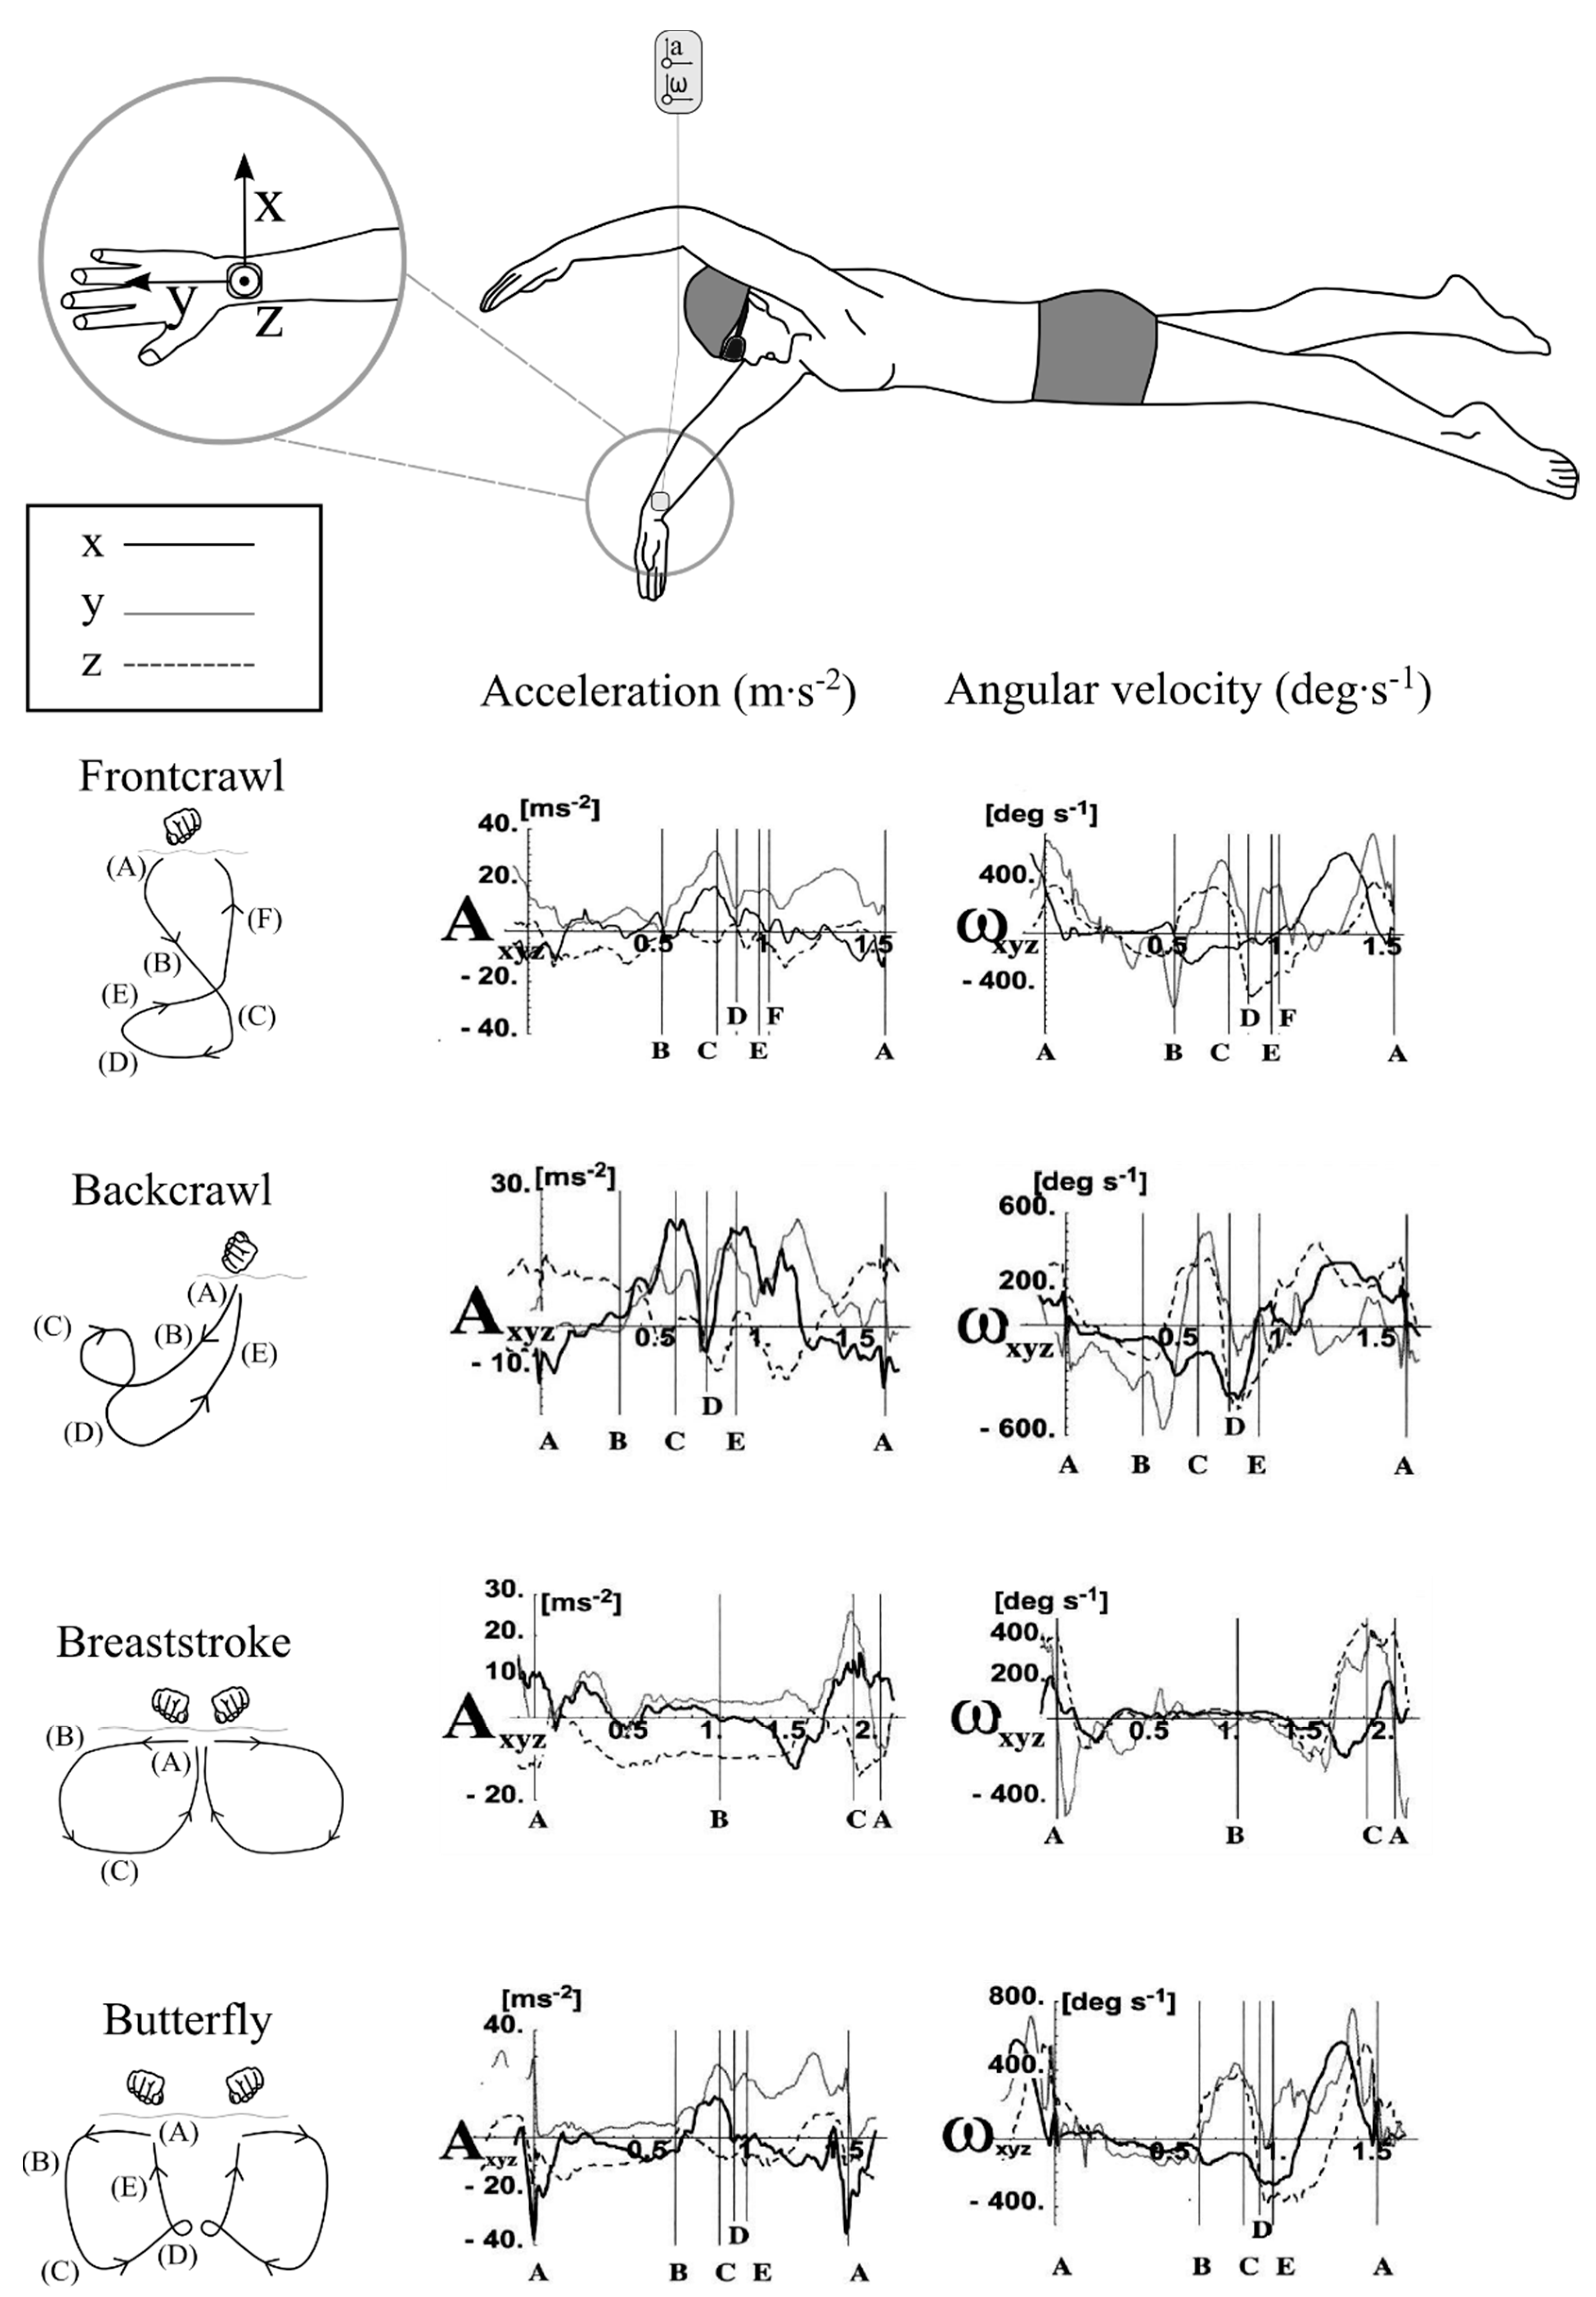
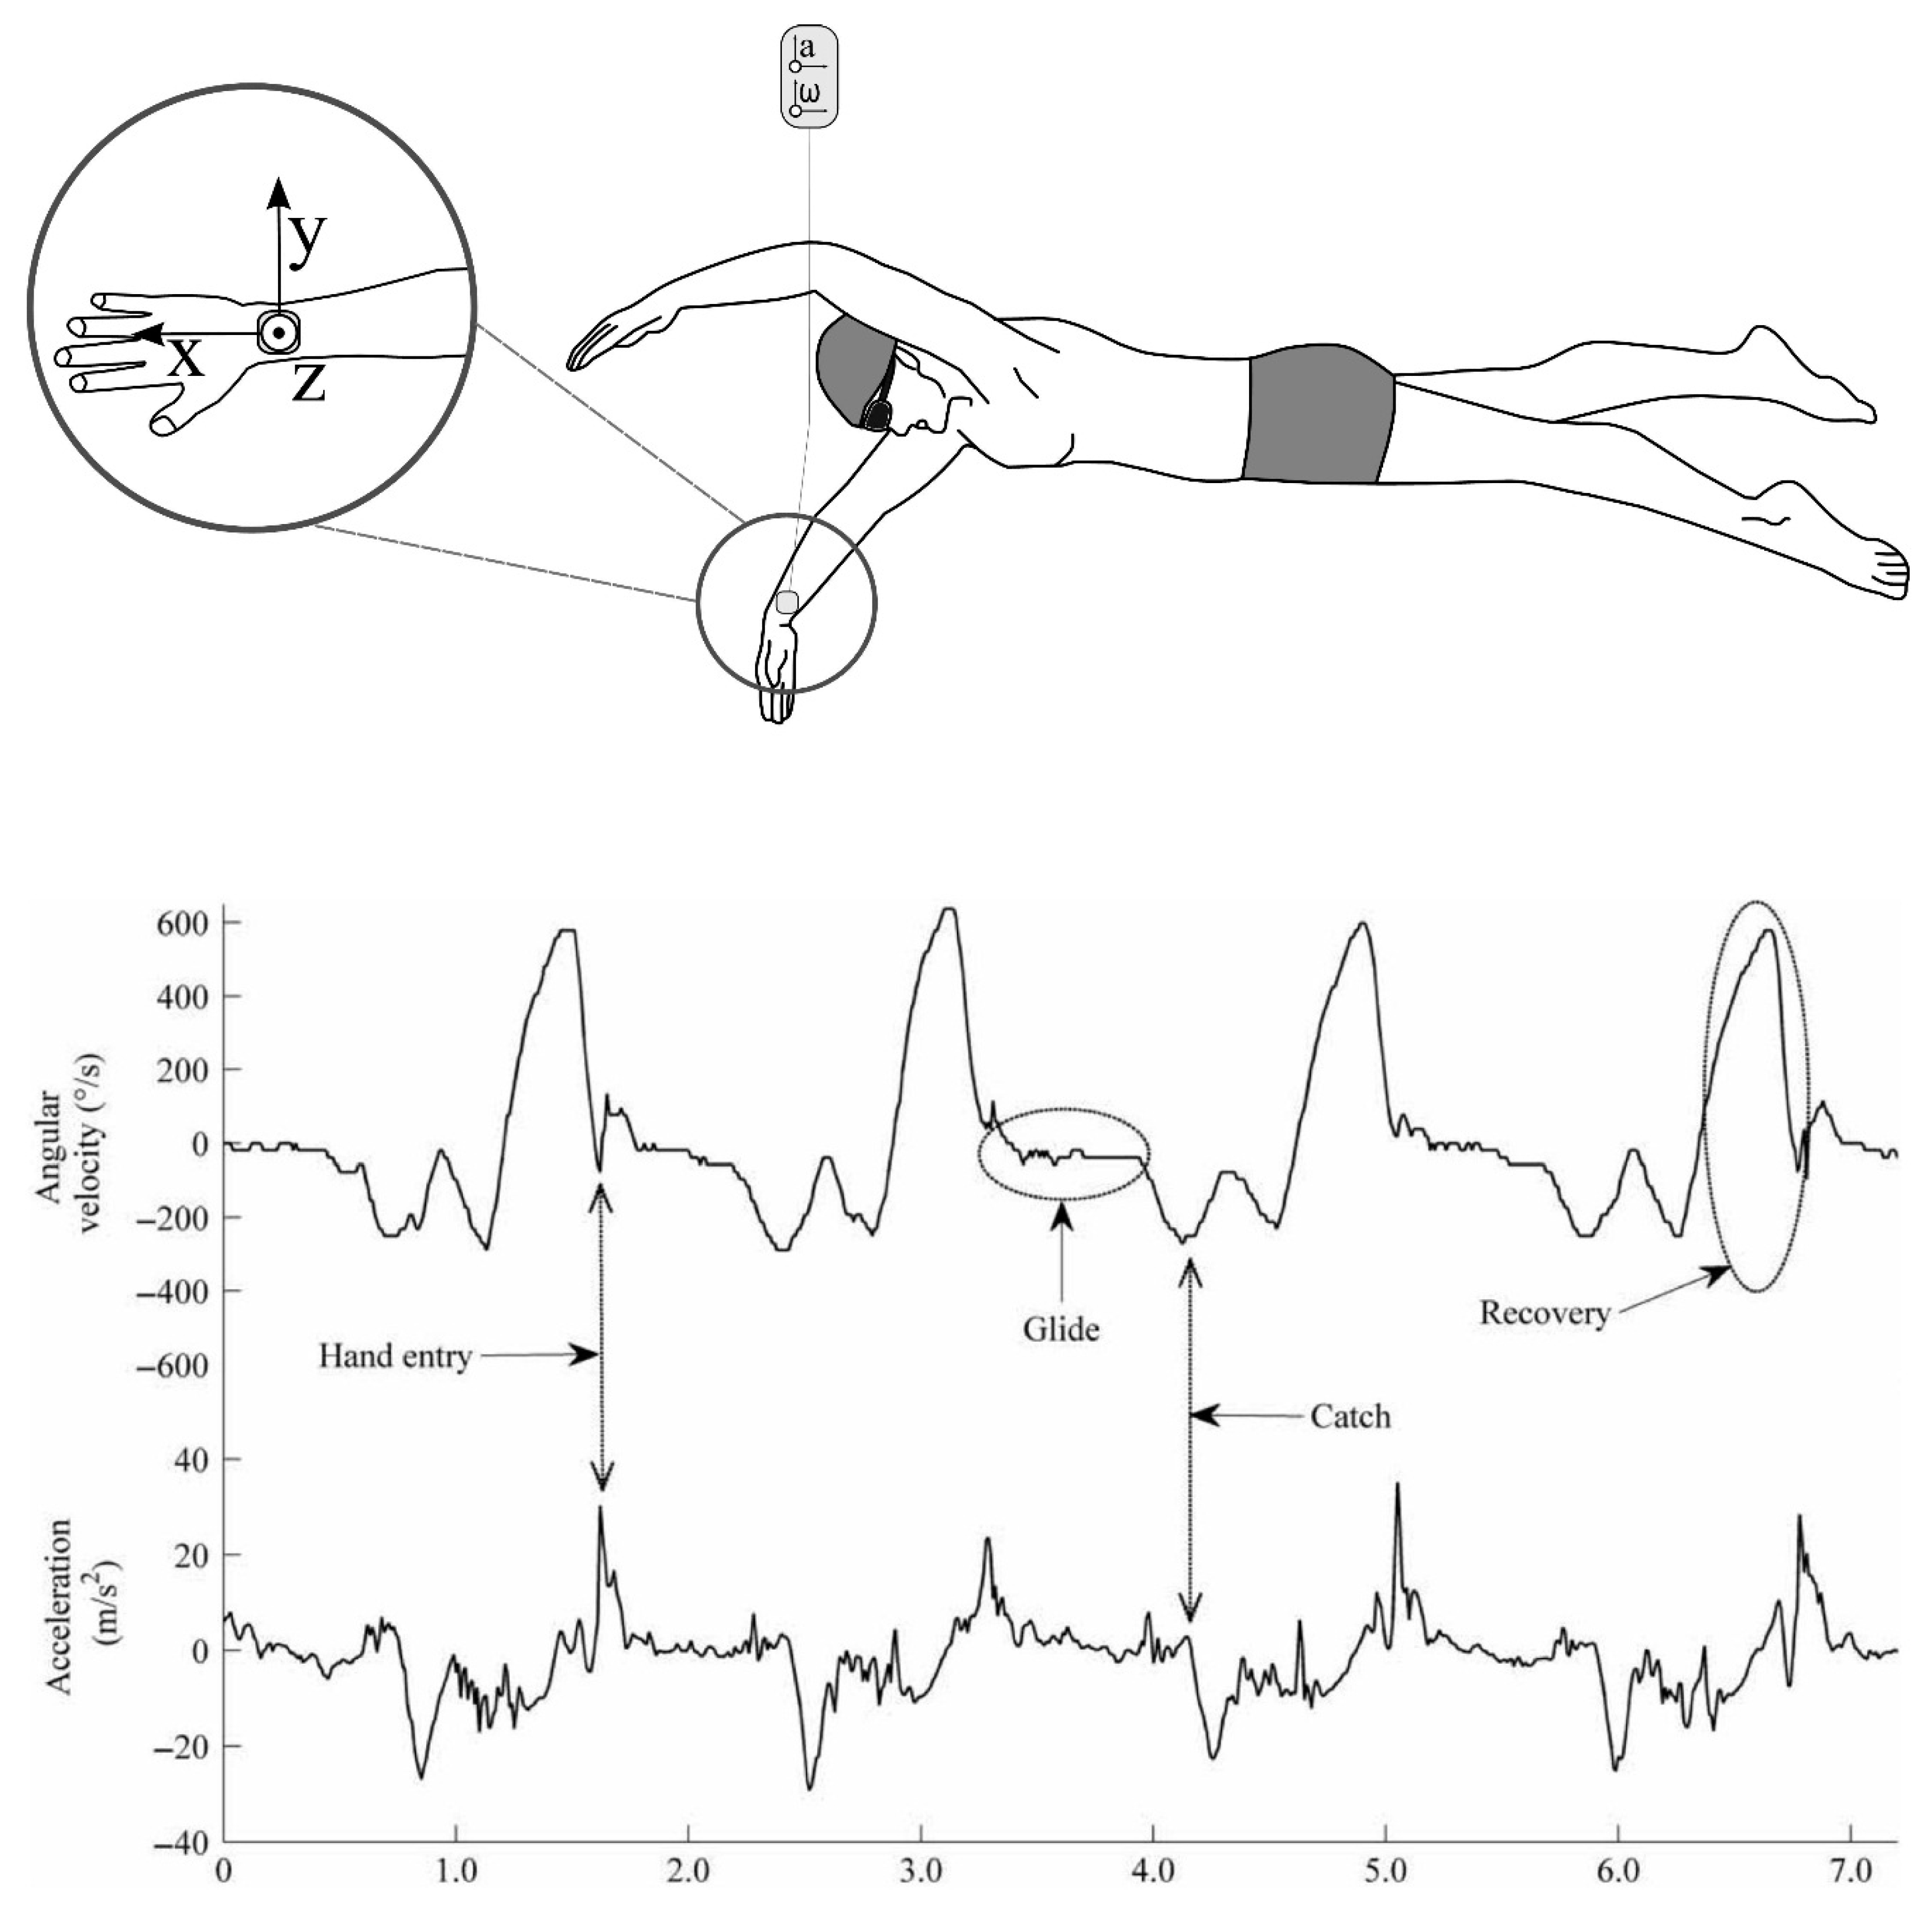
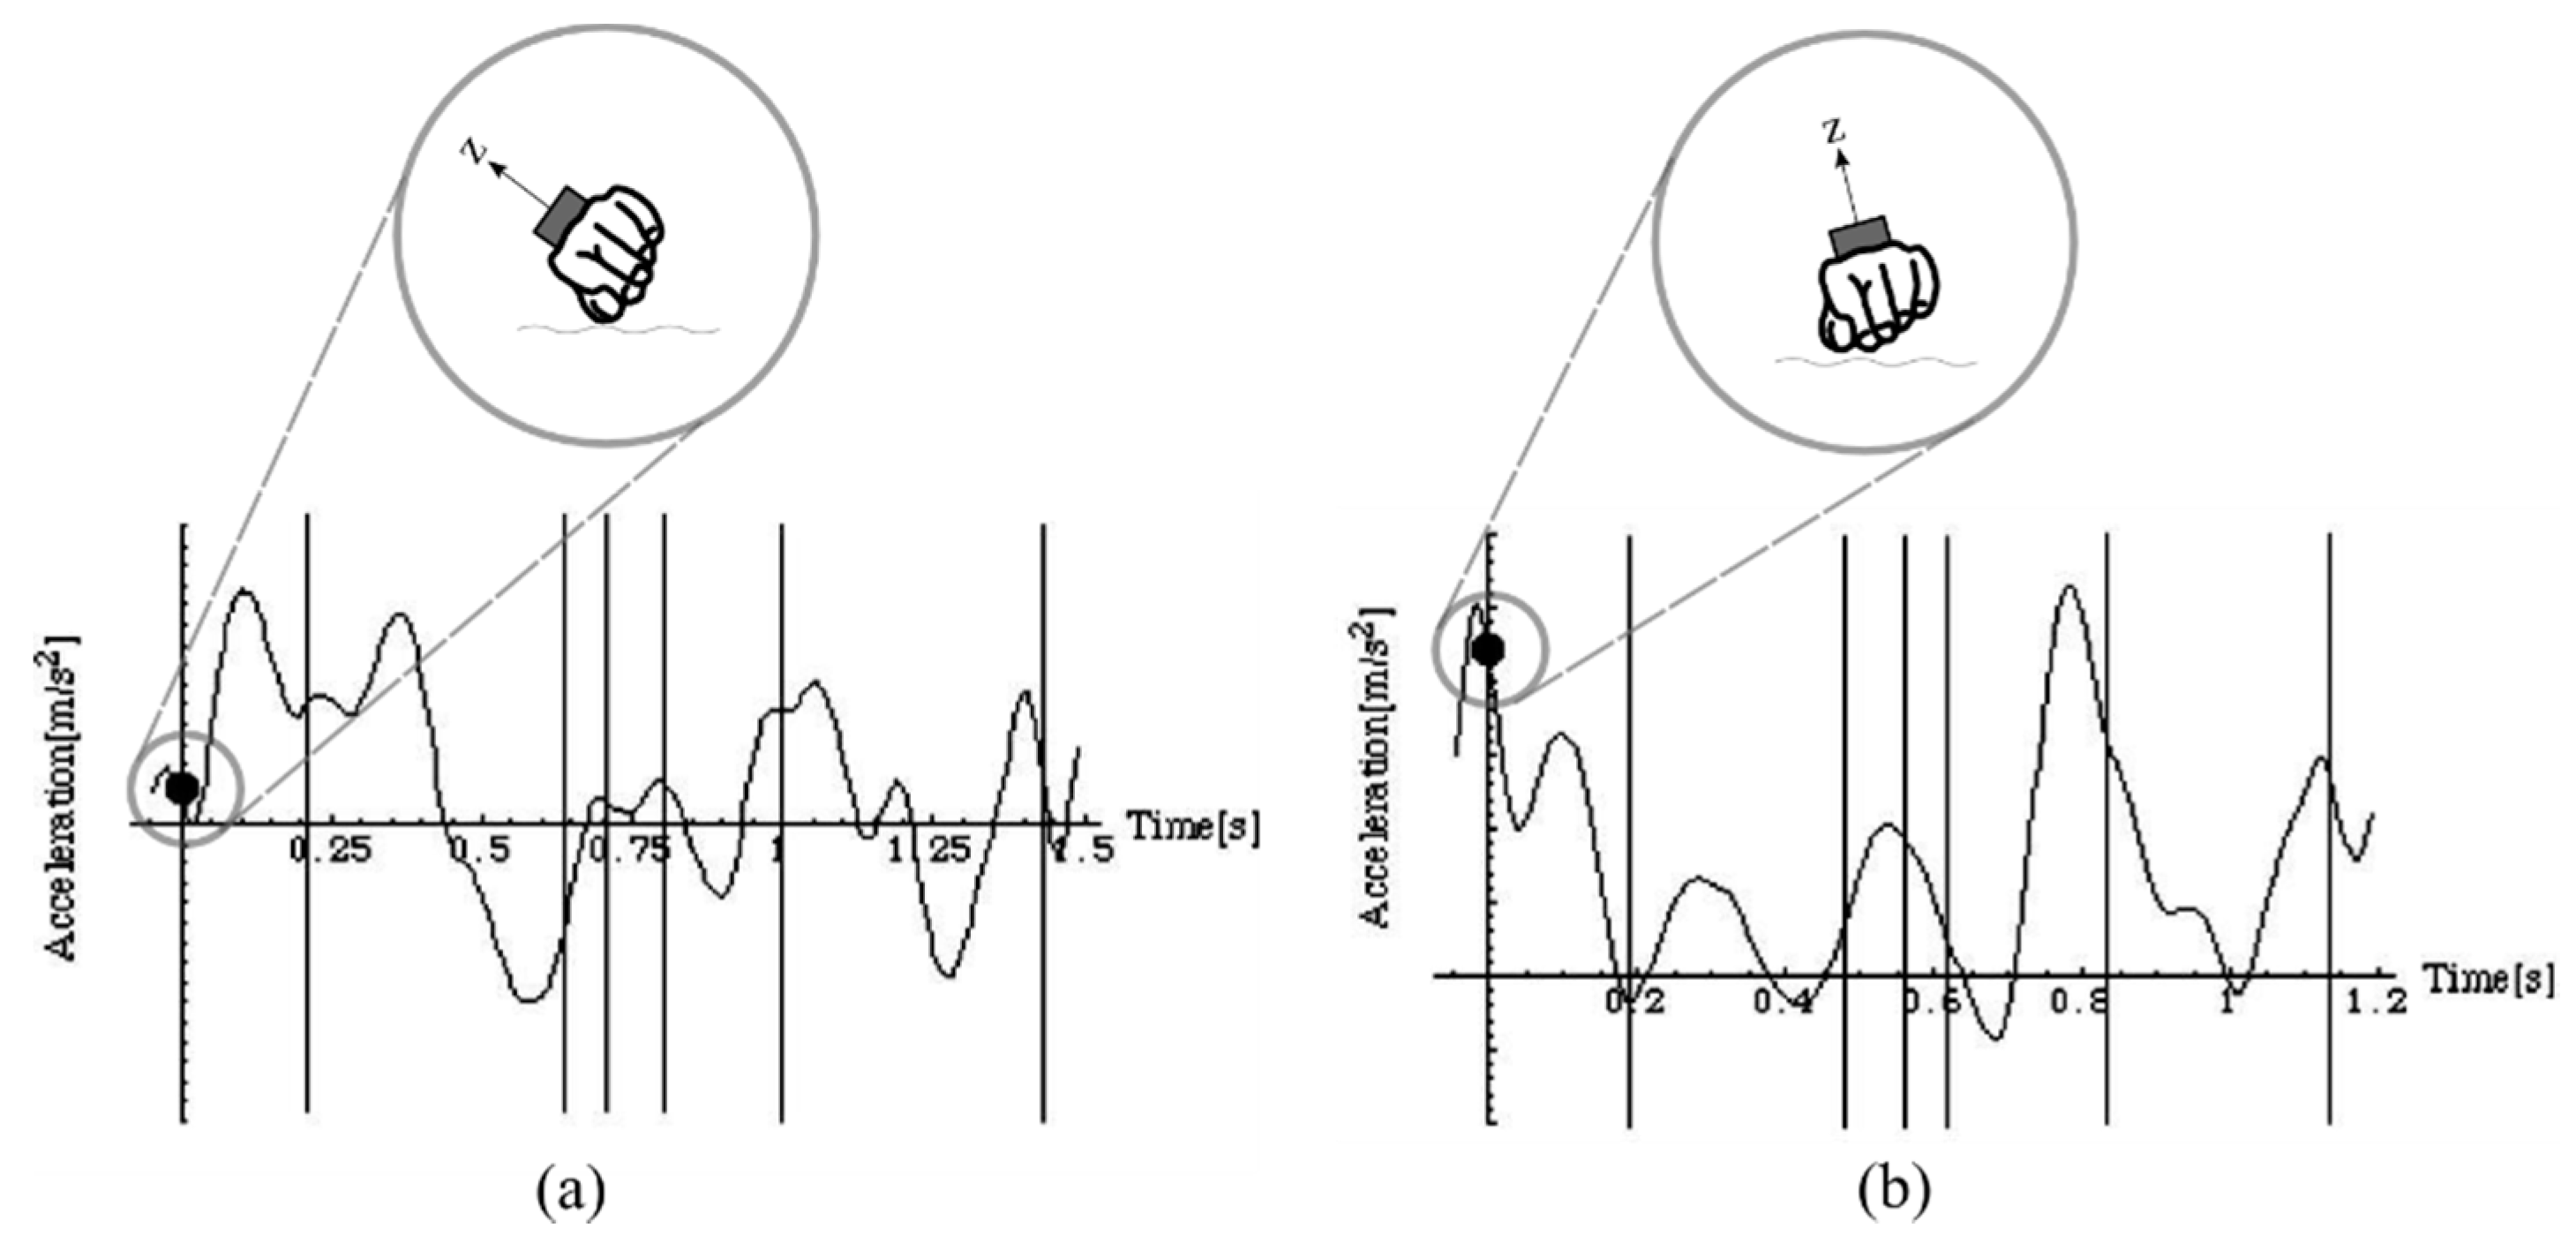
4.1.1. Stroke Phase Analysis
| Swimming Stroke | Acceleration (m·s−2) | Angular Velocity (rad·s−1) |
|---|---|---|
| Frontcrawl | −20 to +40 | −7.0 to +8.7 |
| Backstroke | −10 to +30 | −10.5 to +10.5 |
| Breaststroke | −20 to +40 | −7.0 to +7.0 |
| Butterfly | −40 to +40 | −7.0 to +14.0 |


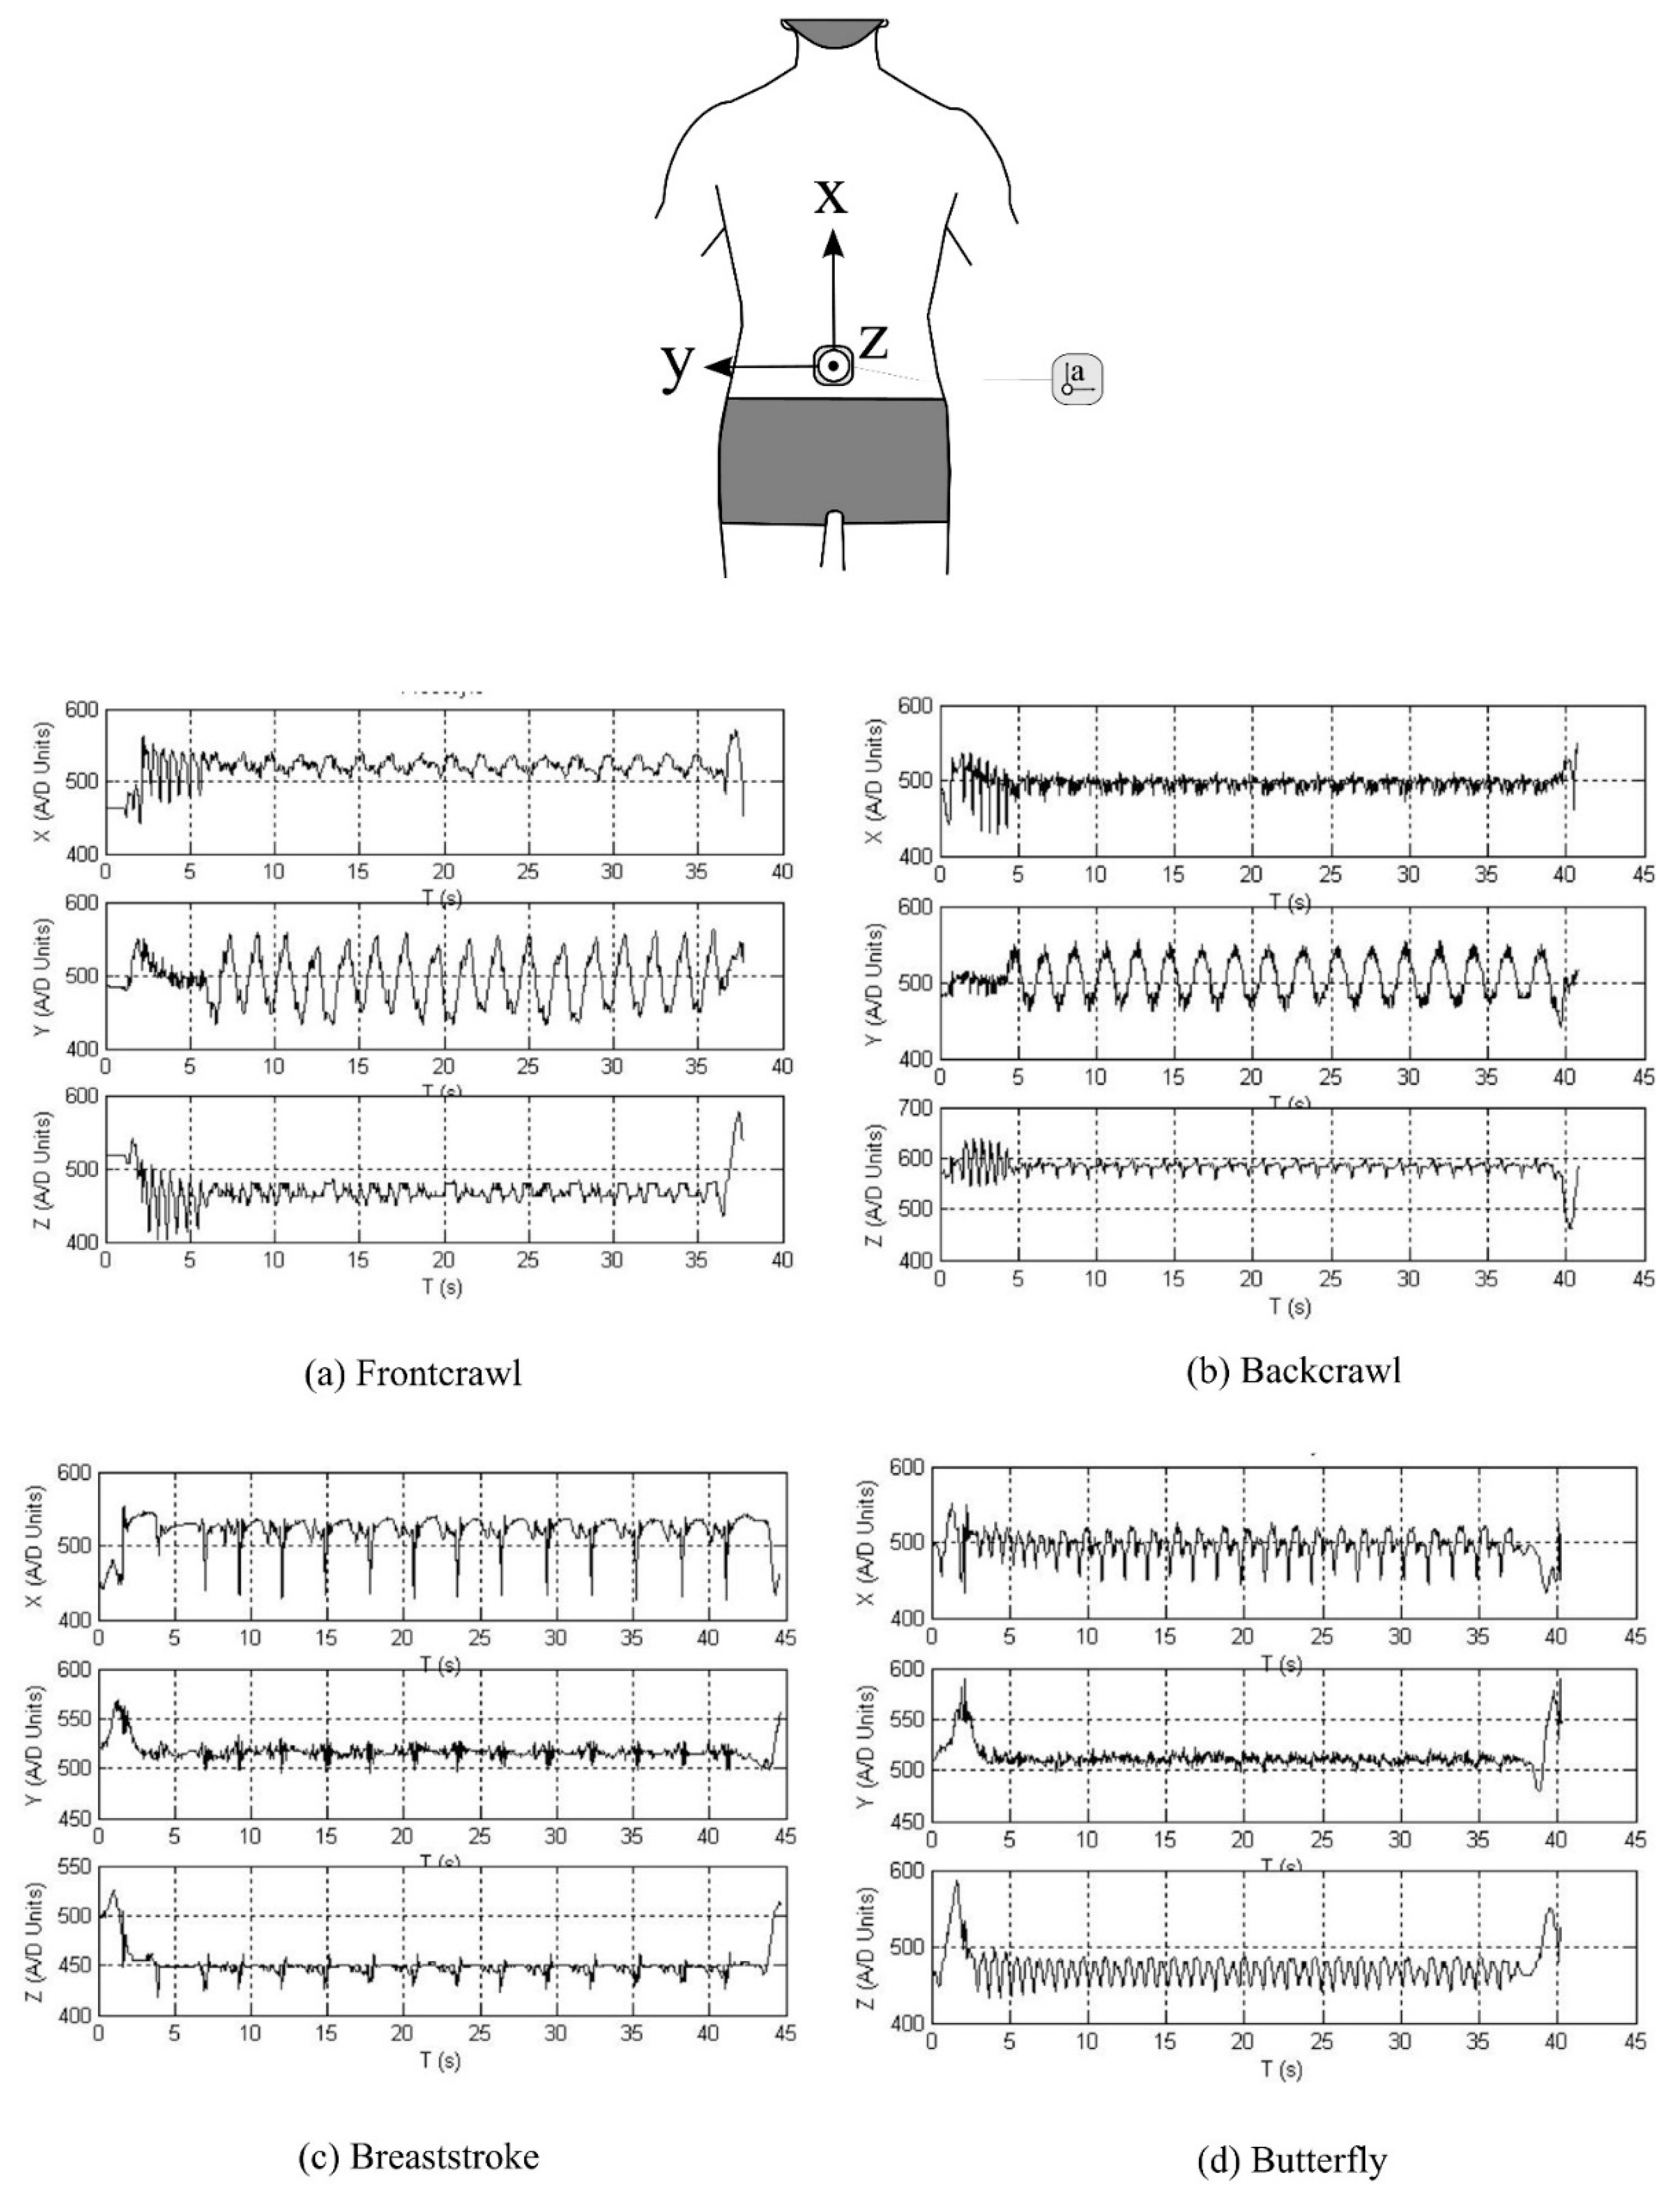
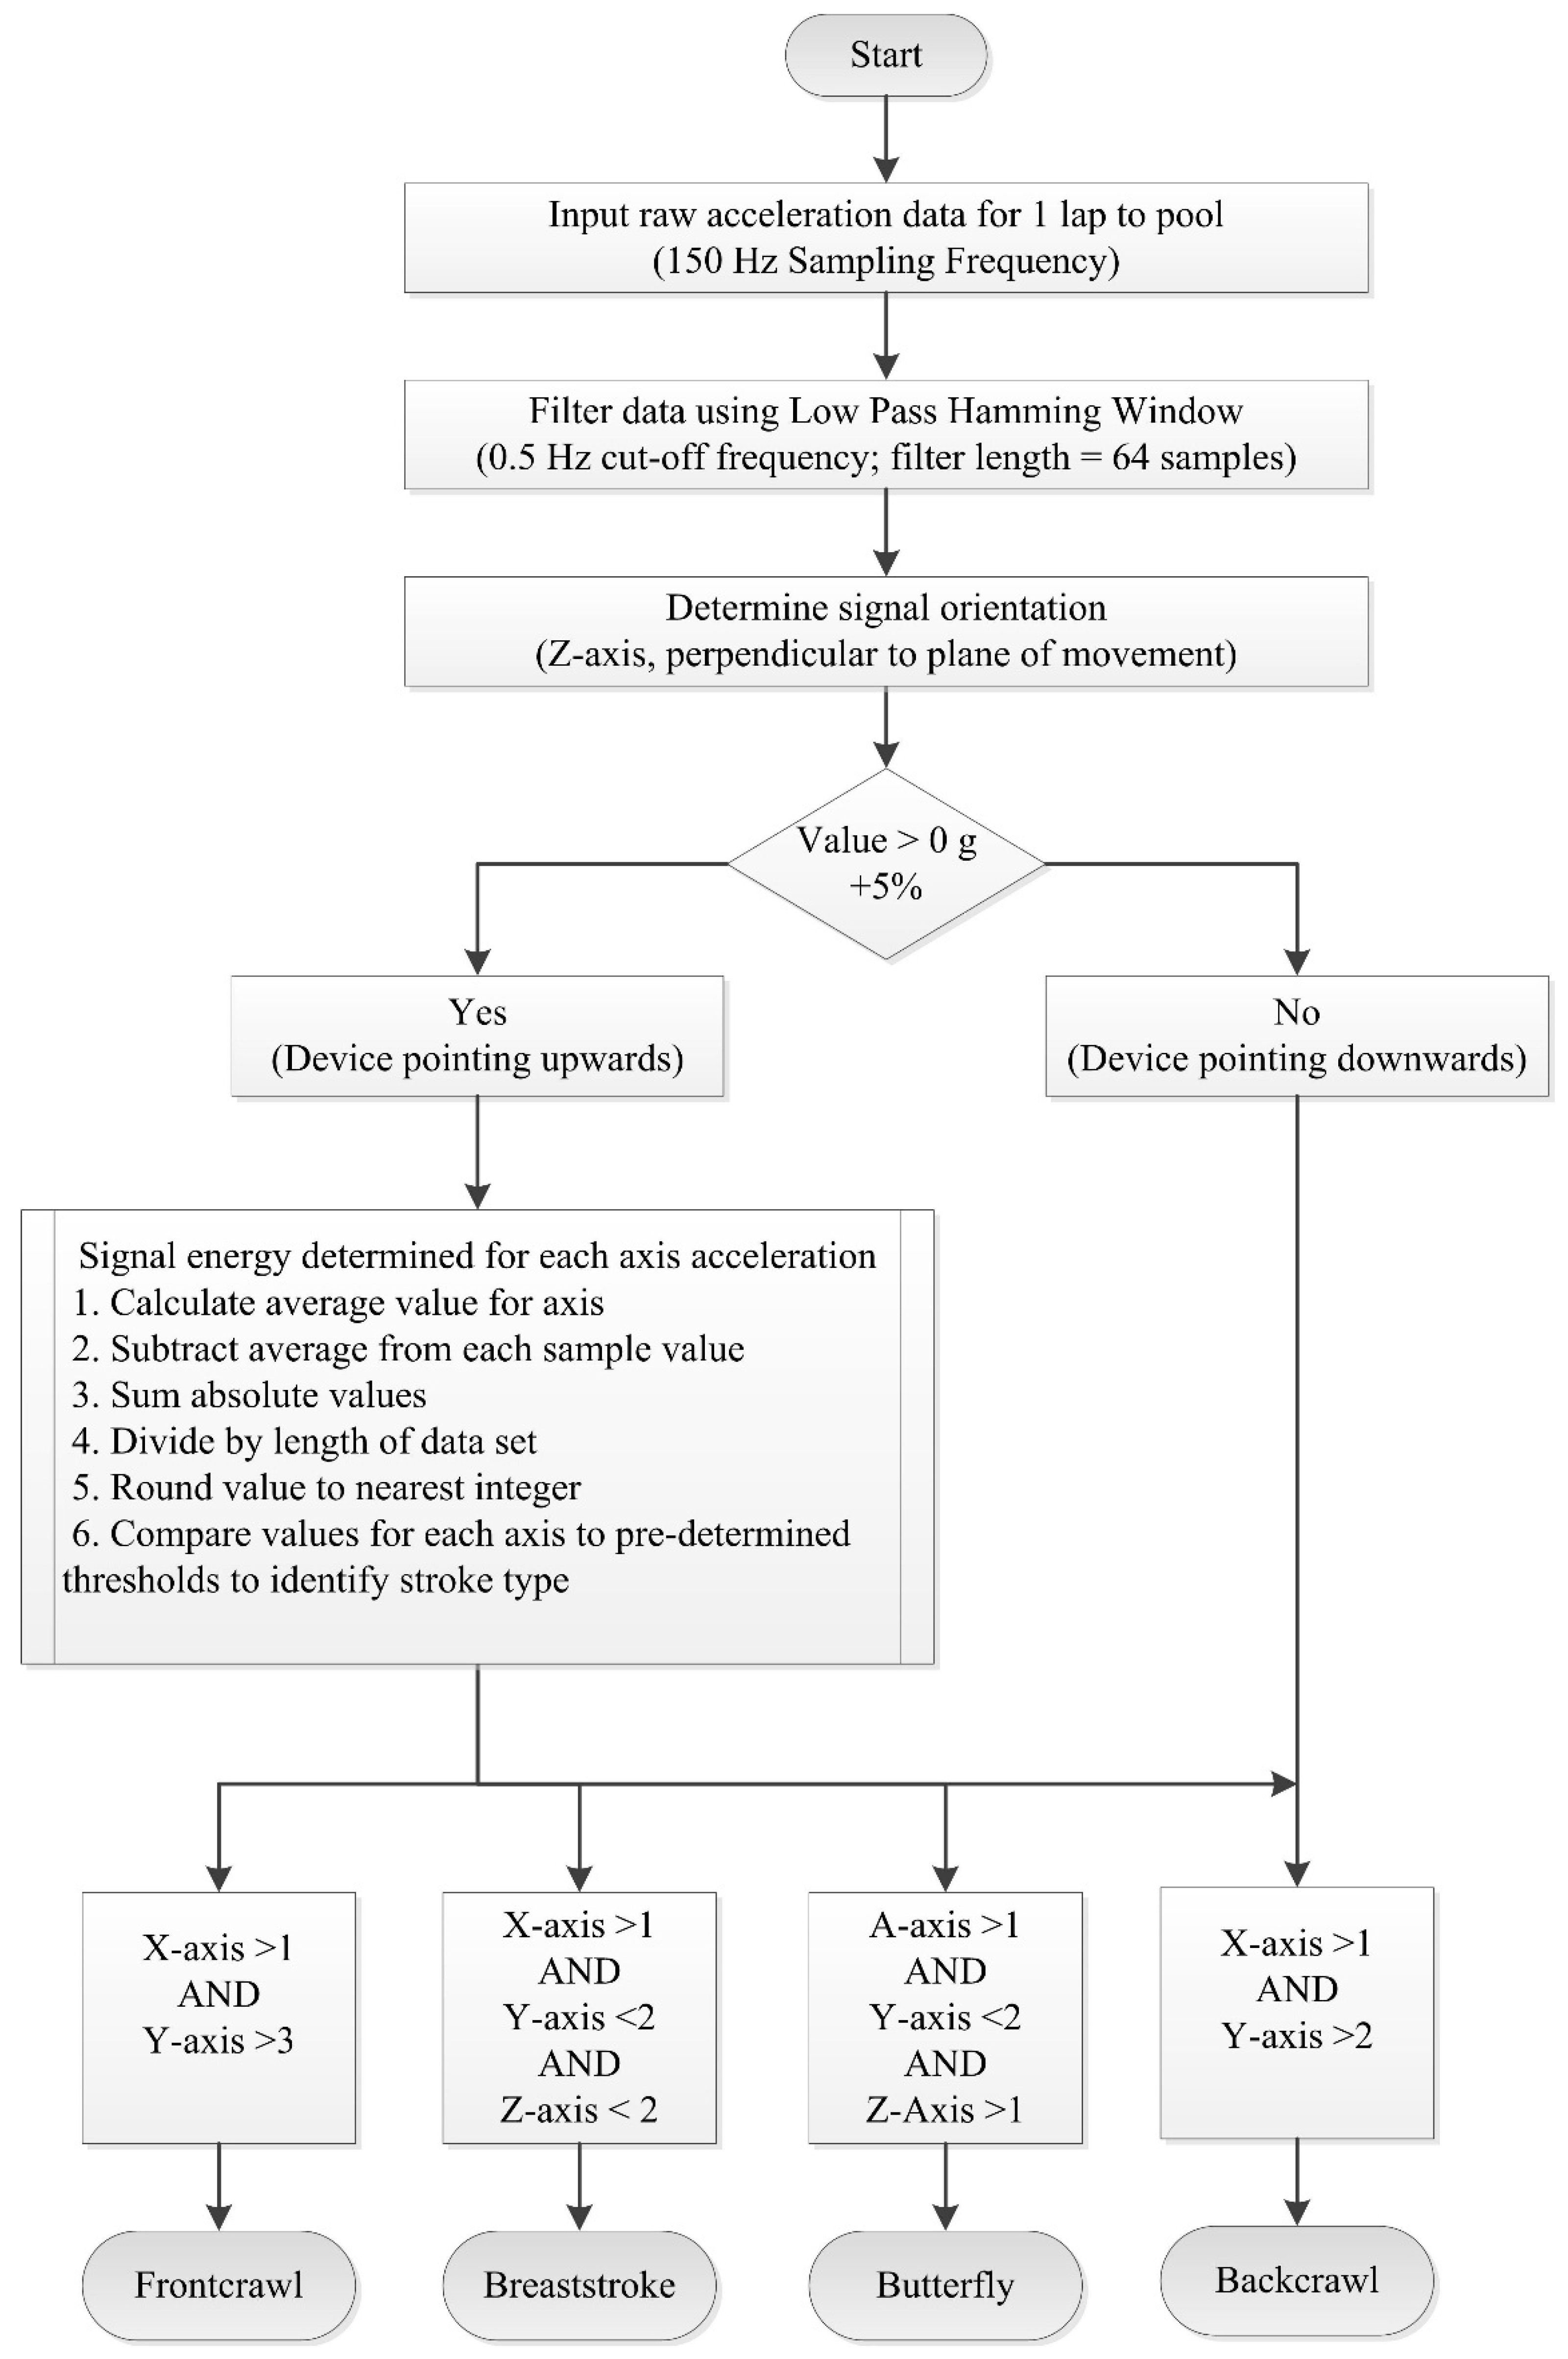
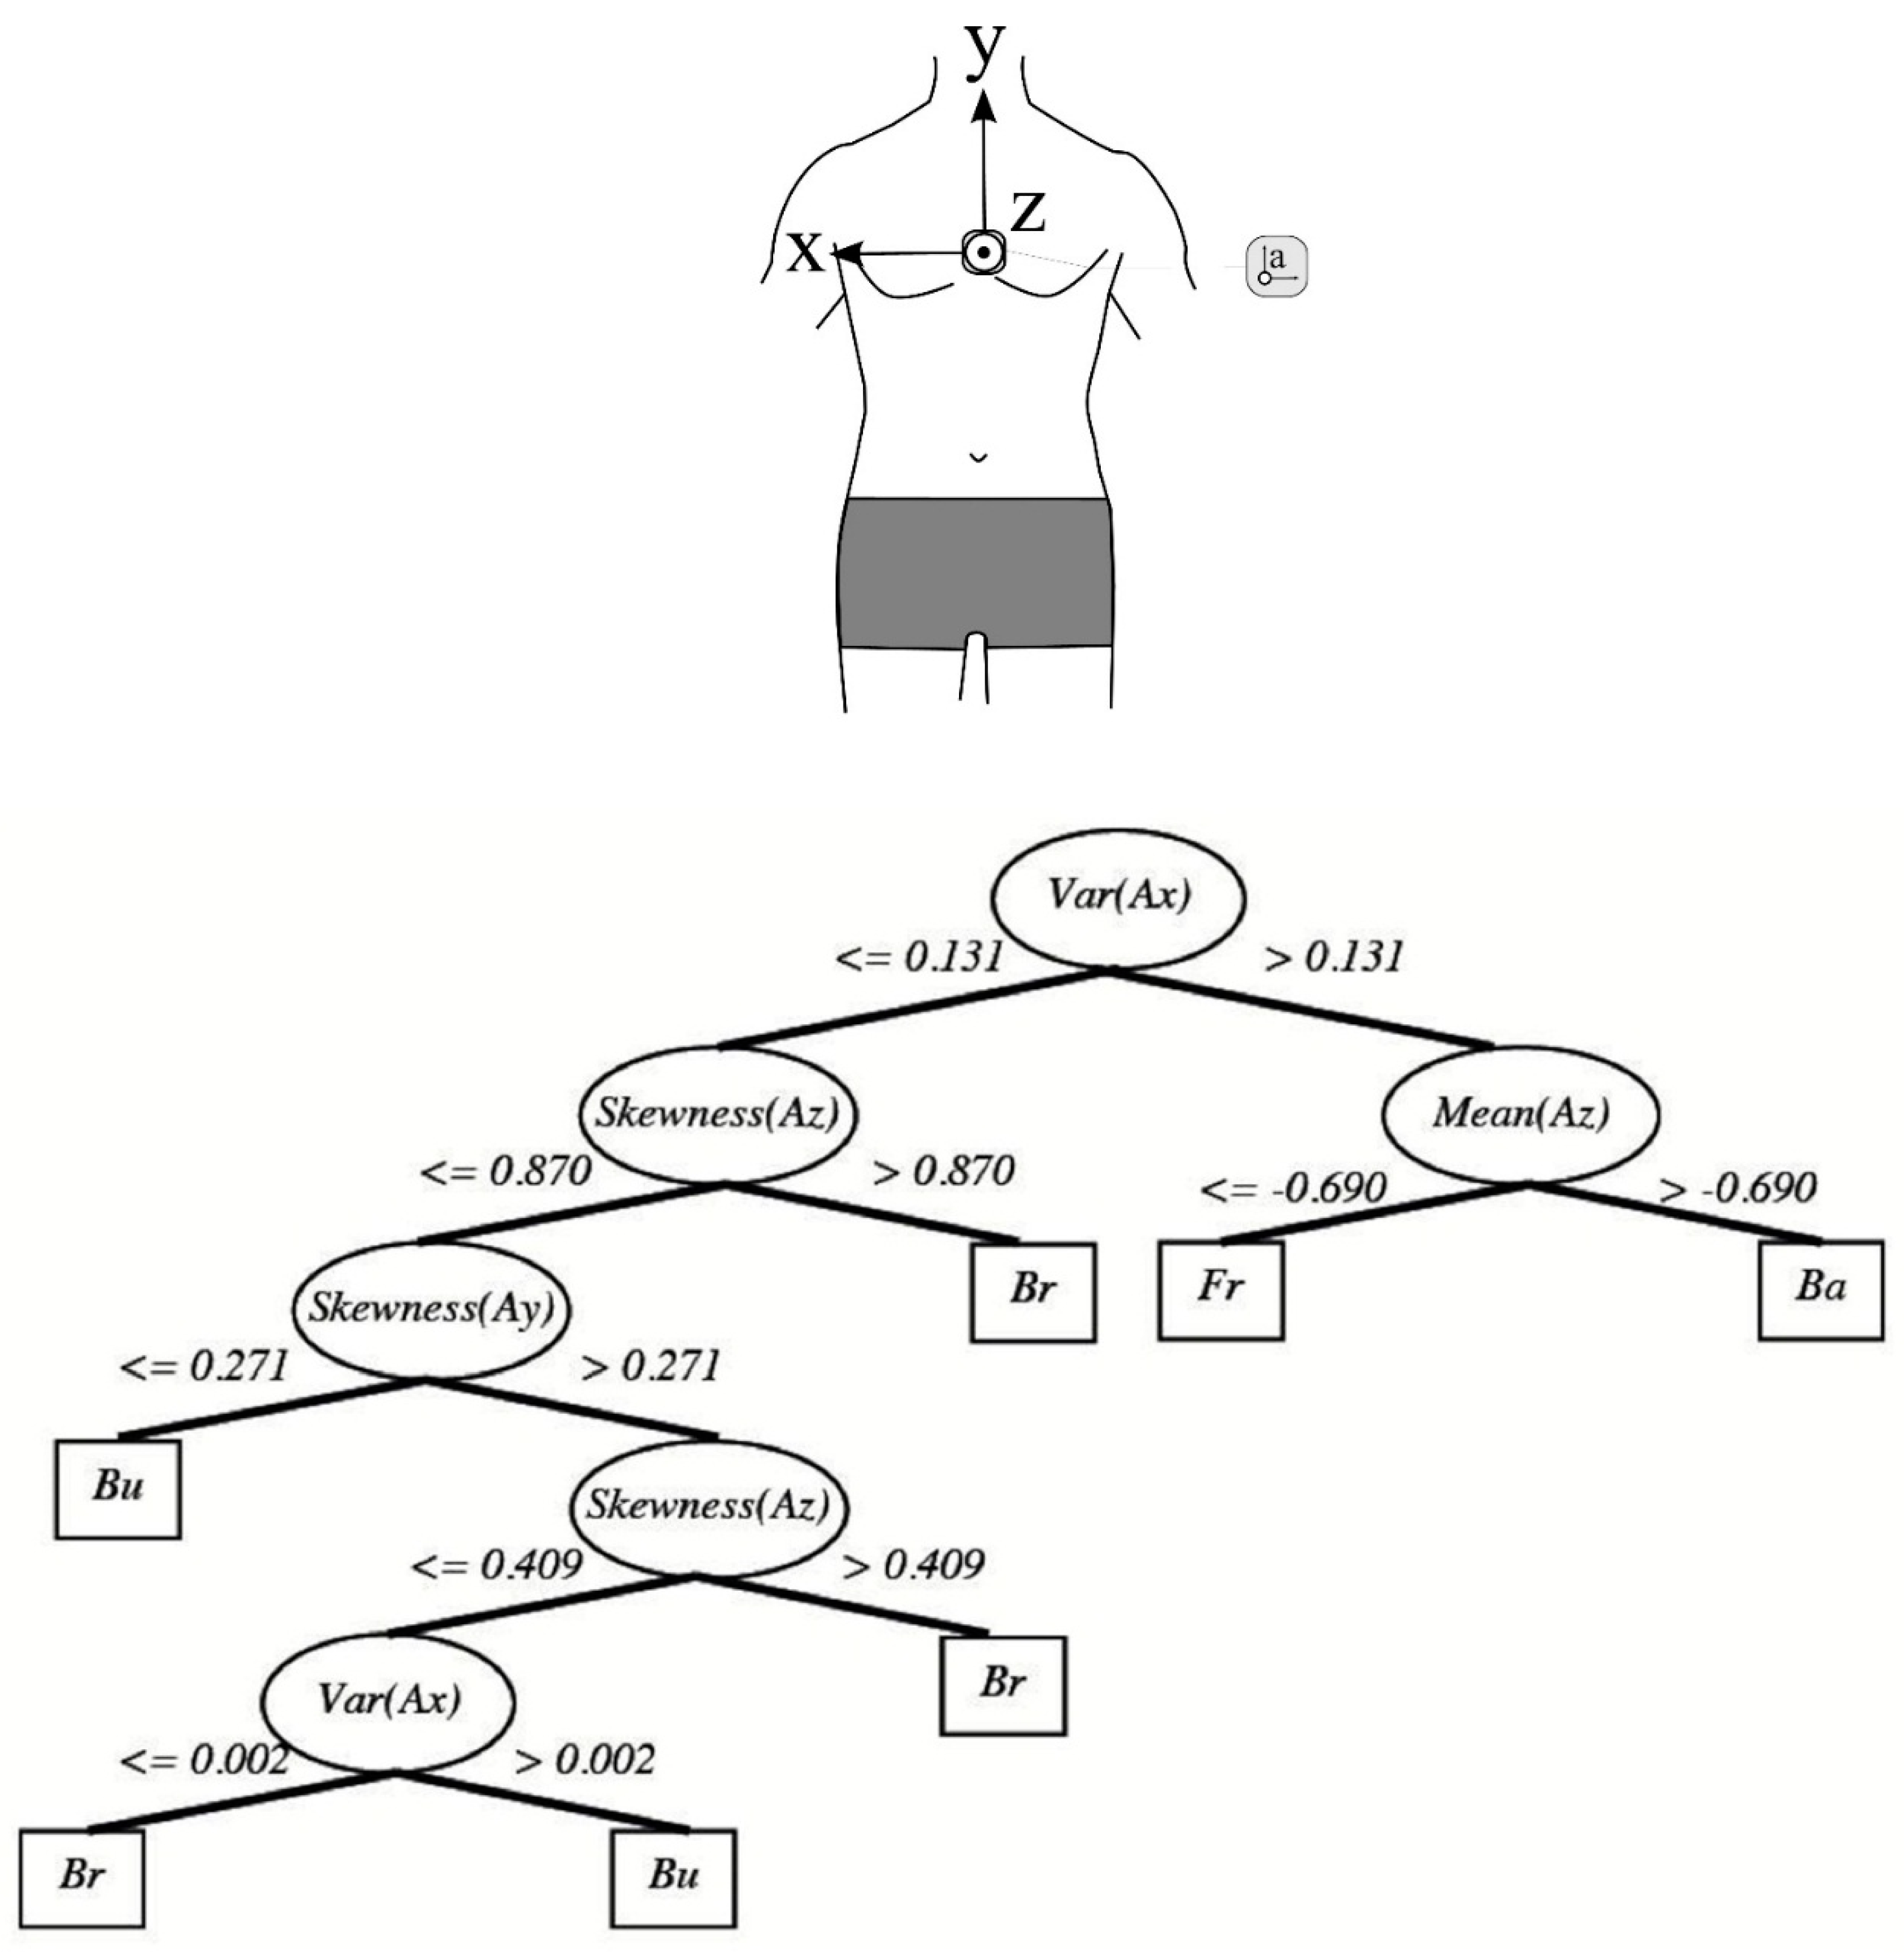
4.1.2. Stroke Type Identification


| Comparison Measure | Recognition Accuracy | |
|---|---|---|
| Wrist | Upper Back | |
| Sampling Frequency | ||
| 5 Hz | 88.5% | 95.1% |
| 10 Hz | 88.9% | 95.4% |
| 25 Hz | 89.8% | 95.3% |
| Swimming style | ||
| Frontcrawl | 90.8% | 96.1% |
| Backstroke | 88.8% | 97.1% |
| Breaststroke | 92.6% | 96.7% |

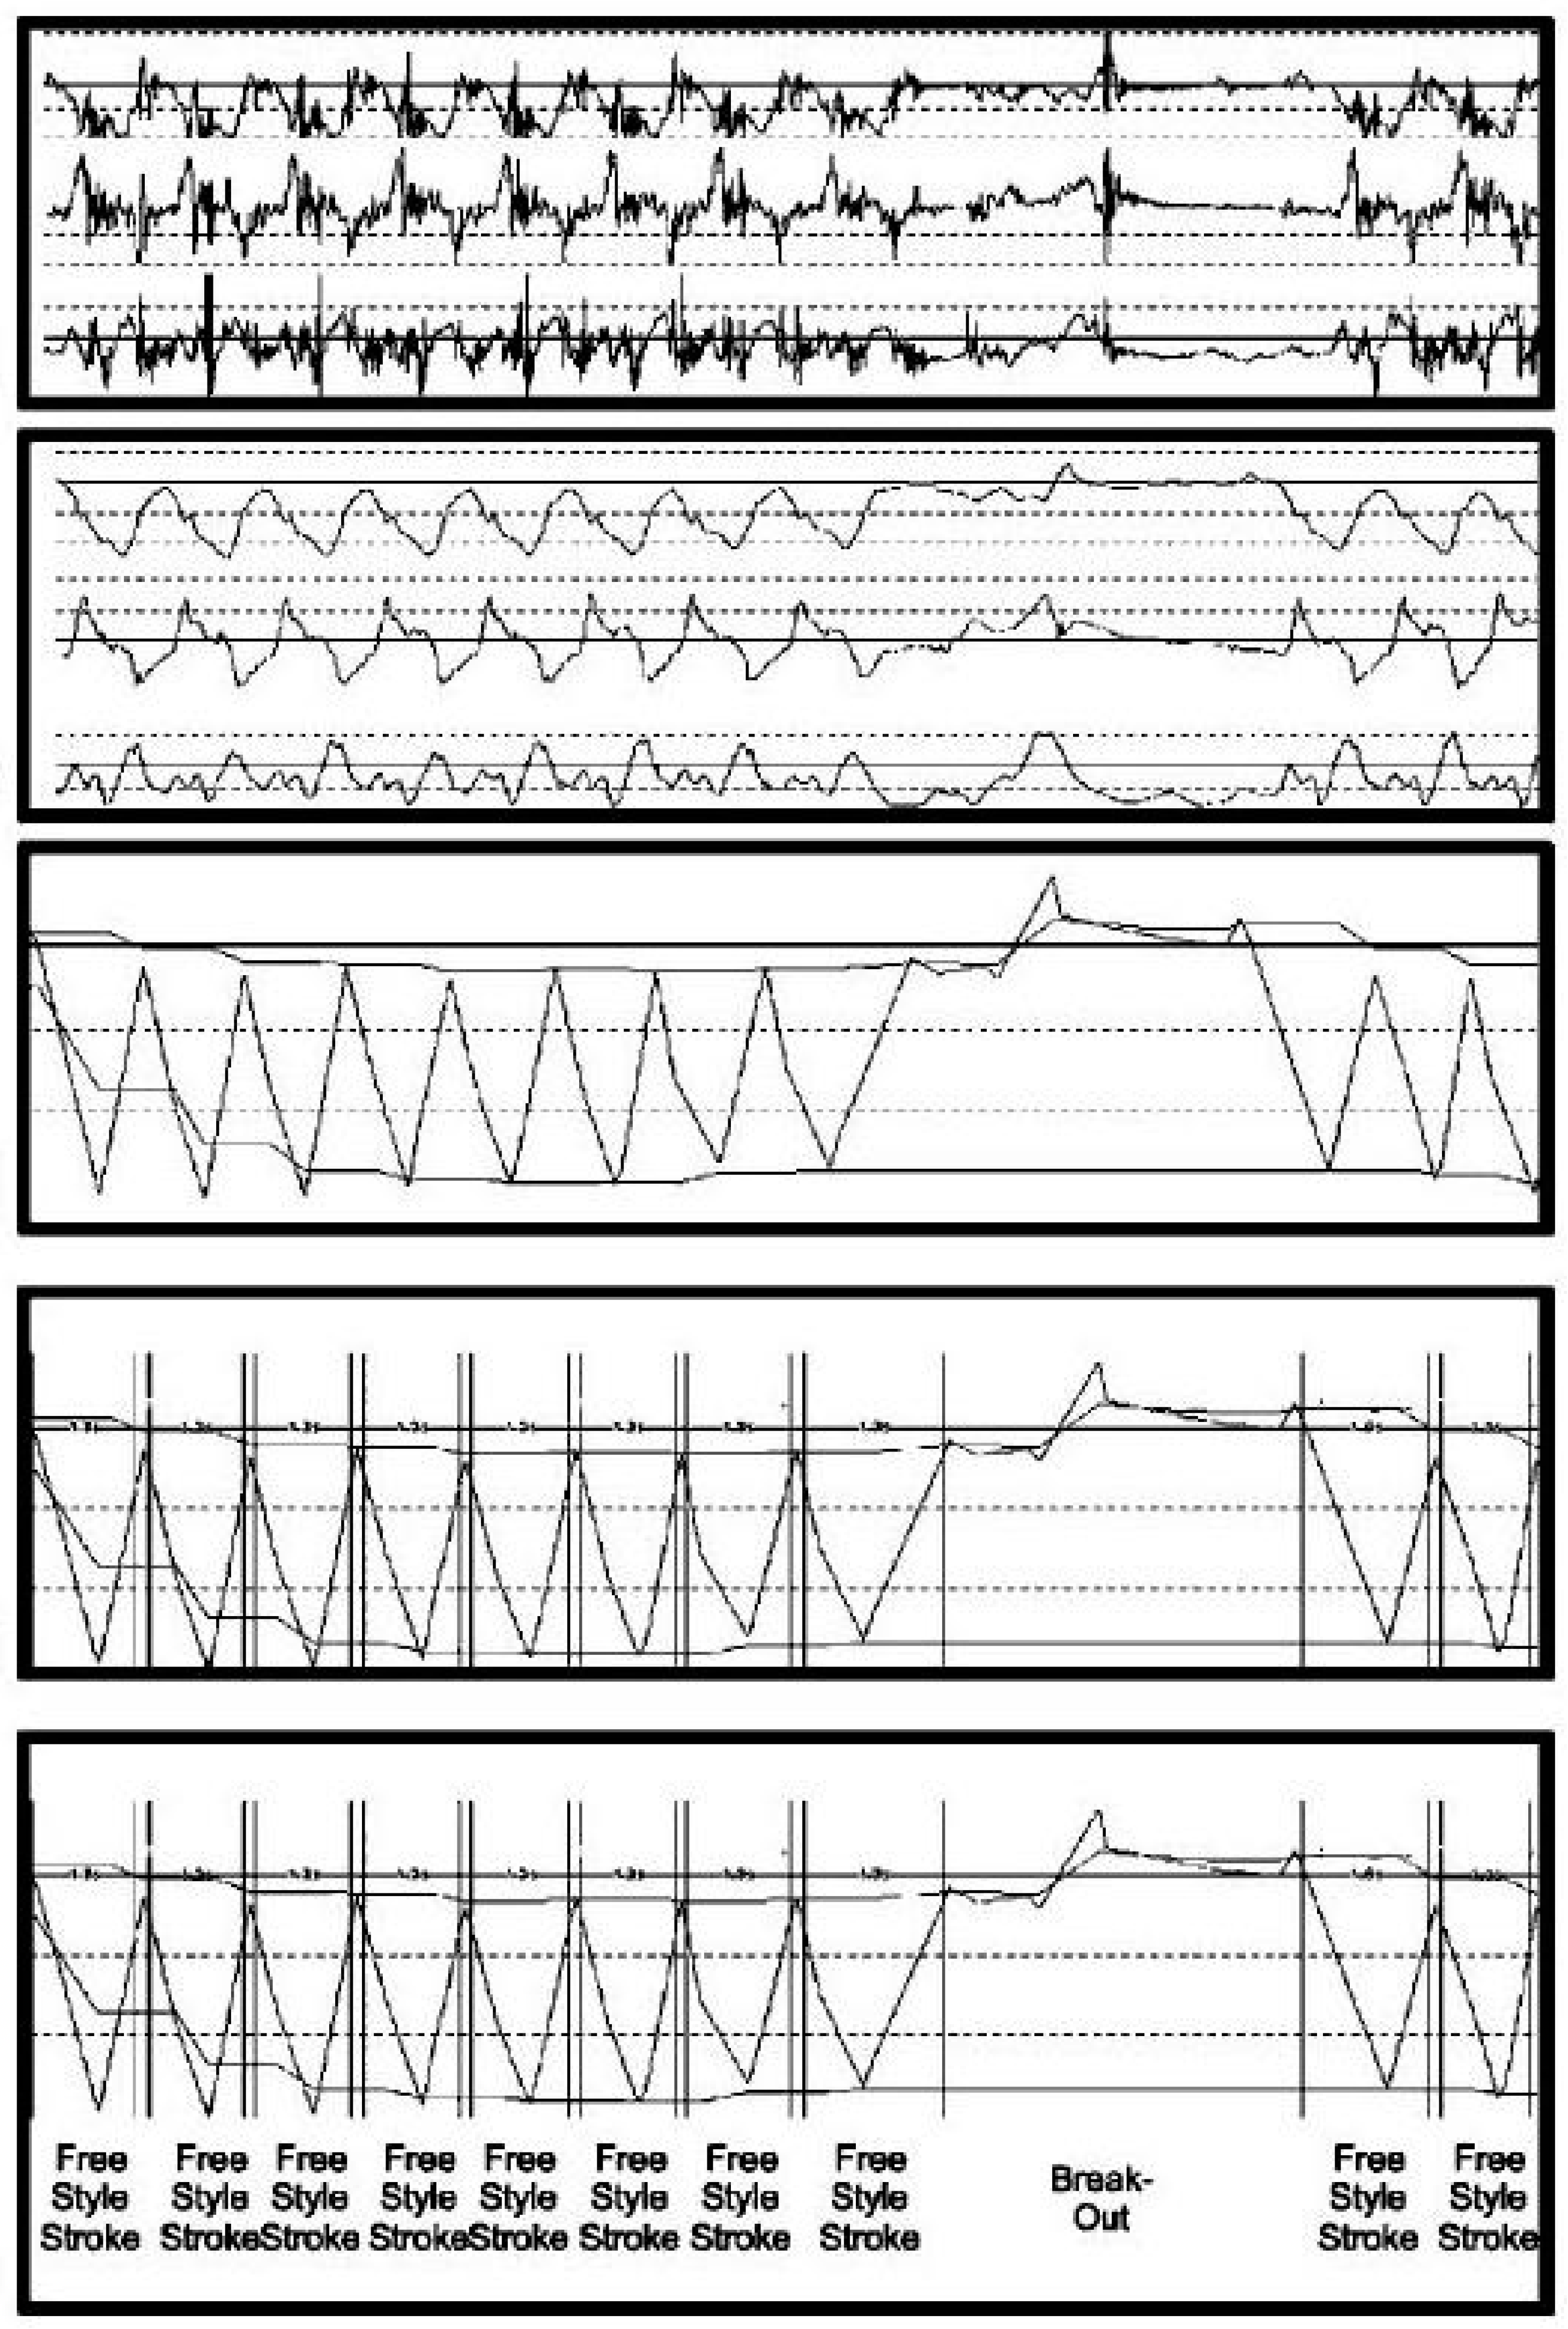
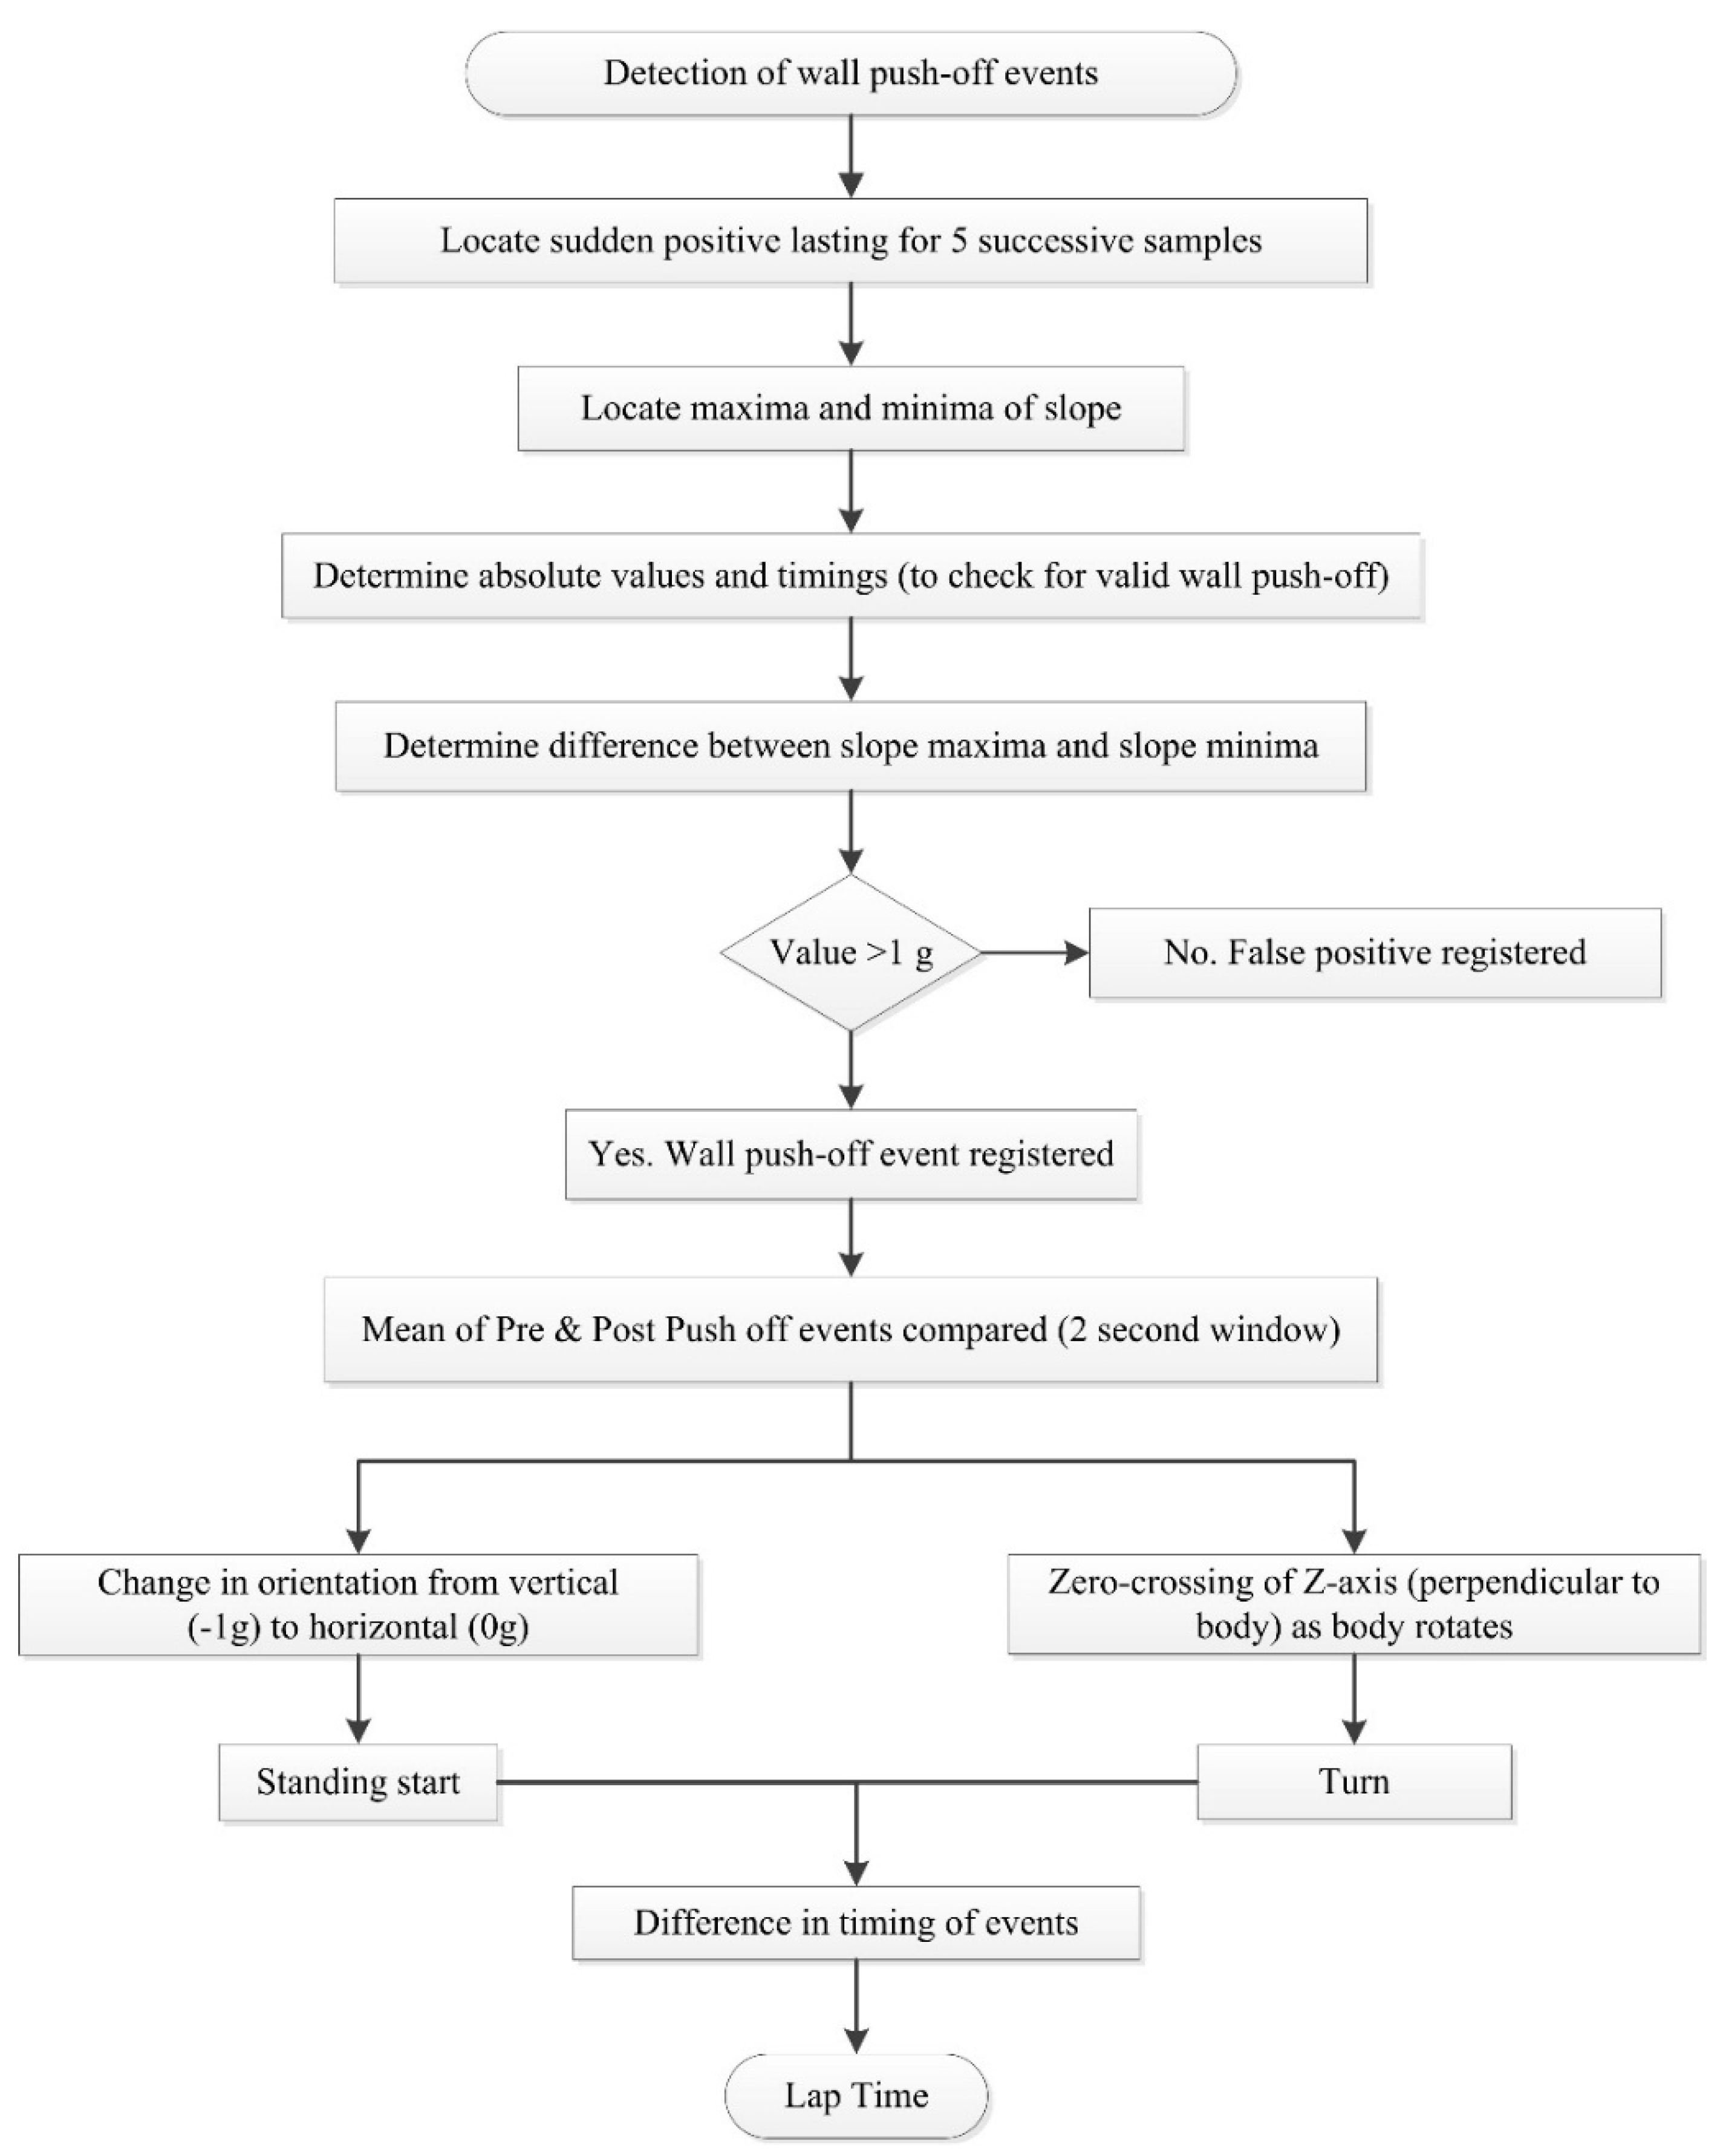
4.1.3. Lap Time

4.1.4. Swim Distance
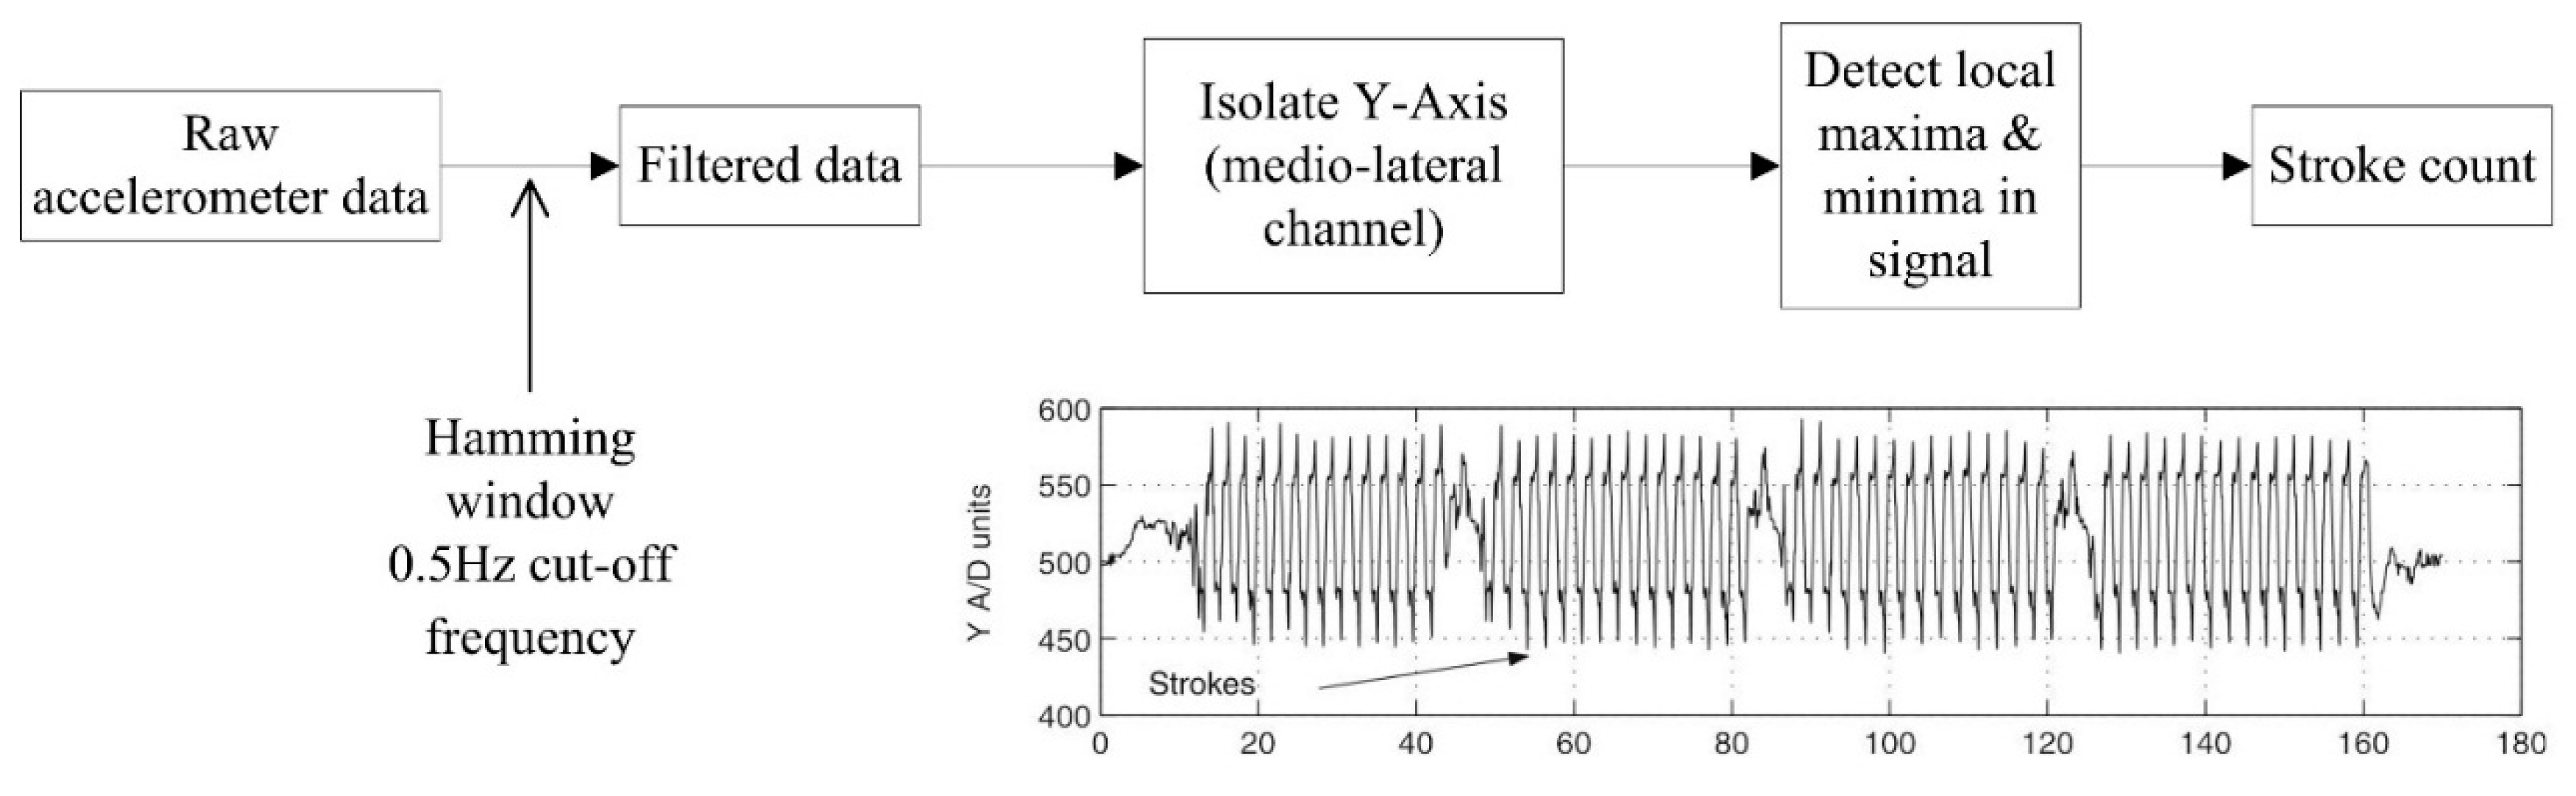
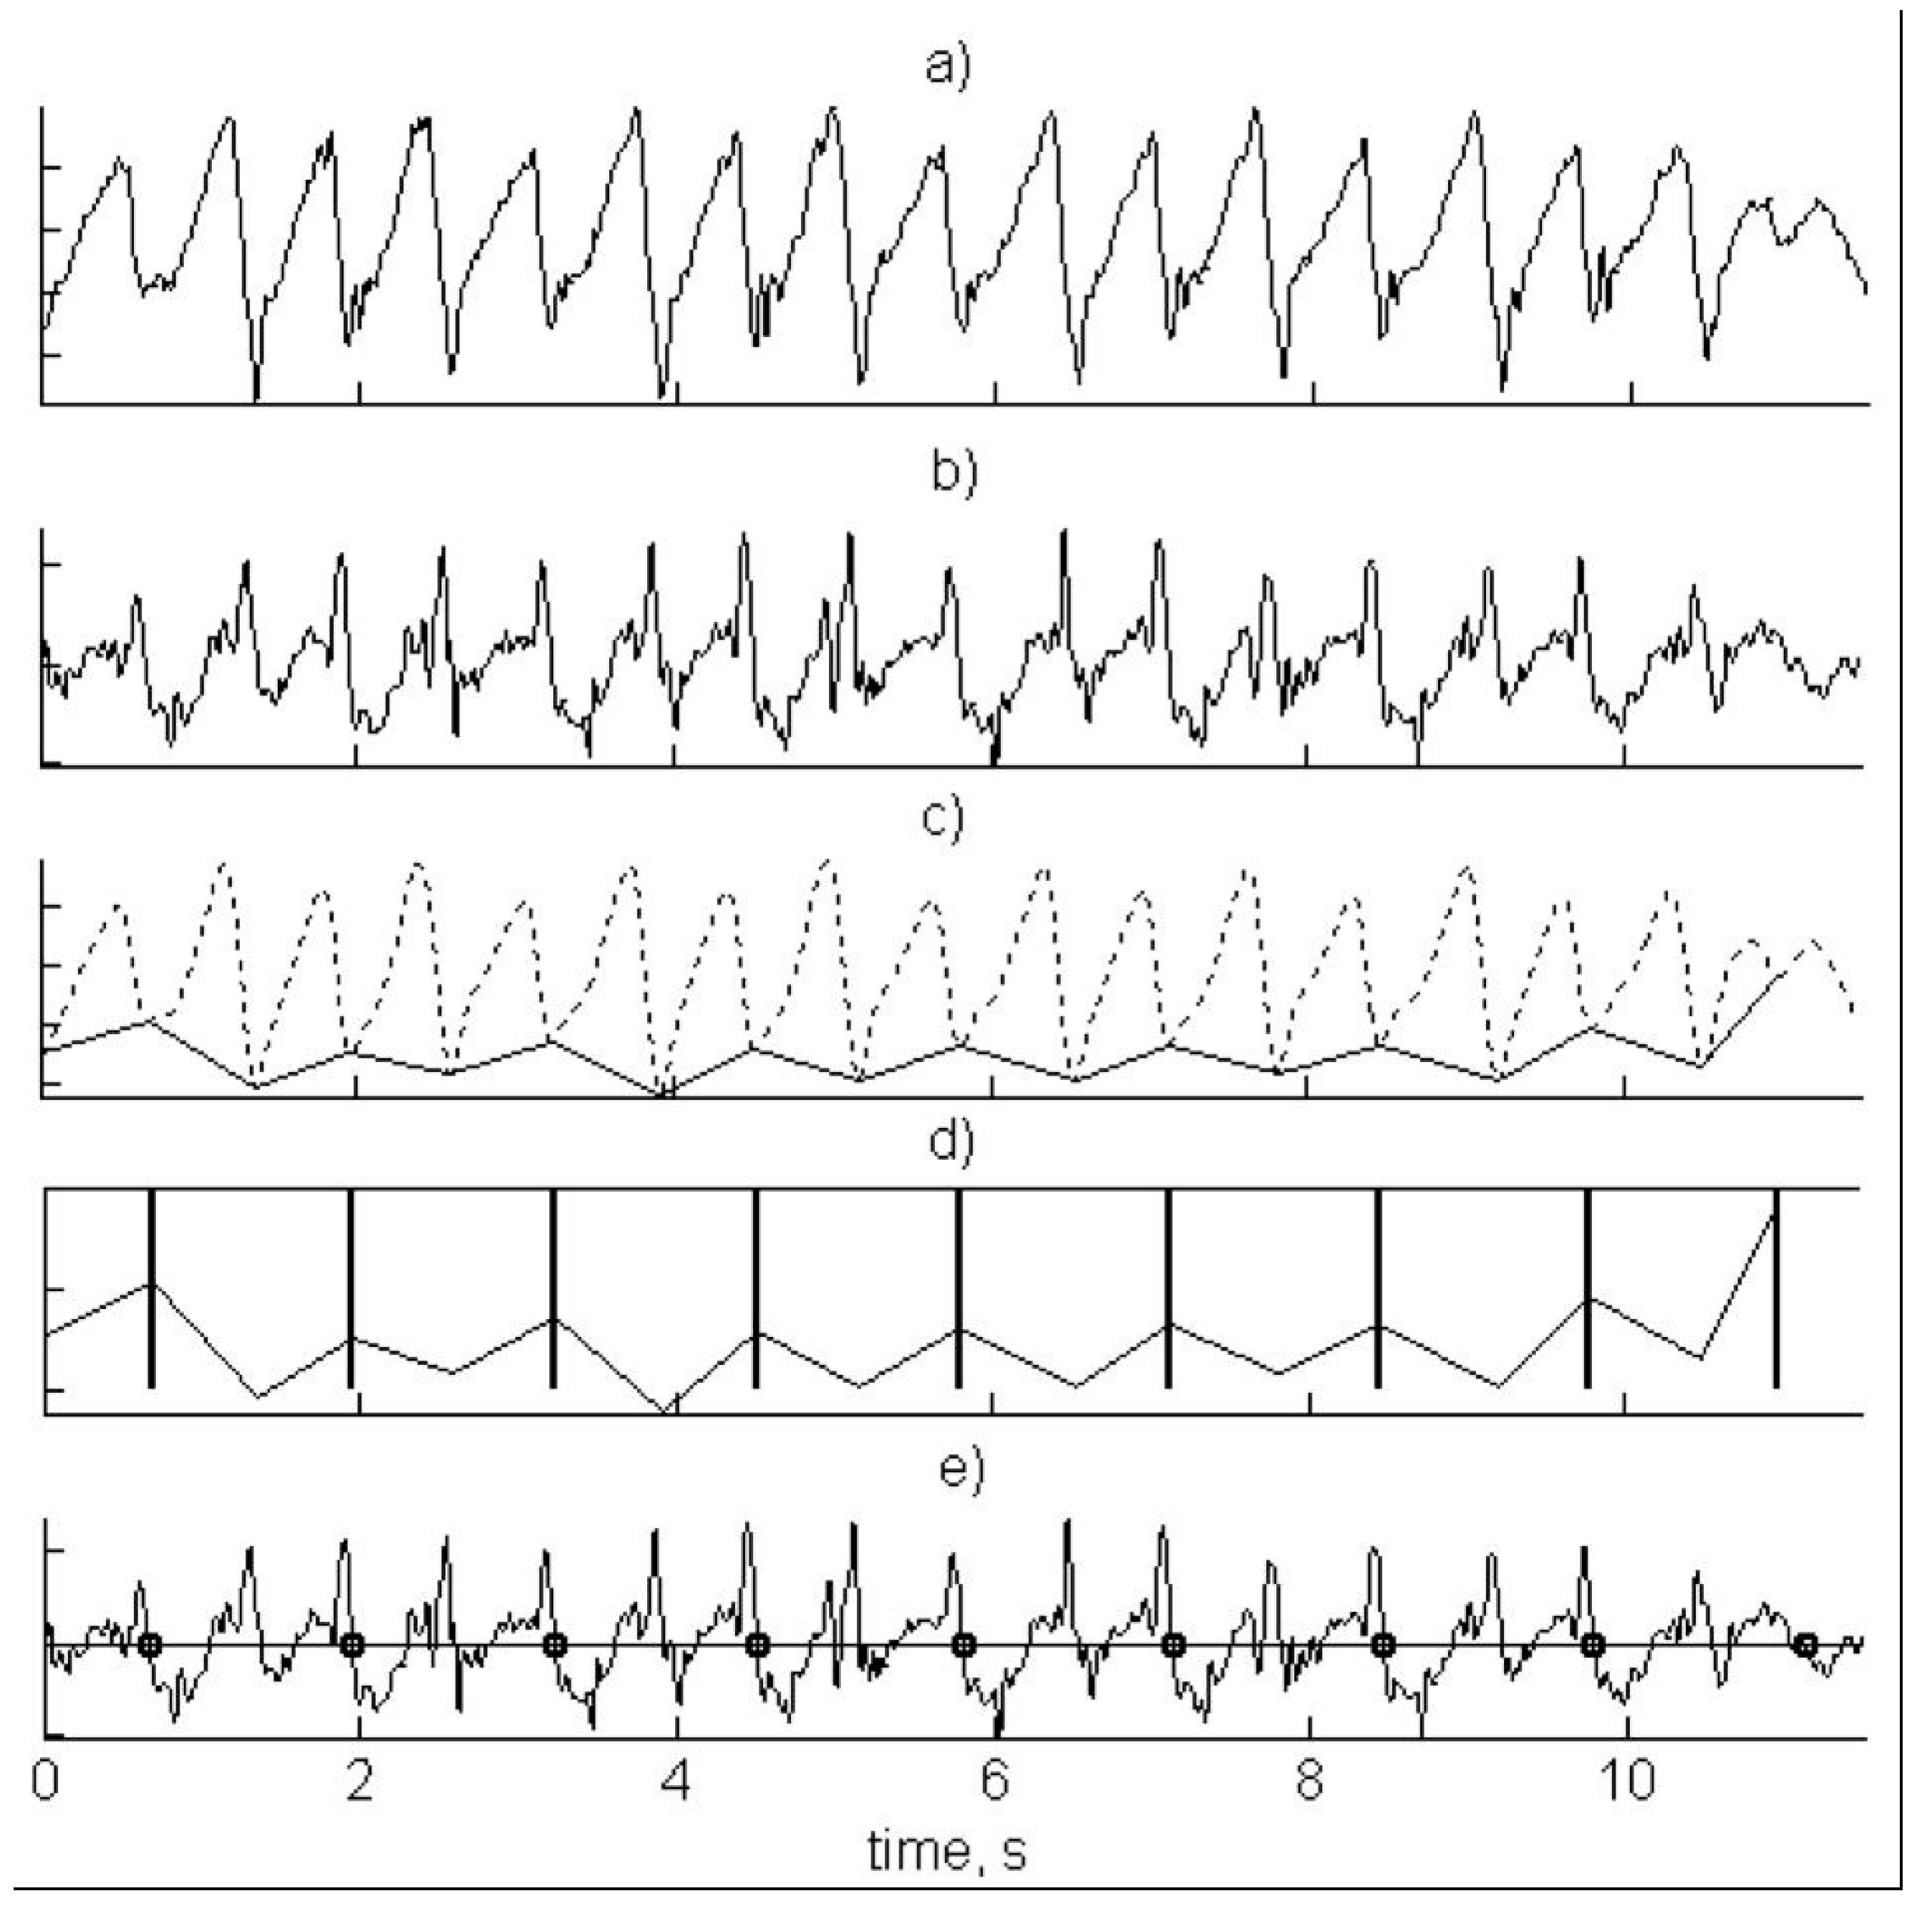
4.1.5. Stroke Count and Stroke Rate

| Ref. | Stroke Count Detection Method | Sensor Location | Protocol | Accuracy |
|---|---|---|---|---|
| [11] | Peak detection of medio-lateral acceleration signal | Lower back | N = 6; 4 × 50 m intervals (164 data sets analysed) Video and manual data used for comparison | All strokes: 90% ± 1 of actual. Frontcrawl: 65% accuracy, 100% ± 1 of actual. |
| [26] | Peak detection of anterio-posterior acceleration signal and zero-crossing of longitudinal signal | Lower back | N = 4; 4 × 25 m intervals of butterfly Video used as criterion measure | 97.6% accuracy |
| [59] | Peak detection of acceleration signal with different threshold levels for each stroke. Different axes used for different strokes | Wrist & upper back | N = 11; Intervals completed at various speeds (up to 1053 data sets); Validation method not reported | All strokes: >99% accuracy |
| [62] | Peak detection of forward acceleration signal | Wrist | N = 18; 7 × 50 m frontcrawl intervals; Video and manual data used for comparison | Not reported |
| [71] | Zero crossing of acceleration signal with thresholding. Medio-lateral axis for frontcrawl and backstroke. Forward axis for breaststroke and butterfly | Lower back | N = 2; 4 × 25 m each stroke | All strokes: 56% accuracy, 100% ± 1 of actual. |
| [86] | Peak detection of acceleration signal; GPS integration necessary | Head | N = 21; 3 × 100 m swims (1 each of butterfly, breaststroke & frontcrawl); Video data used for comparison | Butterfly: r = 1.00 (p < 0.05); Breaststroke: r = 0.99 (p < 0.05); Frontcrawl: stroke count was “not discernible” due to sensor location |

4.1.6. Swimming Velocity
| Ref. | Swimming Velocity Detection Method | Sensor Location | Accuracy |
|---|---|---|---|
| [62] | Average speed determined as time taken to cover known pool distance, recorded with accelerometer. | Wrist | 1.67% upper bound error in velocity calculations |
| 1.33% upper bound error in stroke duration calculations | |||
| [64] | Trapezoidal integration of forward acceleration. Geometric moving average change detection algorithm to account for integration drift. Determined both instantaneous and average velocity. | Lower back | Instantaneous velocity: RMS error = 11.3 cm·s−1 |
| Average velocity: Spearman’s Rho 0.94 (p < 0.001) | |||
| [72] | Gaussian process framework | Lower back | RMS error = 9.0 cm·s−1, r = 0.95 (p < 0.001) |
| [83] | Integration of acceleration signal with correction based on swimmers height. Five points on different axes and resultant acceleration determined | Lower back | 1.08 m·s−1: bias 0.01 m·s−1; limits of agreement: −0.26 to 0.29 m·s−1 (94.75% of data points inside limits of agreement) 1.01 m·s−1: bias 0.02 m·s−1; limits of agreement: −0.17 to 0.20 m·s−1 (96.25% of data points inside limits of agreement) |
| [84] | Regression analysis and predictive equations based on output of two accelerometers | Wrist & ankle | r = 0.76, R2 = 0.57, SEE = 0.14 m·s−1 (p < 0.001) |
| [86] | GPS positioning. 5 point moving average to smooth. Exclusion criterion included for manual inspection of velocity data. | Head | Butterfly: SEM = 0.18, 95% CI = 0.14–0.27 (Sig. difference with criterion, p < 0.05) |
| Frontcrawl: SEM = 0.13, 95% CI = 0.10–0.19 (No sig. difference) | |||
| Breaststroke: SEM = 0.12, 95% CI = 0.09–0.17 (No sig. difference) | |||
| [97] | Bayesian linear regression (BLR) compared against Linear least square estimator (LLS) and Gaussian process regression (GPR) | Lower back | LLS: RMS error = 17.7%, 14.4 cm·s−1, r = 0.56 (p < 0.001) |
| GPR: RMS error = 9.2%, 6.1 cm·s−1, r = 0.91 (p < 0.001) | |||
| BLR: RMS error = 9.7%, 6.2 cm·s−1, r = 0.91 (p < 0.001) |
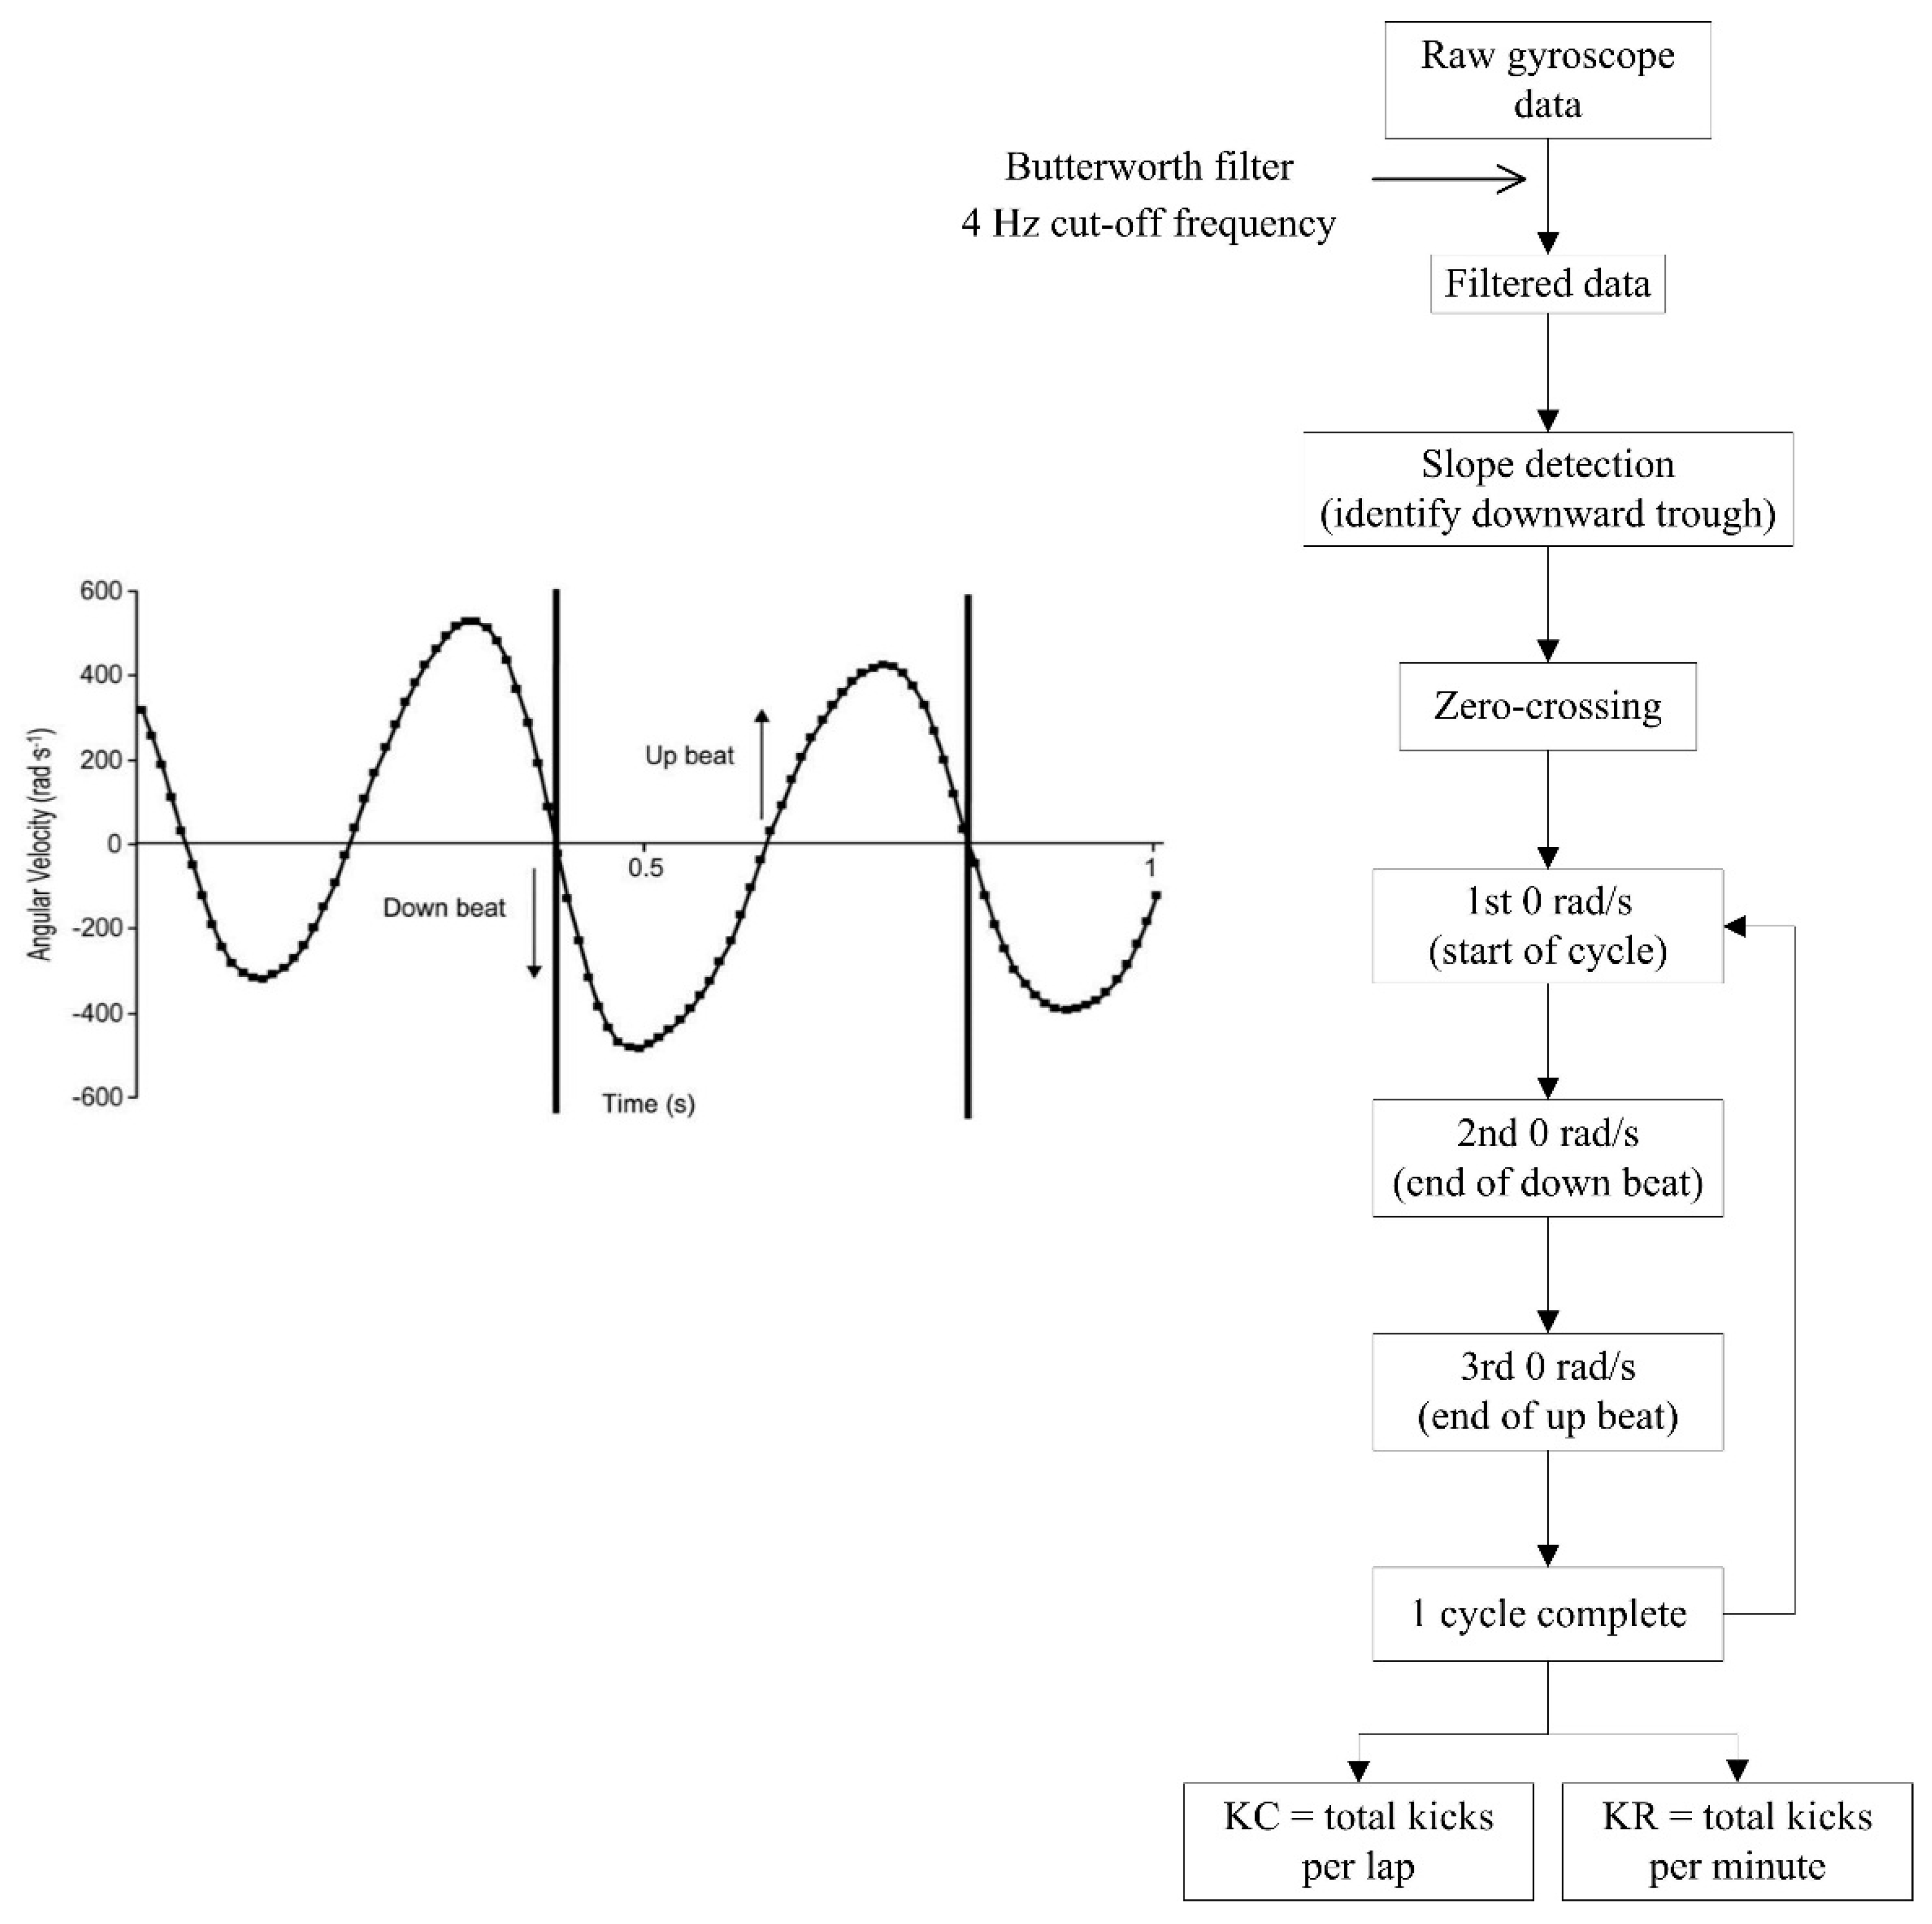
4.1.7. Kick Count and Kick Rate

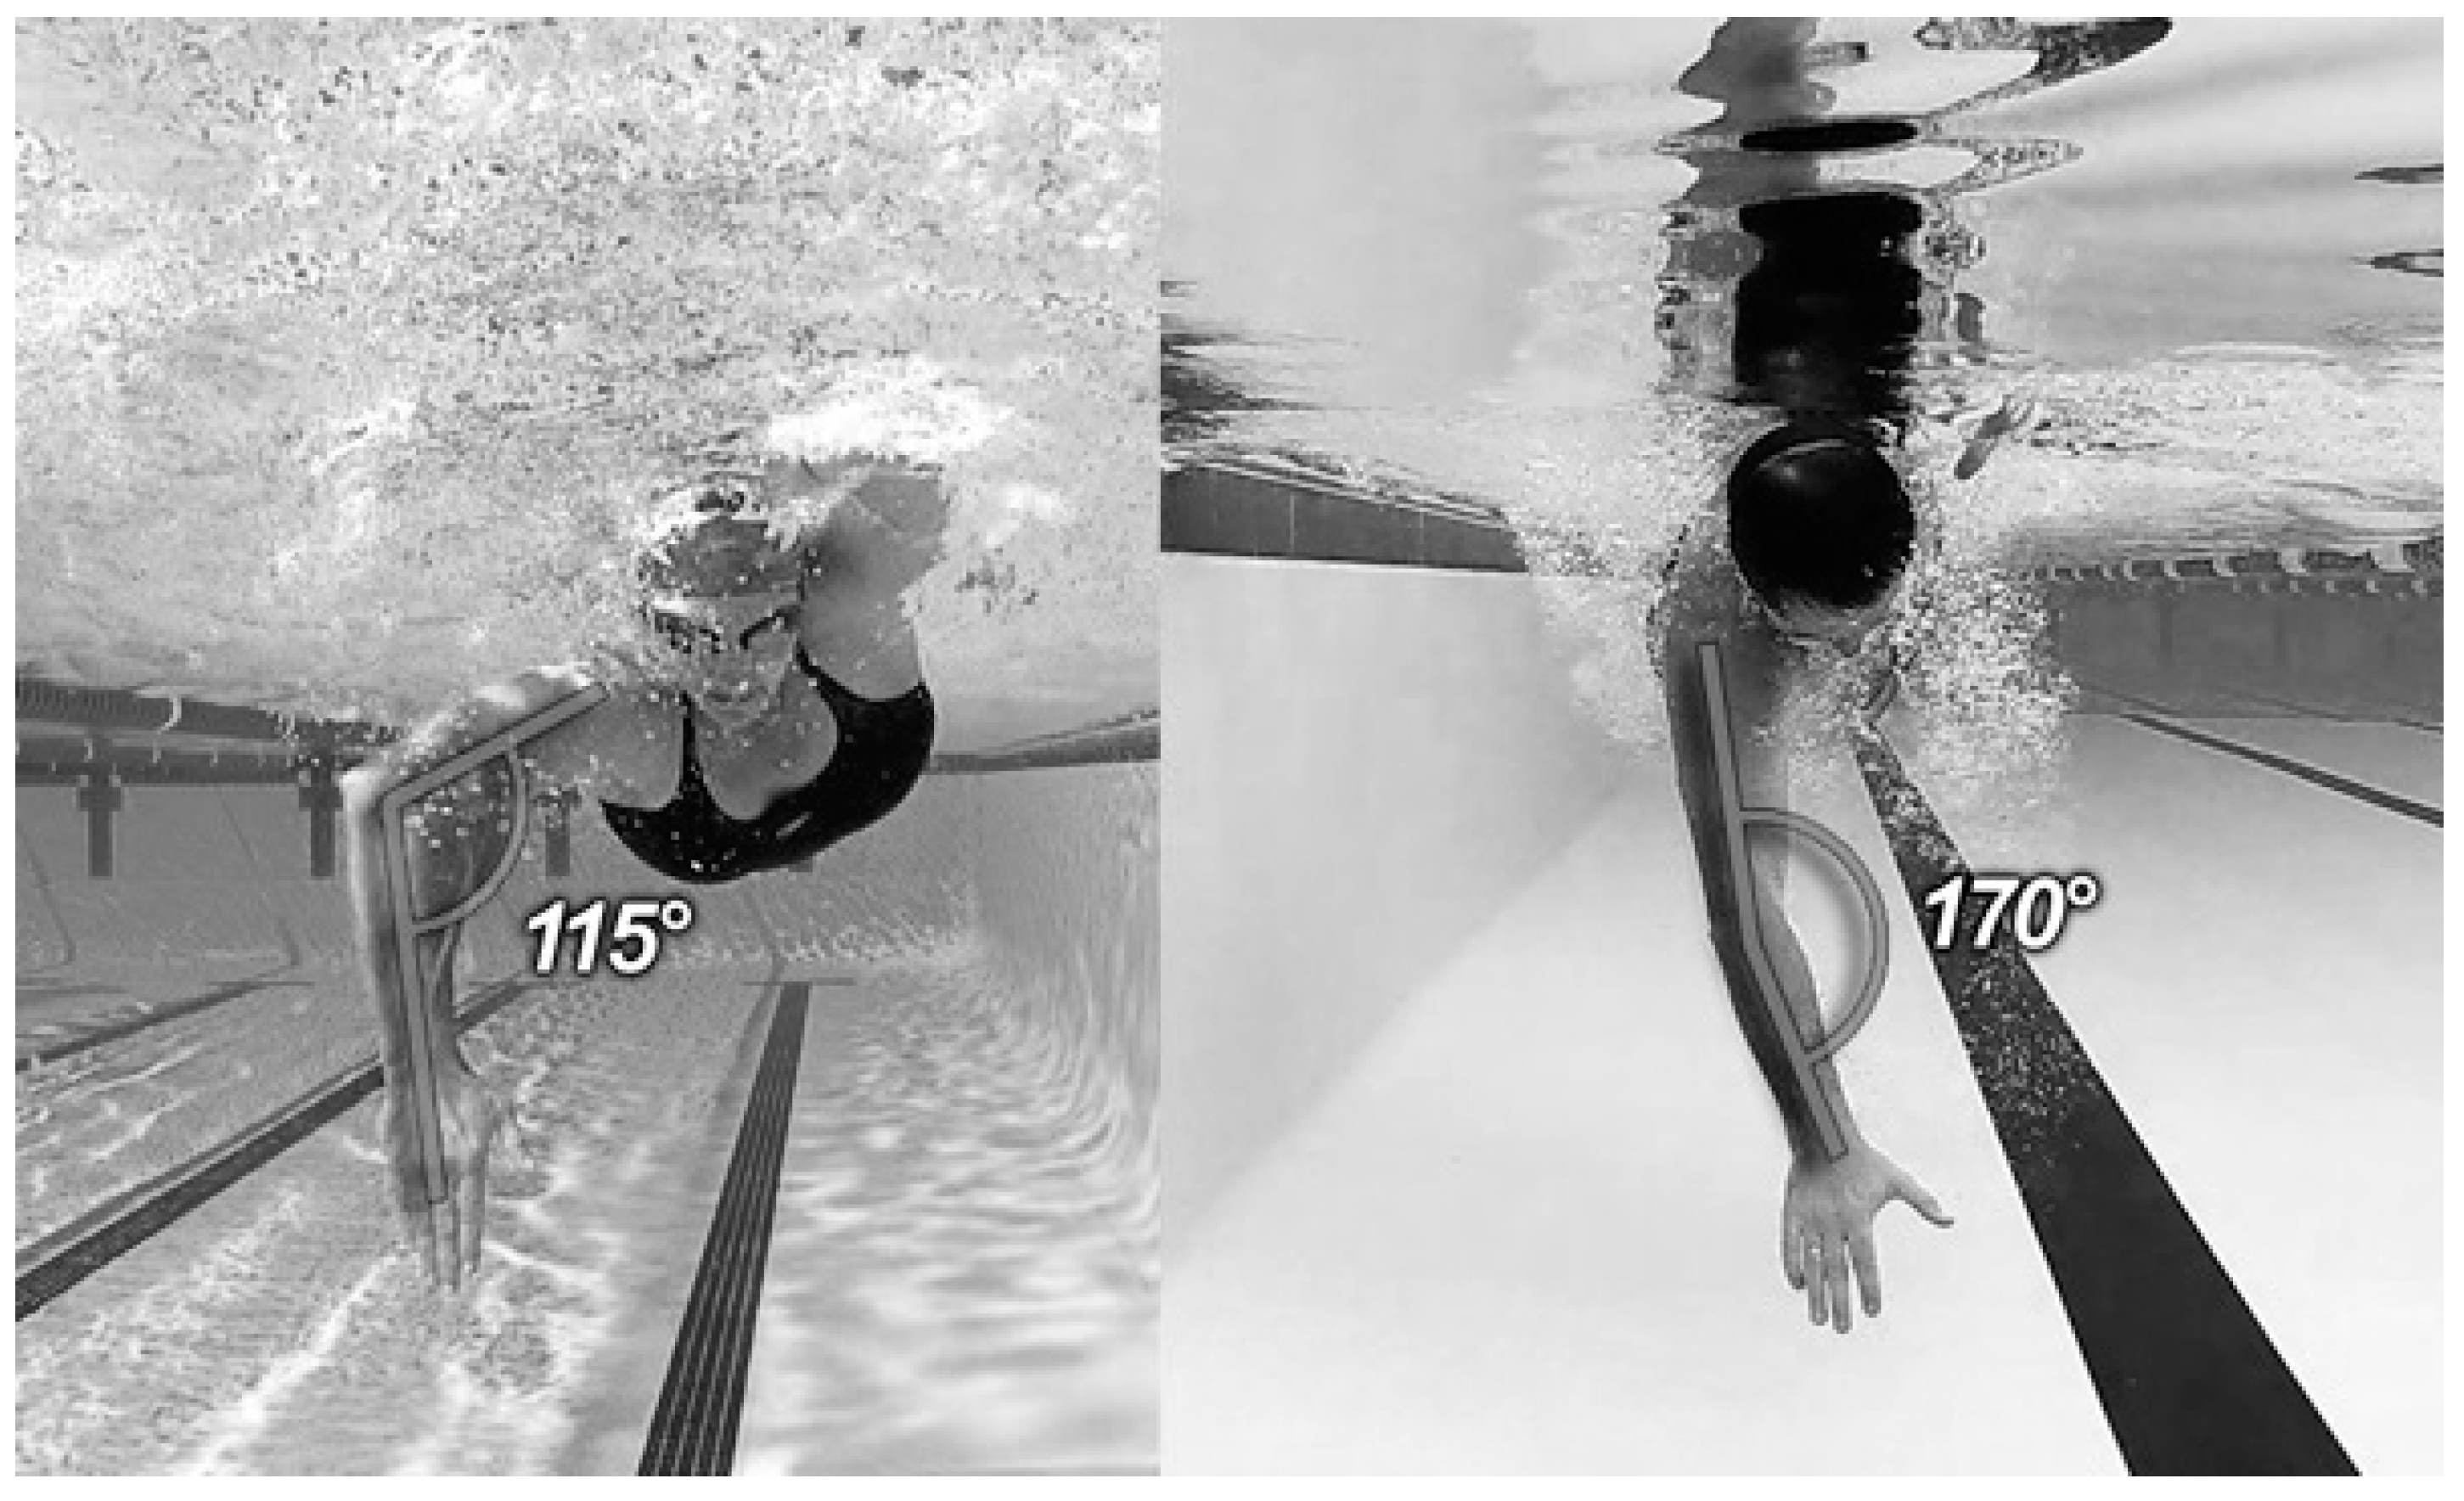
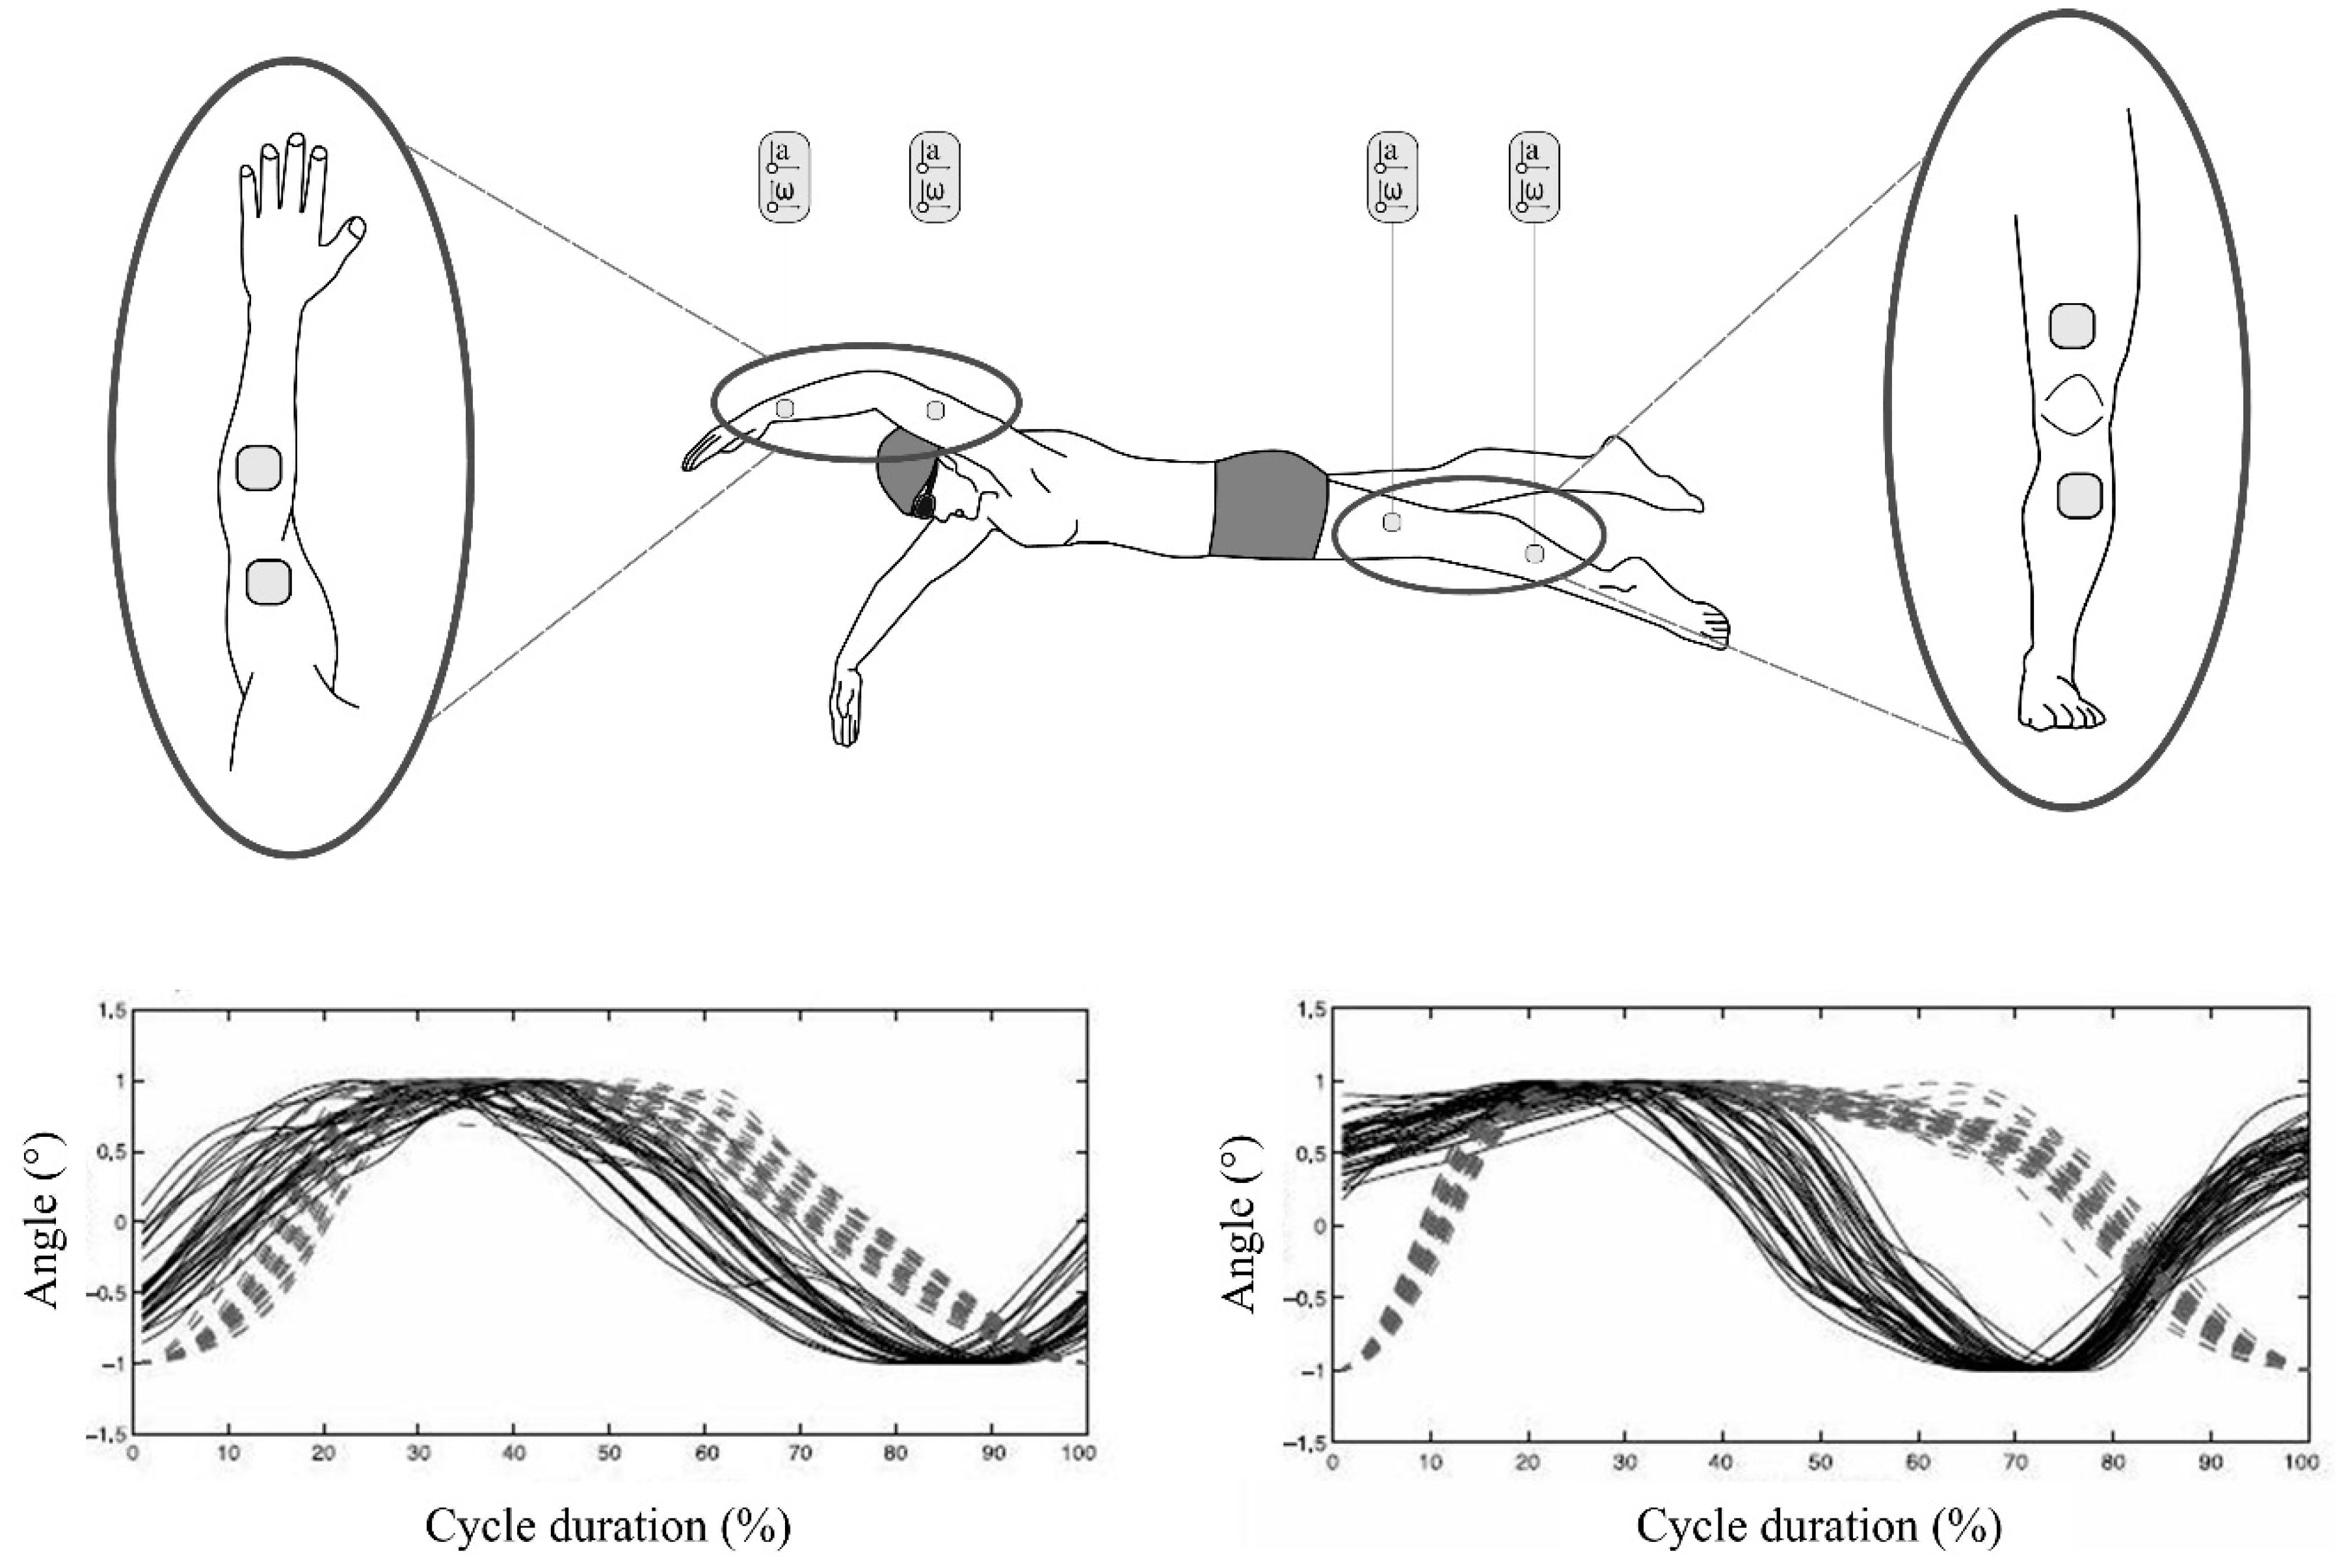
4.1.8. Joint Angular Kinematics


4.1.9. Kinetic Variables
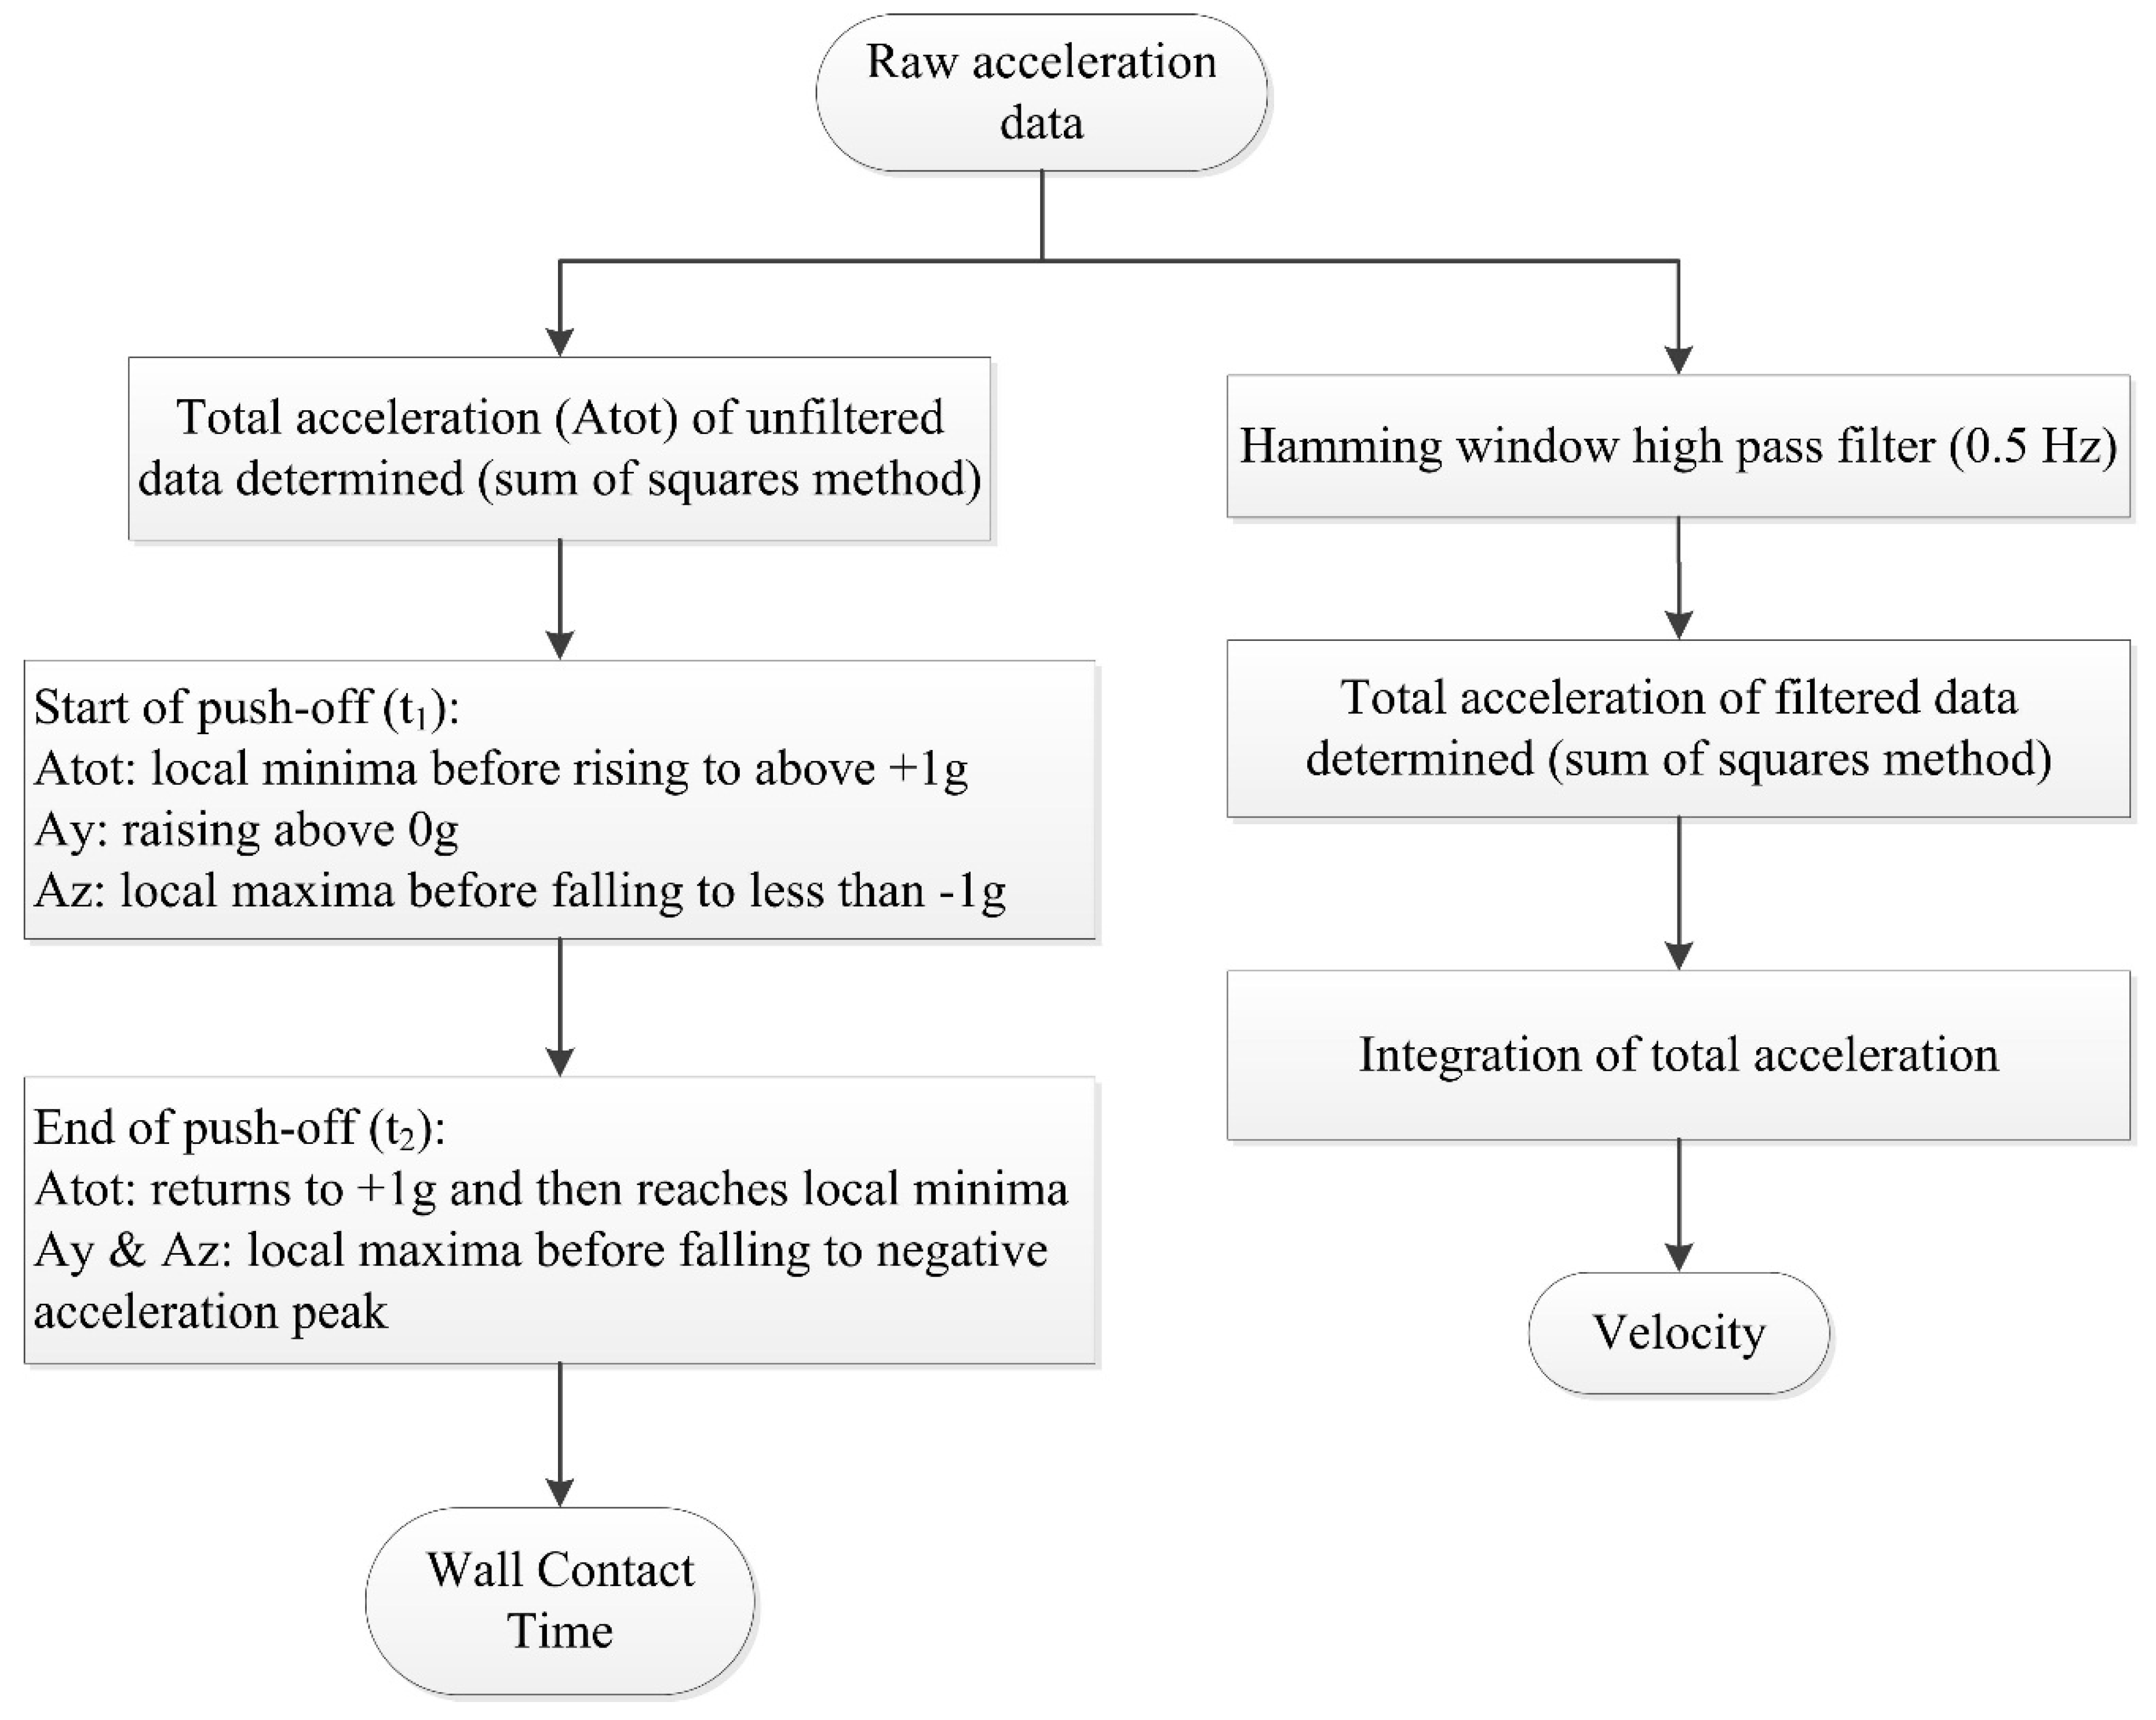
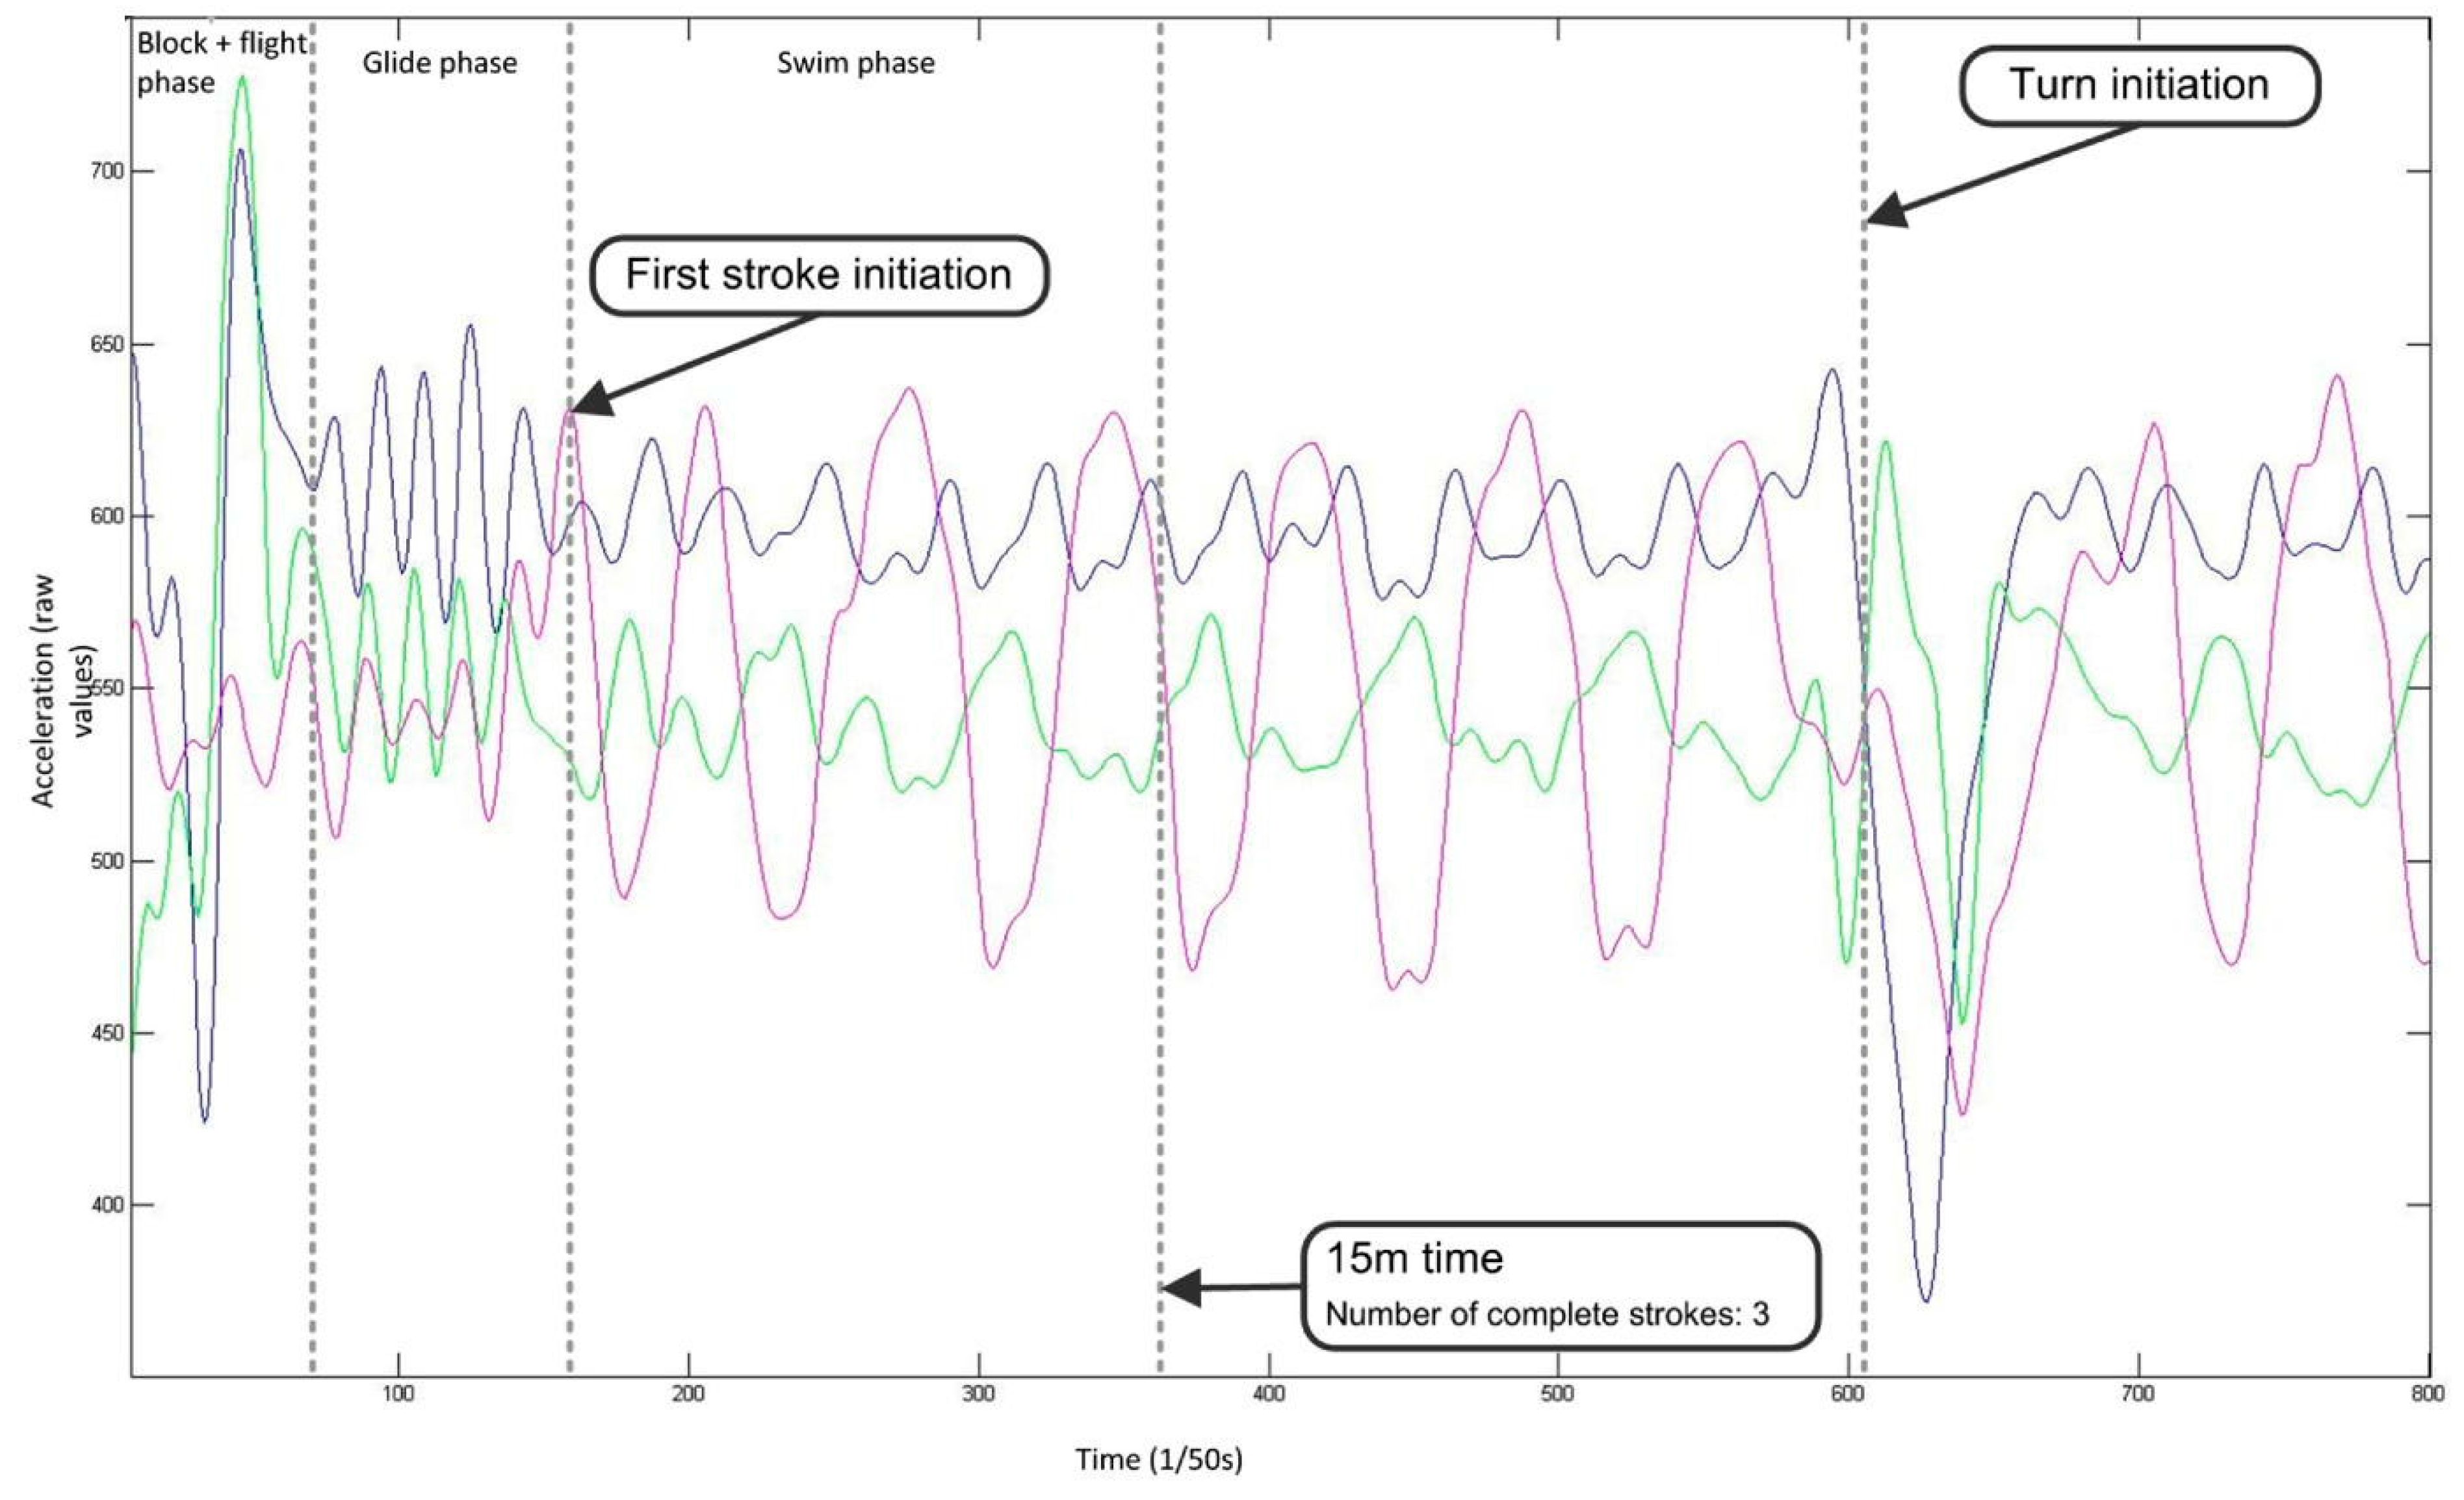
4.2. Parameters for Analysing Starts
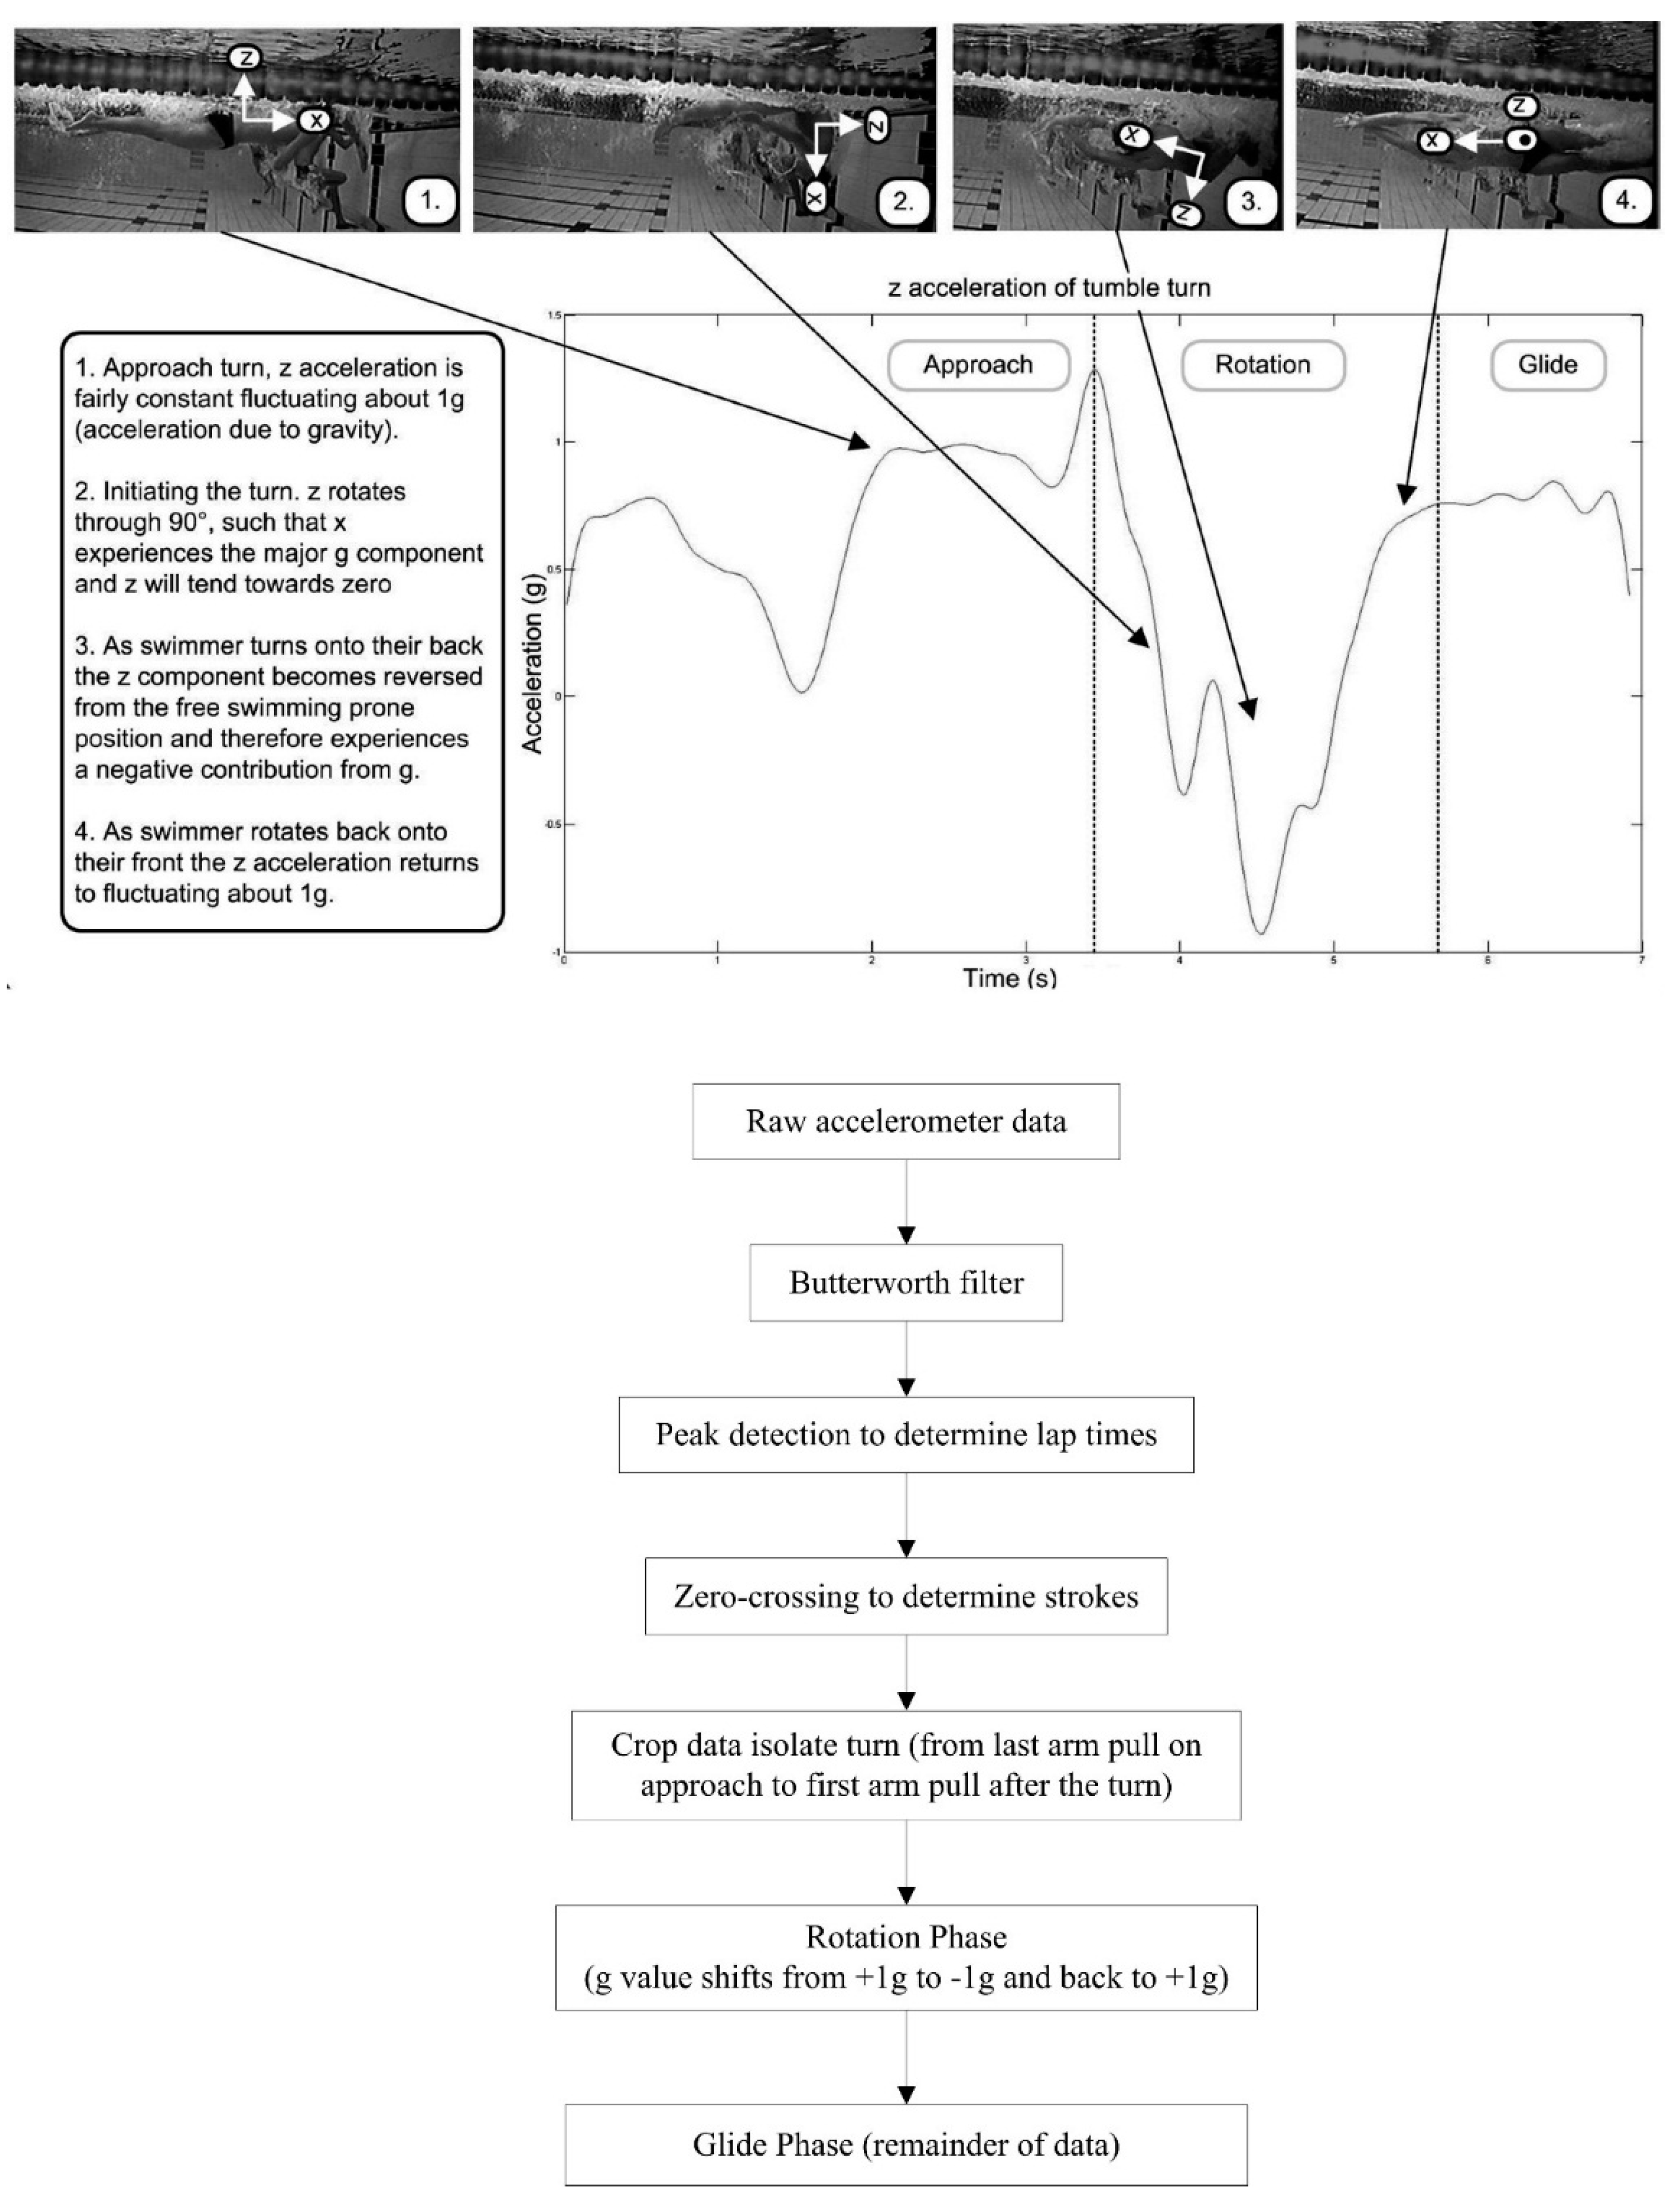
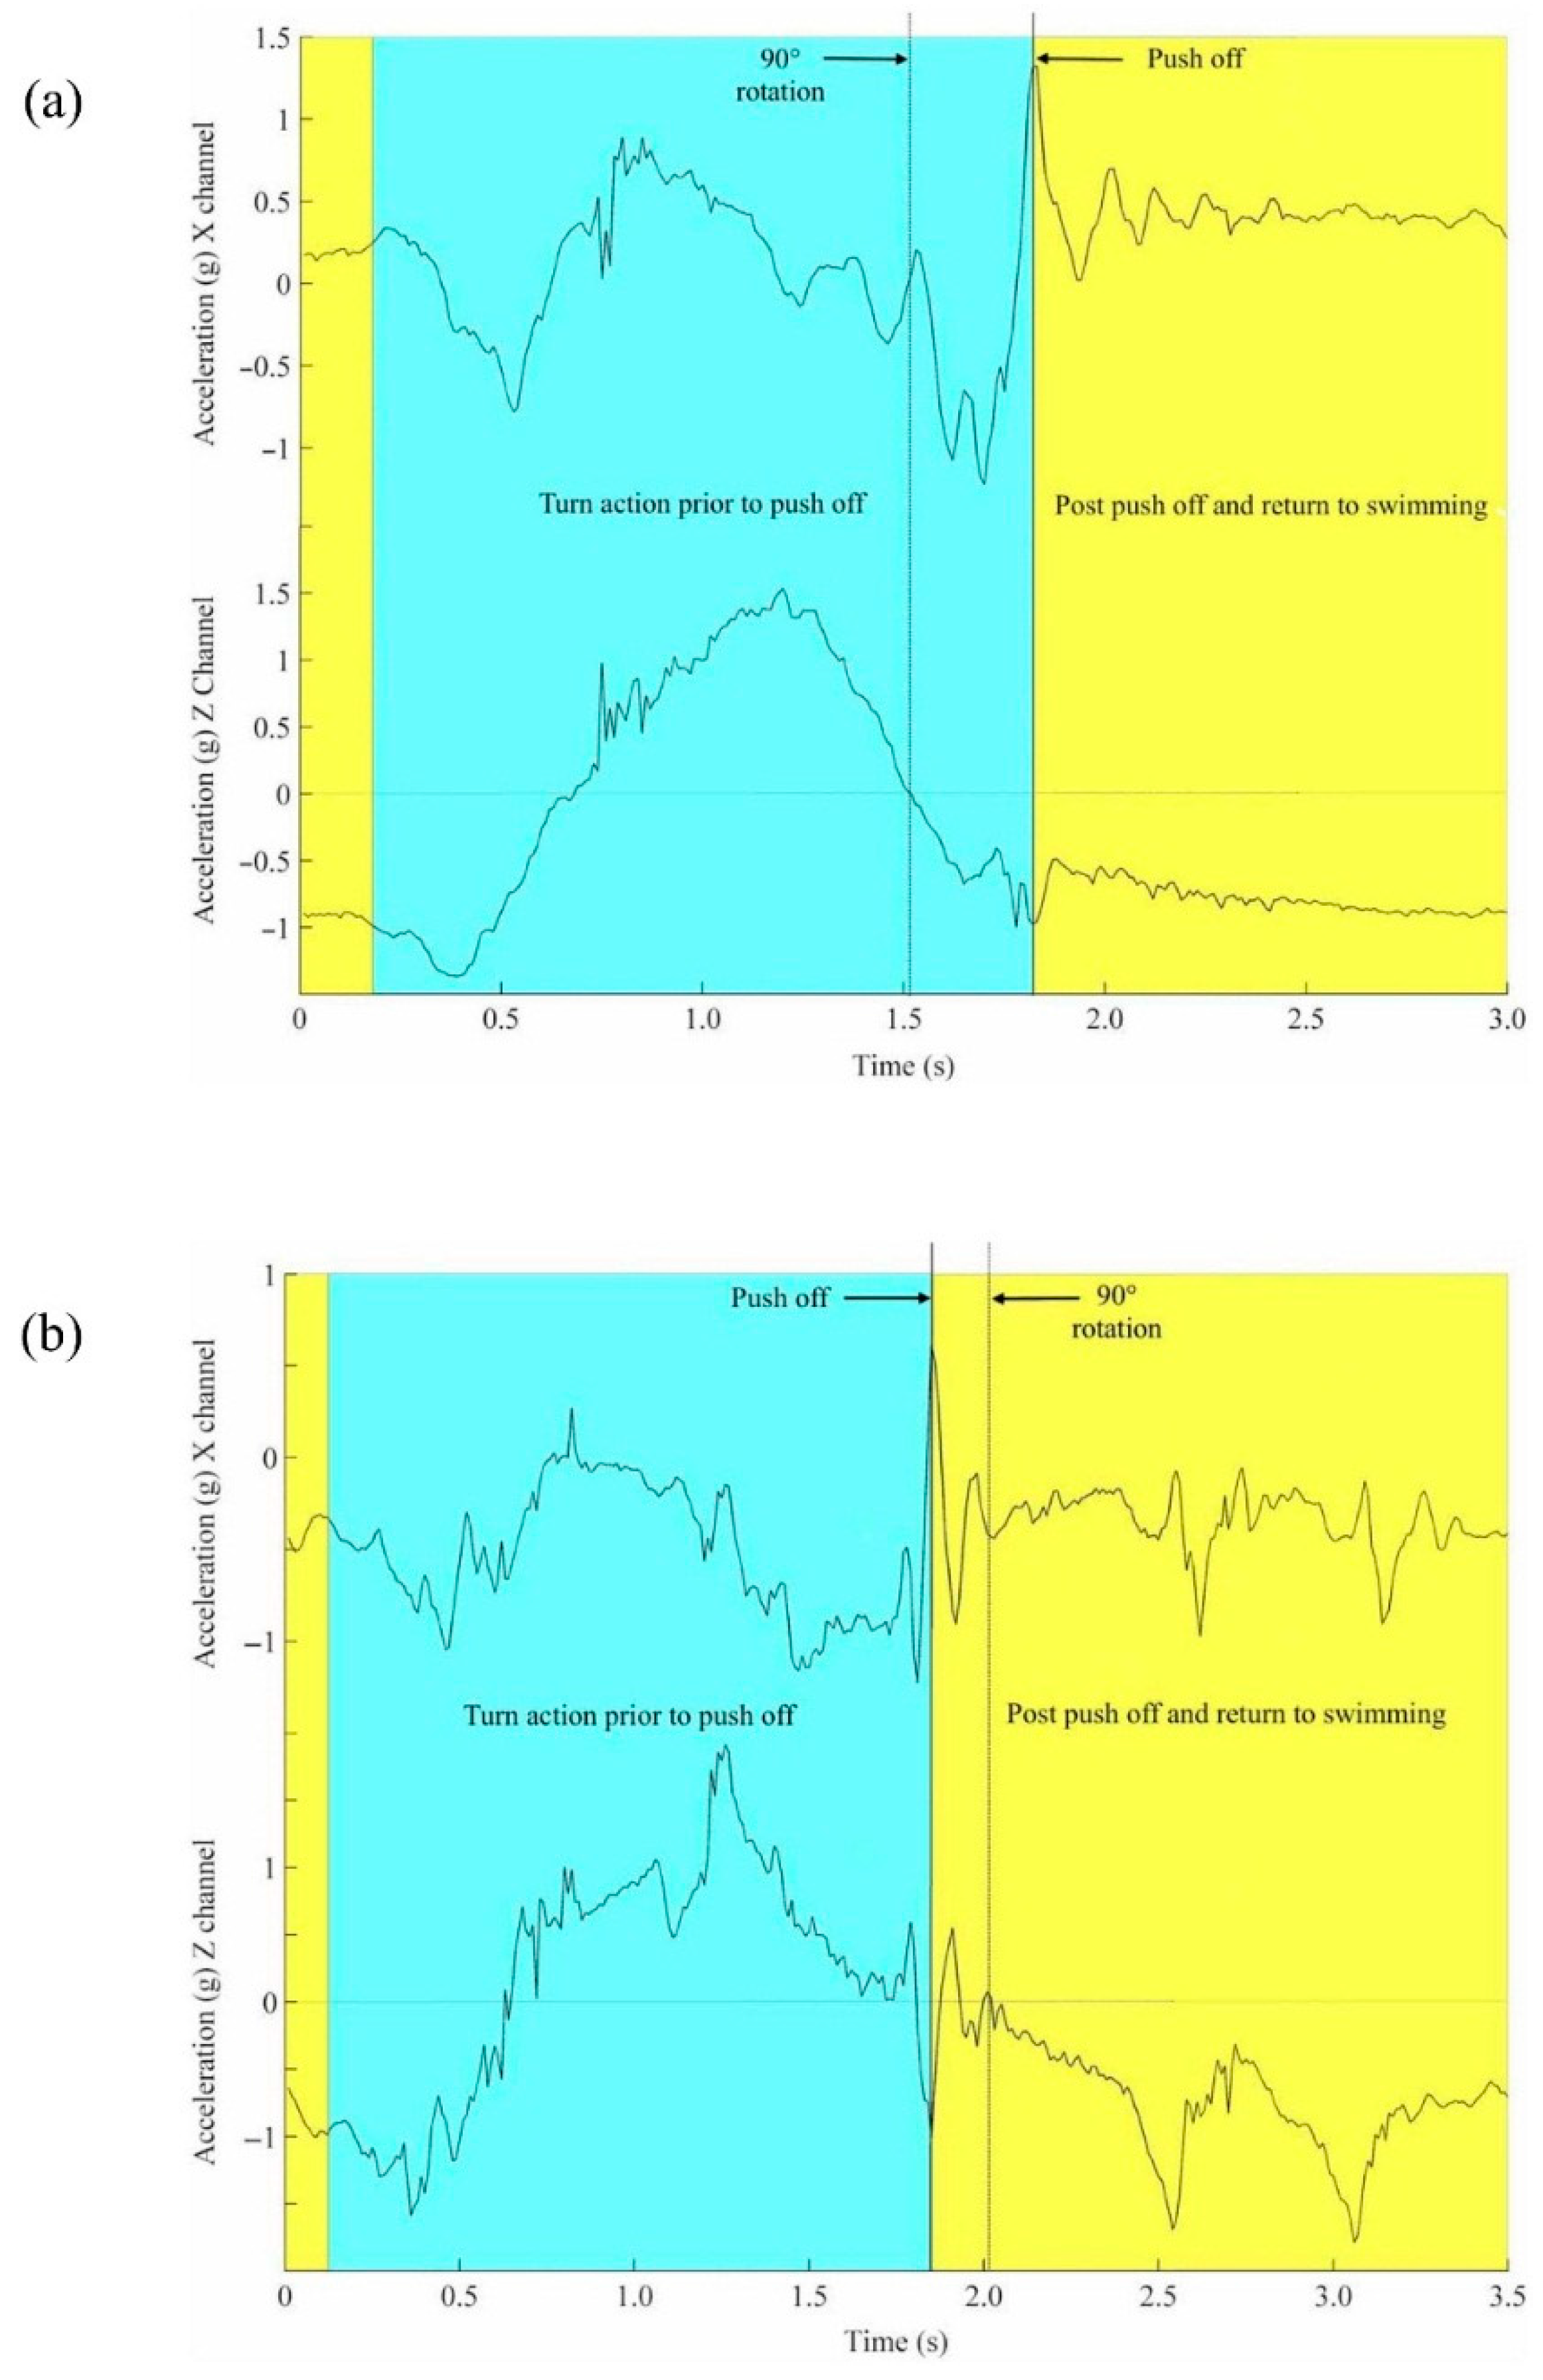
4.3. Parameters for Analysing Turns


| Angular Velocity (rad·s−1) | Frontcrawl | Backstroke | Breaststroke | Butterfly |
|---|---|---|---|---|
| Pωx | −4.21 | −6.14 | −3.58 | −4.01 |
| Pωy | 9.86 | 6.00 | −6.61 | −5.60 |
| Pωz | −1.94 | −0.31 | −5.76 | −4.54 |

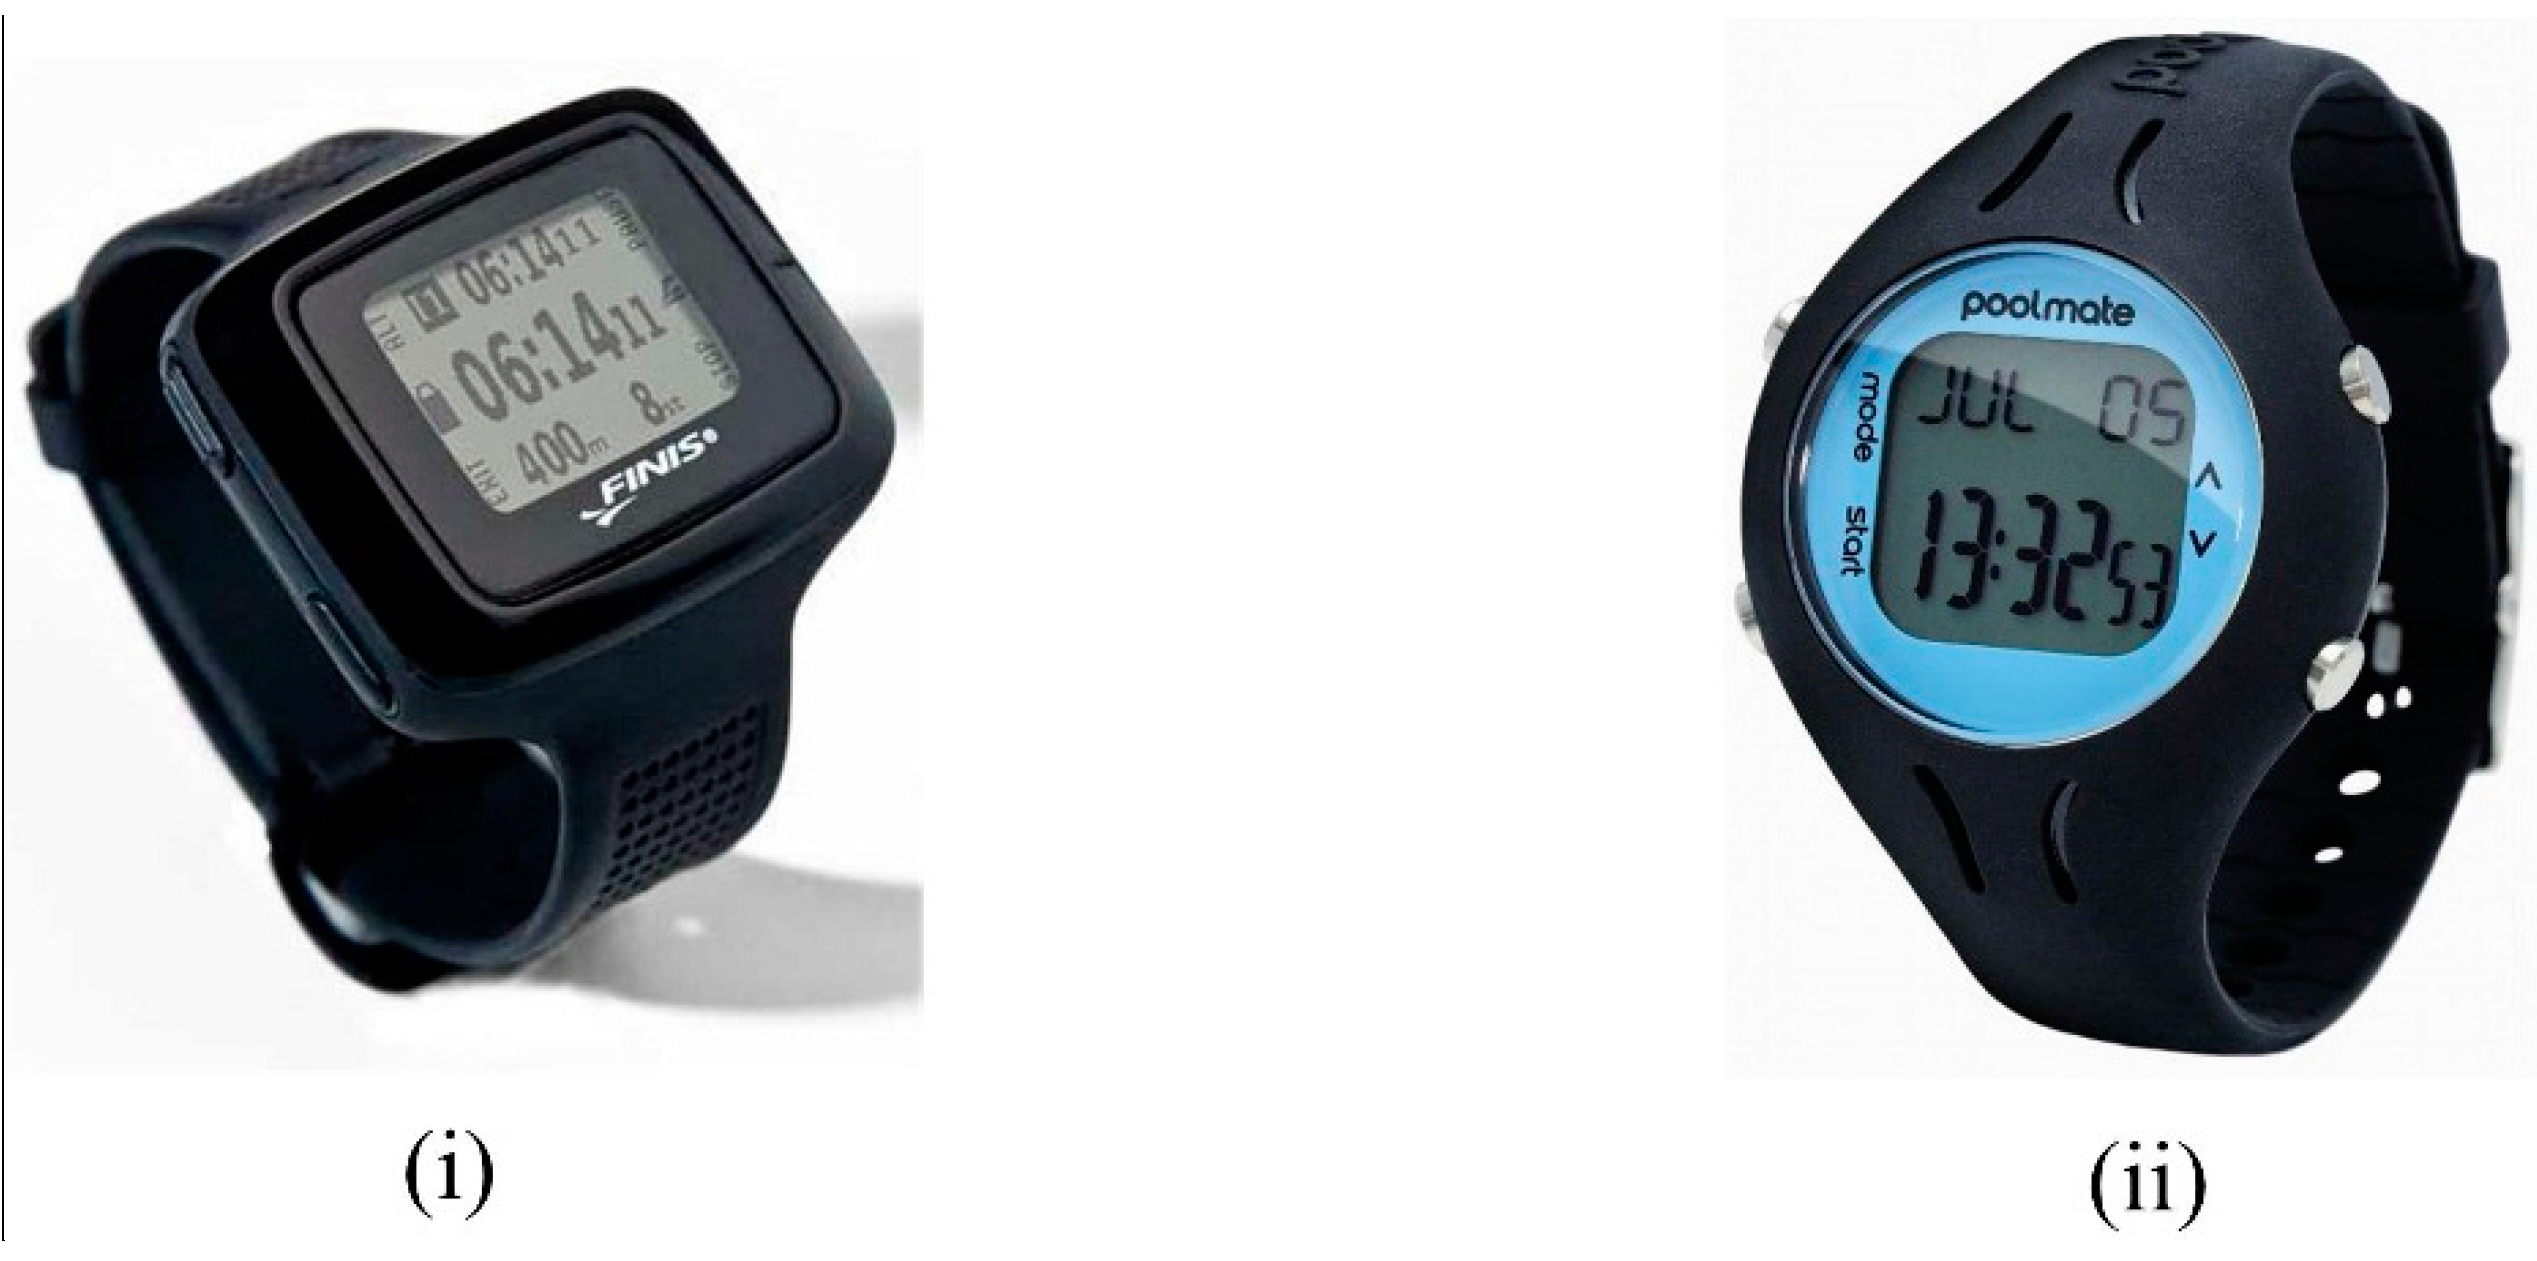
4.4. Commercially Available Swimming Sensor Devices
| Measured Parameter | AvidaSports AvidaMetrics | FINIS Swimsense | Garmin Swim | Swimovate PoolMatePro |
|---|---|---|---|---|
| Time | • | • | • | • |
| Stroke identification | • | • | • | |
| Stroke count | • | • | • | • |
| Stroke rate | • | • | • | |
| Split times | • | • | • | |
| Distance per stroke | • | • | ||
| Breakout | • | |||
| Average speed | • | • | • | • |
| Kick count | • | |||
| Kick rate | • | |||
| Lap counter | • | • | • | |
| Efficiency | • | |||
| Intervals | • | • | ||
| Distance | • | • | • | |
| Calories | • | • | • |
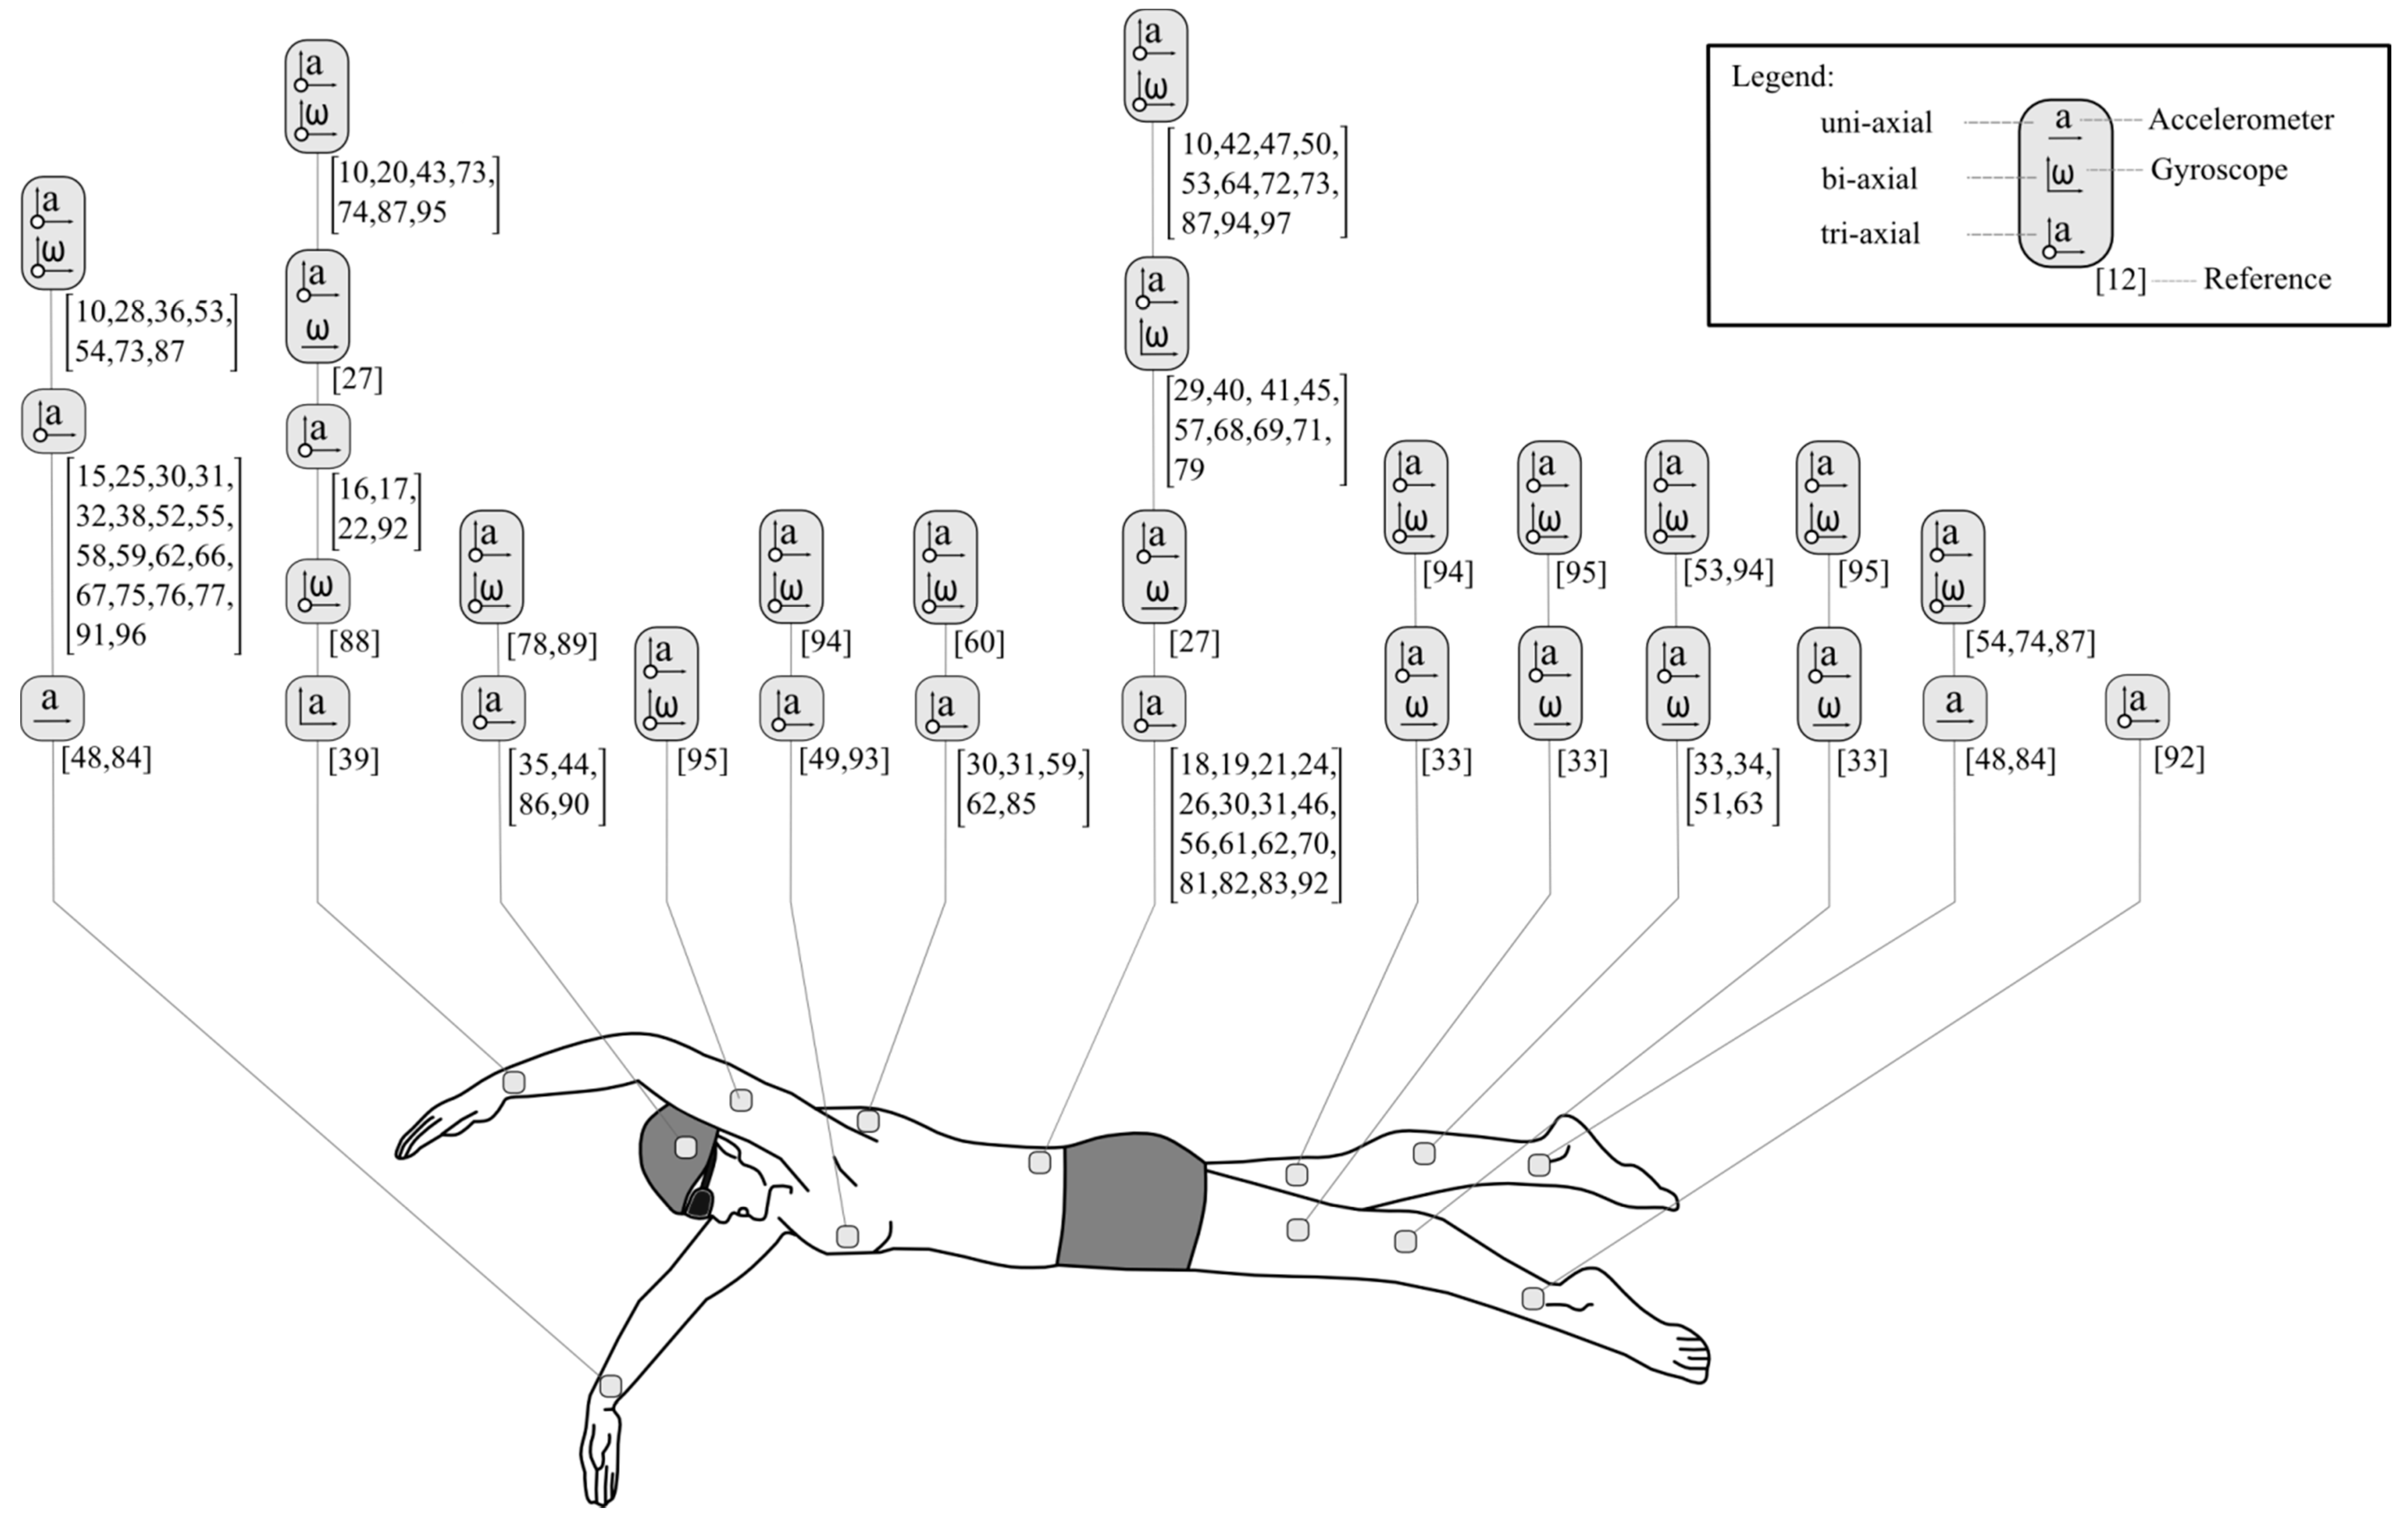
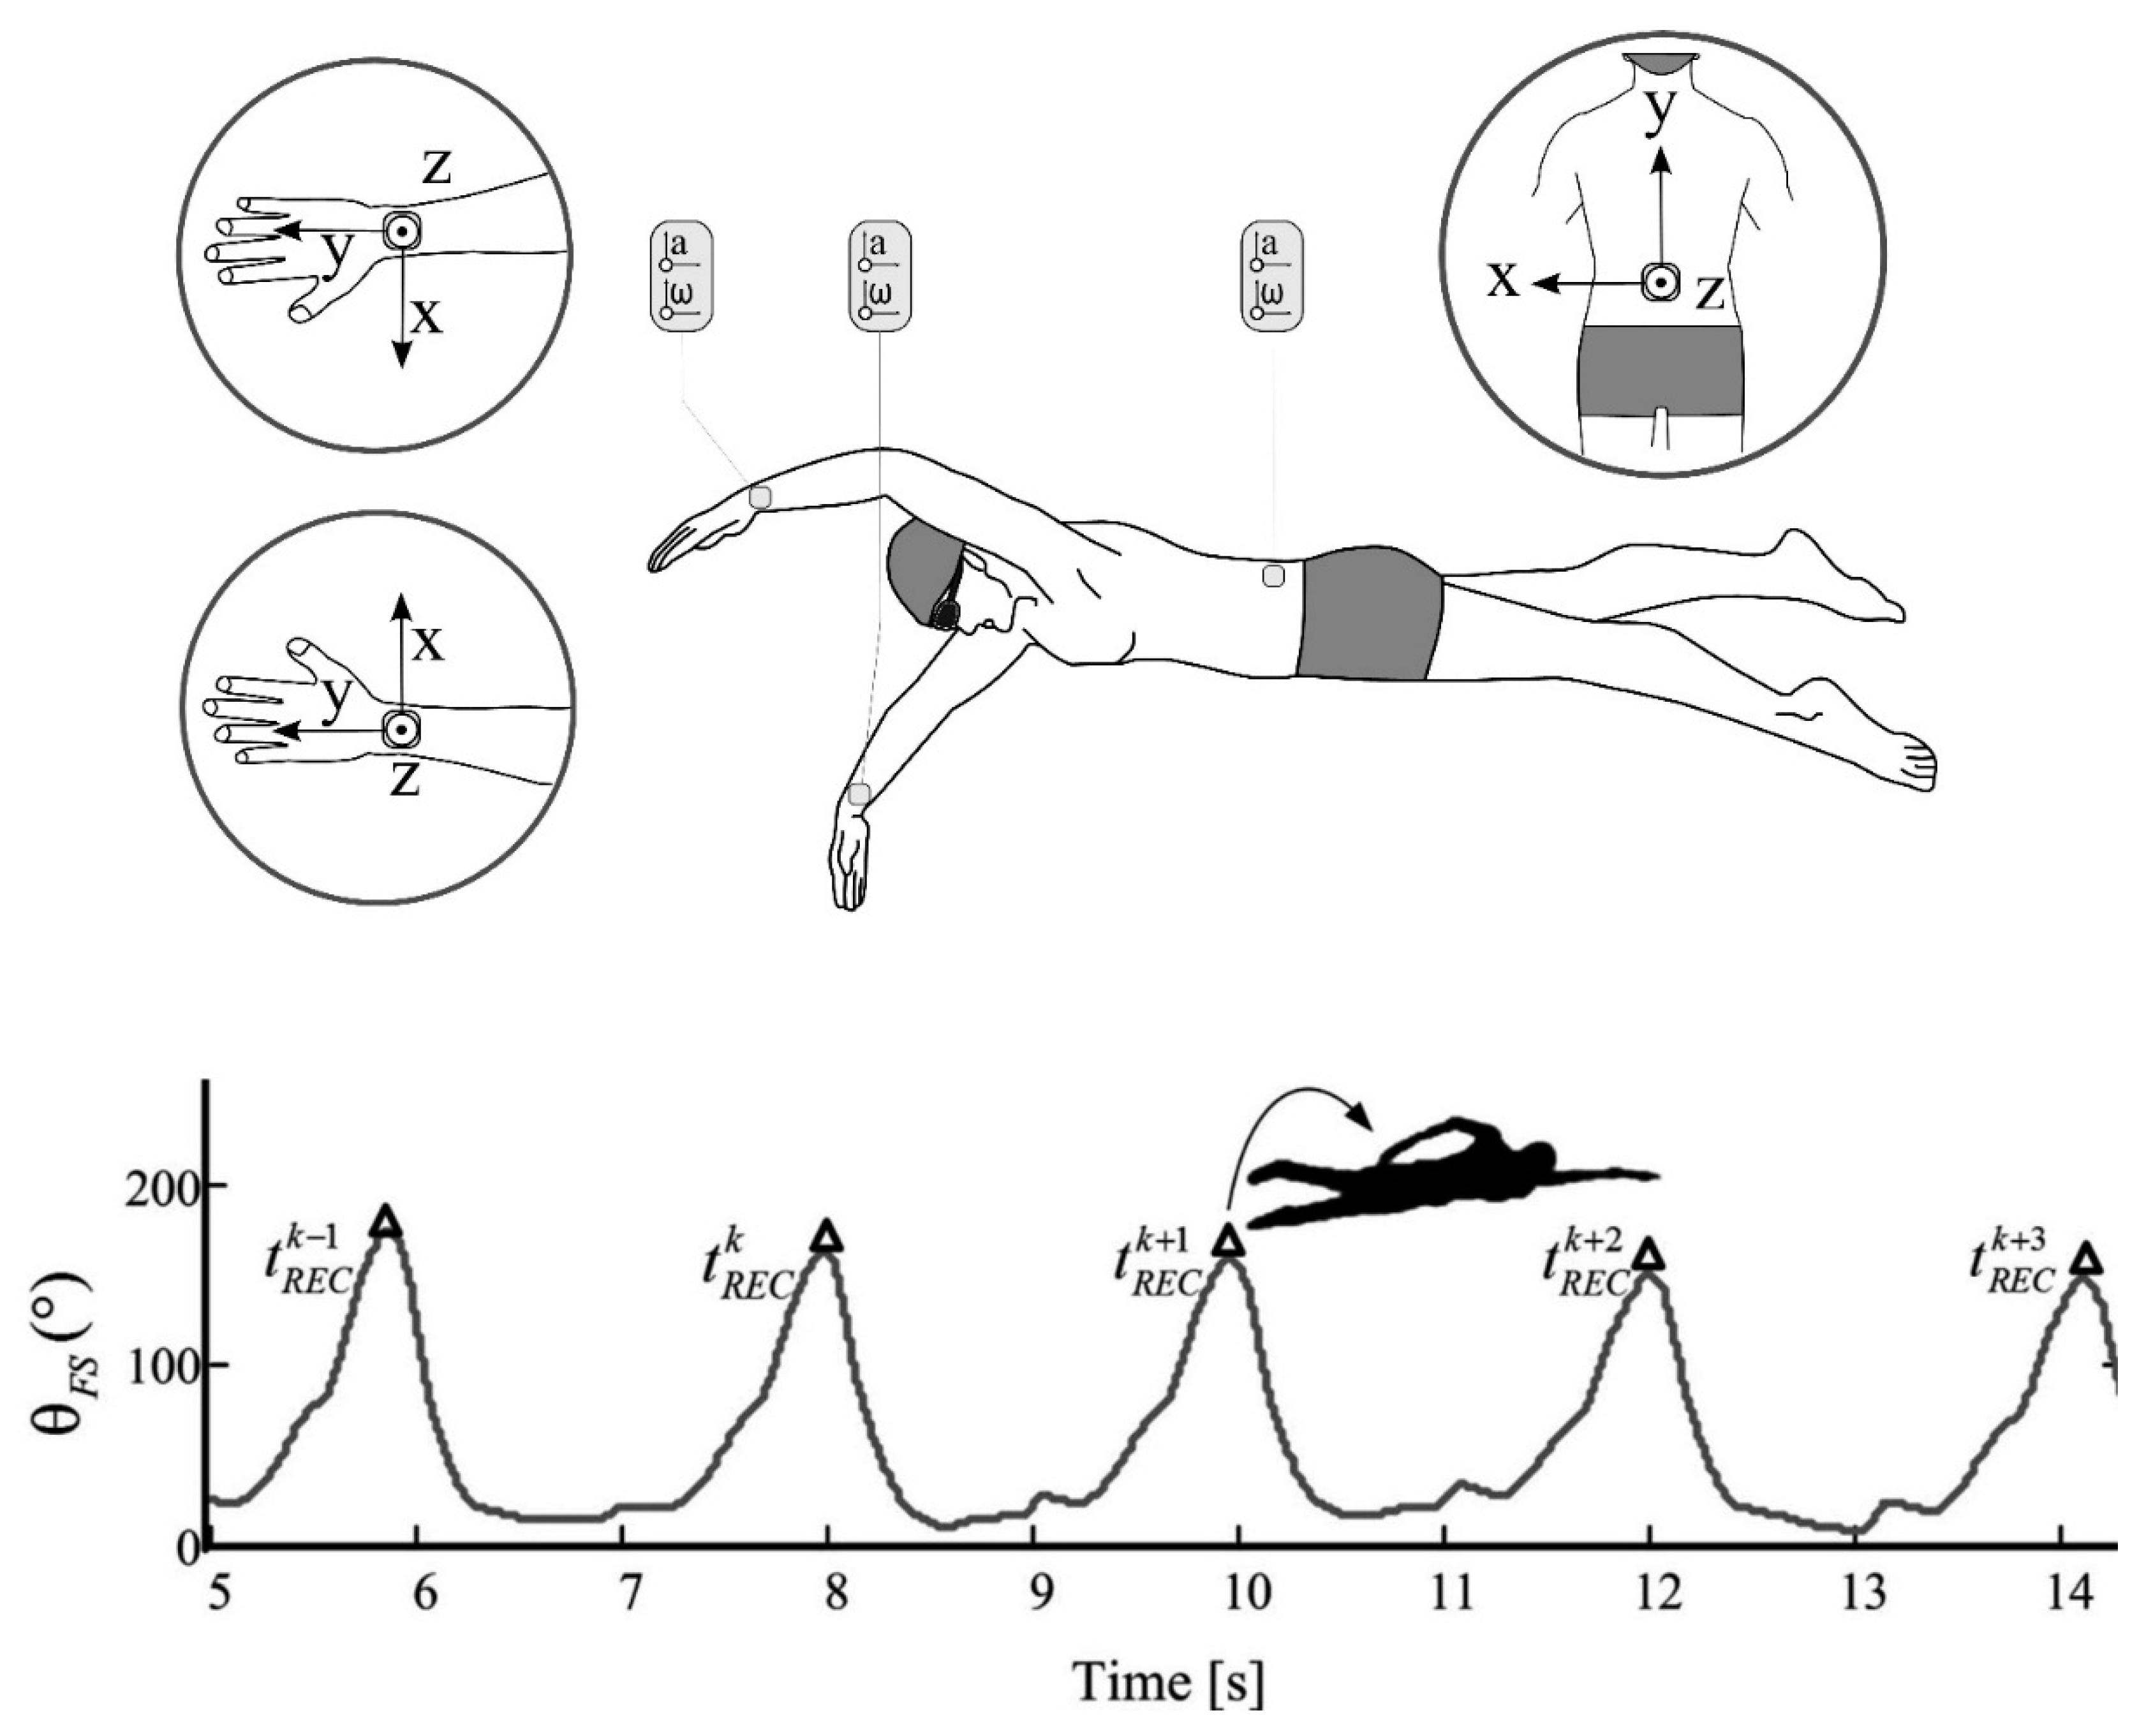
4.5. Sensor Attachment Locations
4.5.1. Upper Limb Locations
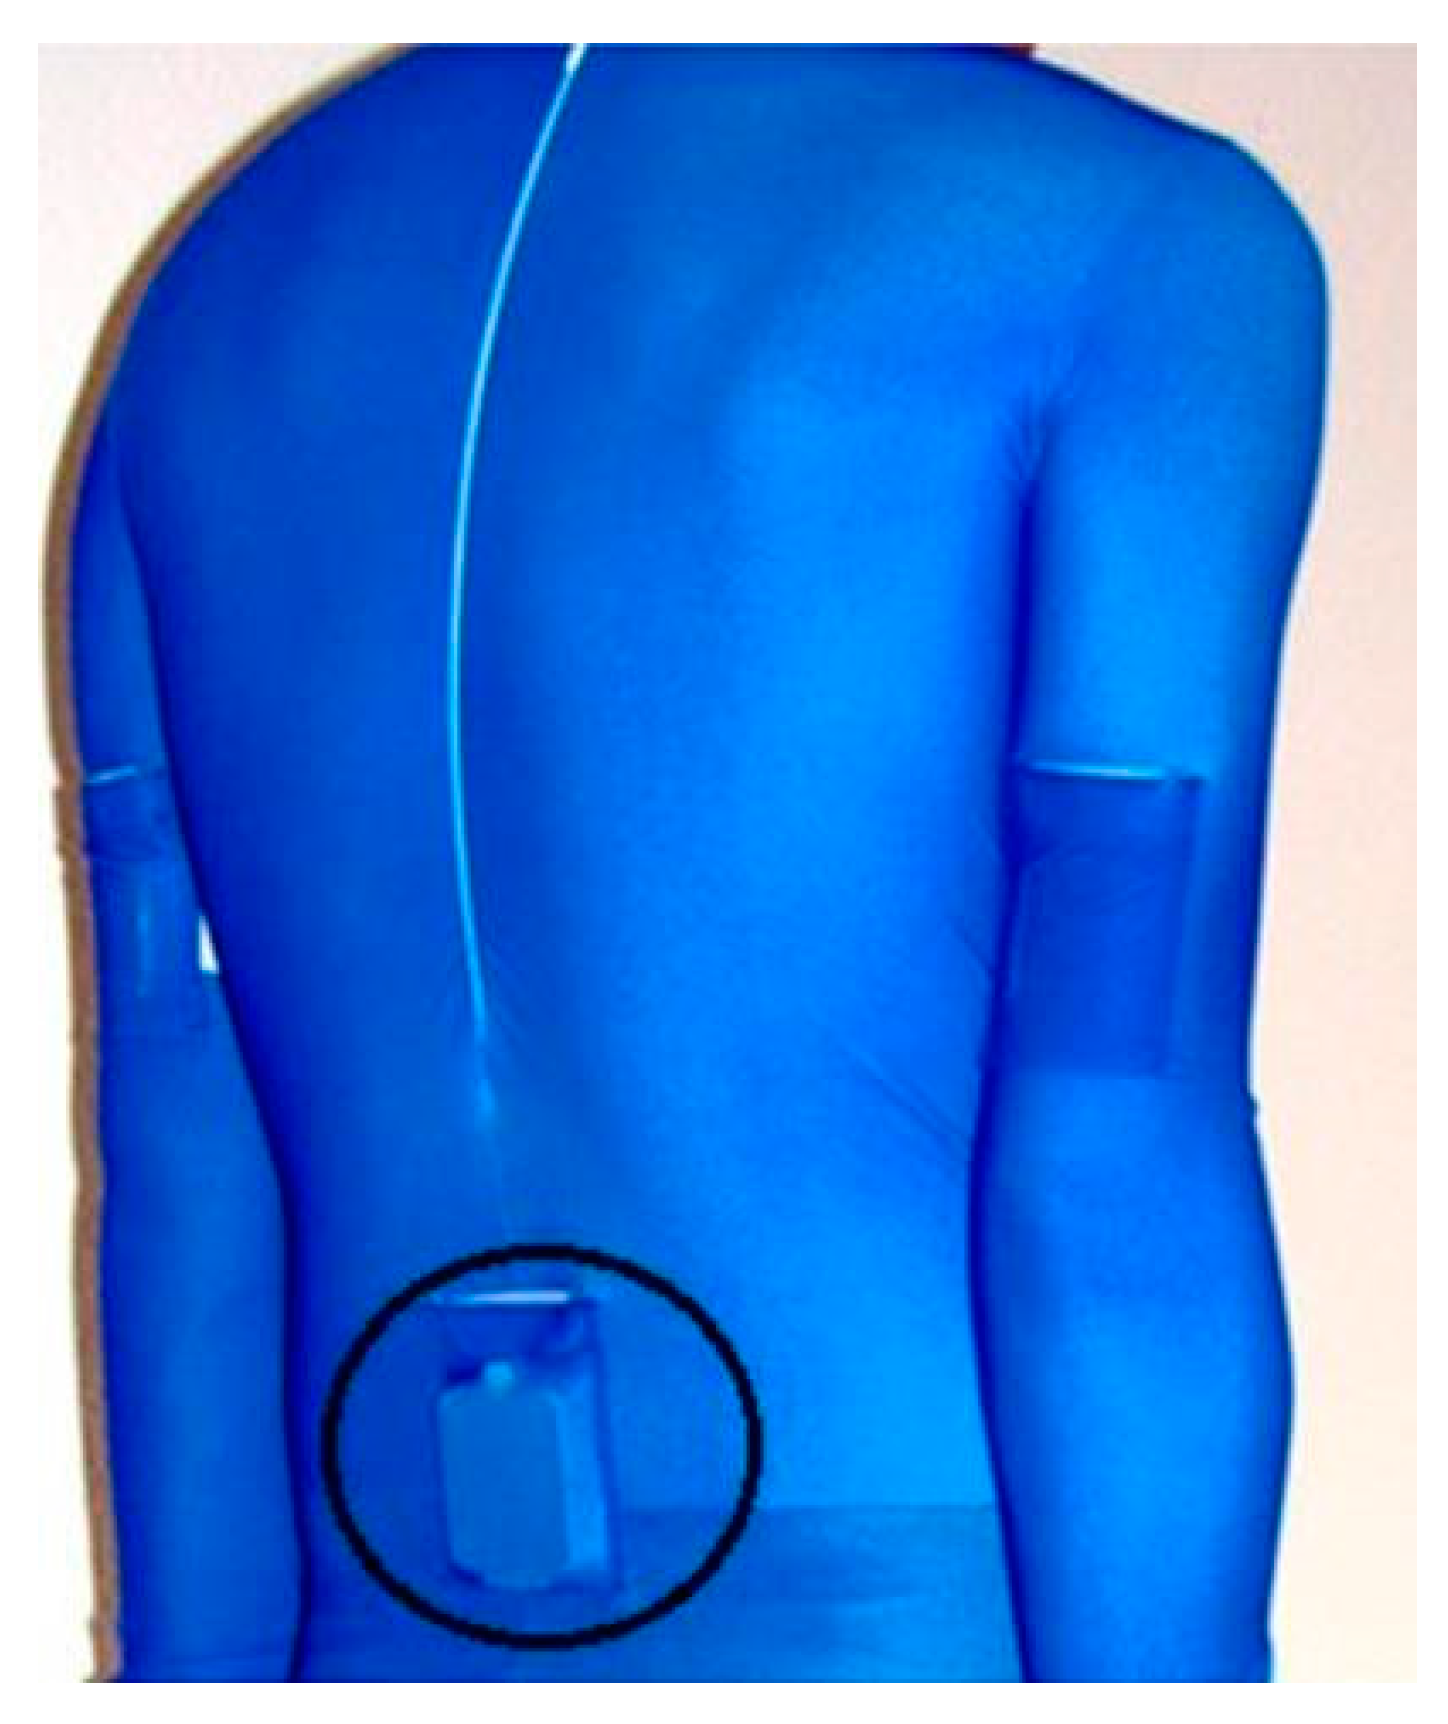
4.5.2. Torso Locations
4.5.3. Head Locations
4.5.4. Multiple Sensor Locations
4.6. Technical Specifications of Inertial Sensor Designs Used in Swimming
4.6.1. Measurement Range
4.6.2. Sampling Frequency
4.6.3. Signal Filtering
4.6.4. Data Storage and Transfer
4.6.5. Power Supply
5. Conclusions
Acknowledgments
Conflicts of interest
References
- Maglischo, E.W. Swimming Fastest; Human Kinetics: Champaign, IL, USA, 2003. [Google Scholar]
- Haljand, R. Competition Analysis: 2012 European Junior Swimming Championships. Available online: http://www.swim.ee/competition/2012_antwerp/antwerp2012.html (Accessed on 4 December 2015).
- Smith, D.J.; Norris, S.R.; Hogg, J.M. Performance evaluation of swimmers: Scientific tools. Sports Med. 2002, 32, 539–554. [Google Scholar] [CrossRef] [PubMed]
- Komar, J.; Lepretre, P.M.; Alberty, M.; Vantorre, J.; Fernandes, R.J.; Hellard, P.; Chollet, D.; Seifert, L. Effect of increasing energy cost on arm coordination in elite sprint swimmers. Hum. Mov. Sci. 2012, 31, 620–629. [Google Scholar] [CrossRef] [PubMed]
- Sanders, R.H. Kinematics, coordination, variability, and biological noise in the prone flutter kick at different levels of a “learn-to-swim” programme. J. Sports Sci. 2007, 25, 213–227. [Google Scholar] [CrossRef] [PubMed]
- Payton, C.J. Motion analysis using video. In Biomechanical Evaluation of Movement in Sport and Exercise: The British Association of Sport and Exercise Sciences Guidelines; Payton, C.J., Bartlett, R., Eds.; Routledge: Abingdon, UK, 2008; pp. 8–32. [Google Scholar]
- Phillips, E.; Farrow, D.; Ball, K.; Helmer, R. Harnessing and understanding feedback technology in applied settings. Sports Med. 2013, 43, 919–925. [Google Scholar] [CrossRef] [PubMed]
- Mooney, R.; Corley, G.; Godfrey, A.; Osborough, C.; Newell, J.; Quinlan, L.R.; ÓLaighin, G. Analysis of swimming performance: Perceptions and practices of us-based swimming coaches. J. Sports Sci. 2015. [Google Scholar] [CrossRef] [PubMed]
- Callaway, A.J.; Cobb, J.E.; Jones, I. A comparison of video and accelerometer based approaches to performance monitoring in swimming. Int. J. Sports Sci. Coach. 2009, 4, 139–153. [Google Scholar] [CrossRef]
- Dadashi, F.; Crettenand, F.; Millet, G.P.; Seifert, L.; Komar, J.; Aminian, K. Automatic front-crawl temporal phase detection using adaptive filtering of inertial signals. J. Sports Sci. 2013, 31, 1251–1260. [Google Scholar] [CrossRef] [PubMed]
- Davey, N.; Anderson, M.; James, D.A. Validation trial of an accelerometer-based sensor platform for swimming. Sports Technol. 2008, 1, 202–207. [Google Scholar] [CrossRef]
- Ohgi, Y.; Ichikawa, H.; Homma, M.; Miyaji, C. Stroke phase discrimination in breaststroke swimming using a tri-axial acceleration sensor device. Sports Eng. 2003, 6, 113–123. [Google Scholar] [CrossRef]
- Magalhaes, F.A.; Vannozzi, G.; Gatta, G.; Fantozzi, S. Wearable inertial sensors in swimming motion analysis: A systematic review. J. Sports Sci. 2014, 33, 732–745. [Google Scholar] [CrossRef] [PubMed]
- Moher, D.; Liberati, A.; Tetzlaff, J.; Altman, D.G. Preferred reporting items for systematic reviews and meta-analyses: The prisma statement. Int. J. Surg. 2010, 8, 336–341. [Google Scholar] [CrossRef] [PubMed]
- Ohgi, Y.; Yasumura, M.; Ichikawa, H.; Miyaji, C. Analysis of stroke technique using acceleration sensor IC in freestyle swimming. In The Engineering of Sport; Subic, A.J., Haake, S.J., Eds.; Blackwell Science: Oxford, UK, 2000; pp. 503–511. [Google Scholar]
- Ohgi, Y. Microcomputer-based acceleration sensor device for sports biomechanics-stroke evaluation by using swimmer’s wrist acceleration. IEEE Sens. Proc. 2002, 1, 699–704. [Google Scholar]
- Ohgi, Y.; Ichikawa, H.; Miyaji, C. Microcomputer-based acceleration sensor device for swimming stroke monitoring. Int. J. Jpn. Soc.Mech. Eng. 2002, 45, 960–966. [Google Scholar] [CrossRef]
- Davey, N.P.; James, D.A.; Anderson, M.E. Signal analysis of accelerometry data using gravity based modelling. In Microelectronics: Design, Technology, and Packaging; Abbott, D., Eshraghian, K., Musca, C.A., Pavlidis, D., Weste, N., Eds.; SPIE: Bellingham, WA, USA, 2004; pp. 362–370. [Google Scholar]
- James, D.A.; Davey, N.; Rice, T. An accelerometer based sensor platform for insitu elite athlete performance analysis. Proc. IEEE Sens. 2004, 3, 1373–1376. [Google Scholar]
- Ohgi, Y. Measurement of acceleration and angular velocity of forearm motion in swimming—Prototype II: Tri-axial acceleration and gyroscope sensor data logger. Eng. Sport 2004, 1, 536–542. [Google Scholar]
- Davey, N.P.; Anderson, M.E.; James, D.A. An accelerometer based system for elite athlete swimming performance analysis. In Smart Structures, Devices, and Systems II, Pt 1 and 2; Al Sarawi, S.F., Ed.; SPIE Digital Library: Washington, DC, USA, 2005; pp. 409–415. [Google Scholar]
- Ichikawa, H.; Ohgi, Y.; Miyaji, C.; Nomura, T. Estimation of arm joint angular displacements in front crawl swimming using accelerometer. Rev. Port. Cienc. Des. 2006, 6, 223–225. [Google Scholar]
- Chan, R. Swimming Lap Counter. European Patent EP 1870139a1, 26 December 2007. [Google Scholar]
- Prichard, R. Hip Rotation Measuring Device for Use in E.G. Swimming Activity, Has Standard Attachment Device Fixed to Outside of Case, and Readout Display Provided for Showing Magnitude of Acceleration or Deceleration of Hip Movement. U.S. Patent US2007112286-A1, 17 May 2007. [Google Scholar]
- Bächlin, M.; Förster, K.; Schumm, J.; Breu, D.; Germann, J.; Tröster, G. An automatic parameter extraction method for the 7 × 50 m stroke efficiency test. In Proceedings of the 3rd international conference on pervasive computing and applications, Alexandria, Egypt, 6–8 October 2008; pp. 442–447.
- Daukantas, S.; Marozas, V.; Lukosevicius, A. Inertial sensor for objective evaluation of swimmer performance. In Proceedings of the 11th International Biennial Baltic Electronics Conference, Tallinn, Estonia, 6–8 October 2008; pp. 321–324.
- Davey, N.P.; James, D.A. Swimming stroke analysis using multiple accelerometer devices and tethered systems. Impact Technol. Sports II 2008, 577–582. [Google Scholar] [CrossRef]
- Mackintosh, C.; James, D.A.; Davey, N.; Grenfell, R.; Zhang, K. Monitoring Sports and Swimming. U.S. Patent US20080018532-A1, 24 January 2008. [Google Scholar]
- Slawson, S.E.; Justham, L.M.; West, A.A.; Conway, P.P.; Caine, M.P.; Harrison, R. Accelerometer profile recognition of swimming strokes. Eng. Sport 2008, 1, 81–87. [Google Scholar]
- Bachlin, M.; Troster, G. Pervasive computing in swimming: A model describing acceleration data of body worn sensors in crawl swimming. In Proceedings of the 2009 Joint Conferences on Pervasive Computing (JCPC), Taipei, Taiwan, 3–5 December 2009; pp. 293–298.
- Bächlin, M.; Förster, K.; Tröster, G. Swimmaster: A wearable assistant for swimmer. In Proceedings of the 11th International Conference on Ubiquitous Computing (Ubicomp), Orlando, FL, USA, 30 September–3 October 2009; pp. 215–224.
- Downey, D.J.; Massoth, K.M. Swim Watch. European Patent EP2128724A2, 2 December 2009. [Google Scholar]
- Fulton, S.K.; Pyne, D.B.; Burkett, B.J. Validity and reliability of kick count and rate in freestyle using inertial sensor technology. J. Sports Sci. 2009, 27, 1051–1058. [Google Scholar] [CrossRef] [PubMed]
- Fulton, S.K.; Pyne, D.B.; Burkett, B. Quantifying freestyle kick-count and kick-rate patterns in paralympic swimming. J. Sports Sci. 2009, 27, 1455–1461. [Google Scholar] [CrossRef] [PubMed]
- Khoo, B.H.; Lee, B.K.J.; Senanayake, S.M.N.A.; Wilson, B.D. System for determining within-stroke variations of speed in swimming (swiss). In Proceedings of the IEEE/ASME International Conference on Advanced Intelligent Mechatronics, Singapore, 14–17 July 2009; pp. 1927–1932.
- Shemesh, E.; Shemesh-Granot, L. Personal Device for Measuring Training Activity E.G. Swimming of Trainee Has Sensing Unit Including Accelerometer and Gyroscope which Repeatedly Measure Parameters Associated with Movement of Body Part during Activity. U.S. Patent US2009239710-A1; WO2008032315-A1; US7980998-B2, 24 September 2009. [Google Scholar]
- Chan, R.; Leong, M.H.; Li, L. Portable Exercise Repetition Counter E.G. Pedometer Has Three Axes Accelerometers that Measure Acceleration Profiles of Exerciser along Three Orthogonal Axes in Space. European Patent EP2281612-A1; HK1149222-A0, 3 September 2009. [Google Scholar]
- Anthony, J.J.; Chalfant, S.E. Multi-State Performance Monitoring System. U.S. Patent US20100210975A1, 19 August 2010. [Google Scholar]
- Irlam, J.C.; Irlam, L.J. Wrist Worn Device E.G. Sports Watch for Determining E.G. Information about Movement of Human Body during Swimming, Has Feedback Unit That Provides Selected Value of Swimming Metric Containing Lap and Stroke Counts to the User. U.S. Patent US2010204952-a1; GB2465824-A; US2010204952-A1; GB2465824-B; US8265900-B2, 12 August 2010. [Google Scholar]
- Le Sage, T.; Bindel, A.; Conway, P.; Justham, L.; Slawson, S.; West, A. Development of a real time system for monitoring of swimming performance. Procedia Eng. 2010, 2, 2707–2712. [Google Scholar] [CrossRef]
- Le Sage, T.; Conway, P.; Justham, L.; Slawson, S.; Bindel, A.; West, A. A component based integrated system for signal processing of swimming performance. In Proceedings of the 2010 International Conference on Signal Processing and Multimedia Applications (SIGMAP), Athens, Greece, 26–28 July 2010; pp. 73–79.
- Li, X. Real-Time Swimming Monitor. U.S. Patent US20100030482a1, 4 Febuary 2010. [Google Scholar]
- Nakashima, M.; Ohgi, Y.; Akiyama, E.; Kazami, N. Development of a swimming motion display system for athlete swimmers’ training using a wristwatch-style acceleration and gyroscopic sensor device. Procedia Eng. 2010, 2, 3035–3040. [Google Scholar] [CrossRef]
- Pansiot, J.; Lo, B.; Yang, G.Z. Swimming Stroke Kinematic Analysis with BSN. In Proceedings of the 2010 International Conference on Body Sensor Networks, Singapore, 7–9 June 2010; pp. 153–158.
- Slawson, S.; Conway, P.; Justham, L.; Le Sage, T.; West, A. Dynamic signature for tumble turn performance in swimming. Procedia Eng. 2010, 2, 3391–3396. [Google Scholar] [CrossRef]
- Thomas, O.; Sunehag, P.; Dror, G.; Yun, S.; Kim, S.; Robards, M.; Smola, A.; Green, D.; Saunders, P. Wearable sensor activity analysis using semi-markov models with a grammar. Perv. Mob. Comput. 2010, 6, 342–350. [Google Scholar] [CrossRef]
- Vannozzi, G.; Donati, M.; Gatta, G.; Cappozzo, A. Analysis of swim turning, underwater gliding and stroke resumption phase in top division swimmers using a wearable inertial sensor device. In Biomechanics and Medicine in Swimming XI; Kjendlie, P.L., Stallman, R.K., Cabri, J., Eds.; Norwegian School of Sport Sciences: Oslo, Norway, 2010; pp. 178–180. [Google Scholar]
- Wright, B.V.; Hinman, M.G.; Stager, J.M. Accelerometry as a Means of Quantifying Training Distance and Speed in Competitive Swimmers. In Proceedings of the XIth International Symposium for Biomechanics & Medicine in Swimming, Oslo, Norway, 16–19 June 2010; pp. 305–307.
- Yuen, P.A. Swim Monitor. World Intellectual Property Organization. WO 2010113135a1, 7 October 2010. [Google Scholar]
- Daukantas, S.; Marozas, V.; Lukosevicius, A.; Jegelevicius, D.; Kybartas, D. Video and Inertial Sensors Based Estimation of Kinematical Parameters in Swimming Sport. In Proceedings of the 2011 IEEE 6th International Conference on Intelligent Data Acquisition and Advanced Computing Systems (IDAACS), Prague, Czech, 15–17 September 2011; pp. 408–411.
- Fulton, S.K.; Pyne, D.; Burkett, B. Optimizing kick rate and amplitude for paralympic swimmers via net force measures. J. Sports Sci. 2011, 29, 381–387. [Google Scholar] [CrossRef] [PubMed]
- Hagem, R.M.; Theil, D.V.; O’Keefe, S.G.; Wixted, A.; Fickenscher, T. Low-cost short-range wireless optical fsk modem for swimmers feedback. Sensors 2011, 258–261. [Google Scholar]
- James, D.A.; Leadbetter, R.I.; Neeli, A.R.; Burkett, B.J.; Thiel, D.V.; Lee, J.B. An integrated swimming monitoring system for the biomechanical analysis of swimming strokes. Sports Technol. 2011, 4, 141–150. [Google Scholar]
- James, D.A.; Burkett, B.; Thiel, D.V. An unobtrusive swimming monitoring system for recreational and elite performance monitoring. Procedia Eng. 2011, 13, 113–119. [Google Scholar] [CrossRef]
- Lee, J.B.; Burkett, B.J.; Thiel, D.V.; James, D.A. Inertial sensor, 3d and 2d assessment of stroke phases in freestyle swimming. Procedia Eng. 2011, 13, 148–153. [Google Scholar] [CrossRef]
- Lee, J.B.; Leadbetter, R.I.; Ohgi, Y.; Theil, D.V.; Burkett, B.; James, D.A. Quantifying and assessing biomechanical differences in swim turn using wearable sensors. Sports Technol. 2011, 4, 128–133. [Google Scholar]
- Le Sage, T.; Bindel, A.; Conway, P.P.; Justham, L.M.; Slawson, S.E.; West, A.A. Embedded programming and real time signal processing of swimming strokes. Sports Eng. 2011, 14, 1–14. [Google Scholar] [CrossRef]
- Siirtola, P.; Koskimäki, H.; Huikari, V.; Laurinen, P.; Röning, J. Improving the classification accuracy of streaming data using sax similarity features. Pattern Recognit. Lett. 2011, 32, 1659–1668. [Google Scholar] [CrossRef]
- Siirtola, P.; Laurinen, P.; Roning, J.; Kinnunen, H. Efficient accelerometer based swimming exercise tracking. In Proceedings of the 2011 IEEE Symposium on Computational Intelligence and Data Mining (CIDM), Paris, France, 11–15 April 2011; pp. 156–161.
- Silva, A.S.; Salazar, A.J.; Correia, M.F.; Borges, C.M. Wimu: Wearable Inertial Monitoring Unit. A Mems-Based Device for Swimming Performance Analysis; Vieira, P., Fred, A., Filipe, J., Gamboa, H., Eds.; Biodevices: Rome, Italy, 2011; pp. 87–93. [Google Scholar]
- Stamm, A.; Thiel, D.V.; Burkett, B.; James, D.A. Towards determining absolute velocity of freestyle swimming using 3-axis accelerometers. In Proceedings of the 5th Asia-Pacific Congress on Sports Technology (Apcst), Melbourne, Australia, 28–31 August 2011; pp. 120–125.
- Bächlin, M.; Tröster, G. Swimming performance and technique evaluation with wearable acceleration sensors. Perv. Mob. Comput. 2012, 8, 68–81. [Google Scholar] [CrossRef]
- Burkett, B. Applications of biomechancis in swimming. In Proceedings of the International Symposium on Biomechanics in Sports: Conference Proceedings Archive, Melbourne, Australia, 6 July 2012; pp. 92–95.
- Dadashi, F.; Crettenand, F.; Millet, G.P.; Aminian, K. Front-crawl instantaneous velocity estimation using a wearable inertial measurement unit. Sensors 2012, 12, 12927–12939. [Google Scholar] [CrossRef] [PubMed]
- Godin, C.; Dauve, S.; Favre-Reguillon, F.; Larue, A.; Caritu, Y.; Riccardi, S.; Soubeyrat, C.; Flament, B.; Mayoue, A.; Favre, R.F. Person’s Elementary Movement E.G. Swimmer’s Cyclic Movement, Counting System for Use in Swimming Pool, Has Computing Unit for Calculating Scalar Product of Time Mask and Component of Signal According to Measurement Axis for Duration of Mask. U.S. Patent US2012191408-a1; FR2948802-A1; WO2011012666-A1; EP2460146-A1; US2012191408-A1; CN102549624-A; JP2013500102-W; FR2948802-B1, 26 July 2012. [Google Scholar]
- Hagem, R.M.; Thiel, D.V.; O’Keefe, S.G.; Dahm, N.; Stamm, A.; Fickenscher, T. Smart optical wireless sensor for real time swimmers feedback. In Proceedings of the IEEE Sensors, Taipei, Taiwan, 28–31 October 2012; pp. 1–4.
- Jallon, P. System for observing E.G. Butterfly style swimming activity, of swimmer during swimming competitions, has analyzing unit to analyze signals transmitted from sensor to measuring shaft to determine swimming type of user. U.S. Patent US2012072165-a1; FR2943554-A1; WO2010112470-A1; EP2414054-A1; US2012072165-A1; FR2943554-B1; EP2414054-B1, 22 March 2012. [Google Scholar]
- Le Sage, T.; Bindel, A.; Conway, P.; Justham, L.; Slawson, S.; Webster, J.; West, A. A multi-sensor system for monitoring the performance of elite swimmers. In E-Business and Telecommunications; Obaidat, M., Tsihrintzis, G., Filipe, J., Eds.; Springer Berlin Heidelberg: Athens, Greece, 2012; Volume 222, pp. 350–362. [Google Scholar]
- Slawson, S.E.; Justham, L.M.; Conway, P.P.; Le-Sage, T.; West, A.A. Characterizing the swimming tumble turn using acceleration data. Proc. Inst. Mech. Eng. Part P J. Sports Eng. Technol. 2012, 226, 3–15. [Google Scholar] [CrossRef]
- Stamm, A.; James, D.A.; Hagem, R.M.; Theil, D.V. Investigating arm symmetry in swimming using inertial sensors. In Proceedings of the IEEE Sensors, Taipei, Taiwan, 28–31 October 2012.
- Chakravorti, N.; Le Sage, T.; Slawson, S.; Conway, P.; West, A. Design & implementation of an integrated performance monitoring tool for swimming to extract stroke information at real time. IEEE Trans. Hum. Mach. Syst. 2013, 43, 199–213. [Google Scholar]
- Dadashi, F.; Aminian, K.; Millet, G.P. Gaussian process framework for pervasive estimation of swimming velocity with body-worn imu. Electron. Lett. 2013, 49, 44–46. [Google Scholar] [CrossRef]
- Dadashi, F.; Aminian, K.; Crettenand, F.; Millet, G.P. Towards estimation of front-crawl energy expenditure using the wearable aquatic movement analysis system (wamas). In Proceedings of the 2013 IEEE International Conference on Body Sensor Networks, Cambridge, MA, USA, 6–9 May 2013.
- Dadashi, F.; Arami, A.; Crettenand, F.; Millet, G.P.; Komar, J.; Seifert, L.; Aminian, K. A hidden markov model of the breaststroke swimming temporal phases using wearable inertial measurement units. In Proceedings of the 2013 IEEE International Conference on Body Sensor Networks, Cambridge, MA, USA, 6–9 May 2013.
- Hagem, R.M.; Haelsig, T.; O’Keefe, S.G.; Stamm, A.; Fickenscher, T.; Thiel, D.V. Second generation swimming feedback device using a wearable data processing system based on underwater visible light communication. Procedia Eng. 2013, 60, 34–39. [Google Scholar] [CrossRef]
- Hagem, R.M.; Thiel, D.V.; O’Keefe, S.; Fickenscher, T. Real-time swimmers’ feedback based on smart infrared (SSIR) optical wireless sensor. Electron. Lett. 2013, 49, 340–341. [Google Scholar] [CrossRef]
- Hagem, R.; O’Keefe, S.; Fickenscher, T.; Thiel, D. Self contained adaptable optical wireless communications system for stroke rate during swimming. IEEE Sens. J. 2013, 13, 3144–3151. [Google Scholar] [CrossRef]
- Jensen, U.; Prade, F.; Eskofier, B.M. Classification of kinematic swimming data with emphasis on resource consumption. In Proceedings of the 2013 IEEE International Conference on Body Sensor Networks, Cambridge, MA, USA, 6–9 May 2013.
- Le Sage, T.; Conway, P.; Slawson, S.; West, A. Development of a wireless sensor network for use as an automated system for monitoring swimming starts. Proc. Inst. Mech. Eng. Part P J. Sports Eng. Technol. 2013, 227, 184–195. [Google Scholar] [CrossRef]
- Pfundt, B.; Reichenbach, M.; Eskofier, B.; Fey, D. Smart sensor architectures for embedded biosignal analysis. In Proceedings of the 2013 Conference on Design and Architectures for Signal and Image Processing (DASIP), Cagliari, Italy, 8–10 October 2013; pp. 174–181.
- Rowlands, D.D.; James, D.A.; Lee, J.B. Visualization of wearable sensor data during swimming for performance analysis. Sports Technol. 2013, 6, 130–136. [Google Scholar]
- Stamm, A.; James, D.A.; Burkett, B.B.; Hagem, R.M.; Thiel, D.V. Determining maximum push-off velocity in swimming using accelerometers. In Proceedings of the 6th Asia-Pacific Congress on Sports Technology (APCST), Hong Kong, China, 18–20 September2013; pp. 201–207.
- Stamm, A.; James, D.A.; Thiel, D.V. Velocity profiling using inertial sensors for freestyle swimming. Sports Eng. 2013, 16, 1–11. [Google Scholar] [CrossRef]
- Wright, B.; Stager, J. Quantifying competitive swim training using accelerometer-based activity monitors. Sports Eng. 2013, 16, 155–164. [Google Scholar] [CrossRef]
- Andreoni, G.; Perego, P.; Fusca, M.C.; Lavezzari, R.; Santambrogio, G.C. Smart garments for performance and training assessment in sport. In Proceedings of the 2014 EAI 4th International Conference on Wireless Mobile Communication and Healthcare (Mobihealth), Athens, Greece, 3–5 November 2014; pp. 267–270.
- Beanland, E.; Main, L.C.; Aisbett, B.; Gastin, P.; Netto, K. Validation of gps and accelerometer technology in swimming. J. Sci. Med. Sport 2014, 17, 234–238. [Google Scholar] [CrossRef] [PubMed]
- Dadashi, F.; Millet, G.P.; Aminian, K. Estimation of front-crawl energy expenditure using wearable inertial measurement units. IEEE Sens. J. 2014, 14, 1020–1027. [Google Scholar] [CrossRef]
- Hong, J.O.; Yuen, S.G.J. Biometric Monitoring System for Obtaining Swimming Metrics Regarding Stroke Cycle Count, Lap Count, and Stroke Type, Has Control Logic Configured to Alter Stored Information Pertaining to Number of Swim Strokes in Memory. U.S. Patent US2014278229-A1, 16 October 2014. [Google Scholar]
- Lecoutere, J.; Puers, R. Wireless communication with miniaturized sensor devices in swimming. Procedia Eng. 2014, 72, 398–403. [Google Scholar] [CrossRef]
- Mueller, N.; Doerksen, K. System and Method for Counting Swimming Laps. U.S. Patent US8696420b2, 15 April 2014. [Google Scholar]
- Nieminen, H.; Kemetter, M.; Kallio, J.; Virtanen, A. Device and Method for Monitoring Swimming Performance. U.S. Patent US 20140277628a1, 18 September 2014. [Google Scholar]
- Nordsborg, N.B.; Espinosa, H.G.; Thiel, D.V. Estimating energy expenditure during front crawl swimming using accelerometers. Procedia Eng. 2014, 72, 132–137. [Google Scholar] [CrossRef]
- Ohgi, Y.; Kaneda, K.; Takakur, A. Sensor data mining on the kinematical characteristics of the competitive swimming. Eng. Sport 2014, 72, 829–834. [Google Scholar] [CrossRef]
- Phillips, C.W.G.; Forrester, A.I.J.; Hudson, D.A.; Turnock, S.R. Comparison of kinematic acquisition methods for musculoskeletal analysis of underwater flykick. Procedia Eng. 2014, 72, 56–61. [Google Scholar] [CrossRef]
- Seifert, L.; L’Hermette, M.; Komar, J.; Orth, D.; Mell, F.; Merriaux, P.; Grenet, P.; Caritu, Y.; Hérault, R.; Dovgalecs, V.; et al. Pattern recognition in cyclic and discrete skills performance from inertial measurement units. Procedia Eng. 2014, 72, 196–201. [Google Scholar] [CrossRef]
- Topalovic, M.; Eyers, S.; Exadaktylos, V.; Olbrecht, J.; Berckmans, D.; Aerts, J.M. Online monitoring of swimmer training using a 3D accelerometer identifying swimming and swimming style. In Proceedings of the 2nd International Congress on Sports Sciences Research and Technology Support icSPORTS 2014, Rome, Italy, 24–26 October 2014; pp. 111–115.
- Dadashi, F.; Millet, G.P.; Aminian, K. A bayesian approach for pervasive estimation of breaststroke velocity using a wearable imu. Perv. Mob. Comput. 2015, 19, 37–46. [Google Scholar] [CrossRef]
- Marshall, J. Magnetic field swimmer positioning. IEEE Sens. J. 2015, 15, 172–179. [Google Scholar] [CrossRef]
- Seifert, L.; Chollet, D.; Bardy, B.G. Effect of swimming velocity on arm coordination in the front crawl: A dynamic analysis. J. Sports Sci. 2004, 22, 651–660. [Google Scholar] [CrossRef] [PubMed]
- Seifert, L.; Leblanc, H.; Chollet, D.; Delignieres, D. Inter-limb coordination in swimming: Effect of speed and skill level. Hum. Mov.Sci. 2010, 29, 103–113. [Google Scholar] [CrossRef] [PubMed]
- Stager, J.M.; Johnston, J.D. Identification of factors impacting the relationship between accelerometer counts and swimming energy expenditure. Med. Sci. Sports Exerc. 2006, 38, S560–S560. [Google Scholar] [CrossRef]
- Davey, N.P. Acquisition and Analysis of Aquatic Stroke Data from an Accelerometer Based System. Master Thesis, Griffith University, Brisbane, Australia, 2004. [Google Scholar]
- Seifert, L.; Leblanc, H.; Herault, R.; Komar, J.; Button, C.; Chollet, D. Inter-individual variability in the upper-lower limb breaststroke coordination. Hum. Mov. Sci. 2011, 30, 550–565. [Google Scholar] [CrossRef] [PubMed]
- Ichikawa, H.; Ohgi, Y.; Miyaji, C.; Nomura, T. Application of a mathematical model of arm motion in front crawl swimming to kinematical analysis using an accelerometer. Sports Eng. 2002, 5, 230–230. [Google Scholar]
- Maws, G.J.; Volkers, S. Measurement and application of stroke dynamics during training in your own pool. Aust. Swim Coach 1996, 12, 34–38. [Google Scholar]
- Deschodt, V.J.; Arsac, L.M.; Rouard, A.H. Relative contribution of arms and legs in humans to propulsion in 25m sprint front crawl swimming. Eur. J. Appl. Physiol. 1999, 80, 192–199. [Google Scholar] [CrossRef] [PubMed]
- Payton, C.J.; Baltzopoulos, V.; Bartlett, R.M. Contributions of rotations of the trunk and upper extremity to hand velocity during front crawl swimming. J. Appl. Biomech. 2002, 18, 243–256. [Google Scholar]
- Toussaint, H.M.; Truijens, M. Biomechanical aspects of peak performance in human swimming. Anim. Biol. 2005, 55, 17–40. [Google Scholar] [CrossRef]
- Feel for the water. Available online: http://www.feelforthewater.com/ (Accessed on 4 December 2014).
- Sabatini, A.M. Estimating three-dimensional orientation of human body parts by inertial/magnetic sensing. Sensors 2011, 11, 1489–1525. [Google Scholar] [CrossRef] [PubMed]
- Ahmadi, A.; Rowlands, D.D.; James, D.A. Development of inertial and novel marker-based techniques and analysis for upper arm rotational velocity measurements in tennis. Sports Eng. 2010, 12, 179–188. [Google Scholar] [CrossRef]
- Bai, L.; Pepper, M.G.; Yan, Y.; Spurgeon, S.K.; Sakel, M.; Phillips, M. Quantitative assessment of upper limb motion in neurorehabilitation utilizing inertial sensors. IEEE Trans. Neural Syst. Rehabil. Eng. 2015, 23, 232–243. [Google Scholar] [CrossRef] [PubMed]
- Benyue, S.; Guangjun, W.; Ming, L.; Jian, Z.; Zeyuan, L. The motion simulation for freestyle skiing aerials. In Communications in Computer and Information Science; IGTA: Beijing, China, 2013; pp. 292–299. [Google Scholar]
- Tranquilli, C.; Bernetti, A.; Picerno, P. Ambulatory joint mobility and muscle strength assessment during rehabilitation using a single wearable inertial sensor. Med. Dello Sport 2013, 66, 583–597. [Google Scholar]
- Cuesta-Vargas, A.I.; Galán-Mercant, A.; Williams, J.M. The use of inertial sensors system for human motion analysis. Phys. Ther. Rev. 2010, 15, 462–473. [Google Scholar] [CrossRef] [PubMed]
- Ahmadi, A.; Mitchell, E.; Richter, C.; Destelle, F.; Gowing, M.; O’Connor, N.E.; Moran, K. Toward automatic activity classification and movement assessment during a sports training session. IEEE Intern. Things J. 2015, 2, 23–32. [Google Scholar] [CrossRef]
- Meamarbashi, A. A novel inertial technique to measure very high linear and rotational movements in sports, part I: The hardware. J. Appl. Sci. 2009, 9, 1746–1751. [Google Scholar] [CrossRef]
- Meamarbashi, A.; Hossaini, S.R.A. Application of novel inertial technique to compare the kinematics and kinetics of the legs in the soccer instep kick. J. Hum. Kinet. 2010, 23, 3–12. [Google Scholar] [CrossRef]
- Berger, M.A.M. Determining propulsive force in front crawl swimming: A comparison of two methods. J. Sports Sci. 1999, 17, 97–105. [Google Scholar] [CrossRef] [PubMed]
- Rowlands, A.V.; Stiles, V.H. Accelerometer counts and raw acceleration output in relation to mechanical loading. J. Biomech. 2012, 45, 448–454. [Google Scholar] [CrossRef] [PubMed]
- Janz, K.F.; Rao, S.; Baumann, J.; Schultz, J.L. Measuring children’s vertical ground reaction force with accelerometry during walking, running and jumpiong: The iowa bone development study. Pediatr. Exerc. Sci. 2003, 15, 34–43. [Google Scholar]
- Sato, K.; Smith, S.L.; Sands, W.A. Validation of an accelerometer for measuring sport performance. J. Strength Cond. Res. 2009, 23, 341–347. [Google Scholar] [CrossRef] [PubMed]
- Quagliarella, L.; Sasanelli, N.; Belgiovine, G.; Moretti, L.; Moretti, B. Evaluation of standing vertical jump by ankles acceleration measurement. J. Strength Cond. Res. 2010, 24, 1229–1236. [Google Scholar] [CrossRef] [PubMed]
- Mizrahi, J.; Verbitsky, O.; Isakov, E.; Daily, D. Effect of fatigue on leg kinematics and impact acceleration in long distance running. Hum. Mov. Sci. 2000, 19, 139–151. [Google Scholar] [CrossRef]
- Blanksby, B.; Nicholson, L.; Elliot, B. Biomechanical analysis of the grab, track and handle swimming starts: An intervention study. Sports Biomech. 2002, 1, 11–24. [Google Scholar] [CrossRef] [PubMed]
- Blitvich, J.; McElroy, G.; Blanksby, B.; Clothier, P.; Pearson, C. Dive depth and water depth in competive swim starts. J. Swim. Res. 2000, 1, 11–24. [Google Scholar]
- McLean, S.; Holthe, M.; Vint, P.; Beckett, K.; Hinrichs, R. Addition of an approach to a swimming relay start. J. Appl. Biomech. 2000, 16, 342–355. [Google Scholar]
- Galbraith, J.; Scurr, J.; Kencken, C.; Wood, L.; Graham-Smith, P. Biomechanical comparison of the track start and the modified one-handed track start in competitive swimming: An intervention study. J. Appl. Biomech. 2008, 24, 307–315. [Google Scholar] [PubMed]
- Le Sage, T.; Bindel, A.; Conway, P.; Slawson, S.; West, A. Development of a wireless sensor network for embedded monitoring of human motion in a harsh environment. In Proceedings of the IEEE 3rd International Conference on Communication Software and Networks (ICCSN), Xi’an, China, 27–29 May 2011; pp. 112–115.
- Tourny-Chollet, C.; Chollet, D.; Hogie, S.; Papparodopoulos, C. Kinematic analysis of butterfly turns of international and national swimmers. J. Sports Sci. 2002, 20, 383–390. [Google Scholar] [CrossRef] [PubMed]
- Blanksby, B.; Gathercole, D.; Marshall, R. Force plate and video analysis of the tumble turn by age-group swimmers. J. Swim. Res. 1996, 11, 40–45. [Google Scholar]
- Le Sage, T.; Conway, P.; Cossor, J.; Slawson, S.; West, A. A wireless sensor system for monitoring the performance of a swimmer's tumble turn. Proc. Inst. Mech. Eng. Part P J. Sports Eng. Technol. 2013, 227, 161–171. [Google Scholar] [CrossRef]
- Puel, F.; Morlier, J.; Avalos, M.; Mesnard, M.; Cid, M.; Hellard, P. 3D kinematic and dynamic analysis of the front crawl tumble turn in elite male swimmers. J. Biomech. 2012, 45, 510–515. [Google Scholar] [CrossRef] [PubMed]
- Cossor, J.; Mason, B. Swim start performances at the sydney 2000 olympic games. In XIXth Symposium on Biomechanics in Sports; Blackwell, J., Ed.; University of California: San Francisco, CA, USA, 2001; pp. 70–74. [Google Scholar]
- AvidaSports. Available online: http://www.avidasports.com/the-revolution/avidametrics/ (accessed on 5 June 2014).
- Finis. Available online: http://www.finisinc.com/SwimSense-Watch (accessed on 4 December 2015).
- Garmin. Available online: http://sites.garmin.com/en-US/swim/ (accessed on 4 December 2015).
- Swimovate. Available online: http://www.swimovate.com/poolmatepro/ (accessed on 4 December 2015).
- Yang, S.; Li, Q. Inertial sensor-based methods in walking speed estimation: A systematic review. Sensors 2012, 12, 6102–6116. [Google Scholar] [CrossRef] [PubMed]
- Nikodelis, T.; Kollias, I.; Hatzitaki, V. Bilateral inter-arm coordination in freestyle swimming: Effect of skill level and swimming speed. J. Sports Sci. 2005, 23, 737–745. [Google Scholar] [CrossRef] [PubMed]
- Figueiredo, P.; Seifert, L.; Vilas-Boas, J.P.; Fernandes, R.J. Individual profiles of spatio-temporal coordination in high intensity swimming. Hum. Mov. Sci. 2012, 31, 1200–1212. [Google Scholar] [CrossRef] [PubMed]
- Osborough, C.D.; Payton, C.J.; Daly, D.J. Influence of swimming speed on inter-arm coordination in competitive unilateral arm amputee front crawl swimmers. Hum. Mov. Sci. 2010, 29, 921–931. [Google Scholar] [CrossRef] [PubMed]
- Barden, J.M.; Kell, R.T.; Kobsar, D. The effect of critical speed and exercise intensity on stroke phase duration and bilateral asymmetry in 200-m front crawl swimming. J. Sports Sci. 2011, 29, 517–526. [Google Scholar] [CrossRef] [PubMed]
- Chollet, D.; Seifert, L.; Leblanc, H.; Boulesteix, L.; Carter, M. Evaluation of the arm-leg coordination in flat breaststroke. Int. J. Sports Med. 2004, 25, 486–495. [Google Scholar] [CrossRef] [PubMed]
- Zhou, H.; Stone, T.; Hu, H.; Harris, N. Use of multiple wearable inertial sensors in upper limb motion tracking. Med. Eng. Phys. 2008, 30, 123–133. [Google Scholar] [CrossRef] [PubMed]
- Supej, M. 3D measurements of alpine skiing with an inertial sensor motion capture suit and gnss rtk system. J. Sports Sci. 2010, 28, 759–769. [Google Scholar] [CrossRef] [PubMed]
- Kruger, A.; Edelmann-Nusser, J. Application of a full body inertial measurement in alpine skiing: A comparison with an optical video based system. J. Appl. Biomech. 2010, 26, 516–521. [Google Scholar] [PubMed]
- Ride, J.R.; James, D.A.; Lee, J.B.; Rowlands, D.D. A distributed architecture for storing and processing multi channel multi-sensor athlete performance data. Procedia Eng. 2012, 34, 403–408. [Google Scholar] [CrossRef]
- Schleihauf, R.E. A hydrodynamic analysis of swimming propulsion. In Swimming III; Terauds, J., Bedingfield, E.W., Eds.; University Park Press: Baltimore, MA, USA, 1979. [Google Scholar]
- Maglischo, C.W.; Maglischo, E.W.; Higgins, J.; Hinrichs, R.; Luedtke, D.; Schleihauf, R.E.; Thayer, A. A biomechanical analysis of the 1984 U.S. Olympic swimming team: The distance freestylers. J. Swim. Res. 1986, 2, 12–16. [Google Scholar]
- Rodriguez, D.A.; Brown, A.L.; Troped, P.J. Portable global positioning units to complement accelerometry-based physical activity monitors. Med. Sci. Sports Exerc. 2005, 37, S572–S581. [Google Scholar] [CrossRef] [PubMed]
- Godfrey, A.; Conway, R.; Meagher, D. Direct measurement of human movement by accelerometry. Med. Eng. Phys. 2008, 30, 1364–1386. [Google Scholar] [CrossRef] [PubMed]
- Scott, B.R.; Lockie, R.G.; Knight, T.J.; Clark, A.C.; de Jonge, X.A. A comparison of methods to quantify the in-season training load of professional soccer players. Int. J. Sports Physiol. Perform. 2013, 8, 195–202. [Google Scholar] [PubMed]
- Sullivan, C.; Bilsborough, J.C.; Cianciosi, M.; Hocking, J.; Cordy, J.; Coutts, A.J. Match score affects activity profile and skill performance in professional australian football players. J. Sci. Med. Sport 2013, 17, 326–331. [Google Scholar] [CrossRef] [PubMed]
- Bouten, C.V.; Koekkoek, K.T.; Verduin, M.; Kodde, R.; Janssen, J.D. A triaxial accelerometer and portable data processing unit for the assessment of daily physical activity. IEEE Trans. Biomed. Eng. 1997, 44, 136–147. [Google Scholar] [CrossRef] [PubMed]
- Zijlstra, W.; Hof, A. Assessment of spatio-temporal gait parameters from trunk accelerations during human walking. Gait Posture 2003, 18, 1–10. [Google Scholar] [CrossRef]
- Ojeda, L.; Borenstein, J. Non-gps navigation for security personnel and first responders. J. Navig. 2007, 60, 391–407. [Google Scholar] [CrossRef]
- Halsey, L.G.; Shepard, E.L.; Wilson, R.P. Assessing the development and application of the accelerometry technique for estimating energy expenditure. Comp. Biochem. Physiol. Part A Mol. Integr. Physiol. 2011, 158, 305–314. [Google Scholar] [CrossRef] [PubMed]
- Bouten, C.V.; Sauren, A.; Verduin, M.; Jansen, J. Effects of placement and orientation of body-fixed accelerometers on the assessment of energy expenditure during walking. IEEE Trans. Med. Biol. Eng. Comput. 1997, 35, 50–56. [Google Scholar] [CrossRef]
- Hill, M.S. A method for measuring mechanical work and work efficiency during human exercise. J. Biomech. 1993, 23, 229–242. [Google Scholar]
- Chen, K.Y.; Bassett, D.R. The technology of accelerometry-based activity monitors: Current and future. Med. Sci. Sports Exerc. 2005, 37, S490–S500. [Google Scholar] [CrossRef] [PubMed]
- Wixted, A.J.; Theil, D.V.; Hahn, A.G.; Gore, C.J.; Pyne, D.B.; James, D.A. Measurement of energy expenditure in elite athletes using mems based triaxial accelerometers. IEEE Sens. J. 2007, 7, 481–488. [Google Scholar] [CrossRef]
- Madera, J.; Gonzalez, L.M.; Benavent, J.; Tella, V. Analysis on the time and frequency domains of the acceleration in front crawl stroke. J. Hum. Kinet. 2012, 32, 109–120. [Google Scholar] [CrossRef] [PubMed]
- Tella, V.; Madera, J.; Colado, J.C.; Mateu, J.; Garcia Masso, X.; Gonzalez, L.M. A study about the 3d acceleration in front crawl and its relation with performance. In Biomechanics and Medicine in Swimming XI; Kjendlie, P.L., Stallman, R.K., Cabri, J., Eds.; Norwegian School of Sport Sciences: Oslo, Norway, 2010. [Google Scholar]
- Scherz, P. Practical Electronics for Inventors, 2nd ed.; McGraw-Hill: New York, NY, USA, 2007. [Google Scholar]
- Callaway, A.J.; Cobb, J.E. Linear acceleration measurement utilizing inter-instrument synchronization: A comparison between accelerometers and motion-based tracking approaches. Meas. Phys. Educ. Exerc. Sci. 2012, 16, 151–163. [Google Scholar] [CrossRef]
- Mayagoitia, R.E.; Nene, A.V.; Veltink, P.H. Accelerometer and rate gyroscope measurement of kinematics: An inexpensive alternative to optical motion analysis systems. J. Biomech. 2002, 35, 537–542. [Google Scholar] [CrossRef]
- Bonnet, V.; Mazza, C.; McCamley, J.; Cappozzo, A. Use of weighted fourier linear combiner filters to estimate lower trunk 3D orientation from gyroscope sensors data. J. Neuroeng. Rehabil. 2013, 10, 1–7. [Google Scholar] [CrossRef] [PubMed]
- Jefferies, S.M.; Jefferies, C.M.; Donohue, S. The effect of real-time feedback on swimming technique. J. Int. Soc. Swim Coach. 2012, 2, 41–49. [Google Scholar]
- Lai, X.; Liu, Q.; Wei, X.; Wang, W.; Zhou, G.; Han, G. A survey of body sensor networks. Sensors 2013, 13, 5406–5447. [Google Scholar] [CrossRef] [PubMed]
- Harb, A. Energy harvesting: State-of-the-art. Renew. Energy 2011, 36, 2641–2654. [Google Scholar] [CrossRef]
- Zhao, W.; Choi, K.; Bauman, S.; Salter, T.; Lowy, D.A.; Peckerar, M.; Khandani, M.K. An energy harvesting system surveyed for a variety of unattended electronic applications. Solid State Electron. 2013, 79, 233–237. [Google Scholar] [CrossRef]
- Liu, J.Q.; Fang, H.B.; Xu, Z.Y.; Mao, X.H.; Shen, X.C.; Chen, D.; Liao, H.; Cai, B.C. A mems-based piezoelectric power generator array for vibration energy harvesting. Microelectron. J. 2008, 39, 802–806. [Google Scholar] [CrossRef]
- Gu, L. Low-frequency piezoelectric energy harvesting prototype suitable for the mems implementation. Microelectron. J. 2011, 42, 277–282. [Google Scholar] [CrossRef]
© 2015 by the authors; licensee MDPI, Basel, Switzerland. This article is an open access article distributed under the terms and conditions of the Creative Commons by Attribution (CC-BY) license (http://creativecommons.org/licenses/by/4.0/).
Share and Cite
Mooney, R.; Corley, G.; Godfrey, A.; Quinlan, L.R.; ÓLaighin, G. Inertial Sensor Technology for Elite Swimming Performance Analysis: A Systematic Review. Sensors 2016, 16, 18. https://doi.org/10.3390/s16010018
Mooney R, Corley G, Godfrey A, Quinlan LR, ÓLaighin G. Inertial Sensor Technology for Elite Swimming Performance Analysis: A Systematic Review. Sensors. 2016; 16(1):18. https://doi.org/10.3390/s16010018
Chicago/Turabian StyleMooney, Robert, Gavin Corley, Alan Godfrey, Leo R Quinlan, and Gearóid ÓLaighin. 2016. "Inertial Sensor Technology for Elite Swimming Performance Analysis: A Systematic Review" Sensors 16, no. 1: 18. https://doi.org/10.3390/s16010018