Article

A Machine Learning Framework for Gait Classification Using Inertial Sensors: Application to Elderly, Post-Stroke and Huntington’s Disease Patients

1
The BioRobotics Institute, Scuola Superiore Sant’Anna, Pisa 56127, Italy
2
Information Engineering Unit, POLCOMING Department, University of Sassari, Sassari 07100, Italy
*
Author to whom correspondence should be addressed.
Sensors 2016, 16(1), 134; https://doi.org/10.3390/s16010134
Submission received: 7 December 2015 / Revised: 16 January 2016 / Accepted: 18 January 2016 / Published: 21 January 2016
(This article belongs to the Section Physical Sensors)

Abstract

:
Machine learning methods have been widely used for gait assessment through the estimation of spatio-temporal parameters. As a further step, the objective of this work is to propose and validate a general probabilistic modeling approach for the classification of different pathological gaits. Specifically, the presented methodology was tested on gait data recorded on two pathological populations (Huntington’s disease and post-stroke subjects) and healthy elderly controls using data from inertial measurement units placed at shank and waist. By extracting features from group-specific Hidden Markov Models (HMMs) and signal information in time and frequency domain, a Support Vector Machines classifier (SVM) was designed and validated. The 90.5% of subjects was assigned to the right group after leave-one-subject–out cross validation and majority voting. The long-term goal we point to is the gait assessment in everyday life to early detect gait alterations.

Graphical Abstract

1. Introduction

Wearable inertial sensors can be used to analyze human physical activity for prolonged periods of time and with minimal subject’s discomfort. Within this context, the assessment of gait in terms of quality and quantity is of great relevance since it provides indications of the level of physical mobility, of the risk of fall or of the effects of a therapy [1]. The development of automatic methods to discriminate between normal and abnormal gait and among different pathological gait patterns would be of great interest in several clinical applications, [2,3]. This, along with the possibility to collect a large amount of data during everyday life conditions, may open up new perspectives for the early identification of gait disorders and for the implementation of general pre-screening procedures.
In general, pathological gaits can be classified based on their characteristic motor features and according to the dominant observed motor disturbance [4]. The fundamental prerequisite for the implementation of automatic methods for the classification of gait disorders is the possibility to identify selected gait features for which the intra-pathology variability is smaller than the inter-pathology variability.
Inertial measurement units (IMUs) including combinations of accelerometers and gyroscopes have been successfully used for assessing gait characteristics (i.e., gait spatio-temporal parameters, gait variability) and the quality and quantity of physical activity in both healthy and pathological populations [5,6,7]. Recently, novel IMU-based approaches based on the statistical modeling of gait sequences using Hidden Markov Models (HMMs) have been proposed [8,9,10,11,12,13,14,15,16]. The inclusion of the statistical information on the signal morphology in addition to the signal value itself (the latter is of main interest in, e.g., classical threshold-based methods) was exploited to model gait data for both segmentation and classification purposes [8,10]. Some examples of recent applications of this statistically-intensive approach include discrimination between walking and jogging [8], classification of type of walking (level walking, inclined walking and stair climbing) [17], gesture recognition [18] and user authentication based on gait [19]. Machine learning methods such as artificial neural networks and support vector machines (SVM) found application in automatic recognition of pathological gait. Lakany proposed a solution for pathology detection from kinematic data obtained using stereo-photogrammetry during gait [20]. In particular, an artificial neural network was designed and validated to recognize 89 control subjects from 32 pathological patients affected by different gait disorders (cerebral palsy, polio or spina-bifida), using features extracted from spatial and temporal gait parameters. Begg and colleagues applied SVM classifiers to recognize gait changes due to ageing from kinematic data. A dataset of gait measurements of 30 young and 28 elderly subjects obtained from stereo-photogrammetry was considered, extracting features from foot clearance [21]. In another study, Pogorelc and colleagues compared several classifiers including neural networks and SVM to automatically recognize five healthy controls and four patients with hemiplegia using kinematic data [22]; features were extracted from joint angles, relative displacements, left-right symmetry and walking speed.
A few studies have attempted to categorize abnormal gait patterns from IMU data. Although no classification tests were conducted, Abaid and colleagues found significant differences in the duration of the gait phases between 10 healthy and 10 hemiplegic children using IMU data [14]. Chen and colleagues proposed an HMM based approach for discriminating between two simulated gait deviations (toe-in and toe-out gait) [12]. However, the method was applied and validated on four healthy subjects only, who were asked to reproduce the two abnormal gait conditions.
The objective of the current work is to propose and validate a machine learning framework for the definition of features to be used for the classification of different pathological gaits from IMU data. Specifically, this work presents a methodology based on the training of class-specific HMMs used to recognize the pathology group jointly with SVM classifiers. This mixed approach should take advantage of each single methodology. In fact, previous HMM based solutions have shown the capability to capture gait characteristics useful for classification [8,14], whereas gait classification studies involving SVM classification have reported high rates in recognizing gait alteration [21,22,23].
Very often the validation phase of newly proposed methodologies for the gait classification, especially in pathological populations, is overlooked or based on N-fold cross-validation approaches that includes data from the same subject in both training and test sets [21,22]. In the present study, we tested the proposed methodology and validated it on about 3500 gait cycles recorded on three different populations (Huntington’s disease and post-stroke subjects and healthy elderly controls) [15]. The methodology validation was performed using a Leave-One-Subject-Out (LOSO) cross-validation approach, so as to properly assess the algorithm behavior when evaluated on a new subject. The two pathological populations were selected as a paradigm since they are characterized by gait patterns that result in IMU signals with characteristic features [24,25,26,27,28].
The main motivation of this work is to lay the methodological foundation for mobile-based gait assessment tools, to be possibly included in health-tracking platforms such as Google Fit or Apple Health. The long-term goal we point to is then the gait assessment in everyday life, in the attempt to detect gait alterations early.

2. Materials and Methods

2.1. Subjects

The study included 15 post stroke patients (PS) (five females, ten males; mean (sd) age: 61.3 (13) y.o., height: 1.71 (0.06) m, mass: 78.7 (16.3) kg), 17 subjects with Huntington’s disease (HD) (seven females, ten males; mean (sd) age: 54.3 (12.2) y.o., height: 1.66 (0.08) m, mass: 61.5 (10.3) kg), and 10 healthy elderly (EL) (six females, four males; mean (sd) age: 69.7 (5.8) y.o., height: 1.62 (0.08) m, mass: 63.6 (5.7) kg). Subjects were enrolled from the out-patient Movement Disorders Clinic of the University of Genoa. Disease severity was determined by means of the Functional Ambulatory Category (FAC) which rates gait from 5 (independent walker) to 1 (walks with physical assistance only) [29] for the PS subjects (3.2 ± 1.5) and the Unified Huntington’s Disease Rating Scale (UHDRS) [30] for the HD subjects (40 ± 20). The UHDRS scale quantifies the general level of impairment taking into account motor, cognitive and behavioral aspects. Because the focus of the present study is on gait only, information related to ambulation only was considered (normal walking and tandem walking) to define a more specific scale named HDRS’. The level of the locomotor disability decreases with the scale score (8: not ambulating–0: normal gait). The Declaration of Helsinki was respected, all subjects provided informed written consent, and local ethic committee approval was obtained.

2.2. Acquisition Protocol

Three IMUs (Opal, APDM, Inc., Portland, OR, USA) featuring a tri-axial accelerometer and a tri-axial gyroscope (unit mass 22 g, unit size 48.5 mm × 36.5 mm × 13.5 mm, sampling frequency 128 Hz, accelerometer range ± 6 g, where g = 9.81 m/s2) were located on both shanks (about 20 mm above the malleoli with x, y and z axes pointing in vertical (VT, downward), antero-posterior (AP, forward) and medio-lateral (ML, right), directions respectively) and over the subject’s lumbar spine, between L4 and S2, of each participant. Although this work did not include anatomical calibration of the IMU positioning [31,32,33,34], care was taken to align the IMU axes to the anatomical axes. IMUs signals were low-pass filtered using a double-pass second order Butterworth filter with 5Hz cut-off frequency. A seven-meters long instrumented gait pressure mat (GAITRite™ Electronic Walkway, CIR System Inc., Franklin, NJ, USA) acquired at 120 Hz (spatial resolution accuracy: ±12.7 mm; time accuracy: ±1 sample) was used to acquire reference data. The instrumented mat returned the foot strike (FS) and toe off (TO) events and all relevant gait temporal parameters. The IMUs and the instrumented mat were synchronized (± 1 sample) by means of a wired connection between the IMU access point and the sensorized mat. The synchronization error was then evaluated in preliminary tests using the signals generated when a wooden cane, instrumented with one IMU, impacted the sensorized mat.
Subjects were asked to walk back and forth for about one minute along a 12-m walkway with the instrumented mat placed two meters from the starting line. Subjects walked both at self-selected comfortable speed and higher speed, wearing their own shoes. Each passage on the instrumented mat was considered as a separate gait trial.

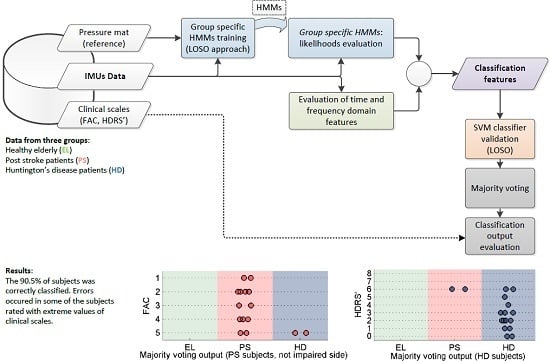
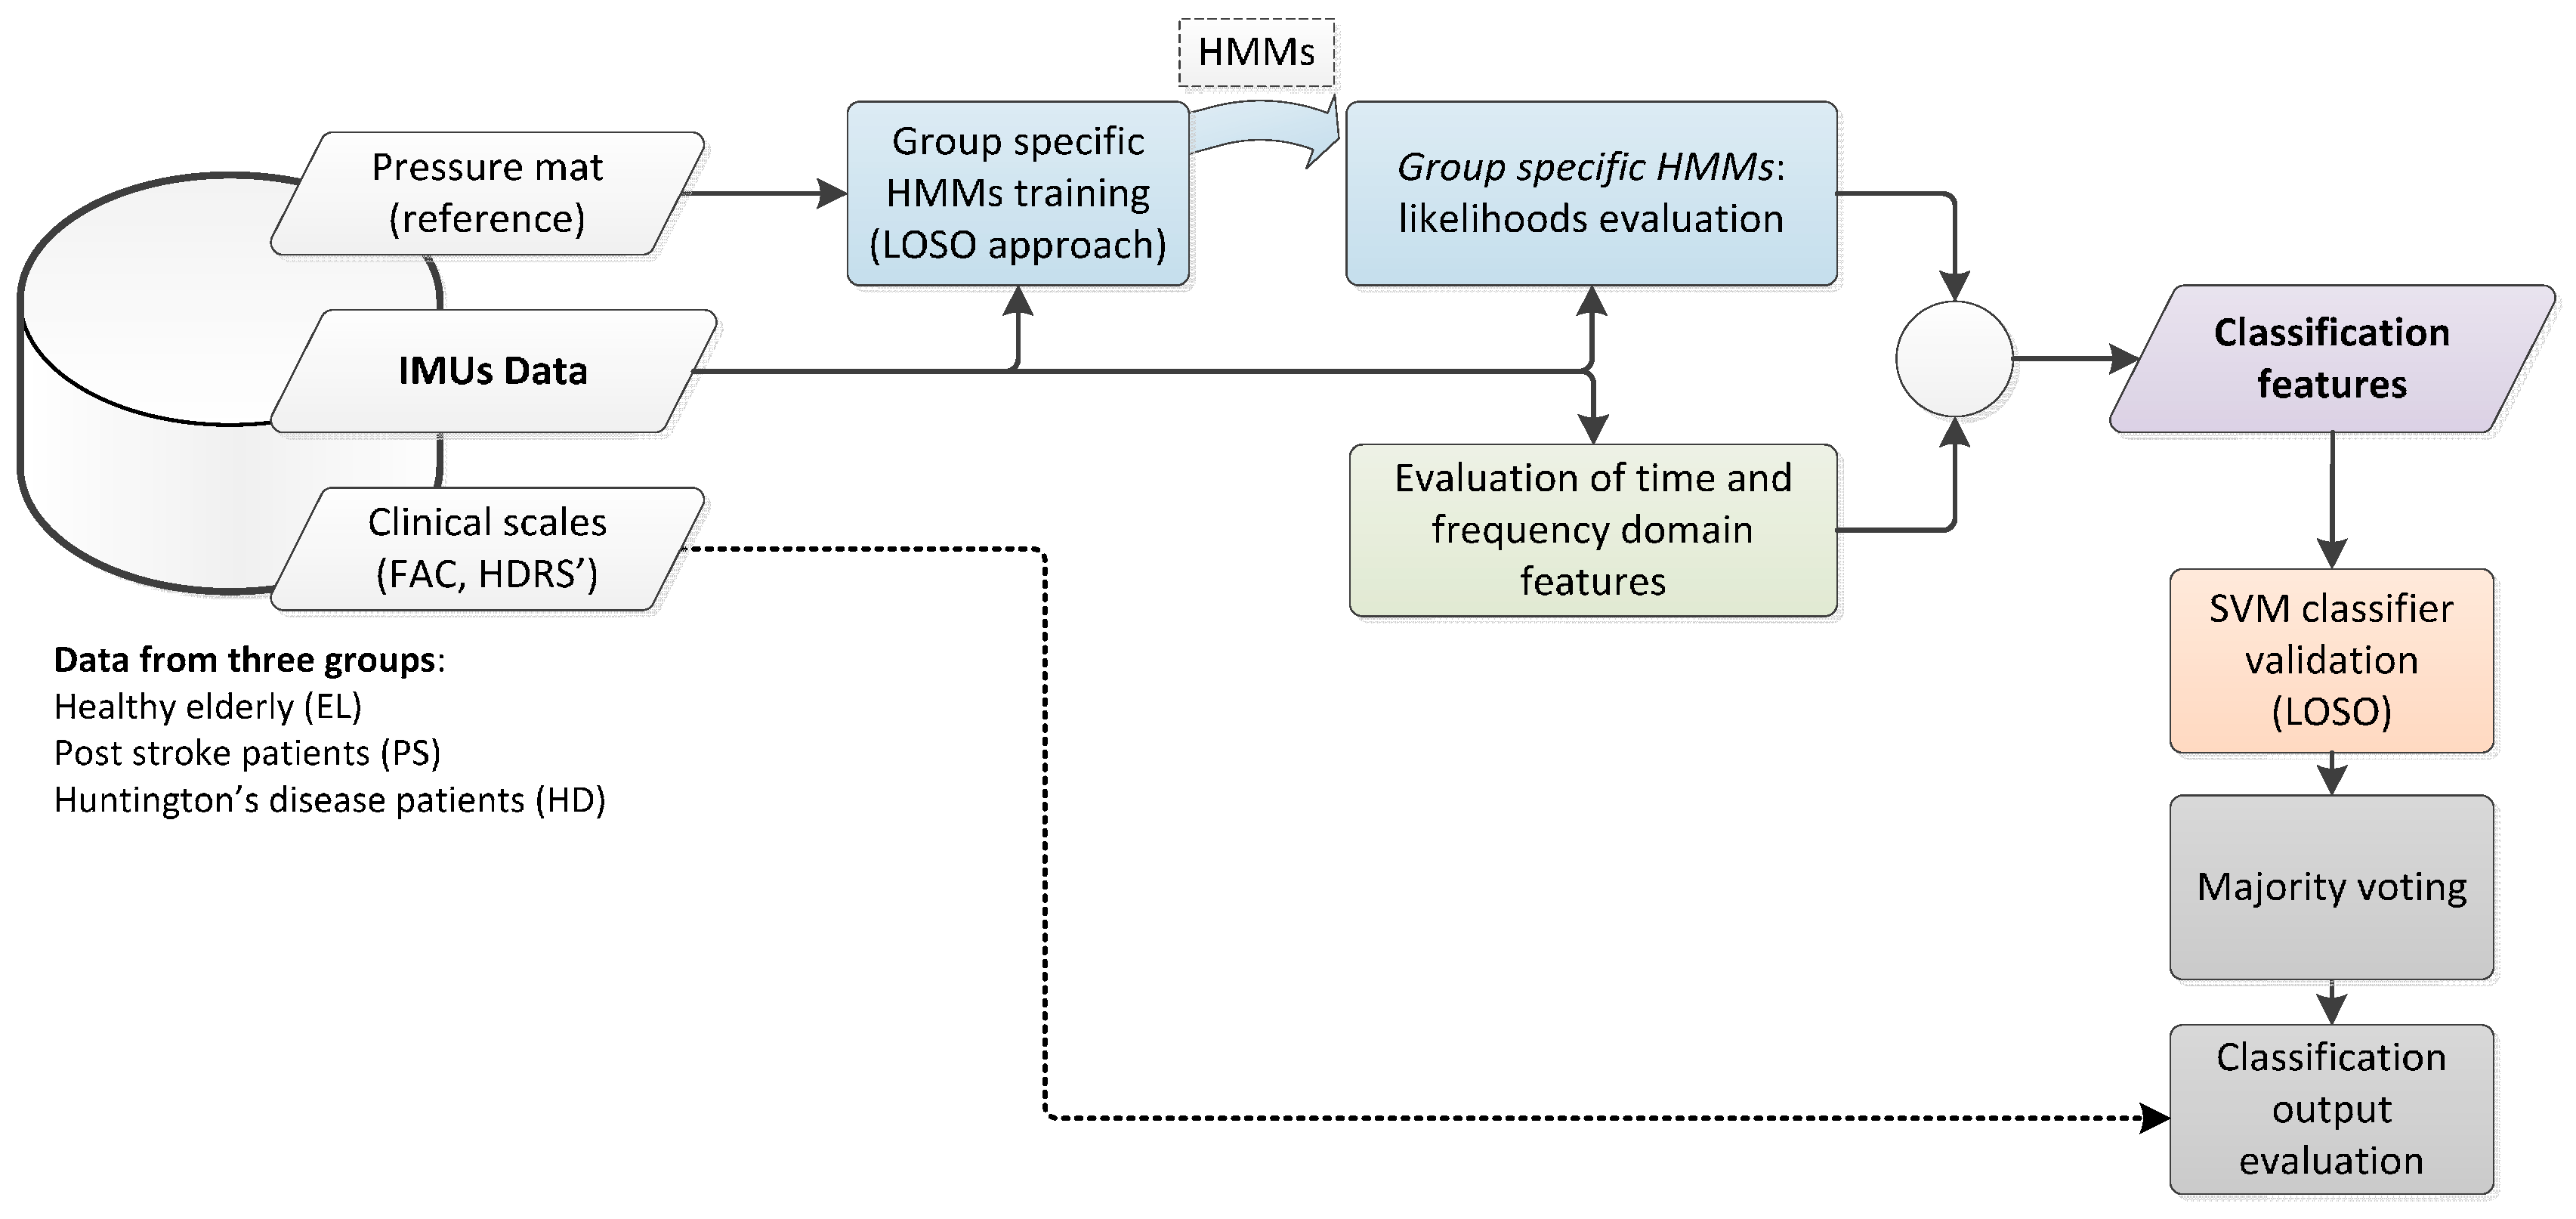
2.3. Gait Classification Strategy

A classification strategy was implemented for the automatic identification of pathological gaits based on IMU data, as reported in Figure 1. The classification framework was defined through three major steps: (i) the classification process started from implementing class-specific HMMs, whose likelihoods of observing data given each model were evaluated; (ii) the HMM likelihoods were included in a wider feature set, which was then classified using an SVM classifier; (iii) a majority voting (MV) classification post-processing was cascaded to summarize the results obtained in step ii.
Figure 1. General block scheme of the algorithm for gait classification.
Sensors 16 00134 g001
To evaluate the performance of the proposed classification approach, a LOSO cross-validation was carried out. It consists of training models using all data except those from the subject being tested and then repeating the evaluation for all the subjects in the dataset. Such a validation approach is particularly useful in evaluating the inter-subject generalization capability of the proposed methodology [8,35]. The criterion for assessing the quality of classification was given by the correct classification accuracy resulting from LOSO cross-validation. The accuracy was evaluated from the obtained confusion matrices.
The methodology was validated offline, by running all tests on a personal computer running Matlab (vers 2013b, the MathWorks, Natick, MA, USA). However, the online implementation of the classification method looks feasible, given that it would only require feature extraction and SVM testing, which present, respectively, time complexity of O(NlogN) and O(N2). SVM classification and HMM-based gait assessment were successfully tested on Android-based smartphones in some previous works of ours [36,37].

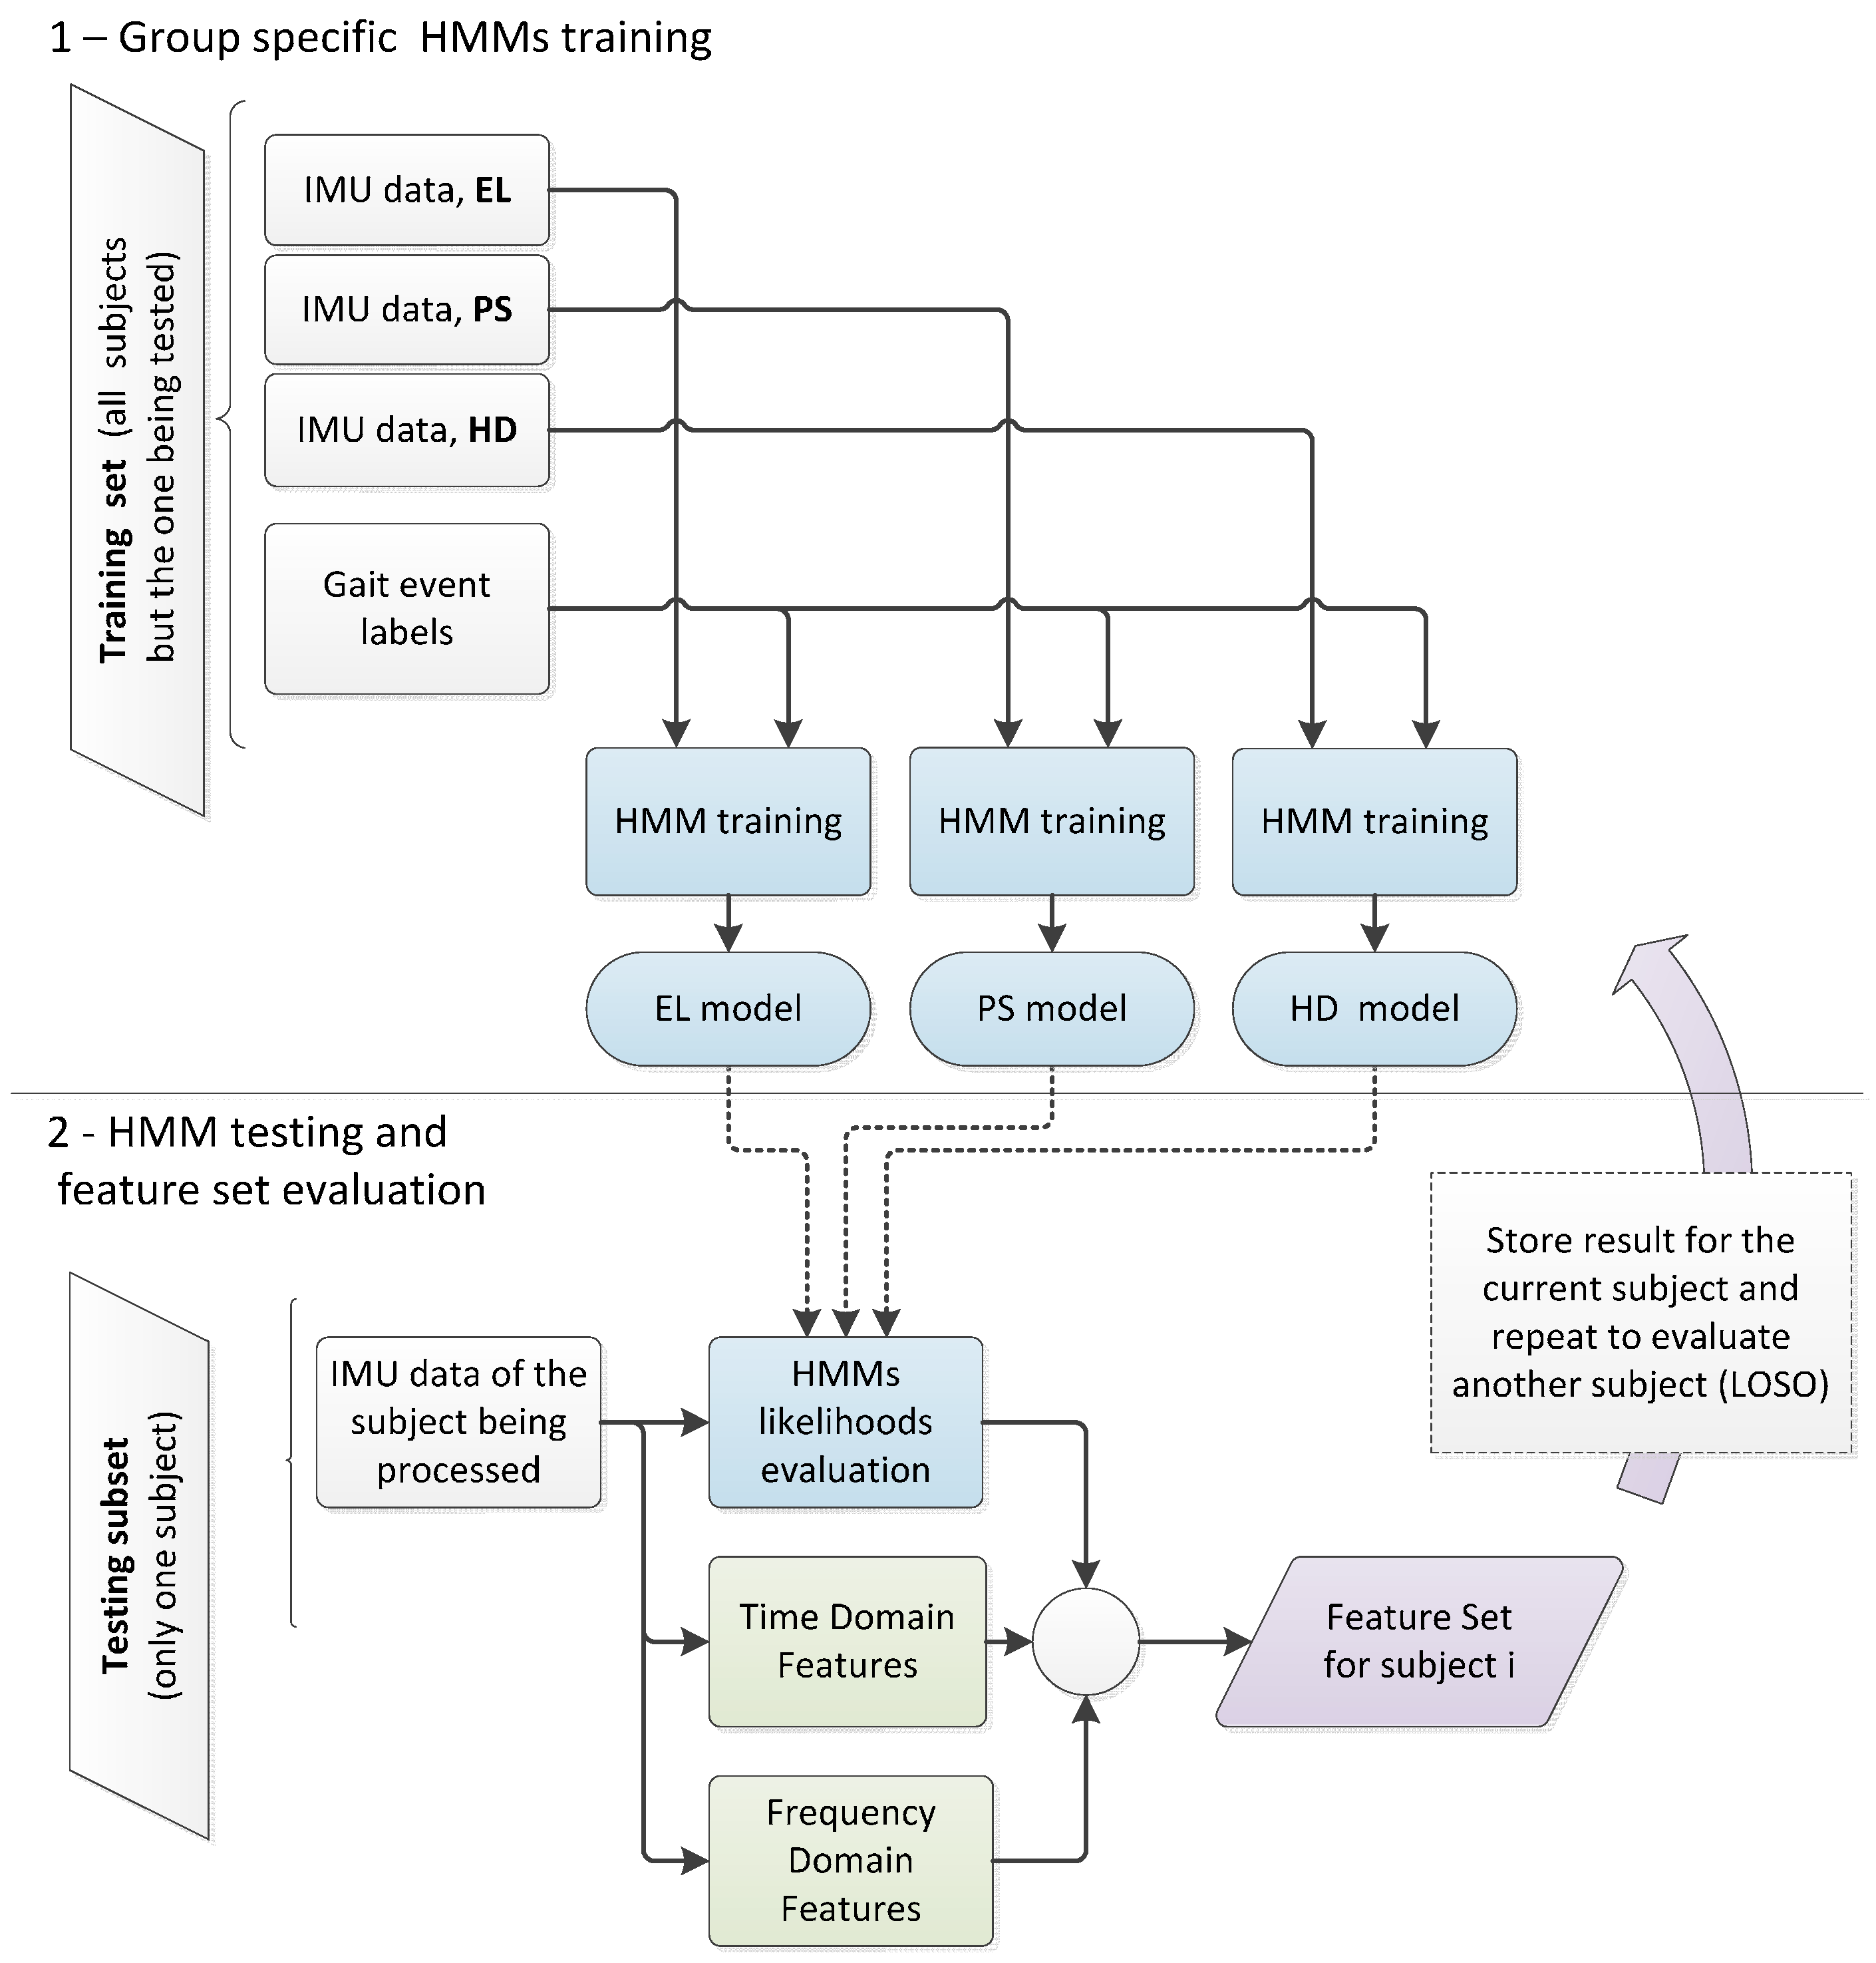
2.3.1. Classification Using Group-Specific HMM Likelihood

HMM is a double stochastic process in which the existence of a set of discrete states is assumed for a given system. The first stochastic process describes how the system may jump from one state to another (transition probability), under the hypothesis that the next state depends only on the state at the present time (Markov property). The state sequence is not observed—it is hidden to the observer, who has access to the emissions of each state only (in practical terms, the emissions can be considered as the observed quantities such as sensor data that are used to infer the hidden structure of the modeled phenomenon). The second stochastic process yields the statistical description governing the emissions of each observed variable (emission probability), in terms of either discrete probabilities or probability density functions. HMMs have been applied to solve classification problems thanks to their capability of summarizing signals’ characteristics using few parameters [38]. For each class, a specific model was trained. New data were then classified by evaluating which of the available models better explains data itself (likelihood) [38]. Given the cyclical nature of gait, we adopted a left–right HMM characterized by two states paired to the stance and swing phases as defined by the TO and FS events. The two state models were trained in a supervised way using the FSs and TOs annotations provided by the instrumented mat, used as a gold standard.
The proposed set of HMM emissions was composed of seven observed variables. Six elements were computed from a single shank sensor according to a previous work on gait segmentation [15]: ML angular velocity and its approximated derivative, AP acceleration and its approximated derivative, and approximated derivative of the ML and VT accelerations. The seventh element is selected from waist data (ML acceleration). The seven elements of data sequences will be referred to as channels in the text. Emission probabilities were modeled in the HMMs as Gaussian mixtures with three modes. To use all the experimental data available, we considered the right and left shank sensors as two different sources. Therefore, for each passage on the instrumented mat, two sets of experimental observations were available. The sign of the waist ML acceleration was changed when organizing emission vectors for the left side shank. This was done to have the same sign in the representation of waist data for both sides. The impaired side in PS subjects was also annotated.
For each group analyzed (EL, PS, HD), a specific model was trained using the experimental data recorded for the relevant group. The training was supervised using the approach reported in [39]. Class-specific models were then used to classify new experimental data, as shown in Figure 2. The forward-backward algorithm, implemented as it was described in the work byRabiner and colleagues [38], was applied to evaluate the likelihoods of observing data given each class-specific model. HMM log-likelihoods at each validation step were evaluated on a data window of the same length, corresponding to the first 2 s from each passage on the sensing mat. The natural logarithm was applied to likelihoods, so as to obtain log-likelihoods [38]. The classification output for each passage was obtained by selecting the model showing the highest log-likelihoods.
Figure 2. Feature set definition for classification. The information from the subject being tested was not included in the training set.
Sensors 16 00134 g002

2.3.2. SVM Classifier

SVM is a geometric-based classifier that constructs boundaries maximizing the margins between the nearest features relative to two distinct classes [40]. An excellent description of SVM algorithms can be found in the works by Vapnik and colleagues [40]. In this work, in particular, we used the LibSVM implementation of these algorithms [41].
To use a more exhaustive feature set, we added to the group-specific HMM log-likelihoods three features obtained by subtracting pairs of group specific likelihoods. In this case, in order to account for different information as above, likelihoods were evaluated on data from the whole duration of the passage on the instrumented mat. These three features were added to extract additional information from HMM models. In particular, the differences between log-likelihoods were proposed to obtain features that hold information about binary classification between two of the available groups. Since the value of the likelihood is known to depend on the length of the sequence, the difference between log-likelihoods for two models helped analyze data from different trials of different length. Moreover, twelve additional time and frequency domain features extracted from the IMU data were included (Table 1); such features confirmed their capability to extract information about ambulation in previous studies on data classification using inertial sensors [23,42].
Table 1. Features for classification.
HMM-Based FeaturesH1. Log-likelihood, EL model (limited to a 2-s window)
H2. Log-likelihood, PS model
H3. Log-likelihood, HD model
H4. Difference between log-likelihoods given EL and PS models (for all available data)
H5. Difference between log-likelihoods given EL and HD models
H6. Difference between log-likelihoods given PS and HD models
Time Domain FeaturesT1. Mean valueEvaluated for each channel (84 features)
T2. Standard deviation
T3. Variance
T4. Maximum
T5. Minimum
T6. Range
Frequency Domain FeaturesF1. Power at first dominant frequency (P1)
F2. Power at second dominant frequency
F3. First dominant frequency
F4. Second dominant frequency
F5. Total power (PT)
F6. P1/PT
The complete features data set hence included 90-dimensional feature vectors (six time domain features for each channel, six frequency domain features for each channel and six HMM-based features). An SVM classifier was then cascaded to classify feature vectors within the three considered classes (EL, PS and HD). Radial basis function kernels were used and SVM kernel parameters were optimized by running a grid search across parameter configurations (upper complexity bound C and kernel variability γ). For each of the tested feature subsets, the optimization criterion was the maximization of the minimum class-specific accuracy.
It is important to notice that both group-specific HMMs and SVM classifiers were evaluated using an LOSO cross-validation approach. This implies that at each validation step, namely for each subject to be evaluated, three HMMs were trained to evaluate likelihoods and a SVM classifier was trained using the feature set described in Table 1, as it is summarized in Figure 2 and Figure 3.
Figure 3. Block scheme of the SVM classifier validation. The LOSO approach was followed: data from N-1 subjects were used for training and the obtained classifier was tested on the features from the remaining subject.
Sensors 16 00134 g003

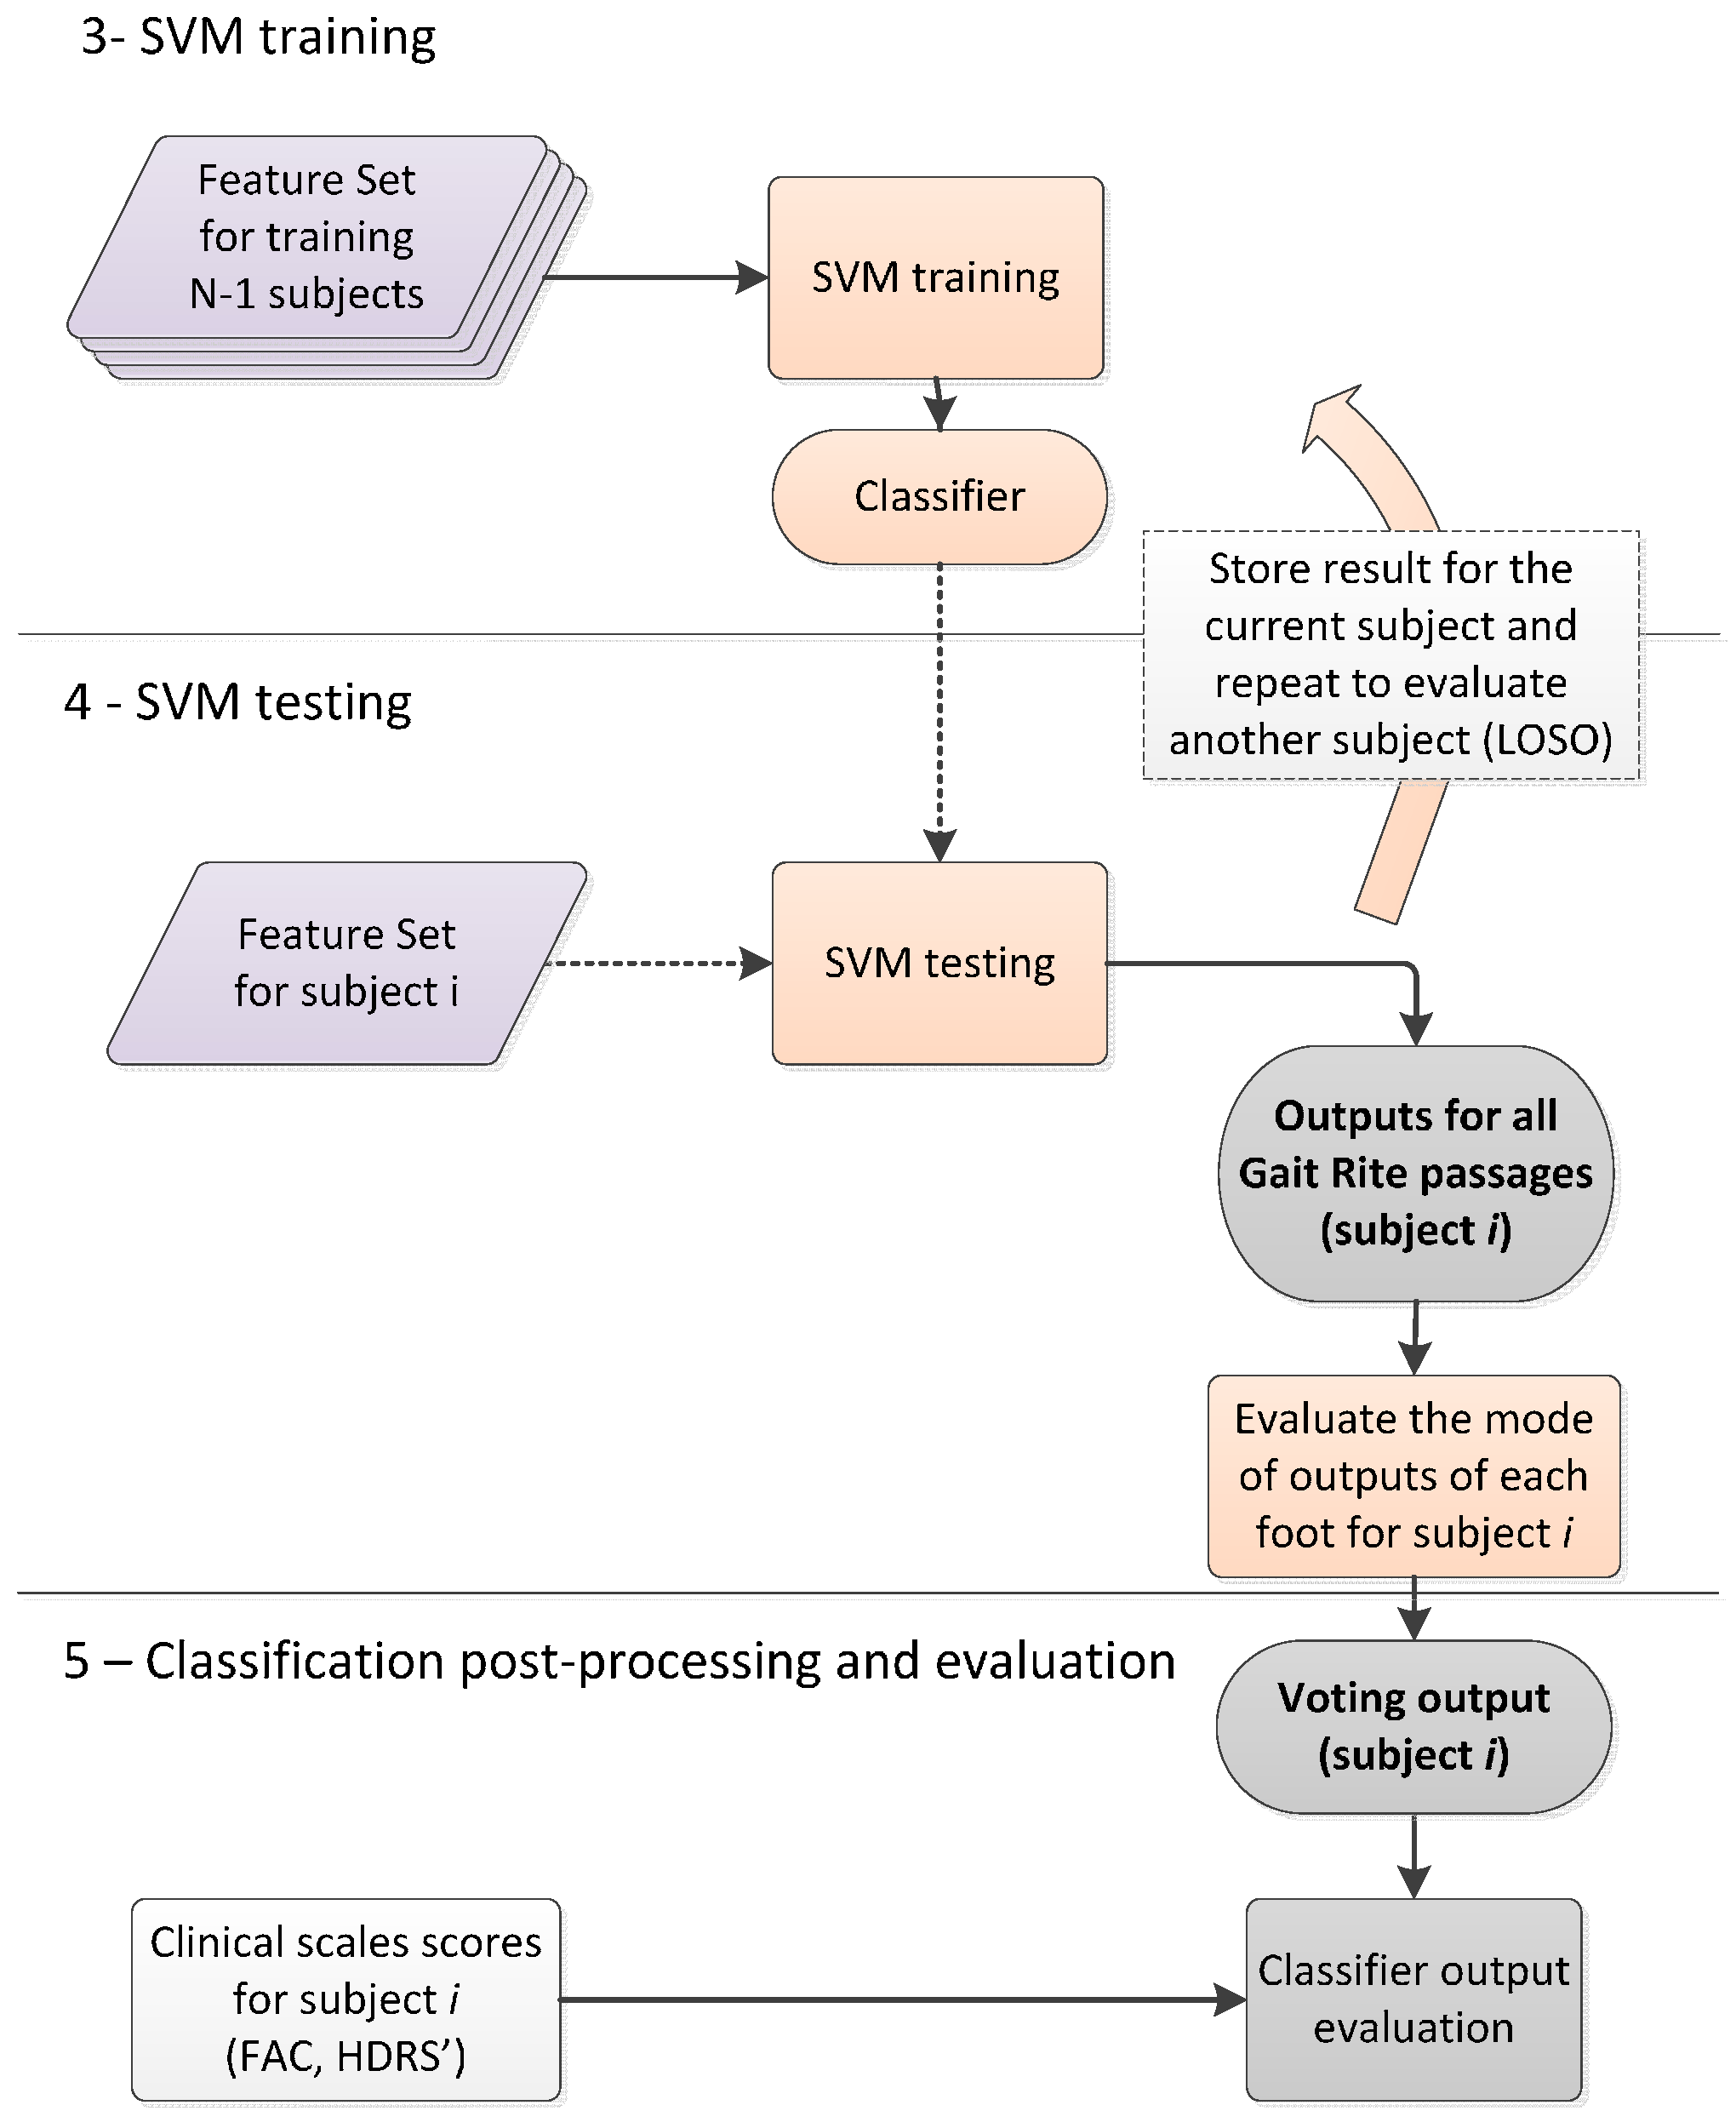
2.3.3. Classification Post-Processing with Majority Voting

To improve the final prediction and summarize the results, a majority voting (MV) strategy was finally applied [43]. MV is a post-processing technique applied to the classification outcomes, where multiple classification outcomes are merged to generate a single classification outcome. In MV, each classification outcome generates a ‘‘vote’’ for the corresponding class; the class collecting more votes is then selected as the winner of the poll.
In this paper, a vote was assigned for each subject, passage on the instrumented mat and side. For each subject, votes for each passage and side were analyzed to generate the assignment of the subject to the corresponding class. A slightly different approach was applied to PS patients, since, for them, a distinction between impaired and not-impaired side is relevant. For this group, instead of summing up votes of both sides to get a unique classification outcome, as it was done for EL and HD groups, the MV was applied, separately to the votes collected for each side.

2.4. Data Analysis

For each subject group (EL, PS, and HD), the accuracy of the classification obtained by solving the classification problem using (i) the HMM-based information only; and (ii) the SVM classifier output were computed. For the latter approach, the influence of the features on the classification output was also investigated. In particular, three different sets of features were compared: (a) HMM-based features; (b) time and frequency domain features; (c) full features set. The results provided by (i) and (ii) were compared with those obtained after (iii) MV was applied using the three sets of features previously described, Table 1.
The relationships between classification outputs and clinical scales were investigated by correlating the majority votes with the clinical scales values. The FAC levels were used for PS patients, whereas HDRS’ scores were used for HD patients.

3. Results

The number of passages on the instrumented mat varied from subject to subject from a minimum of two passages to a maximum of 16, in relation to the average gait speed, Table 2. The complete dataset analyzed consisted of 390 passages on the sensorized mat; for each passage, 4.5 strides were counted, on average, for each foot.
Table 2. Dataset details.
GroupNumber of PassagesNumber of Strides Per Passage
MinMaxMeanSDTotalMinMaxMeanSDTotal
EL61512.43.1124253.50.7862
PS2116.33.1953246.03.61144
HD41610.13.41712214.32.61467
Overall2169.34.03902244.52.73473

Gait Classification

Results for the automatic classification obtained by group-specific HMMs are reported in Part 1 of Table 3. The overall accuracy was 66.7%. Most data were incorrectly classified as HD data.
After applying SVM classification to the features set of Table 1, the results improved significantly. As reported in Parts 2A, 2B and 2C of Table 3, the bias toward the HD class was reduced by applying SVM classification. In particular, by limiting the SVM classifier to HMM-based features, an overall accuracy of 71.5% was obtained (Part 2A of Table 3). Similarly, by using time and frequency domain features only, the overall recognition accuracy was 71.7% (Part 2B of Table 3). The inclusion of the full feature set resulted in a classification accuracy of 73.3%, as it is shown in Part 2C of Table 3. After the MV was applied, by using all the features, the 90.5% of the subjects were correctly classified (Table 4). For PS patients, in order to discriminate between impaired and not impaired side, two results for each subject are reported in Table 3 and Table 4. As it is shown in Table 4, Part 2C, there were no misclassifications from HD or PS classes to the EL class, and then misclassifications occurred only between the two pathological conditions (PS and HD).
Table 3. Confusion matrices. Results are reported for two different strategies: (1) solving the classification problem using Hidden Markov Models (HMM) based information only; (2) solving the problem using a Support Vector Machine (SVM) classifier. In the latter case, the contributions of HMM-based features only (2A), of time and frequency domain features only (2B) and of the full features set (2C) are presented separately. Confusion matrices refer to the classification of single mat passages: each entry in the matrix corresponds to a passage on the mat of one foot. The amount of passages is then doubled with respect to data in Table 2. Correct classifications are in bold.
Classification Output
ELPSHD
1. HMM-based information (maximum log-likelihood)
Actual LabelEL176 (71%)0 (0%)72 (29%)
PS–not imp. side0 (0%)16 (16.8%)79 (83.2%)
PS–imp. side0 (0%)51 (53.7%)44 (46.3%)
HD60 (17.5%)5 (1.5%)277 (81%)
Overall accuracy 66.7% of mat passages
2A. SVM classifier (HMM-based features only)
Actual LabelEL168 (67.7%)50 (20.2%)30 (12.1%)
PS–not imp. side11 (11.6%)69 (72.6%)15 (15.8%)
PS–imp. side0 (0%)93 (97.9%)2 (2.1%)
HD55 (16.1%)59 (17.3%)228 (66.7%)
Overall accuracy 71.5% of mat passages
2B. SVM classifier (time and frequency domain features only)
Actual LabelEL182 (73.4%)0 (0%)66 (26.6%)
PS–not imp. side3 (3.2%)57 (60%)35 (36.8%)
PS–imp. side1 (1.1%)78 (82.1%)16 (16.8%)
HD63 (18.4%)37 (10.8%)242 (70.8%)
Overall accuracy 71.7% of mat passages
2C. SVM classifier (all available features)
Actual labelEL159 (64.1%)48 (19.4%)41 (16.5%)
PS–not imp. side0 (0%)71 (74.7%)24 (25.3%)
PS–imp. side0 (0%)88 (92.6%)7 (7.4%)
HD39 (11.4%)49 (14.3%)254 (74.3%)
Overall accuracy 73.3% of mat passages
The evaluation of classifiers with respect to the clinical scales values is summarized in Figure 4.
Figure 4a concerns PS subjects and reports only results for the not impaired side given that the classification showed 100% accuracy for the impaired side. In general, FAC values for data correctly classified as PS were low, whereas misclassifications from PS to the EL class showed higher FAC values, as shown in Figure 4.
A relation was also found between classifier output and the HDRS’ values, showing higher values, on average, for data misclassified as PS, Figure 4b.
Table 4. Confusion matrices obtained after majority voting (MV). Results are reported for two different strategies: (1) solving the classification problem using HMM based information only; (2) solving the problem using a SVM classifier. In the latter case, the contributions of HMM-based features only (2A), of time and frequency domain features only (2B) and of the full features set (2C) are evaluated separately. Each entry in the matrix corresponds to a subject. Post stroke (PS) subjects were reported twice, separating the two sides contributions. Correct classifications are in bold.
Classification Output
ELPSHD
1. HMM-based information (maximum log-likelihood)
Actual LabelEL7 (70%)0 (0%)3 (30%)
PS–not imp. side0 (0%)5 (33.3%)10 (66.7%)
PS–imp. side0 (0%)10 (66.7%)5 (33.3%)
HD1 (5.9%)0 (0%)16 (94.1%)
Overall accuracy 76.2% of subjects
2A. SVM classifier (HMM-based features only)
Actual LabelEL9 (90%)0 (0%)1 (10%)
PS–not imp. side1 (6.7%)13 (86.7%)1 (6.7%)
PS–imp. side0 (0%)15 (100%)0 (0%)
HD1 (5.9%)4 (23.5%)12 (70.6%)
Overall accuracy 85.7% of subjects
2B. SVM classifier (time and frequency domain features only)
Actual LabelEL8 (80%)0 (0%)2 (20%)
PS–not imp. side0 (0%)13 (86.7%)2 (13.3%)
PS–imp. side0 (0%)14 (93.3%)1 (6.7%)
HD3 (17.6%)0 (0%)14 (82.4%)
Overall accuracy 83.3% of subjects
2C. SVM classifier (all available features)
Actual labelEL9 (90%)1 (10%)0 (0%)
PS–not imp. side0 (0%)13 (86.7%)2 (13.3%)
PS–imp. side0 (0%)15 (100%)0 (0%)
HD0 (0%)2 (11.8%)15 (88.2%)
Overall accuracy 90.5% of subjects
Figure 4. Output of the classifier after MV in relation to clinical scales: (a) PS subjects (impaired side only), in relation to the FAC scale. No data were misclassified from the PS class to the EL class. Two subjects are misclassified from the PS class to the HD class; (b) HD subjects in relation to the HDRS’ scale. No data were misclassified from the HD class to the EL class. Two subjects were misclassified from the HD class to the PS class.
Sensors 16 00134 g004

4. Discussion

We proposed and validated a general probabilistic modeling approach based on IMU recordings for the classification of normal and pathological gaits (EL, HD and PS). The classification framework was defined through three major steps starting from a classification based on class-specific HMMs, then including the HMM likelihoods in a wider feature set to be classified using a SVM classifier, and finally cascading MV to summarize the results obtained.
The classification based on the maximum class-specific likelihood evaluation [38], was only partially successful to solve the classification problem (overall accuracy 66.7%). The significant bias toward the HD class could be related to the large inter- and intra- subject gait variabilities that characterize the PS group [44]. In fact, if the population analyzed is characterized by a highly variable and asymmetric gait, the internal consistency of the stance and swing phases duration is likely to be poor. This circumstance can reduce the efficacy of the specific models to capture a common signature that can describe the group as a whole.
The use of SVM classifiers improved the class separation thanks to their capability to define more complex decision boundaries. Results indicated that HMM-based and time/frequency domain features perform similarly when used separately, but they improve the final outcome when merged (up to 73.3%). An explanation could be that time and frequency domain features provide information about the gait variability that are somehow complementary to those contained in the HMM likelihoods.
Finally, the MV step summarized results by smoothing the effects of intra-subject variability, providing a high overall accuracy in terms of subjects classification up to 90.5%. In fact, the large variability observed during each trial is smoothed by taking into account a larger amount of trials. It is interesting to note that, despite of a similar accuracy, before applying the MV procedure, the outputs for HMM-based features are more distributed across classes than those obtained using time and frequency domain features only. As a result, the classification based on HMM features takes more advantage from the voting procedure. It is noted that the proposed MV strategy treats each vote equally. To improve the methodology we could modify the majority voting to a weighted majority voting approach in which each vote could be weighted based on the classification uncertainty, as estimated by, e.g., cascading a logistic regression to the SVM classifier [37,45]. However, as a first step in the development of the method, the voting approach in which each vote contributes equally was preferred and any refinement of the voting procedure is then left to future developments.
Looking at the few misclassifications between PS and HD in relation to the scores of the clinical scales (Figure 4), it is noted that two PS patients with a low level of impairment (FAC = 5) were assigned to the HD group when testing their not-impaired side, whereas two HD patients with severe gait impairments (HDRS’ = 6) were classified as PS. This is somehow an expected result; in fact, the patients with clinical scores at the extreme range of the specific reference population are more likely to be misclassified. In this regard, it is important to highlight that, because the proposed classification method focus on the gait alterations caused by the pathology and not on the pathology itself, pathology misclassifications are not to be considered necessarily as errors: altered gait patterns can be common to different pathologies and mild impairments may not affect significantly gait patterns. Hence, the direct application of the proposed methodology to different pathologies that affect gait would not be straightforward. The inclusion of additional pathological populations would require the definition of disorder-specific models.

5. Conclusions

The present methodology allowed to properly discriminate abnormal gait patterns using an SVM classifier, taking advantage of HMM derived information. The use of complementary features (HMM likelihoods and time-frequency domain features) along with an MV classification post-processing allowed for the improvement of the classification outcomes (overall accuracy 90.5%). The few incorrect classifications were found for those patients with clinical scores at the extreme range of the specific reference population. As a paradigm for testing the performance of the classification methodology, we selected two pathological populations—Huntington’s disease and post-stroke subjects and elderly as control group. However, it is important to highlight that the same general approach can be extended to the classification of other pathological populations after those specific validations are carried out. Future works will focus on this, by extending the vocabulary of recognized conditions, improving model complexity, including gait spatial and temporal parameters as classification features and by defining metrics for gait assessment based on the same wearable sensing sources and methodological approach.

Acknowledgments

The authors thank Andrea Ravaschio and Elisa Pelosin from the Department of Neuroscience, Rehabilitation, Ophthalmology, Genetics, Maternal and Child Health (DINOGMI) of the University of Genoa for the patients’ recruitment and data acquisition. This work was supported by the Italian Ministry of Education and Research (MIUR) through the project (PRIN) “A quantitative and multi-factorial approach for estimating and preventing the risk of falls in the elderly people.”

Author Contributions

Diana Trojaniello participated in the data acquisition and in the preparation of the dataset; Andrea Mannini, Diana Trojaniello and Angelo Maria Sabatini conceived the study; Andrea Mannini designed and performed the experiments; Andrea Mannini analyzed the data; Andrea Mannini and Andrea Cereatti wrote the paper. All authors read and approved the final manuscript.

Conflicts of Interest

The authors declare no conflict of interest. The founding sponsors had no role in the design of the study, in the collection, analyses, or interpretation of data, in the writing of the manuscript, and in the decision to publish the results.

References

  1. Bonato, P. Wearable sensors and systems. IEEE Eng. Med. Biol. Mag. 2010, 29, 25–36. [Google Scholar] [CrossRef] [PubMed]
  2. Aminian, K.; Trevisan, C.; Najafi, B.; Dejnabadi, H.; Frigo, C.; Pavan, E.; Telonio, A.; Cerati, F.; Marinoni, E.; Robert, P. Evaluation of an ambulatory system for gait analysis in hip osteoarthritis and after total hip replacement. Gait Post. 2004, 20, 102–107. [Google Scholar] [CrossRef]
  3. Long, J.D.; Paulsen, J.S.; Marder, K.; Zhang, Y.; Kim, J.I.; Mills, J.A. Tracking motor impairments in the progression of Huntington’s disease. Mov. Disord. 2014, 29, 311–319. [Google Scholar] [CrossRef] [PubMed]
  4. Giladi, N.; Horak, F.B.; Hausdorff, J.M. Classification of gait disturbances: Distinguishing between continuous and episodic changes. Mov. Disord. 2013, 28, 1469–1473. [Google Scholar] [CrossRef] [PubMed]
  5. Rueterbories, J.; Spaich, E.G.; Larsen, B.; Andersen, O.K. Methods for gait event detection and analysis in ambulatory systems. Med. Eng. Phys. 2010, 32, 545–552. [Google Scholar] [CrossRef] [PubMed]
  6. Troiano, R.P.; Berrigan, D.; Dodd, K.W.; Mâsse, L.C.; Tilert, T.; McDowell, M. Physical activity in the United States measured by accelerometer. Med. Sci. Sports Exerc. 2008, 40, 181–188. [Google Scholar] [CrossRef] [PubMed]
  7. Trojaniello, D.; Cereatti, A.; Pelosin, E.; Avanzino, L.; Mirelman, A.; Hausdorff, J.M.; Della, C.U. Estimation of step-by-step spatio-temporal parameters of normal and impaired gait using shank-mounted magneto-inertial sensors: Application to elderly, hemiparetic, parkinsonian and choreic gait. J. Neuroeng. Rehabil. 2014, 11, 152–160. [Google Scholar] [CrossRef] [PubMed]
  8. Mannini, A.; Sabatini, A.M. Gait phase detection and discrimination between walking-jogging activities using hidden Markov models applied to foot motion data from a gyroscope. Gait Post. 2012, 36, 657–661. [Google Scholar] [CrossRef] [PubMed]
  9. Pfau, T.; Ferrari, M.; Parsons, K.; Wilson, A. A hidden Markov model-based stride segmentation technique applied to equine inertial sensor trunk movement data. J. Biomech. 2008, 41, 216–220. [Google Scholar] [CrossRef] [PubMed]
  10. Taborri, J.; Rossi, S.; Palermo, E.; Patanè, F.; Cappa, P. A Novel HMM distributed classifier for the detection of gait phases by means of a wearable inertial sensor network. Sensors 2014, 14, 16212–16234. [Google Scholar] [CrossRef] [PubMed] [Green Version]
  11. Guenterberg, E.; Yang, A.Y.; Ghasemzadeh, H.; Jafari, R.; Bajcsy, R.; Sastry, S.S. A Method for Extracting Temporal Parameters Based on Hidden Markov Models in Body Sensor Networks with Inertial Sensors. IEEE Tran. Inf. Technol. Biomed. 2009, 13, 1019–1030. [Google Scholar] [CrossRef] [PubMed]
  12. Chen, M.; Huang, B.; Xu, Y. Human Abnormal Gait Modeling via Hidden Markov Model. In Proceedings of the International Conference on Information Acquisition (ICIA’07), Seogwipo-si, Korea, 8–11 July 2007; pp. 517–522.
  13. Bae, J.; Tomizuka, M. Gait phase analysis based on a Hidden Markov Model. Mechatronics 2011, 21, 961–970. [Google Scholar] [CrossRef]
  14. Abaid, N.; Cappa, P.; Palermo, E.; Petrarca, M.; Porfiri, M. Gait detection in children with and without hemiplegia using single-axis wearable gyroscopes. PLoS ONE 2013, 8, 731–752. [Google Scholar] [CrossRef] [PubMed]
  15. Mannini, A.; Trojaniello, D.; Della Croce, U.; Sabatini, A.M. Hidden Markov Model-Based Strategy for Gait Segmentation using Inertial Sensors: Application to Elderly, Hemiparetic Patients and Huntington’s Disease Patients. In Proceedings of the 37th Annual International Conference of the IEEE Engineering in Medicine and Biology Society, Milan, Italy, 25–29 August 2015; pp. 5179–5182.
  16. Mannini, A.; Sabatini, A.M. Walking speed estimation using foot-mounted inertial sensors: Comparing machine learning and strap-down integration methods. Med. Eng. Phys. 2014, 36, 1312–1321. [Google Scholar] [CrossRef] [PubMed]
  17. Bonnet, S.; Jallon, P. Hidden Markov Models Applied onto Gait Classification. In Proceedings of the 18th European Signal Processing Conference (EUSIPCO-2010), Aalborg, Denmark, 23–27 August 2010; pp. 929–933.
  18. Schlömer, T.; Poppinga, B.; Henze, N.; Boll, S. Gesture Recognition with a Wii Controller. In Proceedings of the 2nd International Conference on Tangible and Embedded Interaction, Bonn, Germany, 18–20 February 2008; pp. 11–14.
  19. Nickel, C.; Busch, C.; Rangarajan, S.; Mobius, M. Using Hidden Markov Models for Accelerometer-Based Biometric Gait Recognition. In Proceedings of the IEEE 7th International Colloquium on Signal Processing and its Applications (CSPA), Penang, Malaysia, 4–6 March 2011; pp. 58–63.
  20. Lakany, H. Extracting a diagnostic gait signature. Patt. Recogn. 2008, 41, 1627–1637. [Google Scholar] [CrossRef]
  21. Begg, R.K.; Palaniswami, M.; Owen, B. Support vector machines for automated gait classification. IEEE Trans. Biomed. Eng. 2005, 52, 828–838. [Google Scholar] [CrossRef] [PubMed]
  22. Pogorelc, B.; Bosnić, Z.; Gams, M. Automatic recognition of gait-related health problems in the elderly using machine learning. Multimedia Tools Appl. 2012, 58, 333–354. [Google Scholar] [CrossRef]
  23. Mannini, A.; Sabatini, A.M. Machine Learning Methods for Classifying Human Physical Activity from On-Body Accelerometers. Sensors 2010, 10, 1154–1175. [Google Scholar] [CrossRef] [PubMed]
  24. Chen, G.; Patten, C.; Kothari, D.H.; Zajac, F.E. Gait differences between individuals with post-stroke hemiparesis and non-disabled controls at matched speeds. Gait Post. 2005, 22, 51–56. [Google Scholar] [CrossRef] [PubMed]
  25. Koller, W.C.; Trimble, J. The gait abnormality of Huntington’s disease. Neurology 1985, 35, 1450–1450. [Google Scholar] [CrossRef] [PubMed]
  26. Yang, S.; Zhang, J.-T.; Novak, A.C.; Brouwer, B.; Li, Q. Estimation of spatio-temporal parameters for post-stroke hemiparetic gait using inertial sensors. Gait Post. 2013, 37, 354–358. [Google Scholar] [CrossRef] [PubMed]
  27. Rao, A.K.; Quinn, L.; Marder, K.S. Reliability of spatiotemporal gait outcome measures in Huntington’s disease. Mov. Disord. 2005, 20, 1033–1037. [Google Scholar] [CrossRef] [PubMed]
  28. Dalton, A.; Khalil, H.; Busse, M.; Rosser, A.; van Deursen, R.; ÓLaighin, G. Analysis of gait and balance through a single triaxial accelerometer in presymptomatic and symptomatic Huntington’s disease. Gait Post. 2013, 37, 49–54. [Google Scholar] [CrossRef] [PubMed]
  29. Holden, M.K.; Gill, K.M.; Magliozzi, M.R.; Nathan, J.; Piehl-Baker, L. Clinical gait assessment in the neurologically impaired reliability and meaningfulness. Phys. Ther. 1984, 64, 35–40. [Google Scholar] [PubMed]
  30. Kremer, H.; Group, H.S. Unified Huntington’s disease rating scale: Reliability and consistency. Mov. Disord. 1996, 11, 136–142. [Google Scholar]
  31. Palermo, E.; Rossi, S.; Marini, F.; Patanè, F.; Cappa, P. Experimental evaluation of accuracy and repeatability of a novel body-to-sensor calibration procedure for inertial sensor-based gait analysis. Measurement 2014, 52, 145–155. [Google Scholar] [CrossRef]
  32. Picerno, P.; Cereatti, A.; Cappozzo, A. A spot check for assessing static orientation consistency of inertial and magnetic sensing units. Gait Post. 2011, 33, 373–378. [Google Scholar] [CrossRef] [PubMed]
  33. Picerno, P.; Cereatti, A.; Cappozzo, A. Joint kinematics estimate using wearable inertial and magnetic sensing modules. Gait Post. 2008, 28, 588–595. [Google Scholar] [CrossRef] [PubMed]
  34. Favre, J.; Aissaoui, R.; Jolles, B.; de Guise, J.; Aminian, K. Functional calibration procedure for 3D knee joint angle description using inertial sensors. J. Biomech. 2009, 42, 2330–2335. [Google Scholar] [CrossRef] [PubMed]
  35. Esterman, M.; Tamber-Rosenau, B.J.; Chiu, Y.-C.; Yantis, S. Avoiding non-independence in fMRI data analysis: Leave one subject out. NeuroImage 2010, 50, 572–576. [Google Scholar] [CrossRef] [PubMed]
  36. Mannini, A.; Genovese, V.; Sabatini, A.M. Online Decoding of Hidden Markov Models for Gait Event Detection Using Foot-Mounted Gyroscopes. IEEE J. Biomed. Health Inf. 2014, 18, 1122–1130. [Google Scholar] [CrossRef] [PubMed]
  37. Mannini, A.; Sabatini, A.M. A smartphone-centered wearable sensor network for fall risk assessment in the elderly. In Proceedings of the 10th EAI International Conference on Body Area Networks, Sydney, Australia, 28–30 September 2015; pp. 471–483.
  38. Rabiner, L.R. A tutorial on HMM and selected applications inspeech recognition. IEEE Proc. 1989, 77, 257–286. [Google Scholar] [CrossRef]
  39. Mannini, A.; Sabatini, A.M. Accelerometry-based classification of human activities using Markov modeling. Comput. Intell. Neurosci. 2011, 2011, 647–658. [Google Scholar] [CrossRef] [PubMed]
  40. Vapnik, V. The Nature of Statistical Learning Theory; Springer-Verlag: New York, NY, USA, 2000. [Google Scholar]
  41. Chang, C.-C.; Lin, C.-J. LIBSVM: A library for support vector machines. ACM Trans. Intell. Syst. Technol. 2011, 2, 1–27. [Google Scholar] [CrossRef]
  42. Mannini, A.; Intille, S.S.; Rosenberger, M.; Sabatini, A.M.; Haskell, W. Activity recognition using a single accelerometer placed at the wrist or ankle. Med. Sci. Sports Exerc. 2013, 45, 2193–2203. [Google Scholar] [CrossRef] [PubMed]
  43. Jain, A.K.; Duin, R.P.W.; Mao, J. Statistical pattern recognition: A review. IEEE Trans. Patt. Anal. Mach. Intell. 2000, 22, 4–37. [Google Scholar] [CrossRef]
  44. Balasubramanian, C.K.; Neptune, R.R.; Kautz, S.A. Variability in spatiotemporal step characteristics and its relationship to walking performance post-stroke. Gait Post. 2009, 29, 408–414. [Google Scholar] [CrossRef] [PubMed]
  45. Mannini, A.; Sabatini, A.M.; Intille, S.S. Accelerometry-based recognition of the placement sites of a wearable sensor. Pervas. Mobile Comput. 2015, 21, 62–74. [Google Scholar] [CrossRef] [PubMed]

