Figure 3.
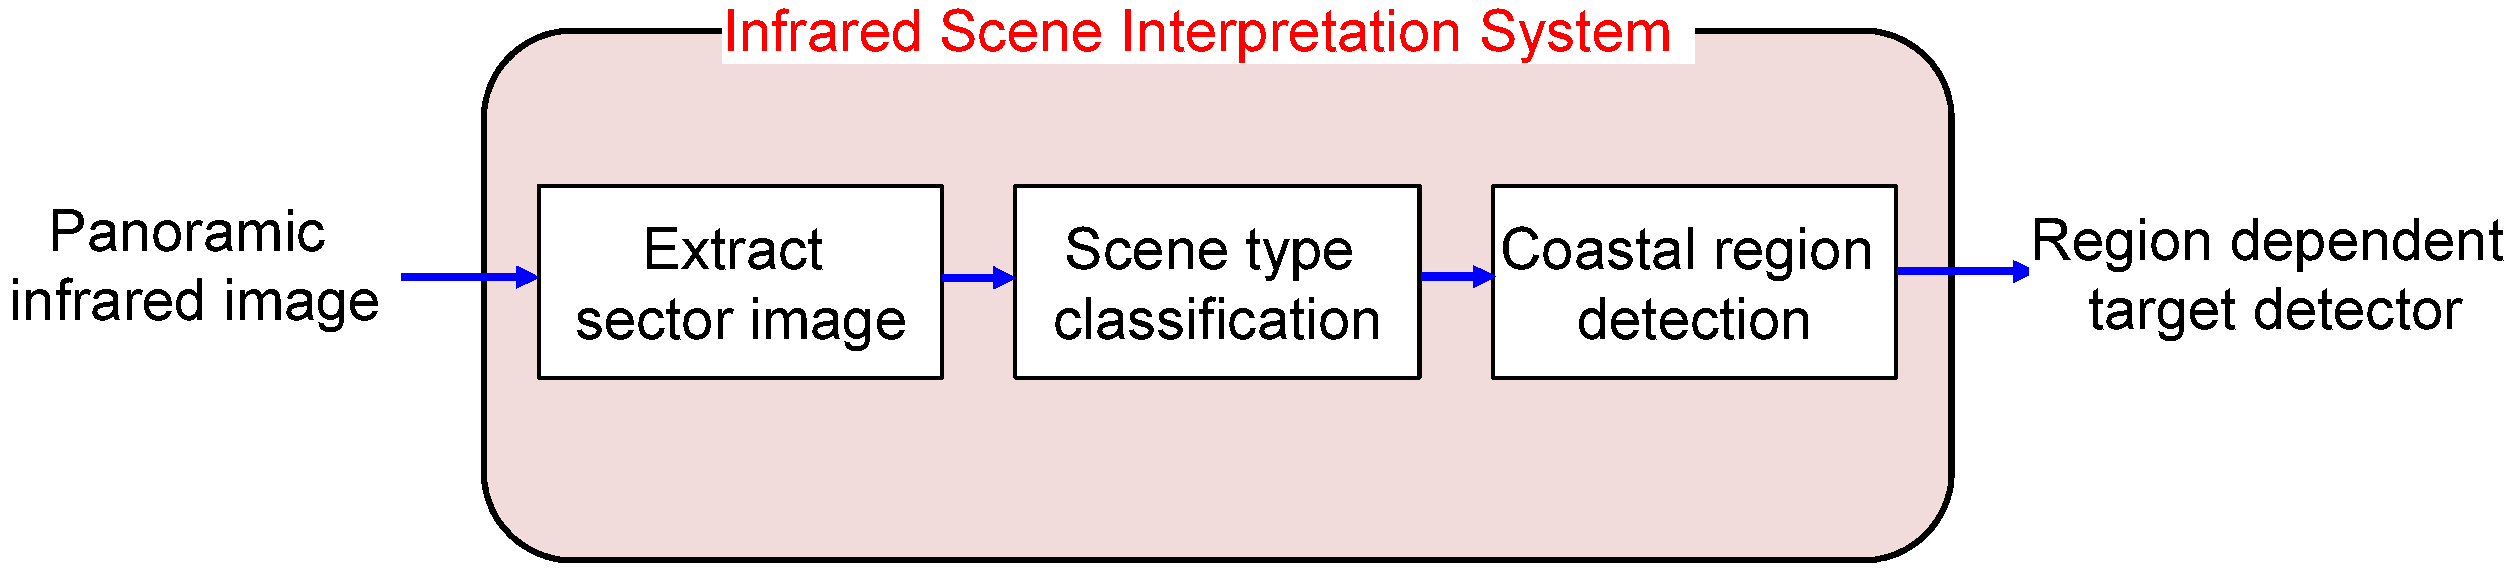
Proposed infrared scene interpretation system.
2.1. Properties of the Sea-Based IRST Background
Sea-based IRST background images should be observed and analyzed carefully to obtain important domain knowledge.
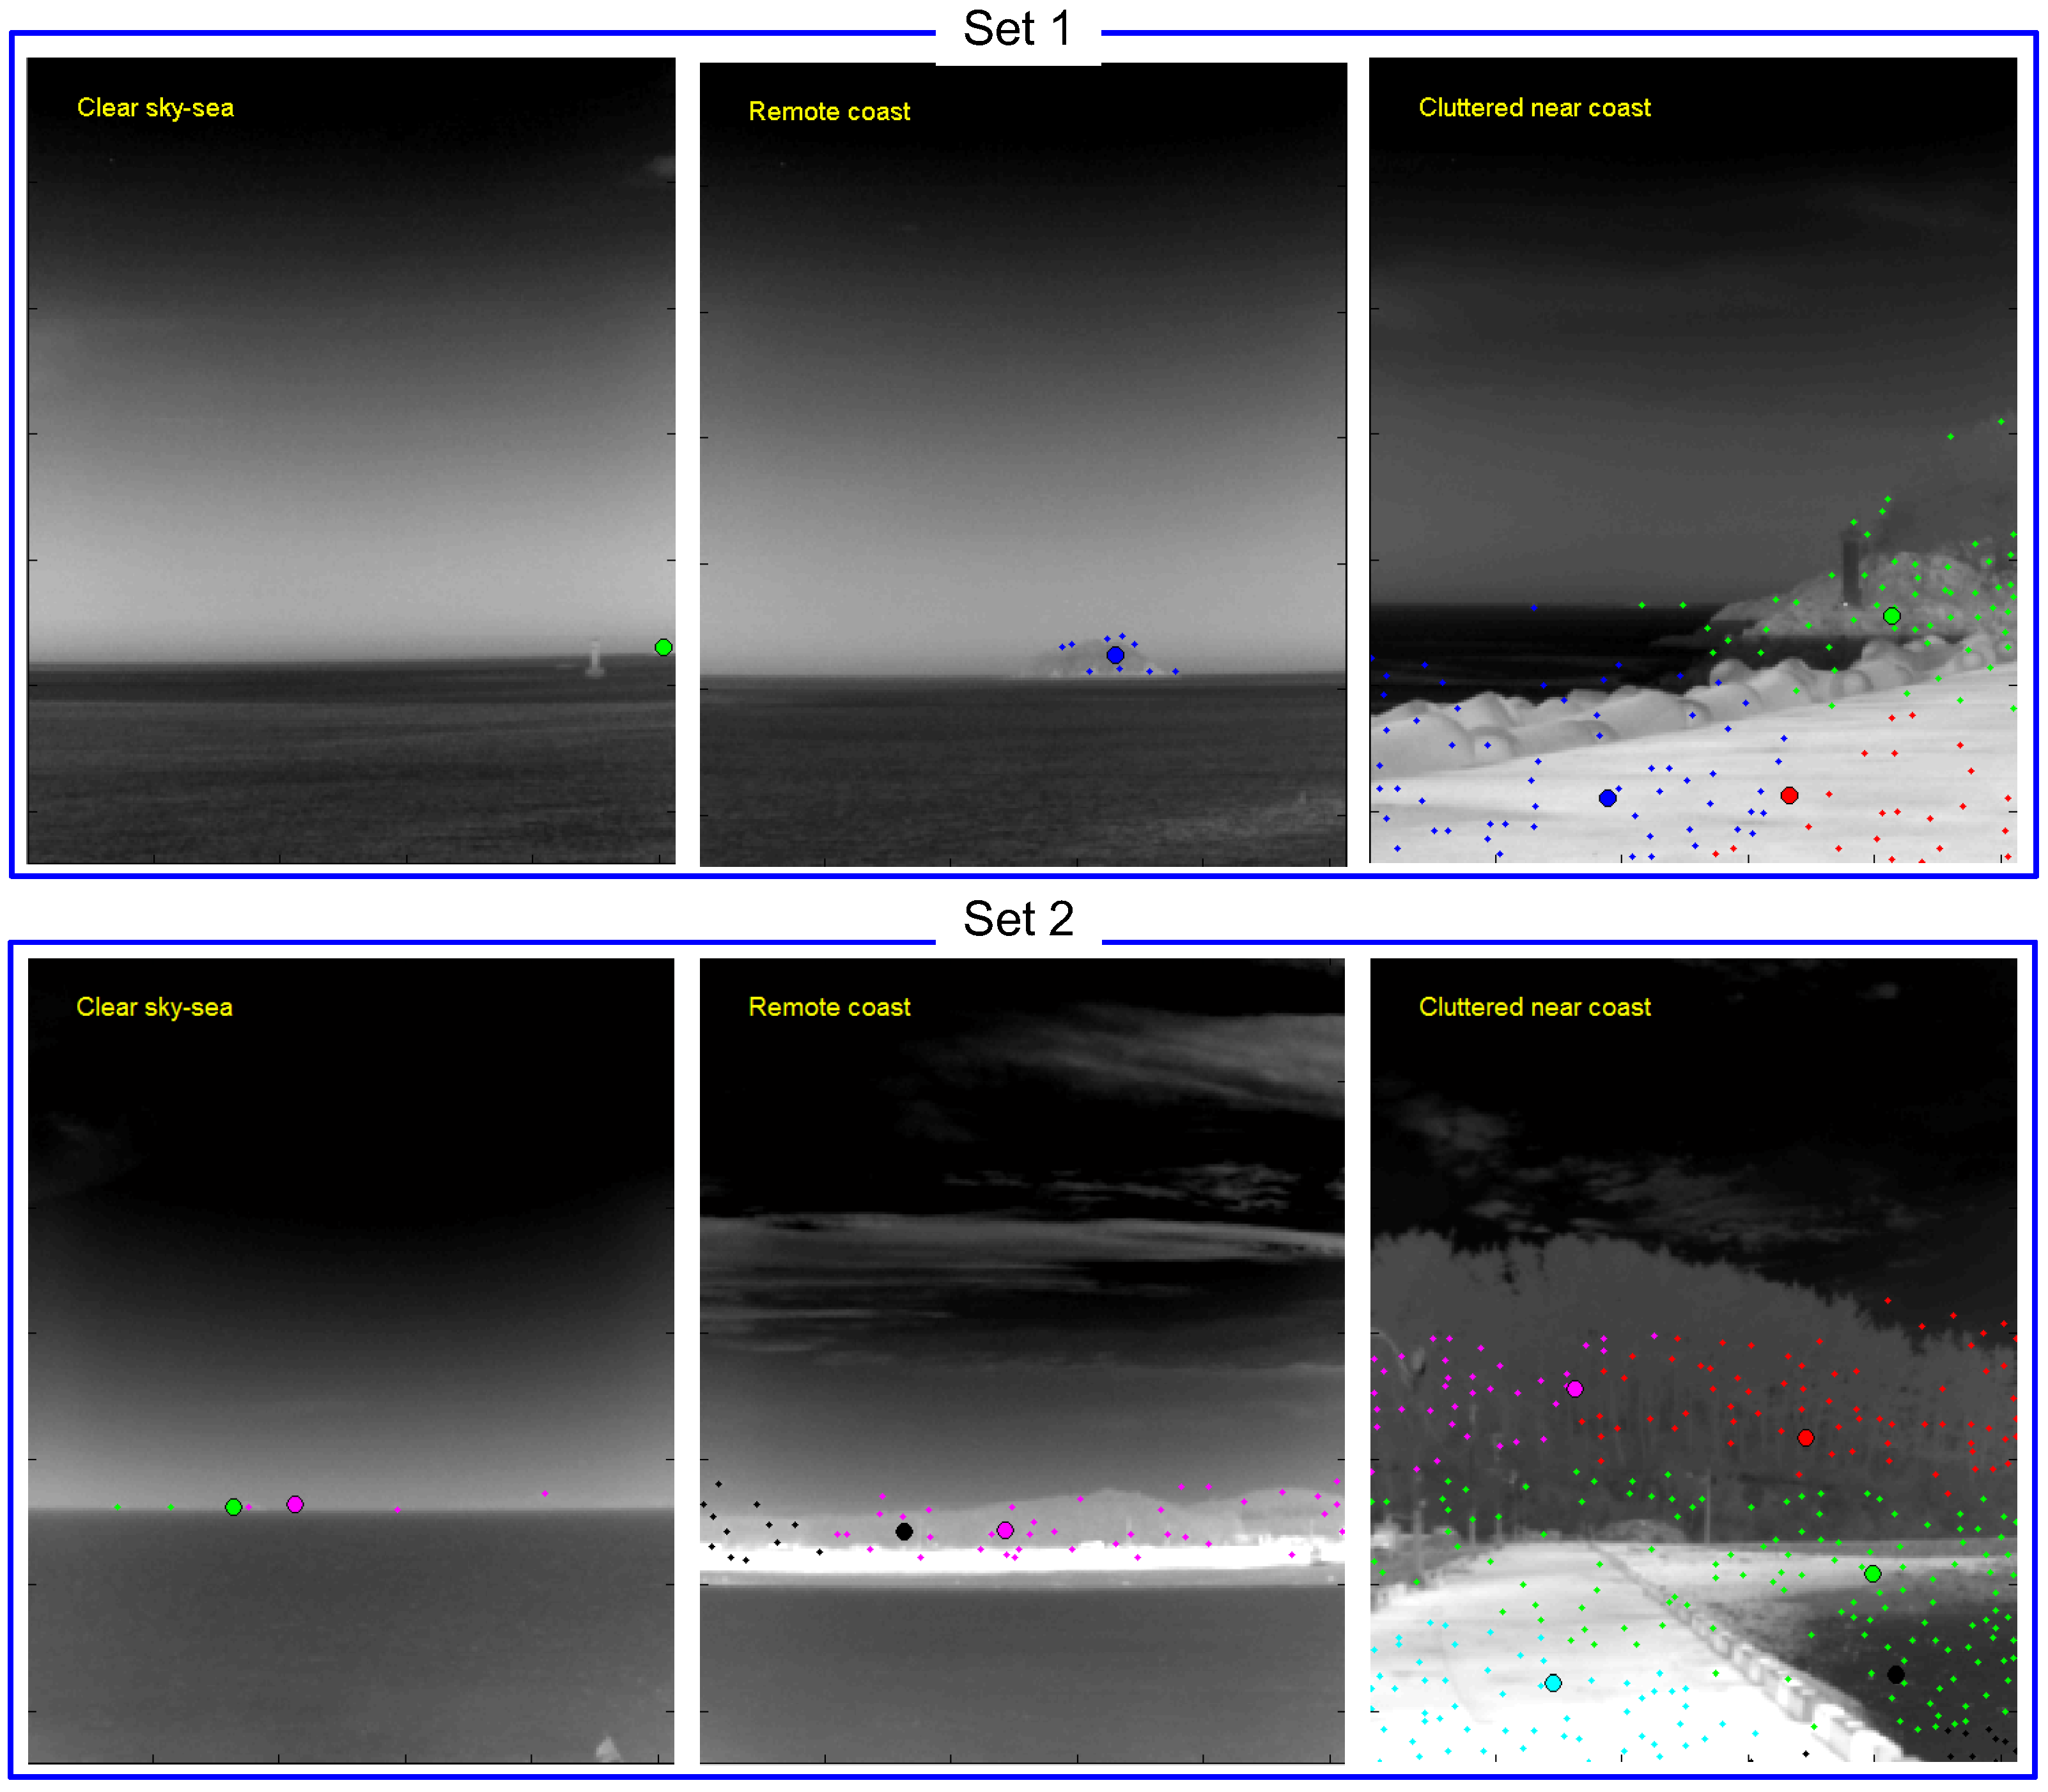
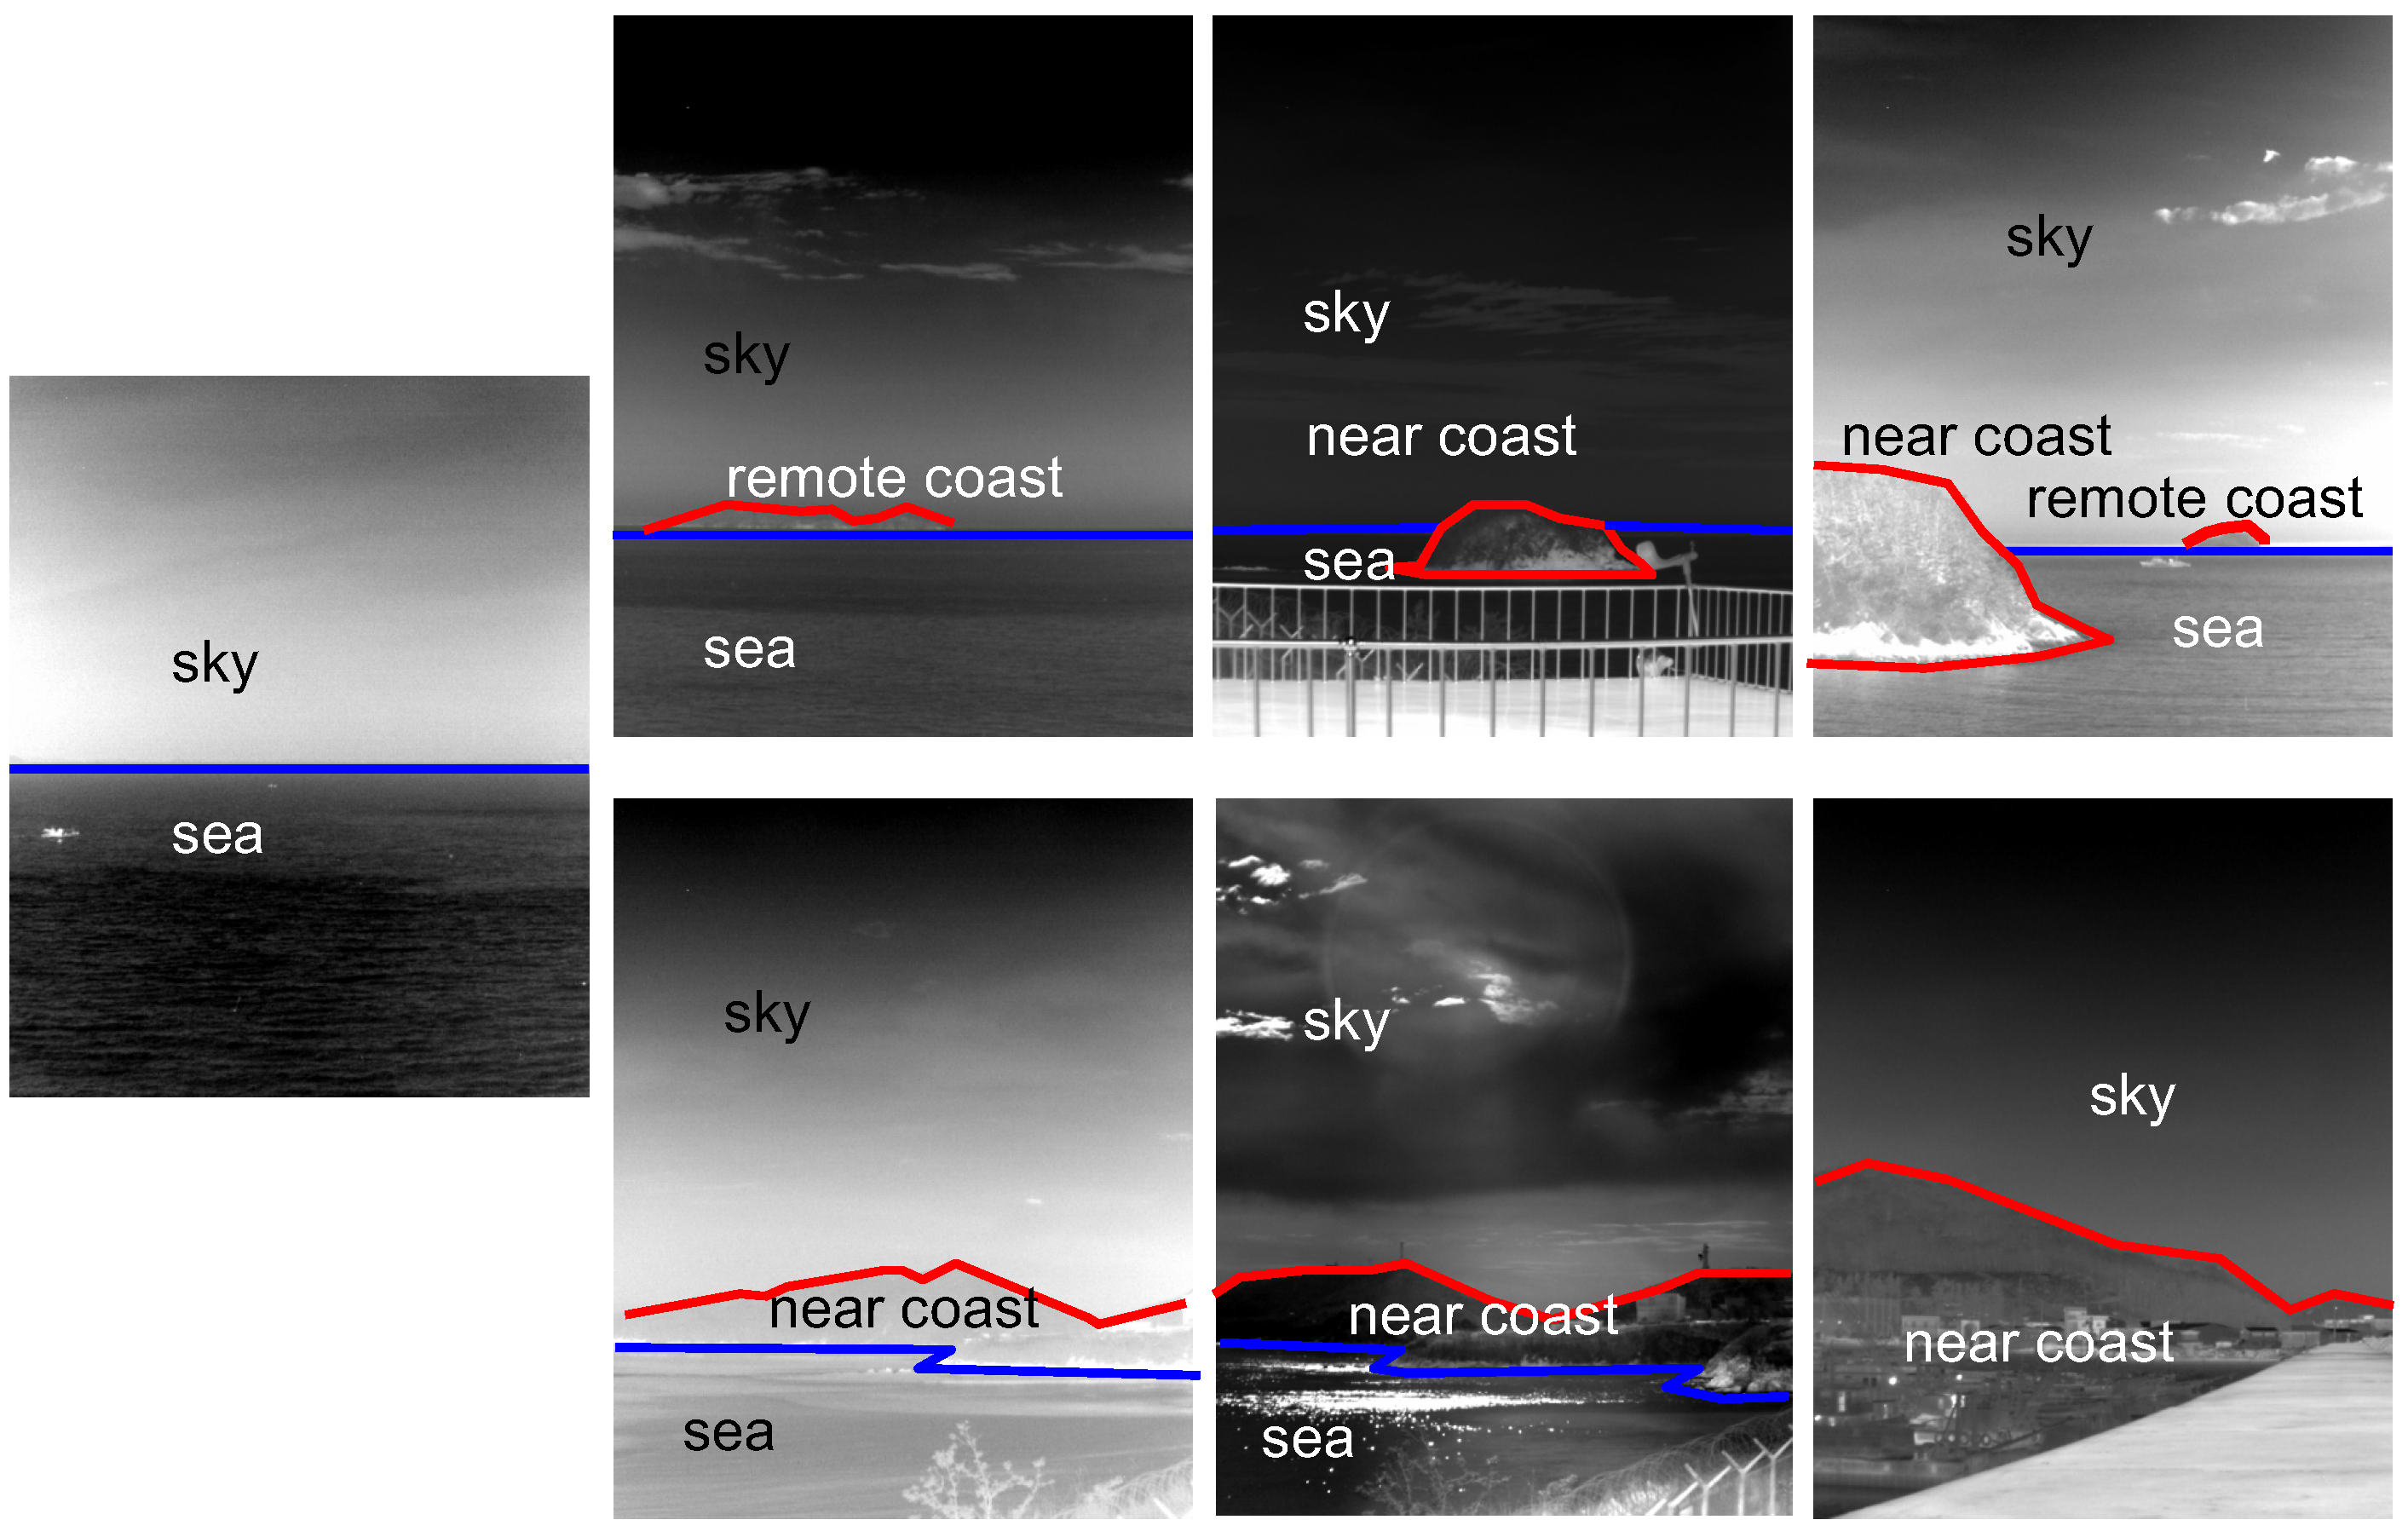
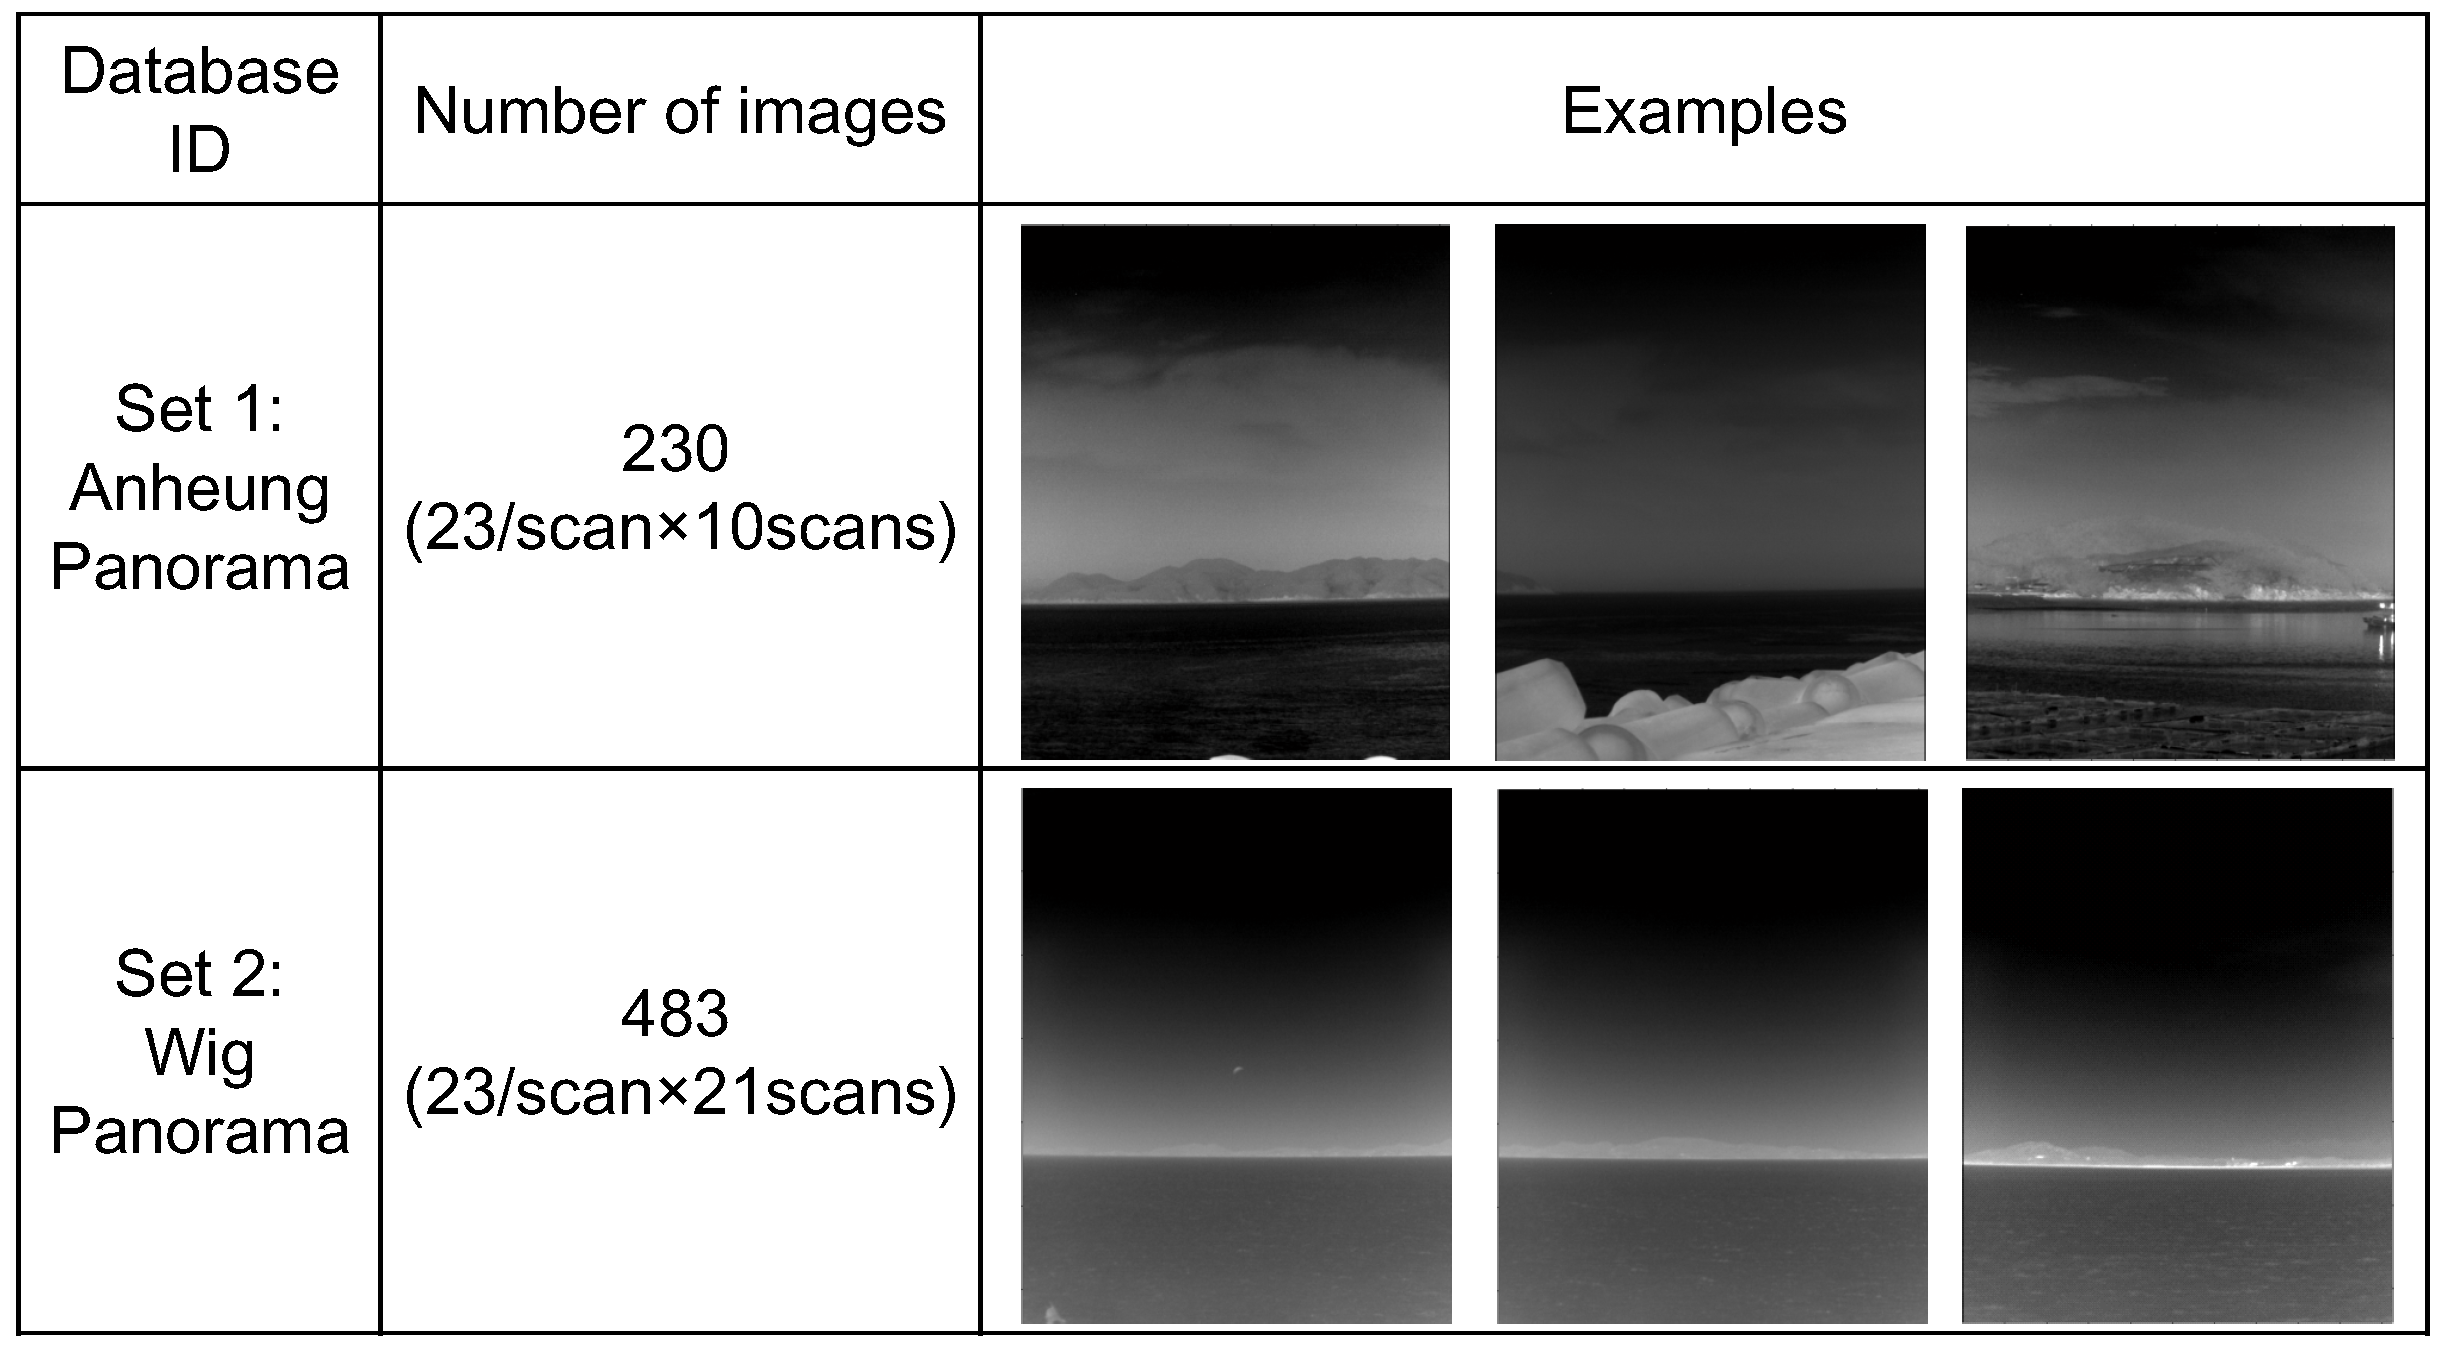
Figure 4 shows representative images used in the sea-based IRST system. Most of the background consists of a sky-sea region, sky-coast-sea or sky-near coast. Direct observations lead to three properties.
The shapes of the sky, coast and sea regions are wide, because the imaging view point is slanted.
The order of the background is predictable, such as sky-sea, sky-coast-sea and sky-coast. The reverse order is not permitted.
A lower coast region generally occludes other remote regions due to the geometry of the camera projection.
Figure 4.
Proposed infrared scene interpretation system.
Figure 4.
Proposed infrared scene interpretation system.
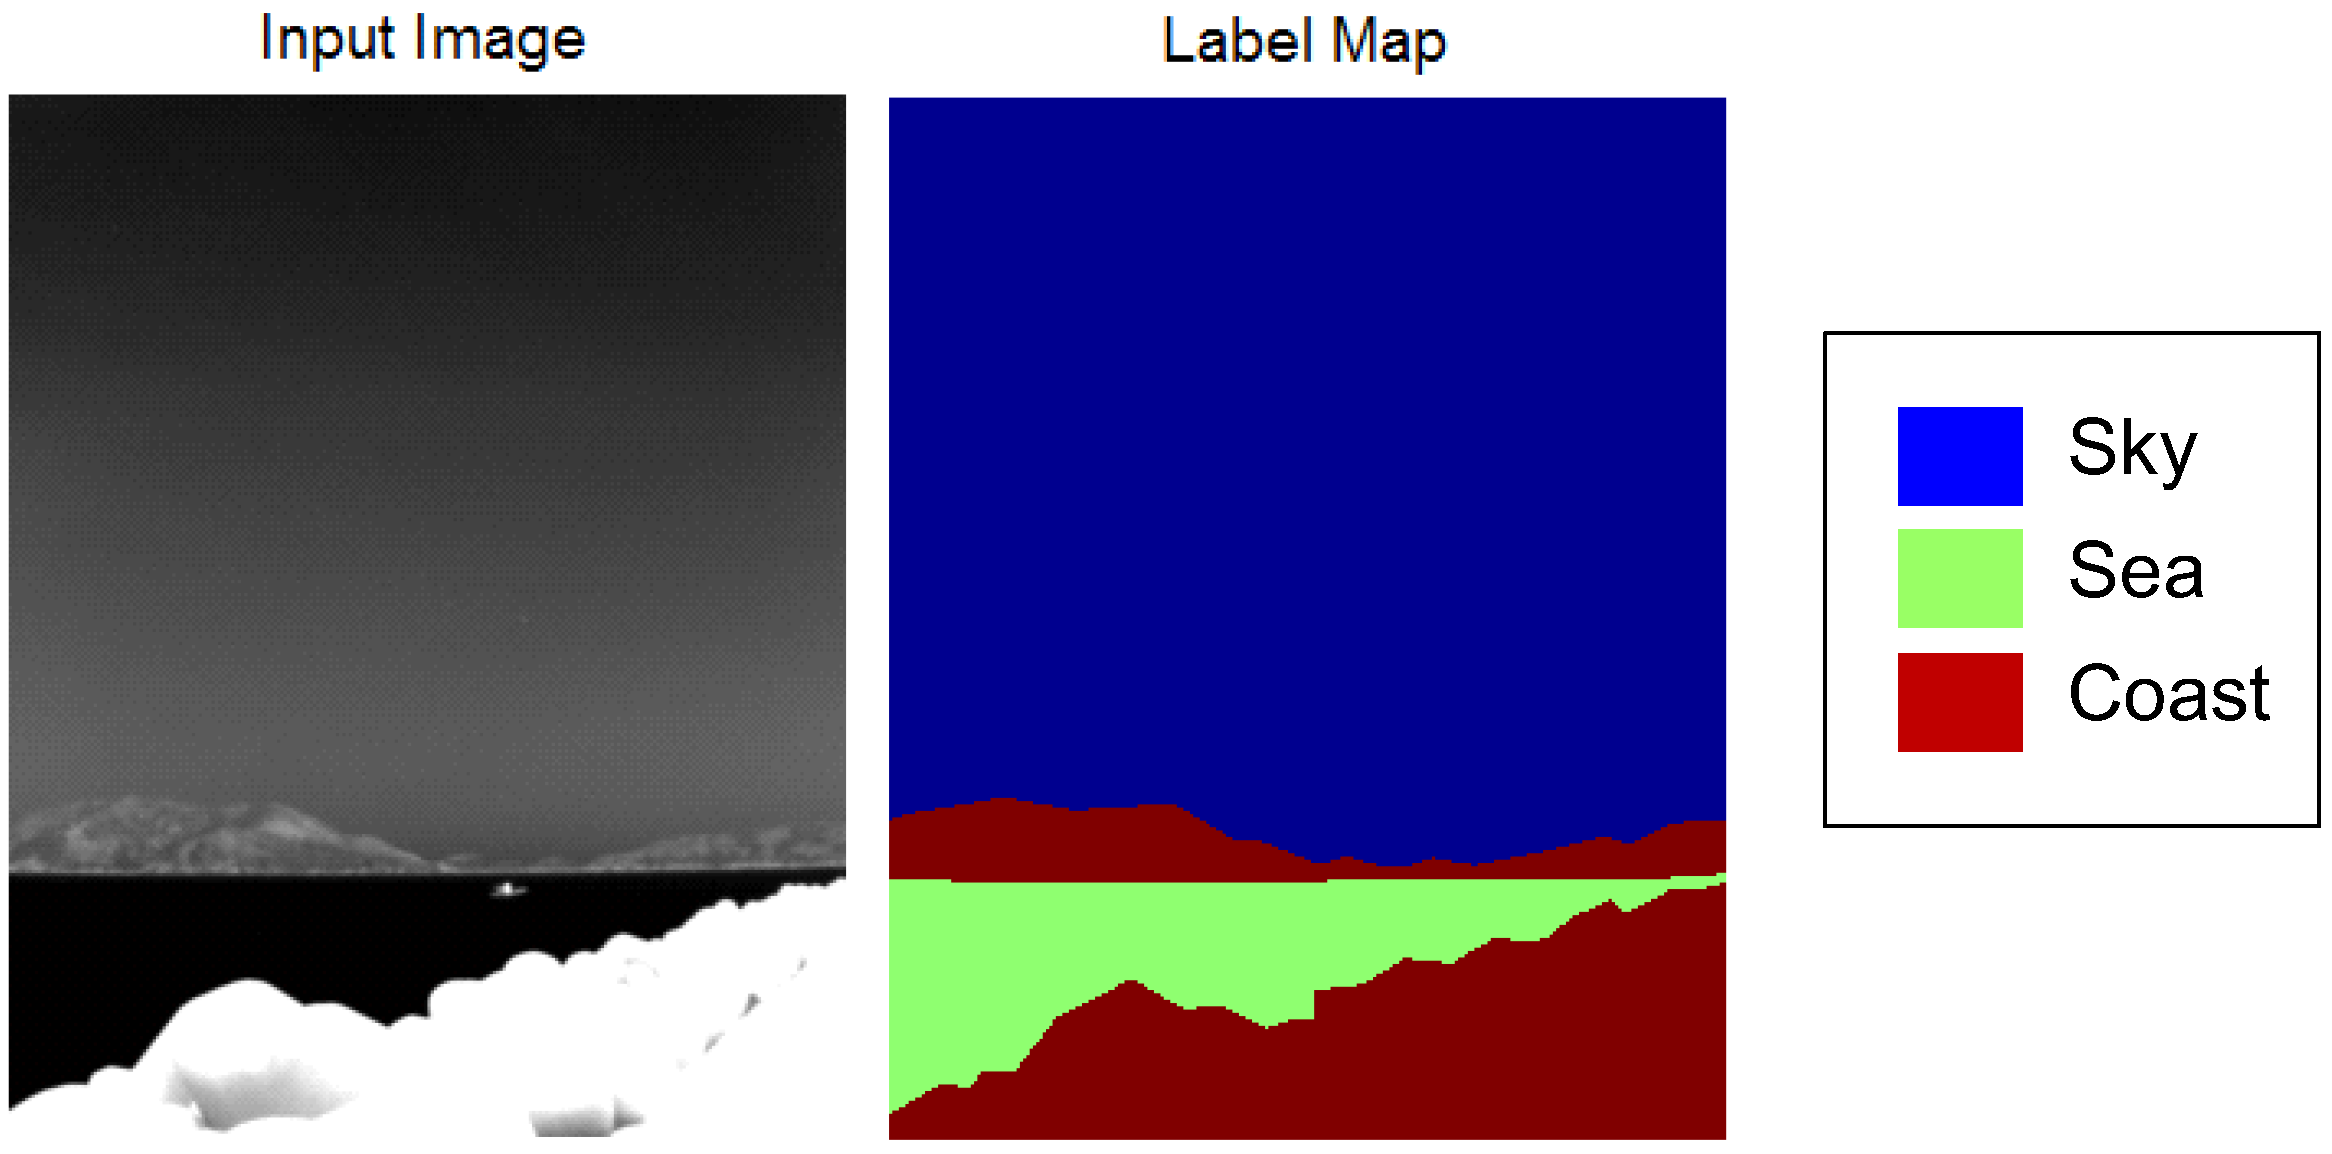
The next inspection is based on quantitative measurements of the temperature and texture distributions. Forty-one infrared background images were prepared and labeled.
Figure 5 provides an example of an infrared background image and the corresponding label map consisting of sky, sea and coast regions.
Figure 5.
Example of the prepared test DB for a quantitative inspection.
Figure 5.
Example of the prepared test DB for a quantitative inspection.
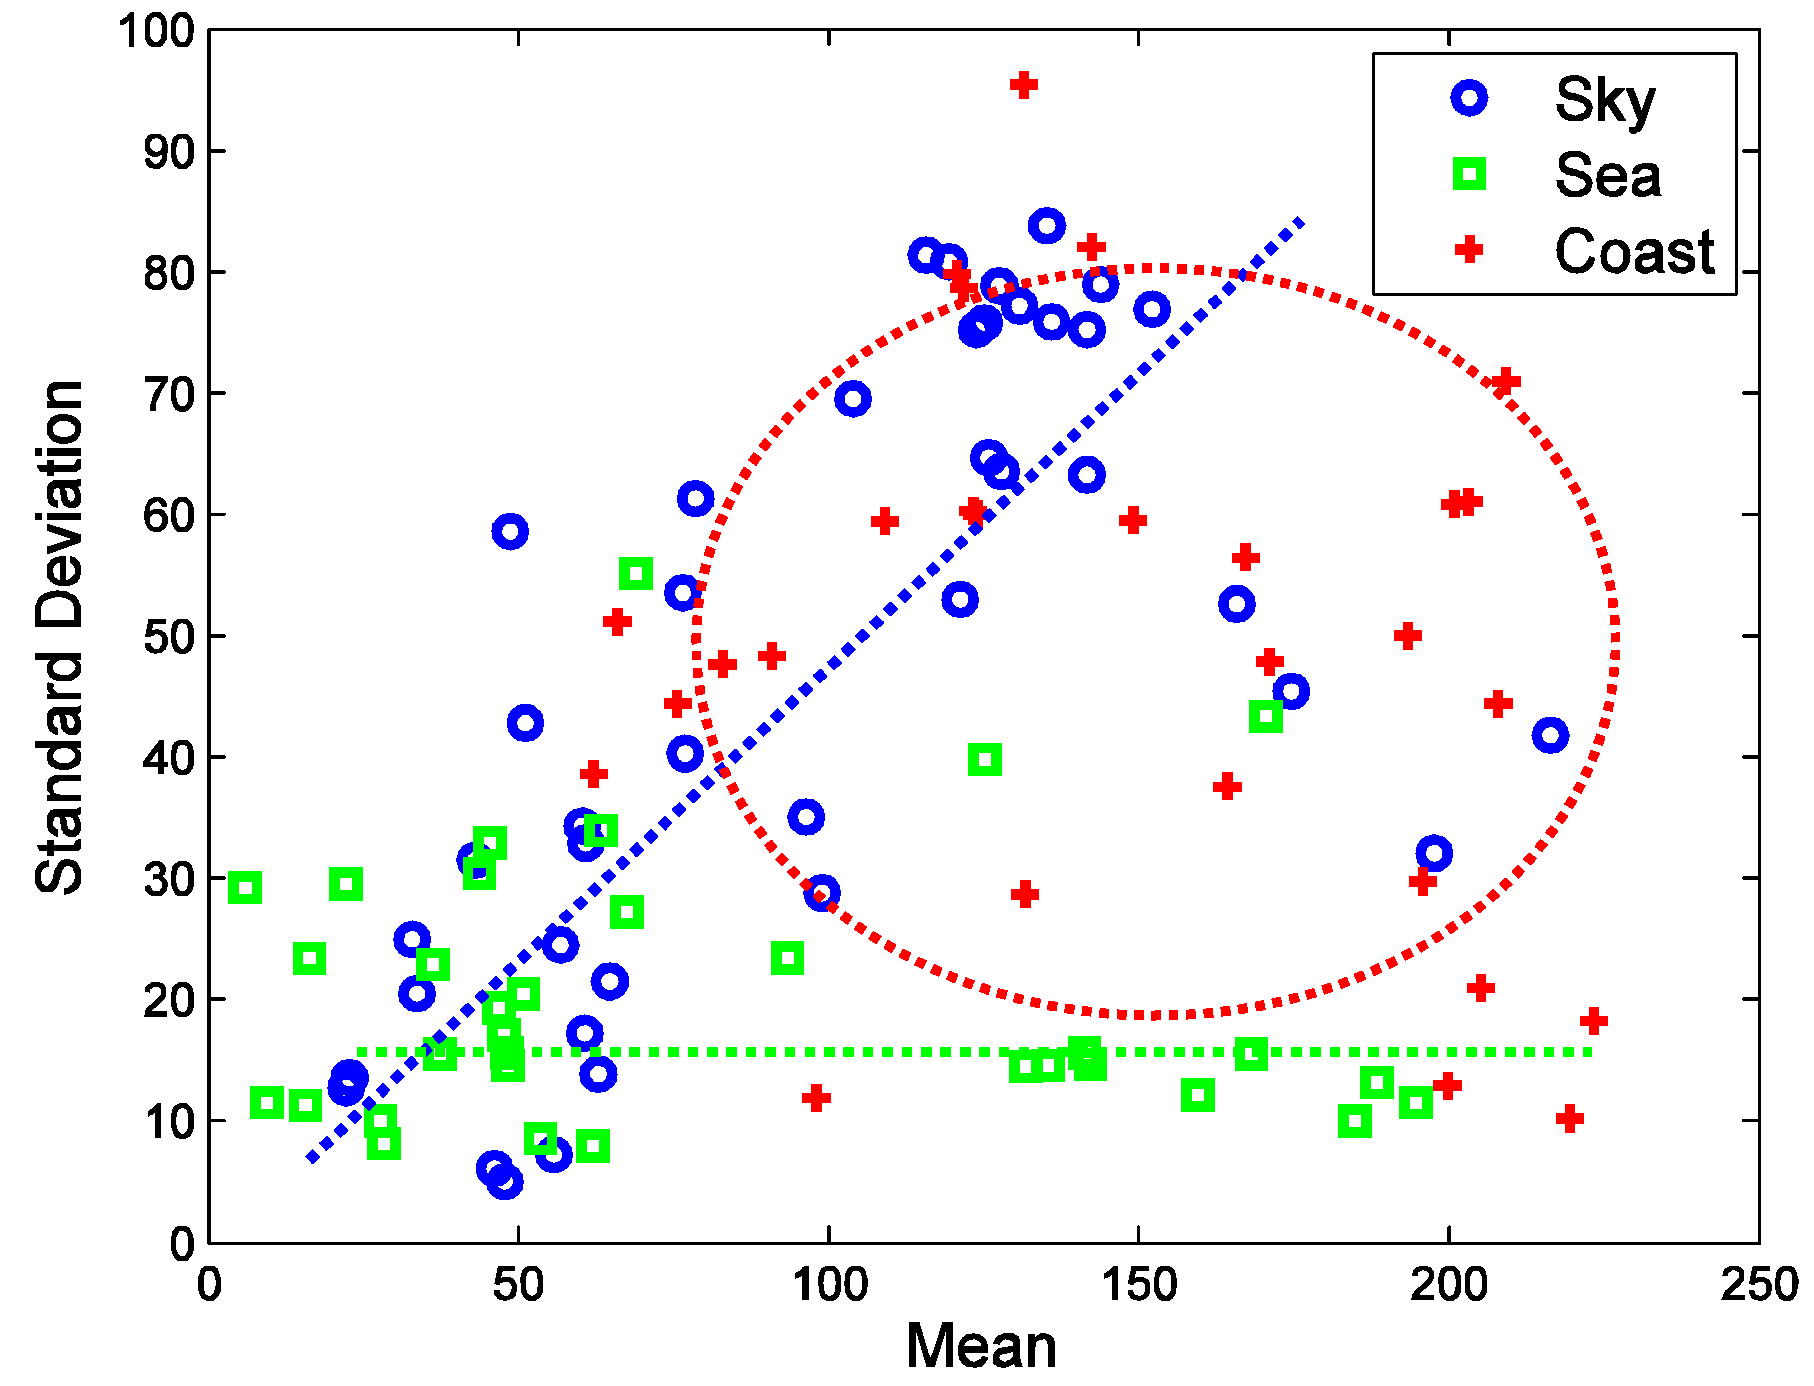
Figure 6 summarizes the distribution of the thermal average intensity and standard deviation. The sky region shows a wide thermal average intensity with a relatively low standard deviation. On the other hand, the sky region shows a proportional relationship between thermal intensity and the standard deviation. This originates from clear sky and warm clouds. Clear sky has a very low temperature with a low standard deviation. Warm clouds have a high temperature and a high standard deviation around the cloud edge. The coast region does not have any correlation between the thermal average intensity and the standard deviation. The coast region normally has a wide intensity and a wide standard deviation owing to its complex nature.
Figure 6.
Distribution of the thermal average intensity and standard deviation for each region.
Figure 6.
Distribution of the thermal average intensity and standard deviation for each region.
A quantitative inspection of the thermal texture can be estimated from the gray level co-occurrence matrix (GLCM) proposed by Blanton and Barner [
23]. The GLCM (
) can be obtained by counting (
) the neighboring pixels with the specific gray values (
) in a probing image. The representative texture features are contrast, correlation, homogeneity and entropy [
23].
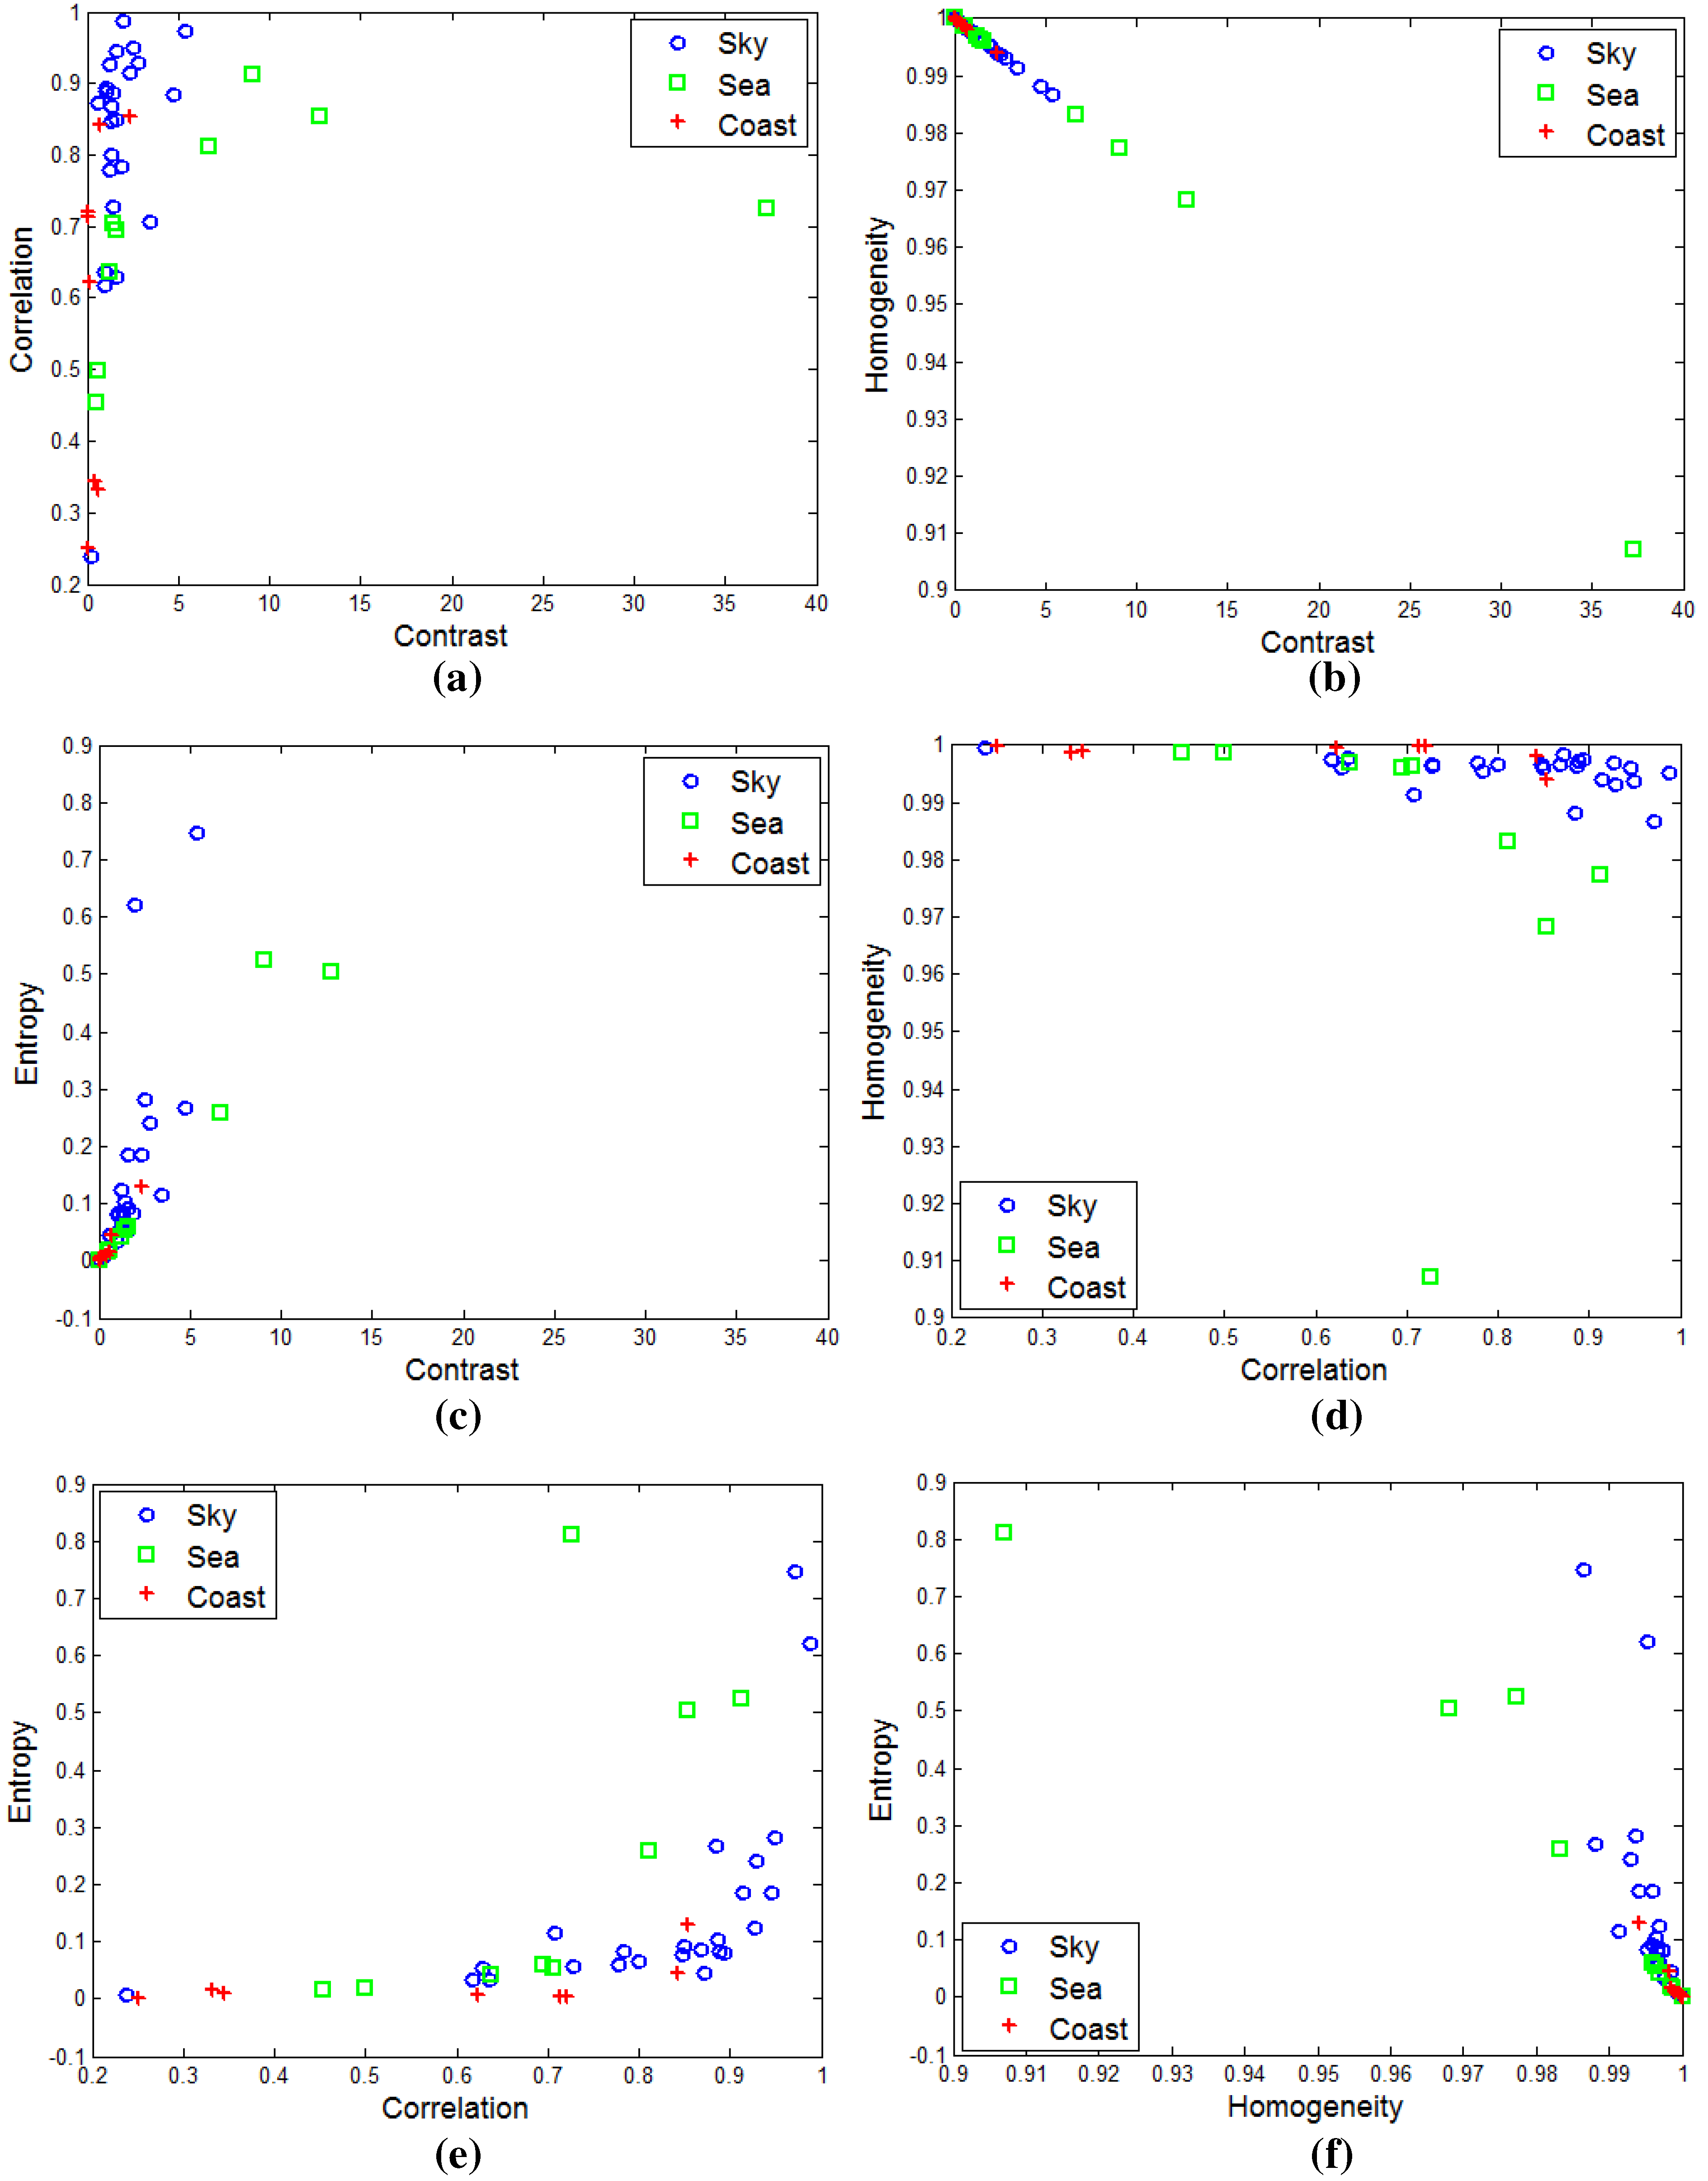
Figure 7 shows the distribution of the GLCM-based texture using different tools for the sky, sea and coastal regions. The sea-based IRST images show no distinctive texture features. Most distributions are mixed and concentrated on the corners. Therefore, texture-based infrared image segmentation is not a suitable approach.
2.2. Infrared Background Type Classification
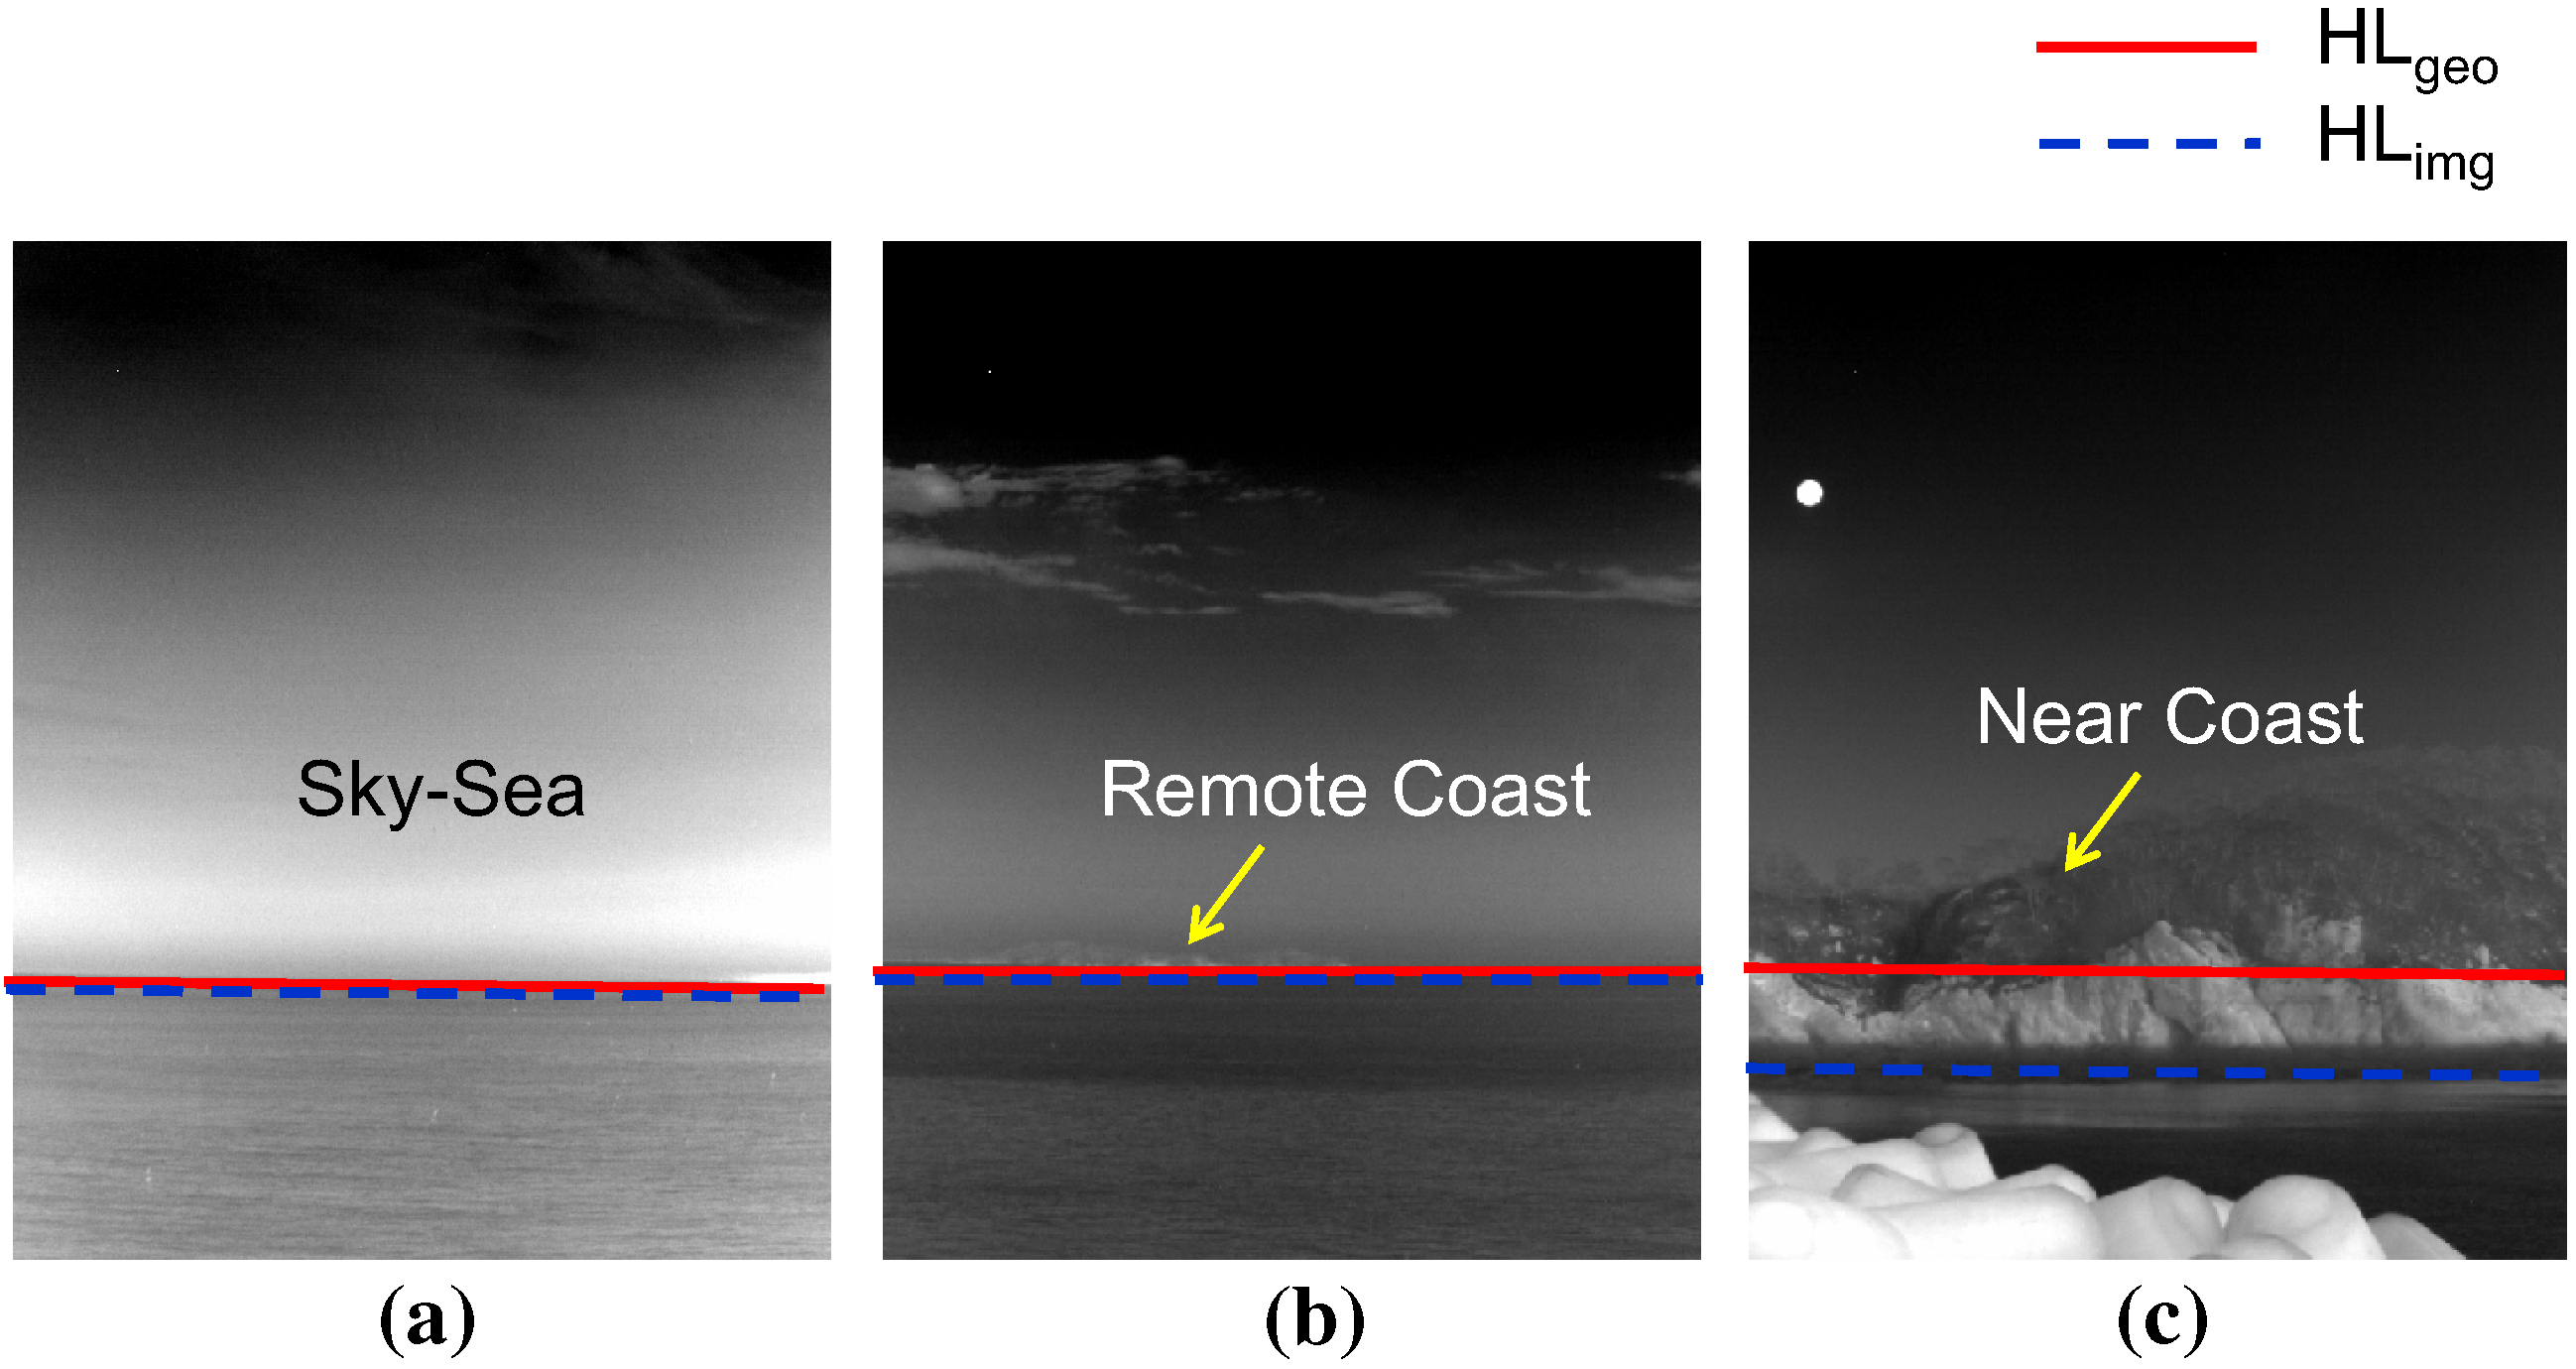
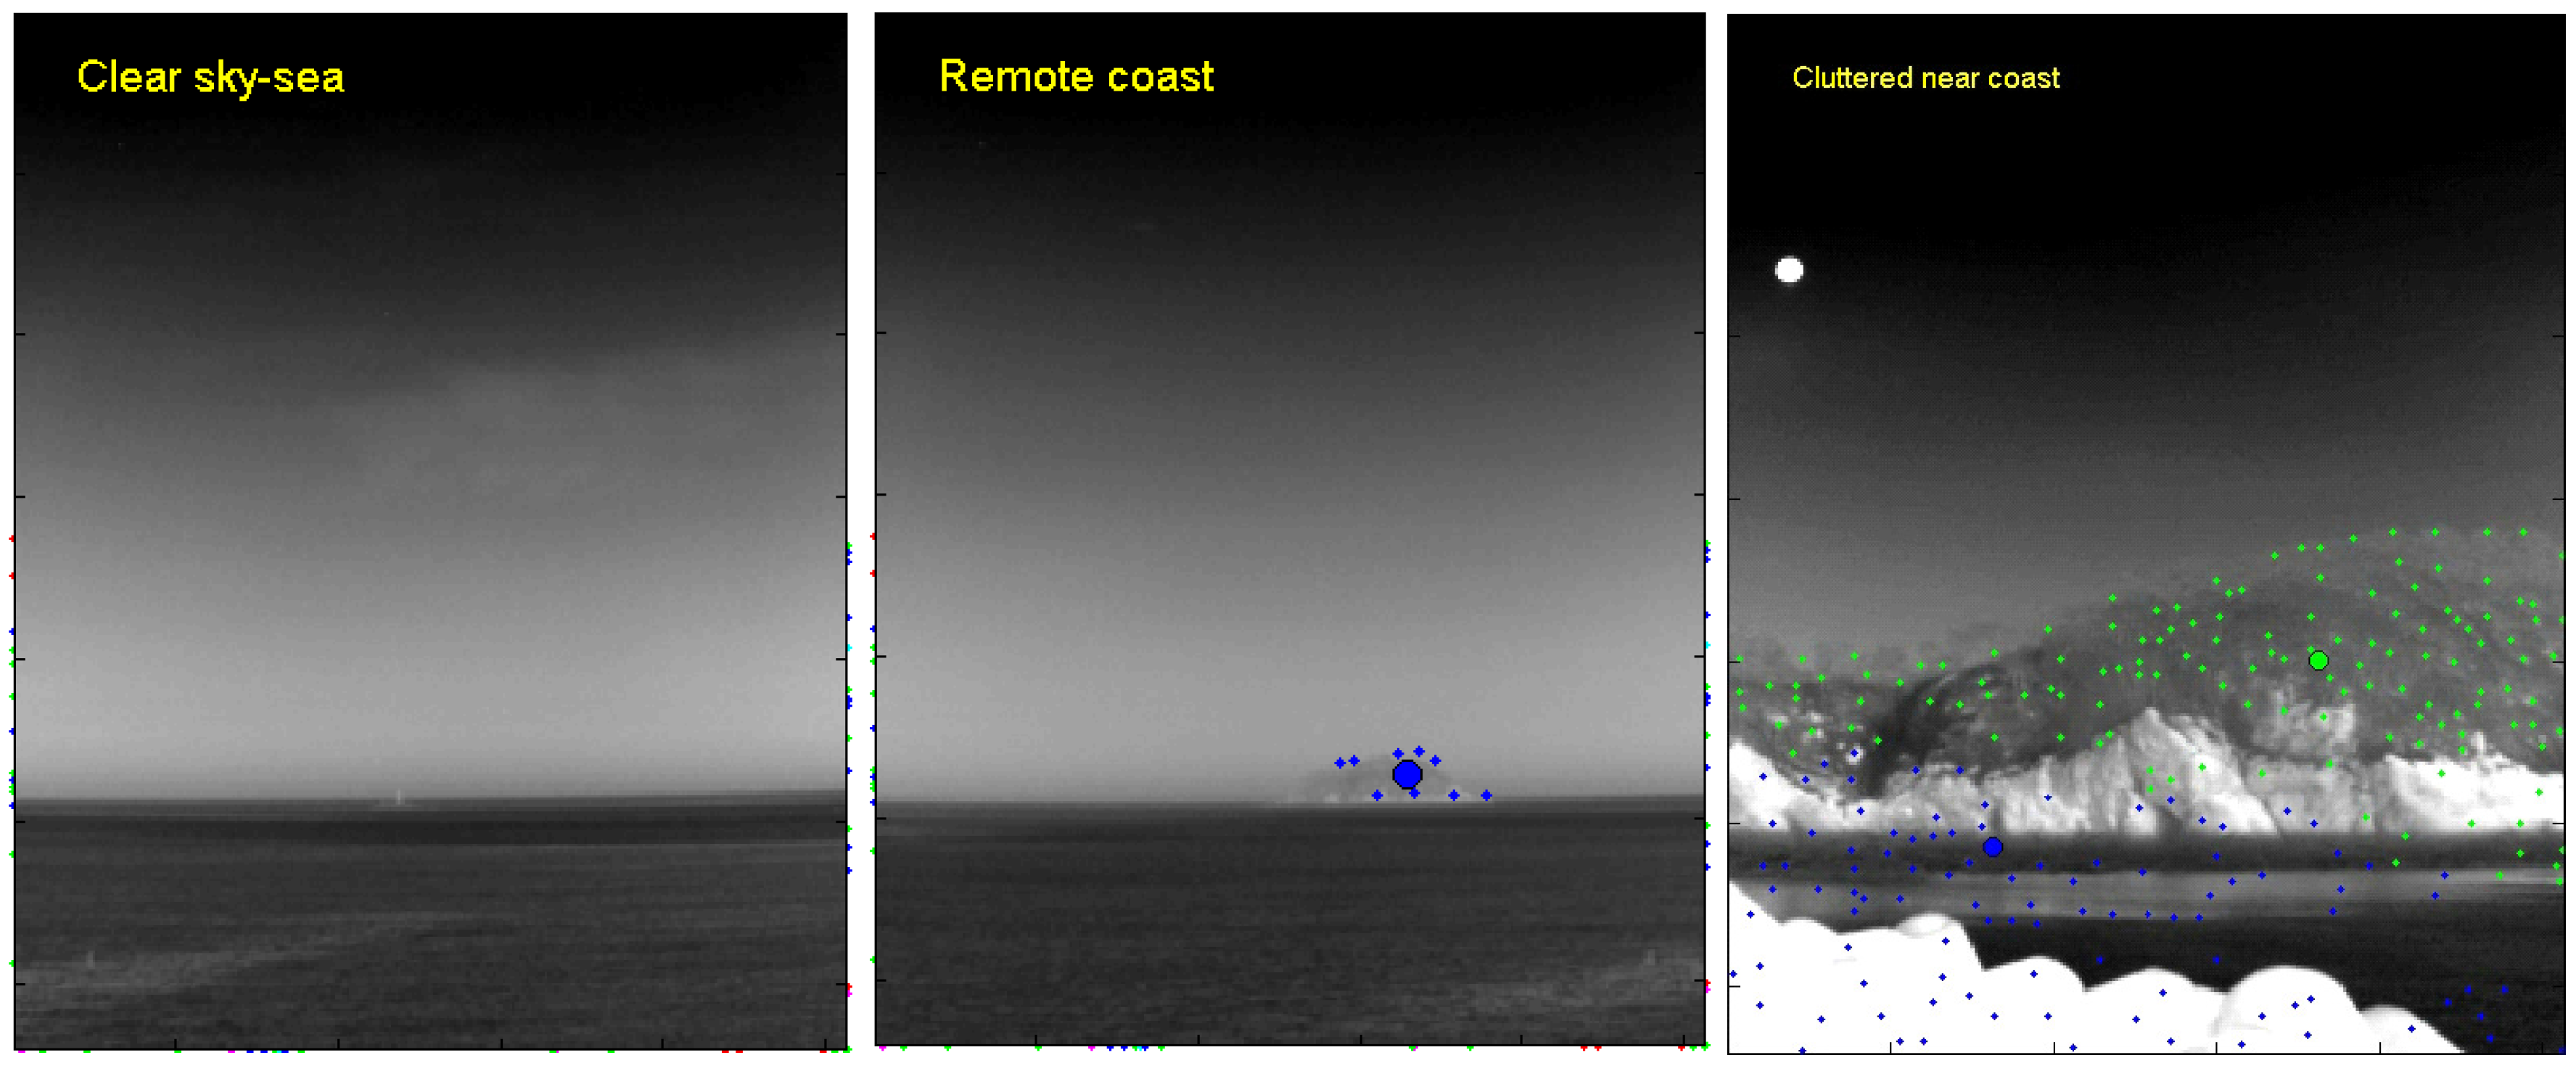
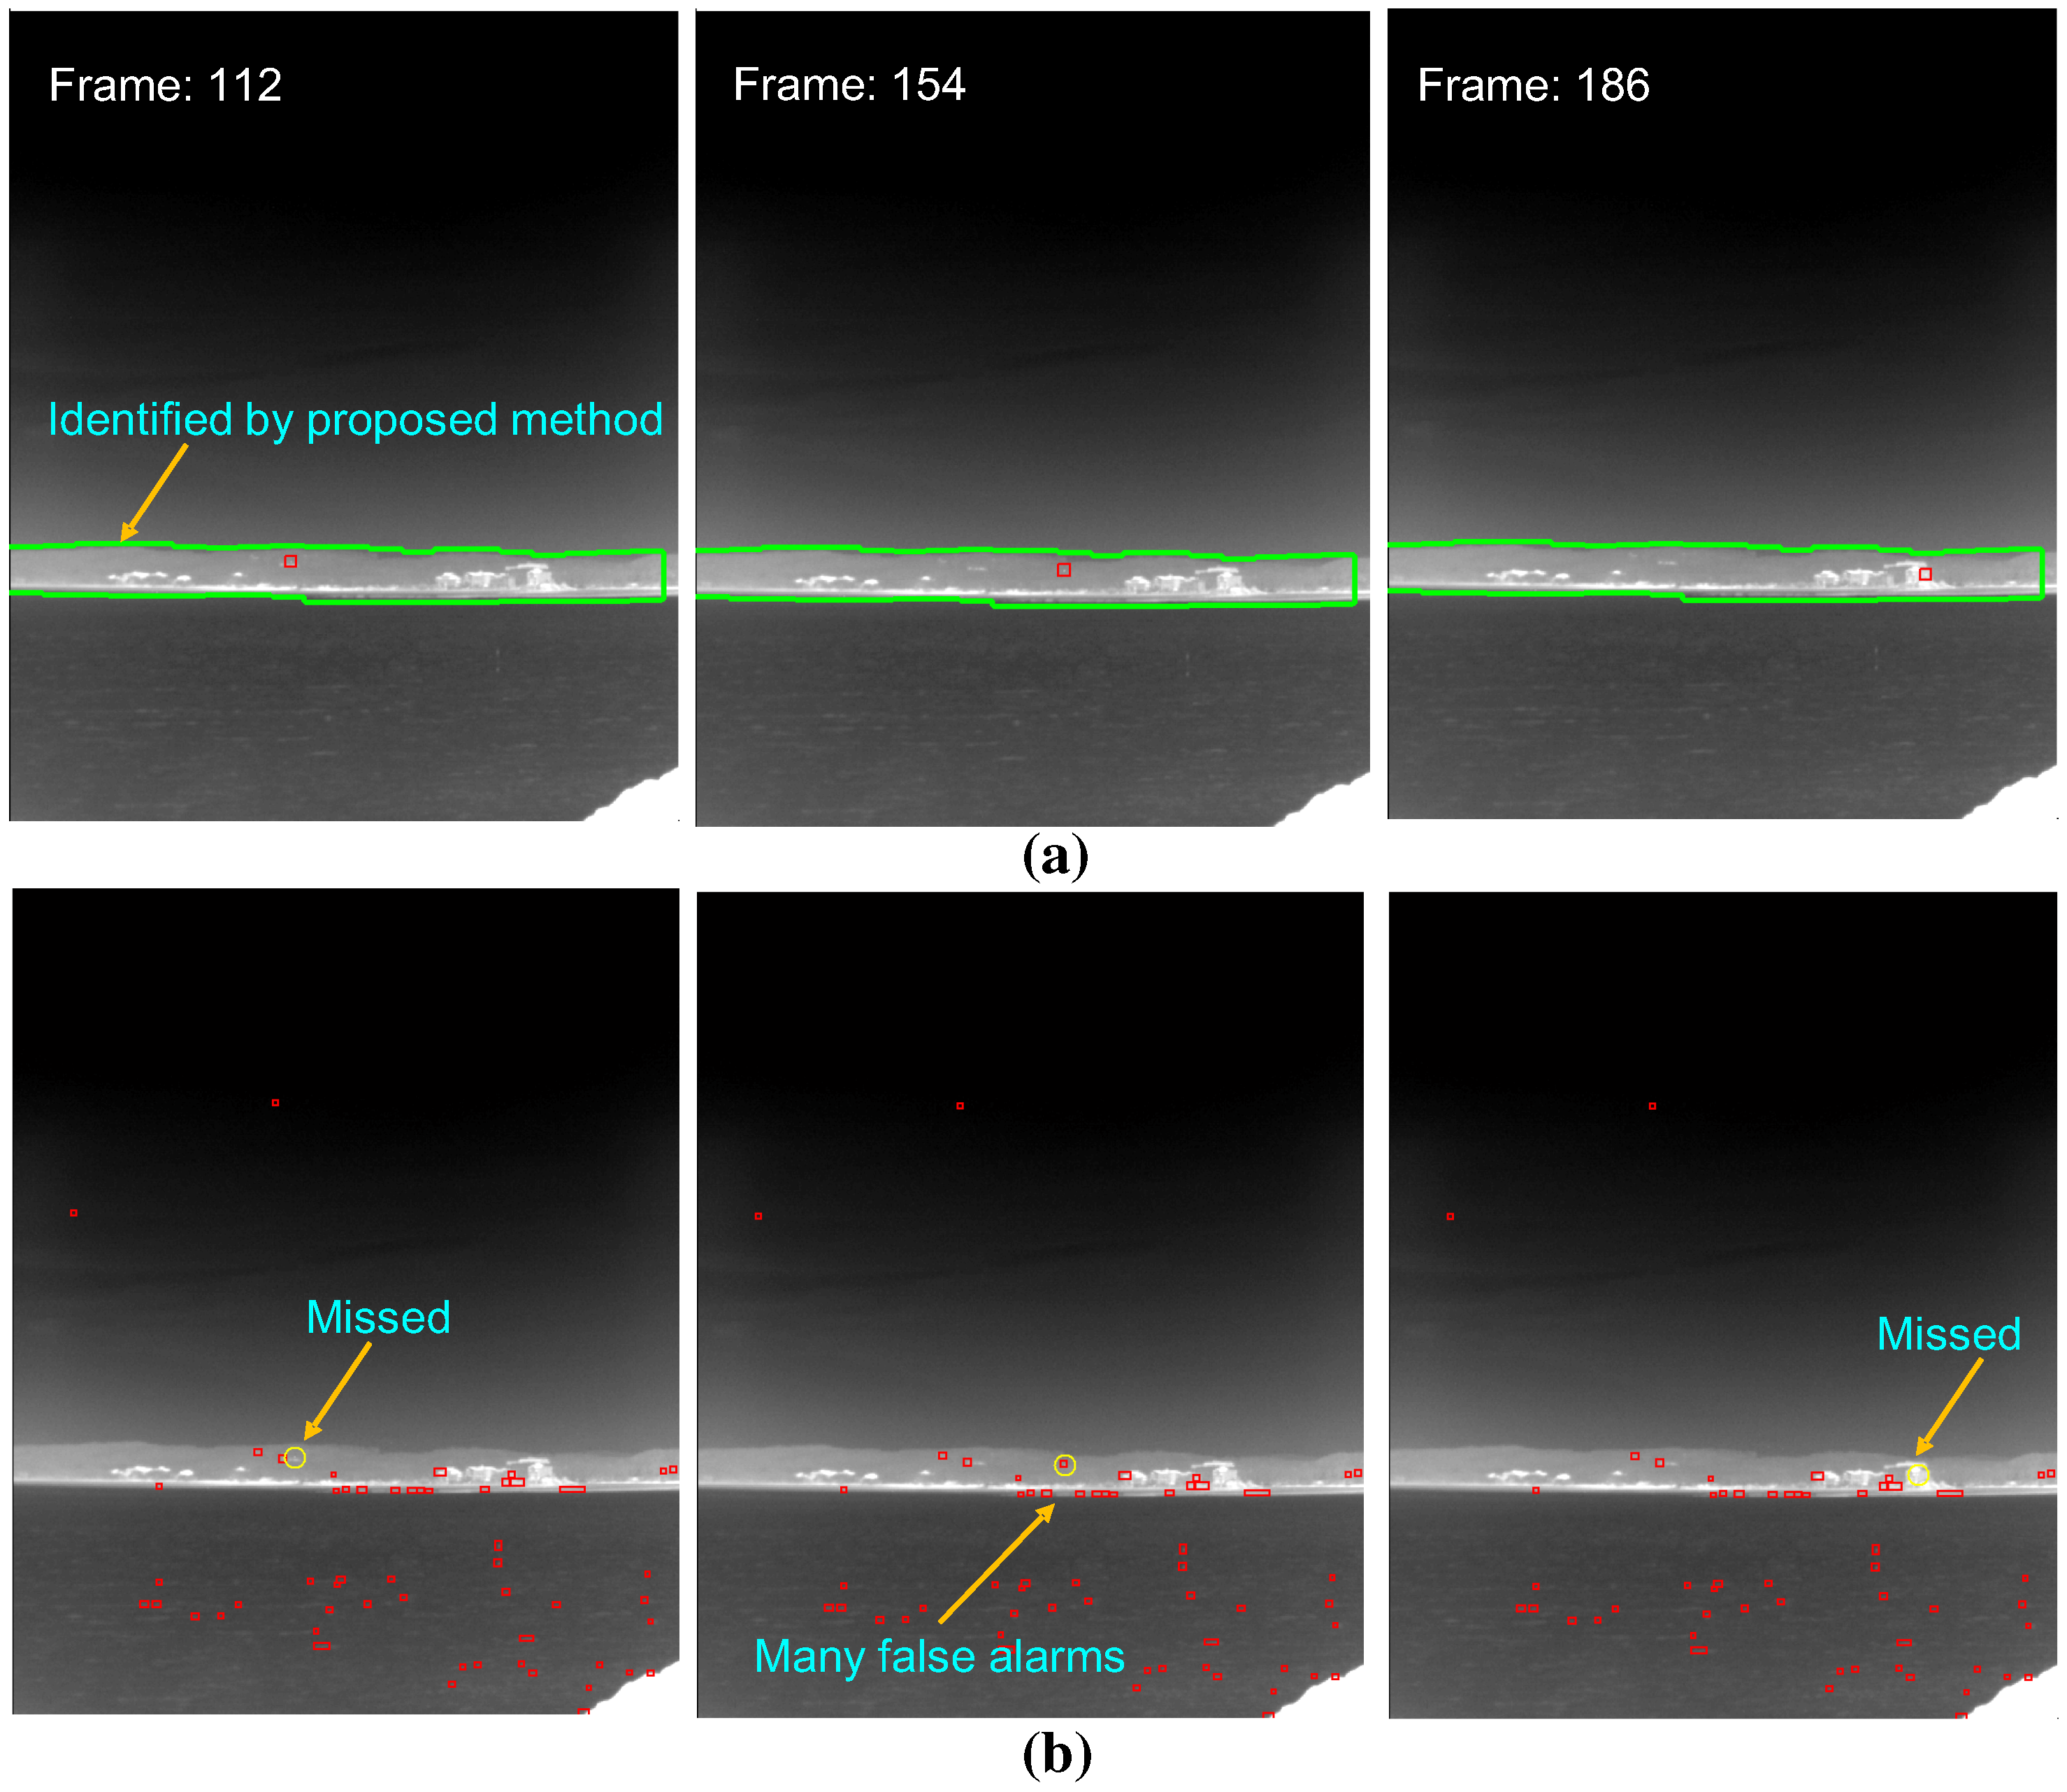
The sea-based infrared image types are normal sky-sea, remote coast and near coast background, as shown in
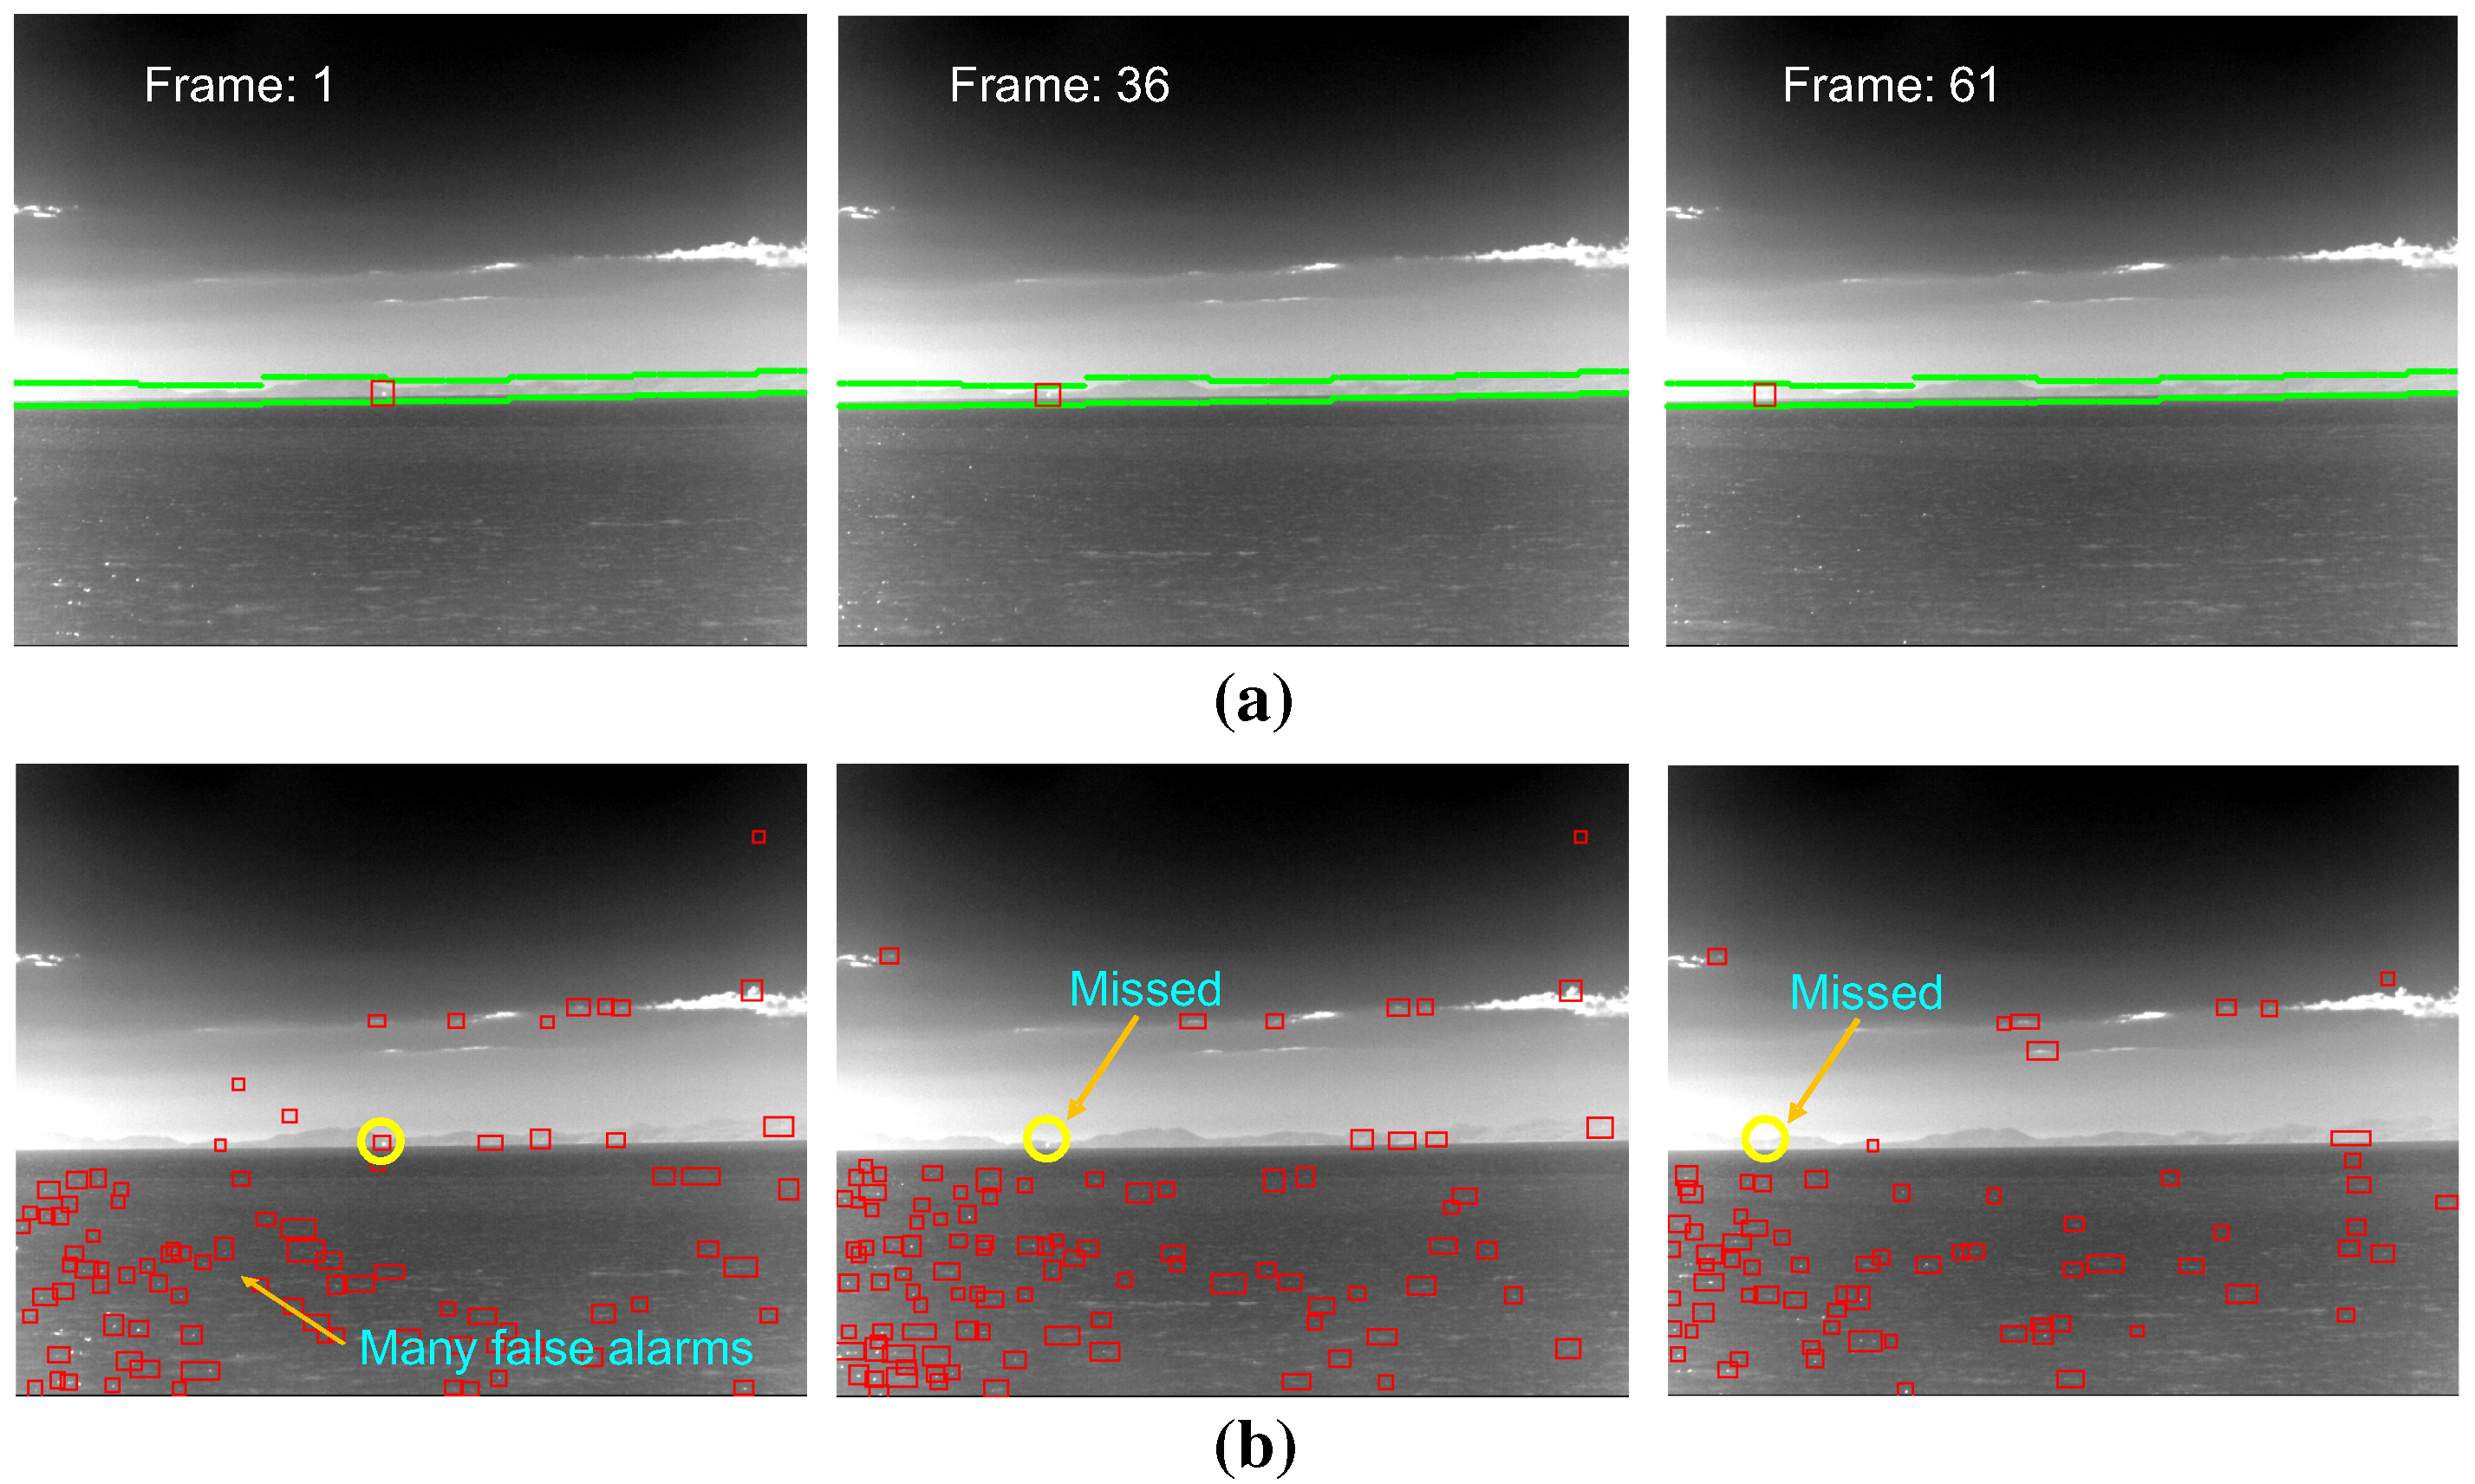
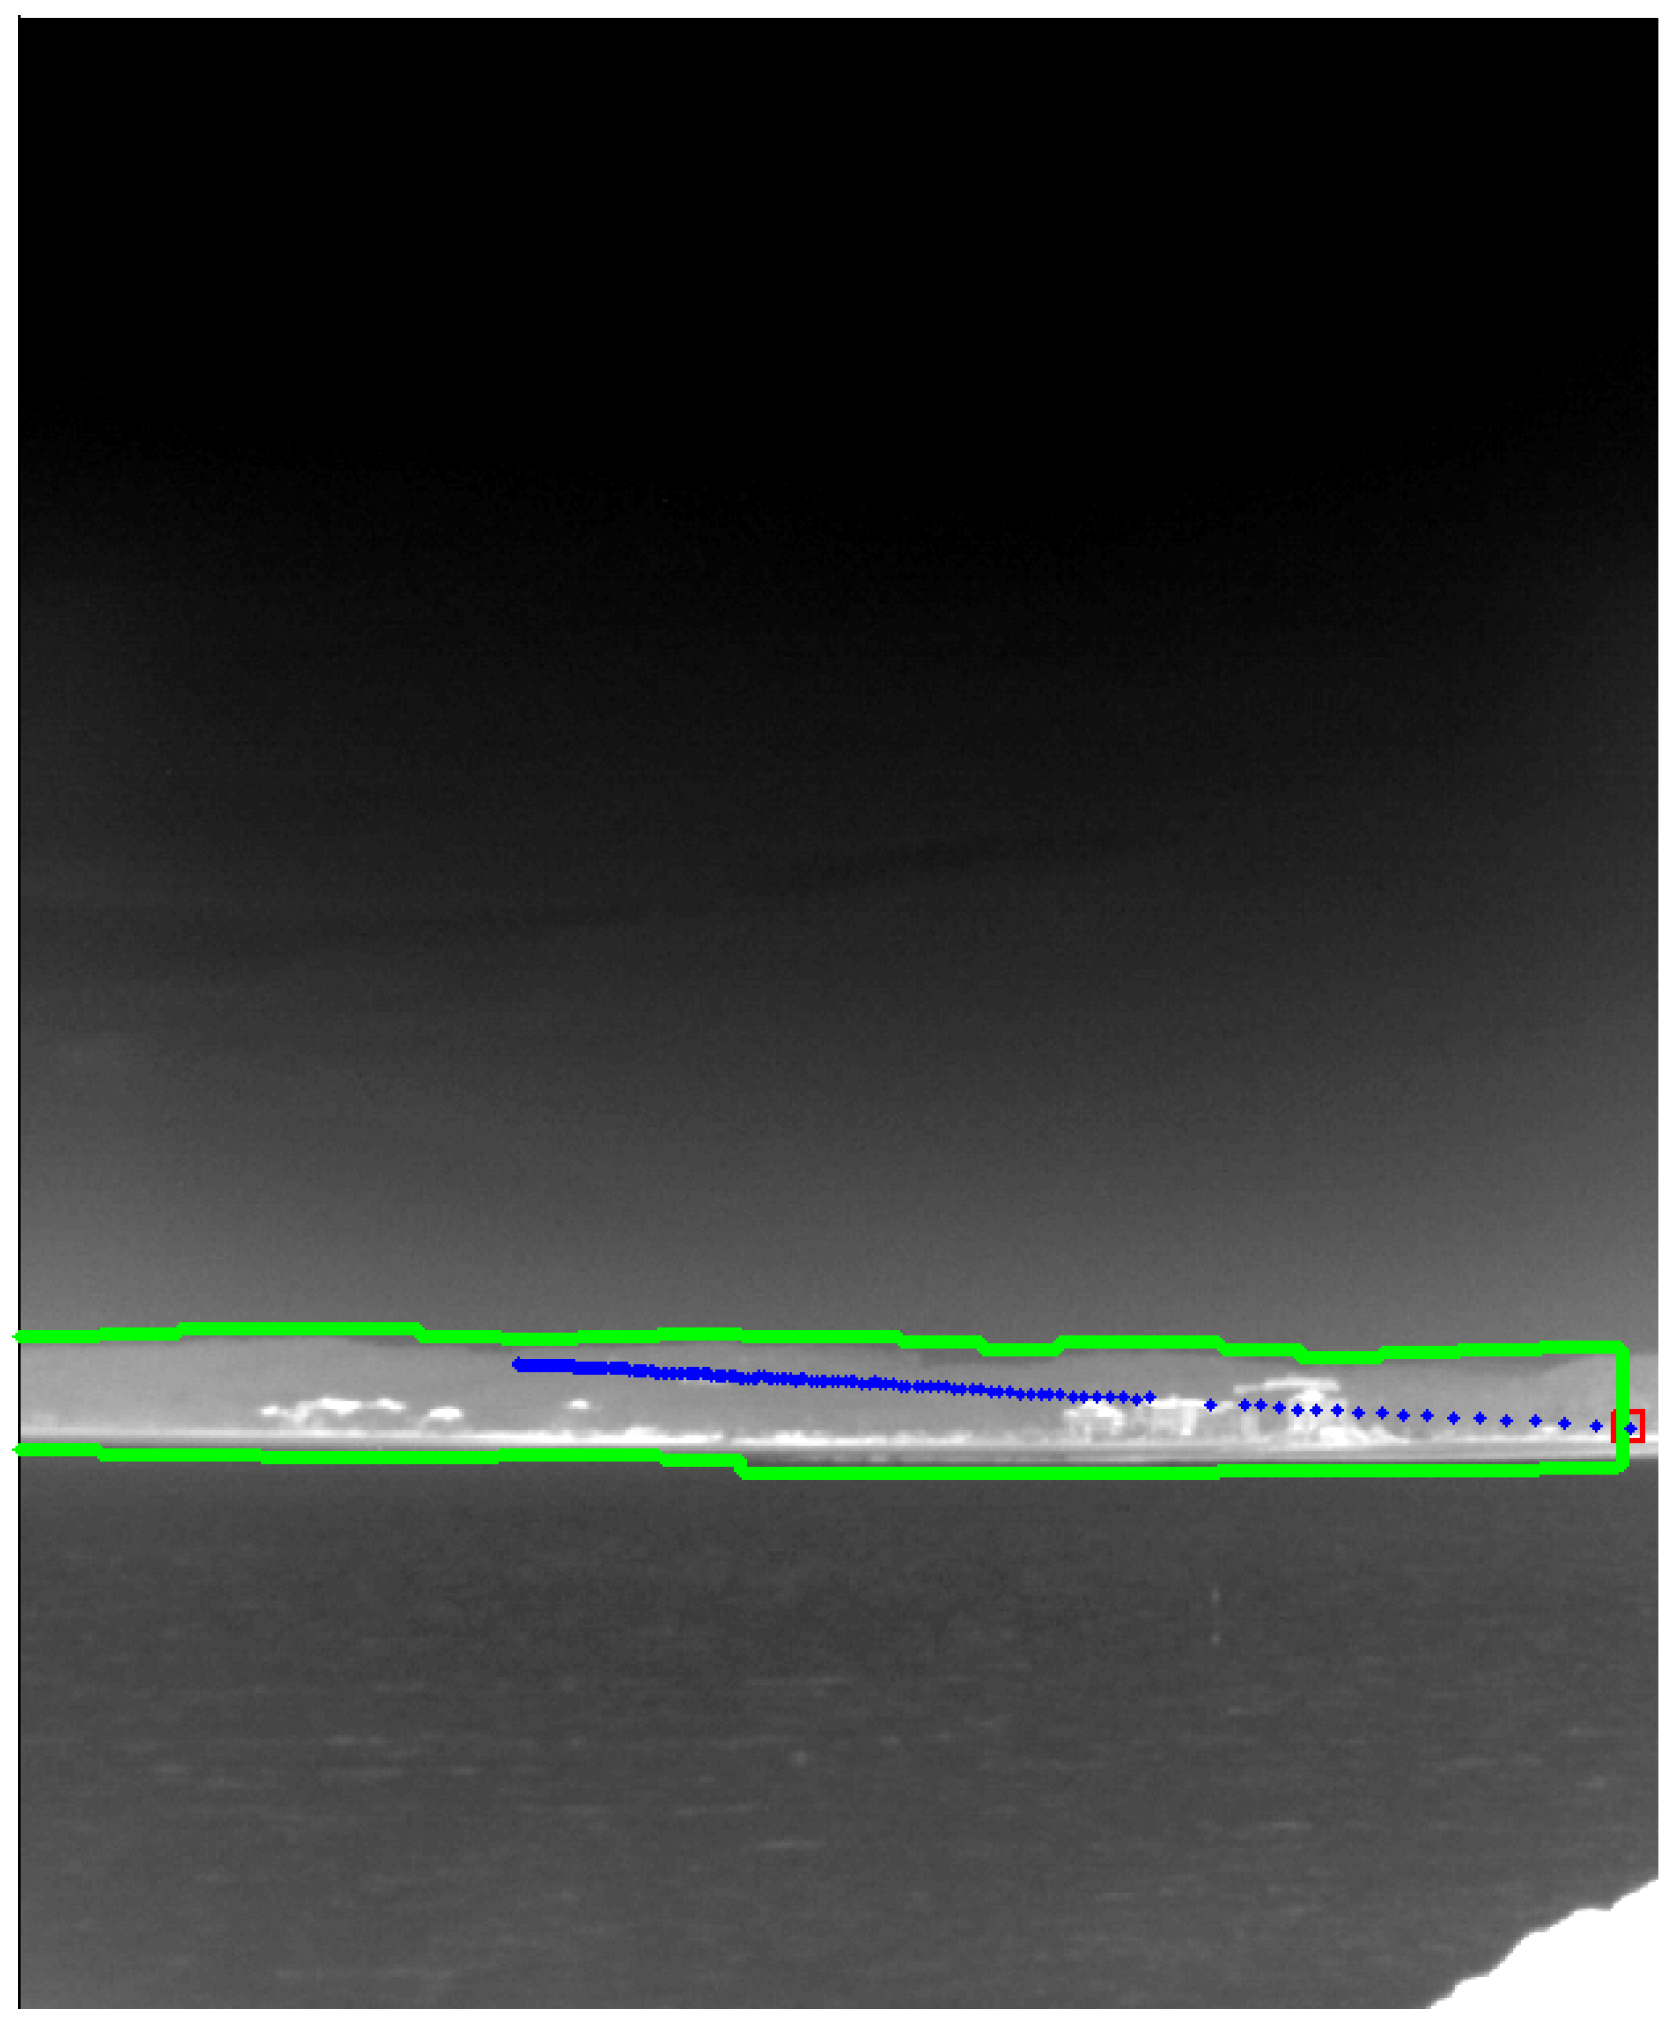
Figure 8, according to the observation. The problem is how to classify the infrared background type using a simple, but robust method. The first idea is to use the horizontal information predicted by the sensor pose and the observed horizon position. As shown in
Figure 8a,b, the horizon position (red solid line) predicted by sensor pose [
24] is identical to the observed horizon (blue dotted line) for remote sea. In a near coast environment, the real horizontal line deviates from the predicted horizontal line, as shown in
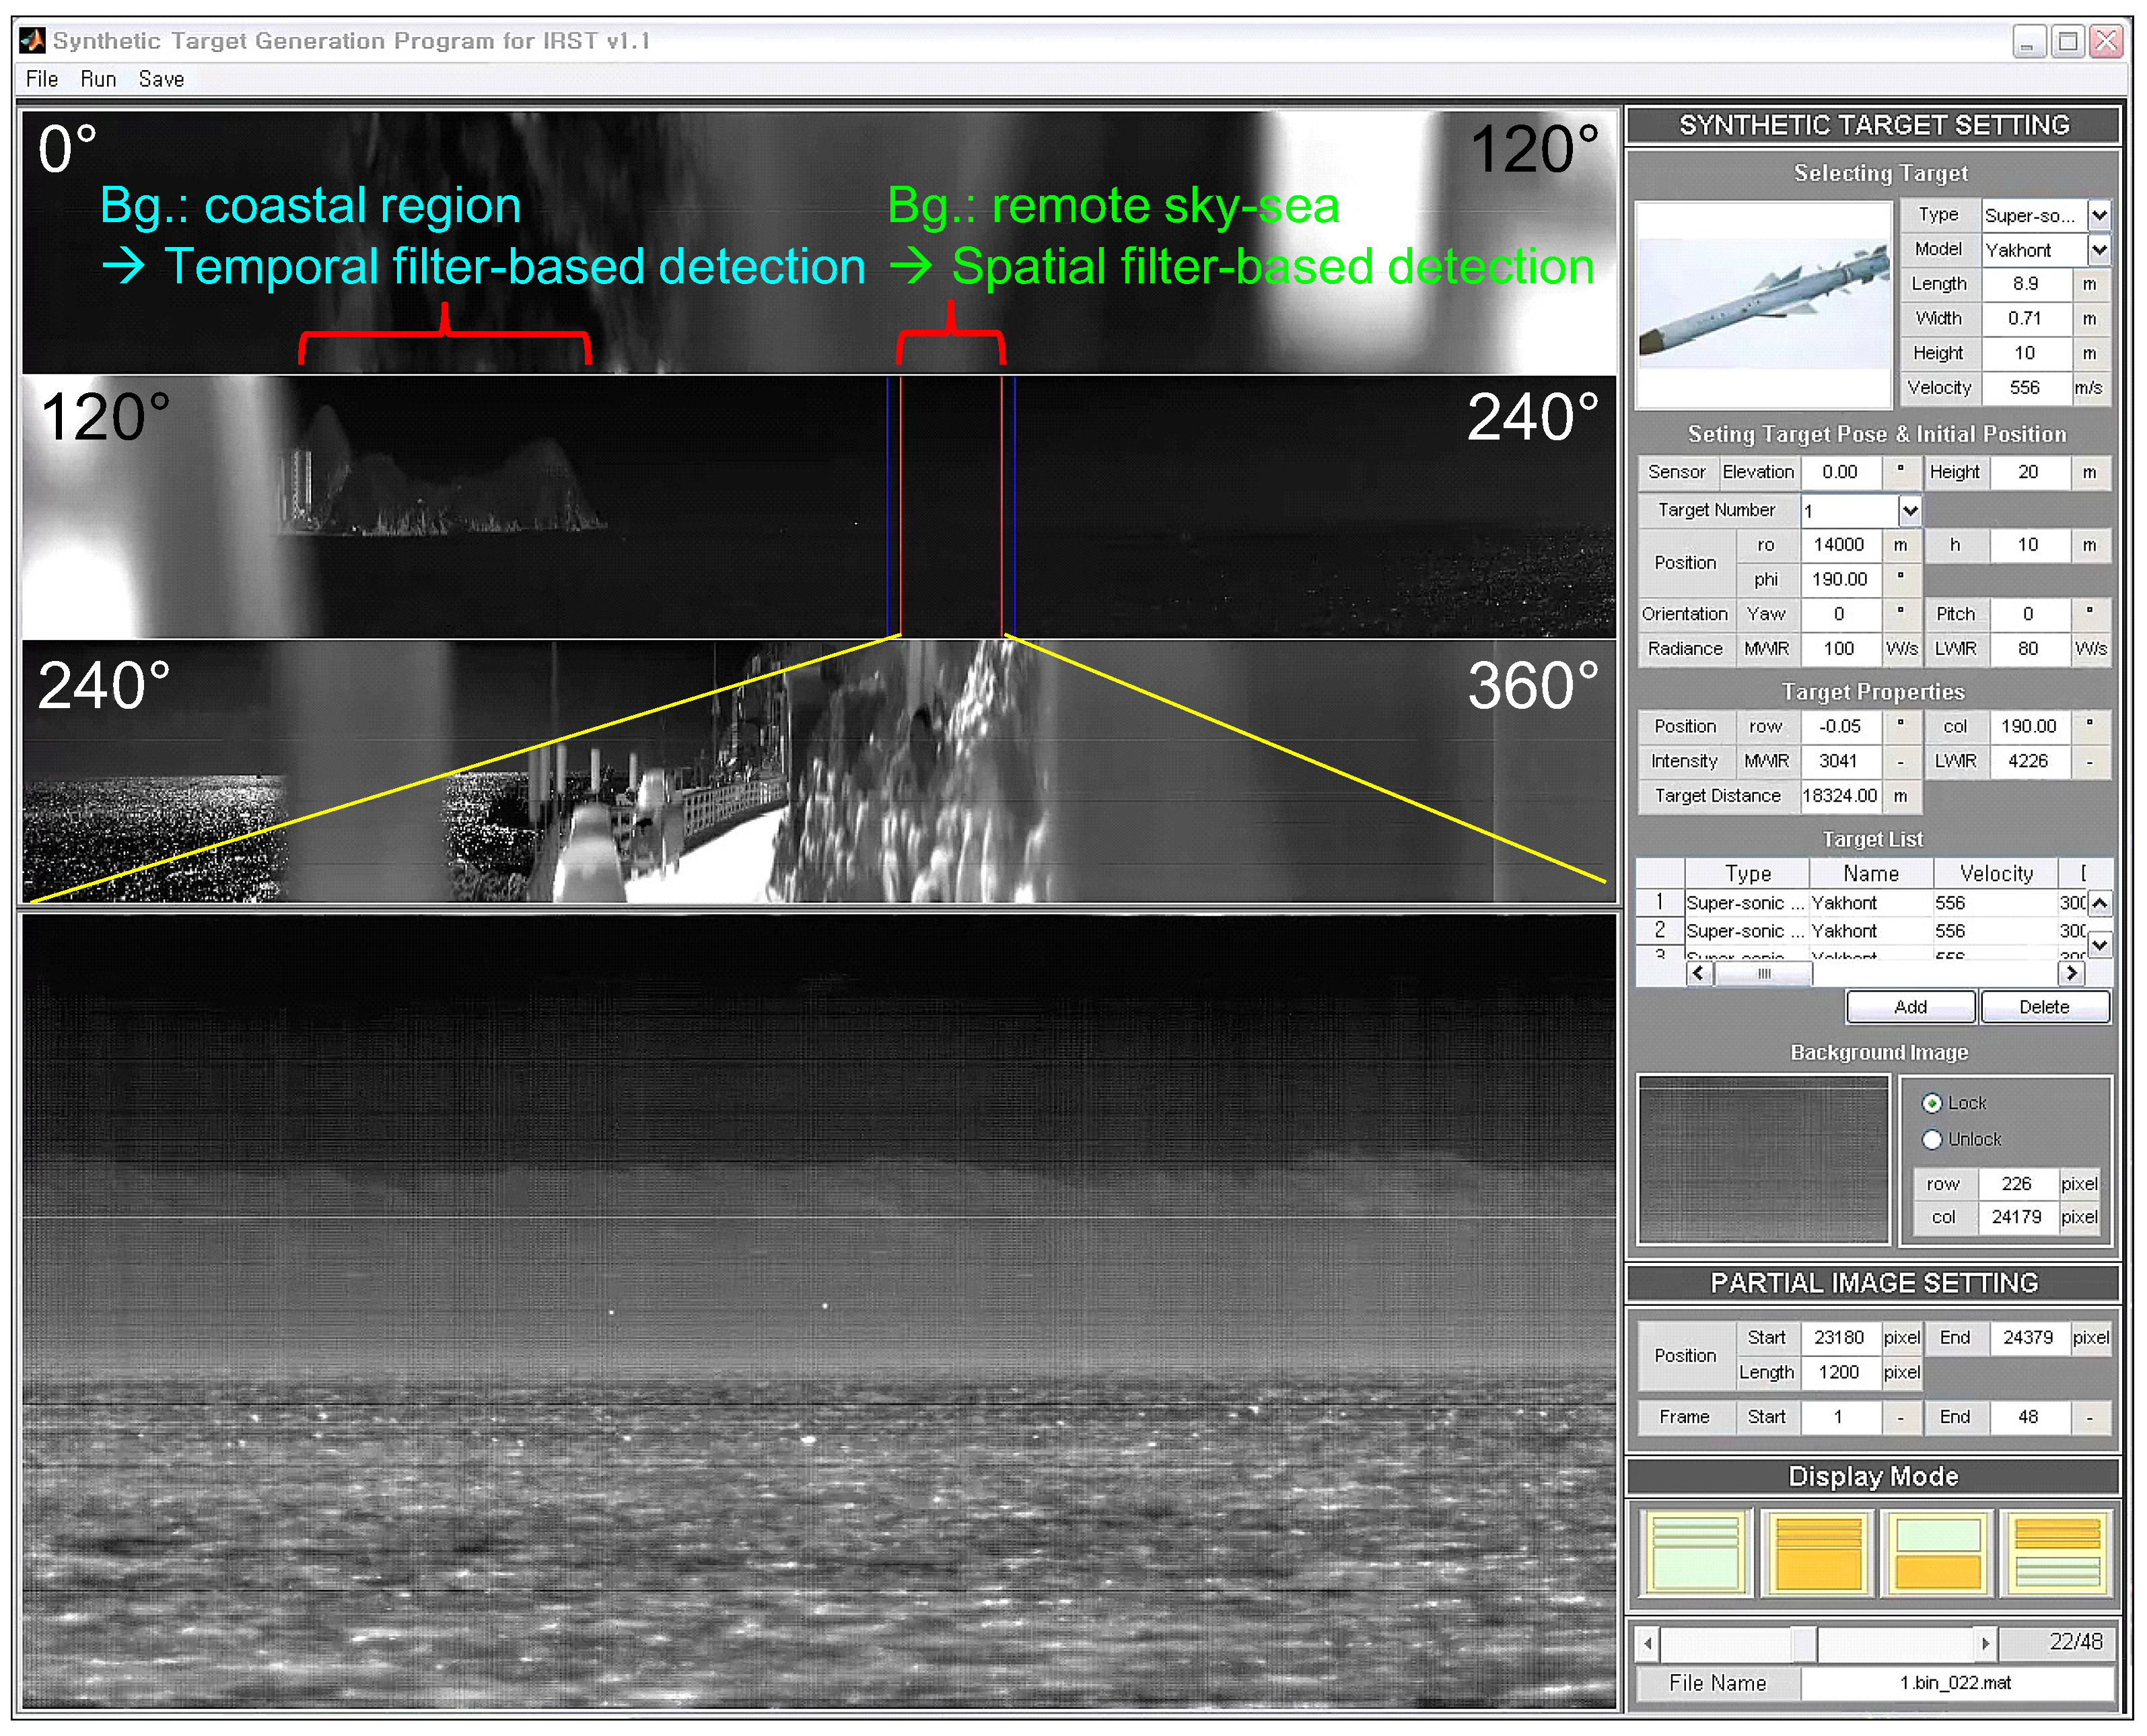
Figure 8c. The second key idea is to use the number of detection results to estimate the clutter density of the probing scene. Normally, a large number of false alarms is prohibited in an IRST system. On the other hand, the number of false detections can provide useful information regarding the coast types, as shown in
Figure 2.
Figure 7.
Distributions of the gray level co-occurrence matrix (GLCM)-based thermal texture for each region: (a) contrast vs. correlation; (b) contrast vs. homogeneity; (c) contrast vs. entropy; (d) correlation vs. homogeneity; (e) correlation vs. entropy; (f) homogeneity vs. entropy.
Figure 7.
Distributions of the gray level co-occurrence matrix (GLCM)-based thermal texture for each region: (a) contrast vs. correlation; (b) contrast vs. homogeneity; (c) contrast vs. entropy; (d) correlation vs. homogeneity; (e) correlation vs. entropy; (f) homogeneity vs. entropy.
Figure 8.
Horizon observation of the sea-based infrared images and background types: (a) normal sky-sea; (b) remote coast; (c) near coast background.
Figure 8.
Horizon observation of the sea-based infrared images and background types: (a) normal sky-sea; (b) remote coast; (c) near coast background.
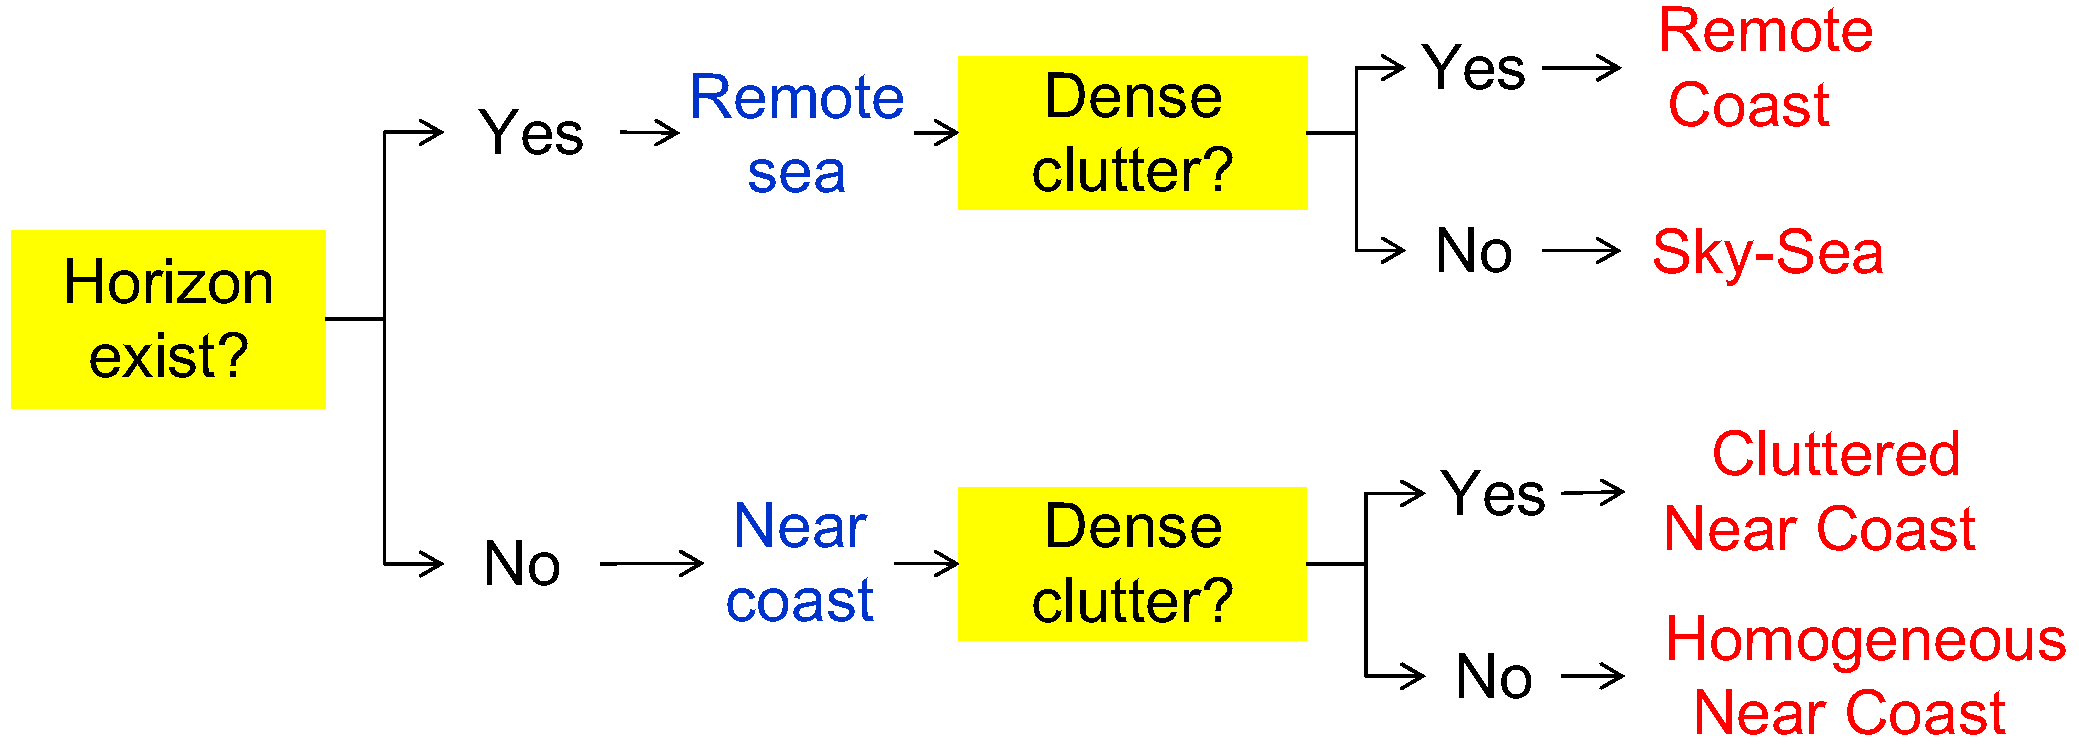
Figure 9 summarizes the proposed infrared scene classification method. The remote sea and near coast are determined depending on the existence of the horizon. In the remote sea case, the scene is classified as remote coast if there is dense clutter. Similarly, the scene is determined to be a cluttered near coast if there is dense clutter in the near coast.
Figure 9.
Proposed infrared scene classification method using the horizon and clutter density cues.
Figure 9.
Proposed infrared scene classification method using the horizon and clutter density cues.
The first criterion is called the horizon evidence function (
) and is defined as Equation (
1).
where
denotes the sensor pose-based horizon prediction in the image and
denotes the horizon position measured from the infrared image. If the difference margin is smaller than δ (normally four pixels), the real horizon can be confirmed to exist.
was derived in [
24] and is briefly introduced in this paper. Consider the IRST sensor height
h, elevation angle α, field of view β and Earth radius
R. The angle of the calculated horizontal line in an image can be found using Equation (
2) assuming
.
If the elevation angle is considered, the amount of sky region (
) can be calculated using Equation (
3).
The geometrically-predicted horizontal line (
) can be found using Equation (
4). The angle of the sea region (
) is just
.
How can a horizon position (
) be found in an image? The camera roll angle is assumed to be zero to simplify the problem. The key idea of the
estimation is to accumulate horizon-like pixel information (
) along each image row and to find a row index (
i) that maximizes the horizon density using Equation (
5). The probing image size is
with a row index
i and column index
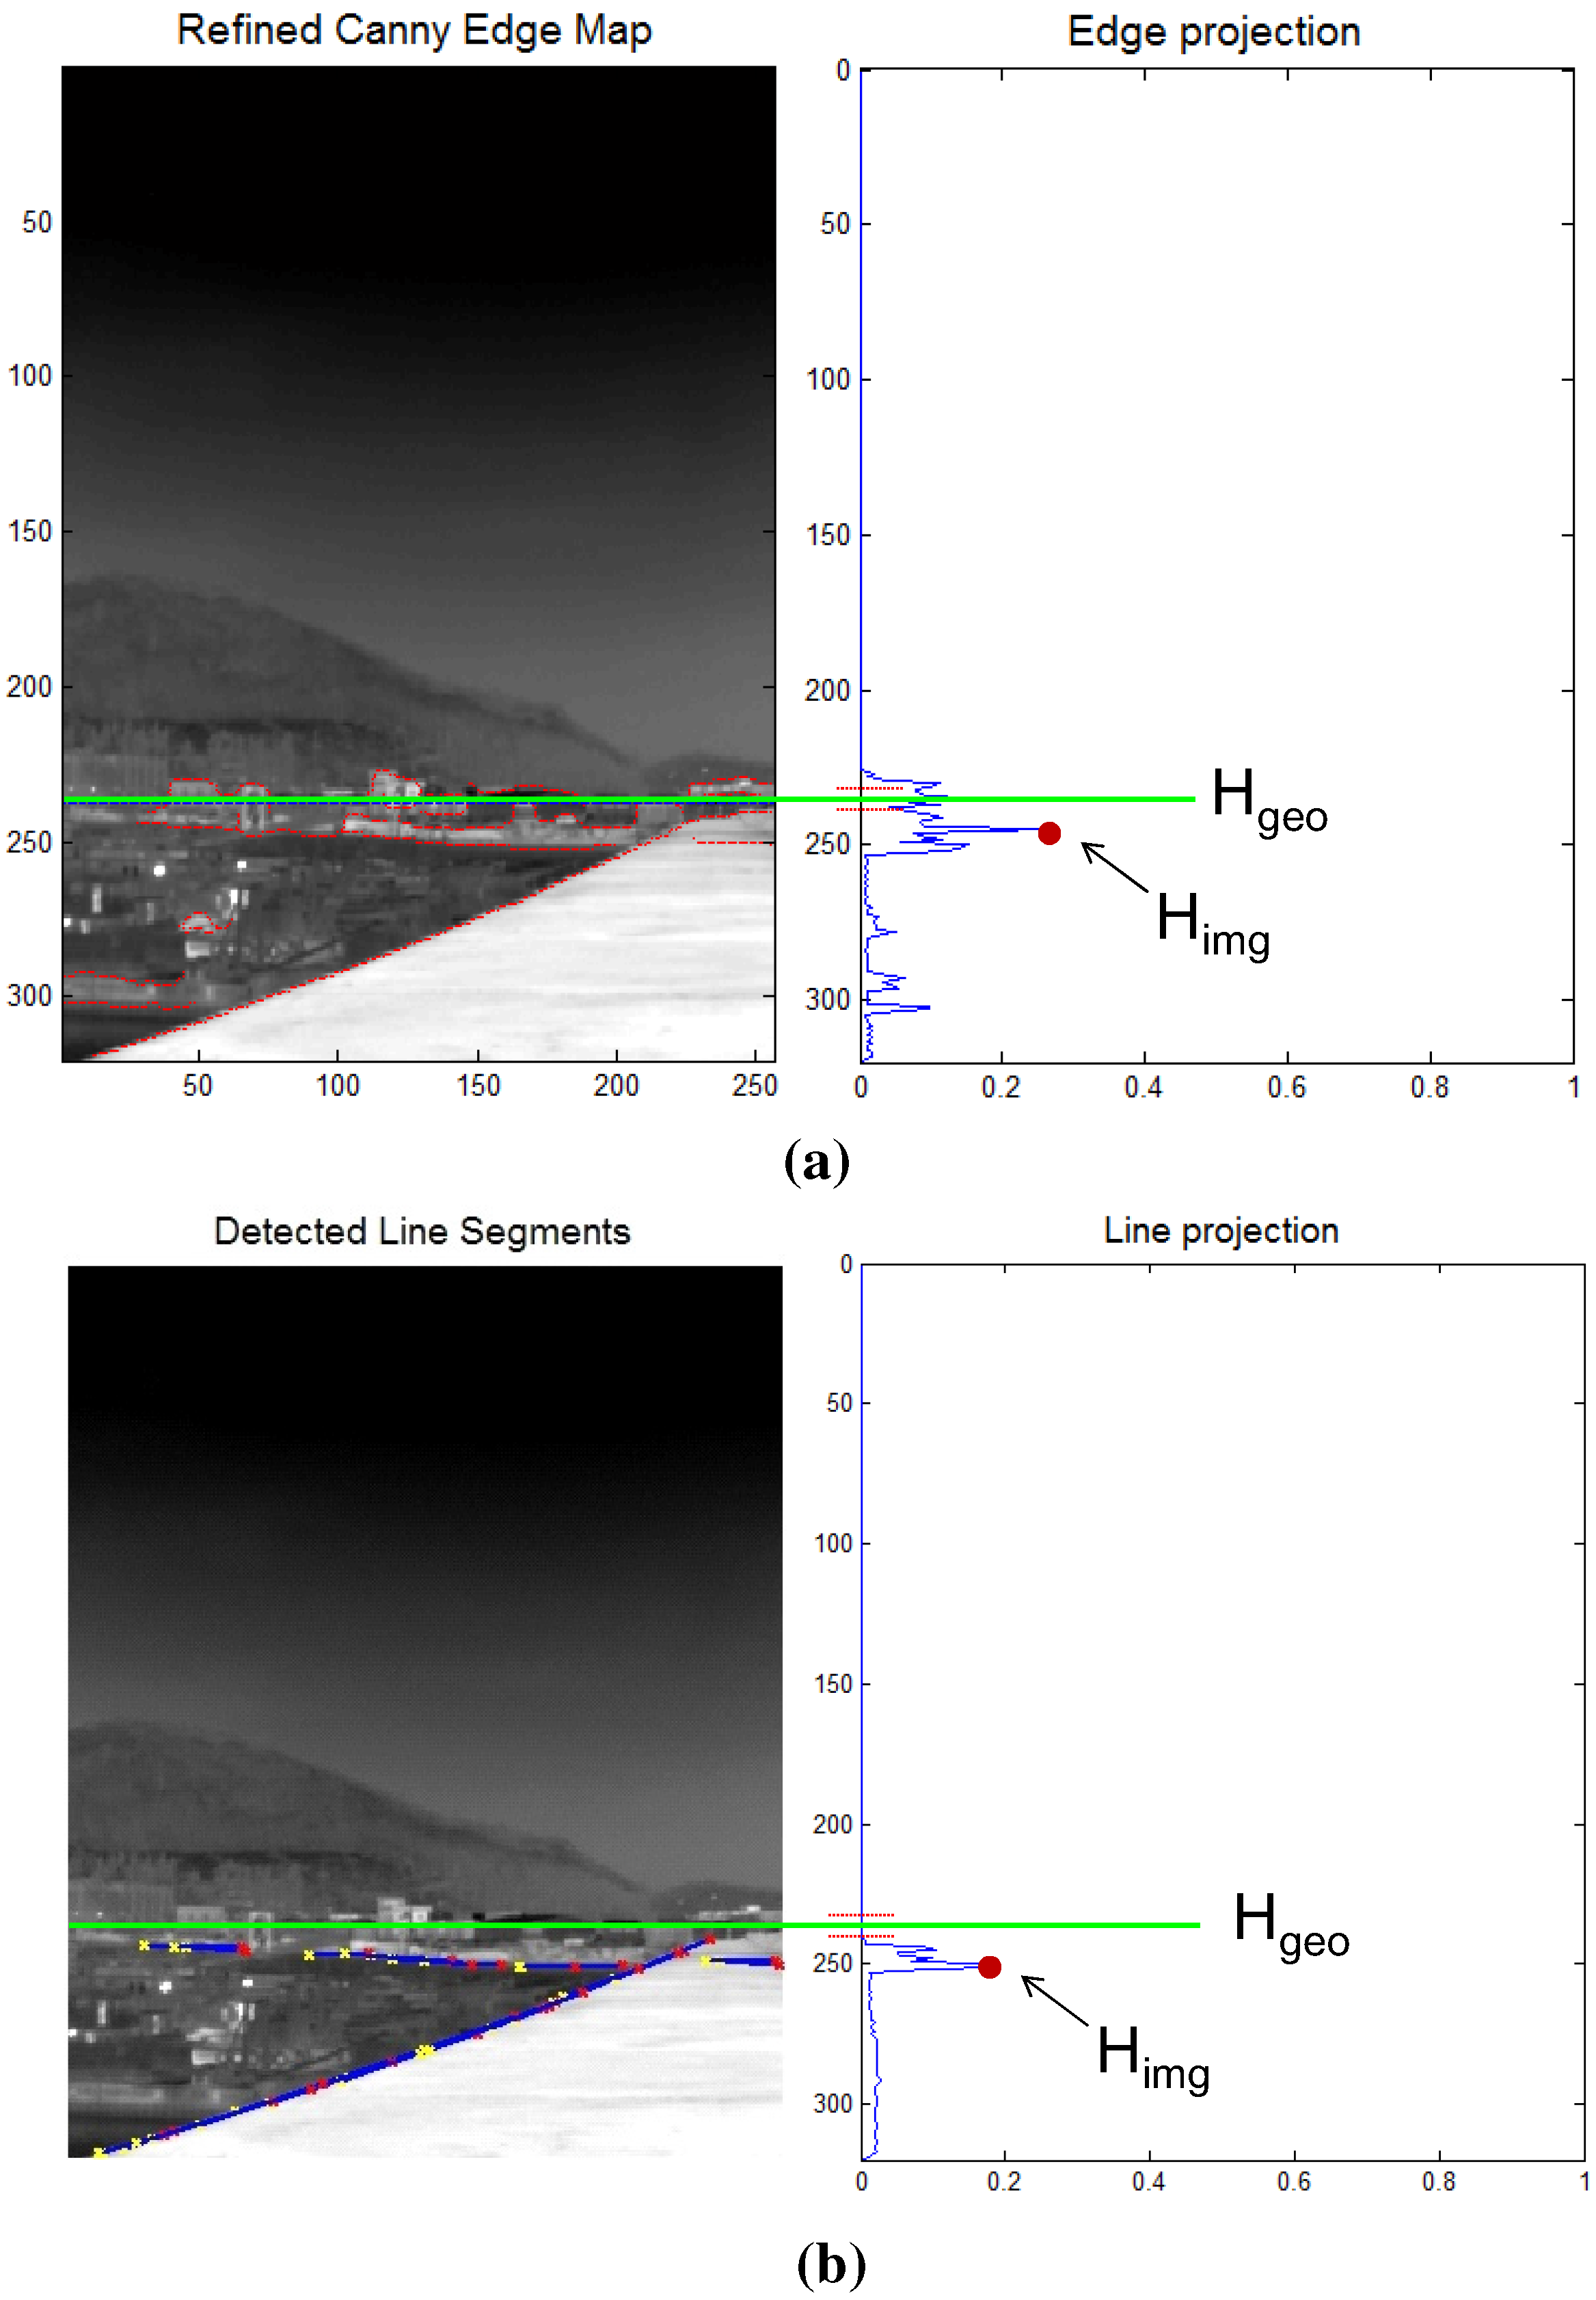
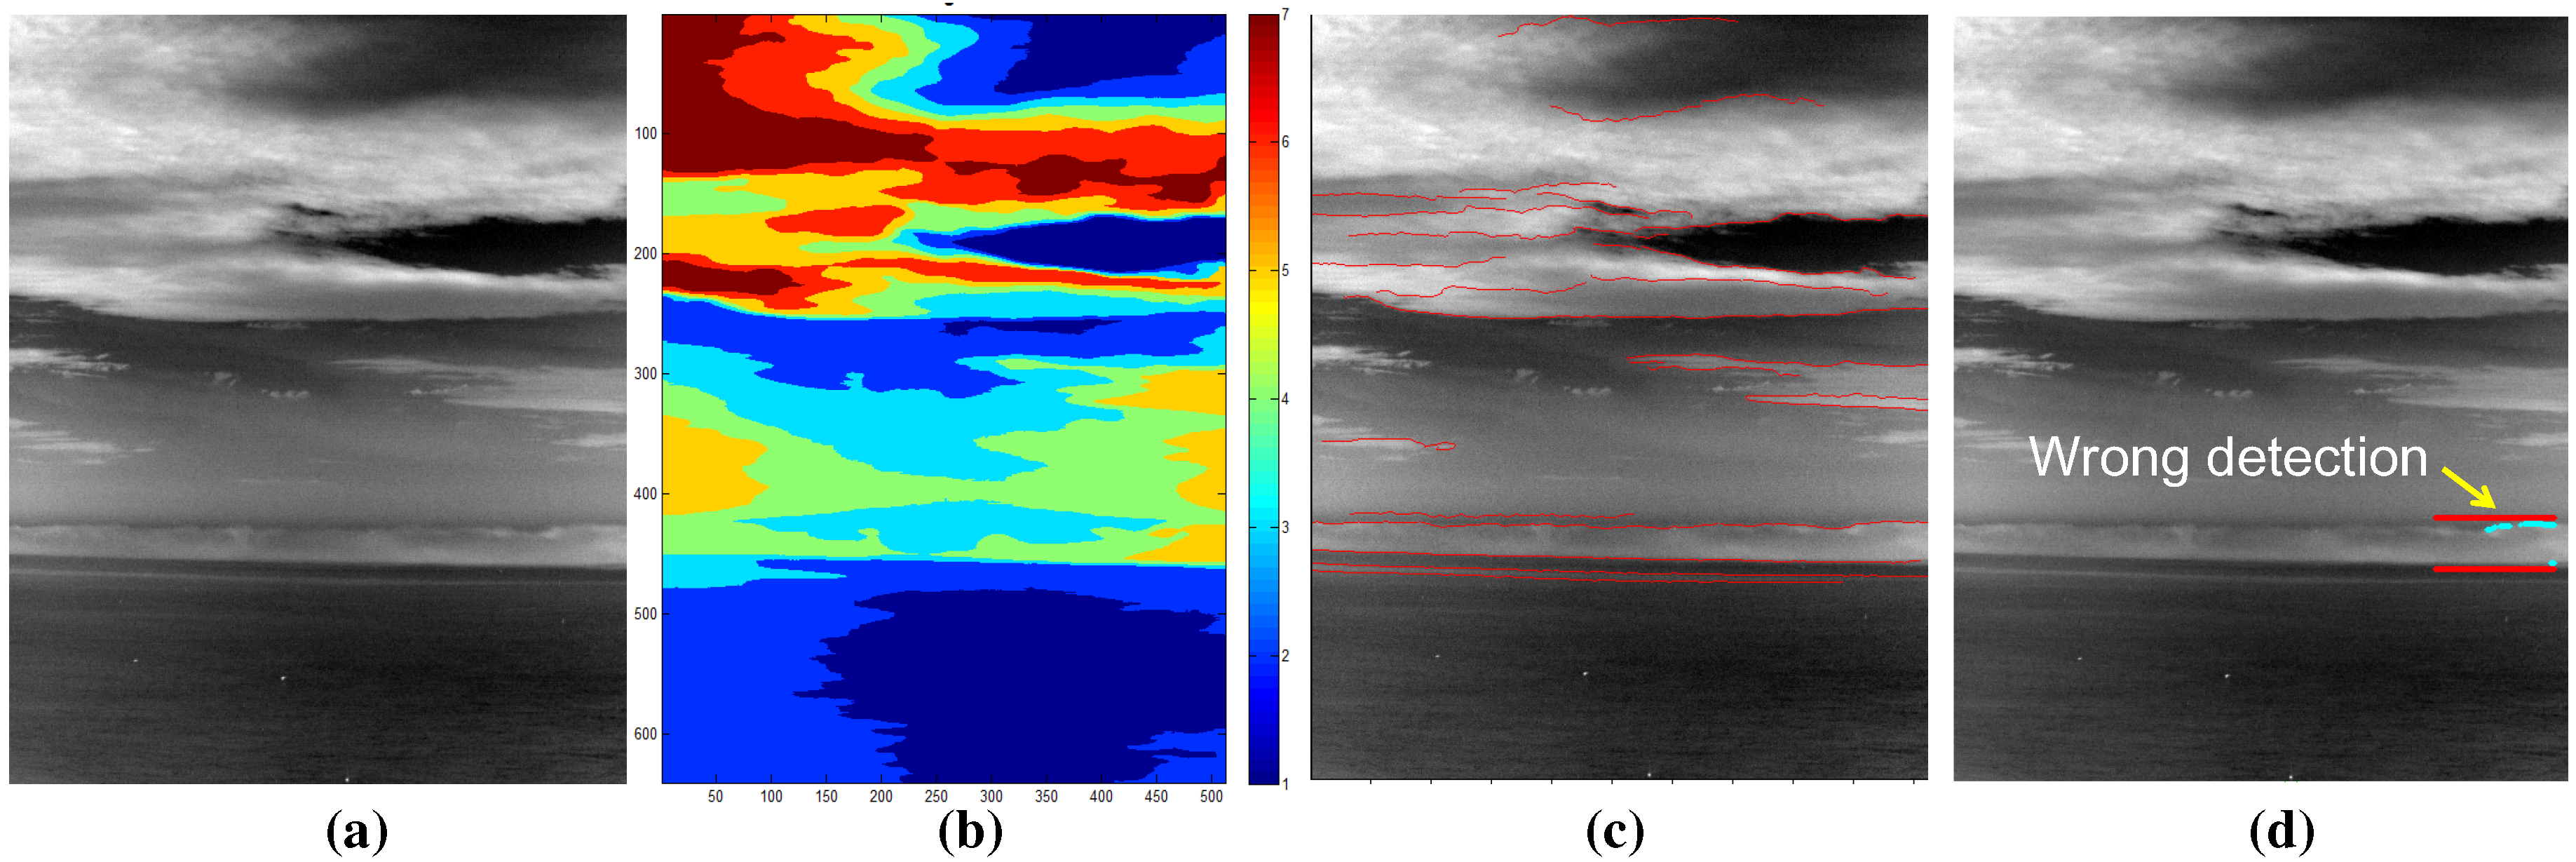
j. The edge map should be selected carefully to achieve the robustness of a horizon estimation in an image. If a well-known Canny edge detector [
25] is applied, as shown in
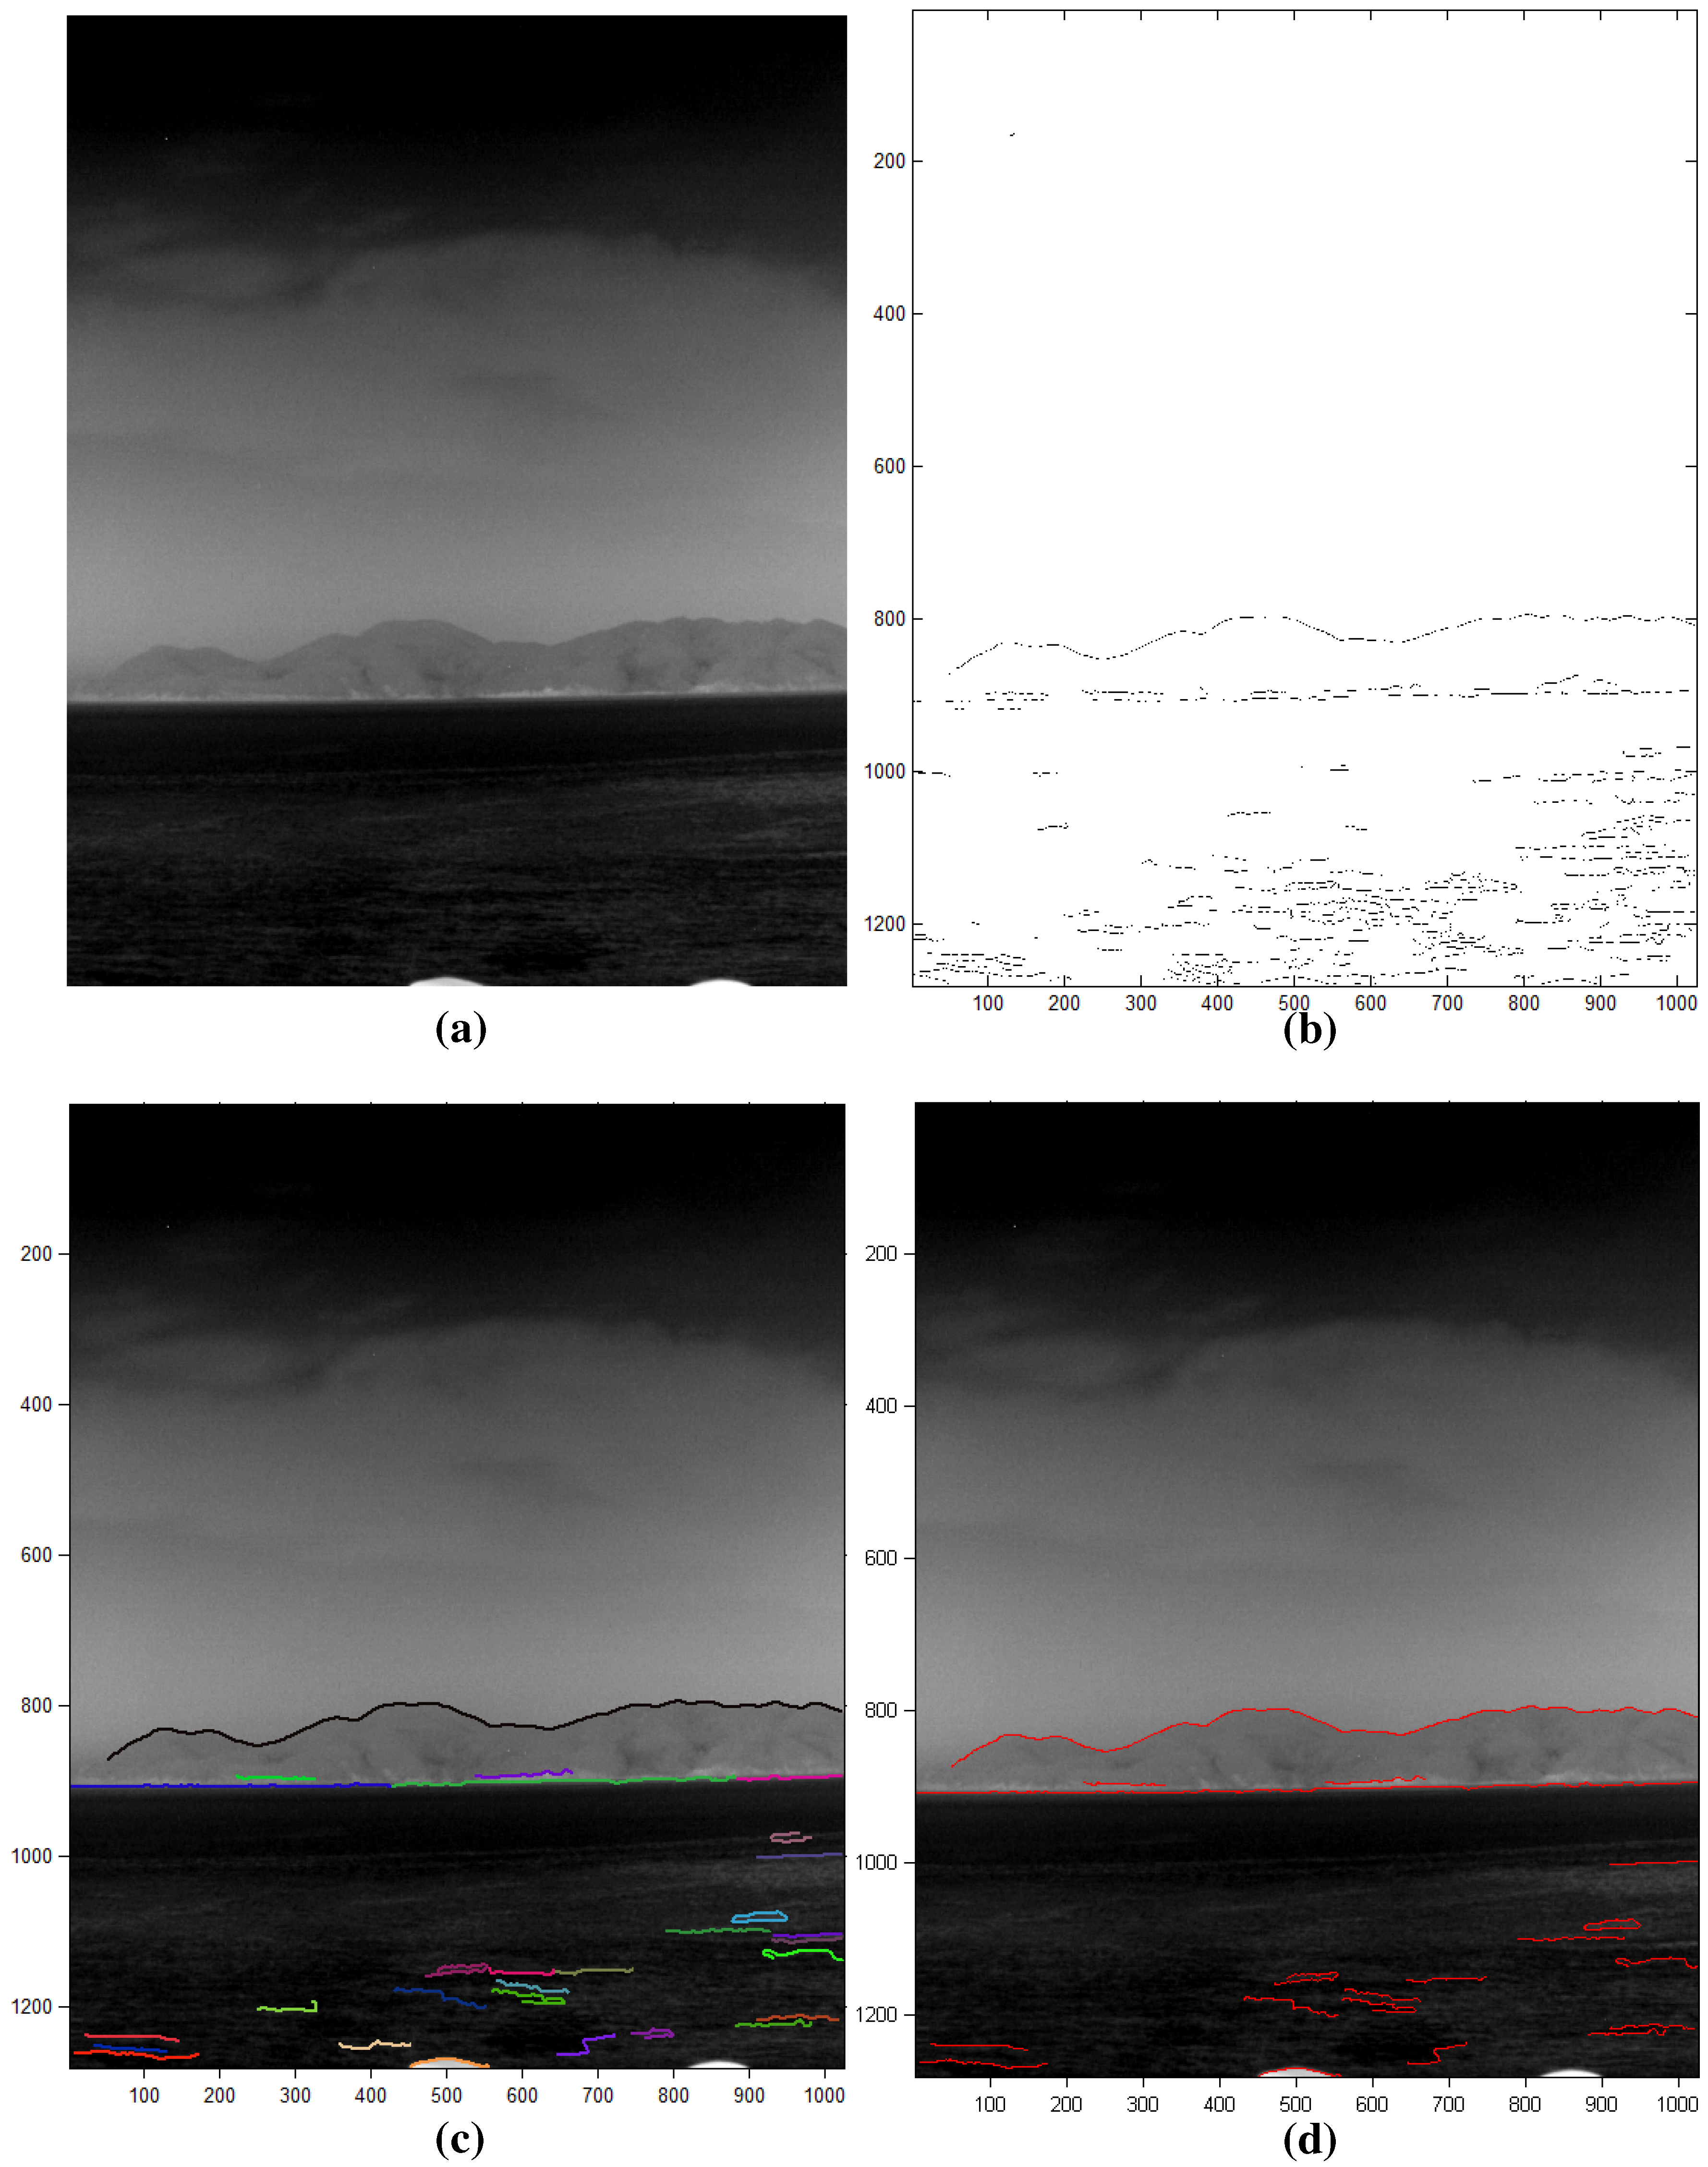
Figure 10a, the accumulated edge map shows an erroneous distribution of horizon density. Instead of a simple edge map, a line map is used, as shown in
Figure 10b. The line segments are detected by applying a Hough transform [
26] to the edge map. Therefore, the remote sea and near coast can be classified using Equation (
1), Equation (
4) and Equation (
5).
The second criteria is the clutter density to further classify the infrared background. The clutter density provides useful scene information on the coast types, as shown in the infrared scene type diagram (see
Figure 9). The clutter density can be measured directly from the infrared images, such as the standard deviation [
27]. On the other hand, the low level intensity-based variance shows very different behavior compared to coastal clutter. Therefore, this paper proposes a new clutter density (
) measurement, as expressed in Equation (
6), where
denotes a spatial filter-based small target detector with a pre-detection threshold in the hysteresis detector [
24].
represents the area (pixels) occupied by pre-detection. If the density is larger than 5 clutters/(100 × 100 pixels), the scene is classified as cluttered coast. The mean-shift clustering method [
28] is applied to the pre-detection results to estimate the area covered by clutter.
Figure 11 presents representative examples of an infrared scene classification using the proposed rule-based algorithm with the horizon existence and clutter density function. Infrared images of the remote sky-sea, remote coast and cluttered near coast are classified correctly.
Figure 10.
Estimation of the horizon in image () using the projection method in the near coast region: (a) edge map-based measurement; (b) line map-based measurement.
Figure 10.
Estimation of the horizon in image () using the projection method in the near coast region: (a) edge map-based measurement; (b) line map-based measurement.
Figure 11.
Examples of scene classification using the proposed background type classification.
Figure 11.
Examples of scene classification using the proposed background type classification.
2.3. Coastal Region Detection
Given the information of the infrared background types, the coastal region should be detected for remote coast and nearest scenes. The state-of-the-art computer vision techniques were applied to find the coastal region in an infrared image. In the bottom-up approach, normalized graph cut (N-cut) is famous for its image segmentation capability [
29]. N-cut regards an image as a set of nodes and edges. The strength of the edge increases if the similarity between pixels is strong. If it is not, the edge is cut to separate these pixels.
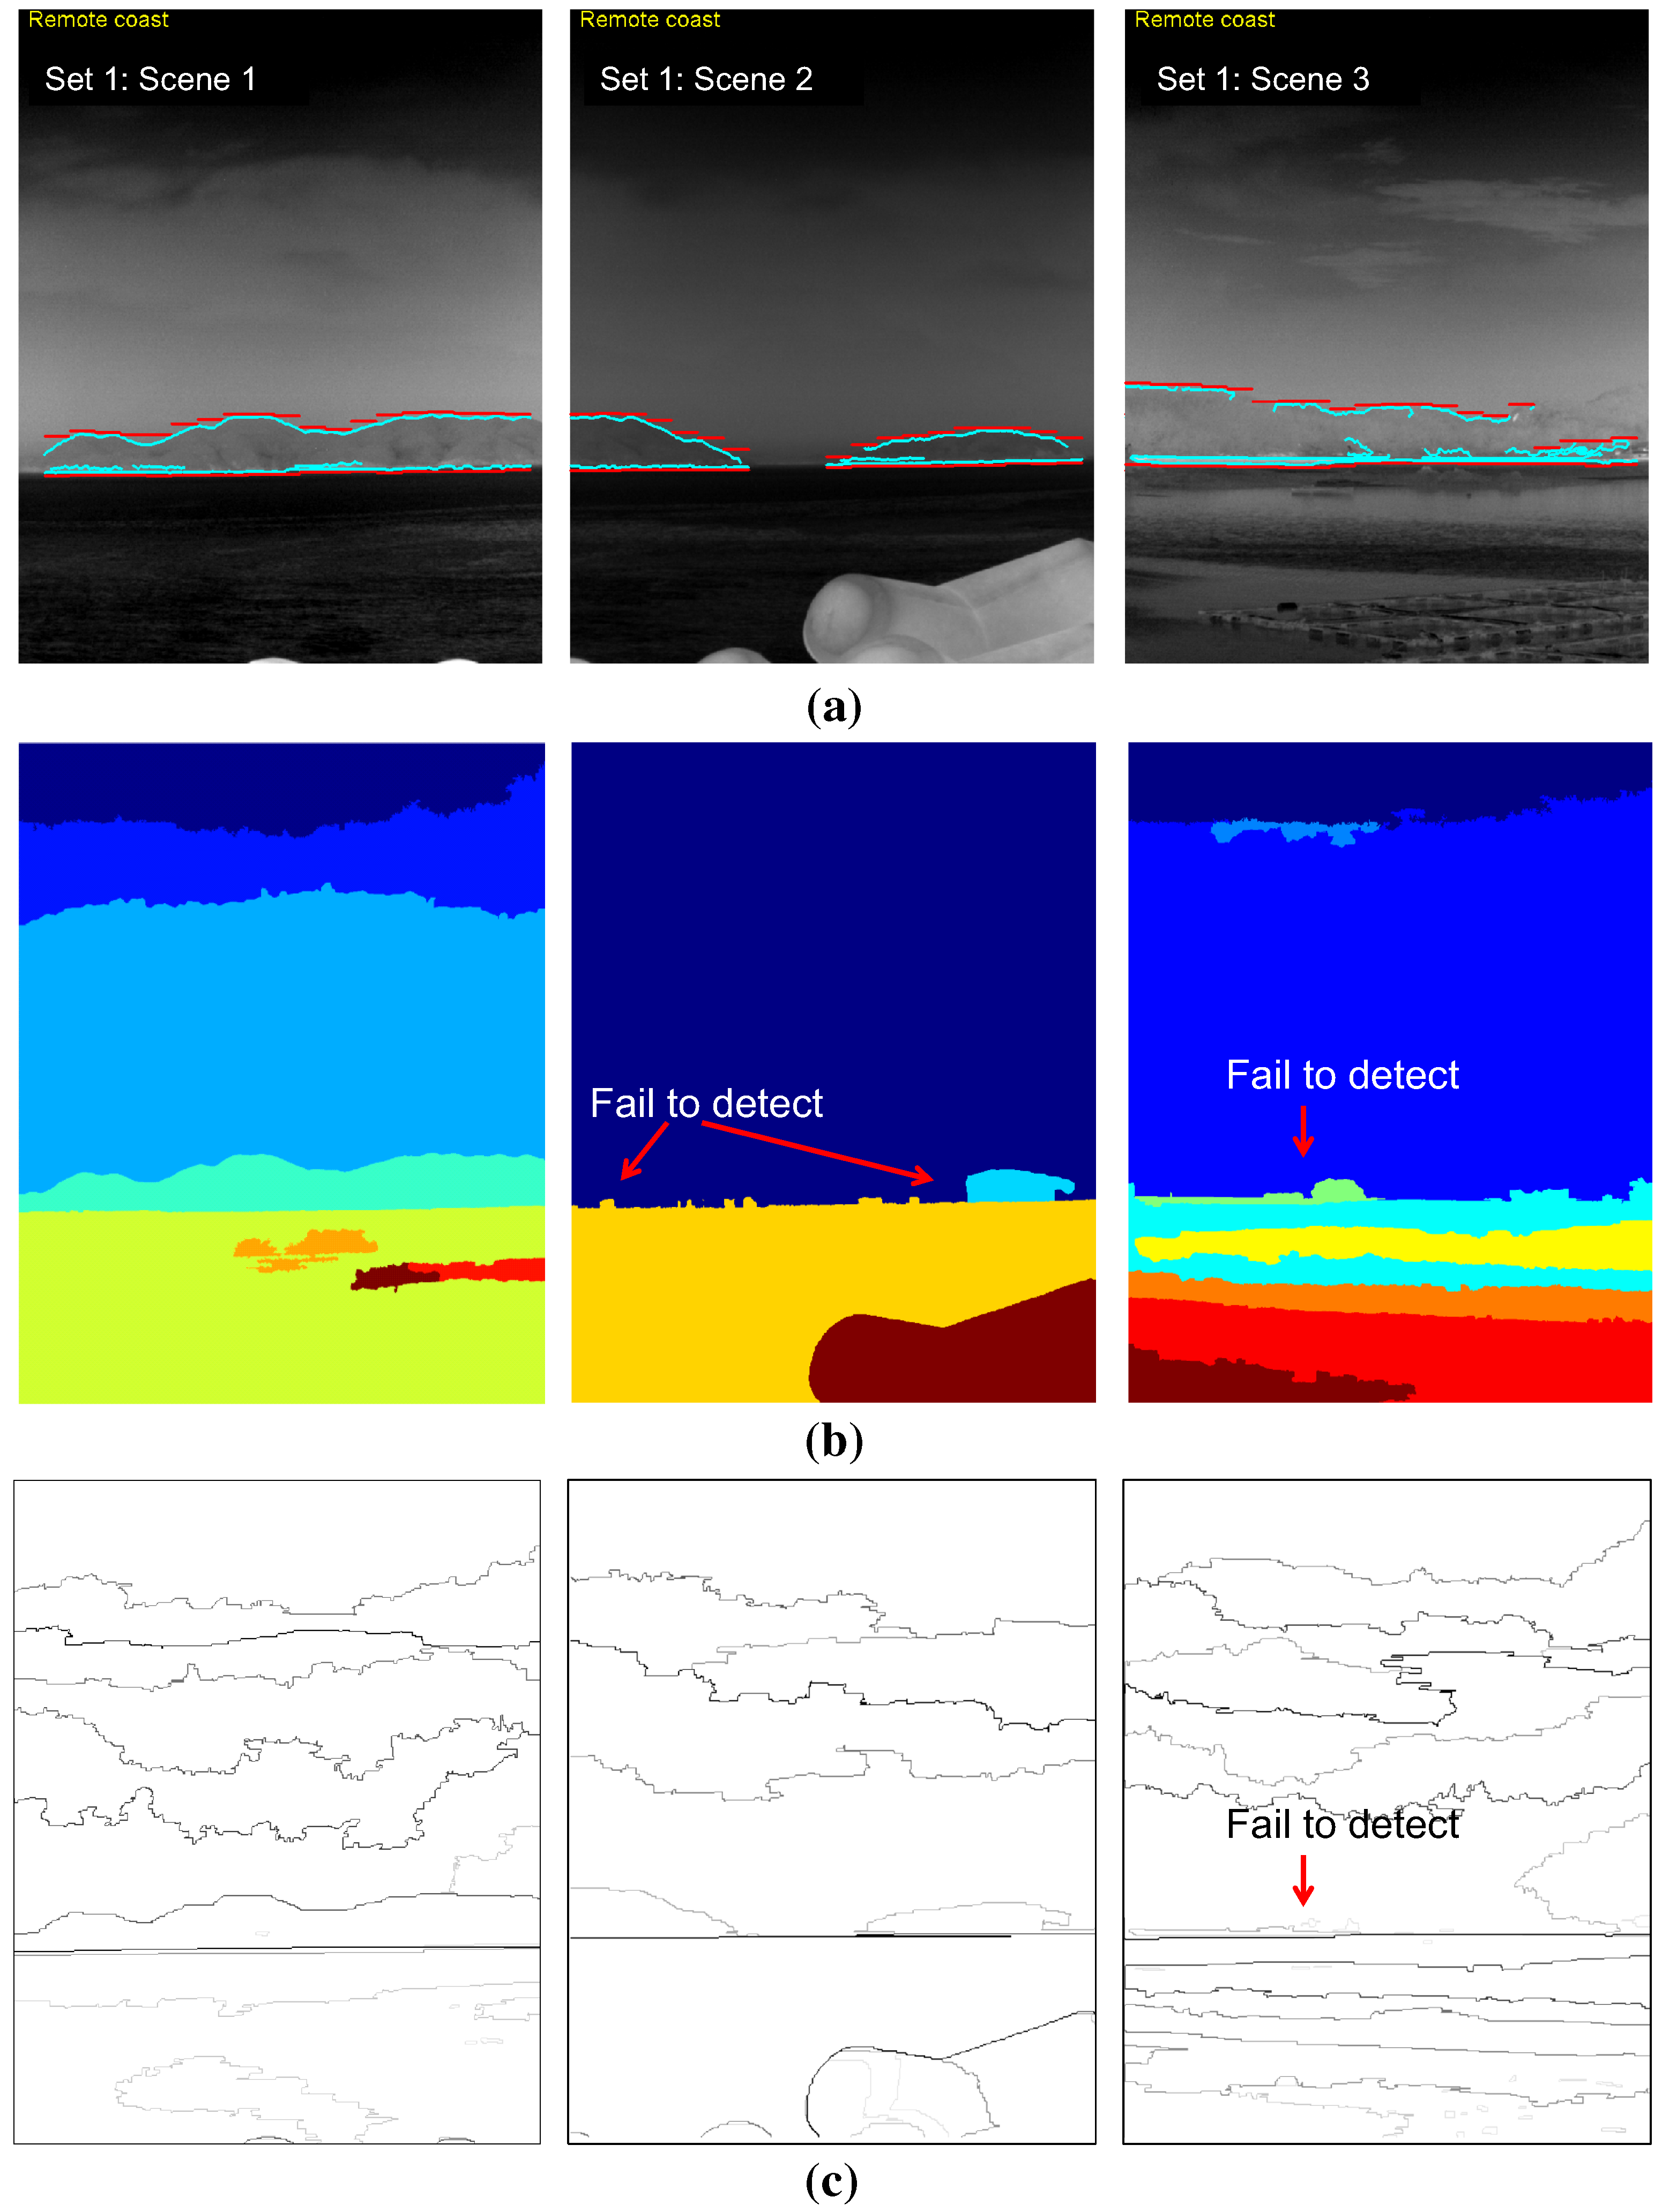
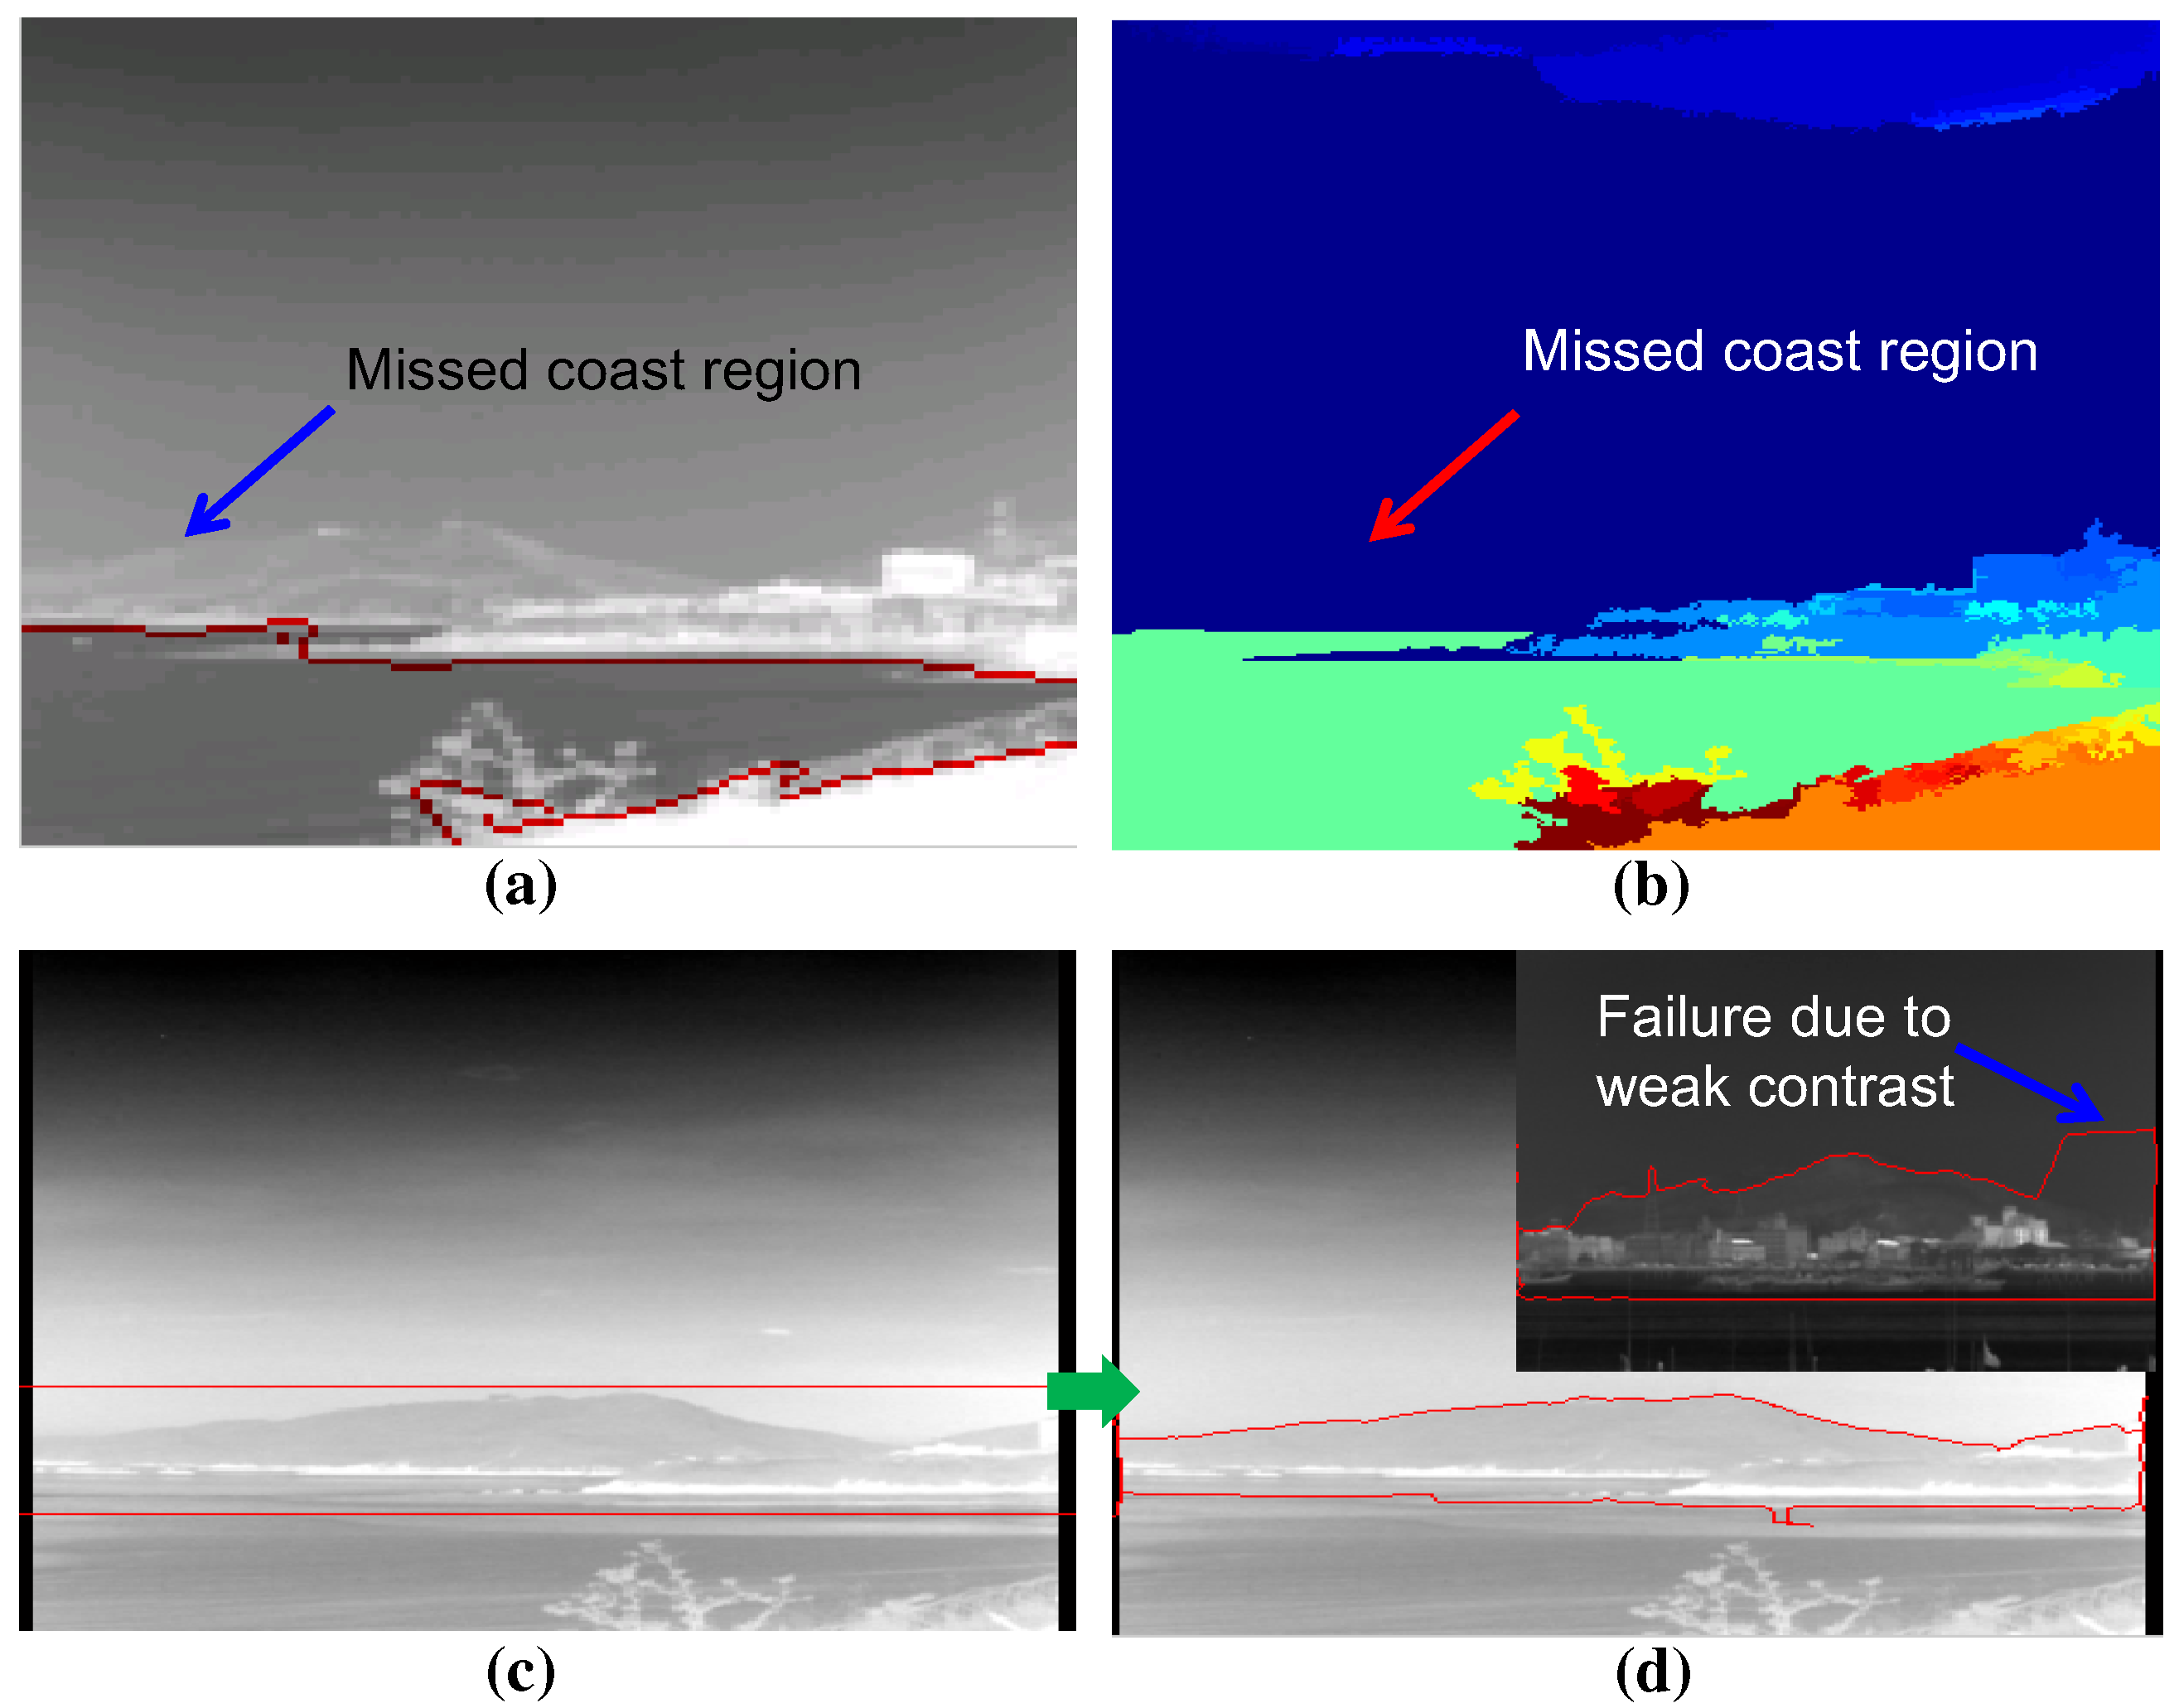
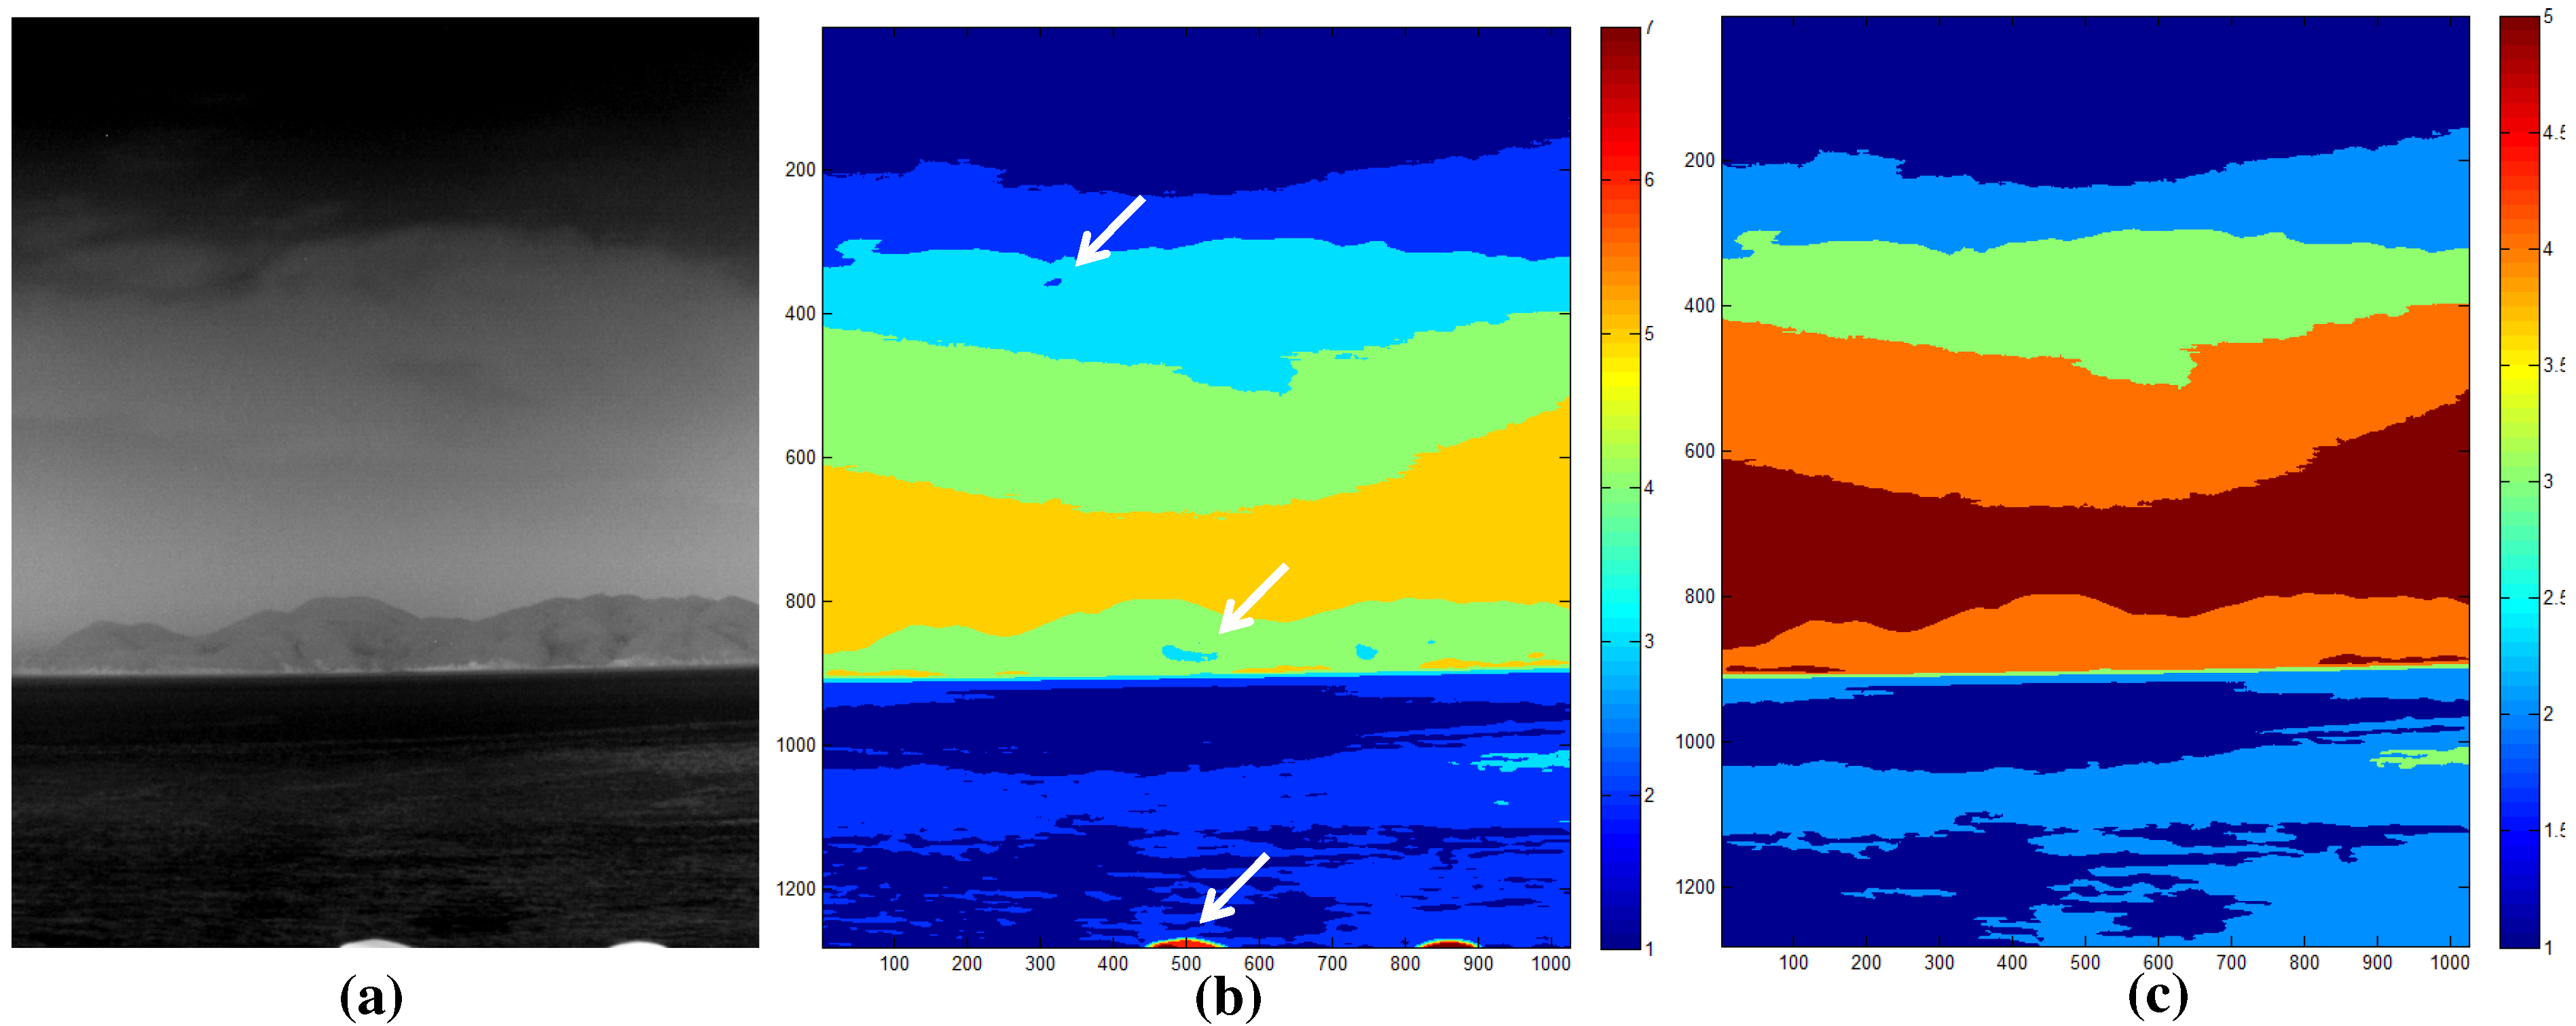
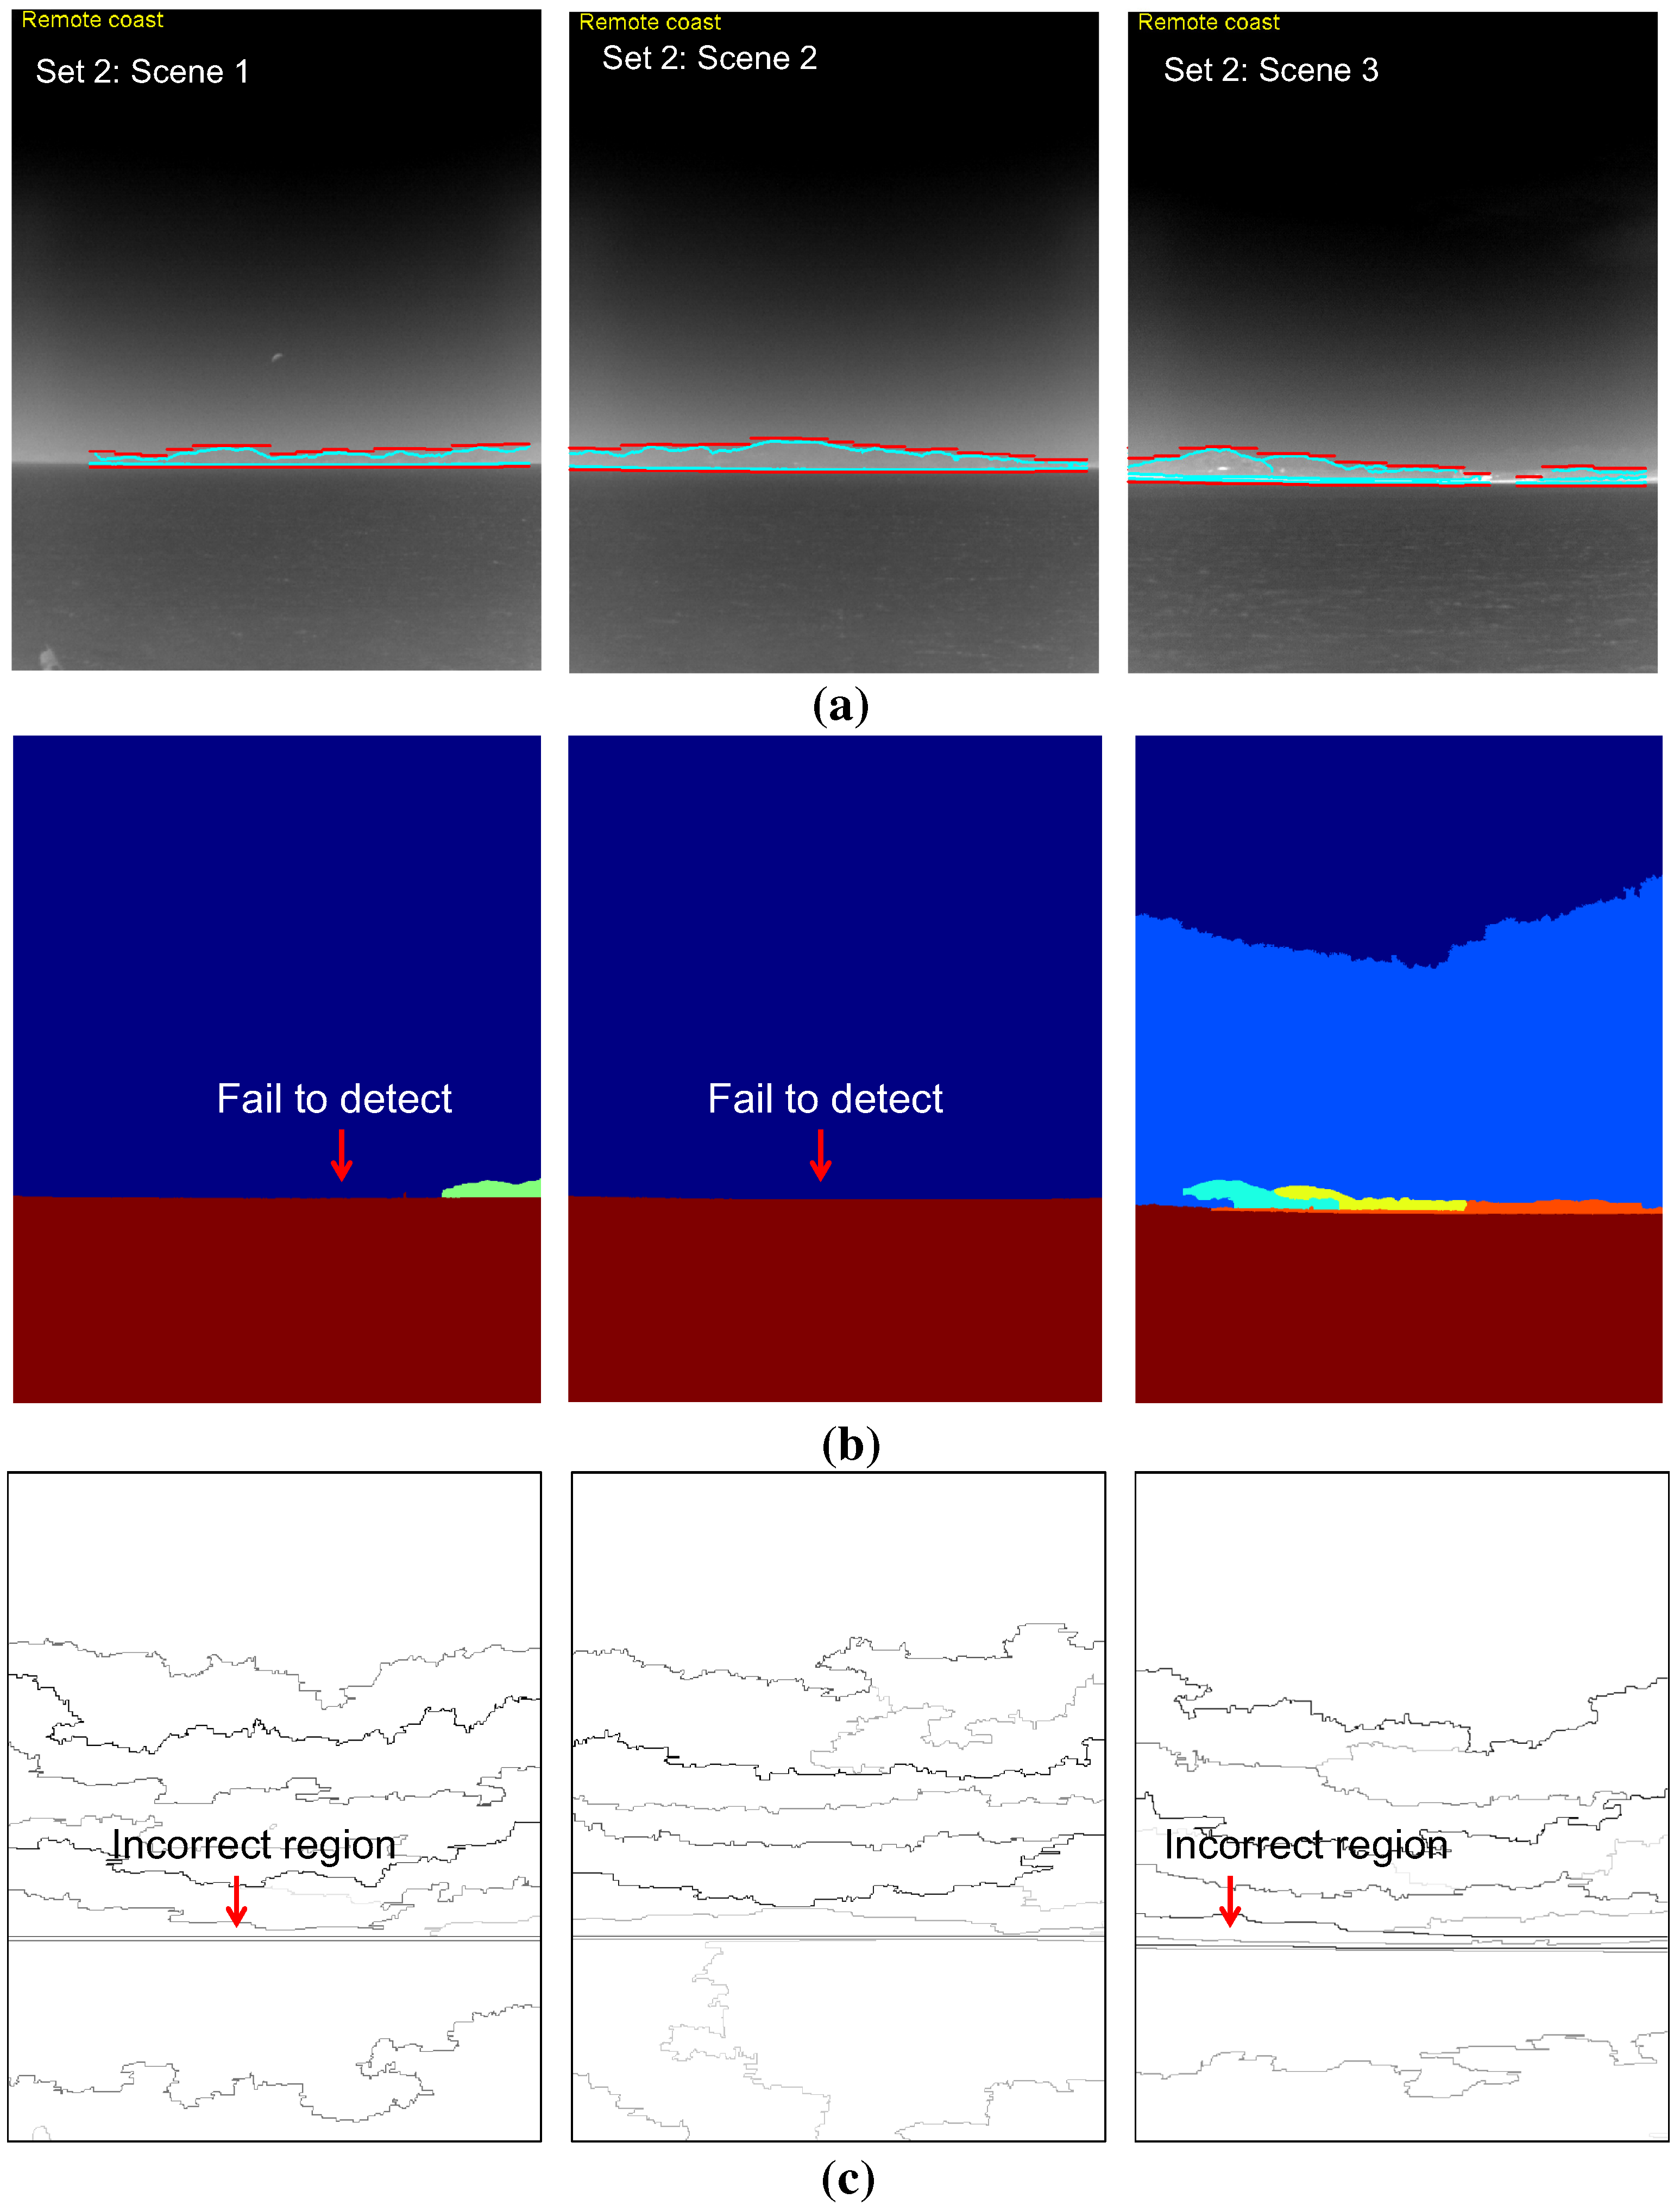
Figure 12a shows the region segmentation result for an infrared image with the number of regions, three. Although the N-cut showed excellent region segmentation in the color image, it showed poor results in the infrared image because of the lack of multi-spectral (red, green, blue) information. Another well-known bottom-up method is the mean-shift segmentation [
28]. The mean-shift finds clusters that maximize the local density.
Figure 12b presents the application results using the mean-shift algorithm. This works quite well, but it misses the important coastal regions indicated by the arrow. The bottom-up approaches require huge processing time and miss important coastal regions. On the other hand, a top-down region segmentation approach uses prior information of the region of interest, such as the snake or active contour model [
30]. The snake moves the initial contours to minimize both the external energy (edge similarity) and internal energy (elastic, bending energy).
Figure 12d shows the final region segmentation result using the initial shape shown in
Figure 12c. The top-down approach showed higher coastal region detection performance than the bottom-up approaches. On the other hand, it failed when there was weak contrast between the sky and coast region. Furthermore, it required the shape prior, and the initial position of the shape prior was selected manually, which is the weakest point of the algorithm.
Figure 12.
Limitations of the previous region segmentation approaches: (a) normalized graph cut (N-cut) with three prior regions; (b) mean-shift segmentation; (c) prior rectangle for snake; (d) after energy minimization in the snake algorithm.
Figure 12.
Limitations of the previous region segmentation approaches: (a) normalized graph cut (N-cut) with three prior regions; (b) mean-shift segmentation; (c) prior rectangle for snake; (d) after energy minimization in the snake algorithm.
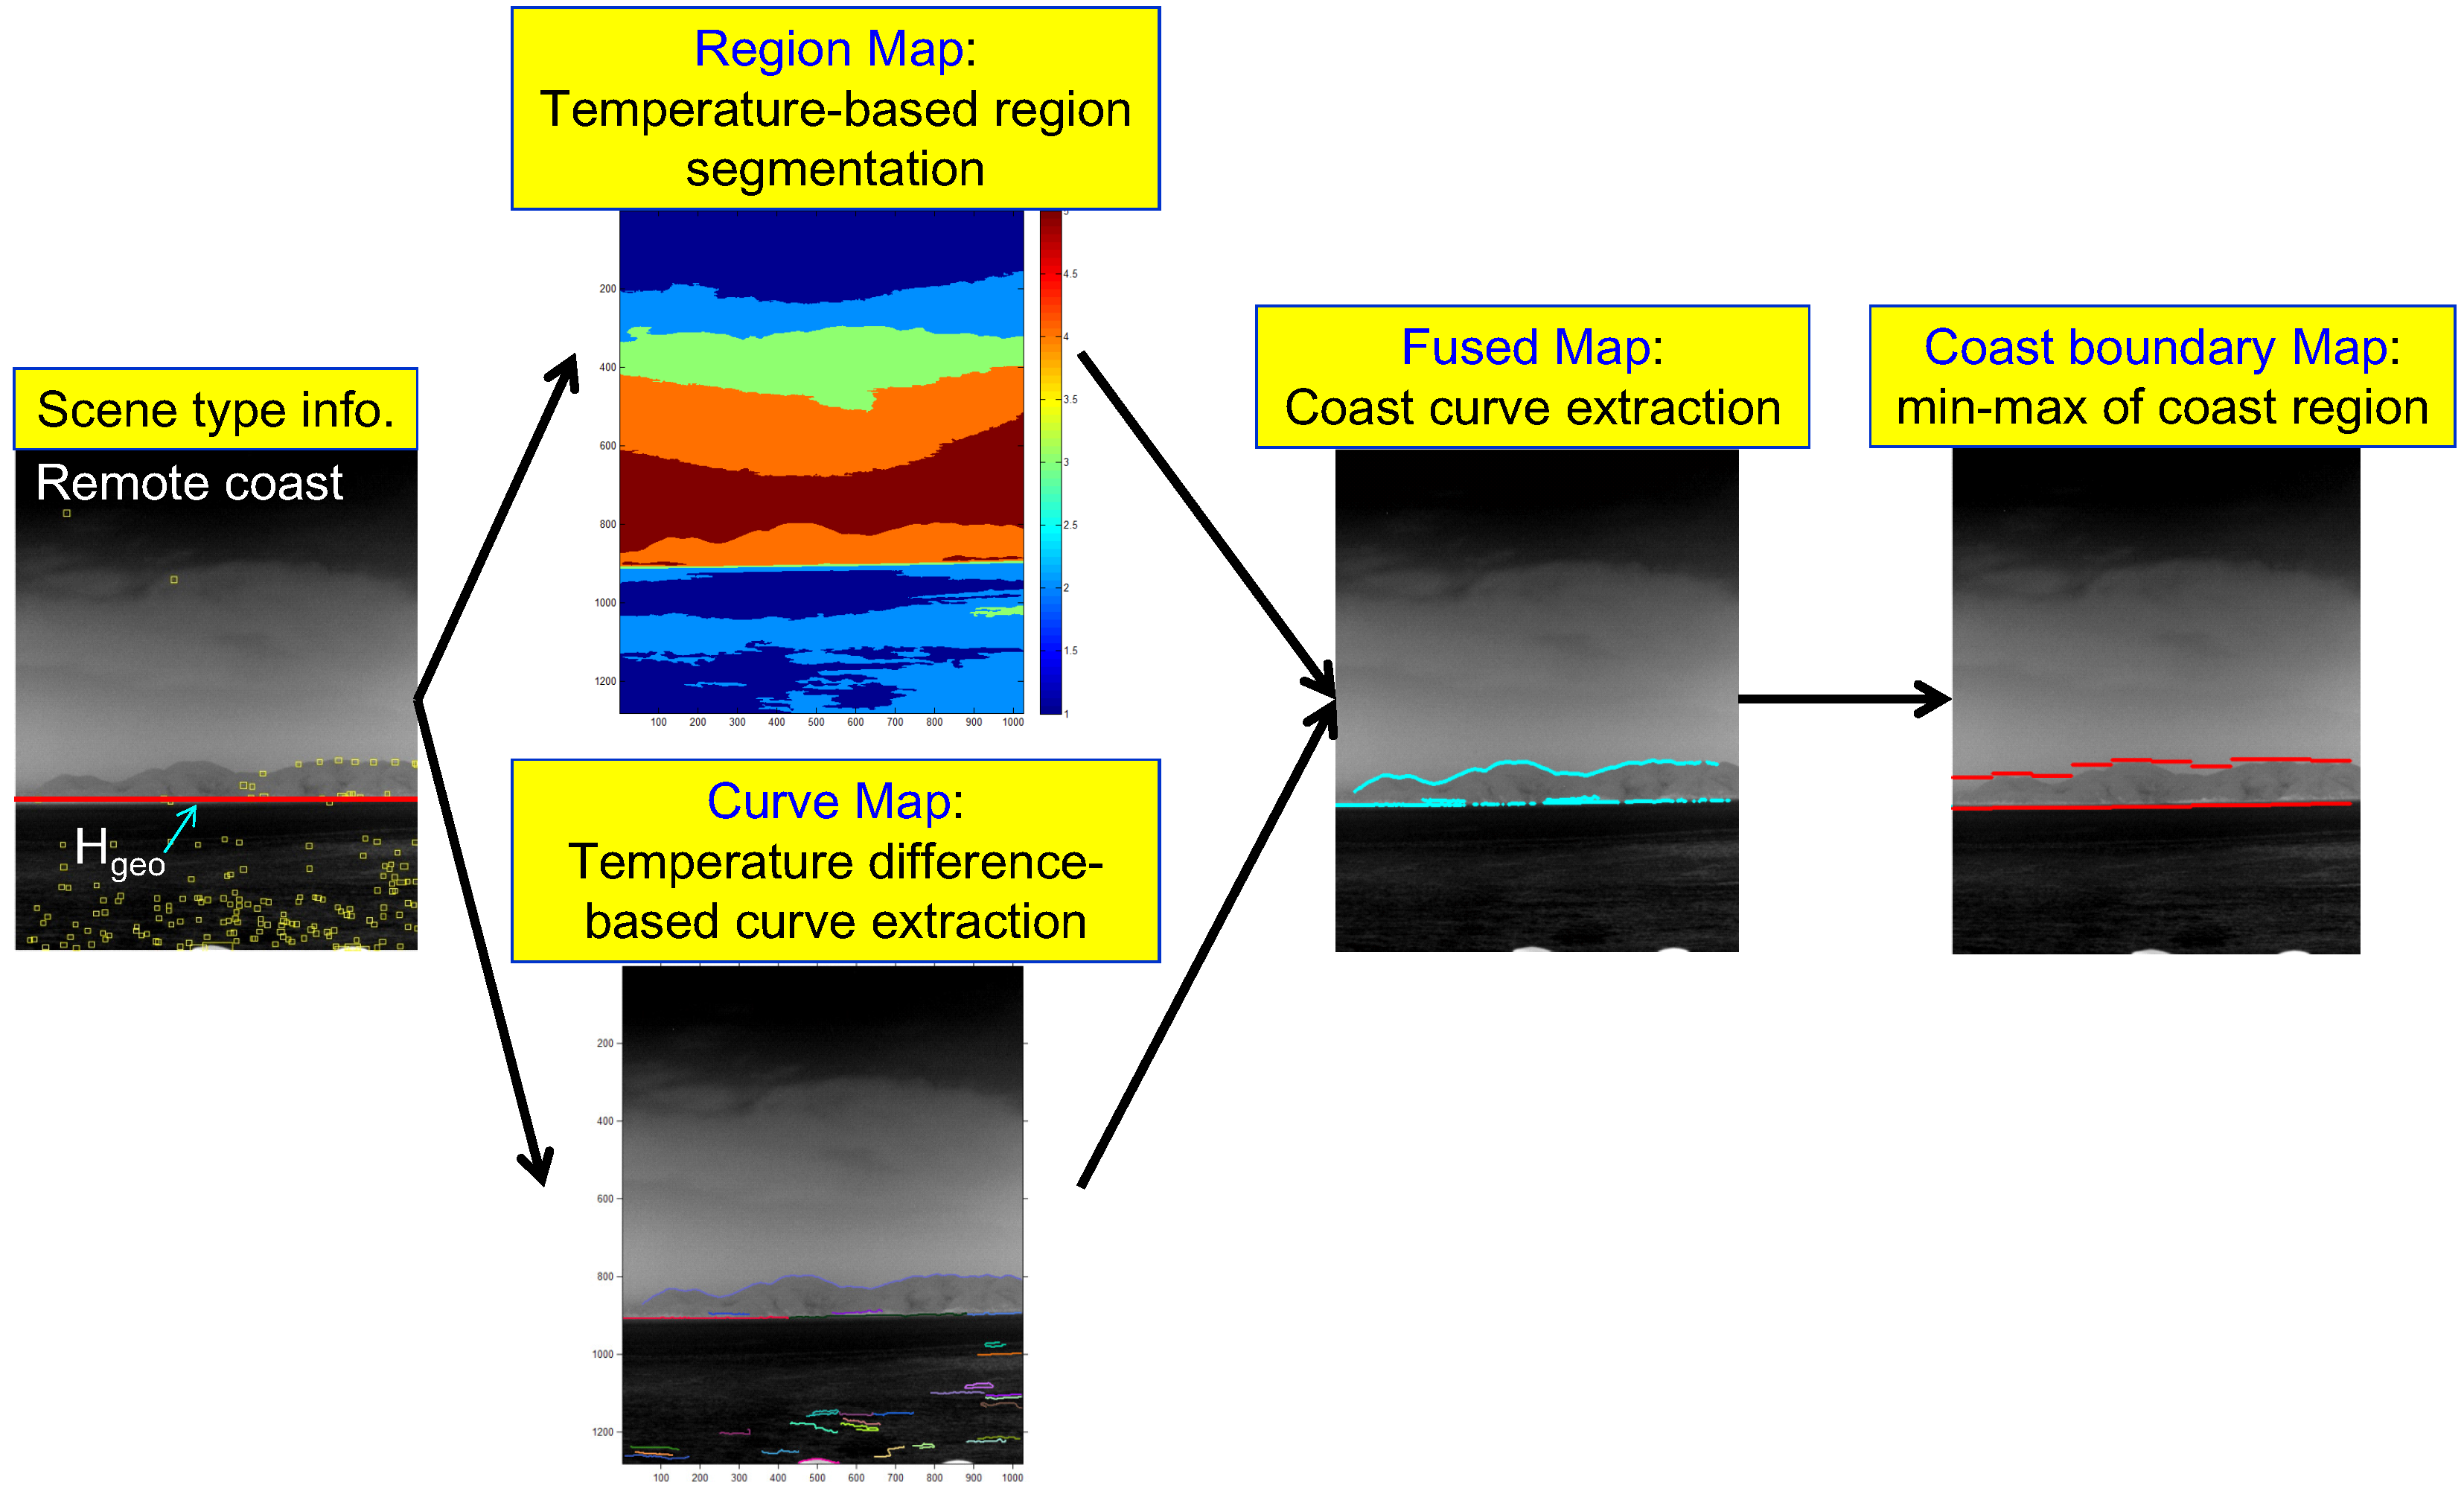
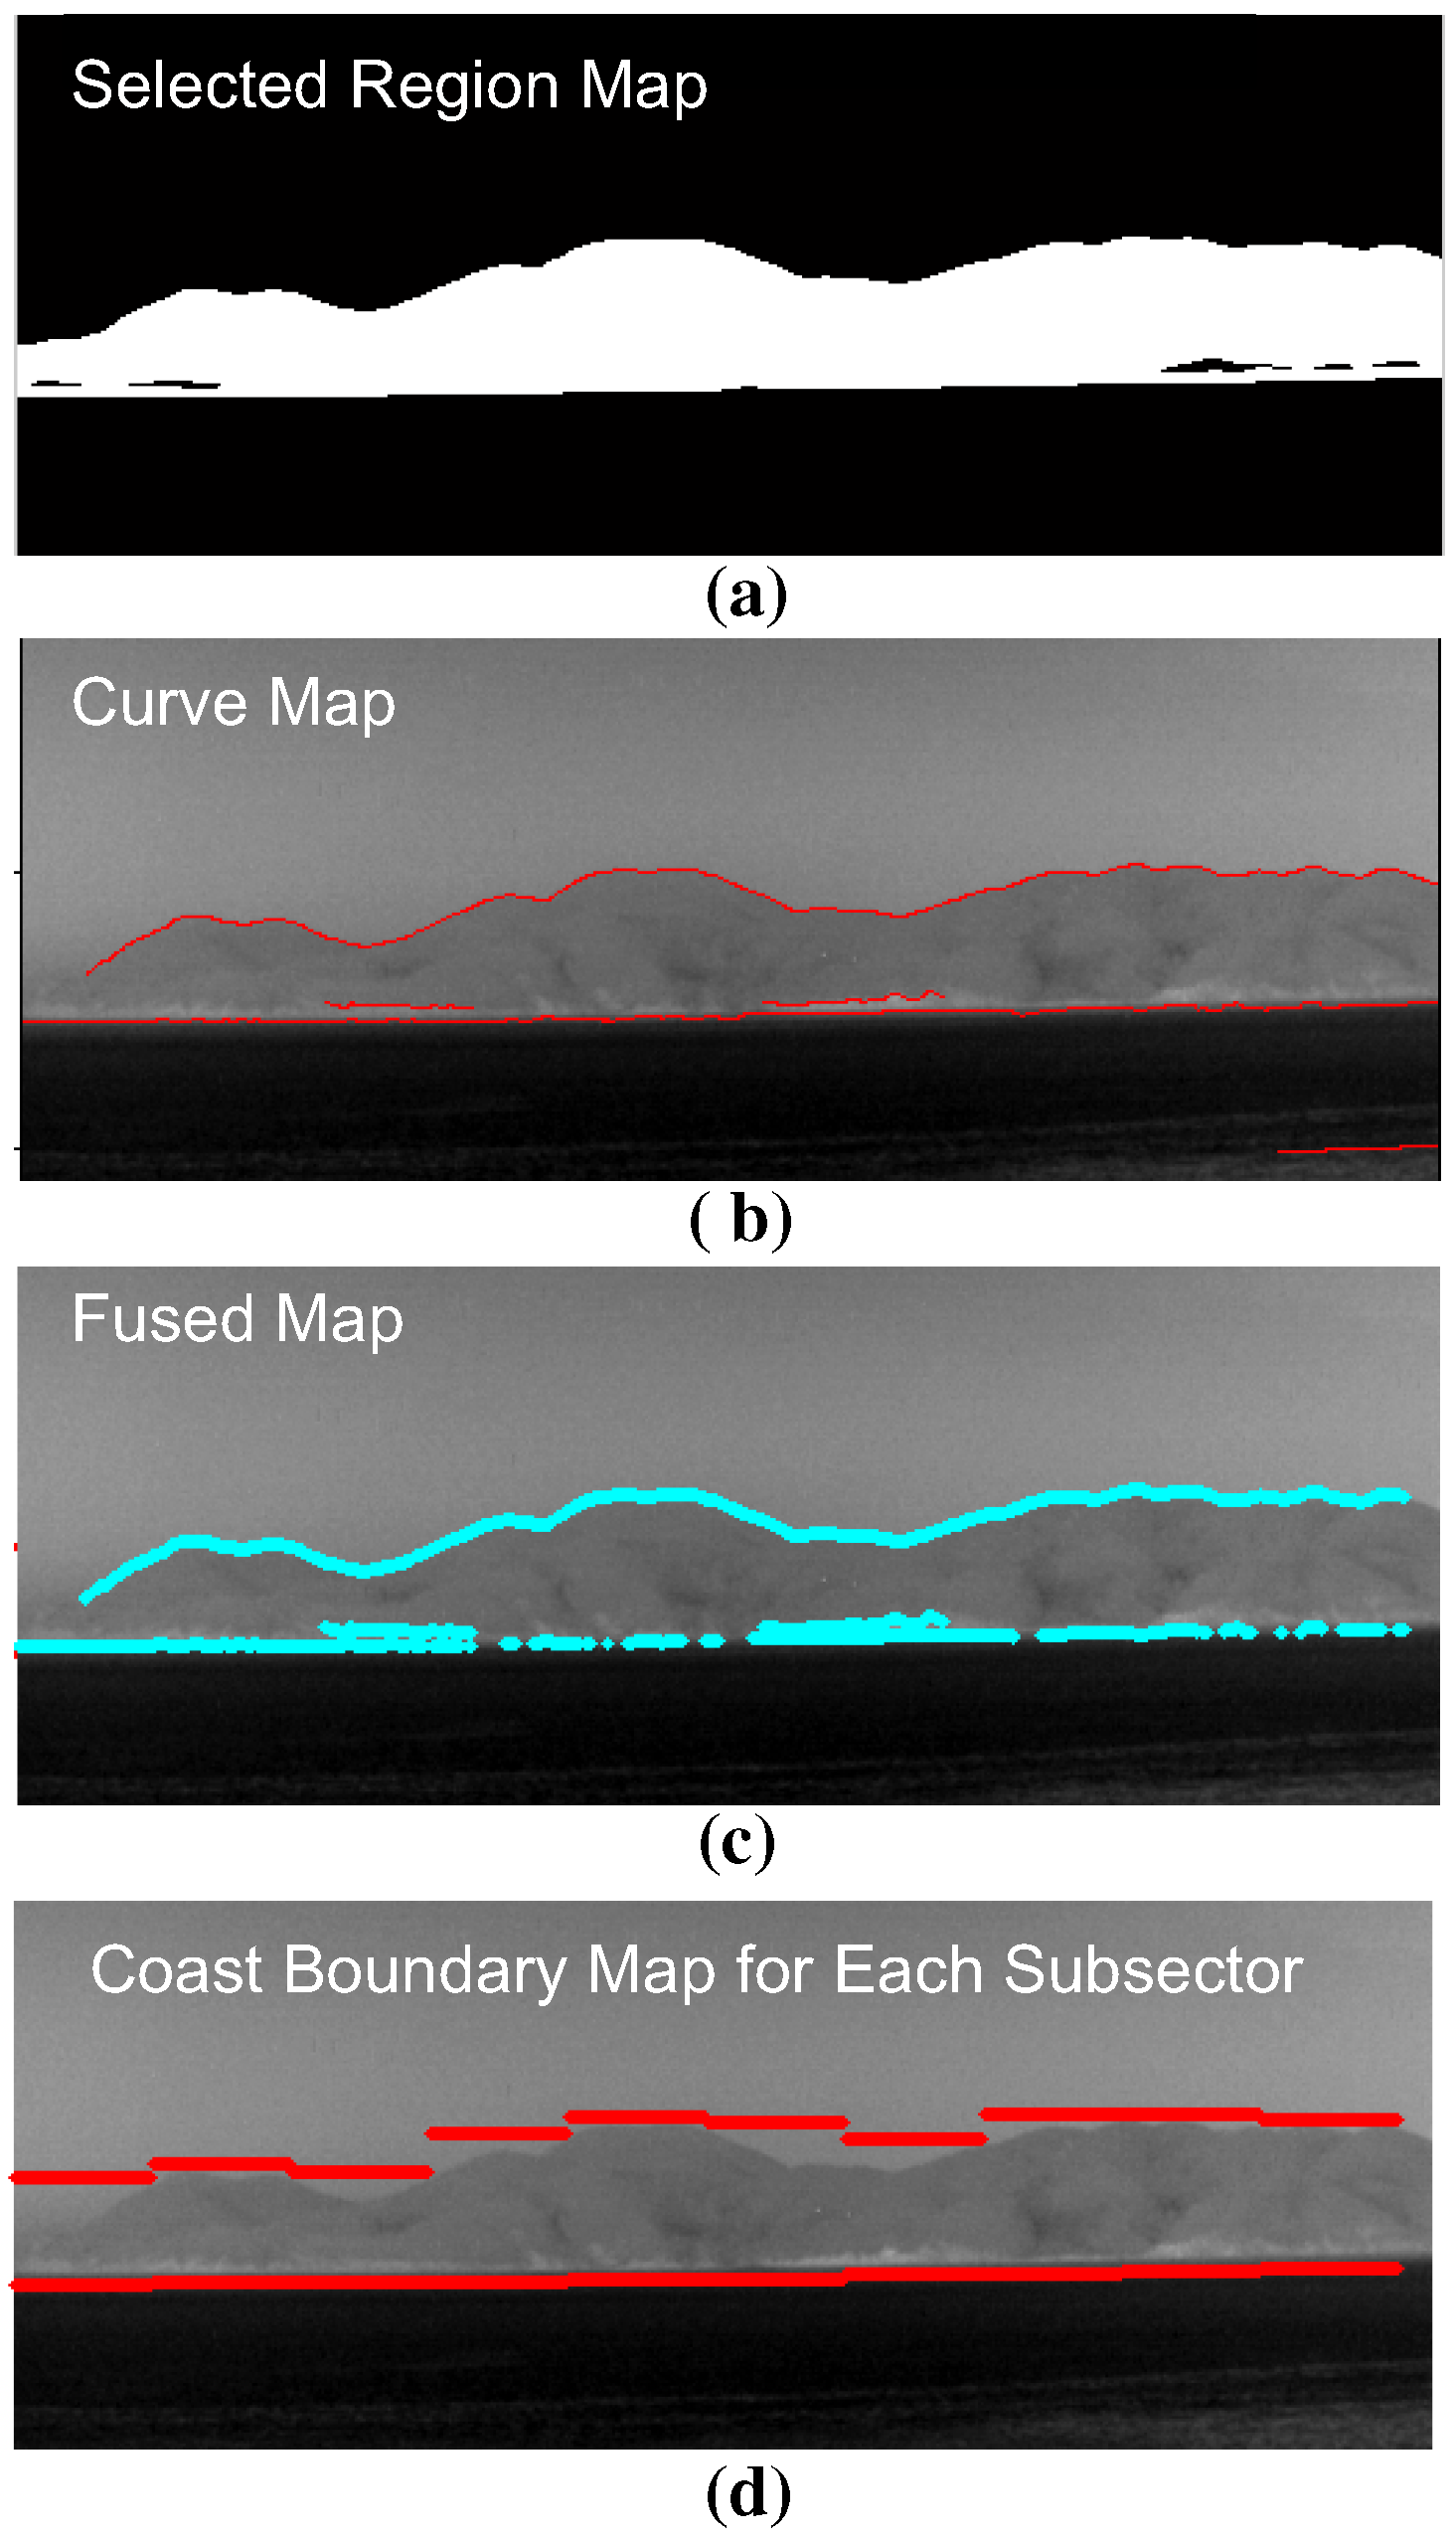
A novel coastal region detection method is proposed to overcome the limitations of previous approaches by fusing a region map and a curve map, as shown in
Figure 13. A region map is obtained using temperature-based segmentation, and a curve map is obtained using temperature difference-based curve extraction. Two important key issues of coastal region detection are whether or not a coast exists, and if it exists, how to initialize the fusion process to detect the coast region. In this study, the information (scene type, horizon) obtained in the scene type classification block was used. The proposed coast region detector is initiated, if the scene type is determined to be a coastal region (remote, near). After the region map and curve map are extracted, the geometric horizontal line (
) is used to select the related coast-like region in the region map. The curves that surround the selected coast-like region are then selected. The final coast boundary map is generated by finding the sub-sector-wise local minima and maxima of the fused map.
Figure 13.
Proposed coast region detection flow given in the scene type information.
Figure 13.
Proposed coast region detection flow given in the scene type information.
A region map (
) is generated using the K-means clustering algorithm, which is useful for segmenting regions according to the thermal energy [
31].
k represents the region label at the pixel position (
). The K-means clustering-based region segmentation method was selected instead of the complex N-cut or mean-shift to reflect the properties of the sky, coast and sea discussed in
Section 2.1. The average temperature of the sea region is cold relative to the coast region, despite the sky region having a wide temperature range.
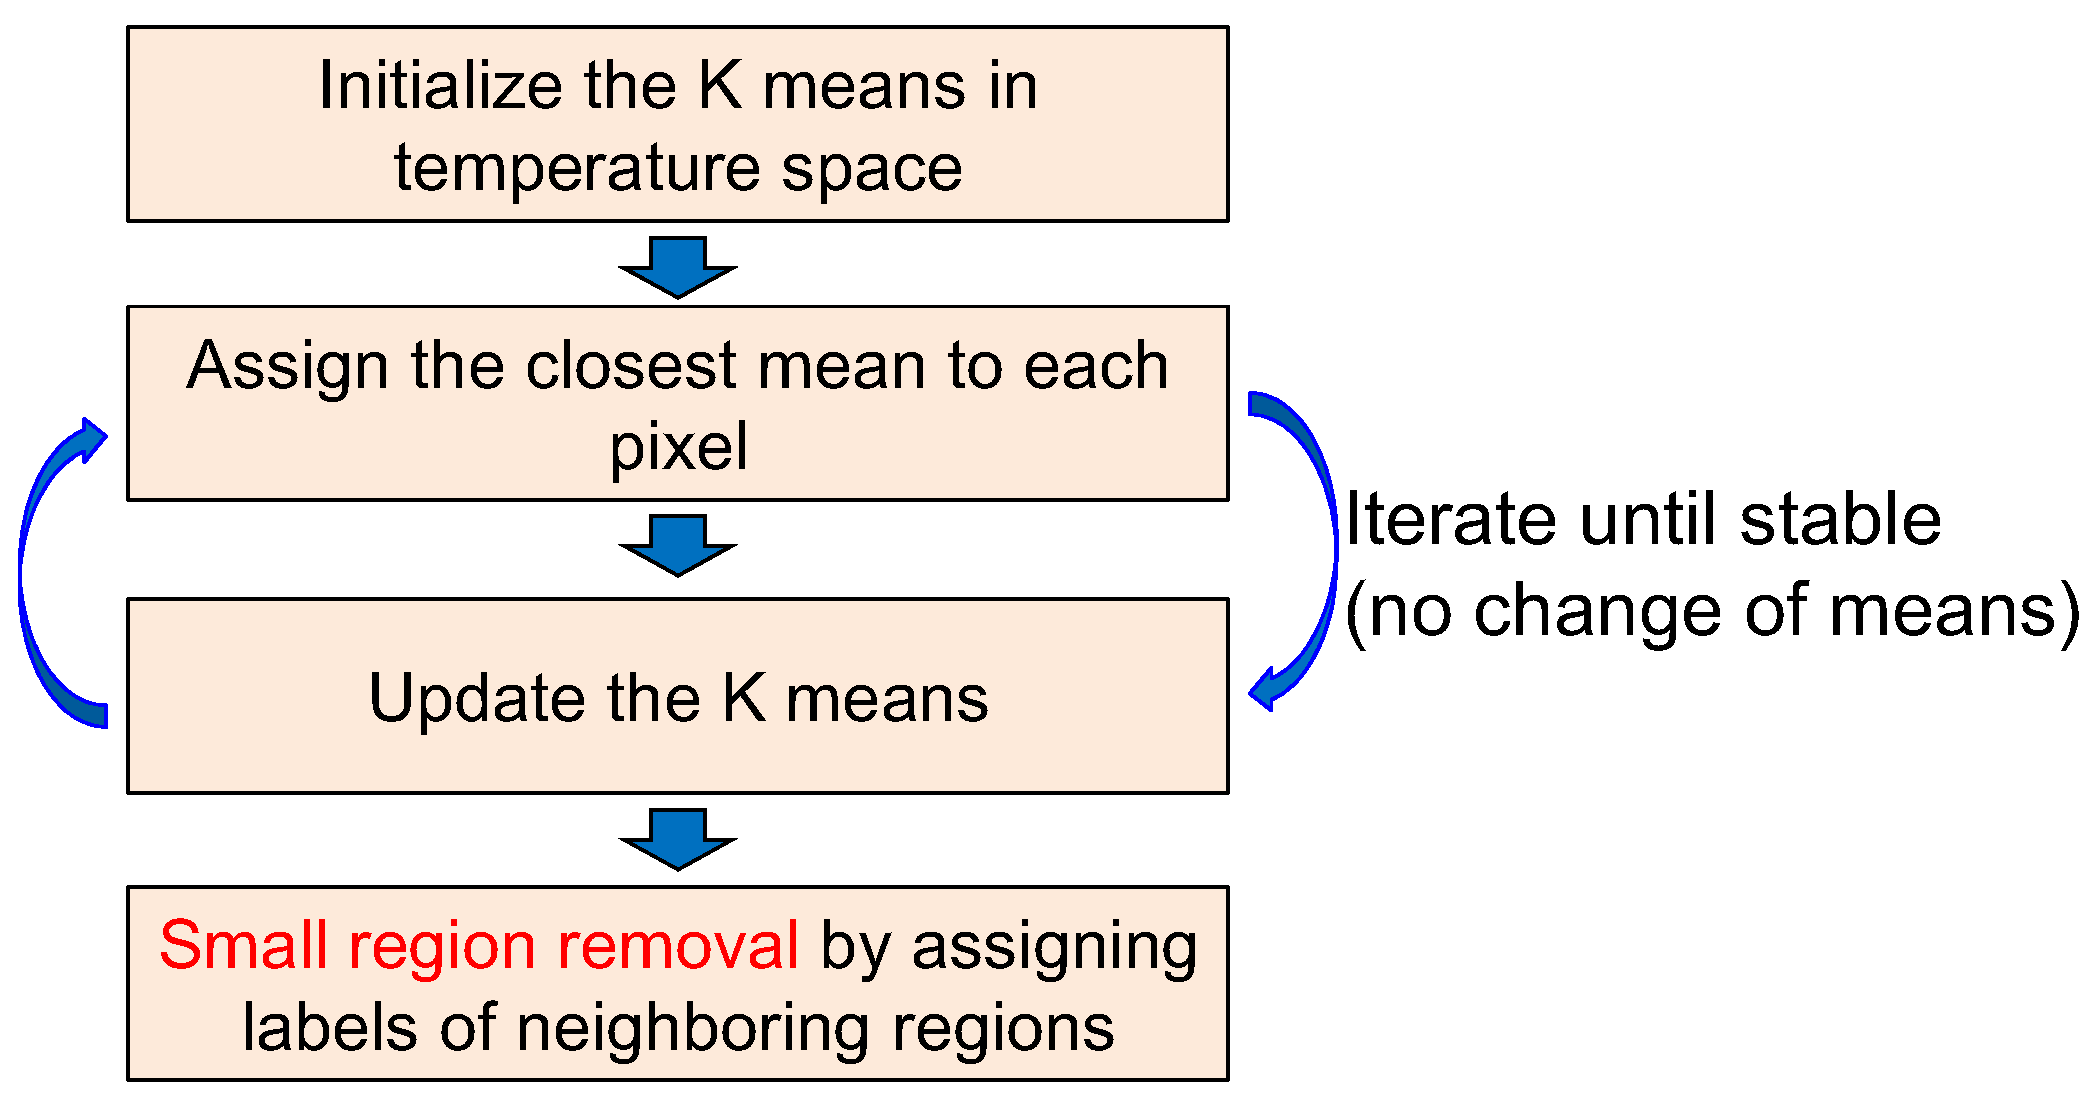
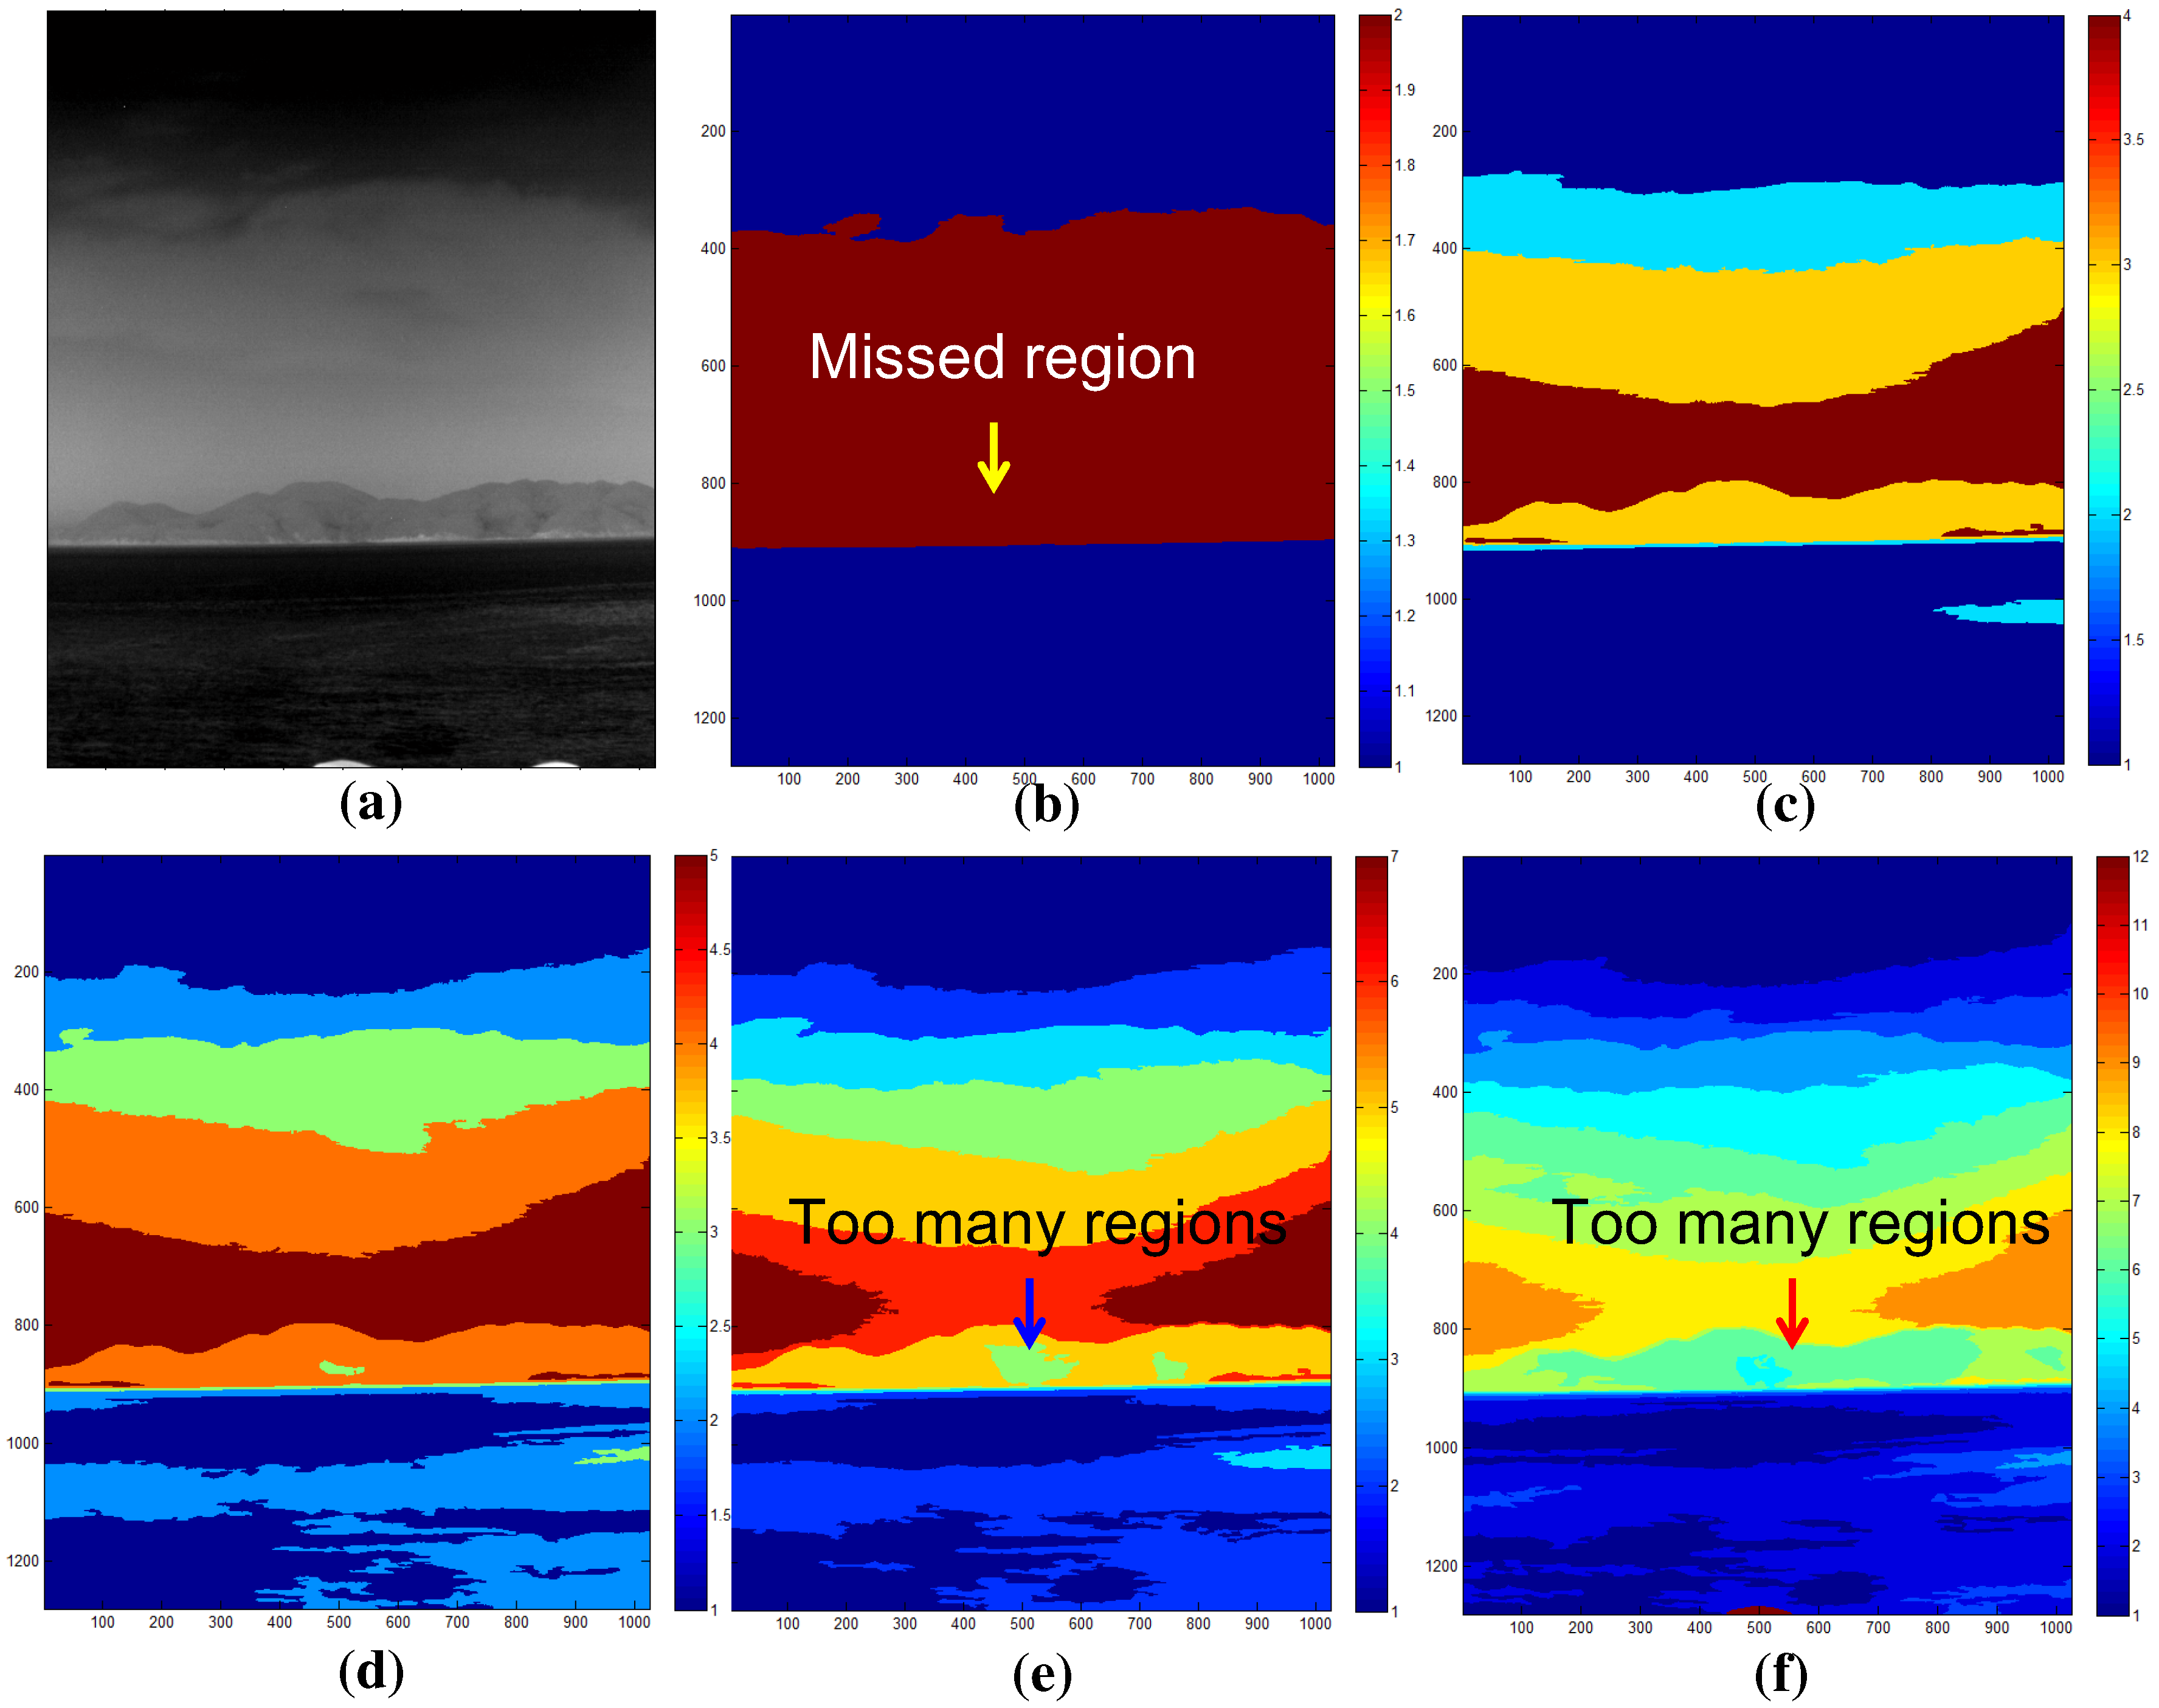
Figure 14 shows the K-means clustering algorithm, where K denotes the number of temperature centers. If K is seven, the initial temperature means (digital number) are 0, 36, 72, 108, 144, 180, and 216 for an eight-bit resolution. The label of each pixel is assigned to the label of the closest mean. The iteration continues until convergence, as shown in
Figure 15b for the test image of
Figure 15a. Furthermore, small region removal by assigning the labels of the neighboring regions is processed to obtain meaningful regions, as shown in
Figure 15c. Note that the small isolated regions indicated by the arrows in
Figure 15b are removed clearly in
Figure 15c.
Figure 14.
Region map extraction using K-means clustering and small region removal.
Figure 14.
Region map extraction using K-means clustering and small region removal.
Figure 15.
Results of the region map extraction: (a) test image; (b) original K-means clustering; (c) final region map.
Figure 15.
Results of the region map extraction: (a) test image; (b) original K-means clustering; (c) final region map.
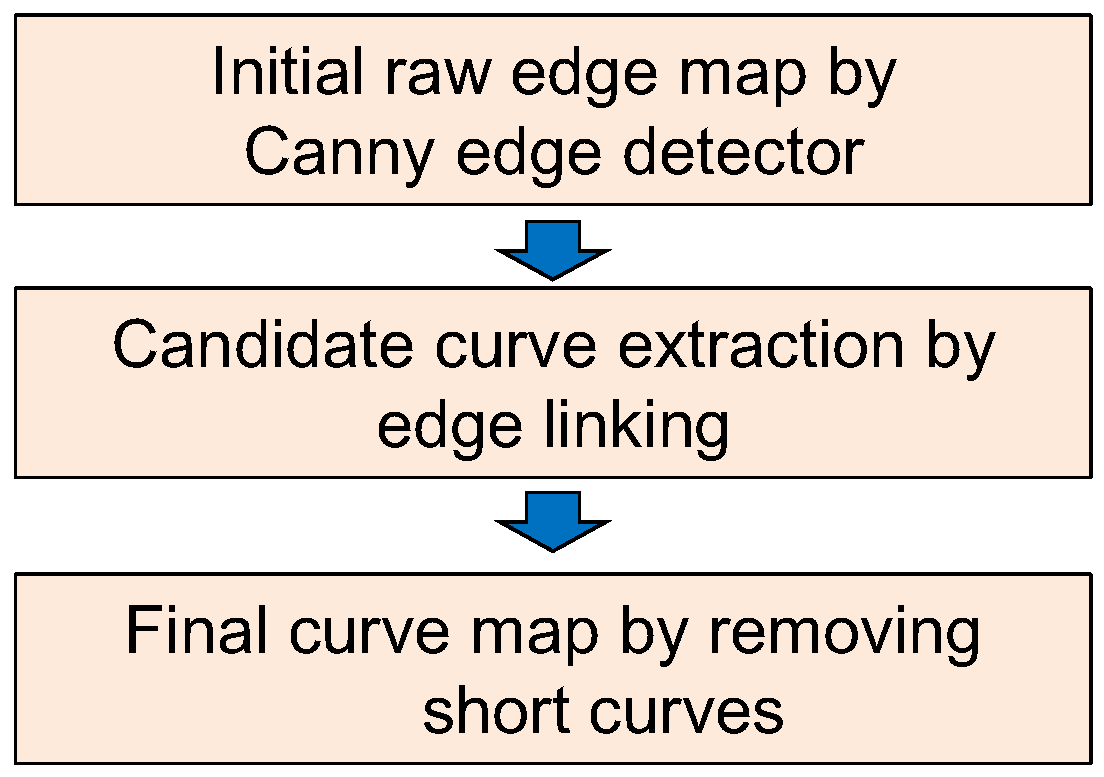
The sky-coast region and coast-sea region show different temperatures, which cause boundaries in the infrared images. A curve map (
) is calculated using the Canny edge detector and edge linking, as shown in
Figure 16. The Canny edge detector [
25] can determine the temperature differences using the Gaussian derivatives and non-maxima suppression, as shown in
Figure 17b for the input image in
Figure 17a. The curve fragments are extracted by applying the edge linking method with edge gap filling, as shown in
Figure 17c, where different colors represent the curve fragments identified. The final curve map is obtained by limiting the minimum curve length because the sky-coast boundary and coast-sea boundary have a long curve length, as shown in
Figure 17d.
Figure 16.
Curve map extraction using Canny edge detection, edge linking and short curve removal.
Figure 16.
Curve map extraction using Canny edge detection, edge linking and short curve removal.
Figure 17.
Results of curve map extraction: (a) test image; (b) initial raw edge map by Canny edge detector; (c) contour extraction with a gap size of 2; (d) final curve map by removing the short curves.
Figure 17.
Results of curve map extraction: (a) test image; (b) initial raw edge map by Canny edge detector; (c) contour extraction with a gap size of 2; (d) final curve map by removing the short curves.
The fused map (
) in
Figure 13 can be obtained from the selected region map (
) and curve map (
), as shown in
Figure 18. The selected region map is the result of the coast-like region selection considering both the geometric horizon line and clutter density, as shown in
Figure 19.
Figure 18.
Fused map and coast boundary map generation flow using the selected region map and curve map: (a) selected region map using horizon information; (b) extracted curve map; (c) fused map generation by applying an AND operation to the selected region and curve map; (d) coast boundary representation.
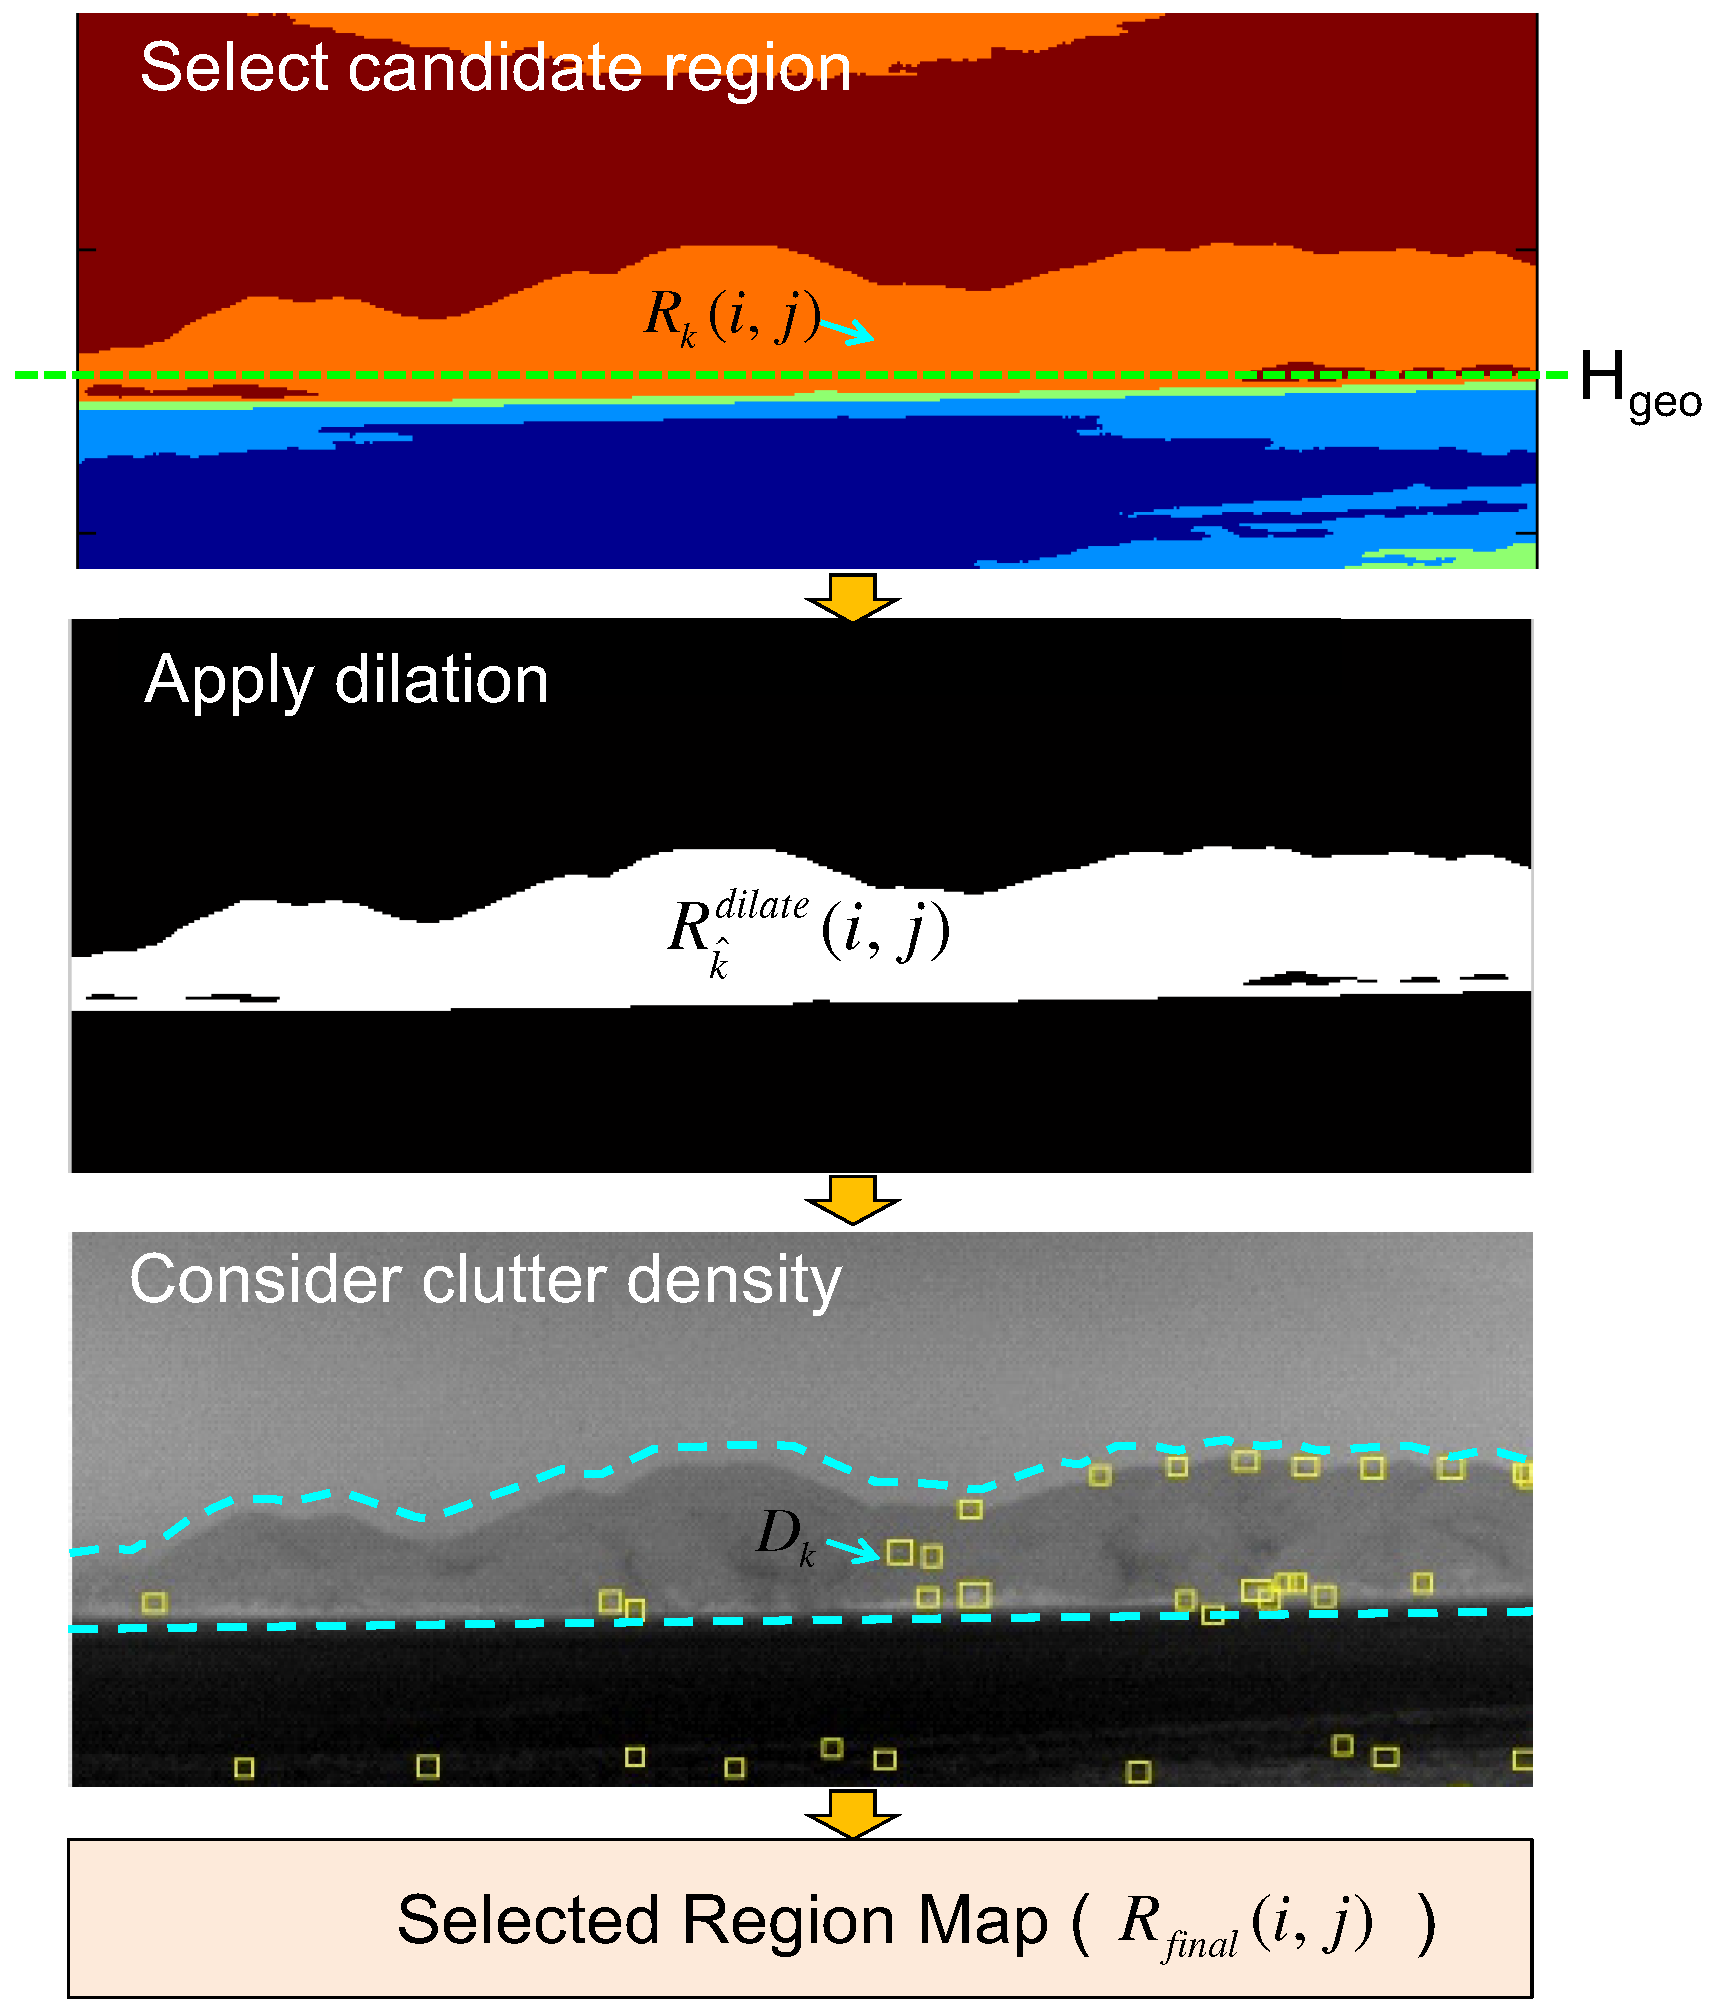
Figure 19.
Region map selection flow using the geometric horizon and clutter density.
Figure 19.
Region map selection flow using the geometric horizon and clutter density.
The candidate region label set (
) can be initialized using the predicted geometric horizon (
) along each column position as expressed in Equation (
7).
The region (
) with a specific label (
) is expanded using a morphological dilation method [
32] to include the coastal edges using Equation (
8).
The initial region labels are refined further (
) using the density (
) of clutter of the related regions, as expressed in Equation (
9). The clutter density of a region with an index of
can be estimated by dividing the number of pre-detections (
) by the area of the specific region (
), as expressed in Equation (
10).
The finally selected region map (
) is generated by merging the surviving coast-like regions, as expressed in Equation (
11).
The fused map (
) is obtained by applying AND fusion [
33] of the selected region map (
) with the curve map (
), as expressed in Equation (
12).


