
Camera on Vessel: A Camera-Based System to Measure Change in Water Volume in a Drinking Glass

Abstract
:1. Introduction
2. State-of-the-Art
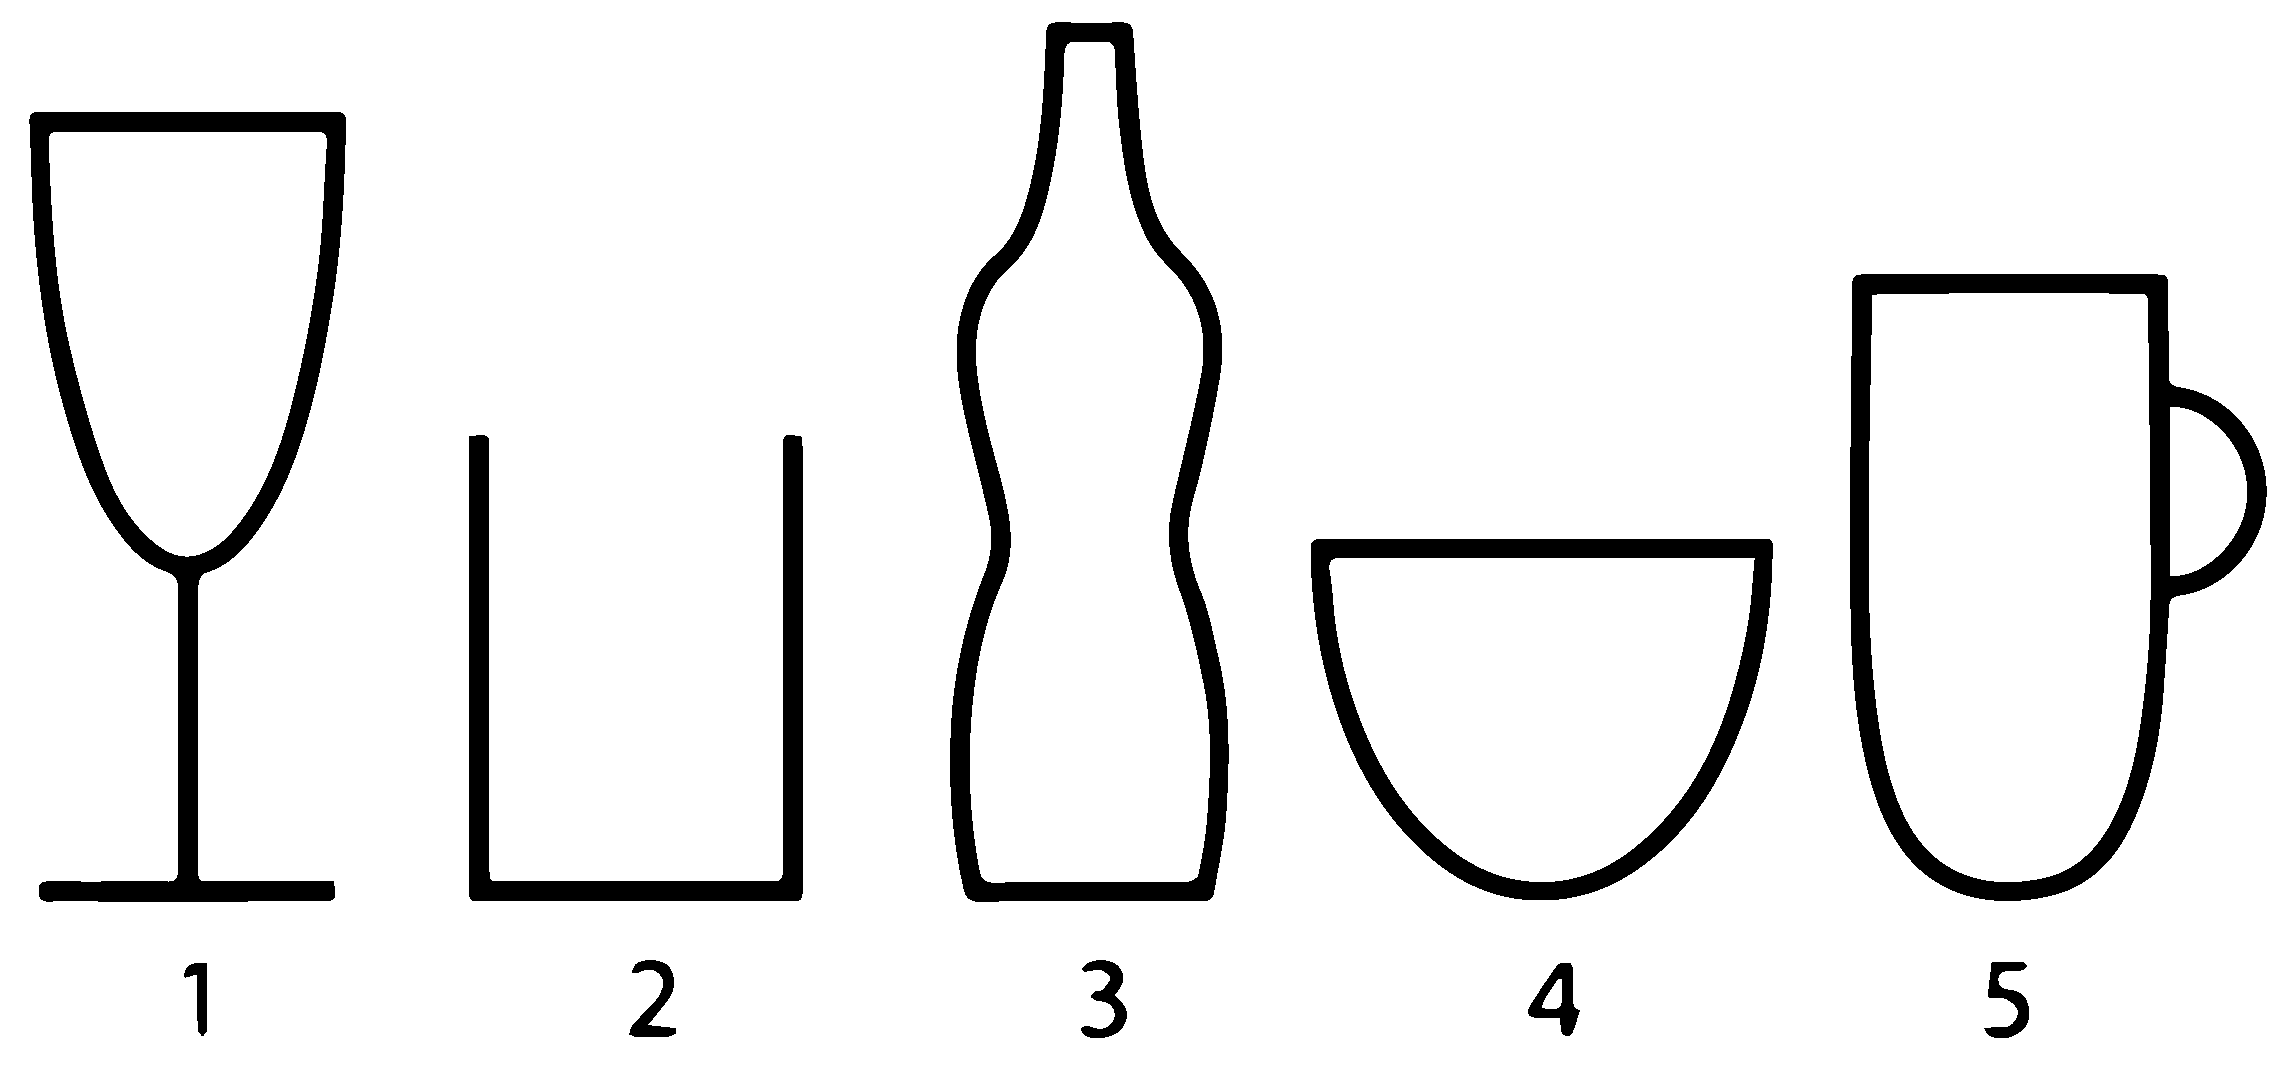
- Technology Application and Accuracy—refers to how the sensor is relevant or applicable to different vessels or shapes in estimating the change in the liquid volume. Examples of the shapes are shown in Figure 1.
- Technological feasibility—refers to the technological challenges, and the integration possibilities of the sensor device.
- Human factor—refers to the factors affecting the use of the device from the users’ perspective. These factors may include, ease of transportation, the ease to attach onto the vessel, cleanability, and the ability to use for ambulatory or stationary situations.


| Sensor Technology/Method | Example Product/Image | Technology Application and Accuracy | Technological Feasibility | Human Factor |
|---|---|---|---|---|
| Immersion Method Liquid pressure transducer: Measures the force required to stop the fluid from expanding. |  | The sensor can measure depth accurately in tanks and basins. It is not suitable in small vessels (as shown in Figure 1) due to its bulkiness. | The technology is well applied in the industry. They are not so miniaturized, therefore, difficult to integrate in the vessels; nevertheless, integration within the vessel might be required. | The sensor requires contact with the liquid to measure. This can make it difficult to clean. The sensor may be required to be integrated in the vessel which makes it bulky to transport. When integrated, it can be suitable for stationary and ambulatory use. |
| Clip-on Method Proximity sensor (i.e., ultrasonic distance sensor): Measures the distance from the surface of the liquid to the top of the container. | Trago [9]: Is a design that incorporates a proximity sensor within a bottle cover. It detects the distance from the bottle cover to the surface of the contained liquid. The prototype is in development phase on Kick-starter. | The sensor can be made to fit on all forms shown in Figure 1. However, the shape of the vessel should be known and calibrated accordingly to assure accuracy of the measurements. Better accuracy is achieved when the container has a regular form. | The sensor is required to be miniaturized to be integrated into the vessel cover or as a clip-on device. The perpendicular alignment of the sensor is also very important to avoid diagonal readings, which makes it challenging. | It can be contactlessly used as a clip-on or a bottle cover that can be easy to attach. The user will need to specify the shape of the vessel for proper calibration. It will be easy to clean as a separate device. When designed as a clip-on device, it should not be in the way of drinking and should not be contaminating. The device can be made portable as it depends on the design. |
 | ||||
| Clip-on Method CMOS Camera: The camera is used to capture images within the vessel to approximate the liquid surface area and the change in the liquid level. | Camera on Vessel: The design incorporates a camera that can be clipped on the edge of a vessel type 1, 2, 4, 5 as shown in Figure 1. (This paper present the development of this device type) | Calibrated to measure the change in liquid volume for a single cup. | It requires image processing and geometric conversions. The image quality is also dependent on the lighting conditions. Miniaturization is desired. | When miniaturized, it can be used without obstructing drinking. When miniaturized, it can easily be transported. It is portable for outdoor use. It provides the possibility to identify the content of the glass (i.e., water, milk, etc.). |
 | ||||
| Band Method Capacitive level sensor: Capacitive level sensors consist of two plates. The capacitive value between the plates will change depending on the liquid level in the vessel. The change in value also depends on the dielectric property of the liquid. | Capacitive Sleeve: With this design, the capacitor plates are integrated into a sleeve-like design. It measures the capacitive liquid level from the outside walls of the container. Device is in research phase. | The sleeve can easily be wrapped around a regularly shaped/ elongated vessels such as 1–3, 5 in Figure 1. Capacitive level sensing is accurate depending on the area of the plates and the dielectric material. Water has a high dielectric constant that is highly sensitive to the change in liquid level. While, coffee has a low dielectric constant that is less sensitive. | Capacitive level sensing is well known and applied in the industry that can be applied in the design of the capacitive plate. A major challenge is to shield the capacitive field from external capacitance such as touch. This will allow proper measurements. The technology can only measure the liquid level and not the volume. It should be used for known diameters only. Otherwise, an additional sensor should be used to measure the diameter of the vessel. The electronic should be flexible and miniaturized for proper integration in the sleeve. | The user is required to wrap the sleeve around the vessel before drinking. The device supports good hygiene, as it is not required to have contact with the liquid or the drinking area. It can be applied to a variety of containers suitable for various scenarios or applications. The form factor makes it possible to use on the go. It can be obtrusive if the sleeve is not properly designed/ integrated. |
 | ||||
| Band Method Accelerometer/ gyroscope: Measures movement and orientation due to gravity. | THE + HUG [10]: A sensor band that tracks water intake by movement. | May apply to all shapes. It can only measure drinking action and cannot measure the quantity that was drunk. | Simple and accessible sensor. It is challenging to estimate drinking based on movement. | It is non-obtrusive. It would not bother the user while drinking. |
| Base Method Strain gauge/air pressure sensor: Measures the change in weight of the vessel. | Obli [7]: A device available on the market used for tracking drinking. It measures the weight of a fixed bottle and assumes the weight of water. It can give notifications when the user does not drink. | The weighing technique can be used for different vessels when placed on flat surface. The measurement should be re-calibrated when used with different weights. Can perform very accurate measurement. | Weight sensors are accessible and industrially well known. It is easy to calibrate. | Requires discipline, only works if vessel is placed on the sensor each time before and after drinking. It is most applicable for home use. Not obstructive, does not bother user while drinking Simple and easy to apply. |
| Tubular Method Flow sensor: Measures flow from a drinking tube. | BluFit [11]: The sensor is placed on the cover of the bottle. It measures the amount of liquid that flow through the tube as the user drinks. Device is in development phase.  | The sensor is limited to a single bottle. It can only be used on a bottle or a container that has a lead. Flow sensors are generally accurate. | Flow sensors/techniques are accessible and industrially well known. | It measures when the user actually drank from the bottle. Requires user to drink all liquids from the same bottle. |
| Manual Method Drink counting App: The user can manually log his drinking activities using a mobile-phone application. | Waterlogged [12]: With the mobile application, the user can manually log his drinking activities. | It does not matter what kind of vessel used for drinking. | Many applications are available and do not constitute a major technical challenge. It is difficult to capture drinking at the moment it occurs. | It is unreliable for the user to estimate the size of every drinking glass and to register appropriately. It is difficult for the user to keep track of multiple drinking activities. It requires a subjective estimation. |
3. Approach
3.1. Setup and Assumptions
3.2. Feasibility Study

4. Method
4.1. Image Capture
4.2. Processing
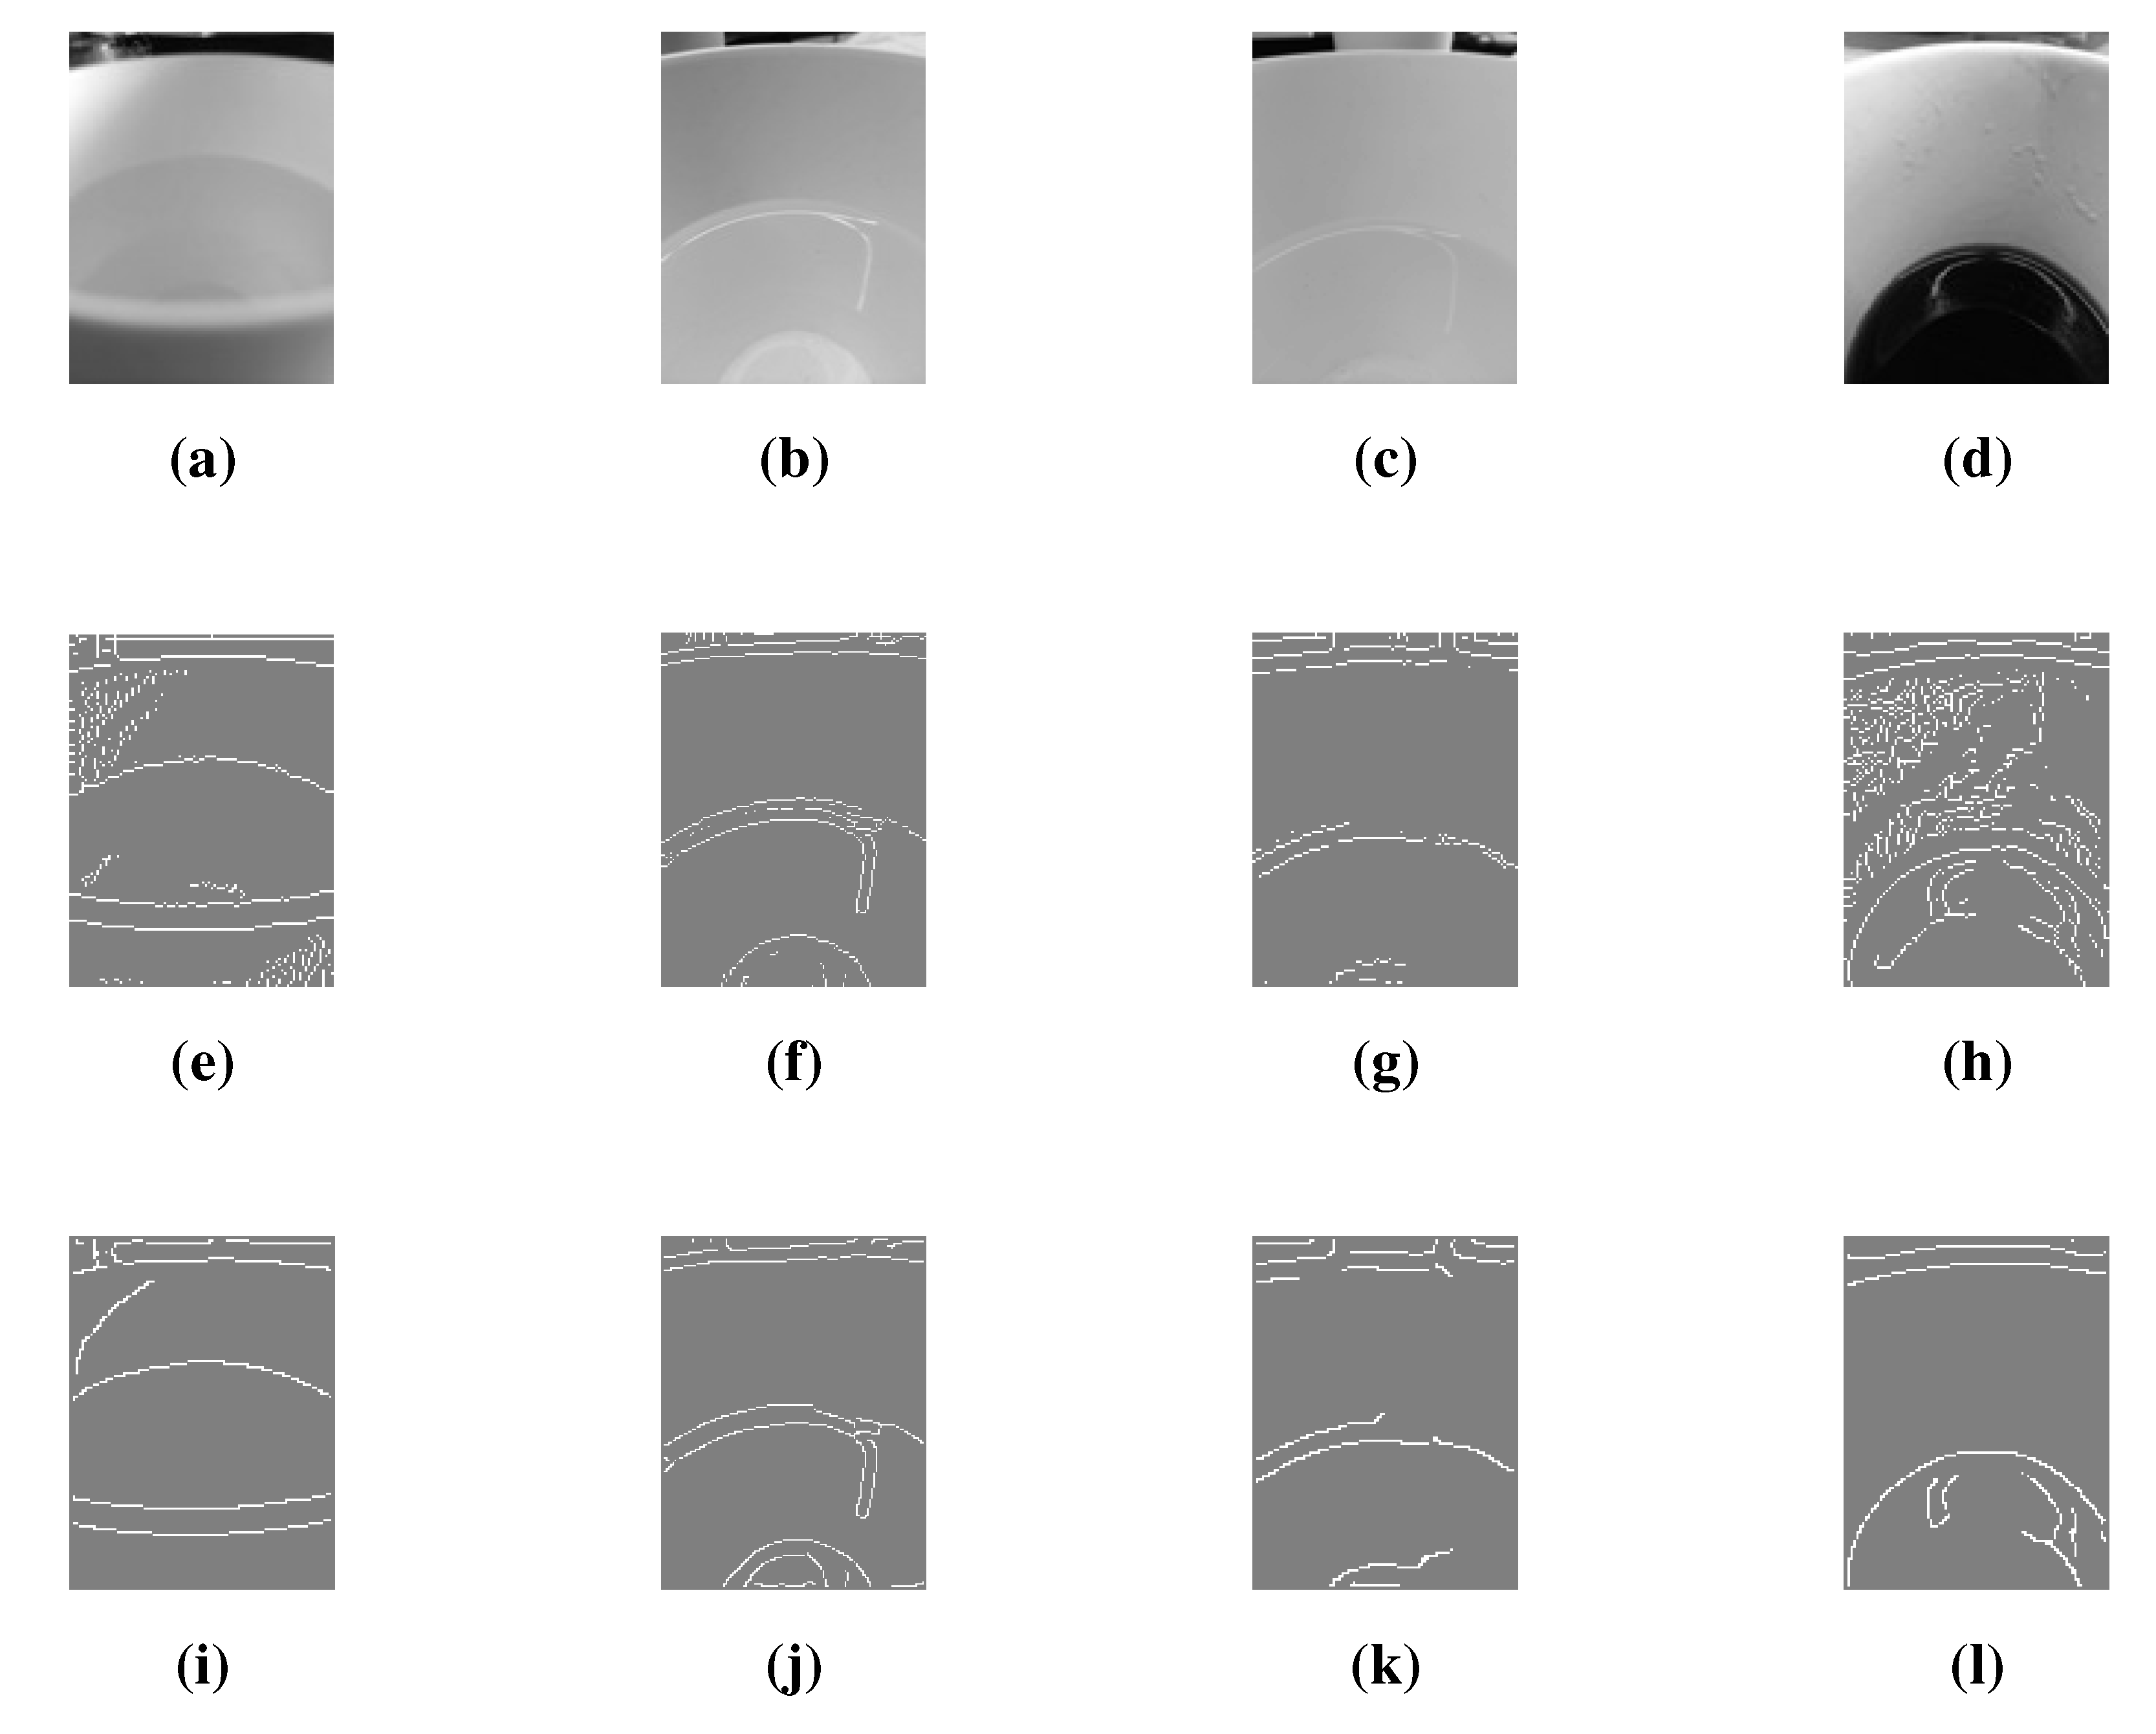
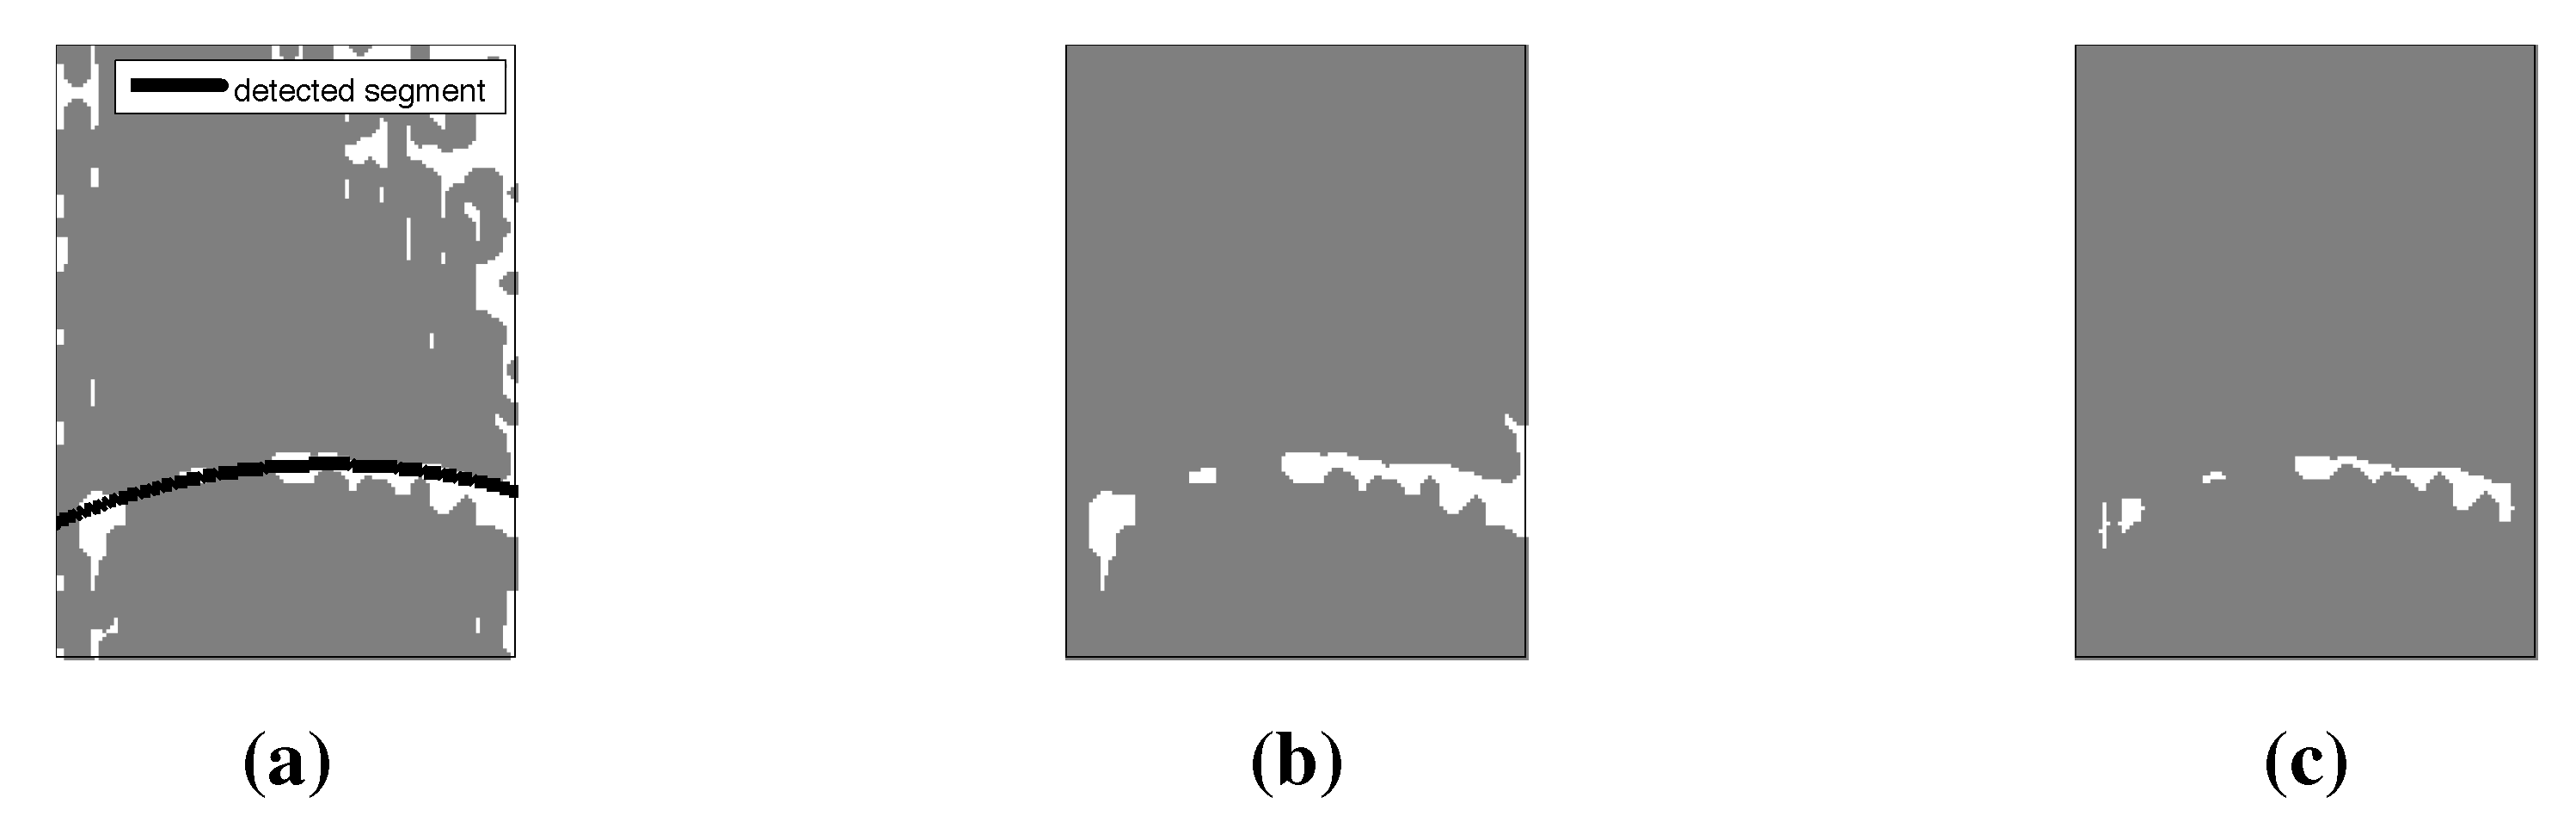
4.2.1. Segmentation
4.2.2. Level Detection

4.2.3. Formulating the Missing Points
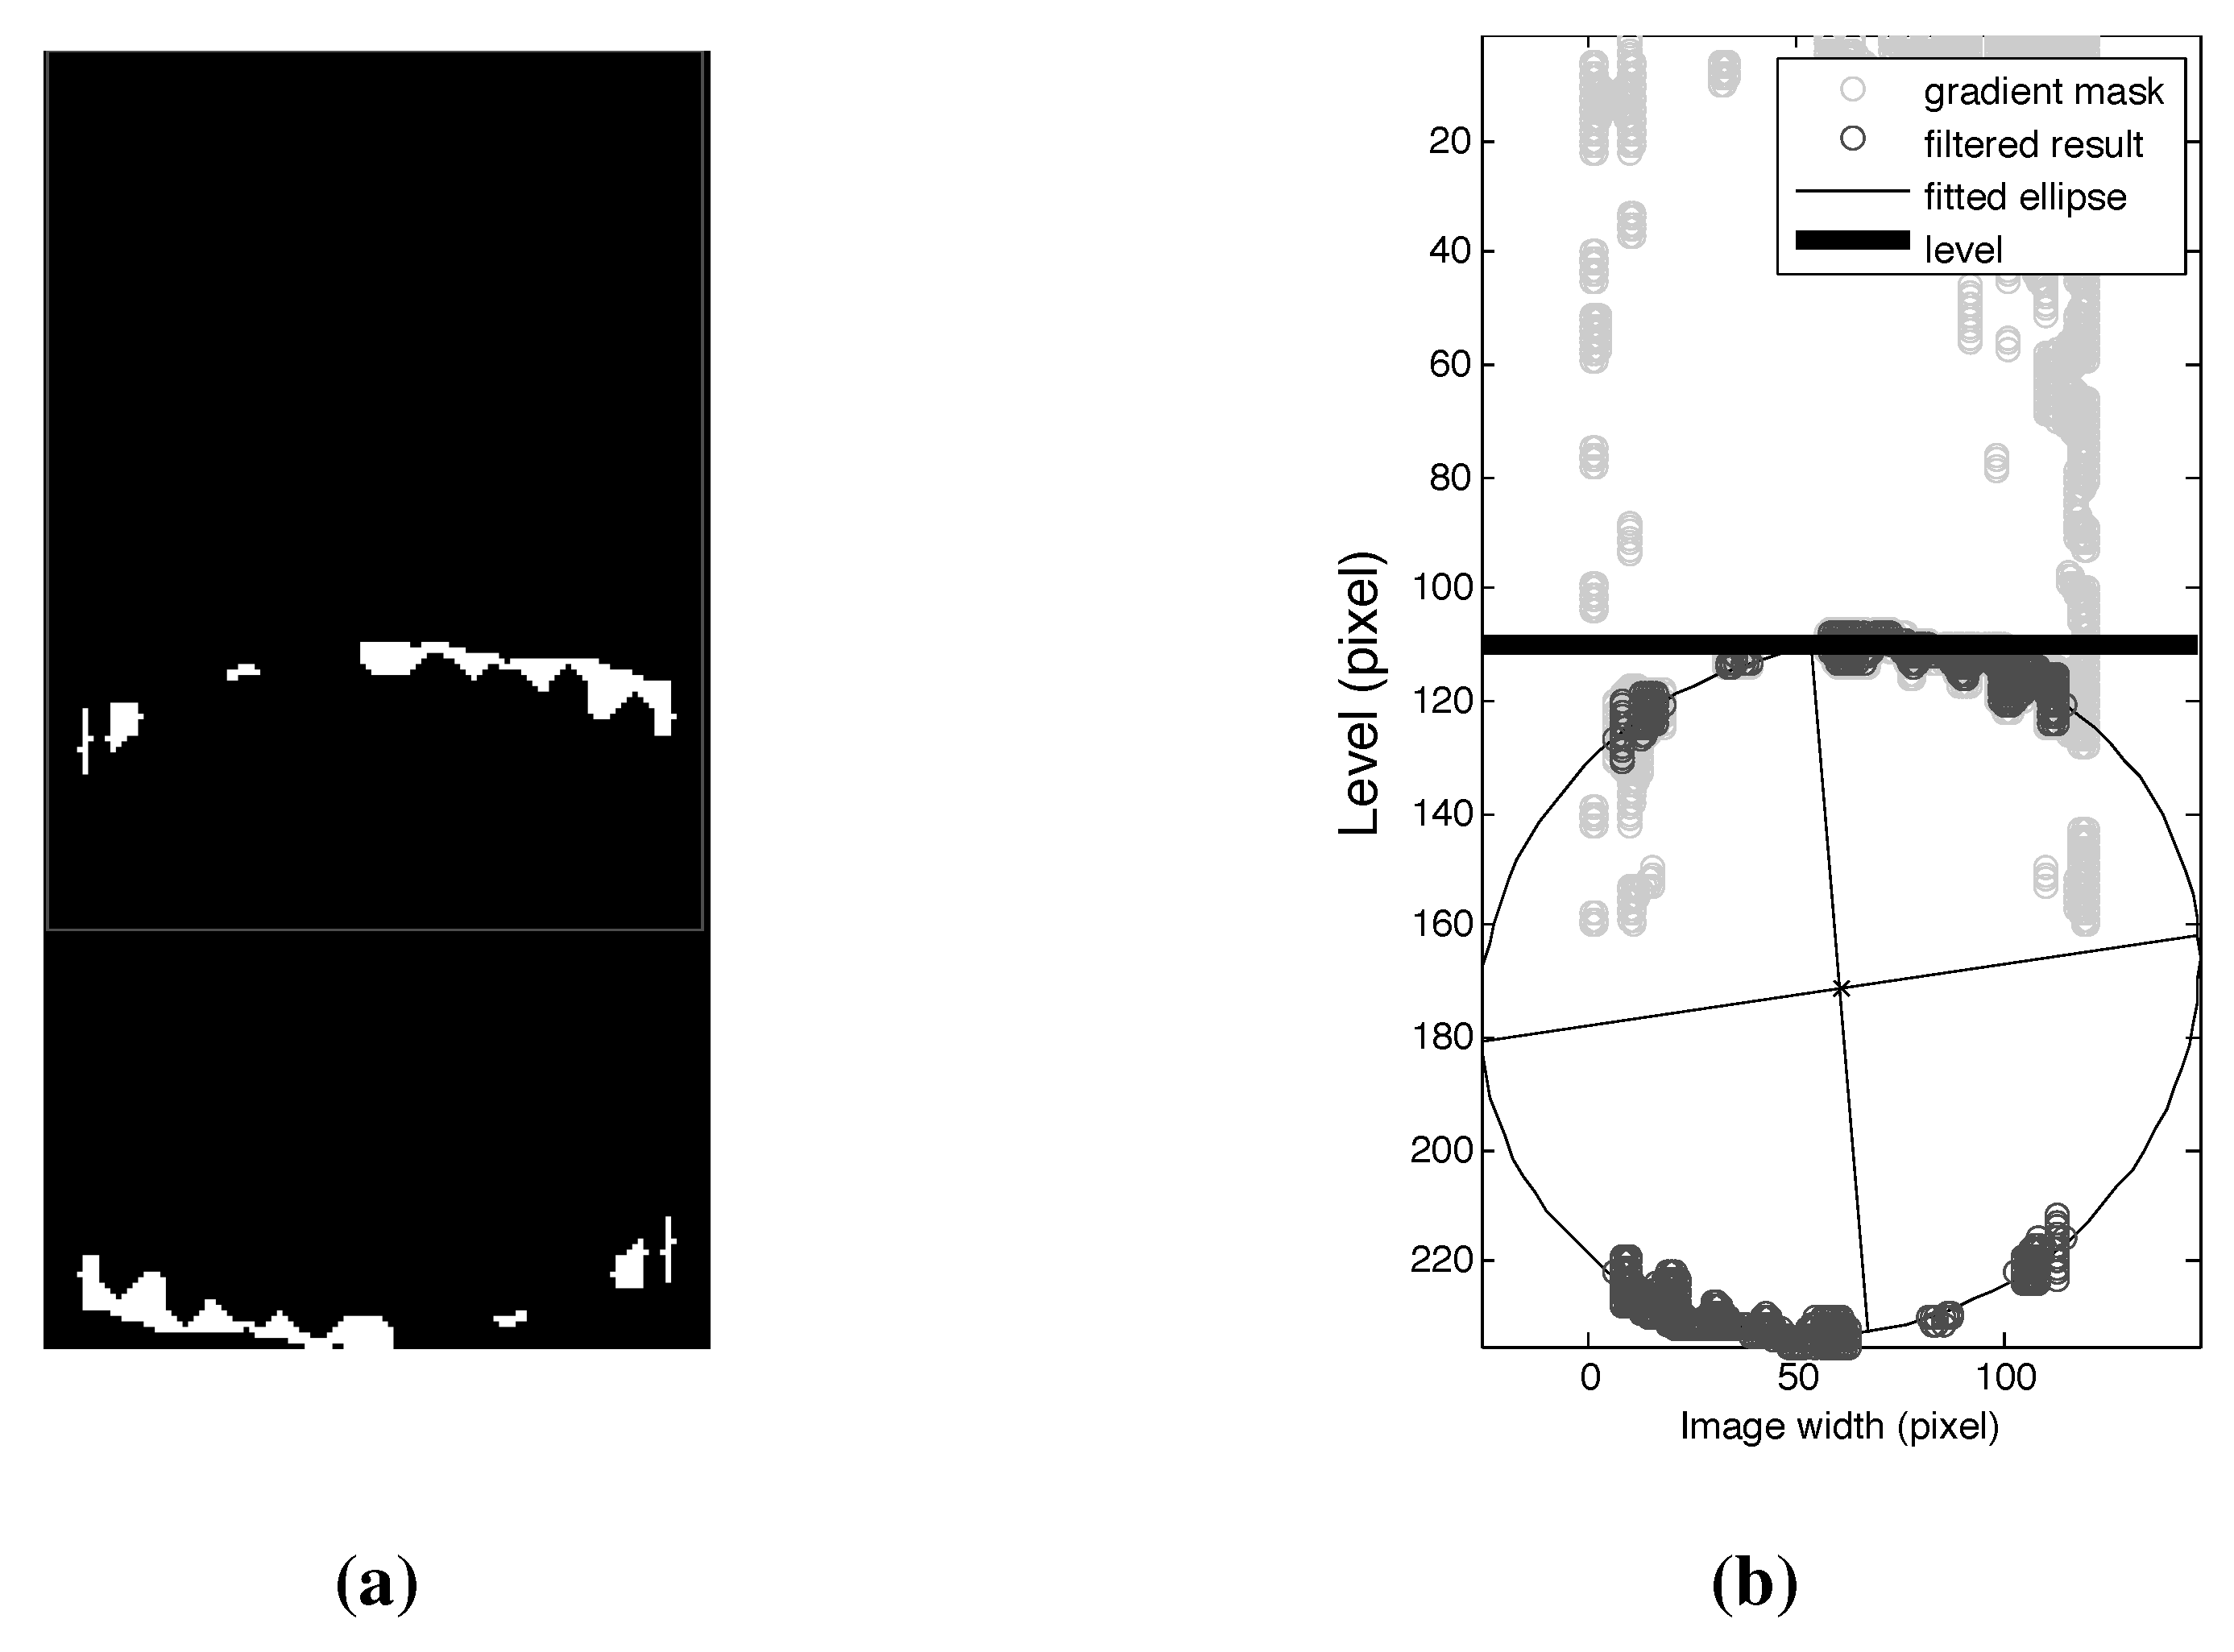
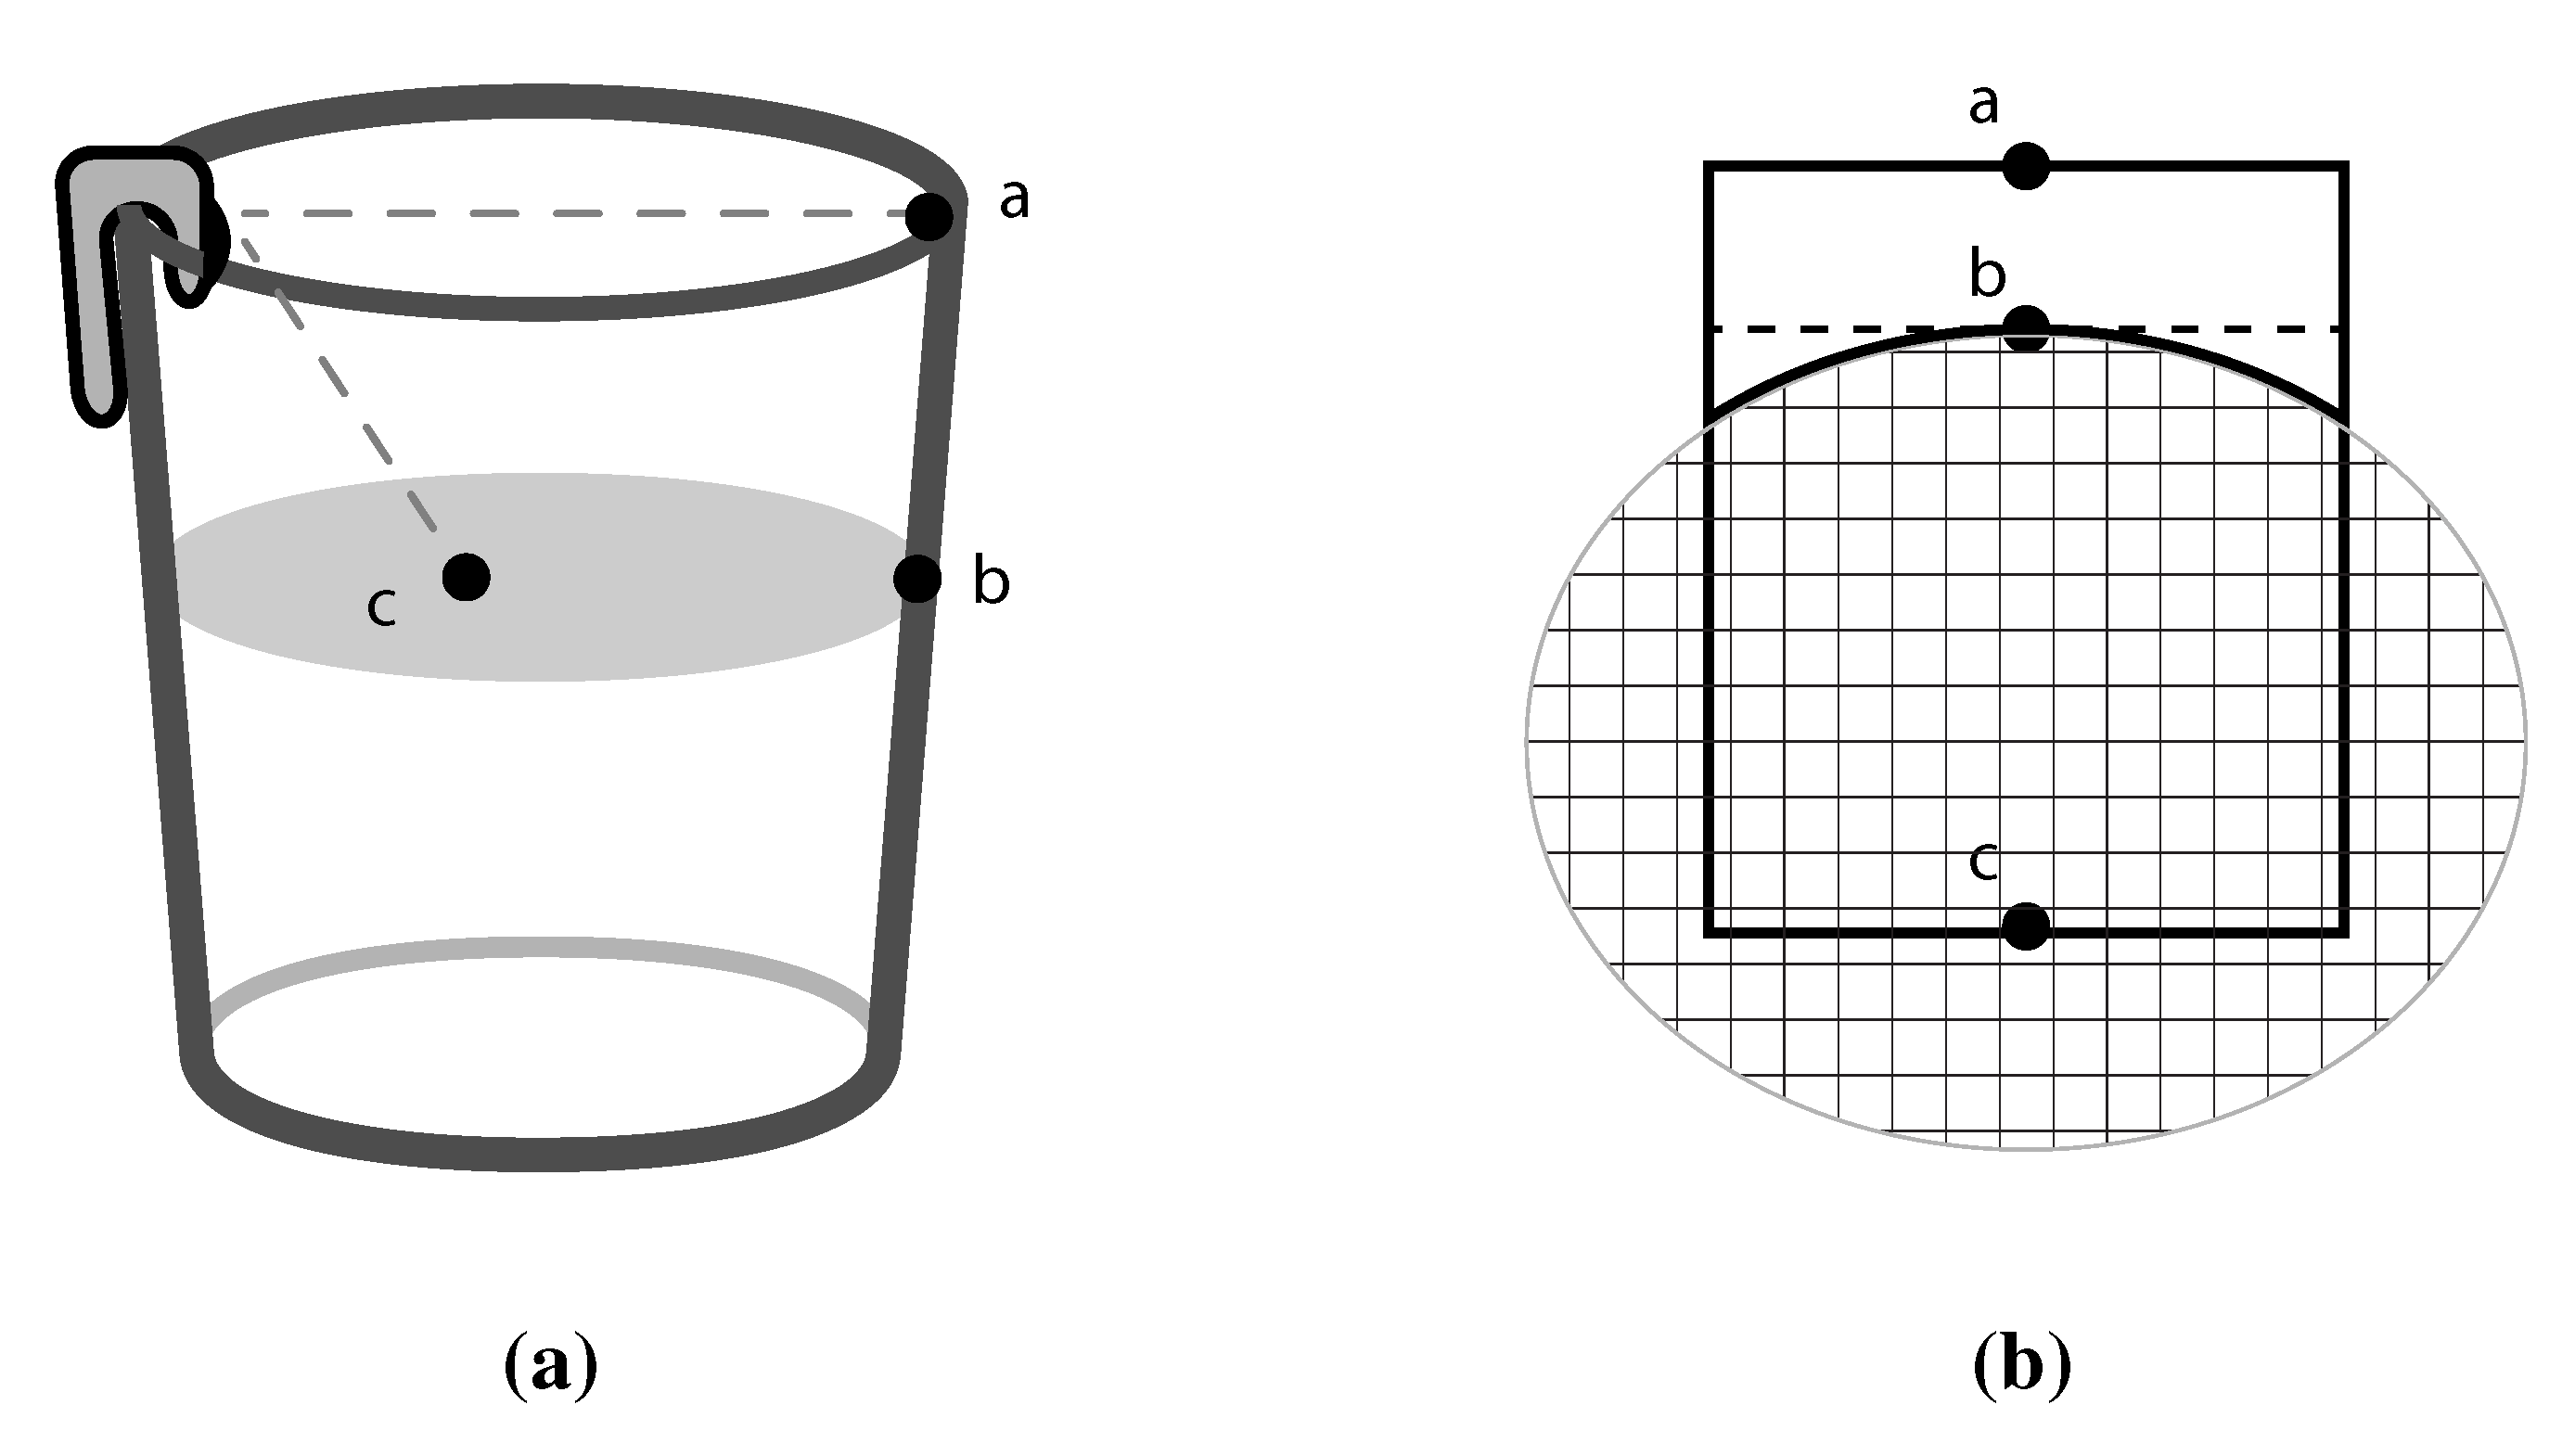
4.2.4. Ellipsoidal Fitting and Measurements
4.3. Dataset
| Ground Truth | Measurement | |||||
|---|---|---|---|---|---|---|
| Image No. | Level of Water (mm) | Diameter at Level (mm) | Calc. Vol (mL) | Derived Level (Pixels) | Derived Surface Area (Pixels 2) | Derived Volume (mL) |
| 1 | 60 | 64 | 193 | 146 | 8215 | 193 |
| 2 | 60 | 64 | 193 | - | ||
| 3 | 60 | 64 | 193 | 147 | 8019 | 195 |
| 4 | 50 | 67 | 169 | 133 | 12106 | 176 |
| 5 | 50 | 67 | 169 | 132 | 9932 | 172 |
| 6 | 50 | 67 | 169 | 133 | 11596 | 176 |
| 7 | 40 | 69 | 139 | 109 | 13895 | 140 |
| 8 | 40 | 69 | 139 | 110 | 16630 | 144 |
| 9 | 40 | 69 | 139 | 111 | 18662 | 146 |
| 10 | 30 | 71 | 108 | 74 | 28001 | 103 |
| 11 | 30 | 71 | 108 | 75 | 30119 | 104 |
| 12 | 30 | 71 | 108 | 76 | 28314 | 105 |
| 13 | 20 | 72 | 73 | 43 | 41572 | 76 |
| 14 | 20 | 72 | 73 | 44 | 40306 | 76 |
| 15 | 20 | 72 | 73 | 44 | 44878 | 77 |
| 16 | 10 | 73 | 37 | - | ||
| 17 | 10 | 73 | 37 | - | ||
| 18 | 10 | 73 | 37 | - | - | - |
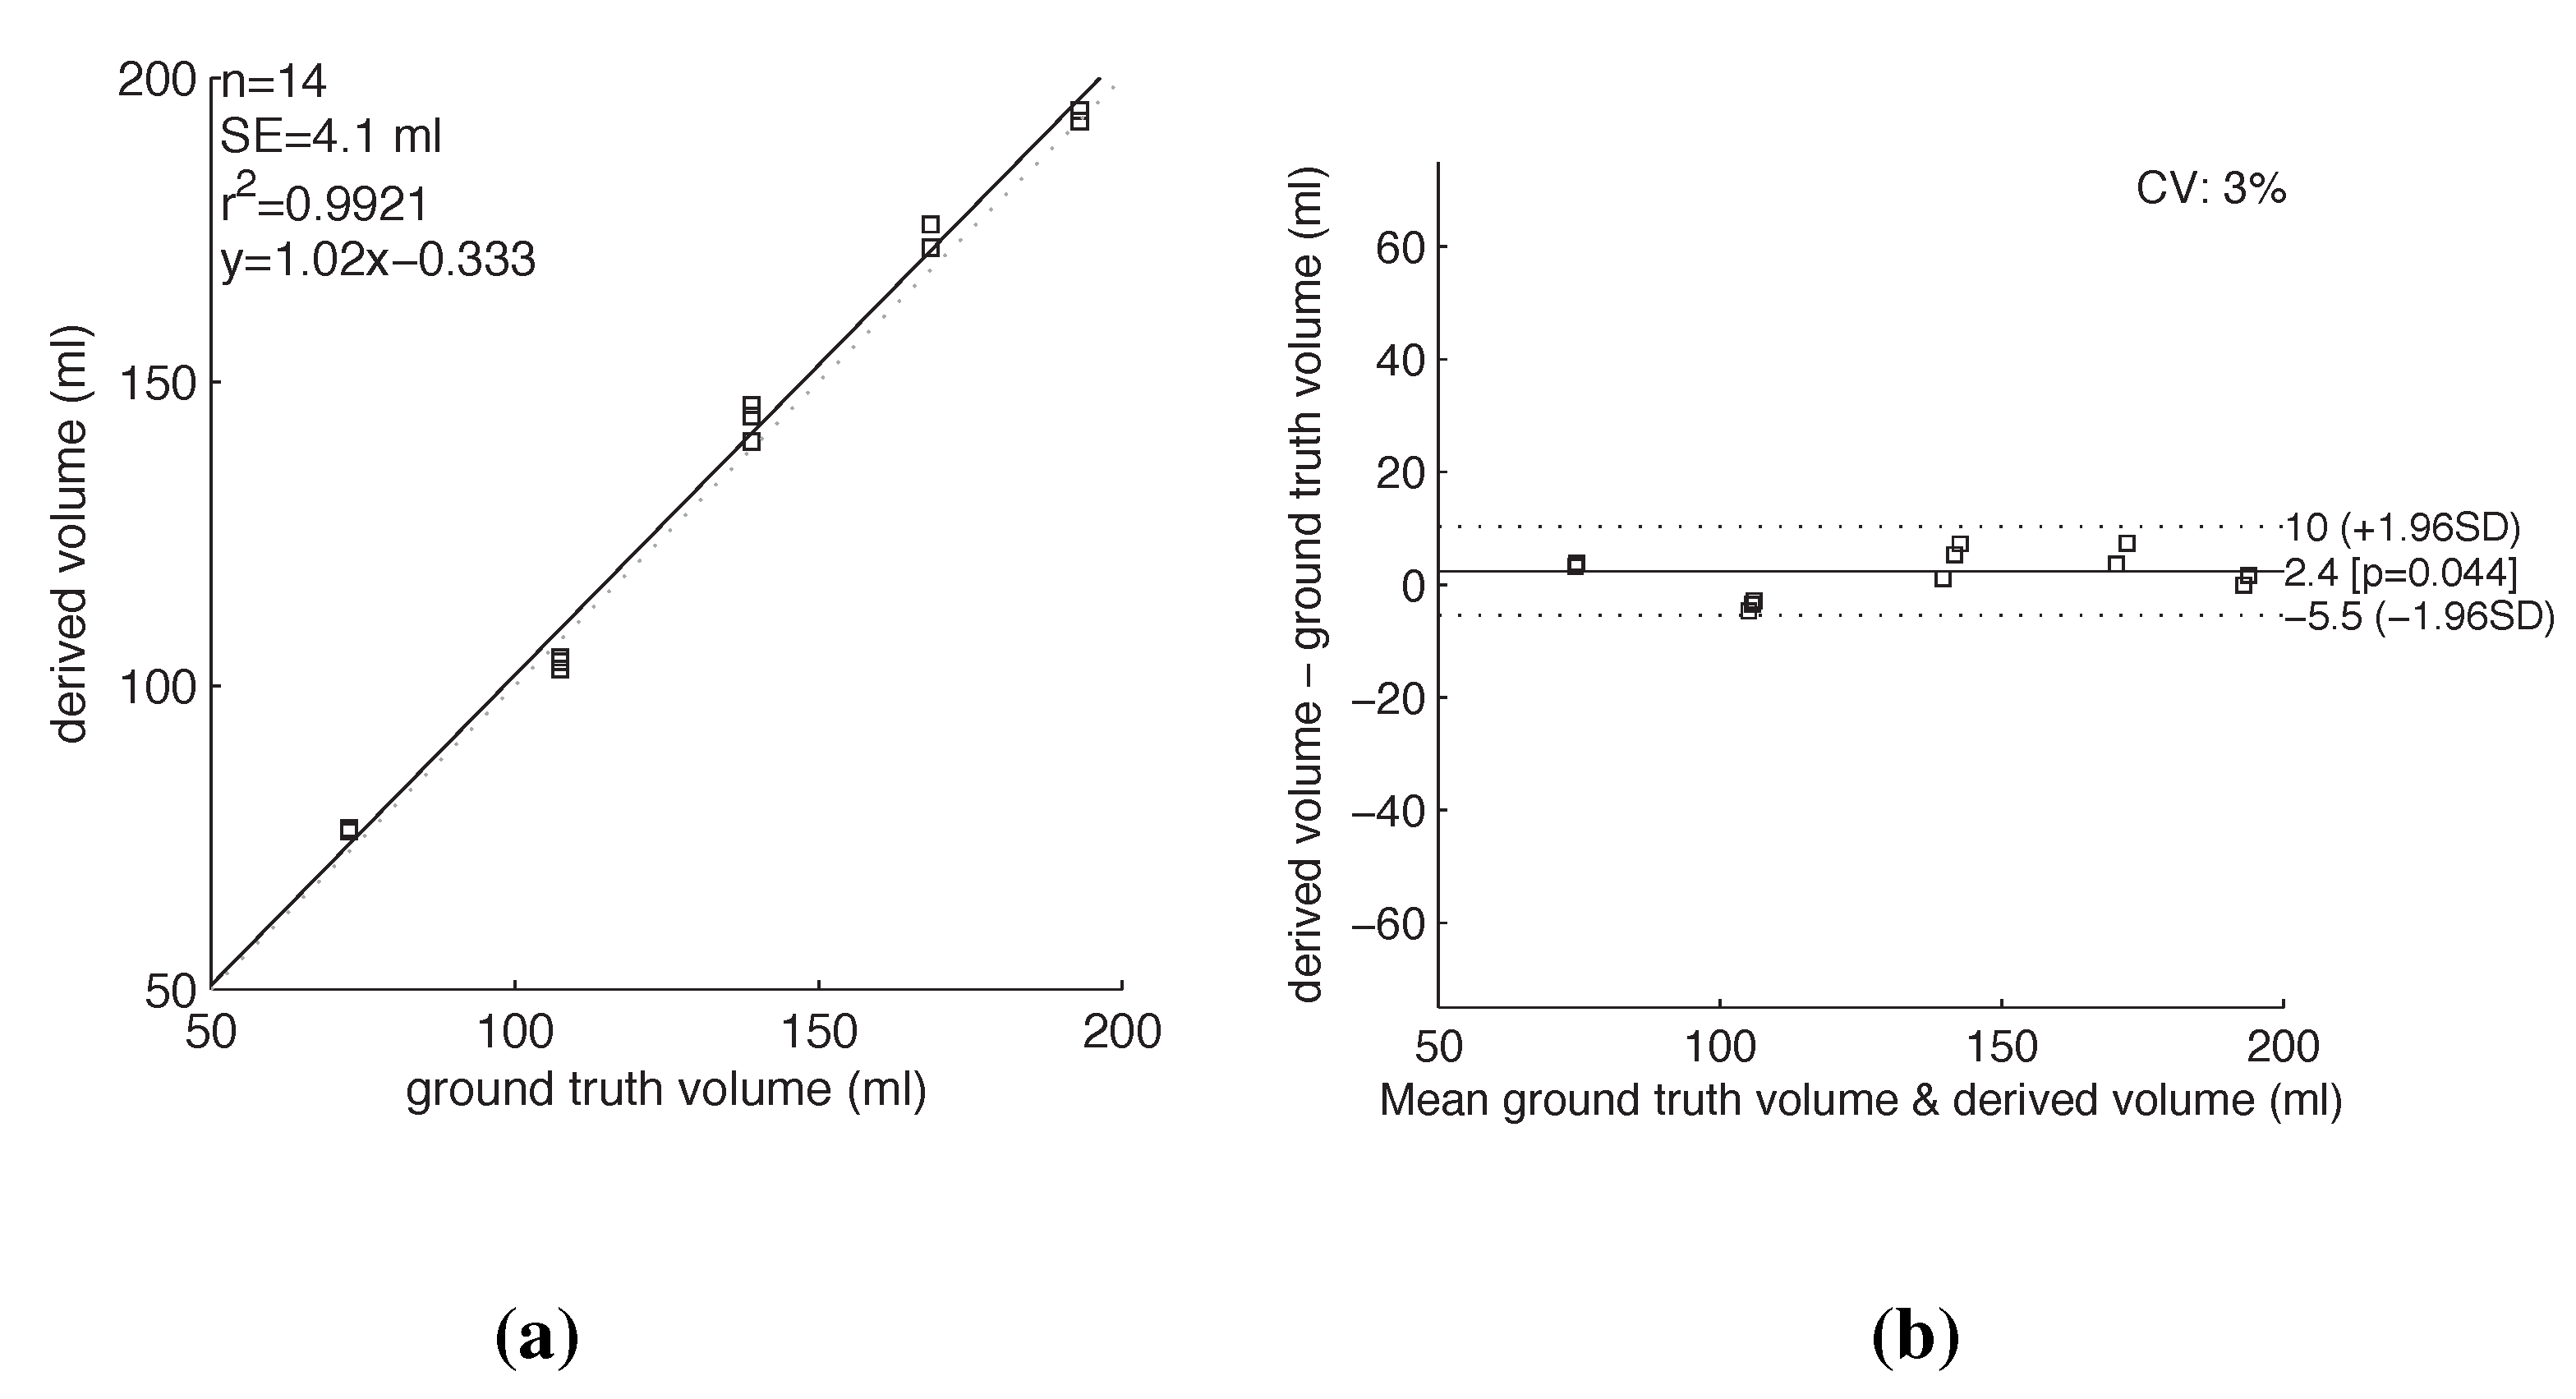
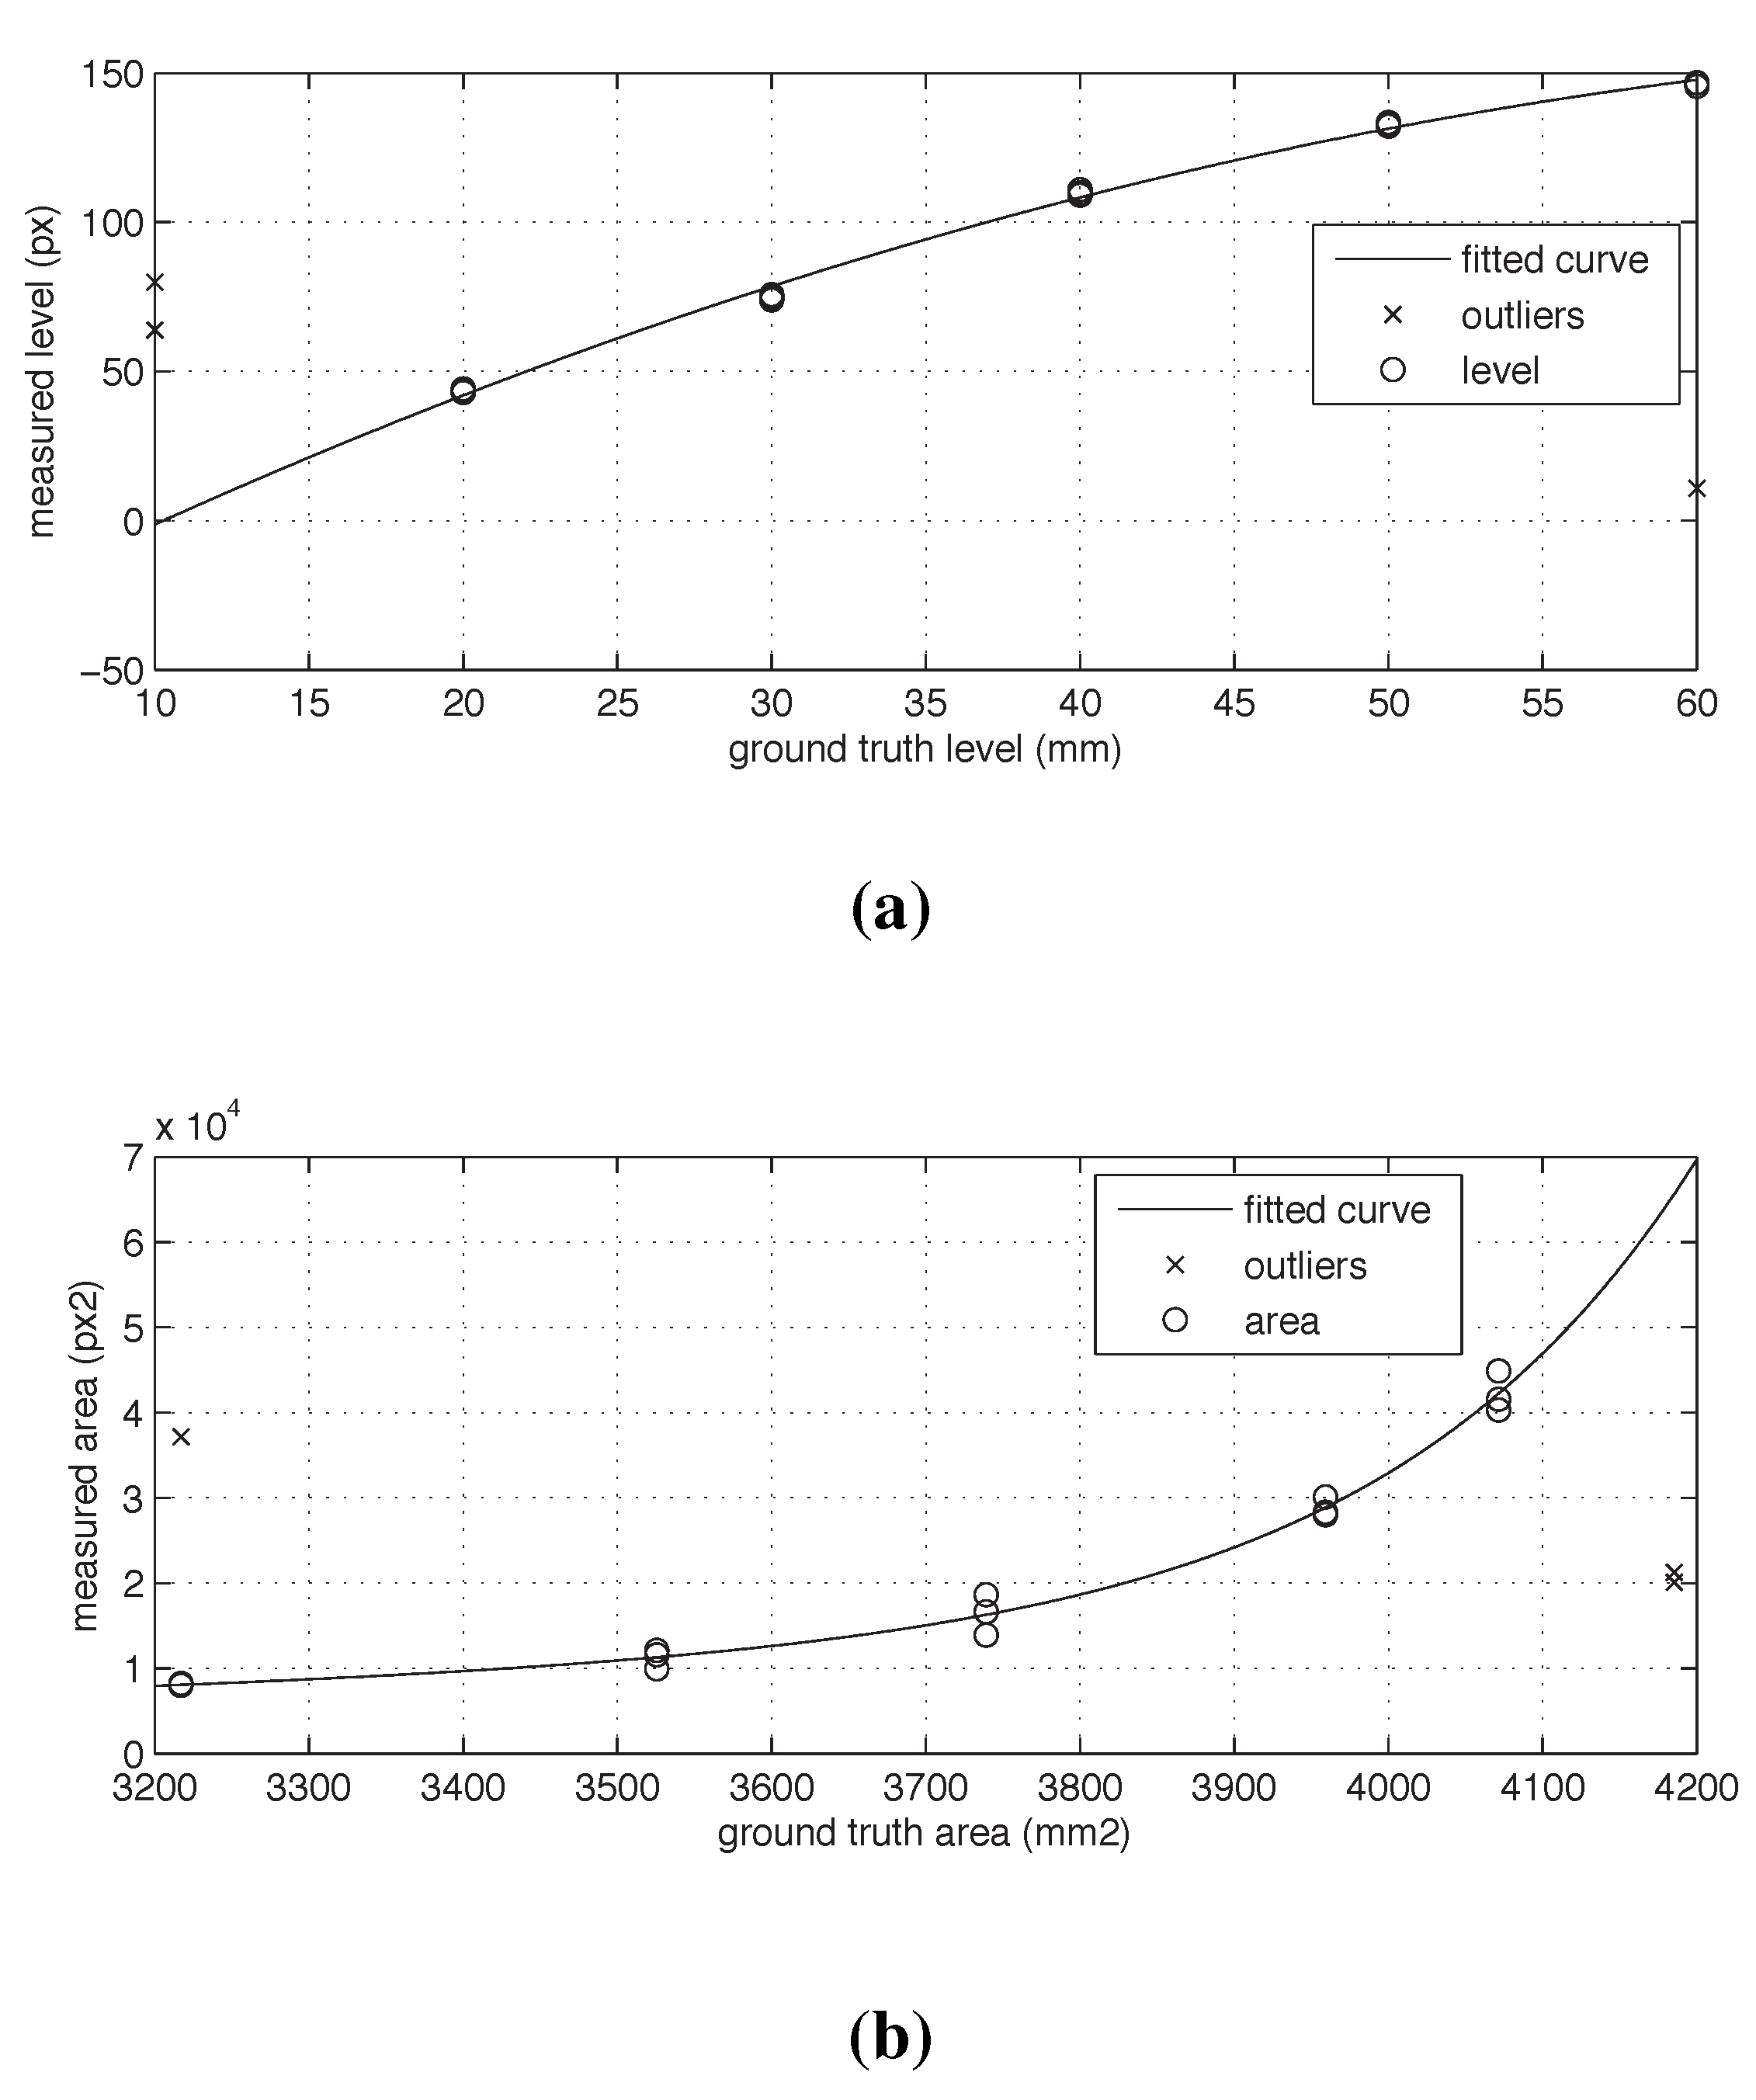
5. Results and Discussion

6. Options for Future Work
7. Summary and Conclusions
Acknowledgments
Author Contributions
Conflicts of Interest
References
- Hunt, S.A.; Baker, D.W.; Chin, M.H.; Cinquegrani, M.P.; Feldman, A.M.; Francis, G.S.; Ganiats, T.G.; Goldstein, S.; Gregoratos, G.; Jessup, M.L.; et al. ACC/AHA guidelines for the evaluation and management of chronic heart failure in the adult: Executive summary: A report of the American College of Cardiology/American Heart Association task force on practice guidelines (committee to revise the 1995 guidelines for the evaluation and management of heart failure) developed in collaboration with the International Society for Heart and Lung Transplantation endorsed by the Heart Failure Society of America. J. Am. Coll. Cardiol. 2001, 38, 2101–2113. [Google Scholar] [PubMed]
- Schuller, D.; Schuster, D.P. Fluid-management strategies in acute lung injury. N. Engl. J. Med. 2006, 355, 1175–1176. [Google Scholar] [CrossRef] [PubMed]
- Kalantar-Zadeh, K.; Regidor, D.L.; Kovesdy, C.P.; van Wyck, D.; Bunnapradist, S.; Horwich, T.B.; Fonarow, G.C. Fluid retention is associated with cardiovascular mortality in patients undergoing long-term hemodialysis. Circulation 2009, 119, 671–679. [Google Scholar] [CrossRef] [PubMed]
- Denhaerynck, K.; Manhaeve, D.; Dobbels, F.; Garzoni, D.; Nolte, C.; de Geest, S. Prevalence and consequences of nonadherence to hemodialysis regimens. Am. J. Crit. Care 2007, 16, 222–235. [Google Scholar] [PubMed]
- Yu, J.; Ng, H.J.; Nandakumar, M.; Griva, K. The management of food cravings and thirst in hemodialysis patients: A qualitative study. J. Health Psychol. 2014. [Google Scholar] [CrossRef] [PubMed]
- Waldréus, N.; Hahn, R.G.; Jaarsma, T. Thirst in heart failure: A systematic literature review. Eur. J. Heart Fail. 2013, 15, 141–149. [Google Scholar] [CrossRef] [PubMed]
- BV, F.I.F. Obli. Available online: http://www.obli.info/ (accessed on 11 September 2015).
- Inc, M.O. My Vessyl. Available online: www.myvessyl.com (accessed on 11 September 2015).
- Trago. Trago-Hydrate Smarter. Available online: http://trago.co/ (accessed on 11 September 2015).
- Caktus. THE+HUG. Available online: http://caktus.me/ (accessed on 11 September 2015).
- Indiegogo. Bluefit Bottle. Available online: https://www.indiegogo.com/projects/blufit-bottle#/story (accessed on 11 September 2015).
- Logger, D. Waterlogged. Available online: https://itunes.apple.com/us/app/waterlogged-drink-more-water/id352199775?mt=8 (accessed on 11 September 2015).
- Inc, A. Adafruit Camera. Available online: www.adafruit.com (accessed on 11 September 2015).
- Arduino. Arduino Microcontroller. Available online: http://www.arduino.cc/ (accessed on 11 September 2015).
- Inc, J. Node JS. Available online: http://nodejs.org/ (accessed on 11 September 2015).
- Frangi, A.F.; Niessen, W.J.; Vincken, K.L.; Viergever, M.A. Multiscale vessel enhancement filtering. In Proceedings of Medical Image Computing and Computer-Assisted Interventation (MICCAI’98), Cambridge, MA, USA, 11–13 October 1998; pp. 130–137.
- Kroon, D.J. Hessian Based Frangi Vesselness Filter. Available online: http://www.mathworks.com/matlabcentral/fileexchange/24409-hessian-based-frangi-vesselness-filter (accessed on 11 September 2015).
- Gal, O. Matlab Code for Ellipse Fitting. Available online: http://www.mathworks.com/matlabcentral/fileexchange/3215-fit-ellipse (accessed on 11 September 2015).
- Fitzgibbon, A.; Pilu, M.; Fisher, R.B. Direct least square fitting of ellipses. IEEE Trans. Pattern Anal. Mach. Intell. 1999, 21, 476–480. [Google Scholar] [CrossRef]
- Taubin, G. Estimation of planar curves, surfaces, and nonplanar space curves defined by implicit equations with applications to edge and range image segmentation. IEEE Trans. Pattern Anal. Mach. Intell. 1991, 13, 1115–1138. [Google Scholar] [CrossRef]
- Ayoola, I. Dataset. Available online: http://goo.gl/L3RG5G (accessed on 11 September 2015).
- Barnett, T.; Tang, L.Y.; Pinikahana, J.; Tan, S.Y. Fluid compliance among patients having haemodialysis: can an educational programme make a difference? J. Adv. Nurs. 2008, 61, 300–306. [Google Scholar] [CrossRef] [PubMed]
- Klein, R. Bland-Altman and Correlation Plot. Available online: http://www.mathworks.com/matlabcentral/fileexchange/45049-bland-altman-and-correlation-plot (accessed on 11 September 2015).
© 2015 by the authors; licensee MDPI, Basel, Switzerland. This article is an open access article distributed under the terms and conditions of the Creative Commons Attribution license (http://creativecommons.org/licenses/by/4.0/).
Share and Cite
Ayoola, I.; Chen, W.; Feijs, L. Camera on Vessel: A Camera-Based System to Measure Change in Water Volume in a Drinking Glass. Sensors 2015, 15, 23847-23867. https://doi.org/10.3390/s150923847
Ayoola I, Chen W, Feijs L. Camera on Vessel: A Camera-Based System to Measure Change in Water Volume in a Drinking Glass. Sensors. 2015; 15(9):23847-23867. https://doi.org/10.3390/s150923847
Chicago/Turabian StyleAyoola, Idowu, Wei Chen, and Loe Feijs. 2015. "Camera on Vessel: A Camera-Based System to Measure Change in Water Volume in a Drinking Glass" Sensors 15, no. 9: 23847-23867. https://doi.org/10.3390/s150923847