
High-Temperature Dielectric Properties of Aluminum Nitride Ceramic for Wireless Passive Sensing Applications

Abstract
:1. Introduction
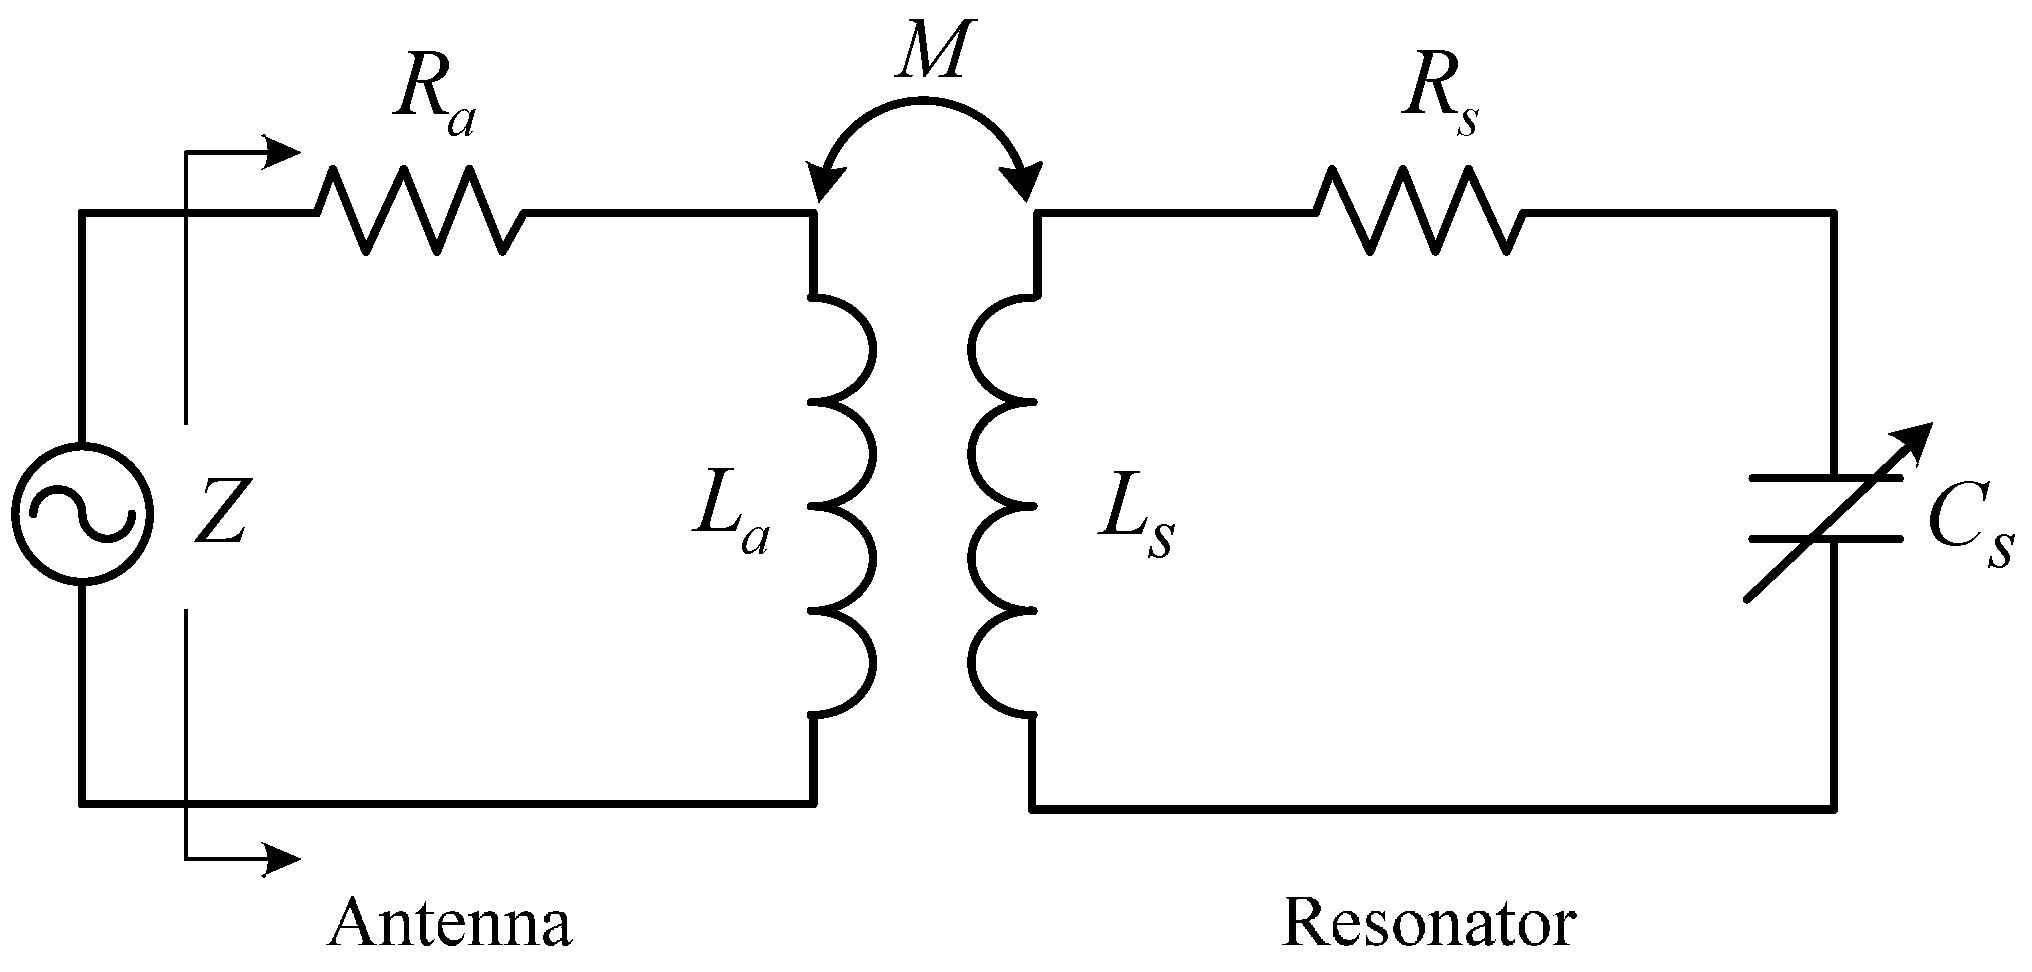
2. Principle of Operation

3. Resonator Design
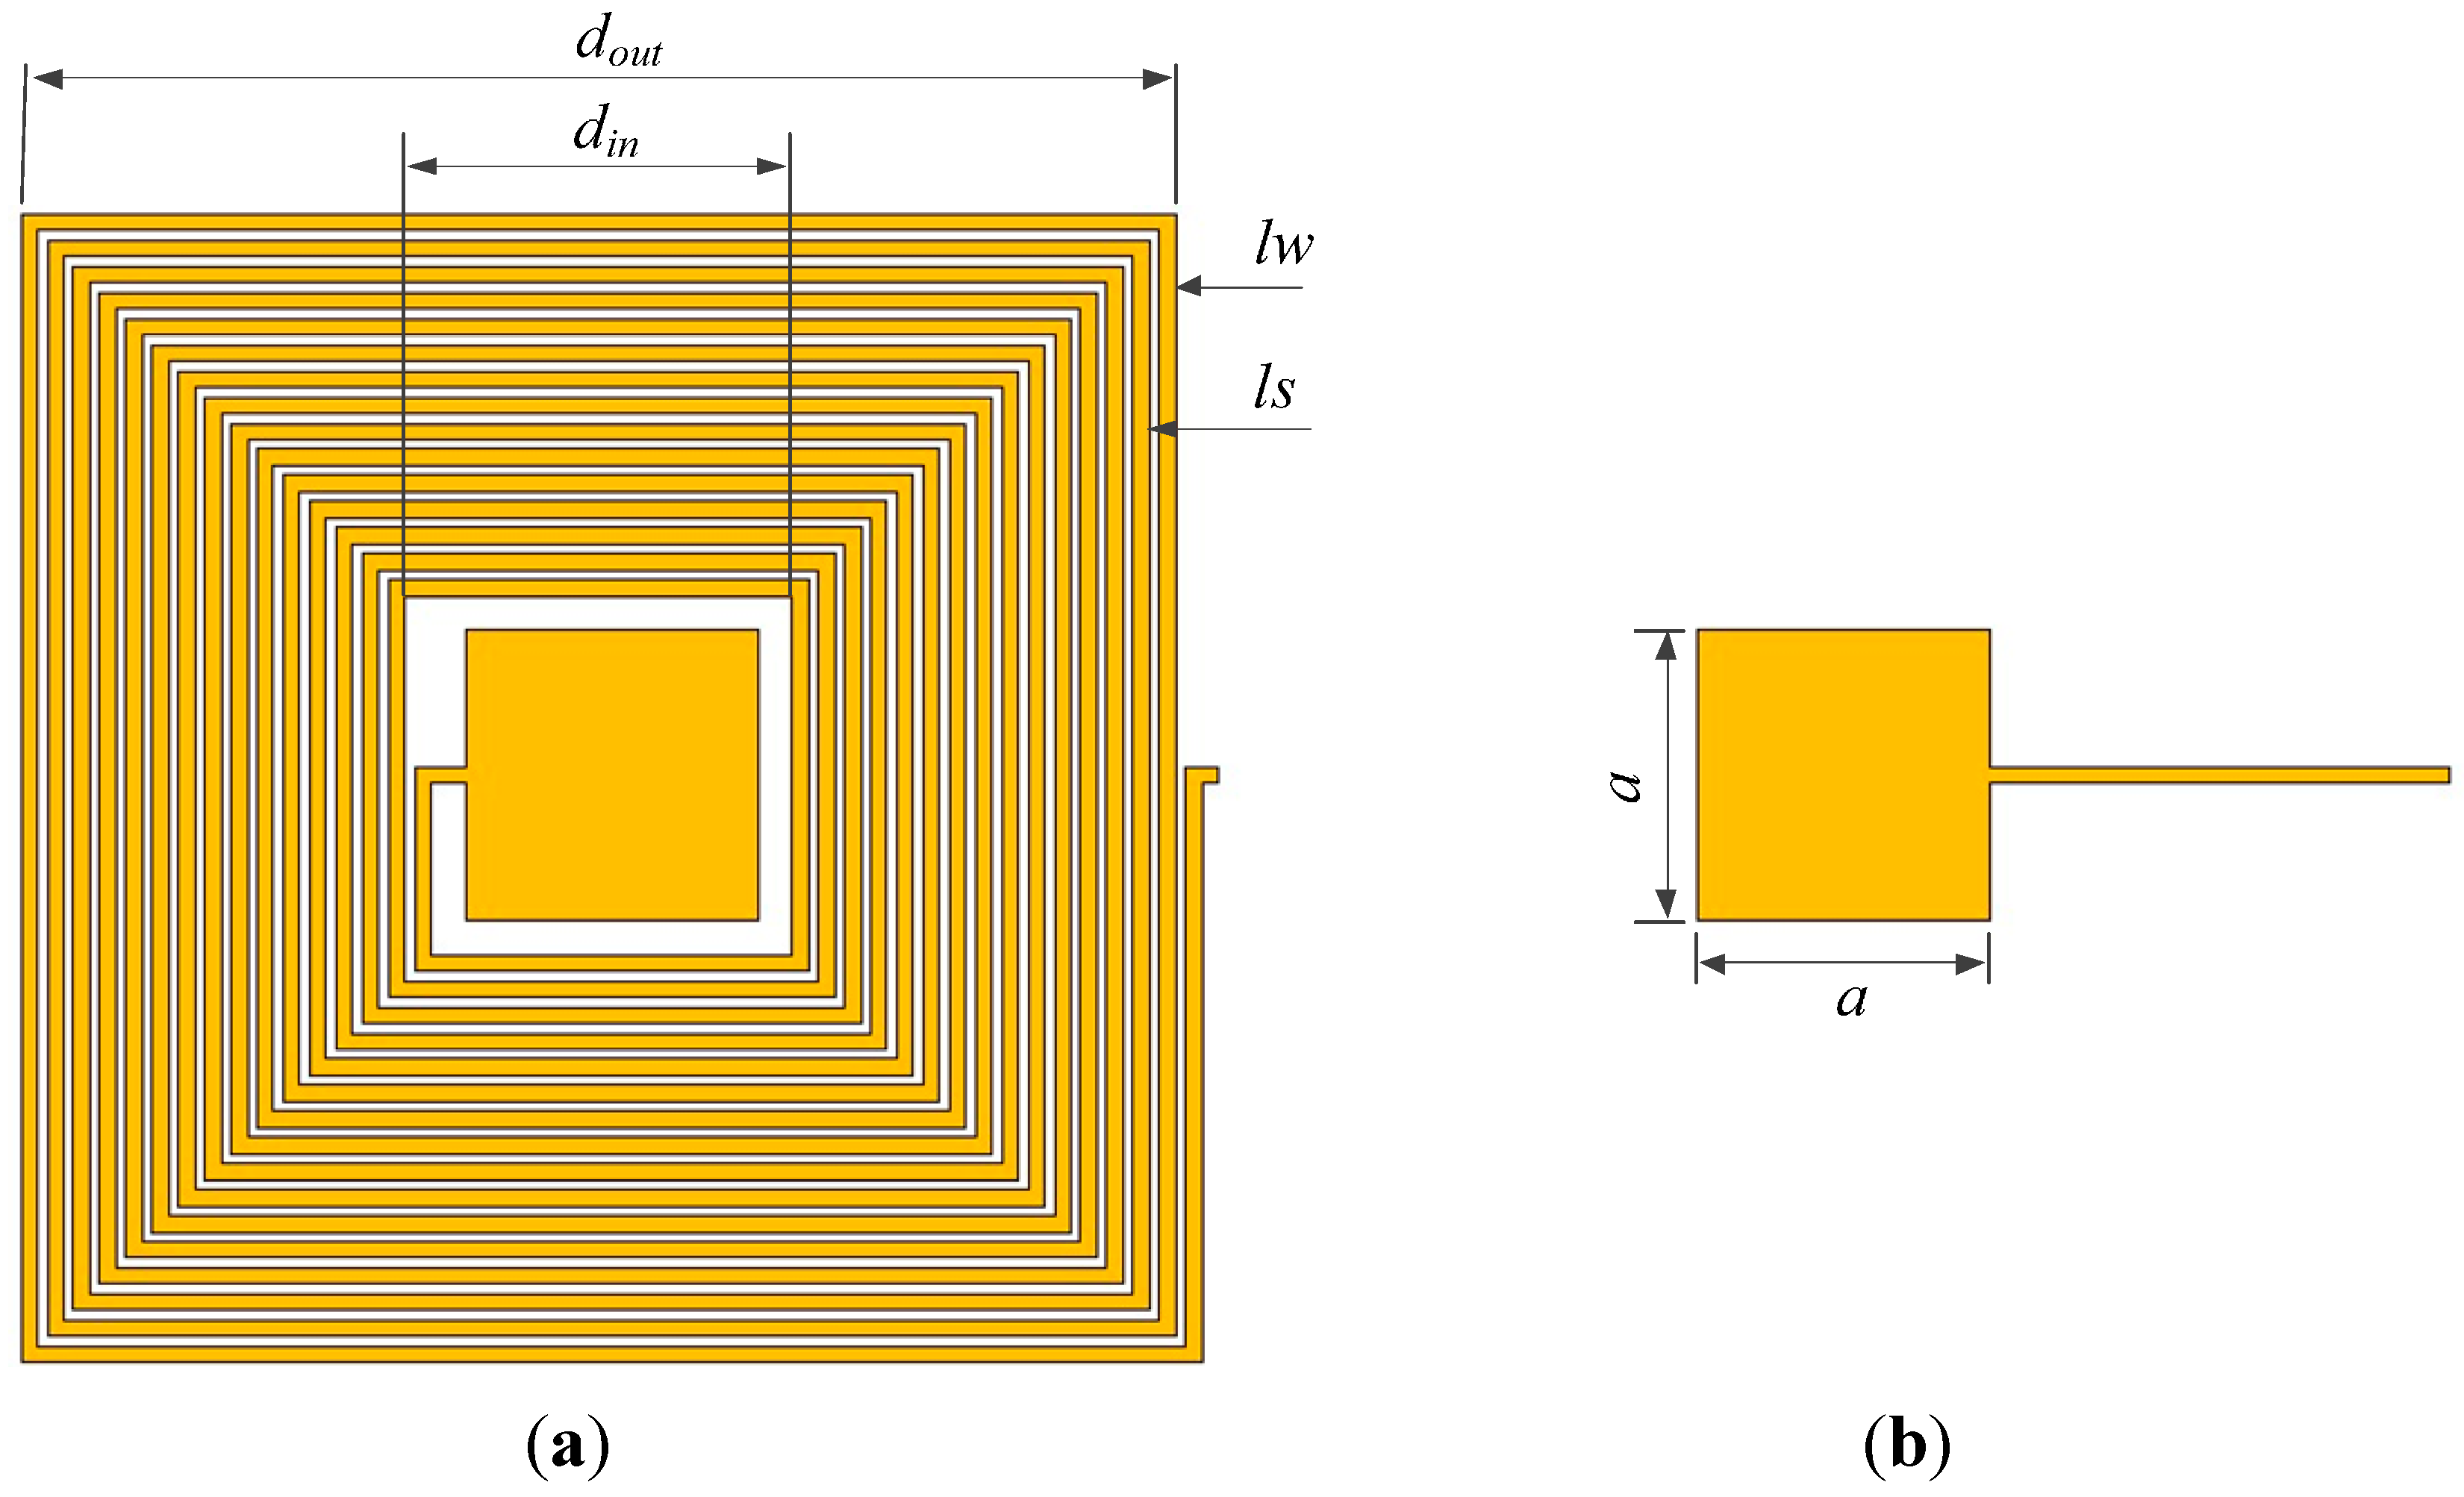
3.1. Inductance Design
3.2. Capacitance Design
3.3. Resistance Estimation
3.4. Q and f0

| Parameters | Value | Parameters | Value |
|---|---|---|---|
| n | 15.5 | εr | 9 |
| din/mm | 11 | Cs/pF | 12.43 |
| dout/mm | 36 | Ls/µH | 6.72 |
| tm/mm | 0.508 | La/µH | ~2 |
| a/mm | 8.9 | Rs/Ω | 25.9 |
| lw/mm | 0.5 | Ra/Ω | 1.5 |
| ls/mm | 0.3 | f0/MHz | 17.4 |
| lt/μm | ~20 | Q | 28.37 |
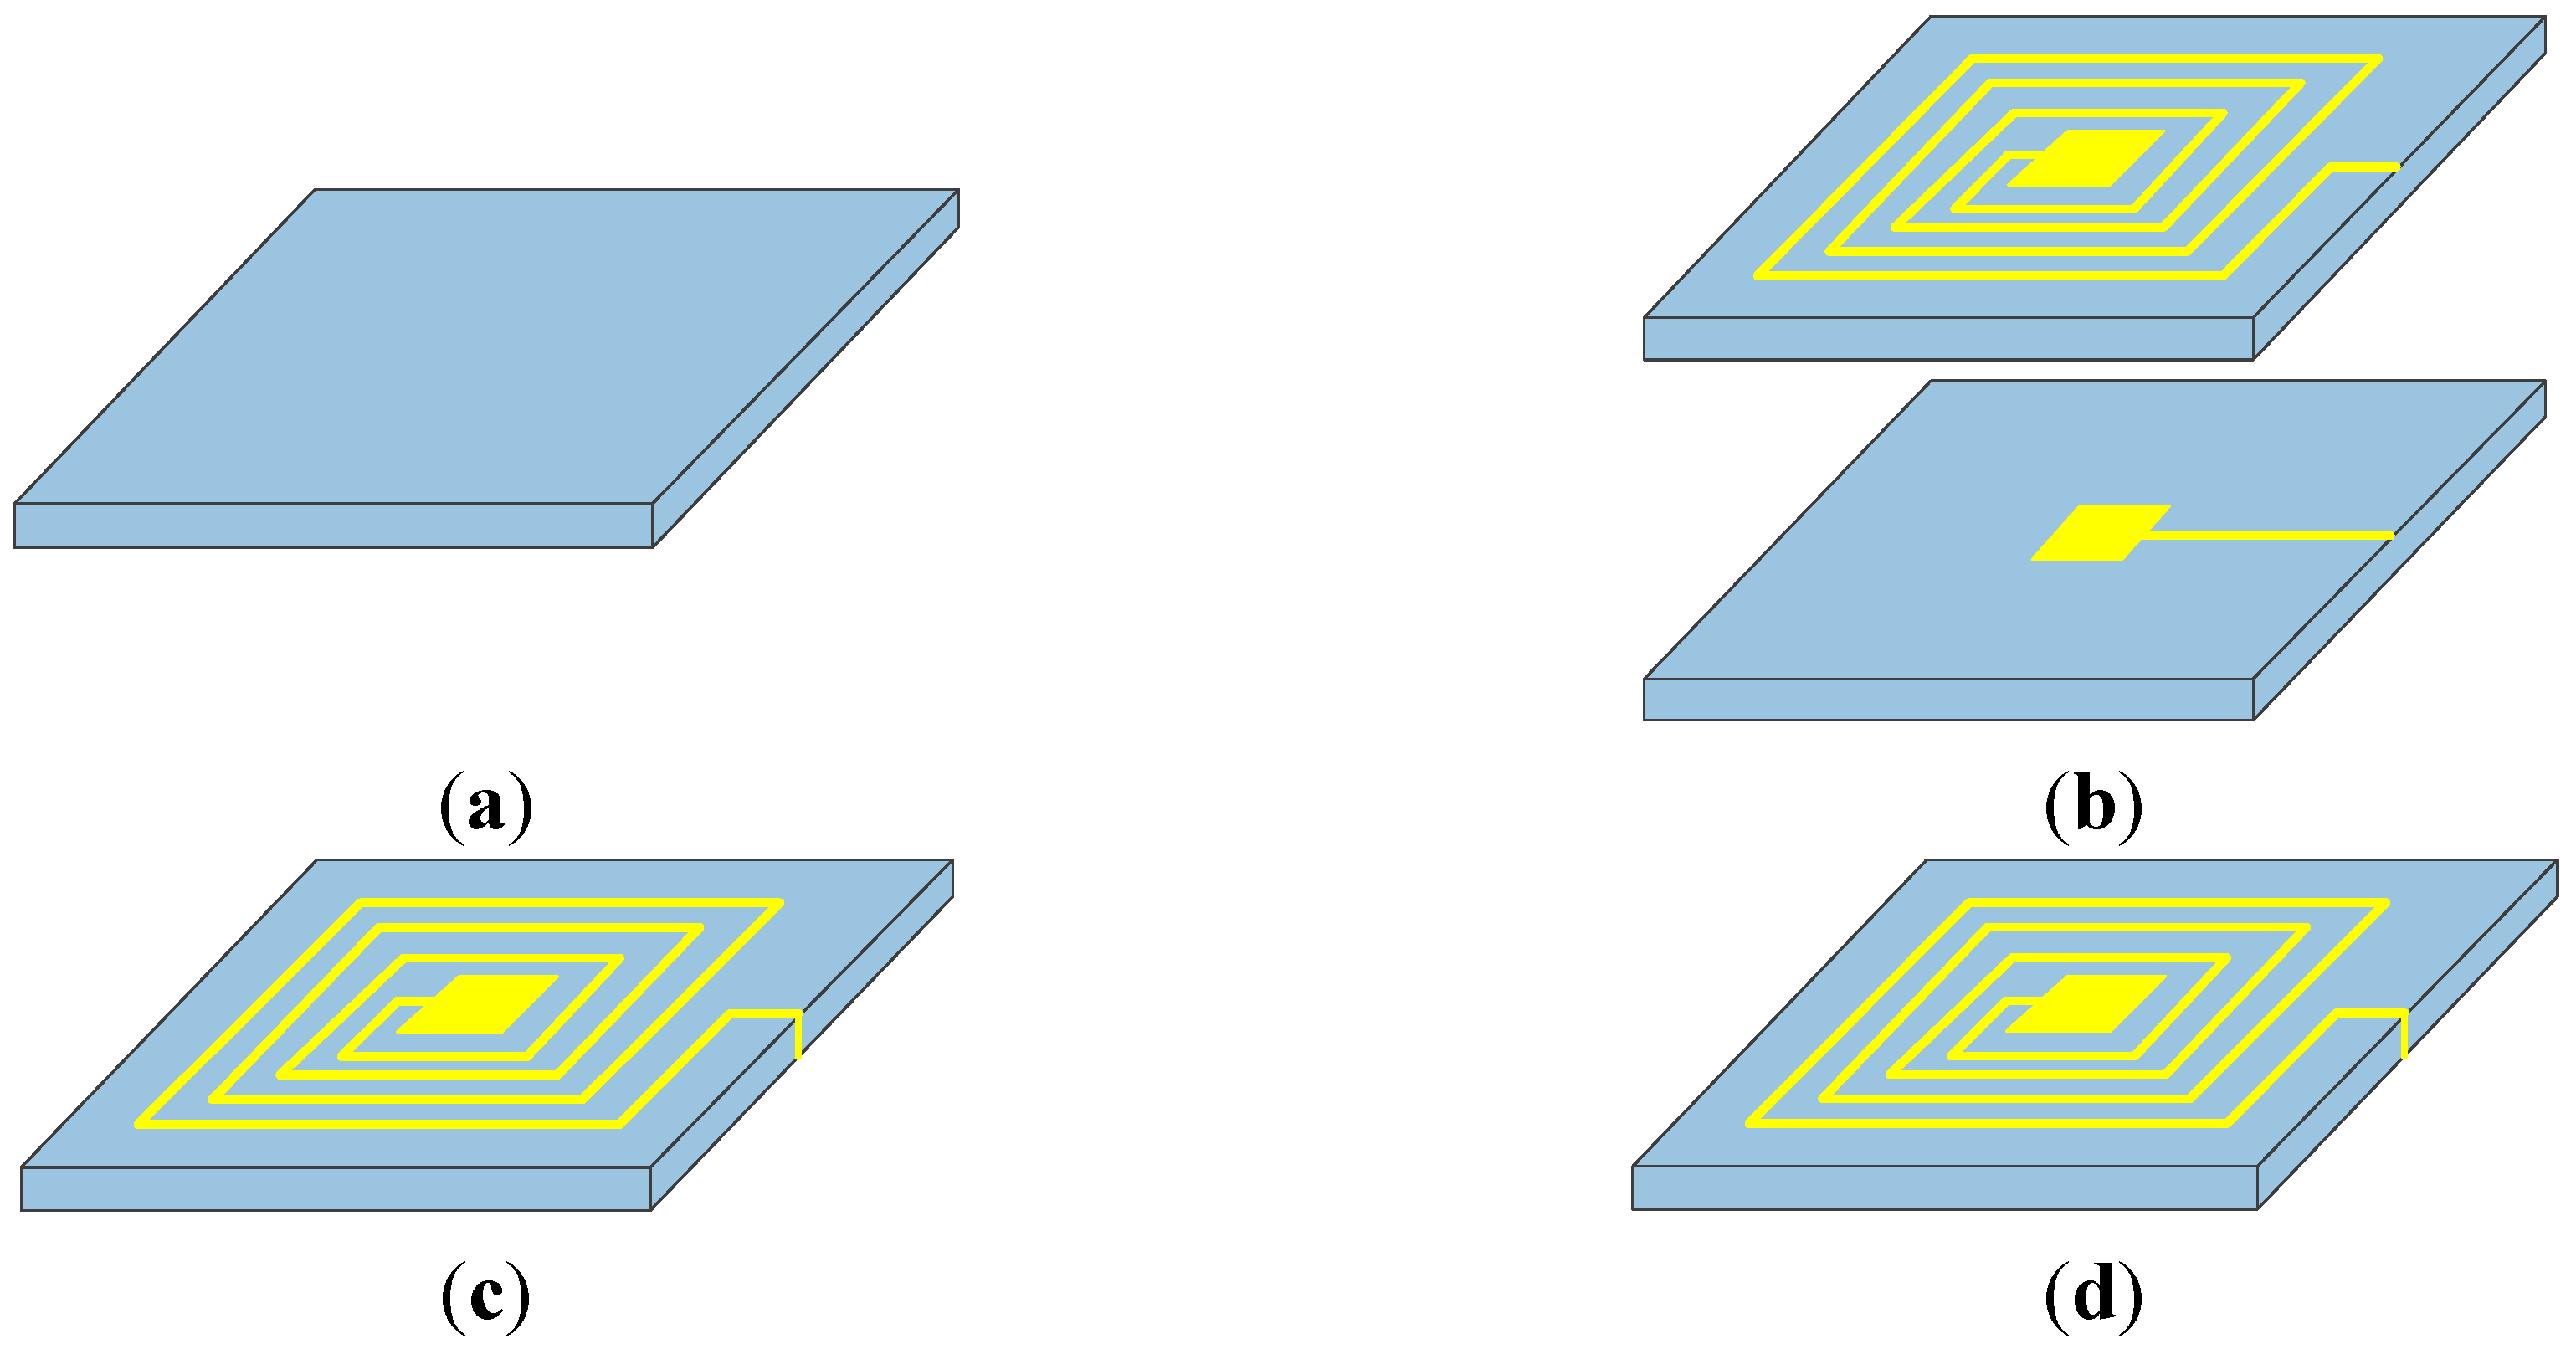
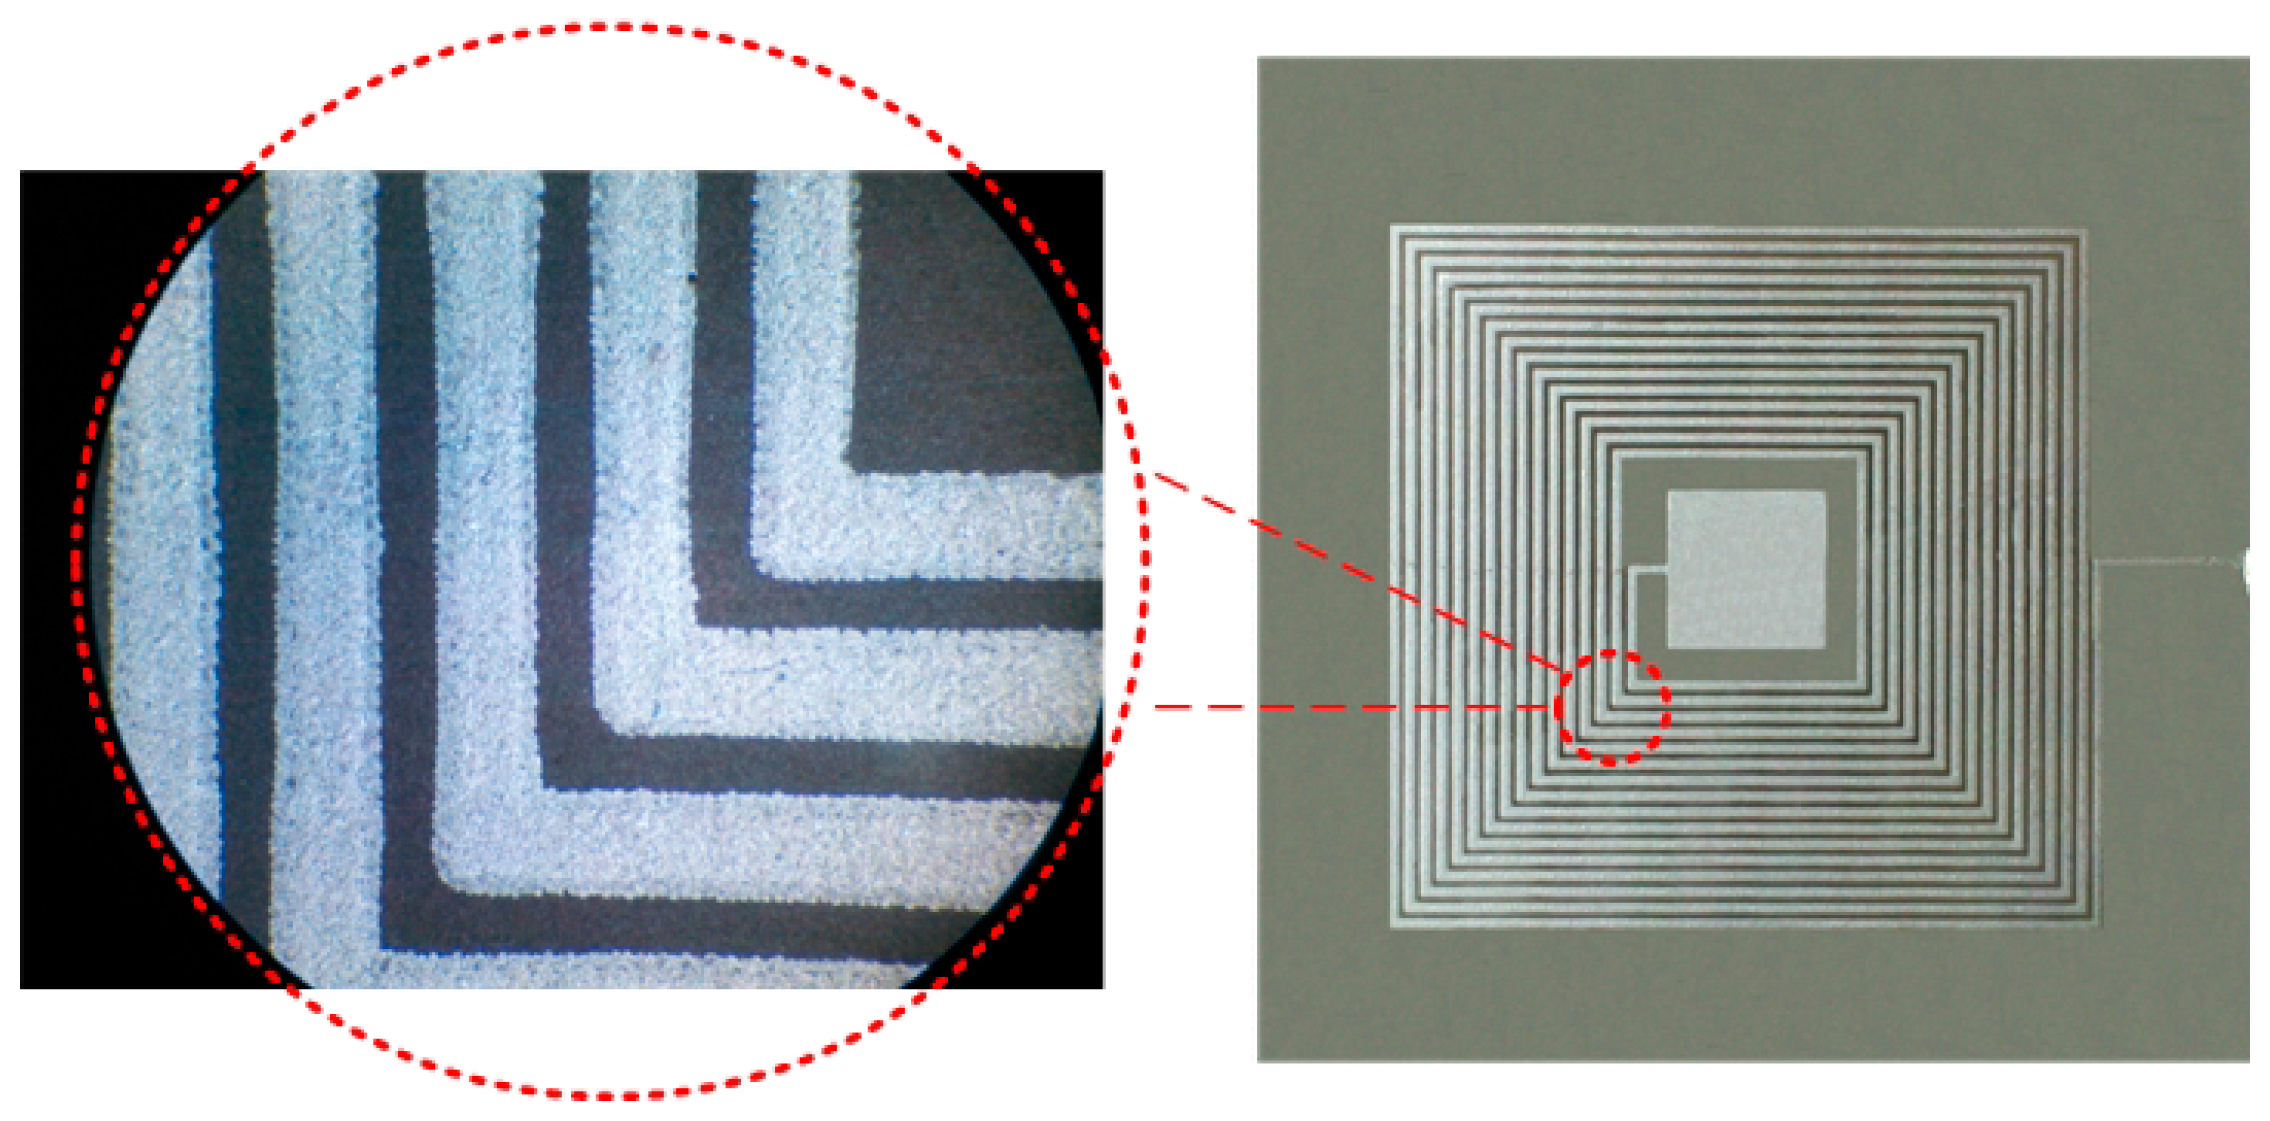
4. Fabrication
| Parameters | Value |
|---|---|
| Density (g/cm3) | 3.335 |
| Flexural Strength (MPa, 25 °C) | 330 |
| Thermal conductivity (W·m−1·K−1, 25 °C) | ≥170 |
| CTE (ppm/°C, 20~300 °C) | 2.805 |
| Relative permittivity (25 °C, 1 MHz) | 9.0 |
| Dielectric loss (25 °C, 1 MHz) | 0.0004 |
| Resistivity (MΩ·m, 25 °C) | 1.4 × 10⁶ |
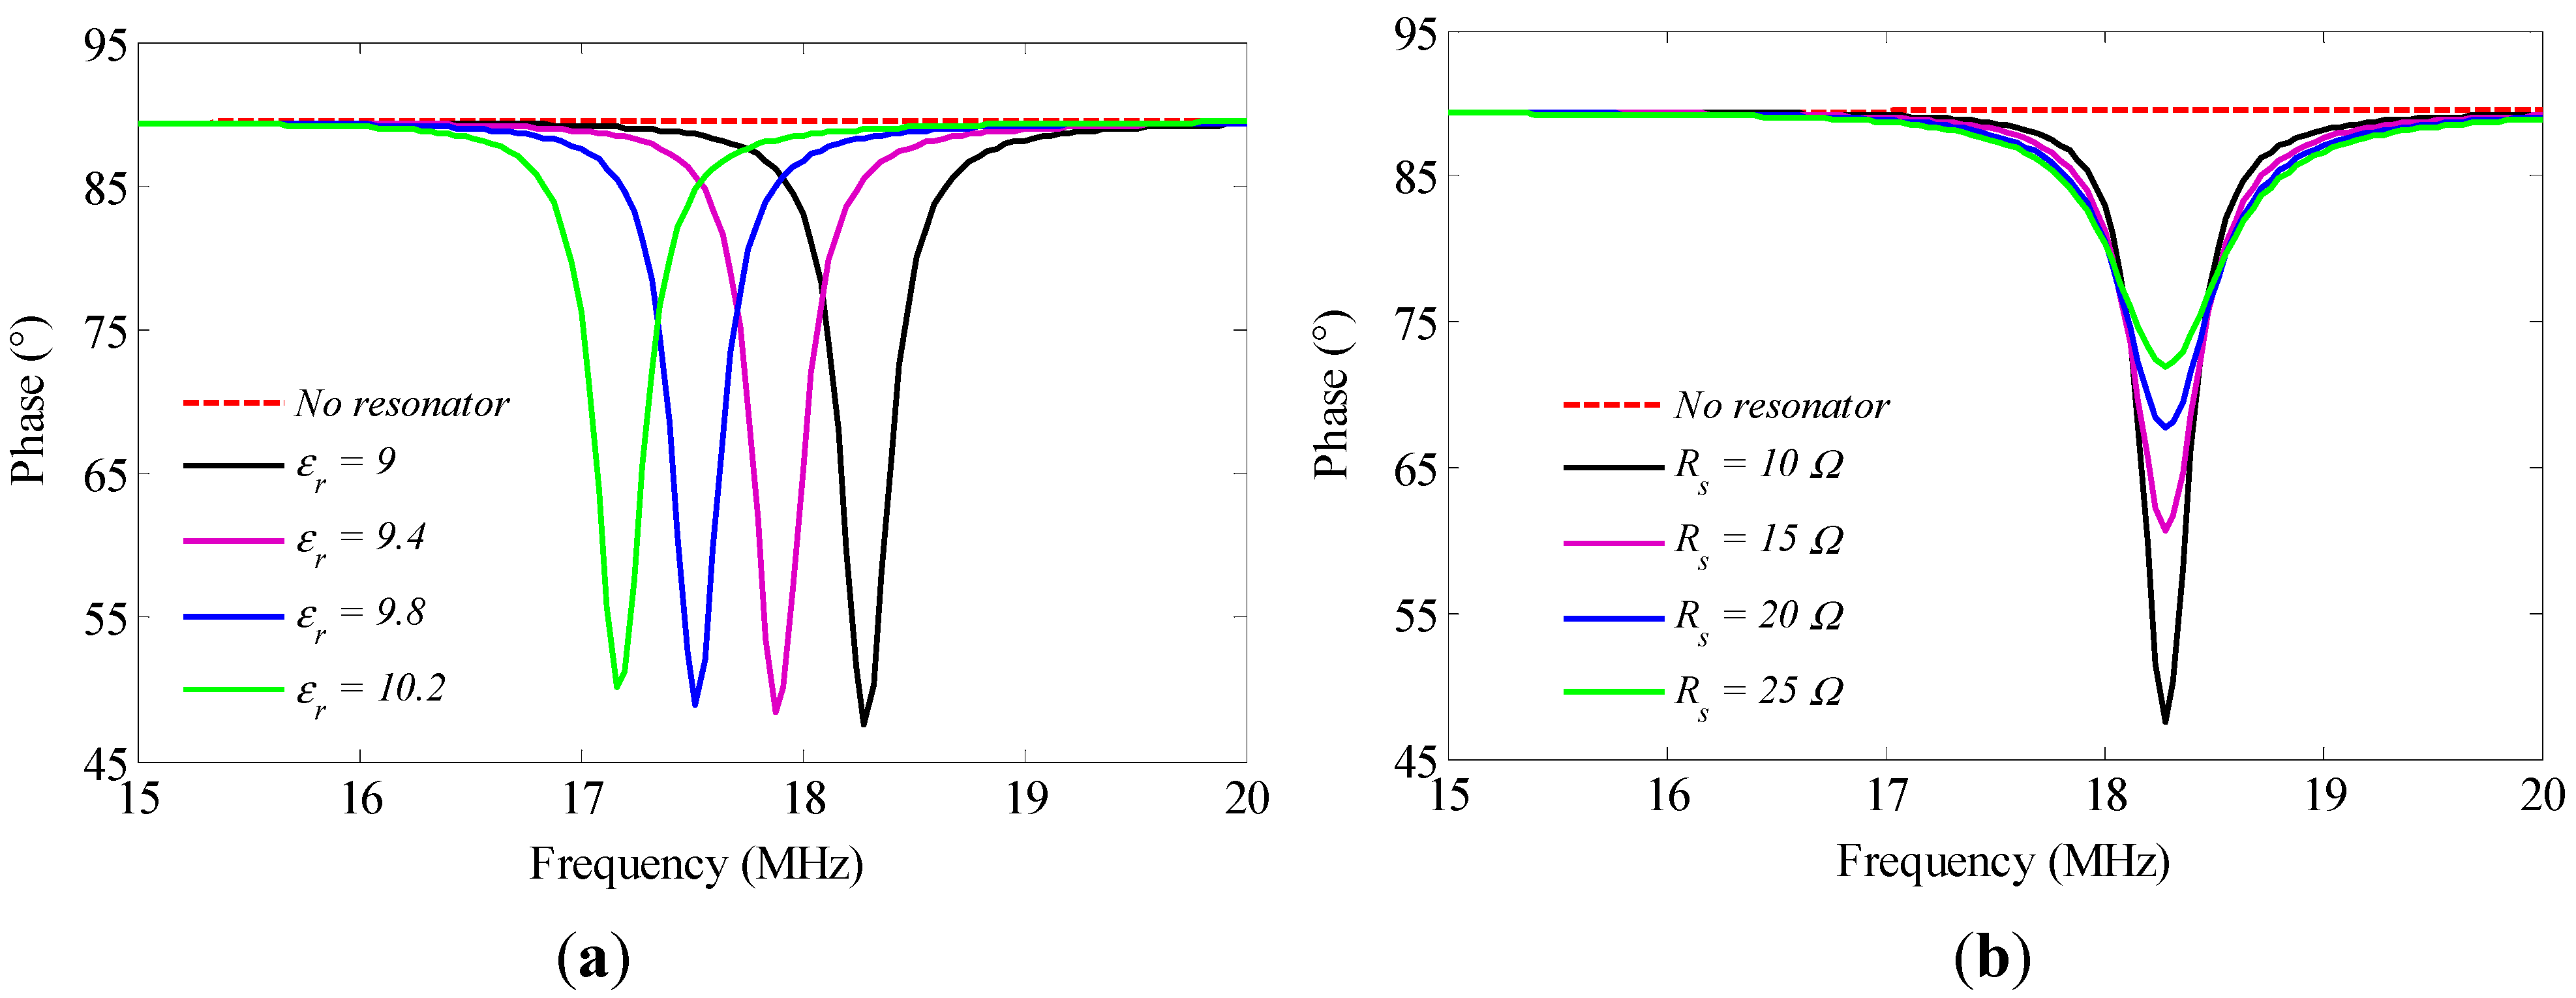
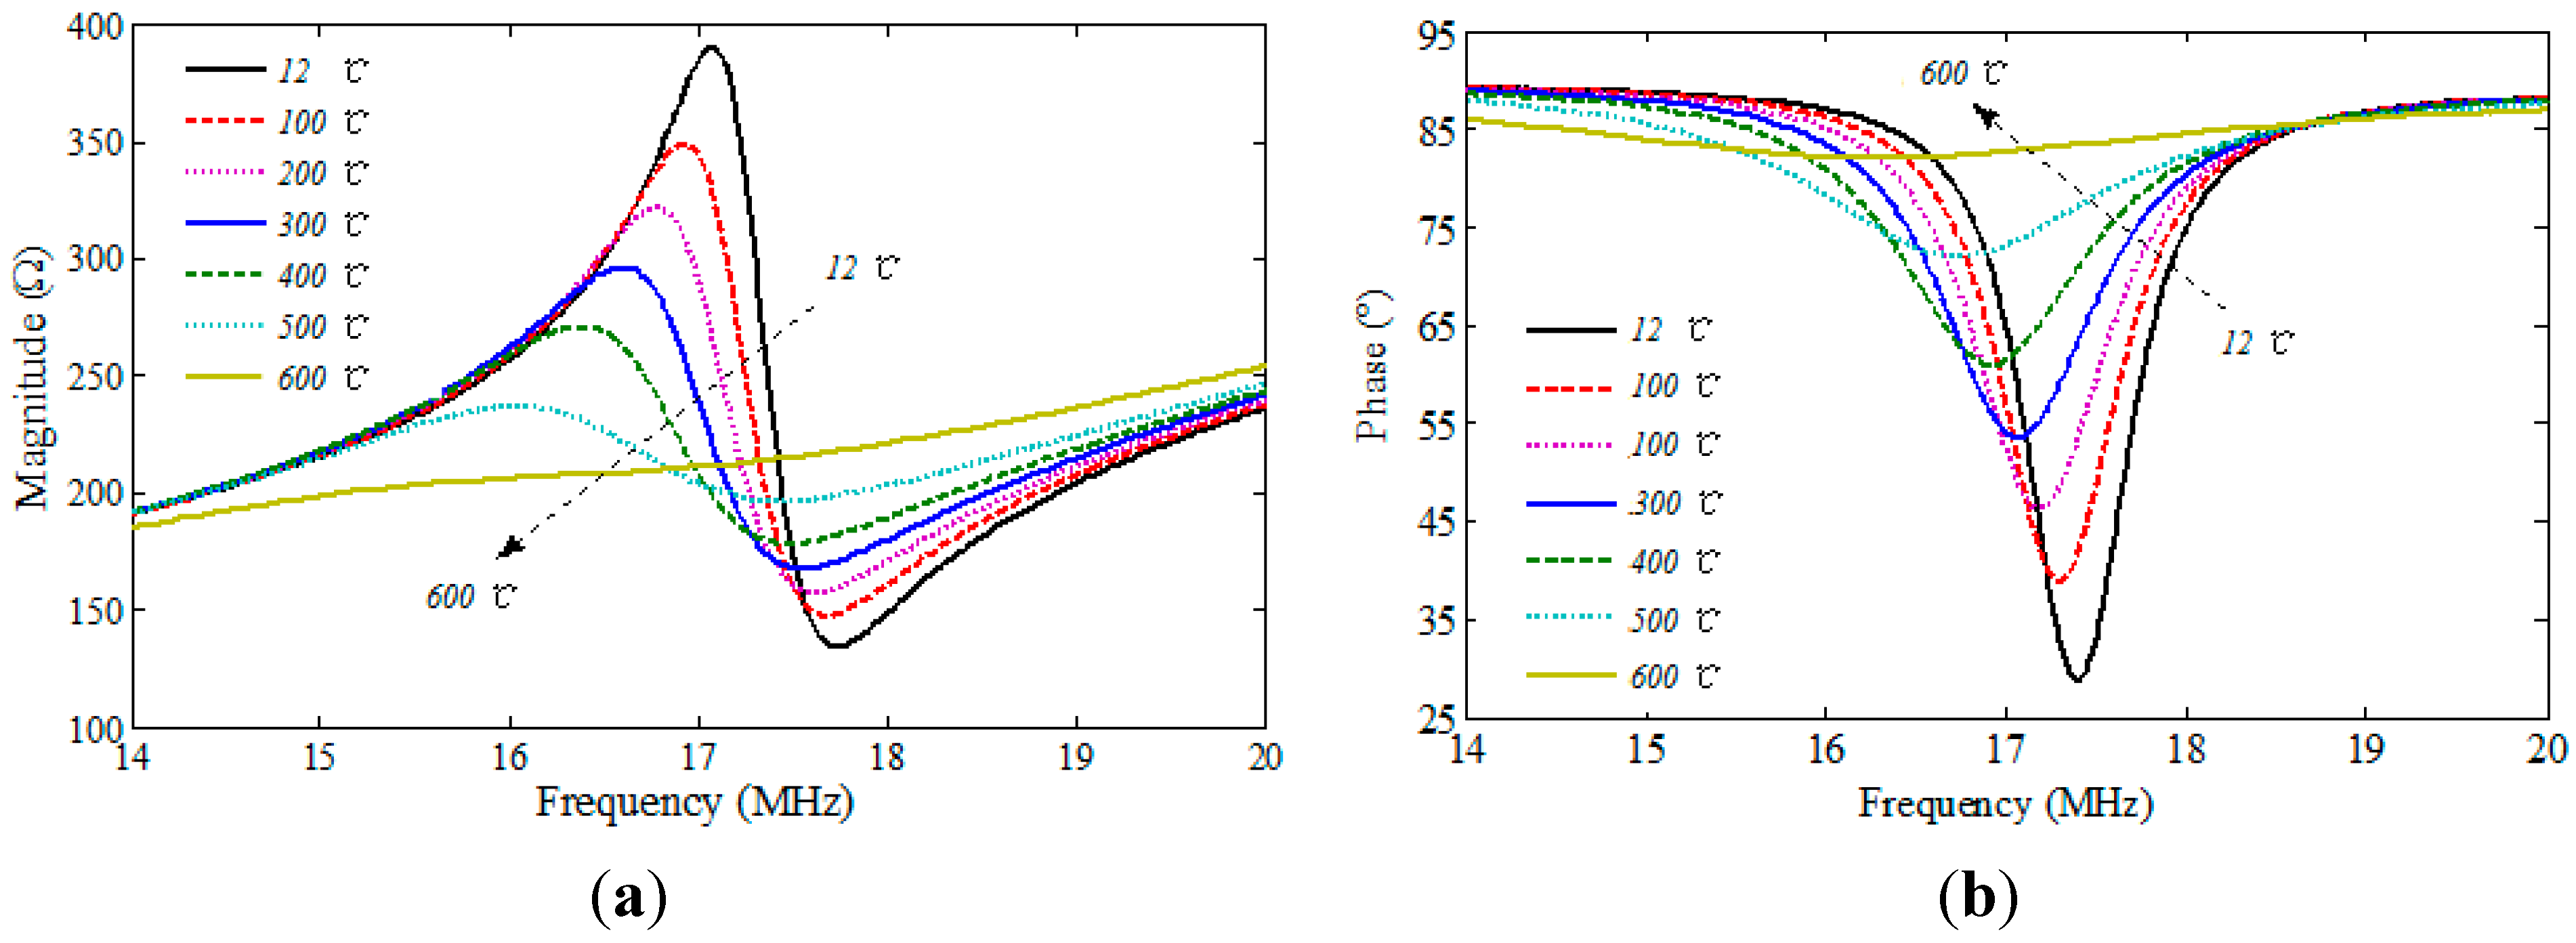
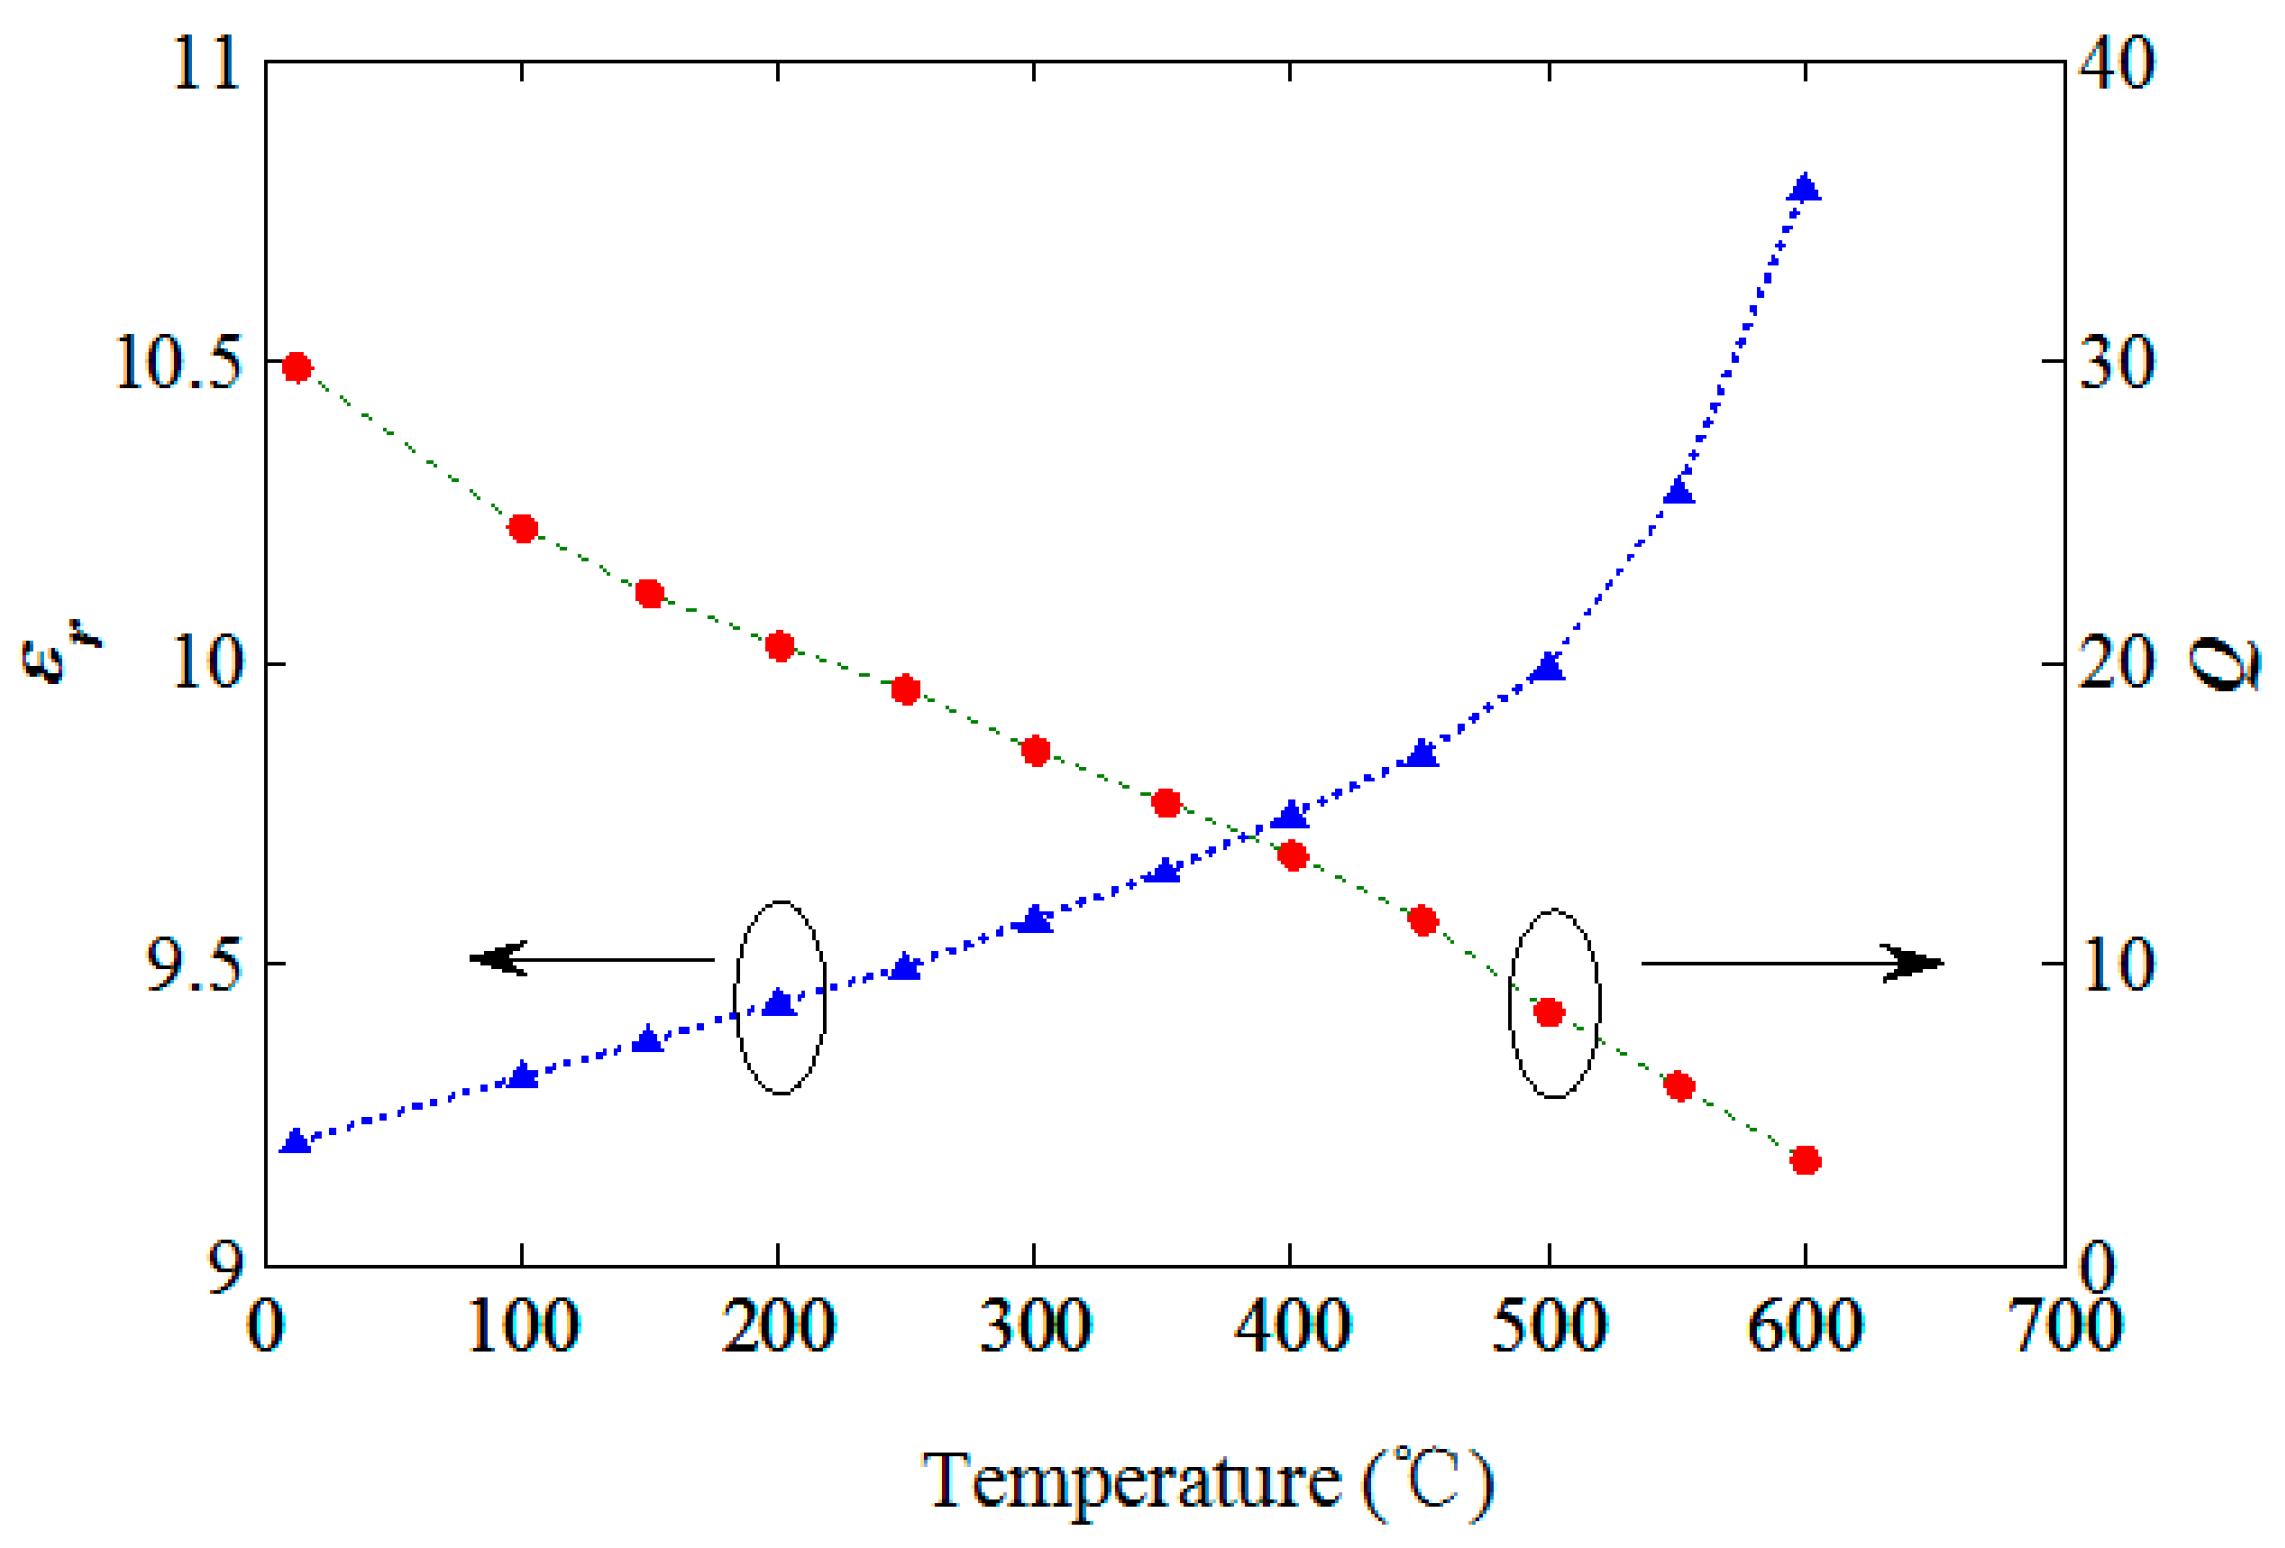
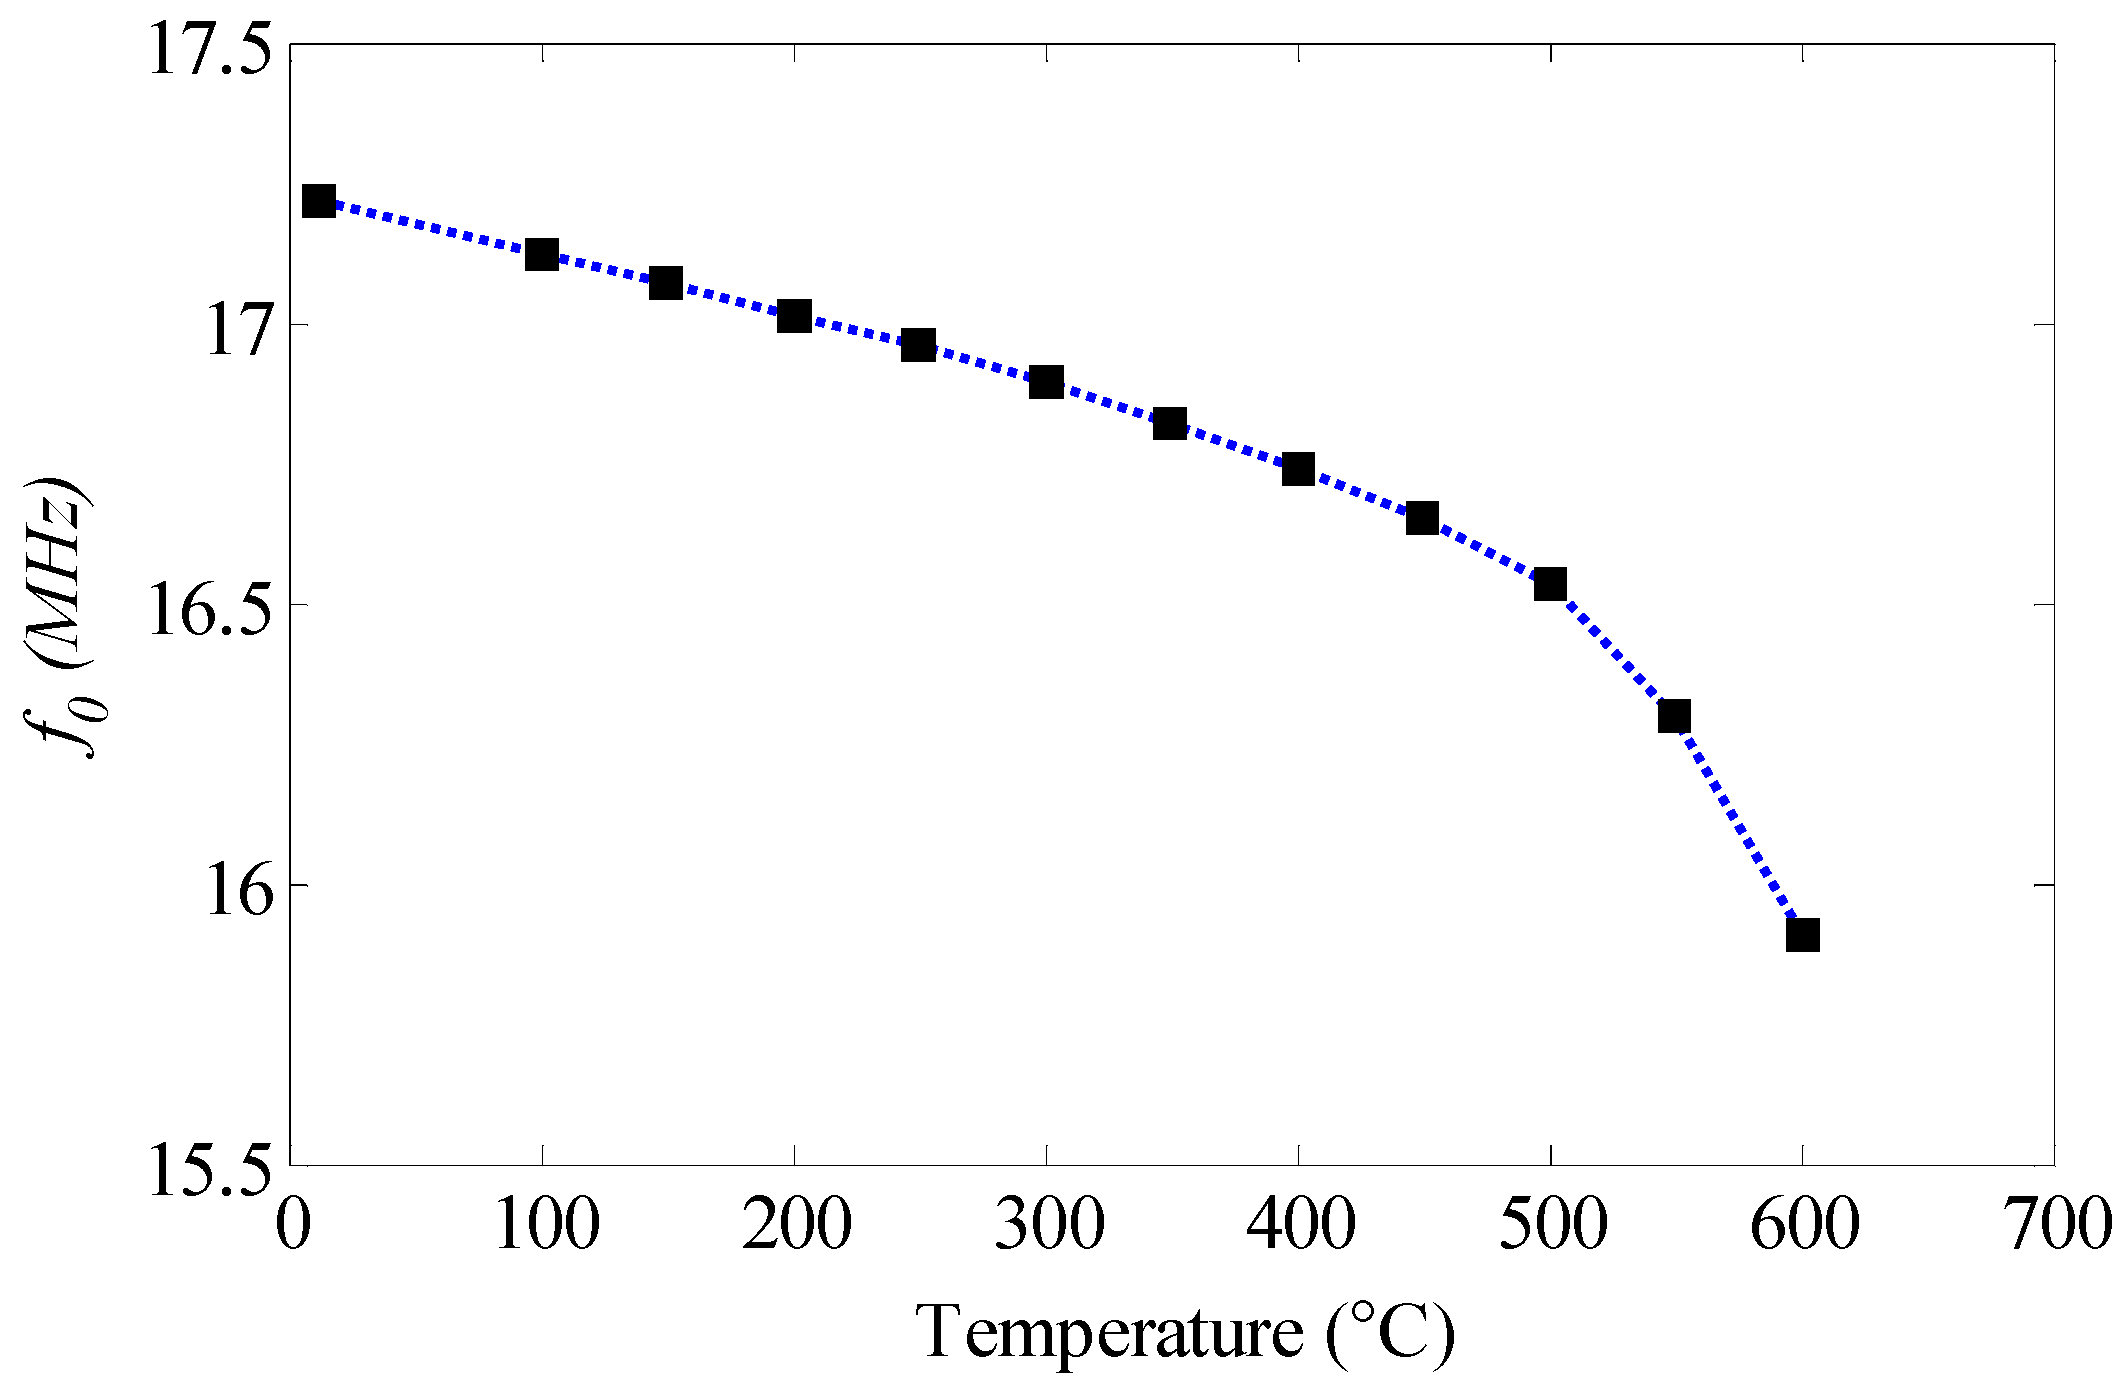
5. Experiment and Discussion


6. Conclusions
Acknowledgments
Author Contributions
Conflicts of Interest
References
- Wang, C.; Peng, C.Q.; Wang, R.C.; Yu, K.; Li, C. Typical properties and preparation technologies of AlN packaging material. Chin. J. Nonfer. Metals 2007, 11, 1729–1738. [Google Scholar]
- Andó, B.; Baglio, S.; Pitrone, N.; Savalli, N.; Trigona, C. ‘Bent beam’ MEMS temperature sensors for contactless measurements in harsh environments. In Proceedings of the IEEE Conferences on Instrumentation and Measurement Technology, Victoria, BC, Canada, 12–15 May 2008.
- Engelmark, F. AlN and High-Thin Films for IC and Electroacoustic Applications. Ph.D. Thesis, Uppsala University, Uppsala, Swenden, 2002. [Google Scholar]
- Khor, K.A.; Cheng, K.H.; Yu, L.G.; Boey, F. Thermal conductivity and dielectric constant of spark plasma sintered aluminum nitride. Mater. Sci. Eng. 2003, A347, 300–305. [Google Scholar] [CrossRef]
- Bellosi, A.; Esposito, L.; Scafè, E.; Fabbri, L. The influence of microstructure on the thermal conductivity of aluminium nitride. J. Mater. Sci. 1994, 29, 5014–5022. [Google Scholar] [CrossRef]
- Jarrige, J.; Lecompte, J.P.; Mullot, J.; Müller, G.G. Effect of oxygen on the thermal conductivity of aluminium nitride ceramics. J. Eur. Ceram. Soc. 1997, 17, 1891–1895. [Google Scholar] [CrossRef]
- Humbert, W.R.; Scott, W.R.J. A resonant technique to measure the dielectric properties of planar materials. IEEE Anten. Propag. Soc. Int. Symp. 1997, 4, 2316–2319. [Google Scholar]
- Lin, M.; Afsar, M.N. A new cavity perturbation technique for accurate measurement of dielectric parameters. In Proceedings of the IEEE MTT-S International Microwave Symposium Digest, San Francisco, CA, USA., 11–16 June 2006.
- Peng, Z.W.; Hwang, J.; Andriese, M. Maximum Sample Volume for Permittivity Measurements by Cavity Perturbation Technique. IEEE Trans. Instrum. Meas. 2013, 63, 450–455. [Google Scholar] [CrossRef]
- Lin, C.-M.; Chen, Y.-Y.; Felmetsger, V.V.; Lien, W.-C.; Riekkinen, T.; Senesky, D.G.; Pisano, A.P. Surface acoustic wave devices on AlN/3C–SiC/Si multilayer structures. J. Micromech. Microeng. 2013, 23. [Google Scholar] [CrossRef]
- Zou, J.; Lin, C.-M.; Chen, Y.-Y.; Pisano, A.P. Theoretical study of thermally stable SiO2/AlN/SiO2 Lamb wave resonators at high temperatures. J. Appl. Phys. 2014, 115. [Google Scholar] [CrossRef]
- Knaust, S.; Khaji, Z.; Sturesson, P.; Klintberg, L. Characterization of dielectric properties of polycrystalline aluminum nitride for high temperature wireless sensor nodes. J. Phys. Conf. Ser. 2013, 476. [Google Scholar] [CrossRef]
- Sheen, J. A dielectric resonator method of measuring dielectric properties of low loss materials in the microwave region. Meas. Sci. Technol. 2008, 19. [Google Scholar] [CrossRef]
- Krupka, J.; Derzakowski, K.; Riddle, B.; Baker-Jarvis, J. A dielectric resonator for measurements of complex permittivity of low loss dielectric materials as a function of temperature. Meas. Sci. Technol. 1998, 9, 1751–1756. [Google Scholar] [CrossRef]
- Lin, C.-M.; Yen, T.-T.; Lai, Y.-J.; Felmetsger, V.V.; Hopcroft, M.A.; Kuypers, J.H.; Pisano, A.P. Temperature-compensated aluminum nitride Lamb wave resonators. IEEE Trans. Ultrason. Ferroelectr. Freq. Control 2010, 57, 524–532. [Google Scholar] [PubMed]
- Lin, C.-M.; Yen, T.-T.; Lai, Y.-J.; Felmetsger, V.V.; Hopcroft, M.A.; Kuypers, J.H.; Pisano, A.P. Thermally compensated aluminum nitride Lamb wave resonators for high temperature applications. Appl. Phys. Lett. 2010, 97. [Google Scholar] [CrossRef]
- Nopper, R.; Has, R.; Reindl, L. A wireless sensor readout system-Circuit concept, simulation, and accuracy. IEEE Trans. Instrum. Meas. 2011, 60, 2976–2983. [Google Scholar] [CrossRef]
- Fonseca, M.A. Polymer/Ceramic Wireless MEMS Pressure Sensors for Harsh Environments: High Temperature and Biomedical Applications. Ph.D. Thesis, Georgia Institute of Technology, Atlanta, GA, USA, 2007. [Google Scholar]
- Mohan, S.S.; Hershenson, M.D.; Boyd, S.P.; Lee, T.H. Simple accurate expressions for planar spiral inductances. IEEE J. Solid-State Circuits 1999, 34, 1419–1424. [Google Scholar] [CrossRef]
- Wang, Y.; Jia, Y.; Chen, Q.; Wang, Y. A passive wireless temperature sensor for harsh environment applications. Sensors 2008, 8, 7982–7995. [Google Scholar] [CrossRef]
- Kuhn, W.; Ibrahim, N. Analysis of current crowding effects in multiturn spiralinductors. IEEE Trans. Microw. Theory Tech. 2001, 49, 31–38. [Google Scholar] [CrossRef]
- Yamaguchi, T.; Kageyama, M. Oxidation behavior of AlN in the presence of oxide and glass for thick film applications. IEEE Trans. Comp. Hybrids Manuf. Technol. 1989, 12, 22–25. [Google Scholar] [CrossRef]
- Xu, Z.H.; Ma, L.S.; Li, Z.Y.; Han, Z.Y.; Wang, Q.; Tang, X.Y. The effect of oxidation of AlN substrates on printing adhesion strength. Electron. Compon. Mater. 2000, 19, 1–2. [Google Scholar]
- Francis, R.W.; Worrell, W.L. High temperature electrical conductivity of aluminum nitride. J. Electrochem. Soc. 1976, 123, 430–433. [Google Scholar] [CrossRef]
© 2015 by the authors; licensee MDPI, Basel, Switzerland. This article is an open access article distributed under the terms and conditions of the Creative Commons Attribution license (http://creativecommons.org/licenses/by/4.0/).
Share and Cite
Liu, J.; Yuan, Y.; Ren, Z.; Tan, Q.; Xiong, J. High-Temperature Dielectric Properties of Aluminum Nitride Ceramic for Wireless Passive Sensing Applications. Sensors 2015, 15, 22660-22671. https://doi.org/10.3390/s150922660
Liu J, Yuan Y, Ren Z, Tan Q, Xiong J. High-Temperature Dielectric Properties of Aluminum Nitride Ceramic for Wireless Passive Sensing Applications. Sensors. 2015; 15(9):22660-22671. https://doi.org/10.3390/s150922660
Chicago/Turabian StyleLiu, Jun, Yukun Yuan, Zhong Ren, Qiulin Tan, and Jijun Xiong. 2015. "High-Temperature Dielectric Properties of Aluminum Nitride Ceramic for Wireless Passive Sensing Applications" Sensors 15, no. 9: 22660-22671. https://doi.org/10.3390/s150922660