
Segmentation of White Blood Cells through Nucleus Mark Watershed Operations and Mean Shift Clustering

Abstract
:1. Introduction
2. Technological Background
2.1. Different Color Spaces
2.2. Illumination Intensity Adjustment

2.3. Mean Shift Clustering
2.4. Watershed Transformation
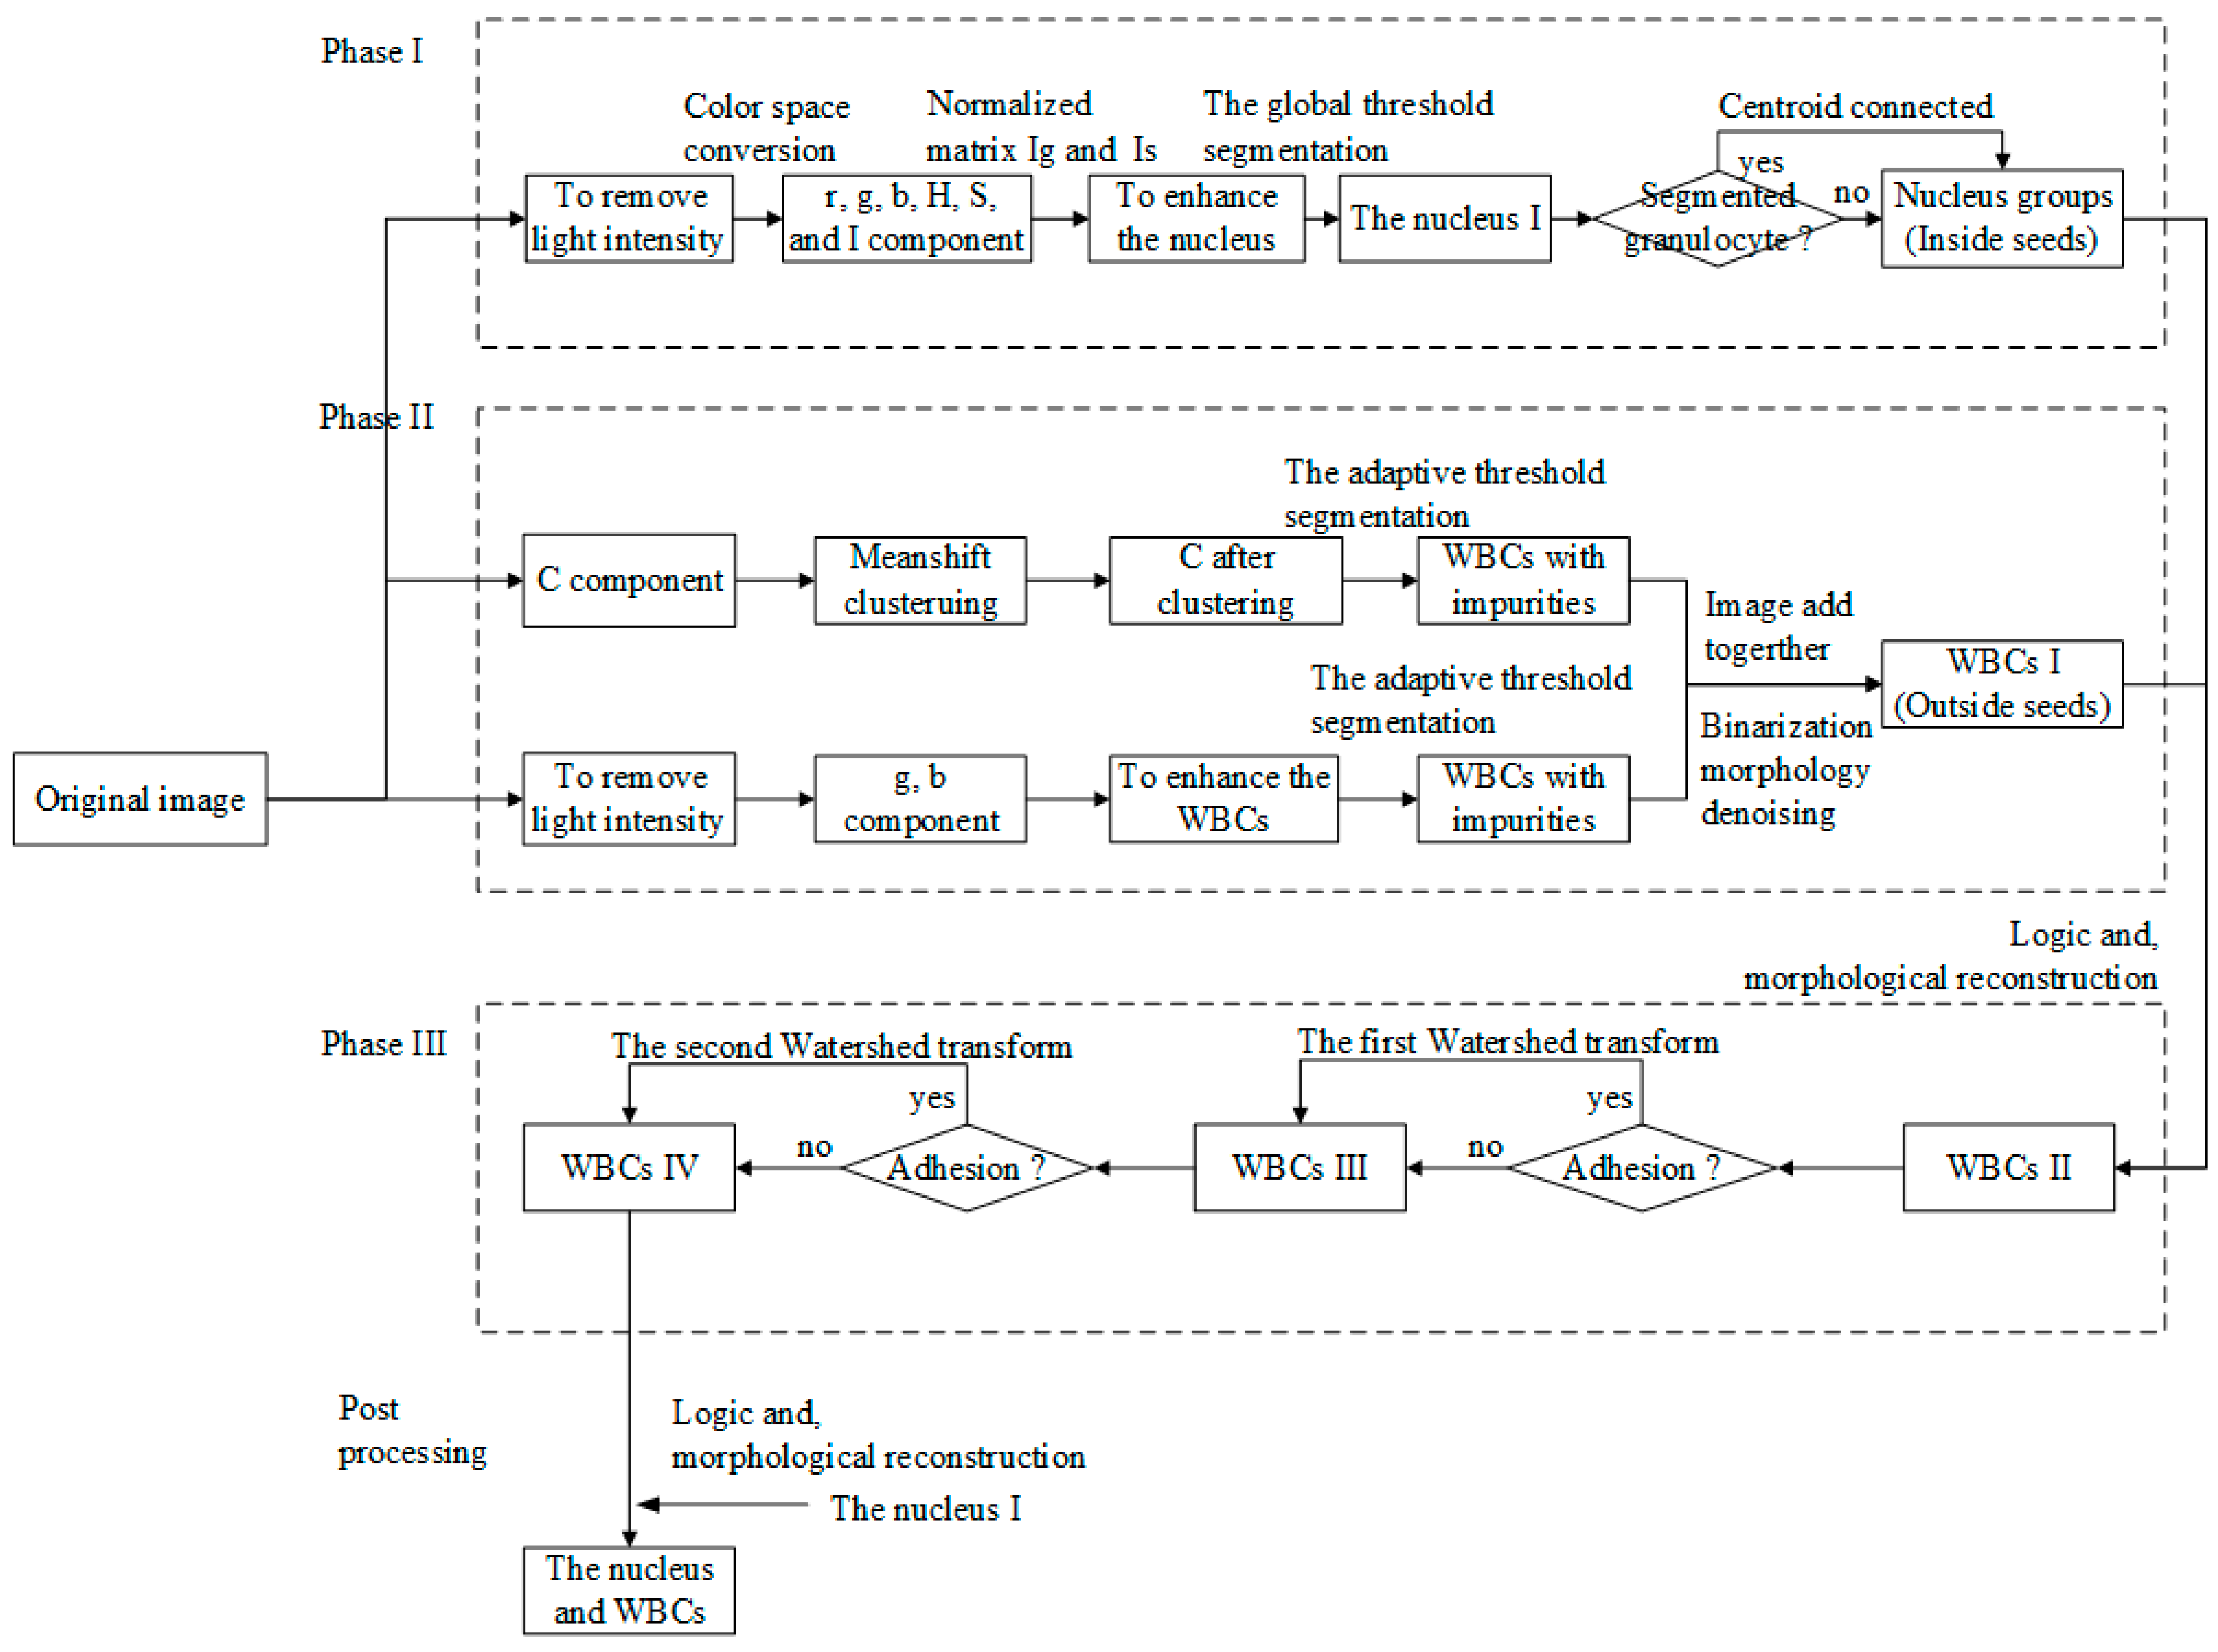
3. Scheme and Methods
3.1. Morphology Operation

3.2. Phase I

3.3. Phase II
3.3.1. Mean Shift Clustering


| Cell Types | Area | Height | Weight | Roundness |
|---|---|---|---|---|
| segmented neutrophil | 708~1797 | 28~53 | 30~48 | 1.49~2.31 |
| staff neutrophil | 939~2236 | 32~58 | 37~59 | 1.57~2.54 |
| lymphocyte | 460~2468 | 26~65 | 27~61 | 1.52~2.34 |
| monocyte | 1777~3367 | 49~70 | 47~74 | 1.51~2.48 |
| eosinophil | 942~2216 | 30~55 | 32~55 | 1.67~3.09 |
| basophil | 943~1932 | 36~63 | 31~51 | 1.51~3.08 |
| AML WBCs | 553~3041 | 27~60 | 24~67 | 1.47~3.03 |
| Cell types | Area | Height | Weight | Distance between Two Cores |
|---|---|---|---|---|
| nucleus of segmented neutrophil | 124~872 | 10~39 | 10~39 | 0~ |
| nucleus of staff neutrophil | 418~1029 | 12~52 | 13~50 | |
| nucleus of lymphocyte | 437~1018 | 23~44 | 23~39 | |
| nucleus of monocyte | 970~1640 | 33~61 | 32~53 | |
| nucleus of eosinophil | 426~2157 | 31~53 | 32~53 | |
| nucleus of basophil | 858~1716 | 31~47 | 30~50 |

3.3.2. WBC Enhancement

3.3.3. Obtaining the WBC Region


3.4. Phase III
- Step 1:
- Obtain and modify inside seeds and outside seeds by using the mean shift algorithm and the morphology operation.
- Step 2:
- Determine whether cell adhesion occurs or not in . If yes, proceed to the following steps; if no, end.
- Step 3:
- Generate the map of distances, named , from the black pixel to the white pixels of the inside seeds.
- Step 4:
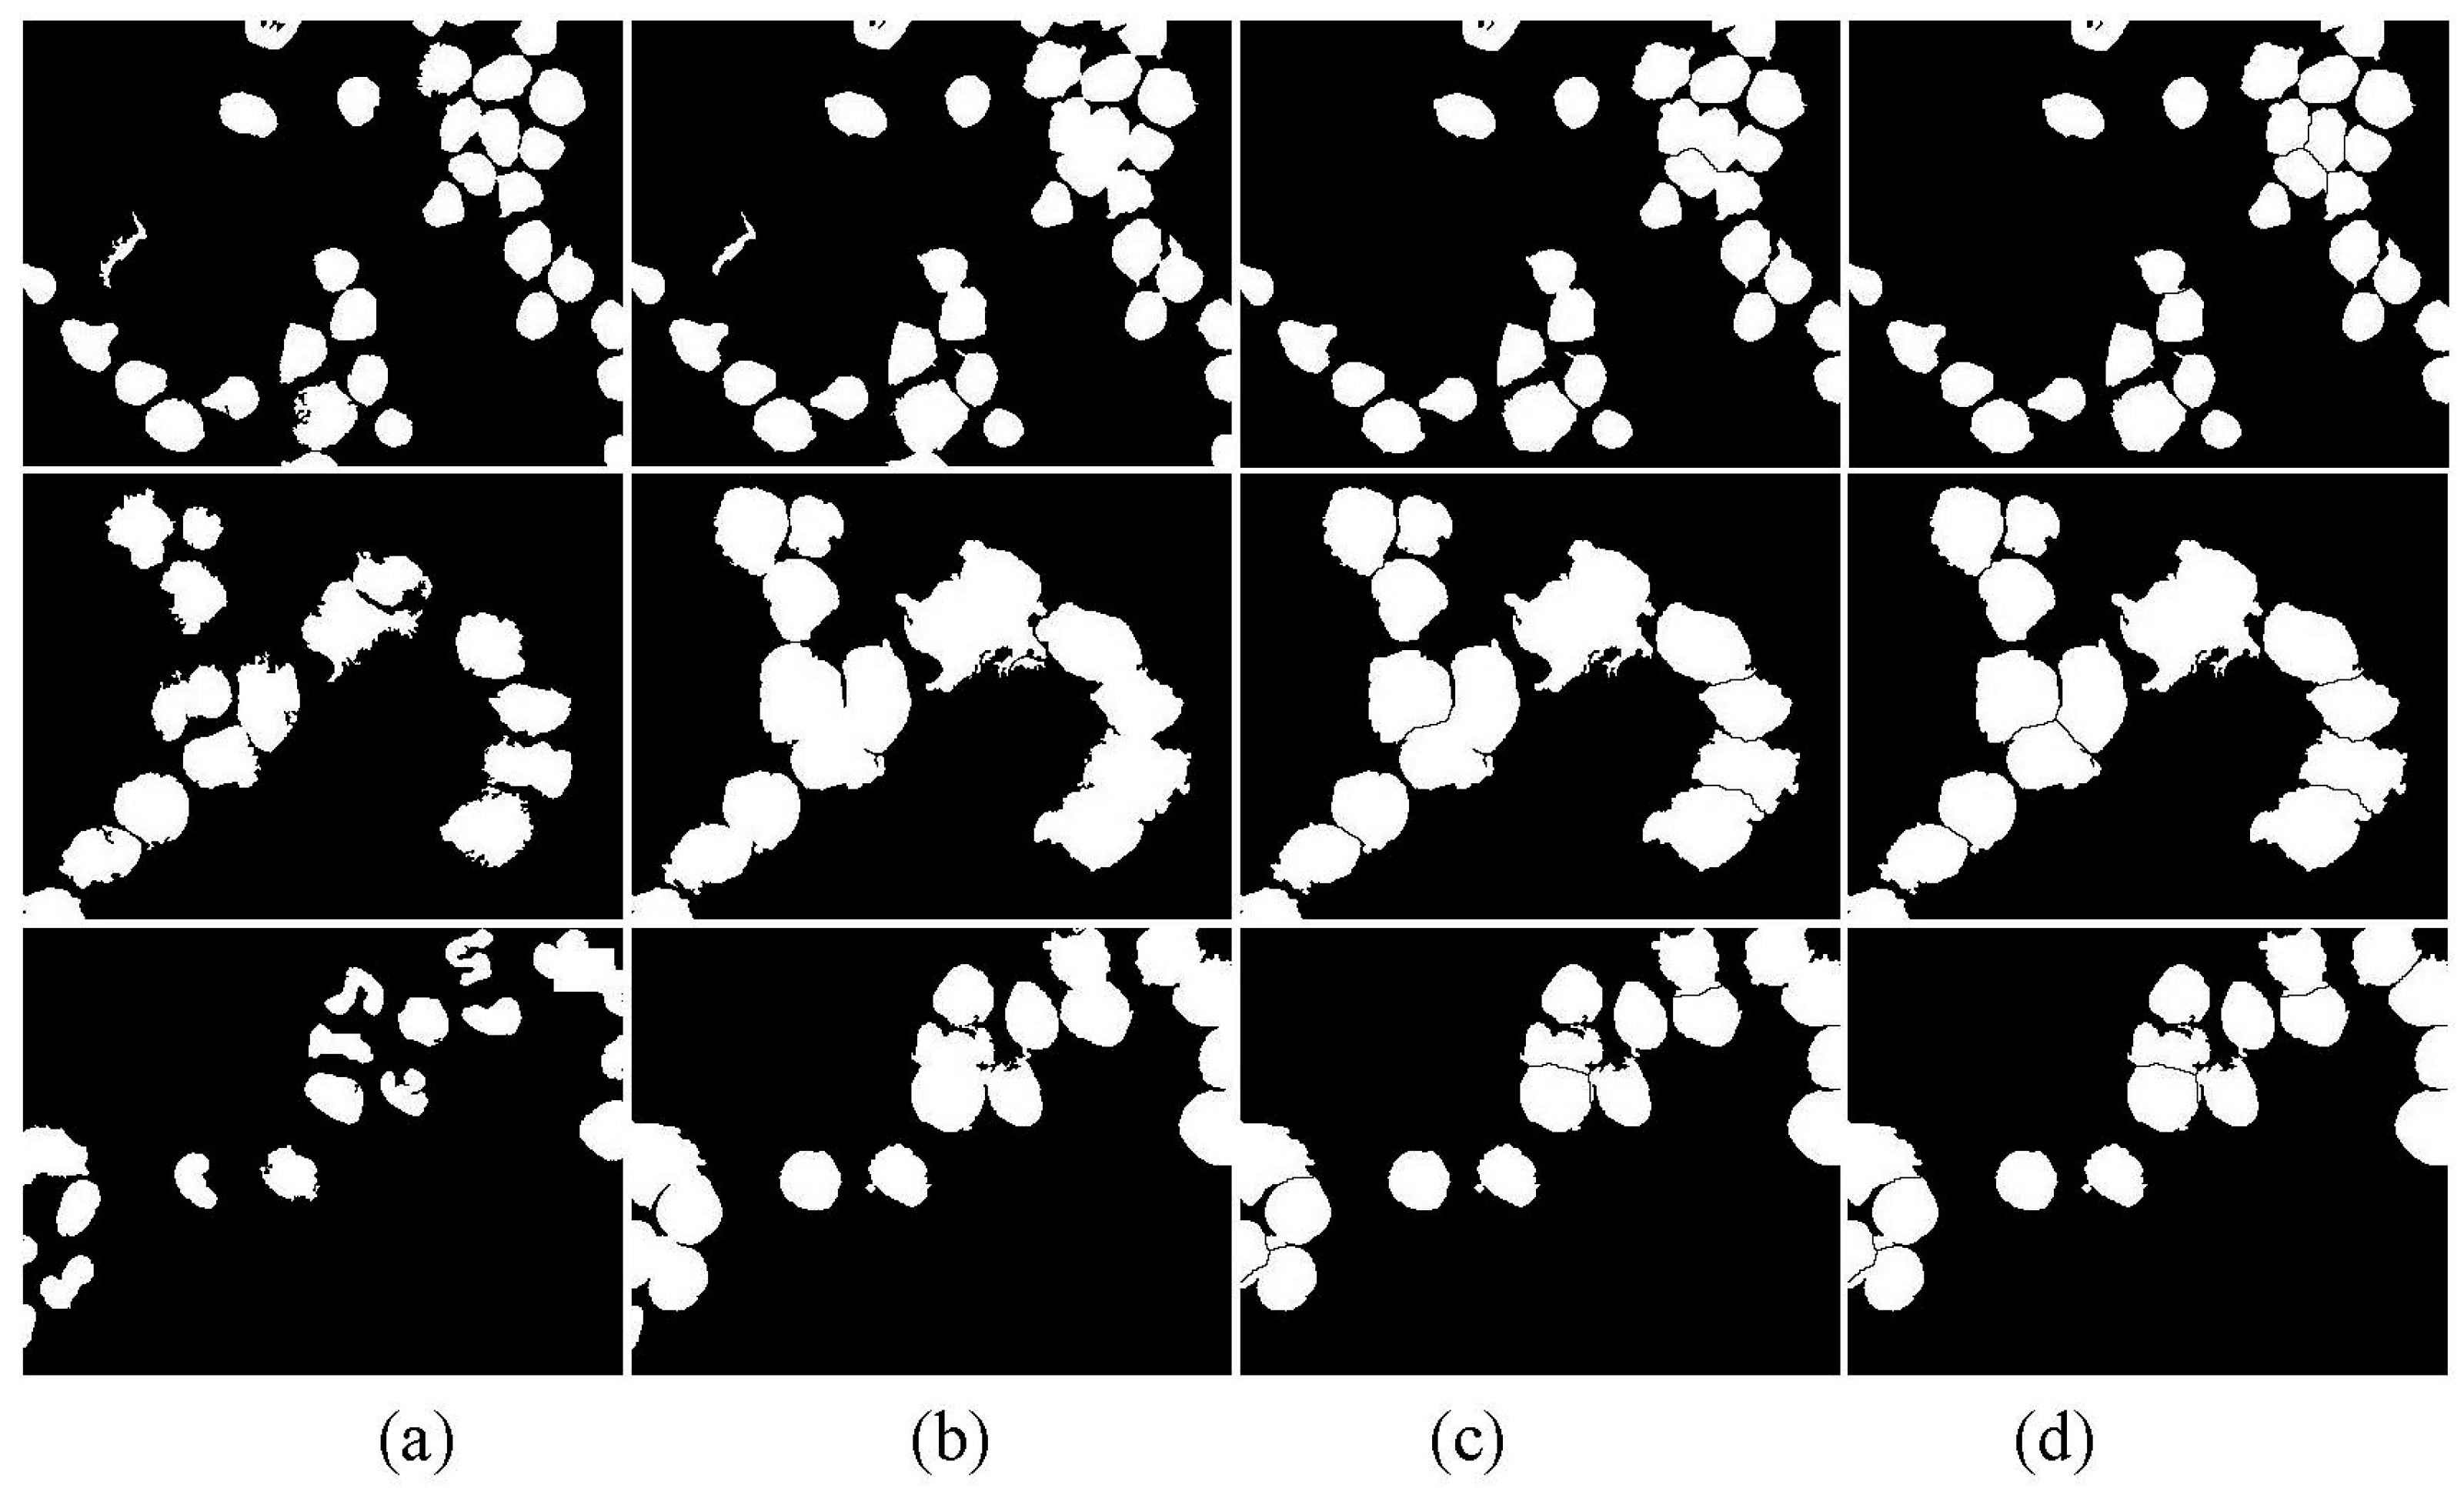
- Apply the watershed algorithm to . The watershed ridge line shown in can be used to obtain separating blood cell images ().
- Step 5:
- Determine whether cell adhesion occurs or not in . If yes, do the following steps; if no, end.
- Step 6:
- Obtain the local extremum region [21] on the adhesion target individually. The local extremum is designed by cell size. Perform adaptive iteration corrosion on adhesion target individually until the number of targets increases or does not merely disappear.
- Step 7:
- Apply the watershed algorithm to one by one to obtain the watershed ridge lines. The watershed ridge line displayed in can obtain the separating blood cell images ().
- Step 8:
- End.
3.5. Post-Processing
4. Experimental Results
4.1. Data Set
4.2. Morphology Preference
- (1)
- and . As shown in Table 1, the minimum area in the nucleus is 124 in segmented neutrophils, and the minimum area in WBCs is 460. Thus, we select = 100 and = 350 as the area thresholds to eliminate platelets and noise in morphological denoising.
- (2)
- : Fluctuation range of the centroid, which may not be located in the cores. We set a fluctuation range around the centroid to connect multiple cores into one nucleus and comprehensively consider the length and width of WBCs, as well as the distances of the multiple cores. = 5 is a suitable fluctuation range.
- (3)
- : The minimum distance threshold of multiple cores. We calculated the range of distances between multiple cores, which is from 0 to . = is a suitable distance threshold.
- (4)
- and : Area thresholds of one core. The range of the area is 124 to 872 for one core. The area whose value is within the range of 100 to 950 can be one of the judgment conditions to distinguish segmental neutrophils. Thus, = 100 and = 950.
- (5)
- and . and are the area and roundness threshold of the adhesion target, respectively. In most cases, the area of the adhesive target is higher than 3500, whereas the roundness of the adhesive target is higher than 3.00. Thus, = 3500 and = 3.00.
- (6)
- . is the local extremum in the second watershed transformation. is designed based on WBC size. The minimum length of WBCs is 24 in terms of AML WBCs shown in Table 1. is a little less than , Thus, we selected as a suitable local extremum.
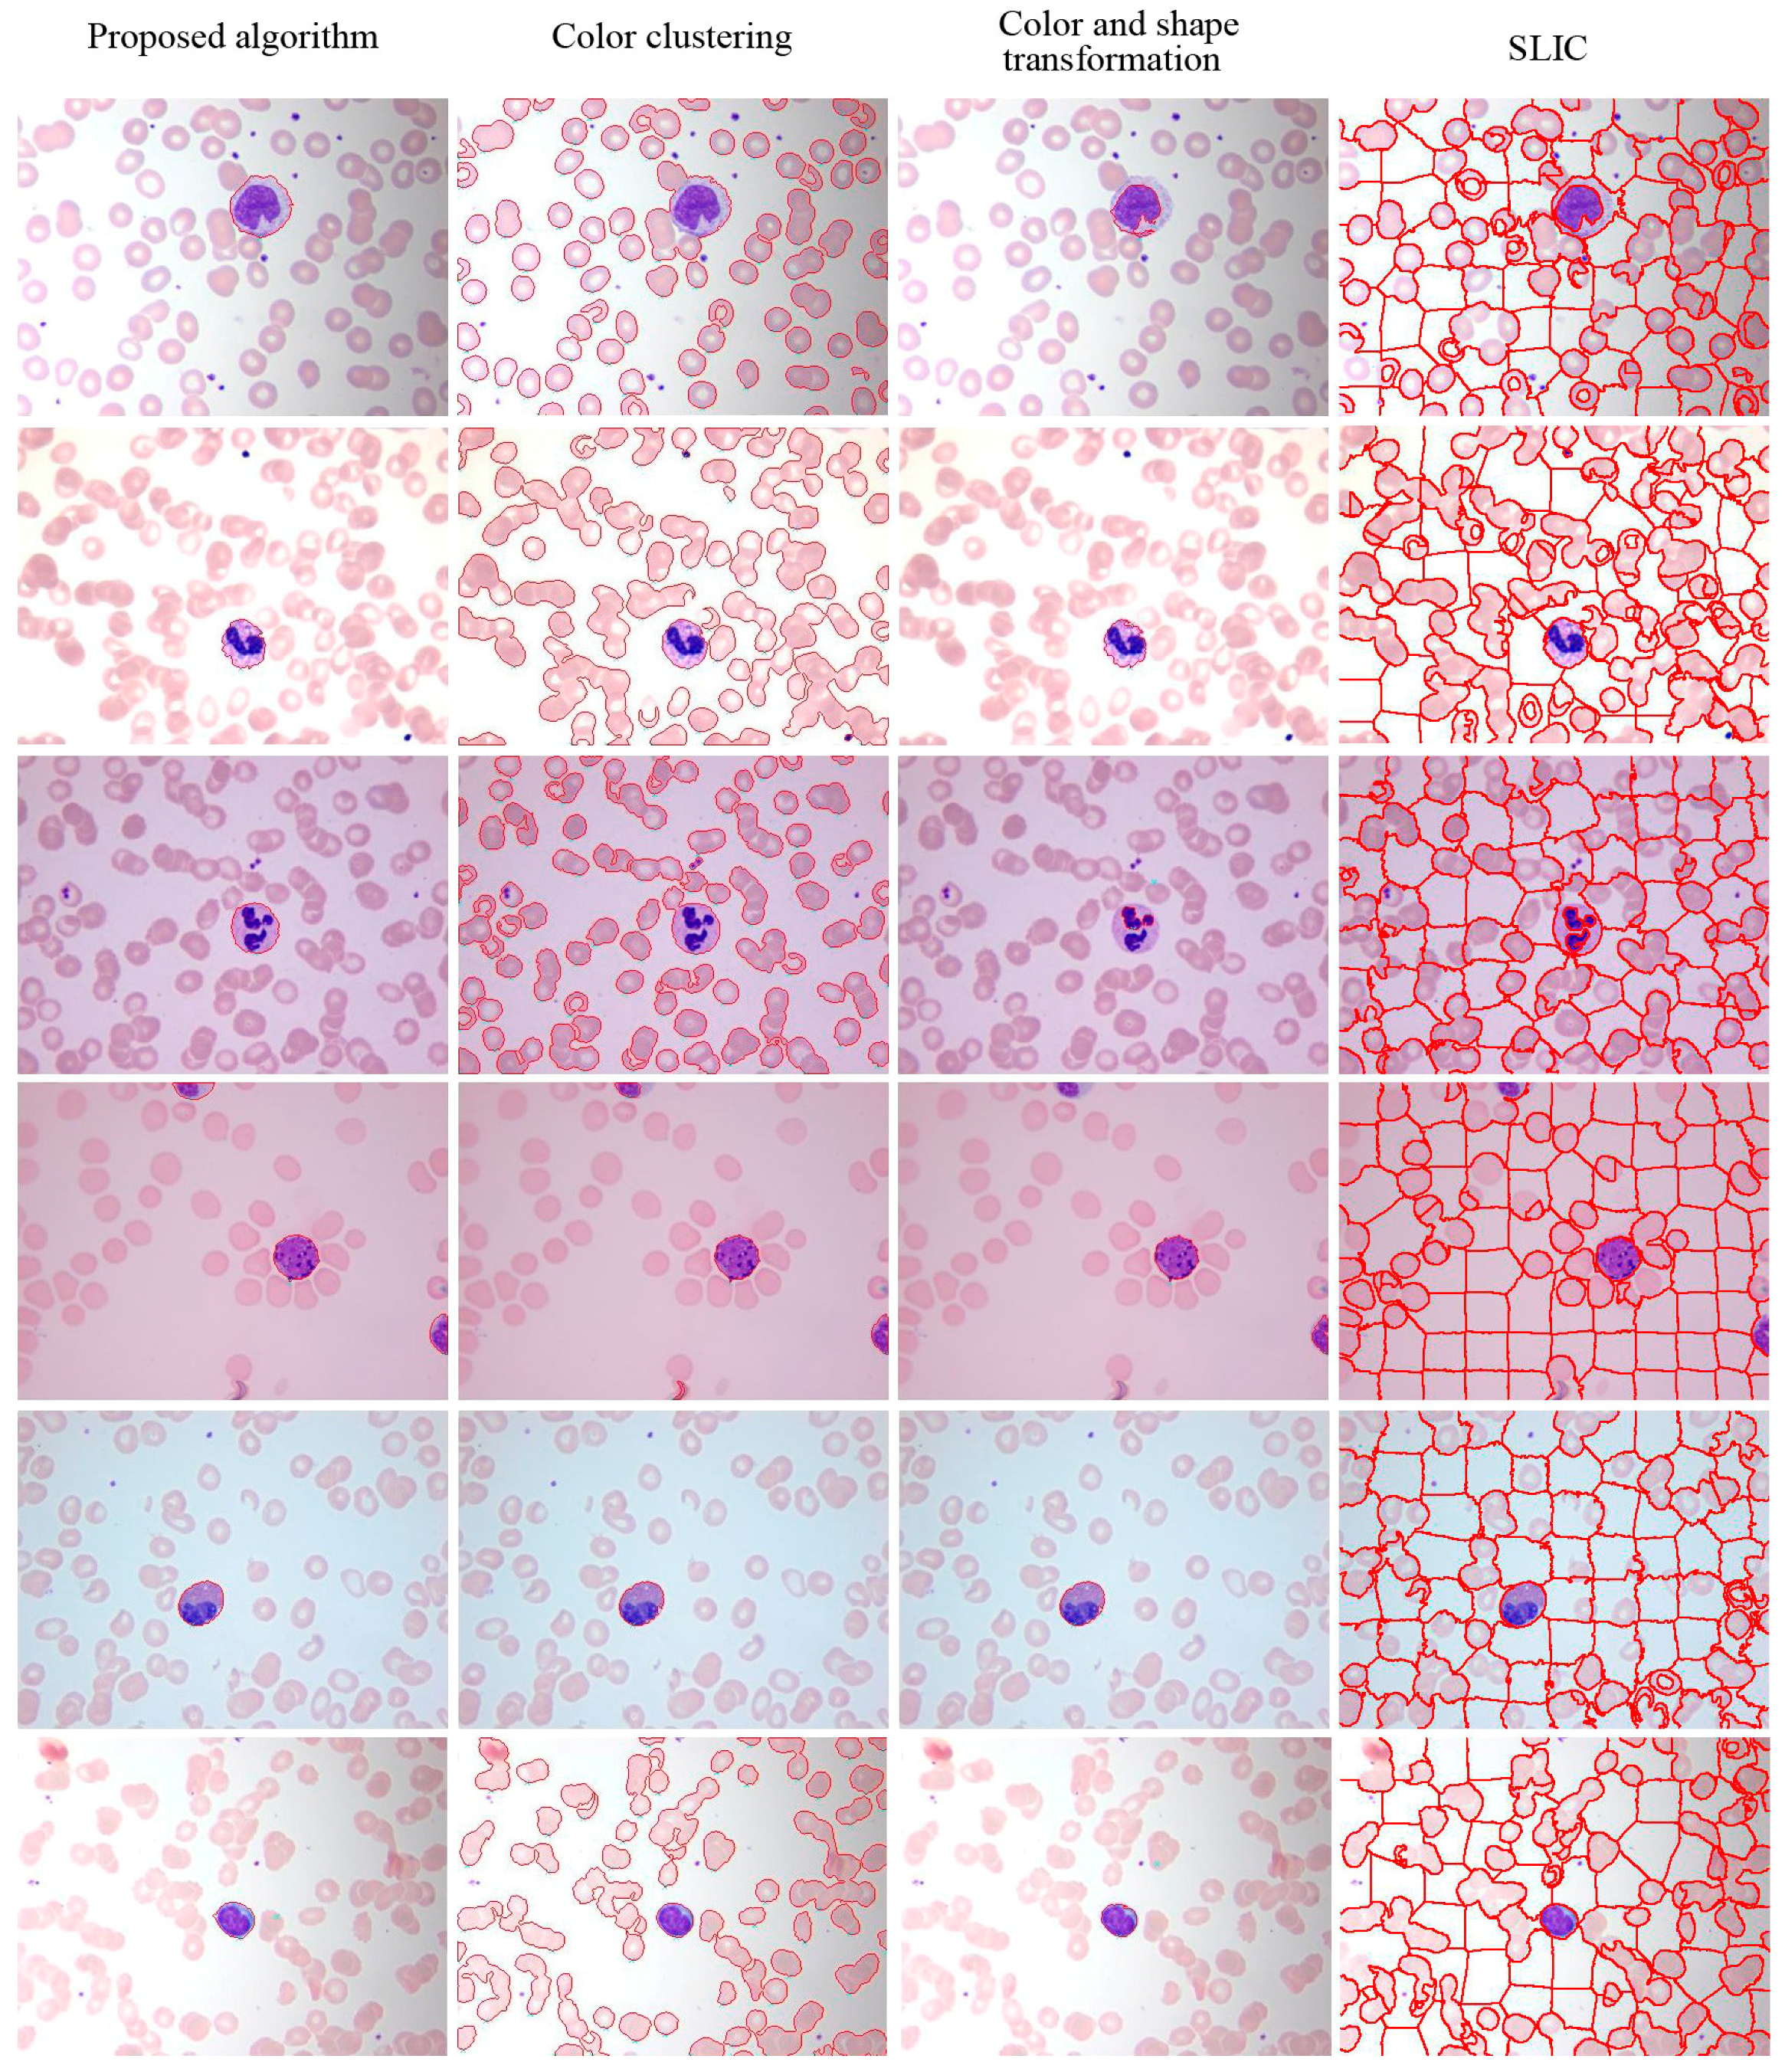
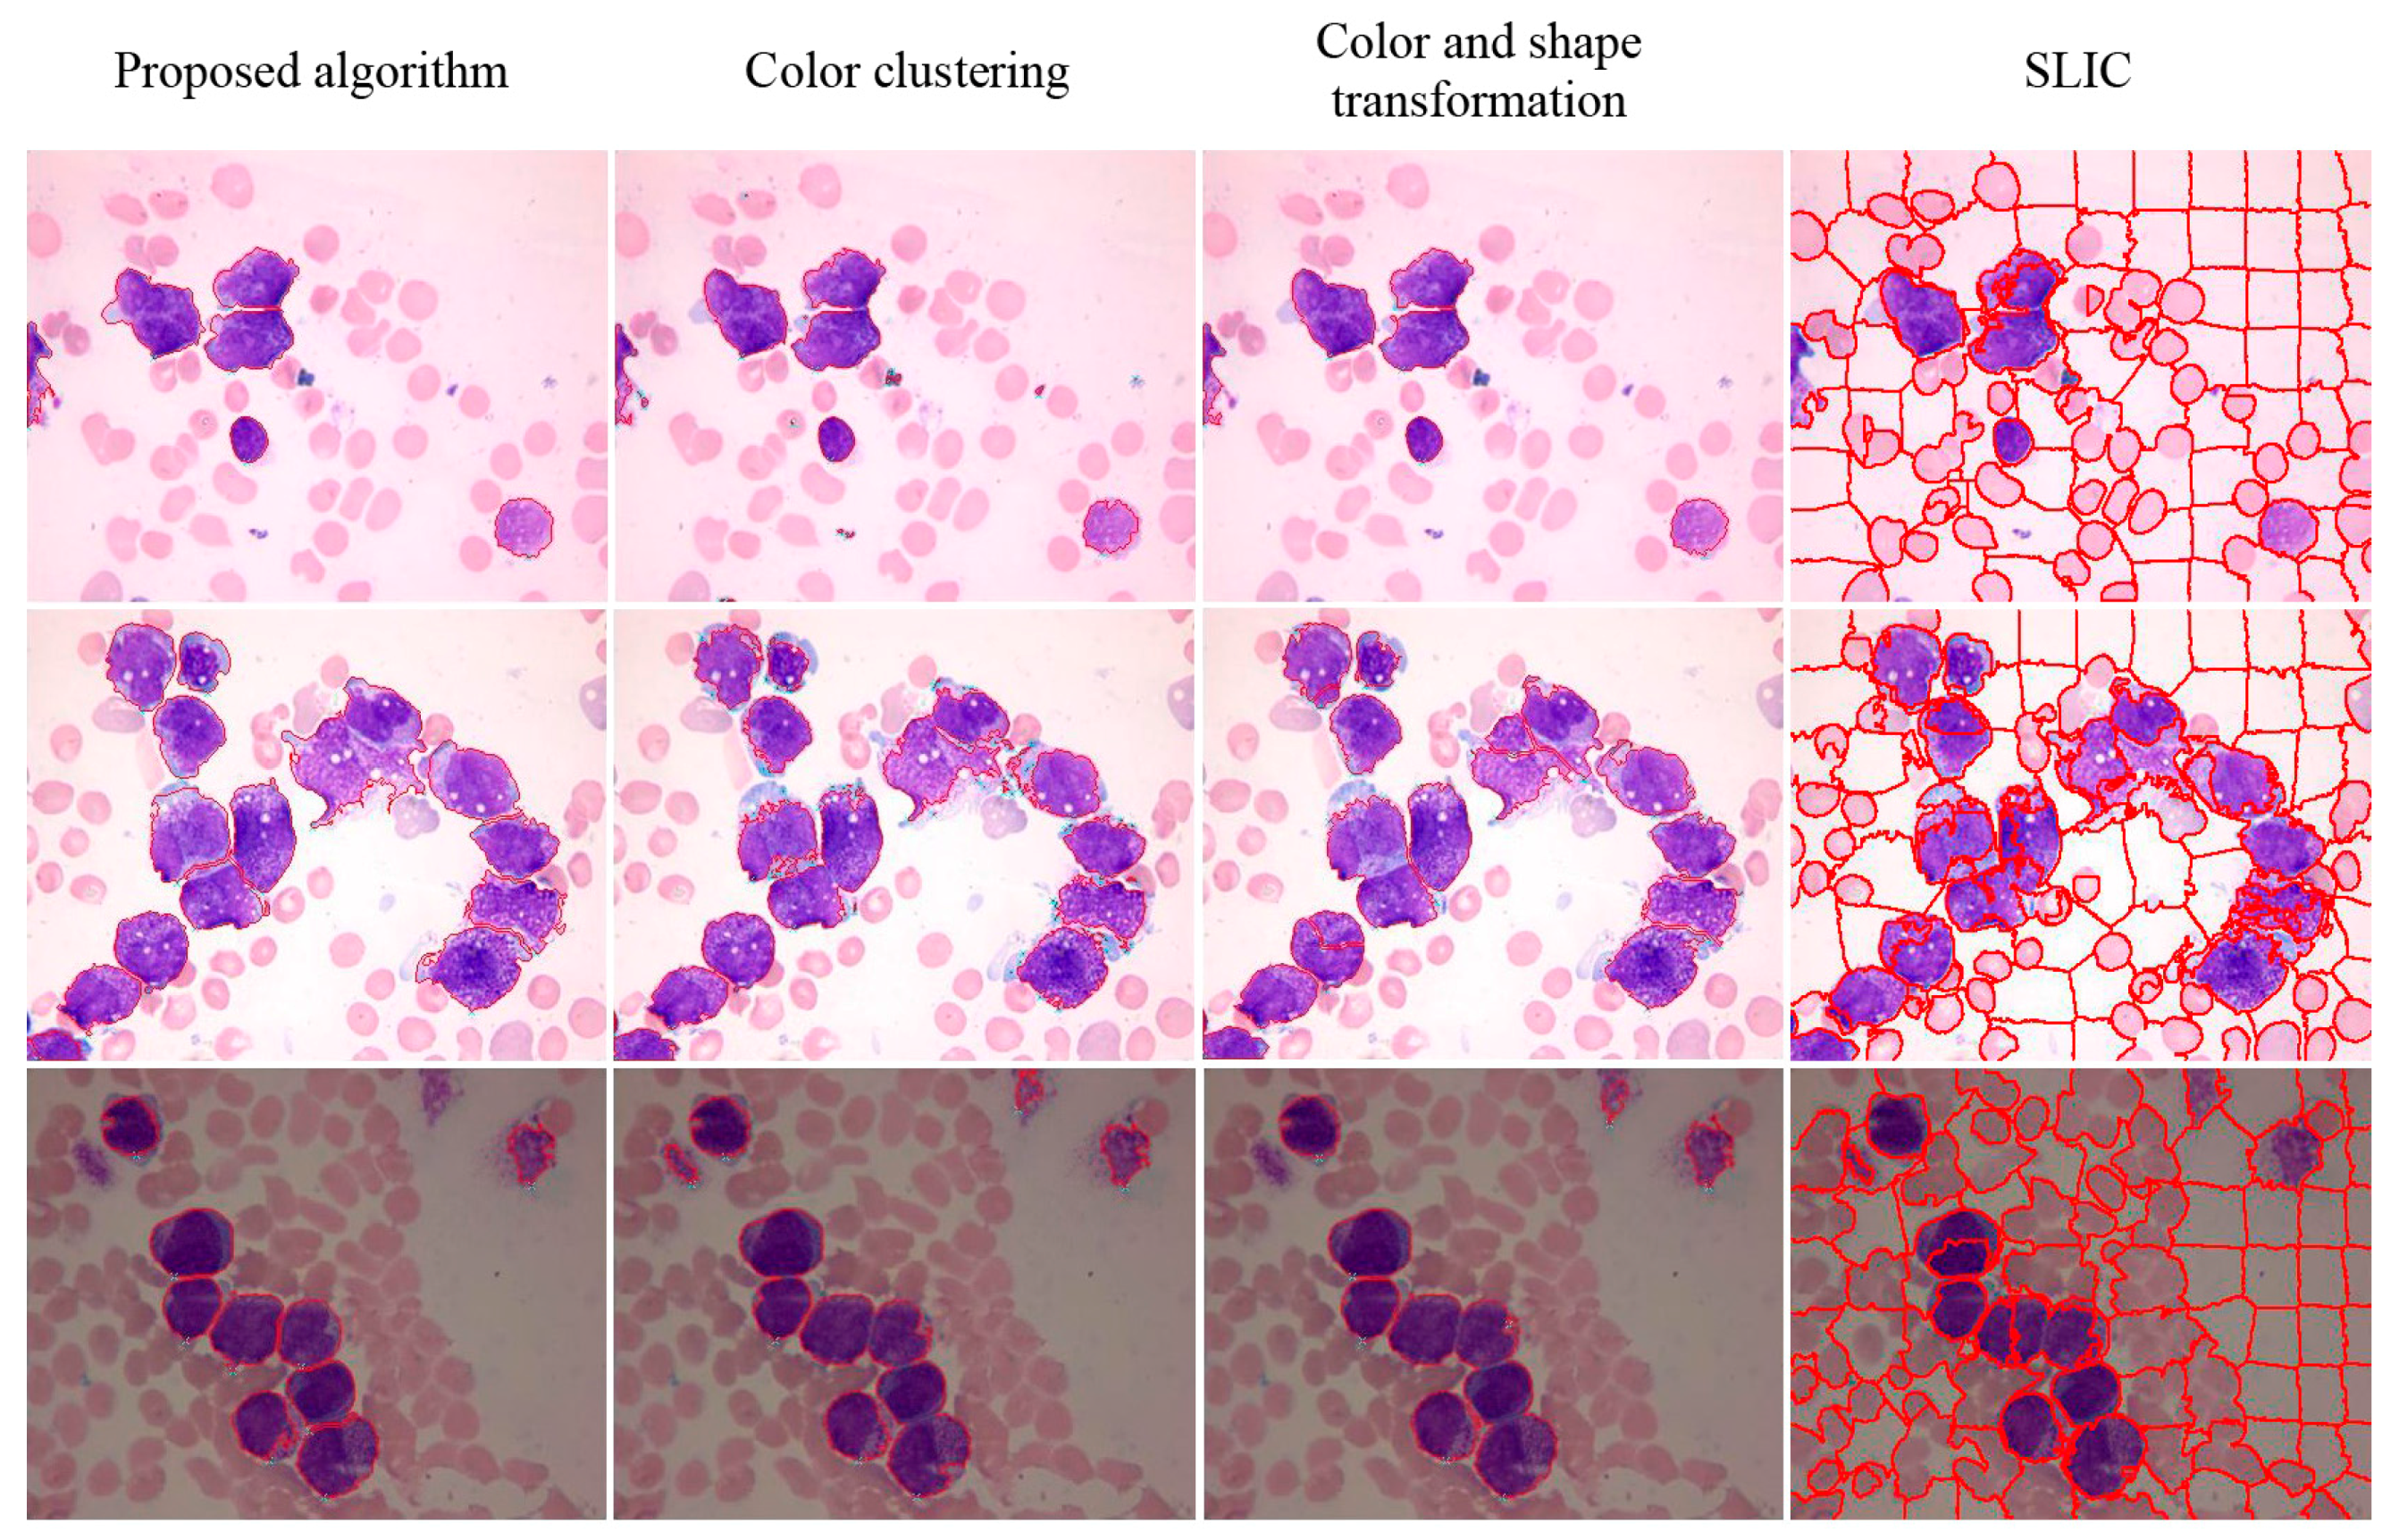
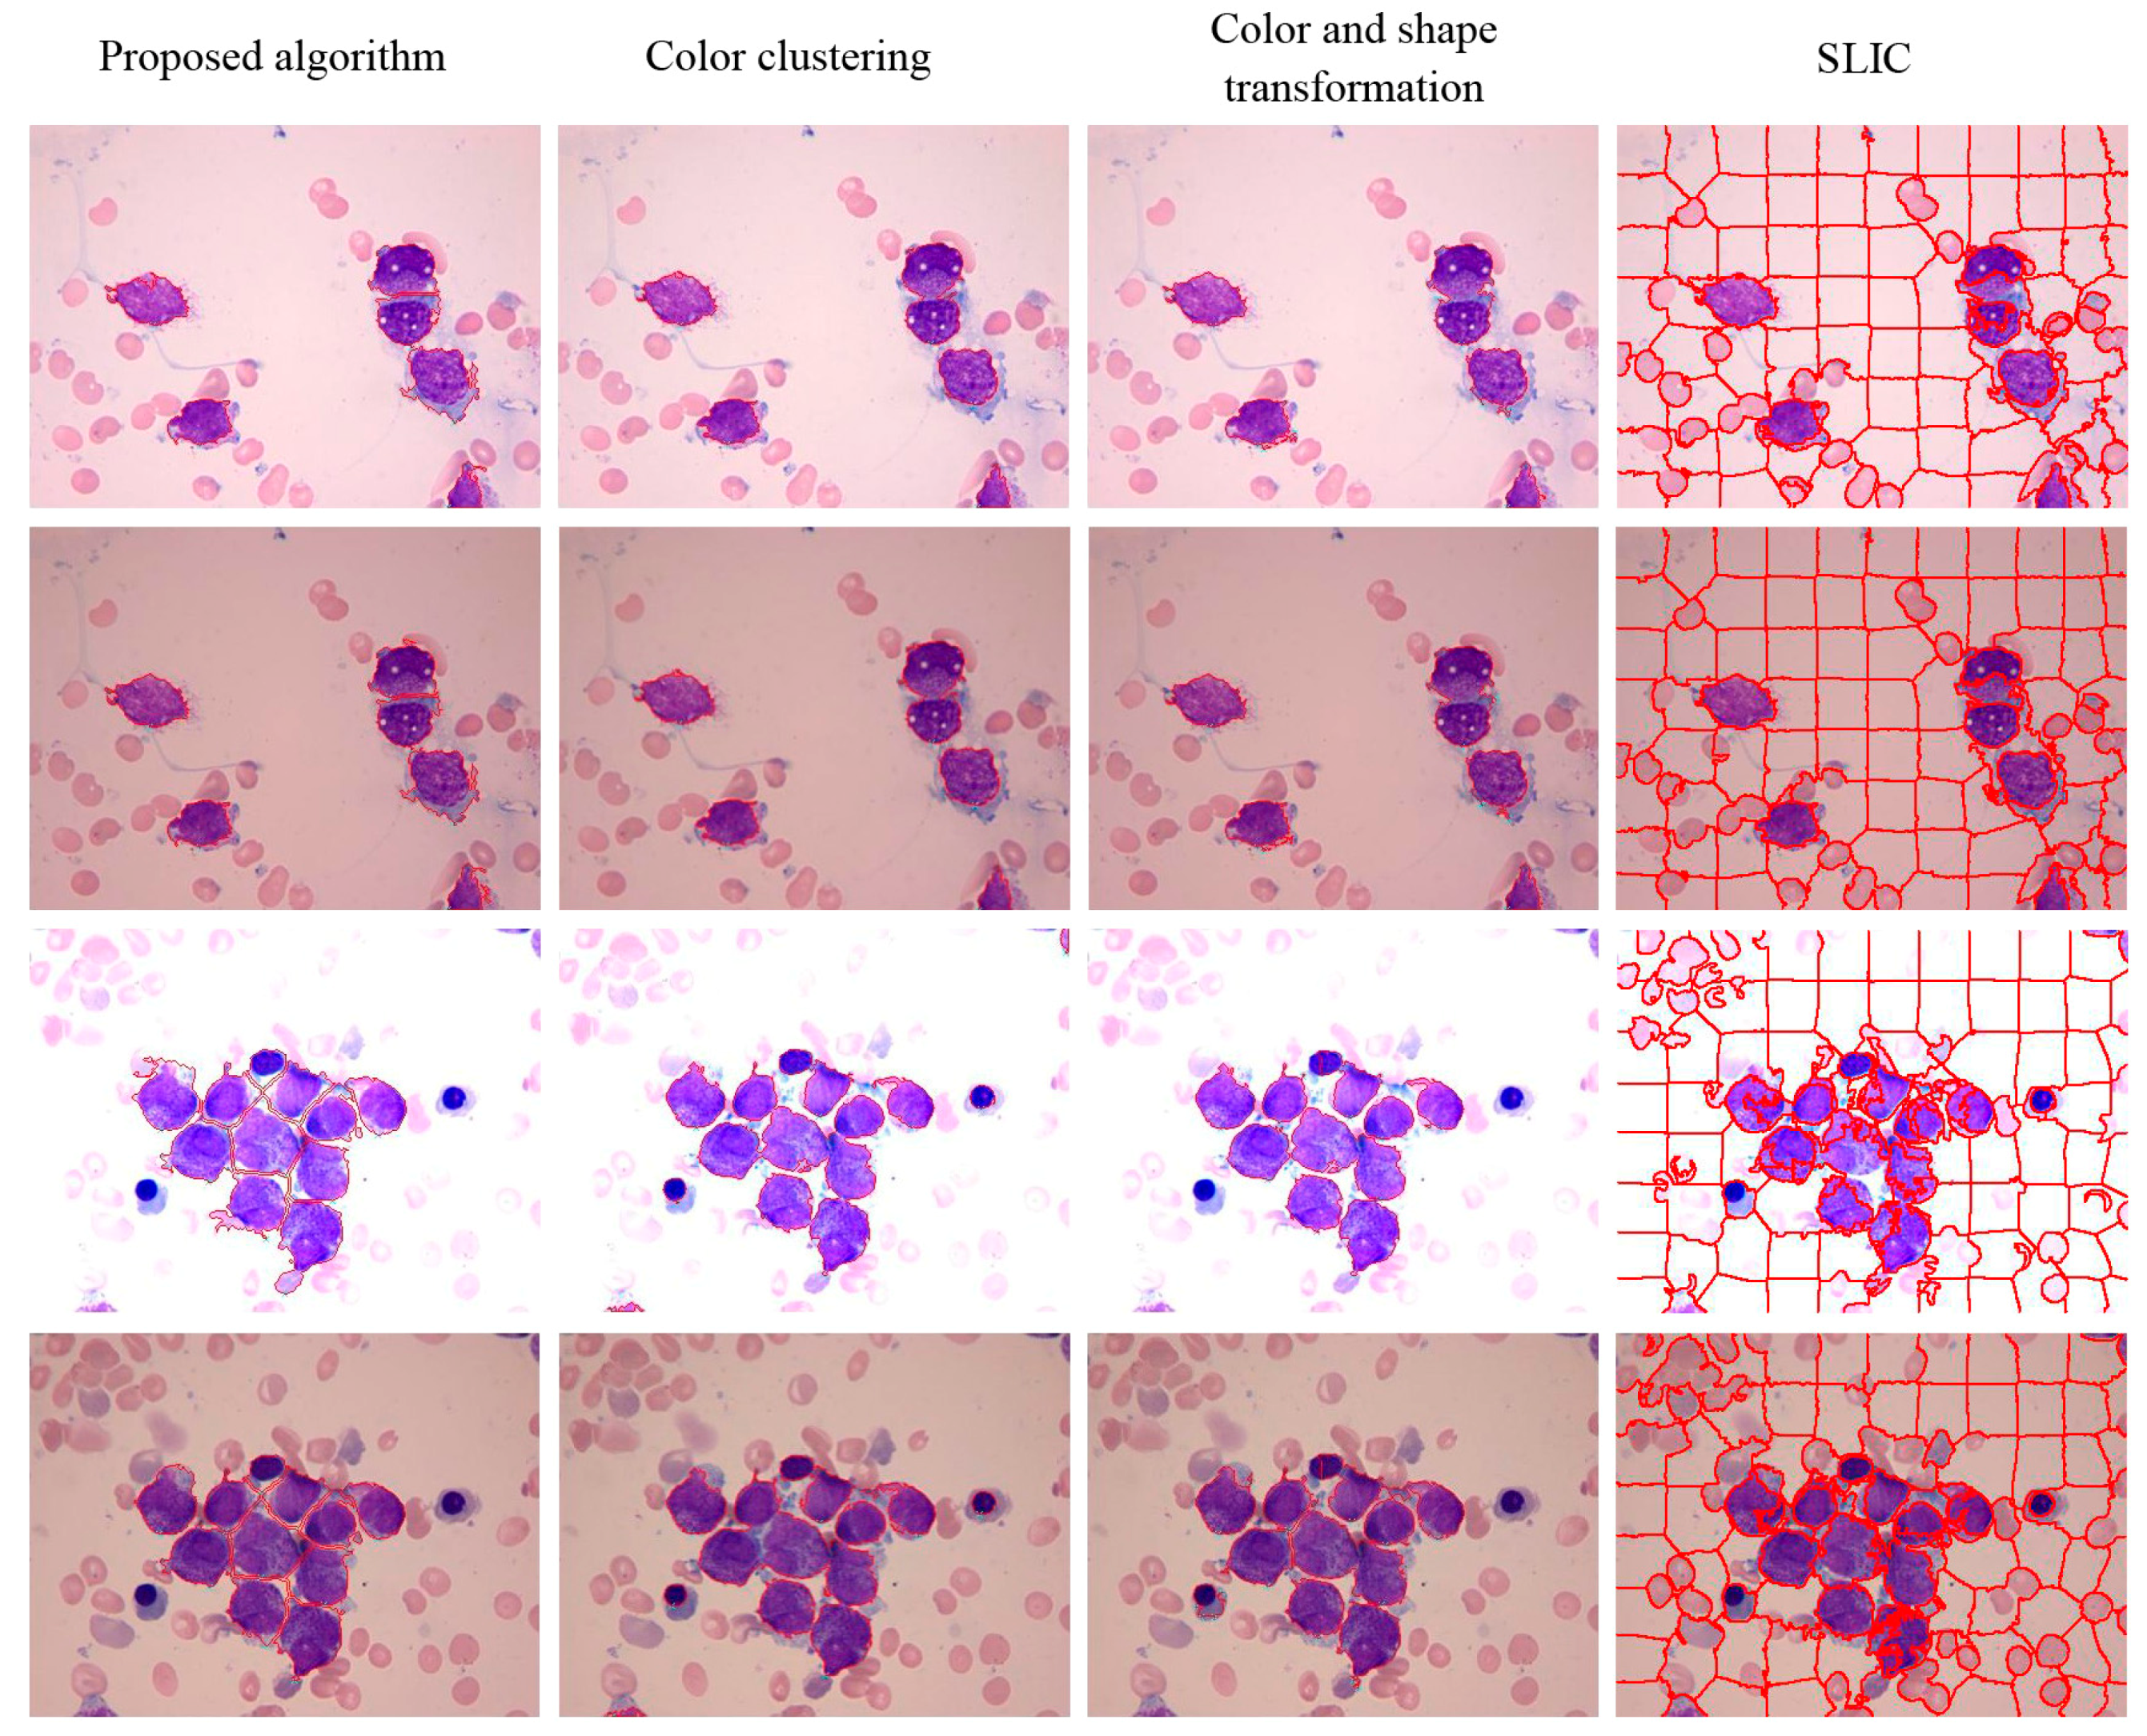
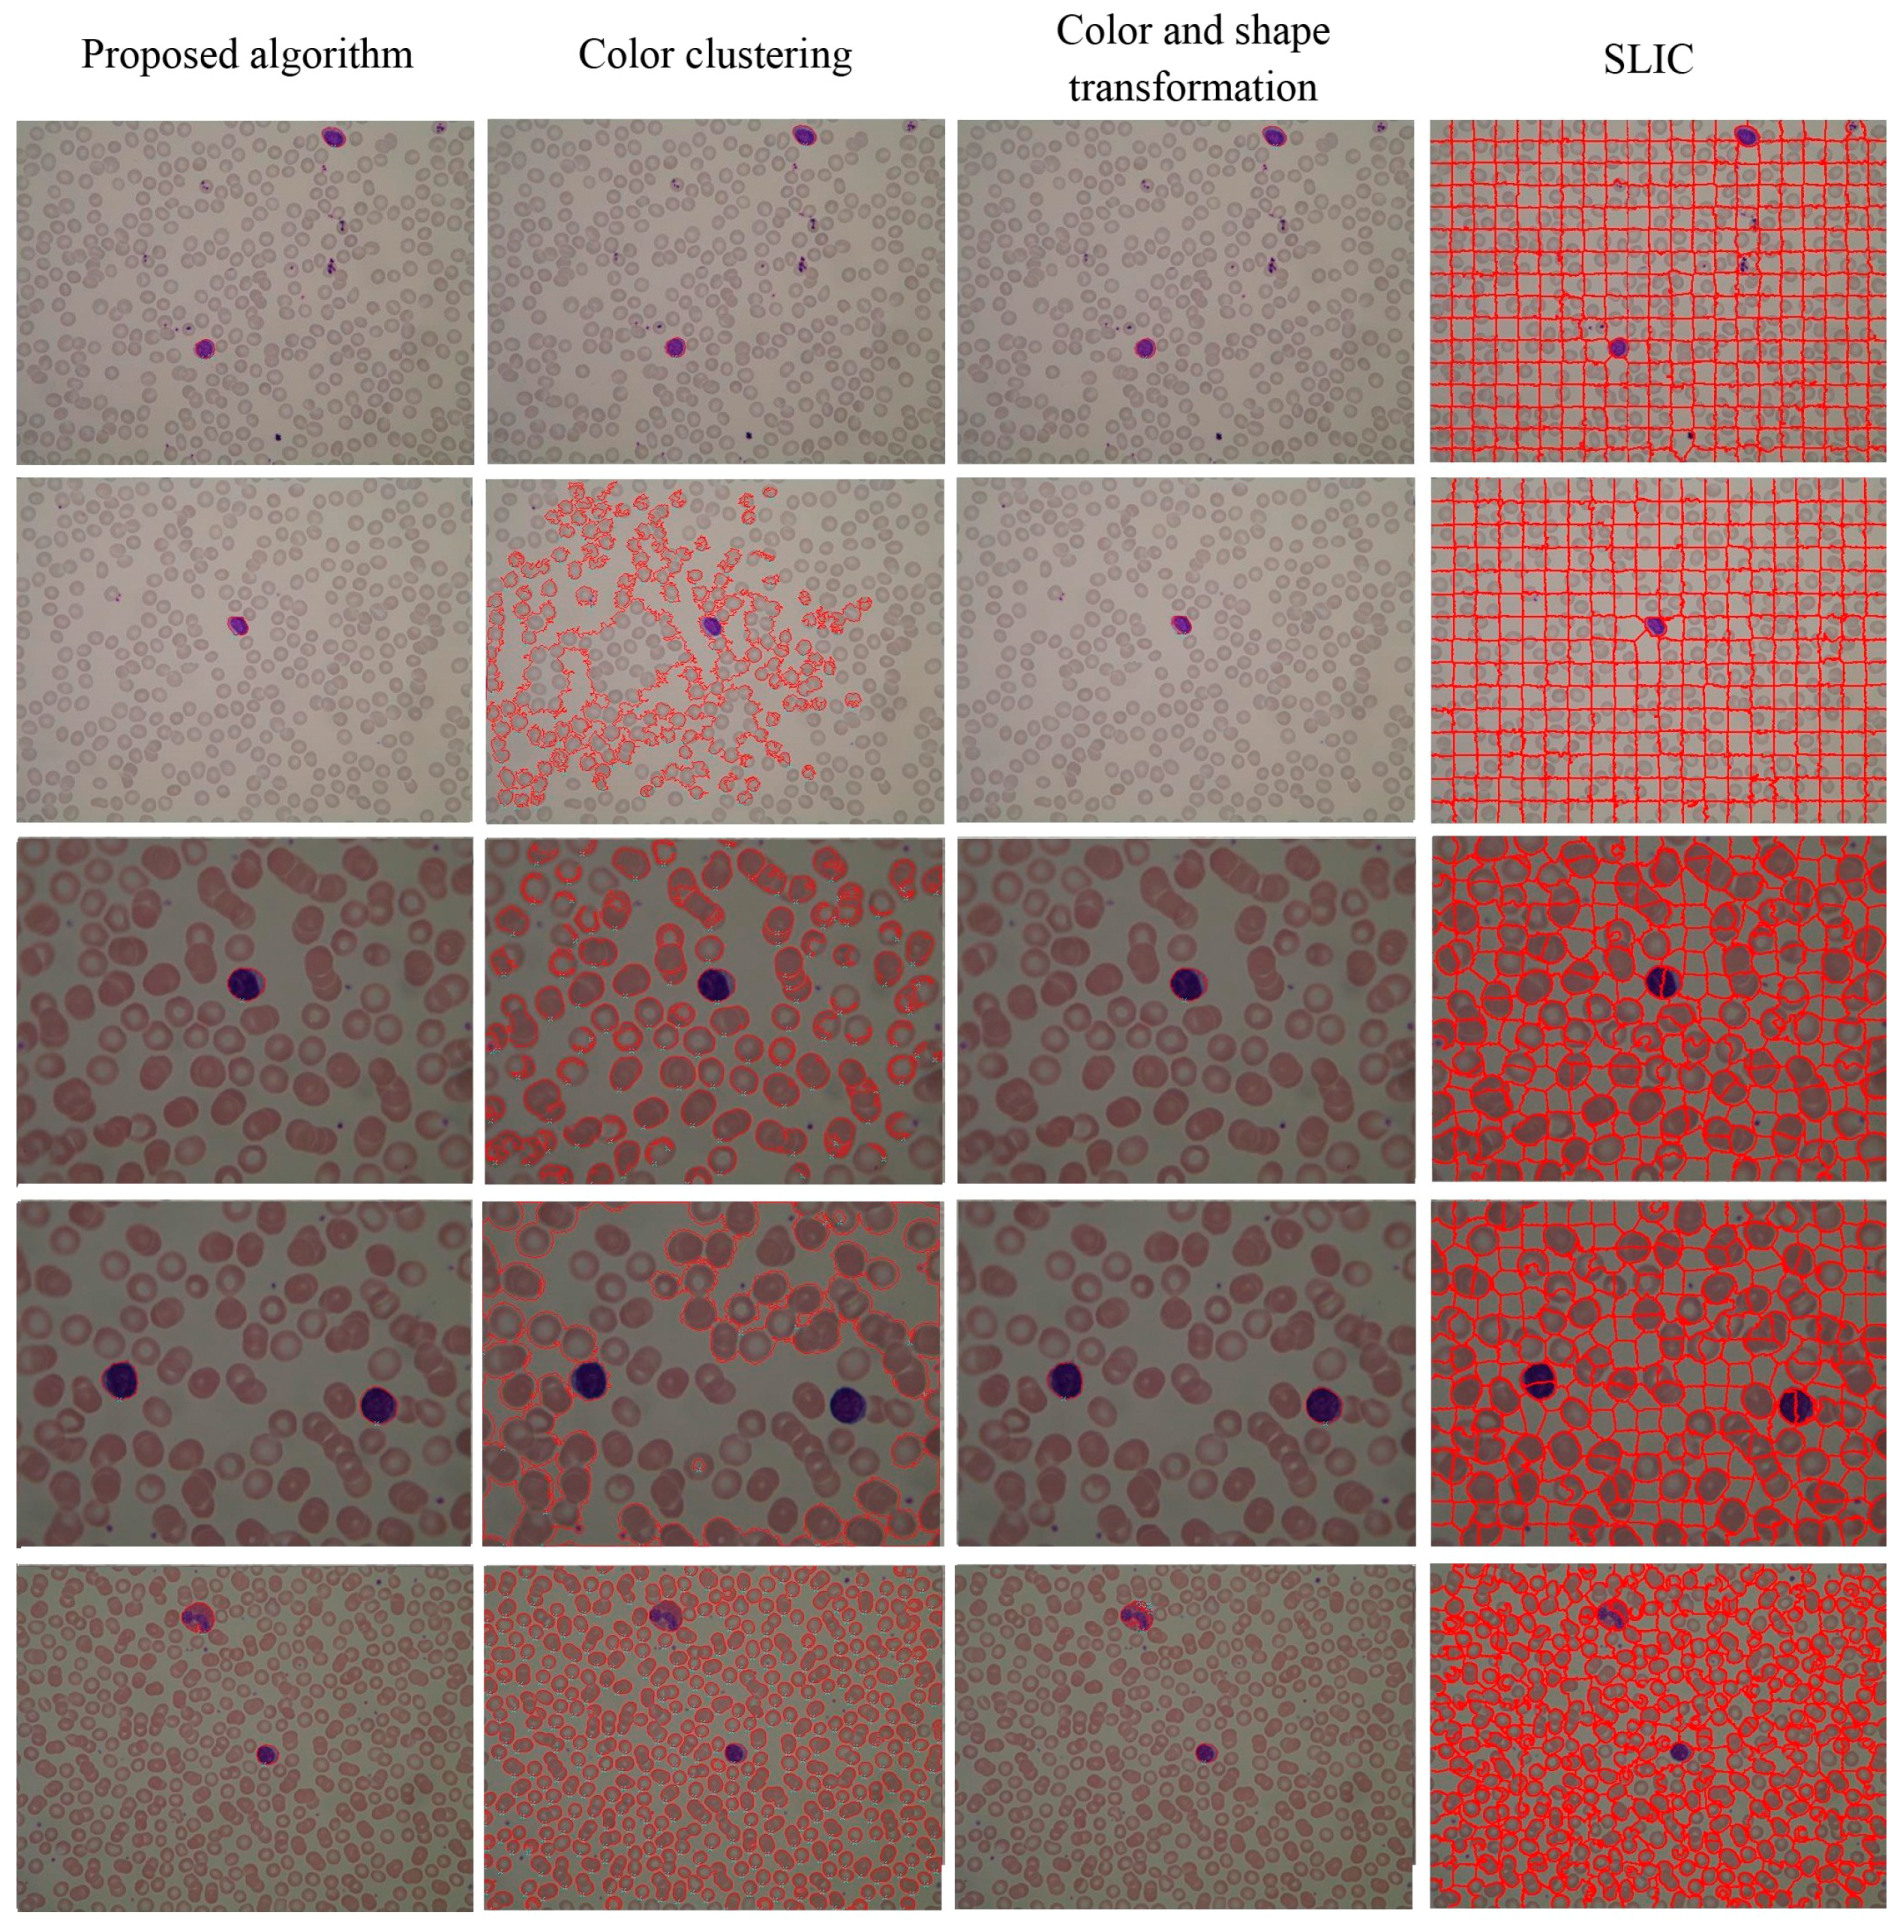
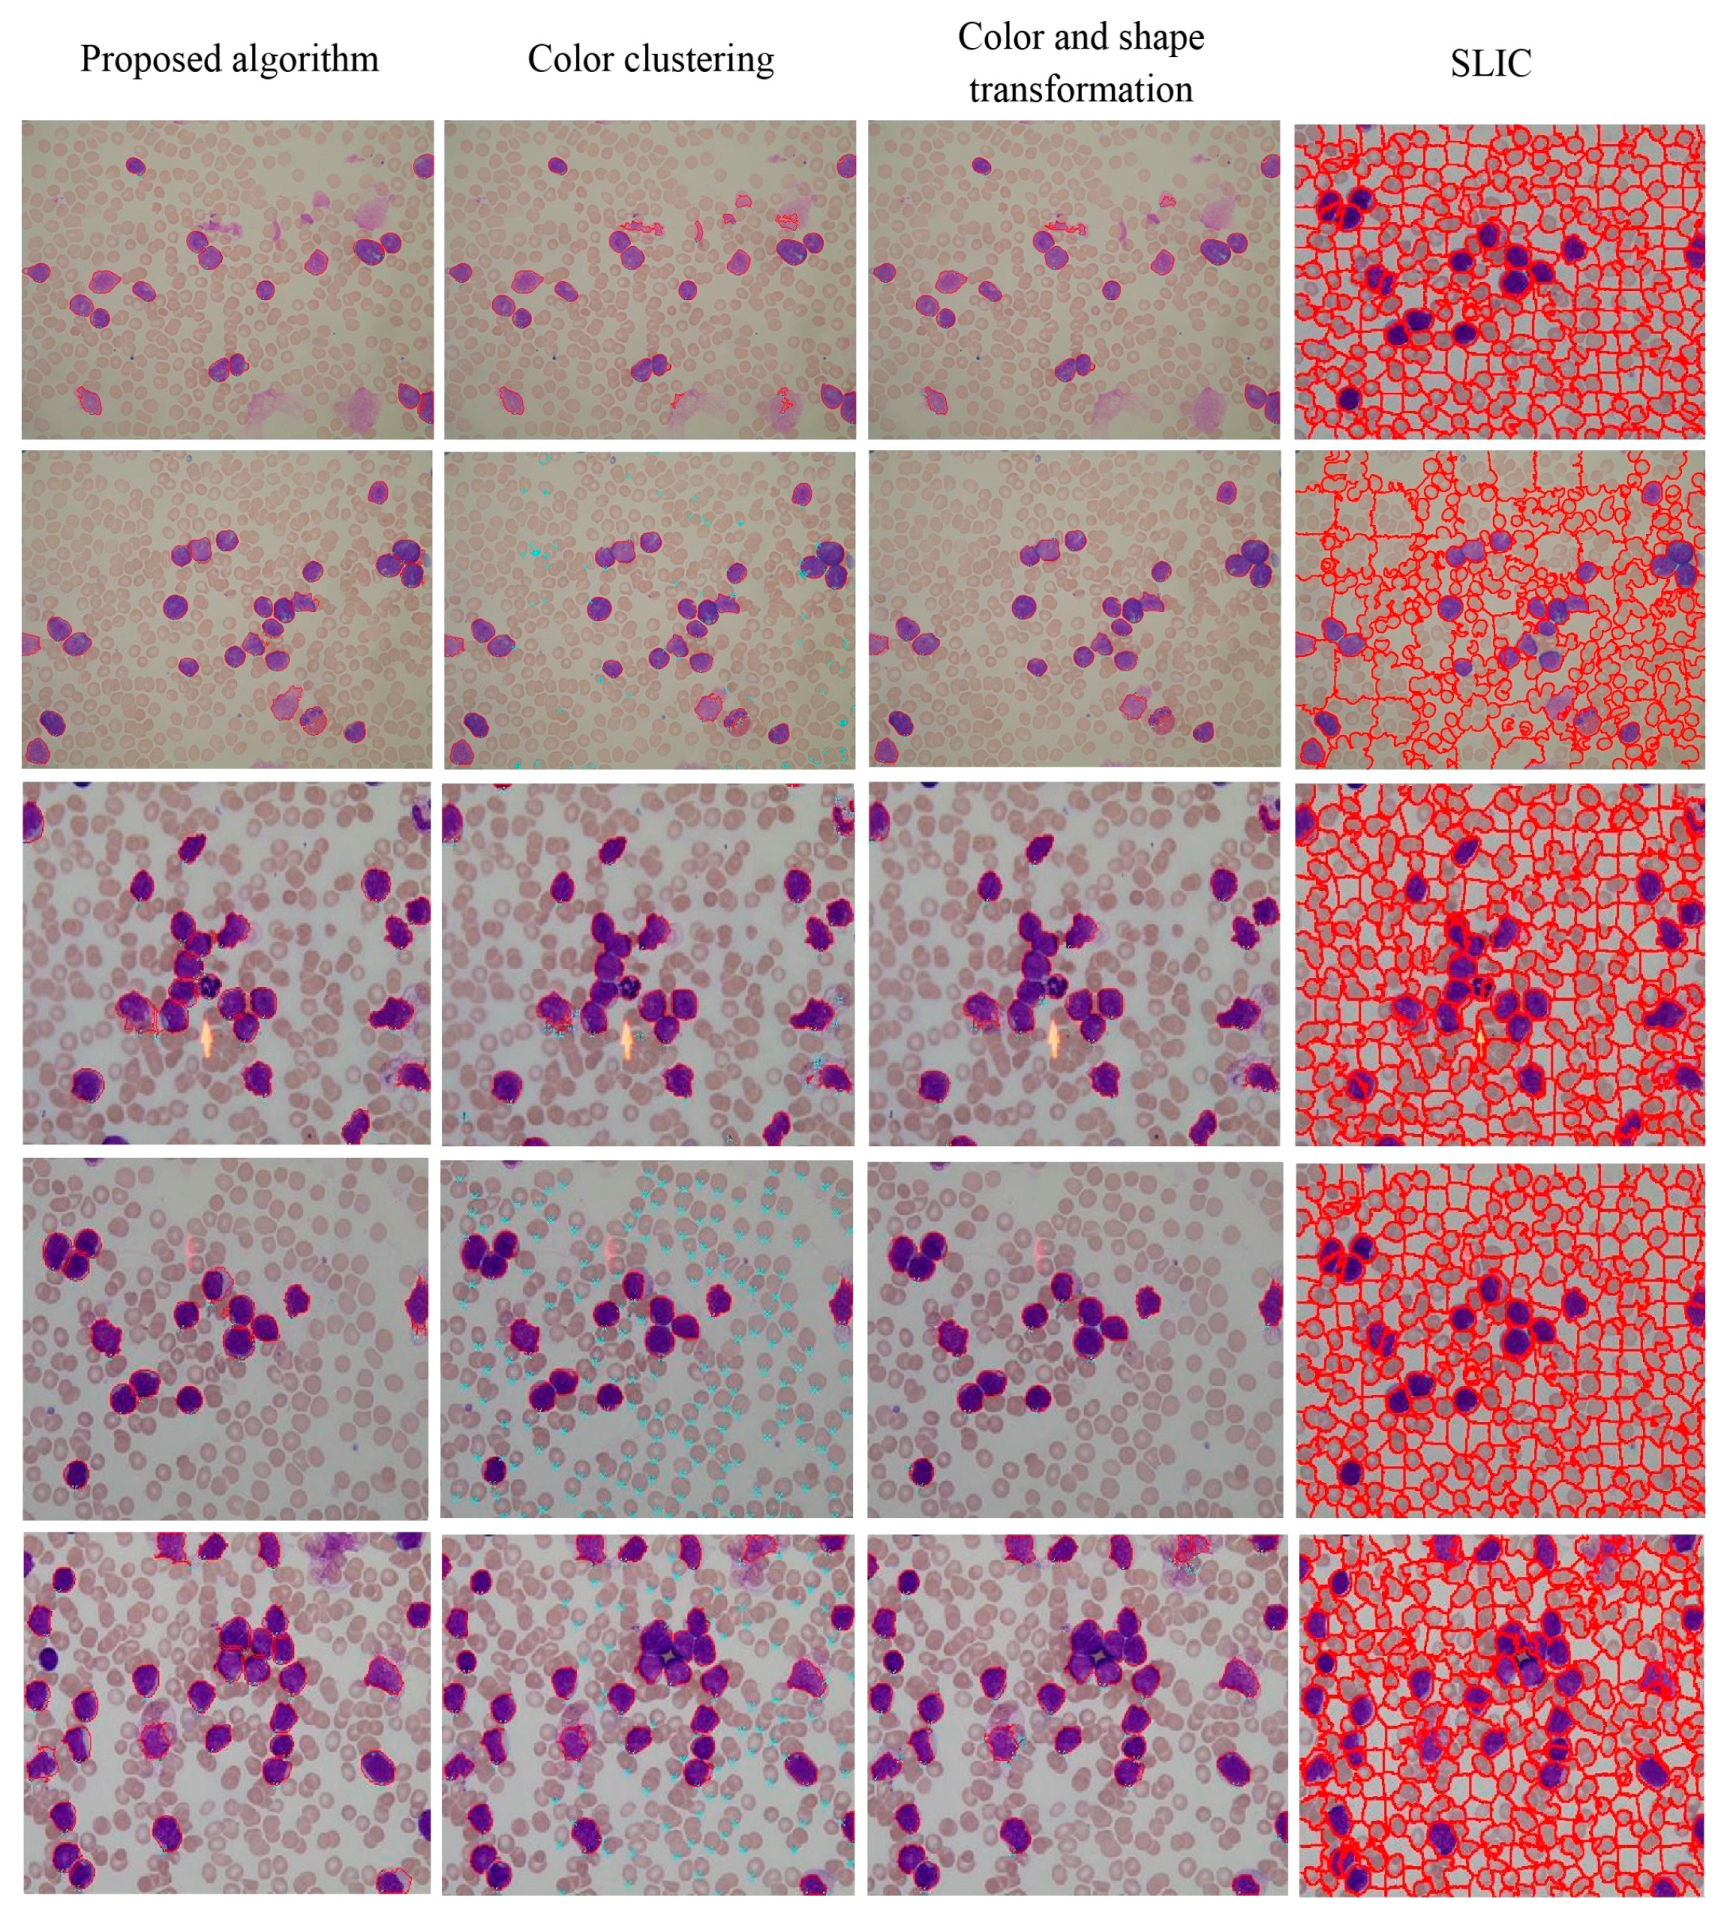
4.3. Segmentation Evaluation
| TP | OVER SEGM | UNDERSEGM | FP | FN | |
|---|---|---|---|---|---|
| Proposed algorithm | 1481 | 19 | 44 | 10 | 69 |
| Color clustering | 1332 | 9 | 511 | >800 | 218 |
| Color and shape transformation | 1407 | 25 | 73 | 35 | 143 |
| SLIC | 1327 | 286 | 57 | >100 | 223 |
| Proposed Algorithm | Color Clustering | Color and Shape Transformation | SLIC | |
|---|---|---|---|---|
| P | 99% | <62.5% | 97.6% | <93% |
| R | 95.5% | 86% | 90.8% | 85.6% |
| F1 | 97% | <72.4% | 94.1% | <89.1% |
| Proposed Algorithm | Color Clustering | Color and Shape Transformation | SLIC | ||
|---|---|---|---|---|---|
| Dataset 1 | Lymphocyte | 43 | 33 | 39 | 38 |
| Monocyte | 49 | 35 | 45 | 40 | |
| Eosinophil | 29 | 22 | 30 | 23 | |
| Basophil | 44 | 33 | 42 | 35 | |
| Neutrophil | 83 | 57 | 61 | 49 | |
| AML WBCs | 472 | 301 | 435 | 368 | |
| Dataset 2 | ALL-IDB1 WBCs | 698 | 331 | 657 | 431 |


5. Conclusions
Acknowledgments
Author Contributions
Conflicts of Interest
References
- Wang, S.T.; Wang, M. A New Detection algorithm (NDA) based on Fuzzy Cellular Neural Networks for White Blood Cell Detection. IEEE Trans. Inf. Technol. Biomed. 2006, 10, 5–10. [Google Scholar]
- Altendorf, E.; Zebert, D.; Holl, M.; Yager, P. Differential blood cell counts obtained using a microchannel based flow cytometer. In Proceedings of the 1997 International Conference on Solid State Sensors and Actuators, Chicago, IL, USA, 16–19 June 1997; pp. 531–534.
- Hirschfeld, T. Blood Cell Analyzer. U.S. Patent No. 3,819,270, 25 June 1974. [Google Scholar]
- Alberts, B.; Johnson, A.; Lewis, J.; Raff, M.; Roberts, K.; Walter, P. Molecular Biology of the Cell, 3rd ed.; W. H. Freeman: New York, NY, USA, 1994. [Google Scholar]
- Putzu, L.; di Ruberto, C. White blood cells identification and counting from microscopic blood images. In Proceedings of the WASET International Conference on Bioinformatics, Computational Biology and Biomedical Engineering, Guangzhou, China, 1 November 2013; pp. 268–275.
- Zhang, C.; Xiao, X.; Li, X. White Blood Cell Segmentation by Color-Space-Based K-Means Clustering. Sensors 2014, 14, 16128–16147. [Google Scholar] [CrossRef] [PubMed]
- Duan, J.; Yu, L. A WBC segmentation method based on HSI color space. In Proceedings of the 4th IEEE International Conference on Broadband Network and Multimedia Technology (IC-BNMT), Shenzhen, China, 28–30 October 2011; pp. 629–632.
- Huang, D.C.; Hung, K.D. Leukocyte nucleus segmentation and recognition in color blood-smear images. In Proceedings of the IEEE International Instrumentation and Measurement Technology Conference (I2MTC), Graz, Austria, 13–16 May 2012; pp. 171–176.
- Lim, H.N.; Mashor, M.Y.; Hassan, R. White blood cell segmentation for acute leukemia bone marrow images. In Proceedings of the 2012 IEEE International Conference on Biomedical Engineering (ICoBE), Penang, Malaysia, 27–28 February 2012; pp. 357–361.
- Roerdink, J.B.; Meijster, A. The watershed transform: Definitions, algorithms and parallelization strategies. Fundam. Inform. 2000, 41, 187–228. [Google Scholar]
- Arslan, S.; Ozyurek, E.; Gunduz-Demir, C. A color and shape based algorithm for segmentation of white blood cells in peripheral blood and bone marrow images. Cytom. A 2014, 85, 480–490. [Google Scholar] [CrossRef] [PubMed]
- Mohamed, M.; Far, B.; Guaily, A. An efficient technique for white blood cells nuclei automatic segmentation. In Proceedings of the 2012 IEEE International Conference on Systems, Man, and Cybernetics (SMC), Seoul, Korea, 14–17 October 2012; pp. 220–225.
- Laosai, J.; Chamnongthai, K. Acute leukemia classification by using SVM and K-Means clustering. In Proceedings of the 2014 IEEE International Electrical Engineering Congress (IEECON), Chonburi, Thailand, 19–21 March 2014; pp. 1–4.
- Salem, N.M. Segmentation of white blood cells from microscopic images using K-means clustering. In Proceedings of the 31st IEEE National Radio Science Conference (NRSC), Cairo, Egypt, 28–30 April 2014; pp. 371–376.
- Gautam, A.; Bhadauria, H.S. White blood nucleus extraction using K-Mean clustering and mathematical morphing. In Proceedings of the 5th IEEE International Conference on The Next Generation Information Technology Summit, Noida, India, 25–26 September 2014; pp. 549–554.
- Rezatofighi, S.H.; Soltanian-Zadeh, H. Automatic recognition of five types of white blood cells in peripheral blood. Comput. Med. Imaging Graph. 2011, 35, 333–343. [Google Scholar] [CrossRef] [PubMed]
- Ko, B.C.; Gim, J.W.; Nam, J.Y. Automatic white blood cell segmentation using stepwise merging rules and gradient vector flow snake. Micron 2011, 42, 695–705. [Google Scholar] [CrossRef] [PubMed]
- Zimmer, C.; Labruyere, E.; Meas-Yedid, V.; Guillen, N.; Olivo-Marin, J.C. Segmentation and tracking of migrating cells in videomicroscopy with parametric active contours: A tool for cell-based drug testing. IEEE Trans. Med. Imaging 2002, 21, 1212–1221. [Google Scholar] [CrossRef] [PubMed]
- Zhang, B.; Zimmer, C.; Olivo-Marin, J.C. Tracking fluorescent cells with coupled geometric active contours. In Proceedings of the 2004 IEEE International Symposium on Biomedical Imaging: Nano to Macro, Arlington, VA, USA, 15–18 April 2004; pp. 476–479.
- Xiong, G.; Zhou, X.; Ji, L. Automated segmentation of Drosophila RNAi fluorescence cellular images using deformable models. IEEE Trans. Circuits Syst. 2006, 53, 2415–2424. [Google Scholar] [CrossRef]
- Gonzalez, R.C.; Woods, R.E.; Eddins, S.L. Digital Image Processing Using MATLAB; Pearson Education: Indianapolis, IN, USA, 2004. [Google Scholar]
- Osowski, S.; Markiewicz, T.; Marianska, B.; Moszczynski, L. Feature generation for the cell image recognition of myelogenous leukemia. In Proceedings of the 12th IEEE Conference on Signal Processing, Vienna, Austria, 6–10 September 2004; pp. 753–756.
- Ping, Z.J.H. A Survey for the Arithmetic of Overlapped Cell Segmentation. Comput. Digit. Eng. 2008, 6, 53–56. [Google Scholar]
- Funt, B.V.; Finlayson, G.D. Color constant color indexing. IEEE Trans. Pattern Anal. Mach. Intell. 1995, 17, 522–529. [Google Scholar] [CrossRef]
- Funaga, K.; Hostetler, L. The estimation of the gradient of a density function, with applications in pattern recognition. IEEE Trans. Inf. Theory 1975, 21, 32–40. [Google Scholar] [CrossRef]
- Wand, M.P.; Jones, M.C. Kernel Smoothing; CRC Press: Boca Raton, FL, USA, 1994. [Google Scholar]
- Cheng, Y. Mean shift, mode seeking, and clustering. IEEE Trans. Pattern Anal. Mach. Intell. 1995, 17, 790–799. [Google Scholar] [CrossRef]
- Comaniciu, D.; Meer, P. Mean shift: A robust approach toward feature space analysis. IEEE Trans. Pattern Anal. Mach. Intell. 2002, 24, 603–619. [Google Scholar] [CrossRef]
- Beuher, S. Watersheds of functions and picture segmentation. In Proceedings of the International Conference on Acoustics, Speech, and Signal Processing (ICASSP), Paris, France, 3–5 May 1982; pp. 1928–1931.
- Vincent, L.; Pierre, S. Watersheds in digital spaces: An efficient algorithm based on immersion simulations. IEEE Trans. Pattern Anal. Mach. Intell. 1991, 13, 583–598. [Google Scholar] [CrossRef]
- Achanta, R.; Shaji, A.; Smith, K.; Lucchi, A.; Fua, P.; Susstrunk, S. SLIC superpixels compared to state-of-the-art superpixel methods. IEEE Trans. Pattern Anal. Mach. Intell. 2012, 34, 2274–2282. [Google Scholar] [CrossRef] [PubMed]
- ALL-IDB Website. Available online: http://www.dti.unimi.it/fscotti/all (accessed on 23 July 2015).
- Chan, T.F.; Vese, L.A. Active contours without edges. IEEE Trans. Image Process. 2001, 10, 266–277. [Google Scholar] [CrossRef] [PubMed]
- Jiawei, H.; Kamber, M. Data Mining Concepts and Techniques, 3rd ed.; Machine Press: Beijing, China, 2012. [Google Scholar]
© 2015 by the authors; licensee MDPI, Basel, Switzerland. This article is an open access article distributed under the terms and conditions of the Creative Commons Attribution license (http://creativecommons.org/licenses/by/4.0/).
Share and Cite
Liu, Z.; Liu, J.; Xiao, X.; Yuan, H.; Li, X.; Chang, J.; Zheng, C. Segmentation of White Blood Cells through Nucleus Mark Watershed Operations and Mean Shift Clustering. Sensors 2015, 15, 22561-22586. https://doi.org/10.3390/s150922561
Liu Z, Liu J, Xiao X, Yuan H, Li X, Chang J, Zheng C. Segmentation of White Blood Cells through Nucleus Mark Watershed Operations and Mean Shift Clustering. Sensors. 2015; 15(9):22561-22586. https://doi.org/10.3390/s150922561
Chicago/Turabian StyleLiu, Zhi, Jing Liu, Xiaoyan Xiao, Hui Yuan, Xiaomei Li, Jun Chang, and Chengyun Zheng. 2015. "Segmentation of White Blood Cells through Nucleus Mark Watershed Operations and Mean Shift Clustering" Sensors 15, no. 9: 22561-22586. https://doi.org/10.3390/s150922561