
Gas-Sensing Performance of M-Doped CuO-Based Thin Films Working at Different Temperatures upon Exposure to Propane

Abstract
:1. Introduction
2. Experimental Section
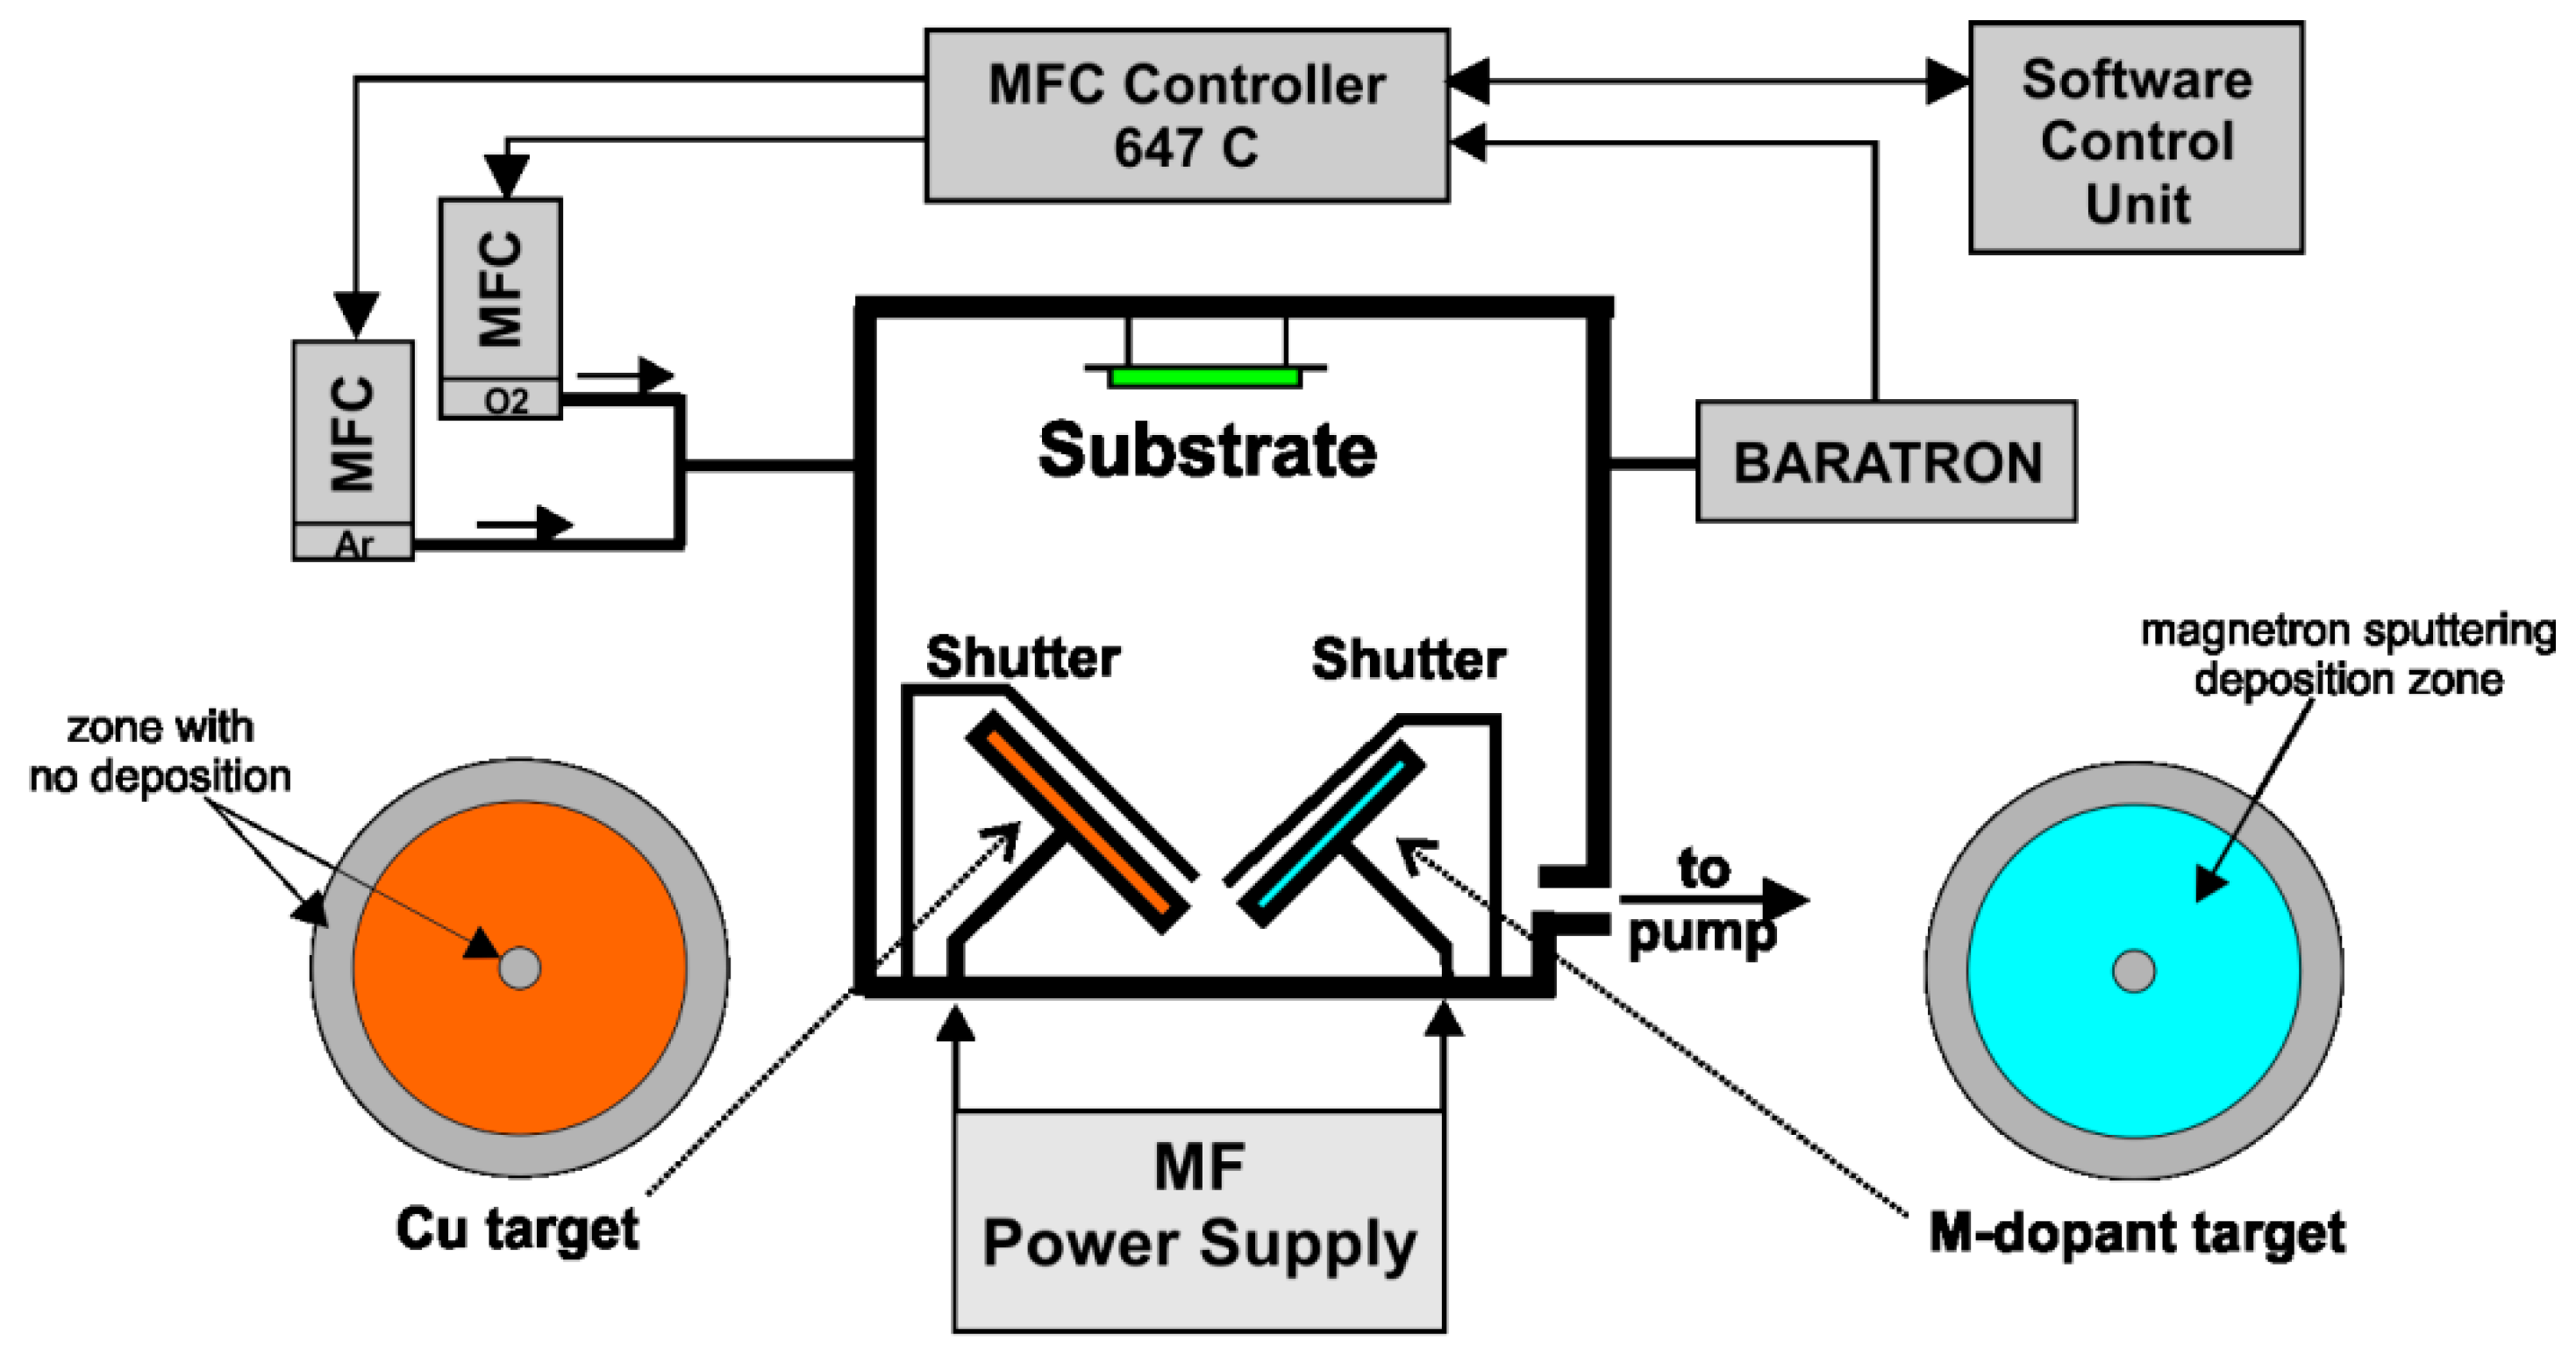
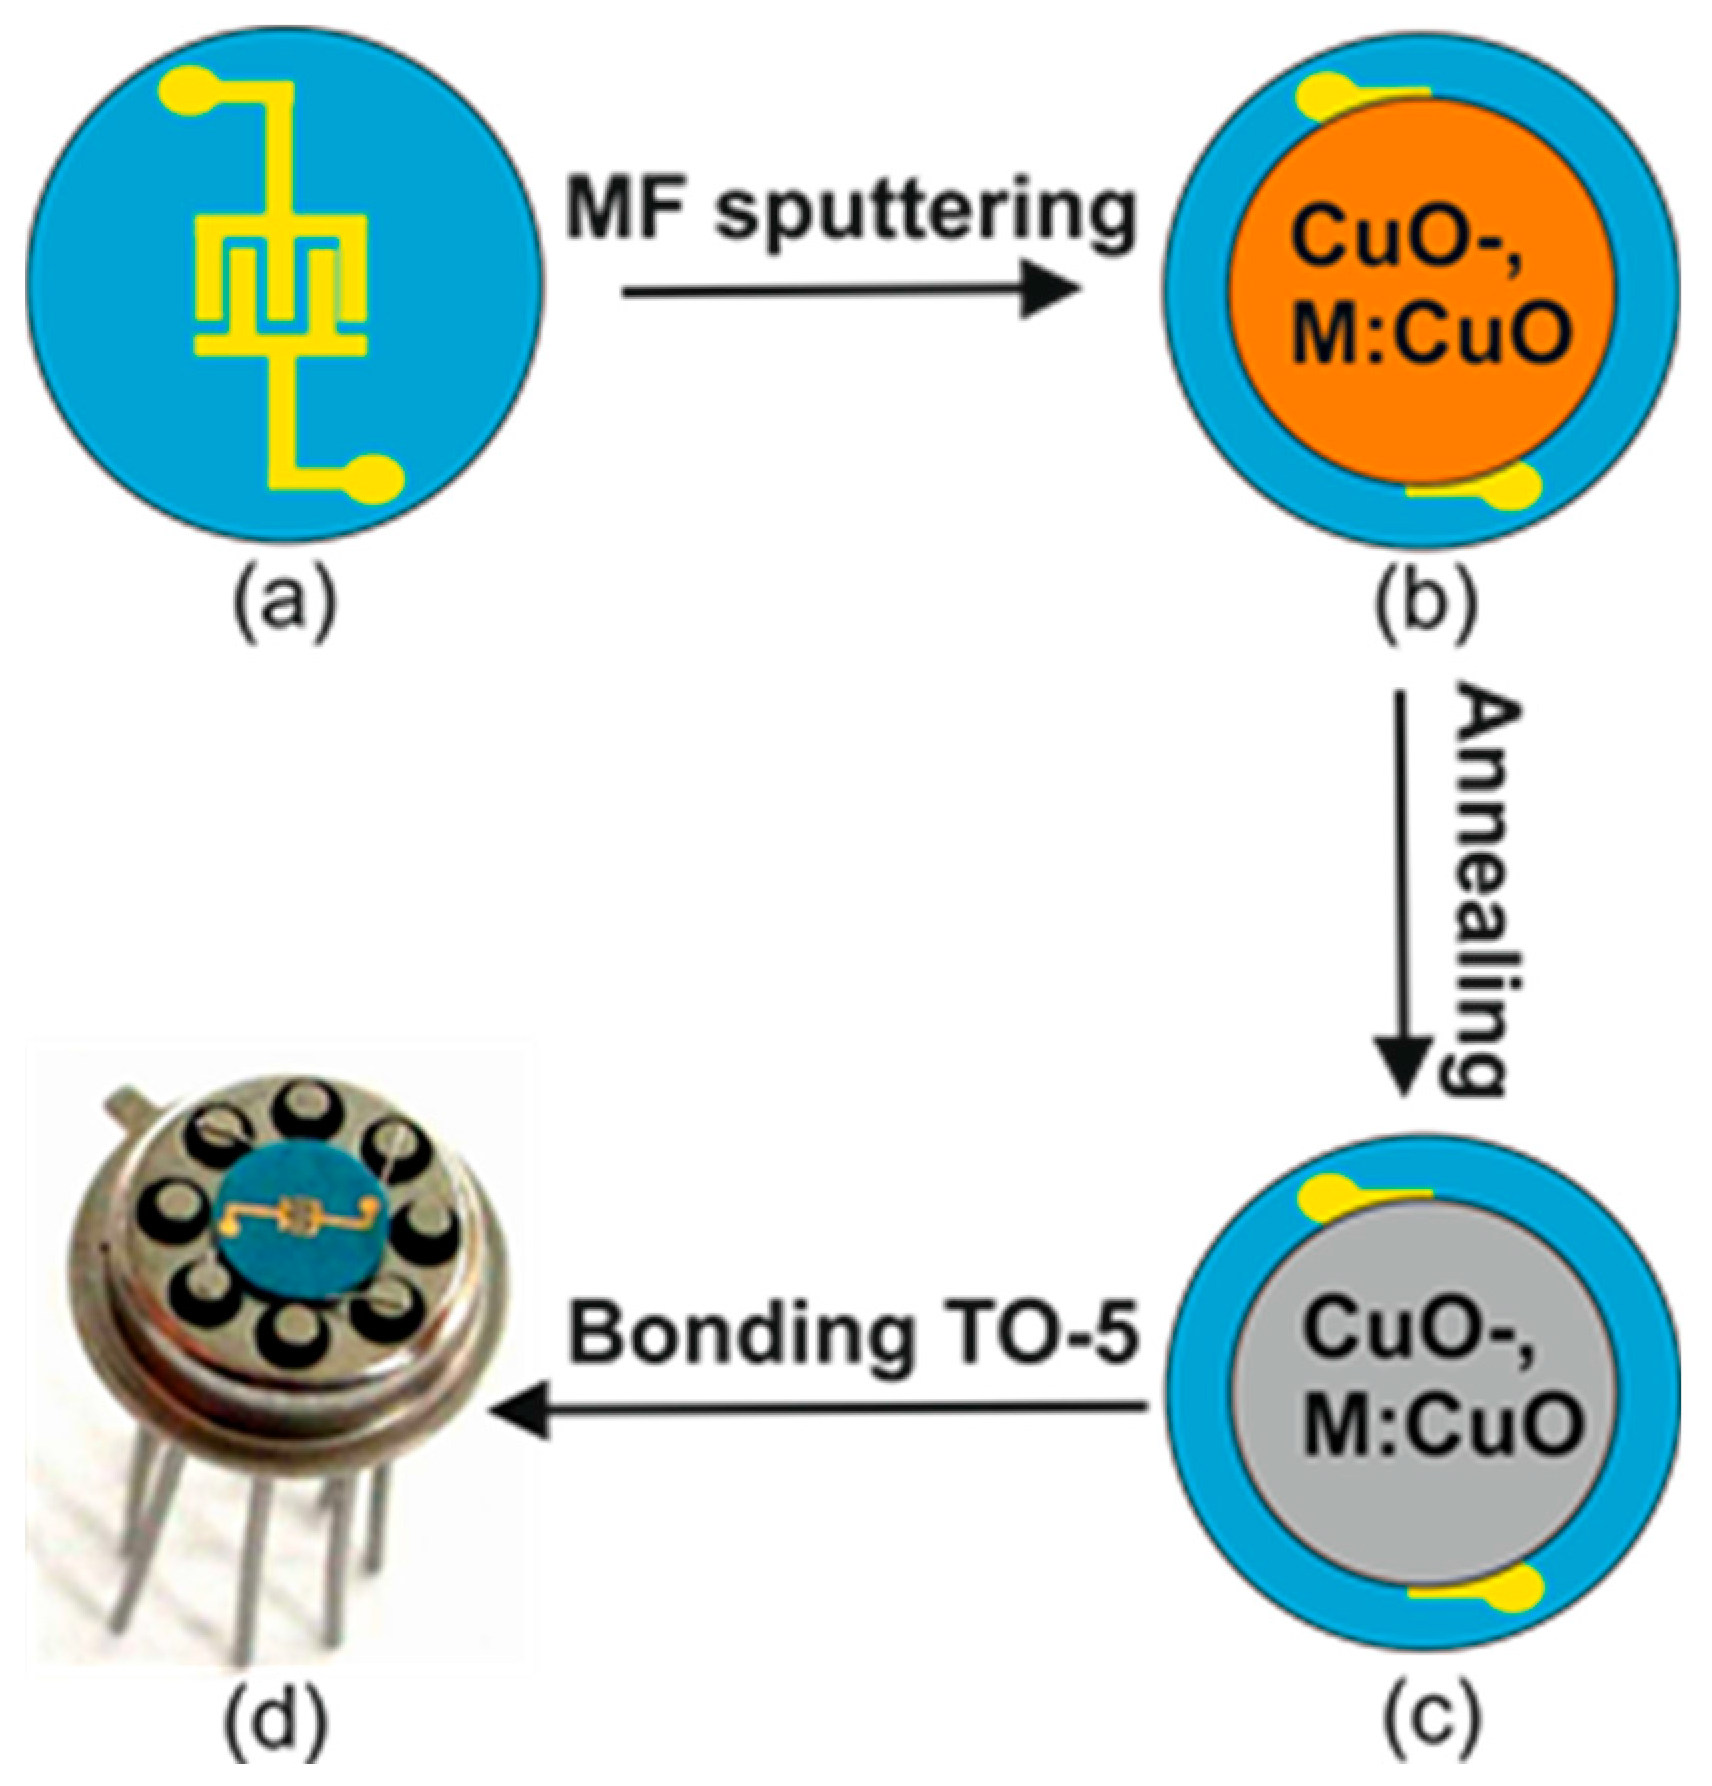
2.1. Preparation of Films

2.2. Film Characterization
2.3. Gas Sensing
3. Results and Discussion
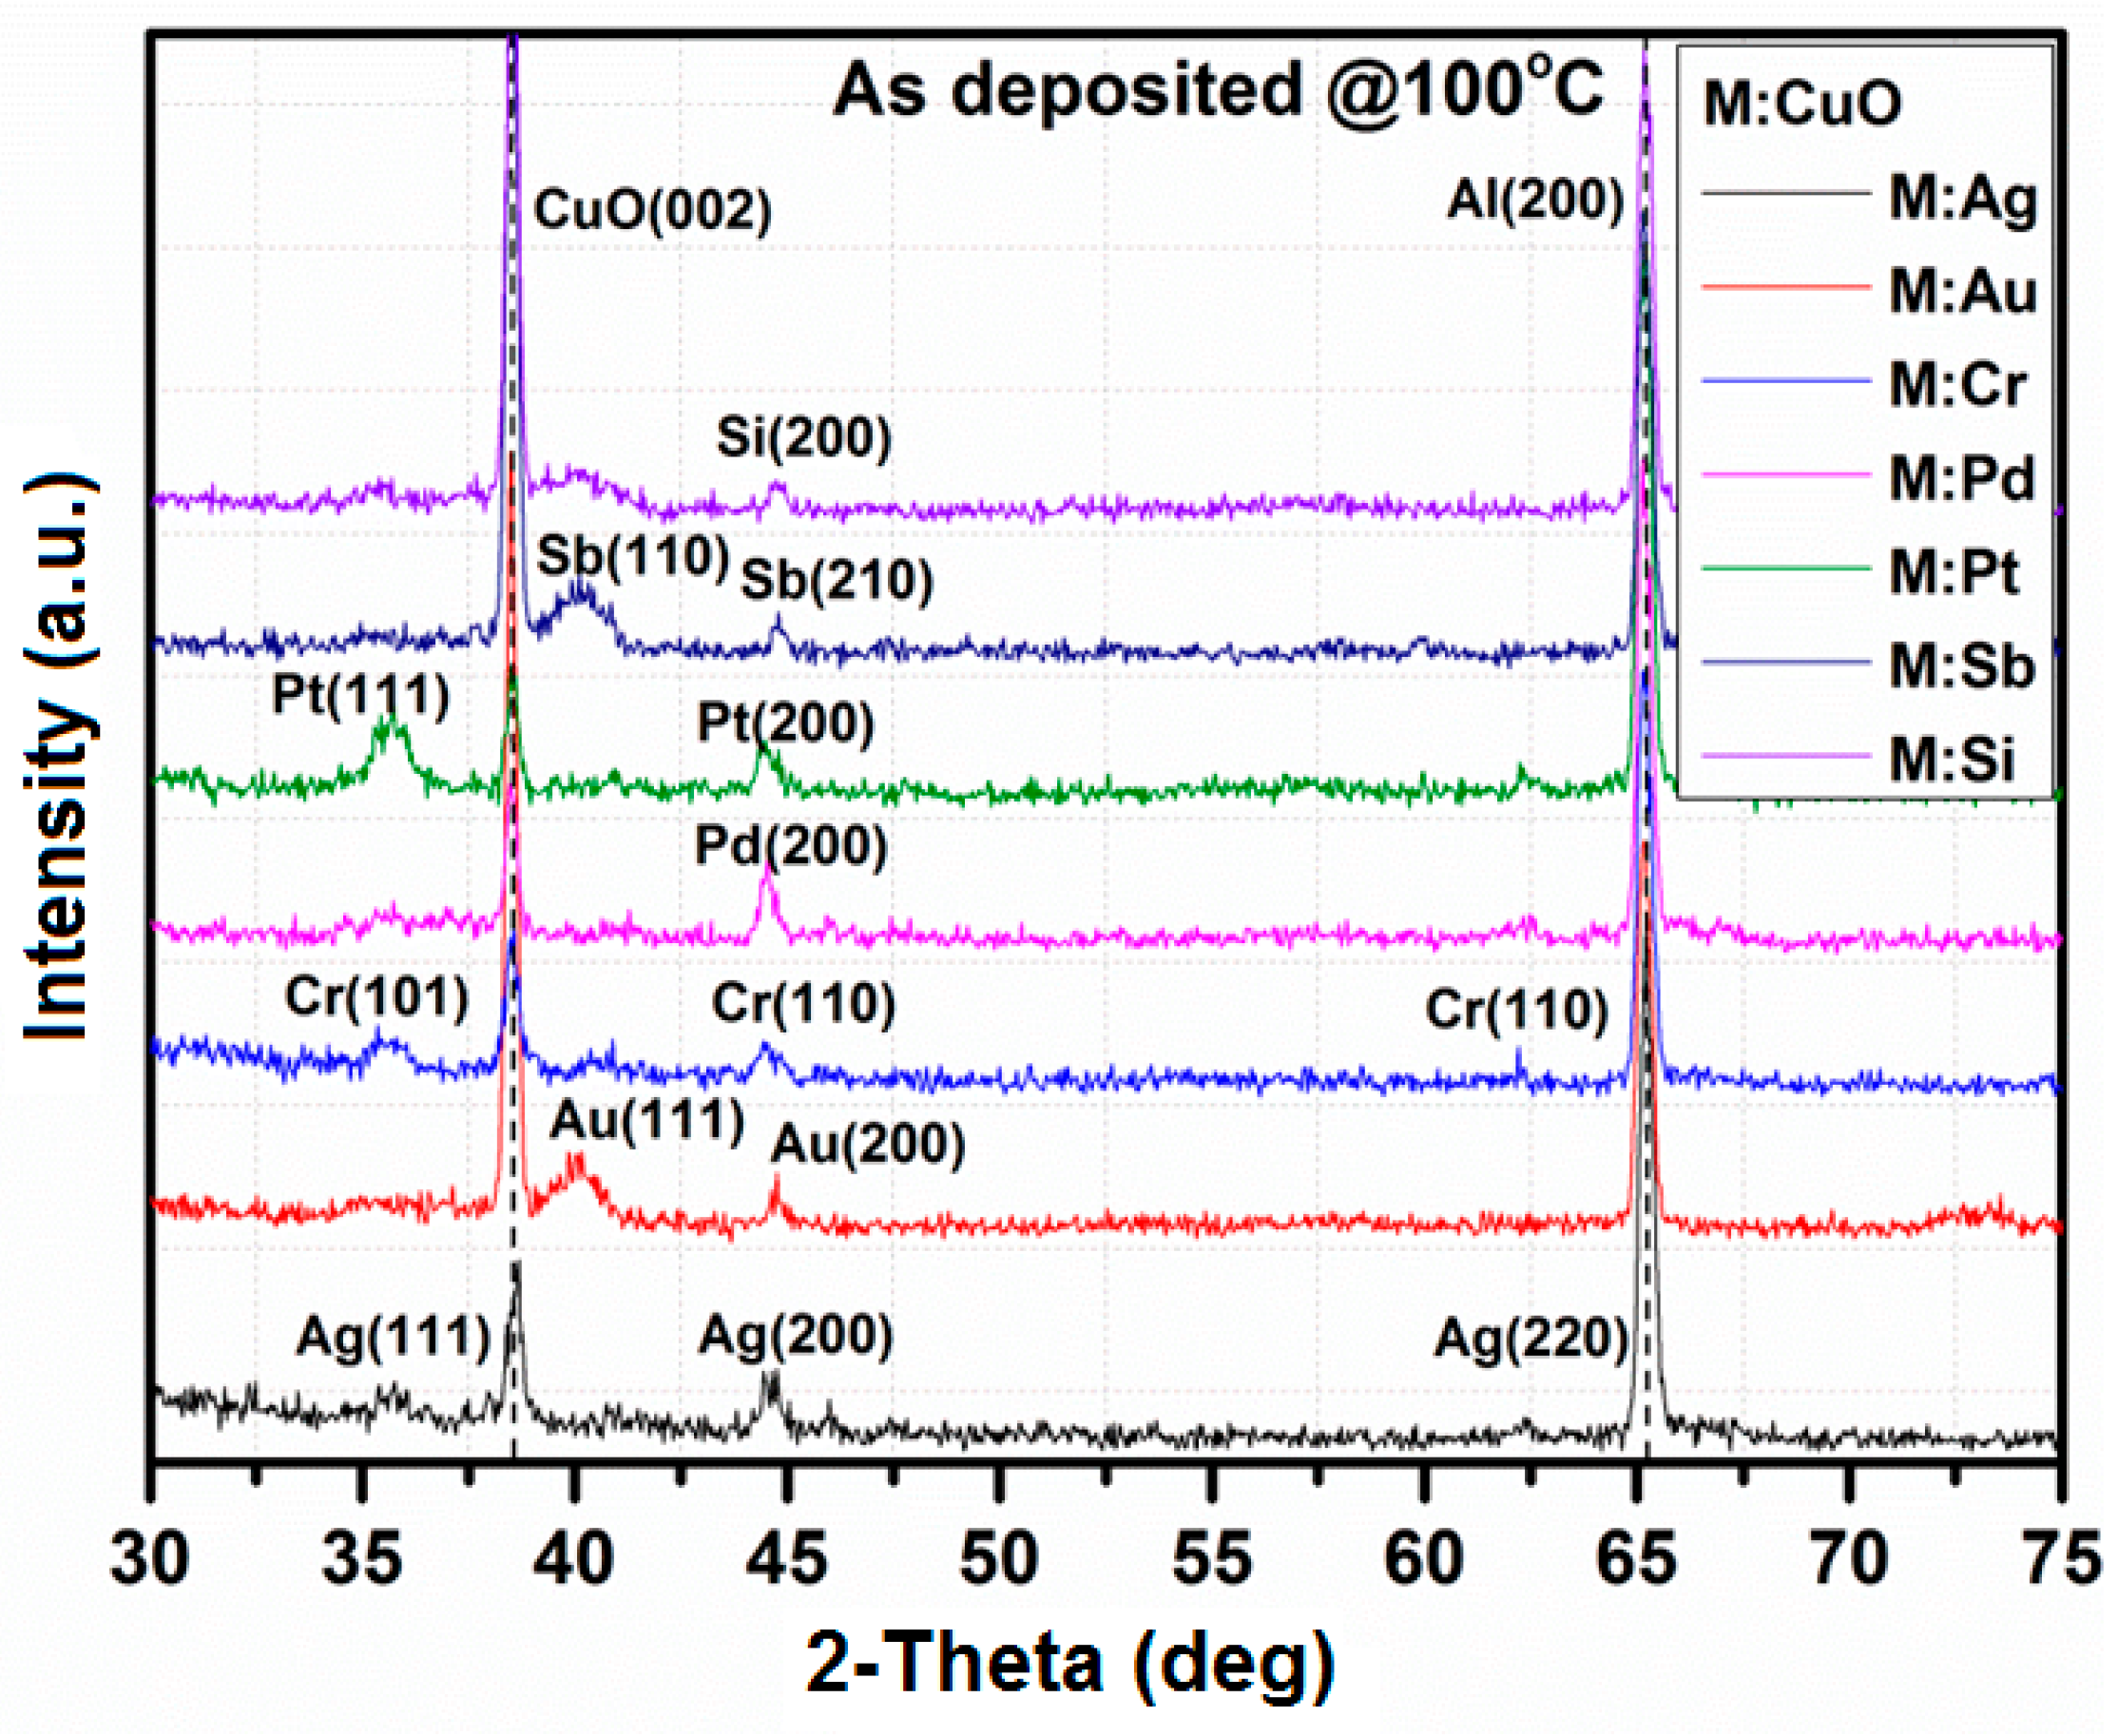
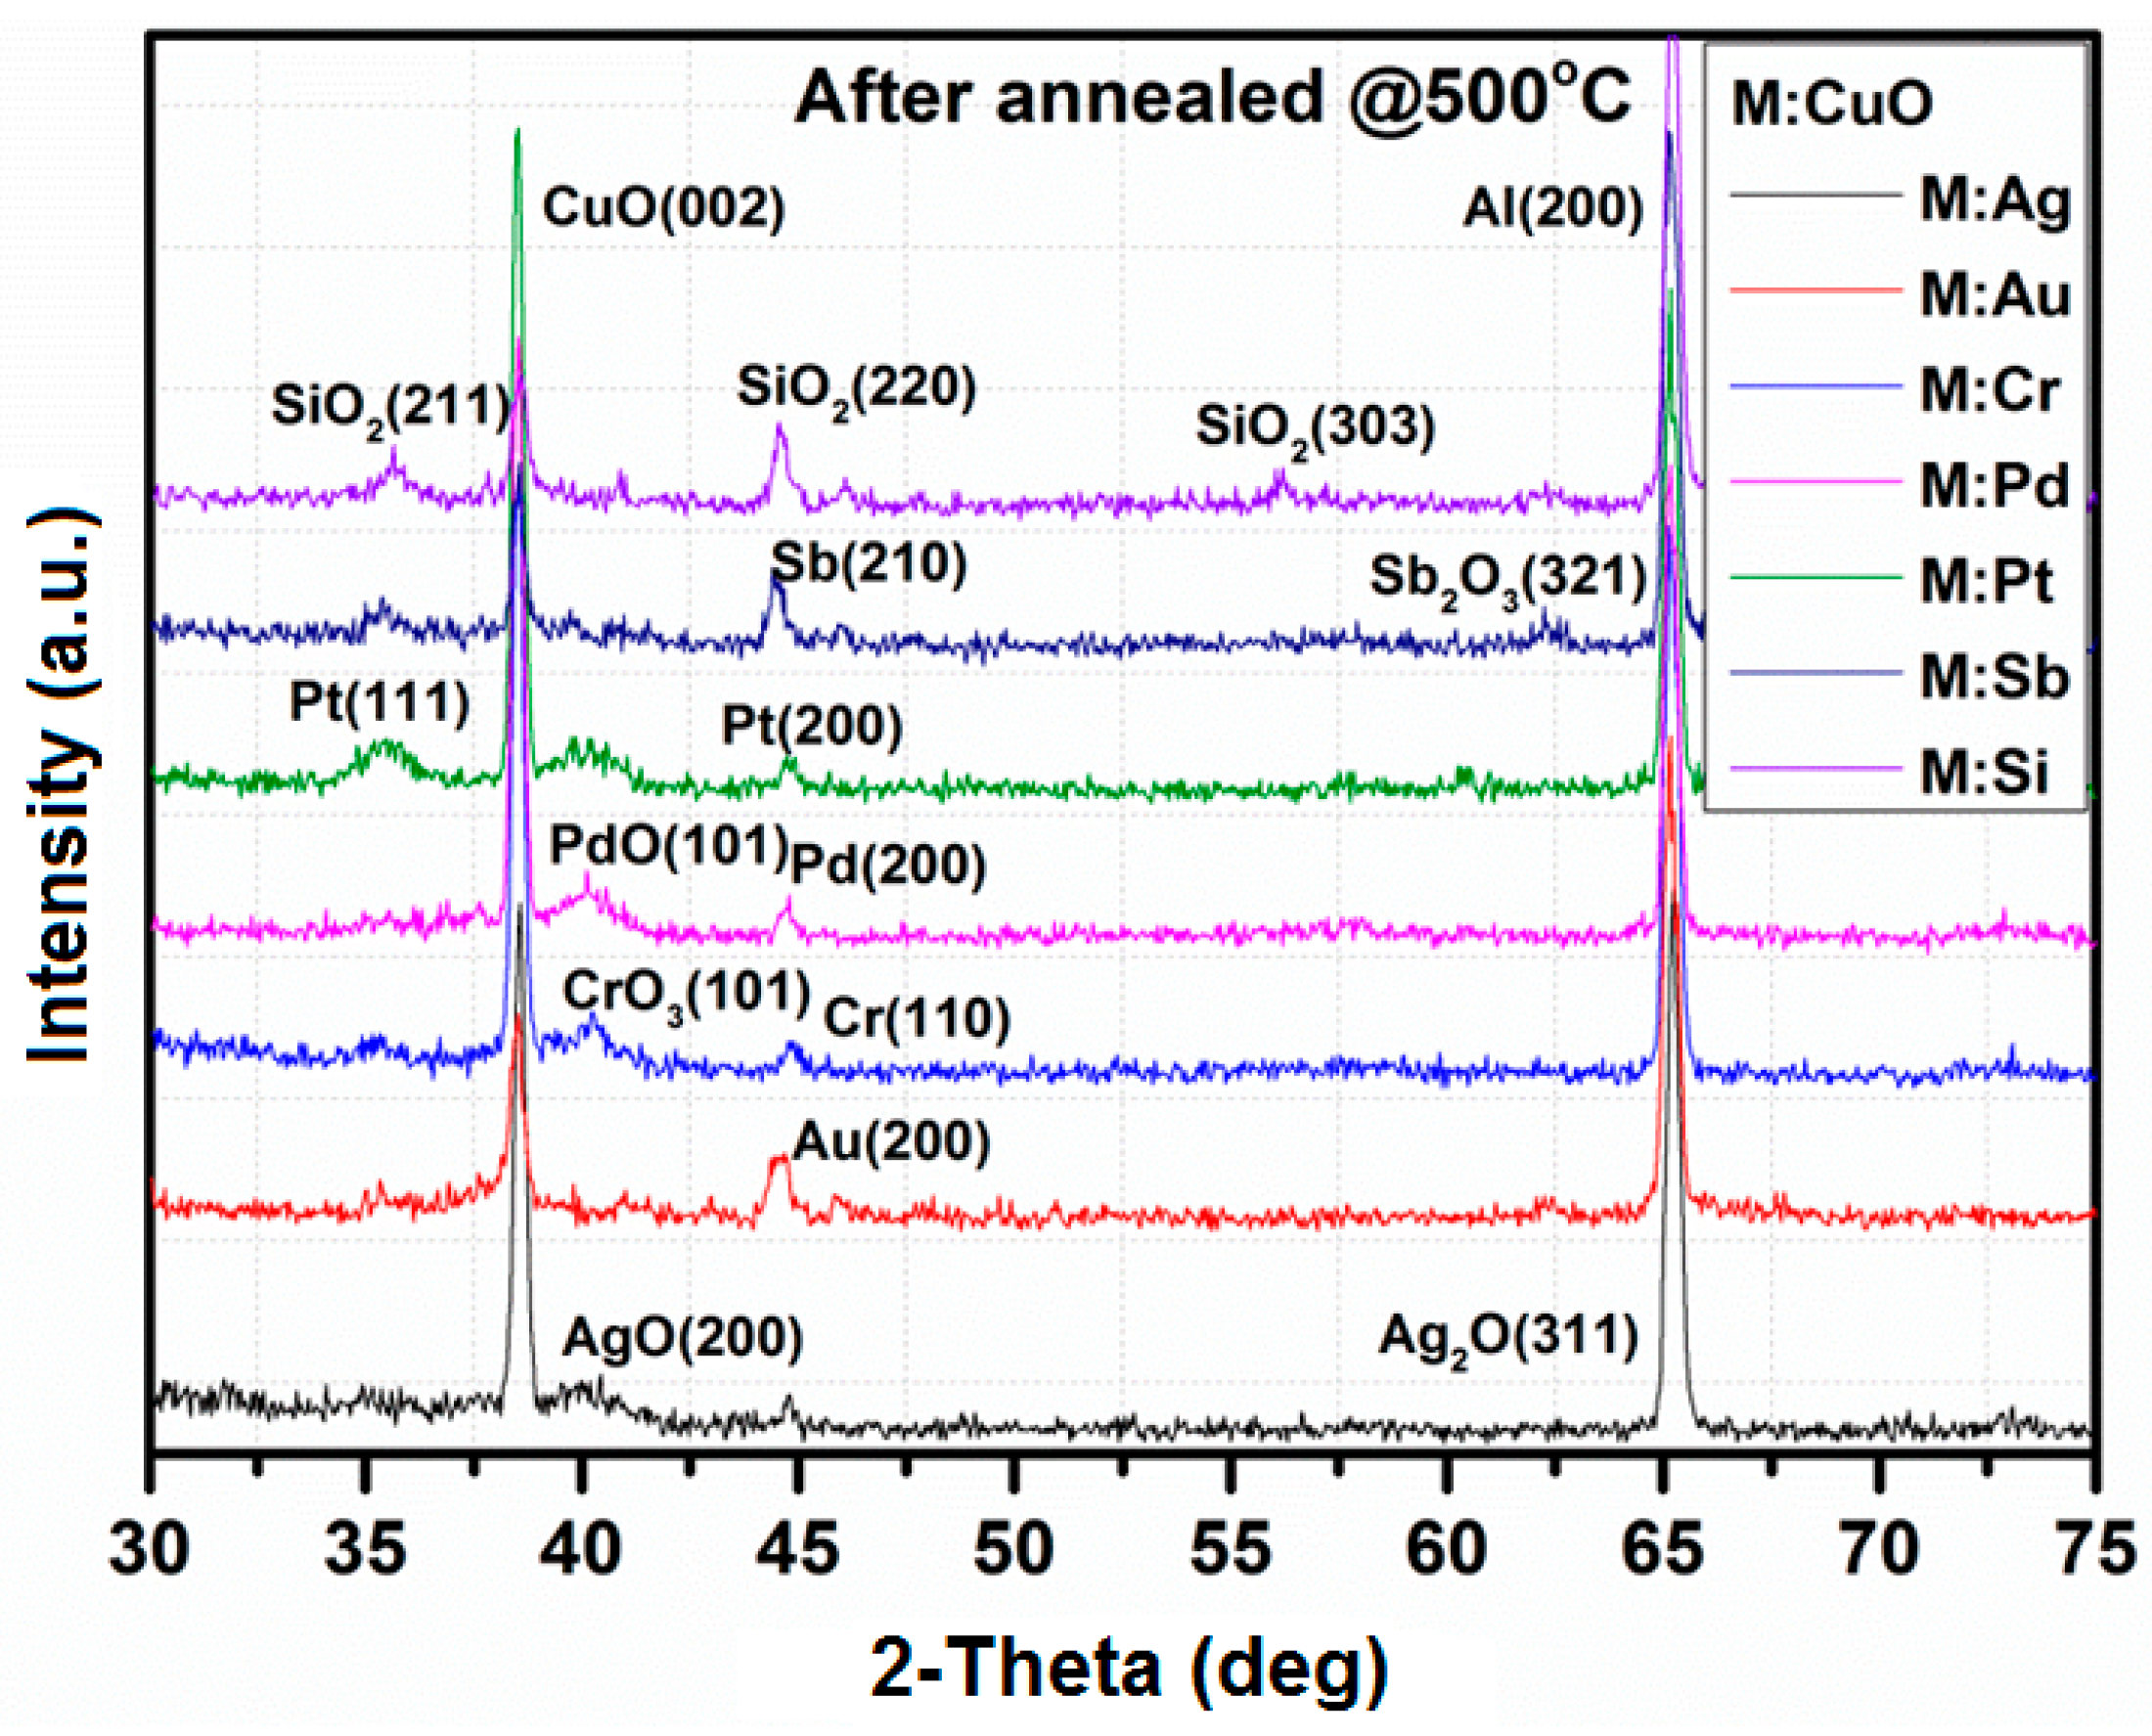
3.1. X-Ray Diffraction

| Thin Film | Crystallographic Parameters | ||||||
|---|---|---|---|---|---|---|---|
| Crystal System | a (Å) | b (Å) | c (Å) | α (°) | β (°) | γ (°) | |
| CuO | Monoclinic | 4.6797 | 3.4314 | 5.1362 | 90 | 99.26 | 90 |
| Au:CuO | Cubic | 4.0786 | 4.0786 | 4.0786 | 90 | 90 | 90 |
| Ag:CuO | Monoclinic | 5.8500 | 3.4800 | 5.5000 | 90 | 107.5 | 90 |
| Cr:CuO | Cubic | 4.0400 | 4.400 | 4.0400 | 90 | 90 | 90 |
| Pd:CuO | Cubic | 3.8902 | 3.8902 | 3.8902 | 90 | 90 | 90 |
| Pt:CuO | Hexagonal | 3.1000 | 3.1000 | 8.3200 | 90 | 90 | 120 |
| Sb:CuO | Cubic | 6.1347 | 6.1347 | 6.1347 | 90 | 90 | 90 |
| Si:CuO | Monoclinic | 8.8664 | 4.7482 | 8.7918 | 90 | 115 | 90 |
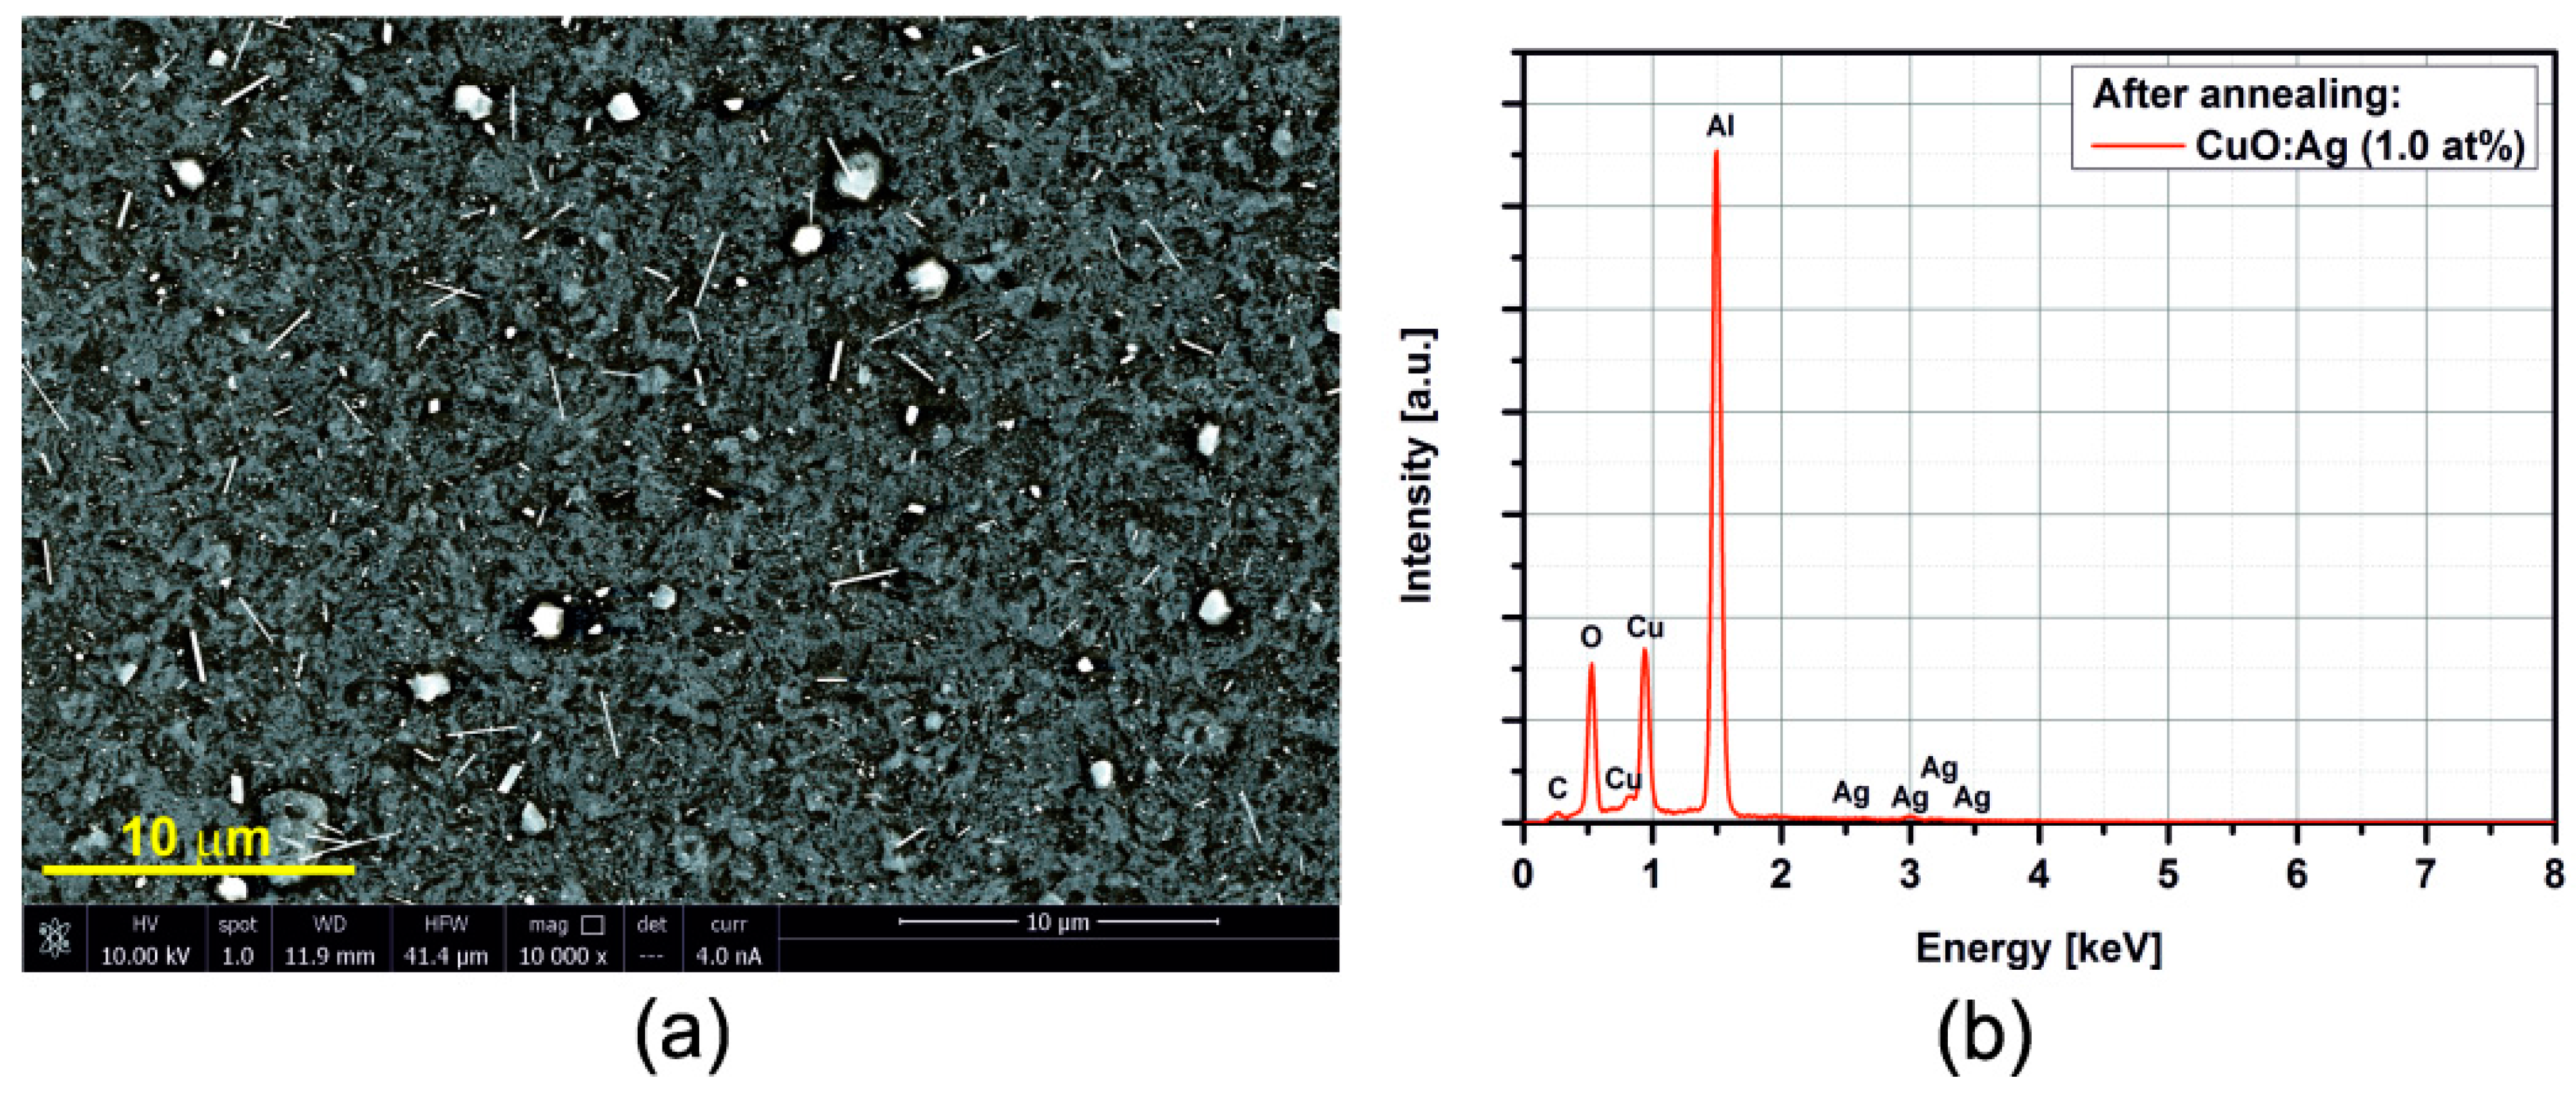
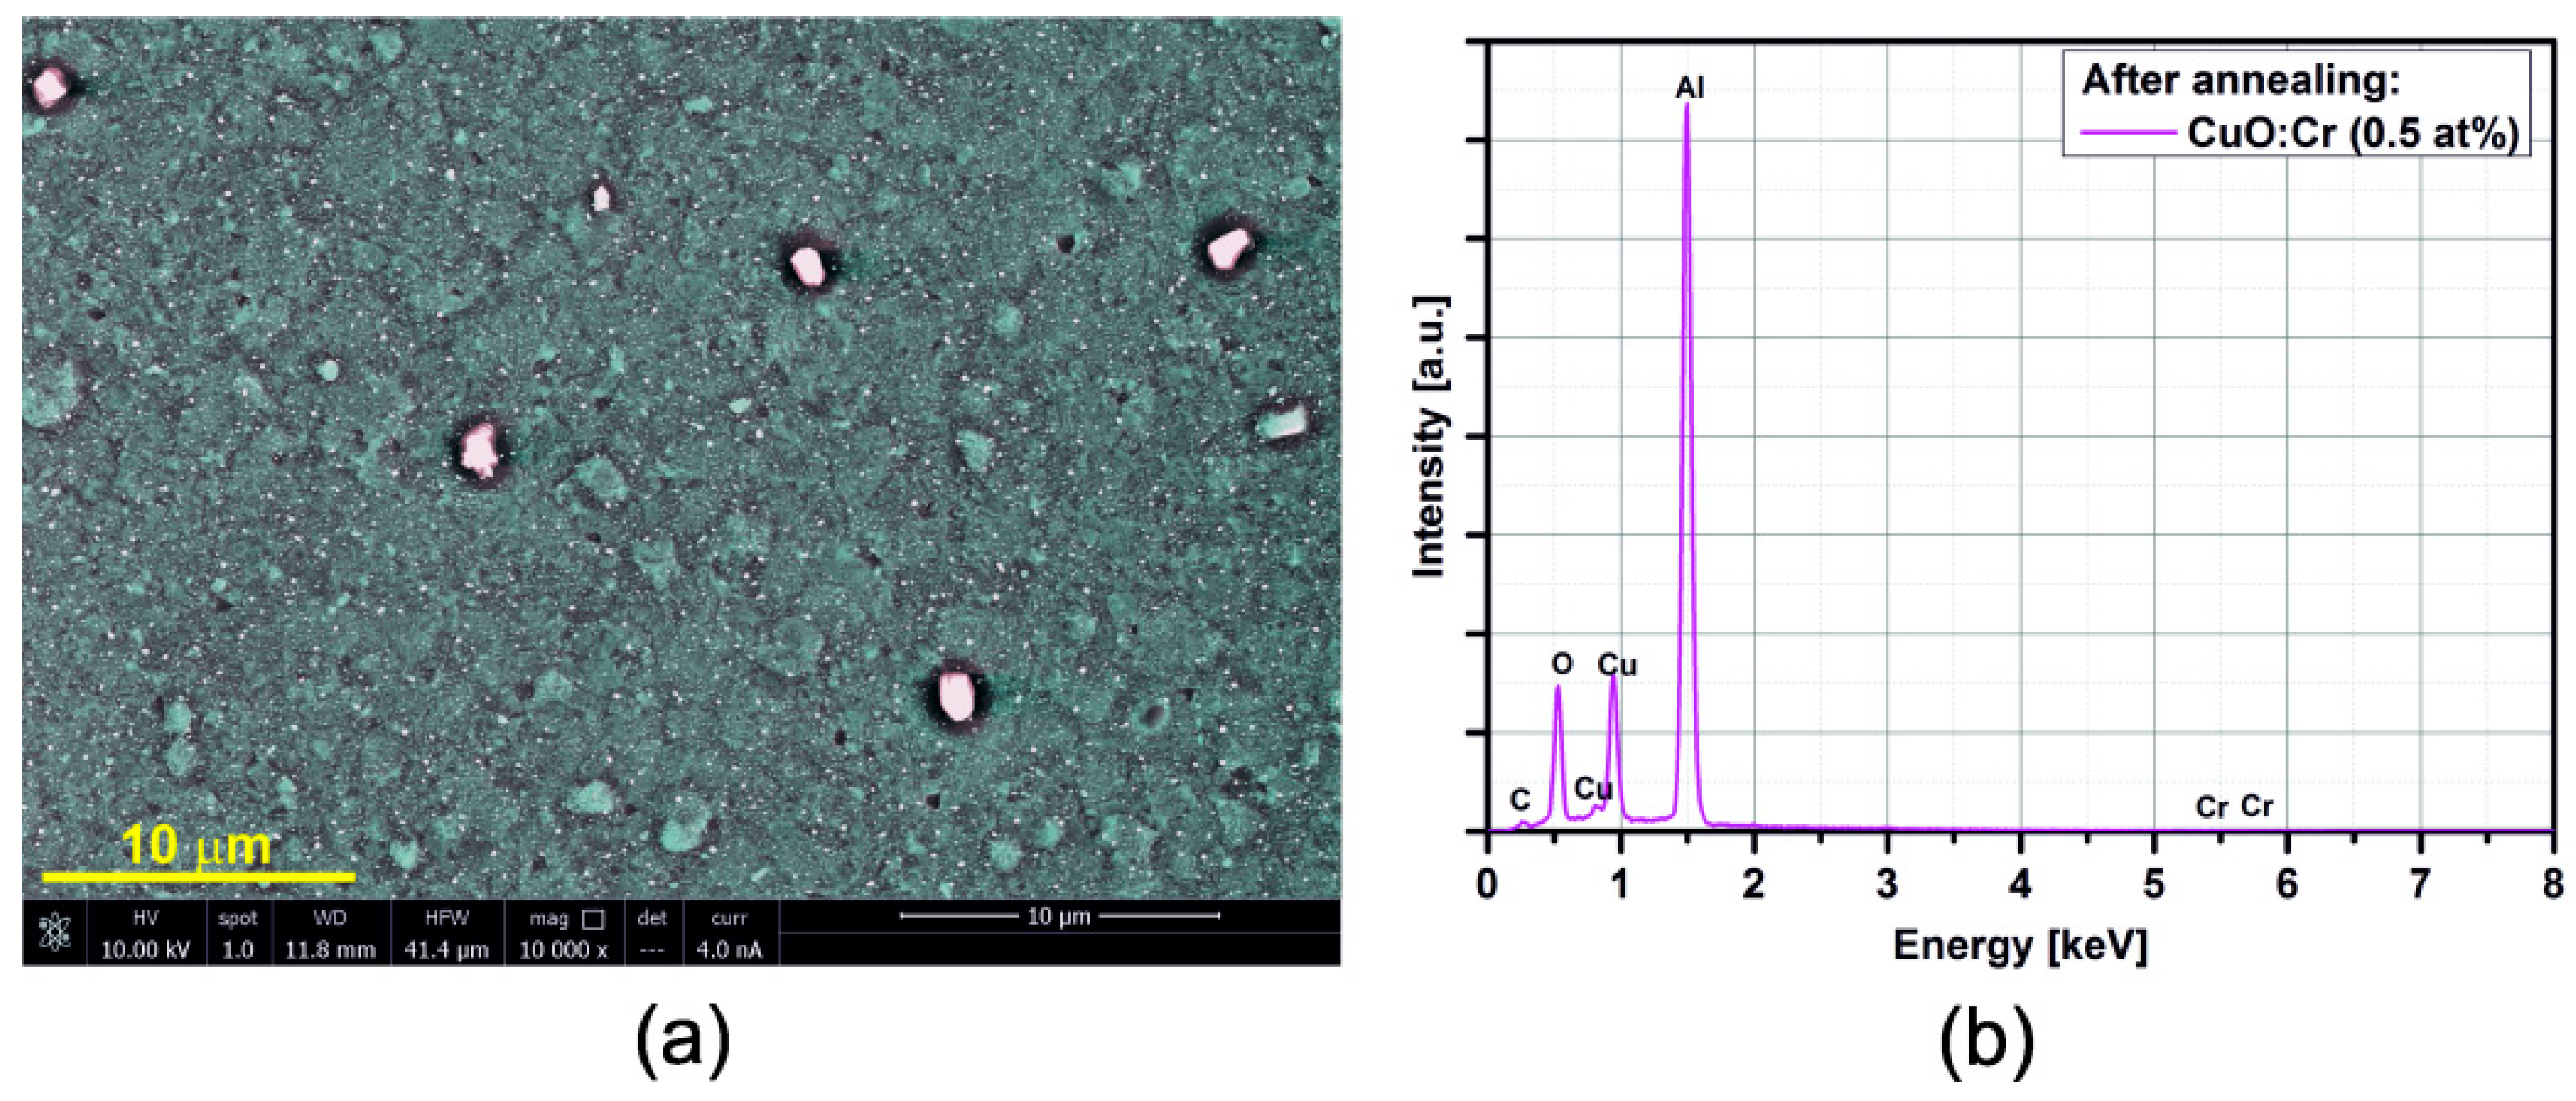
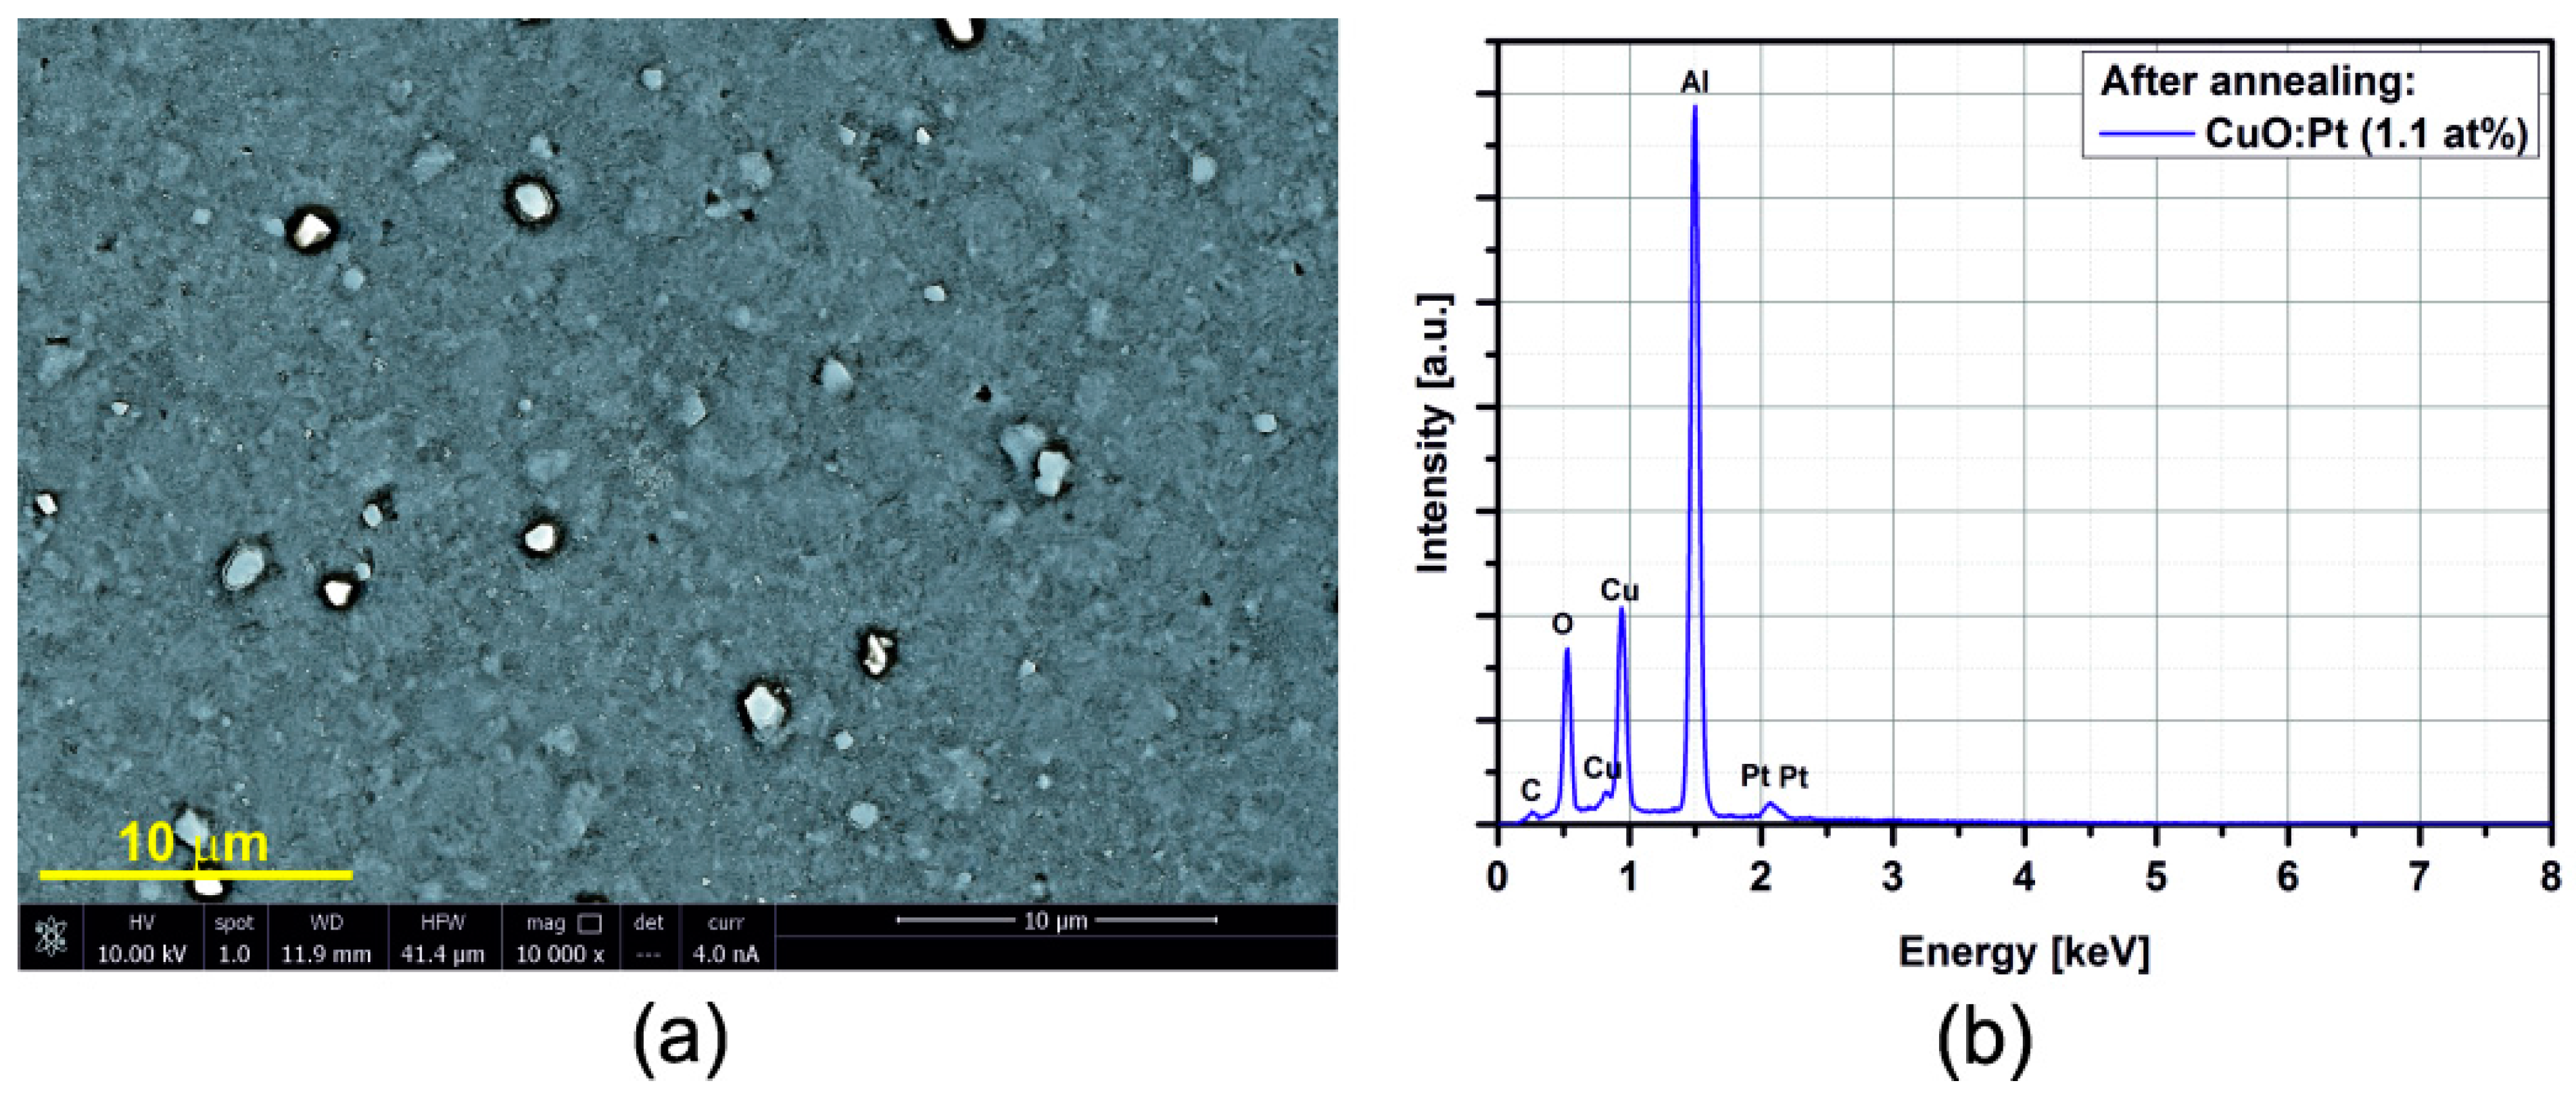
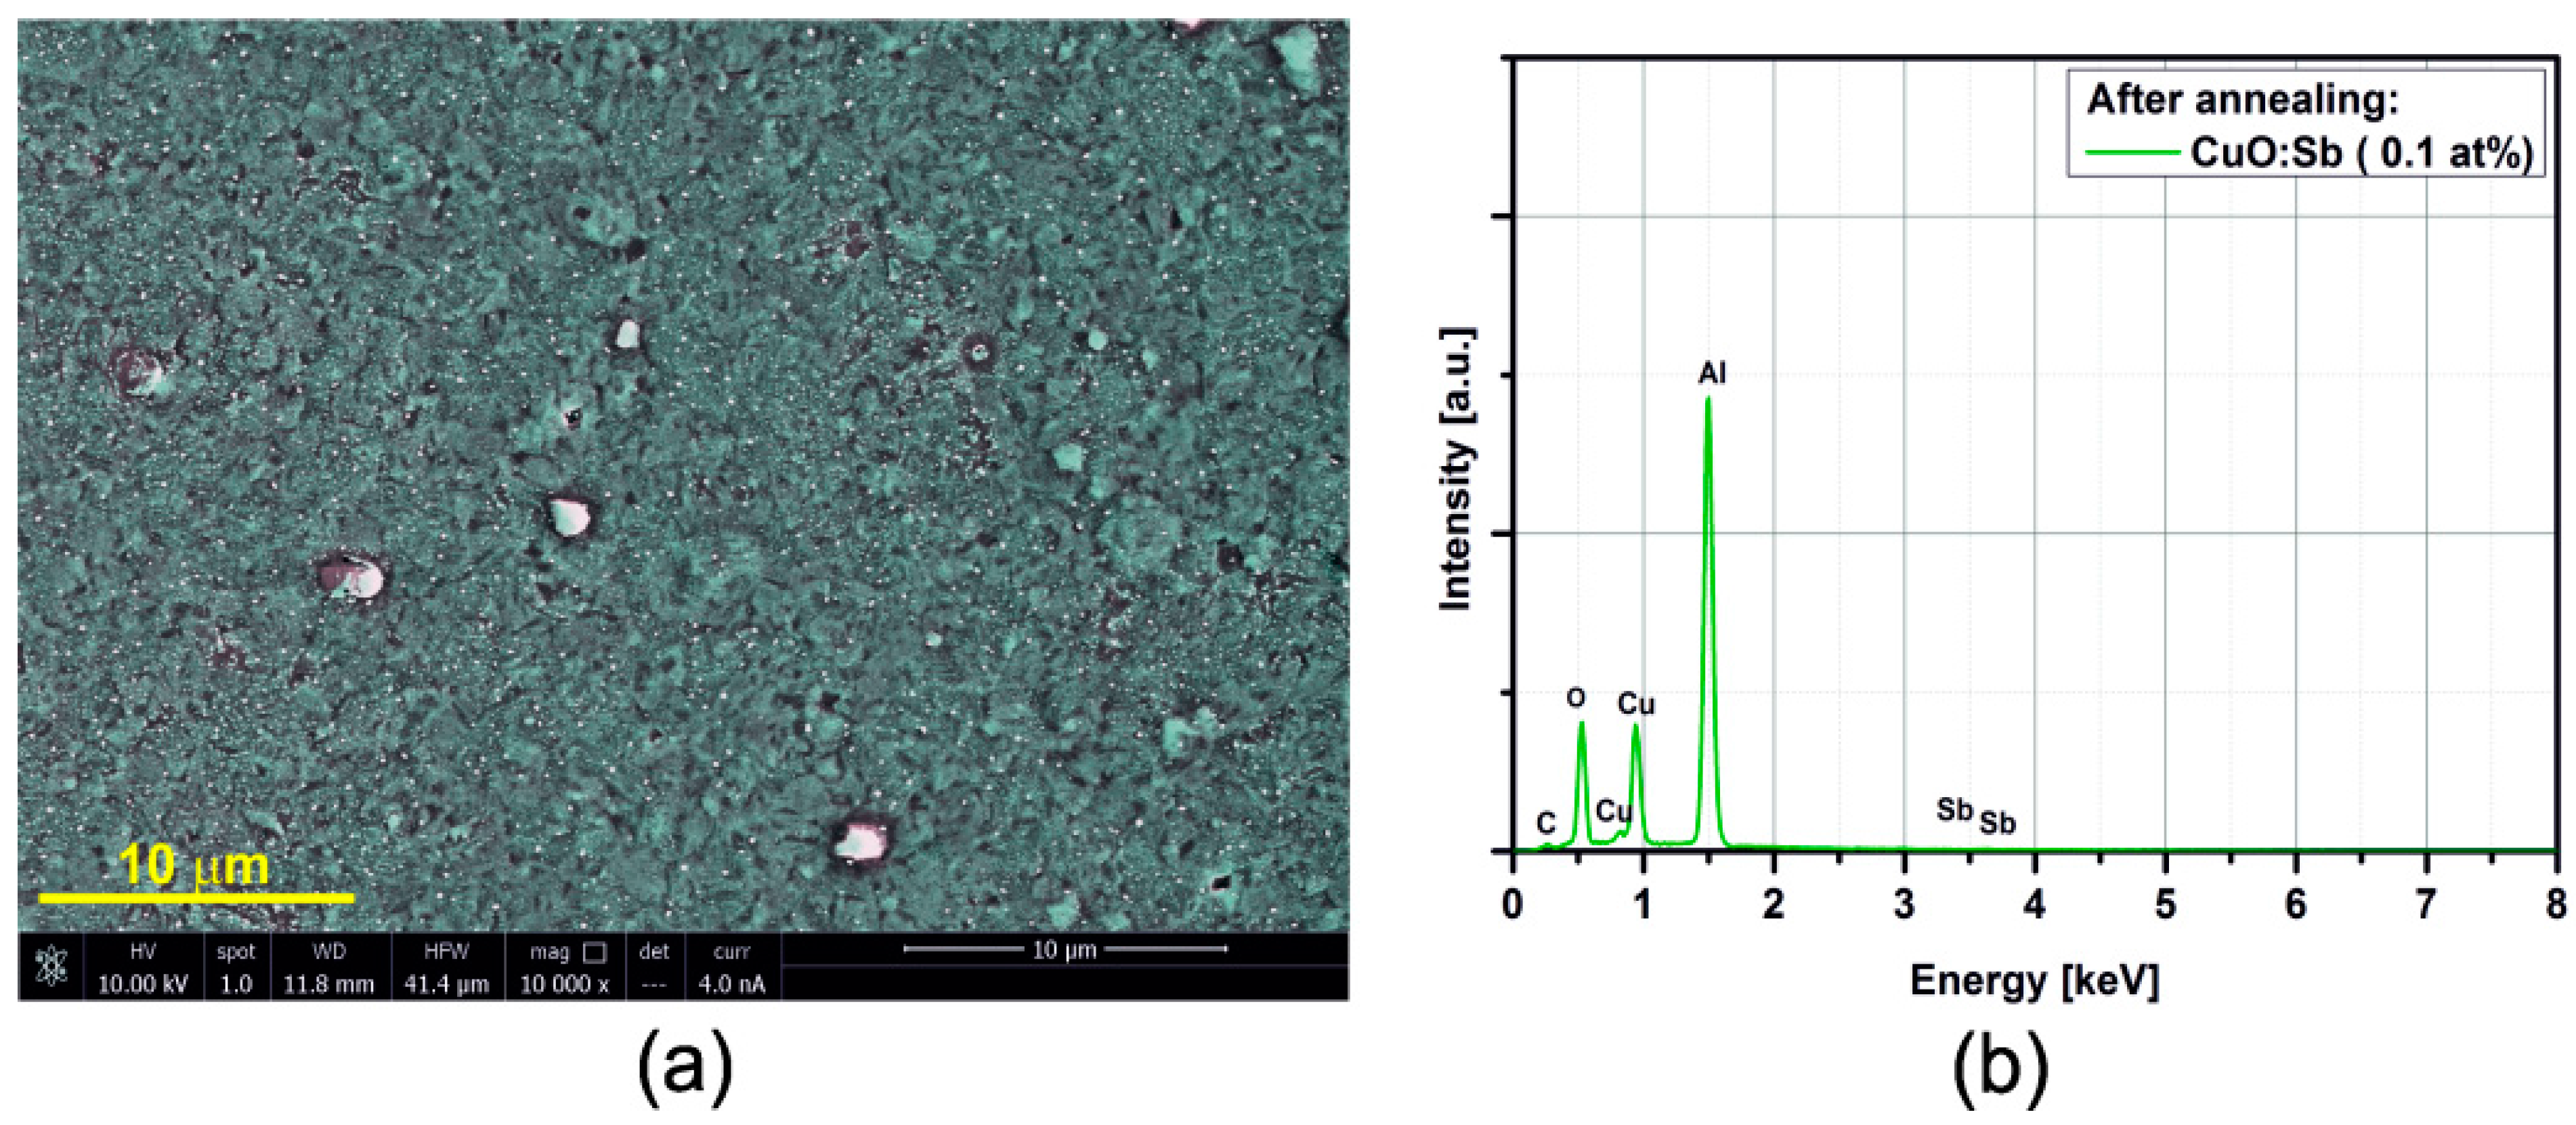
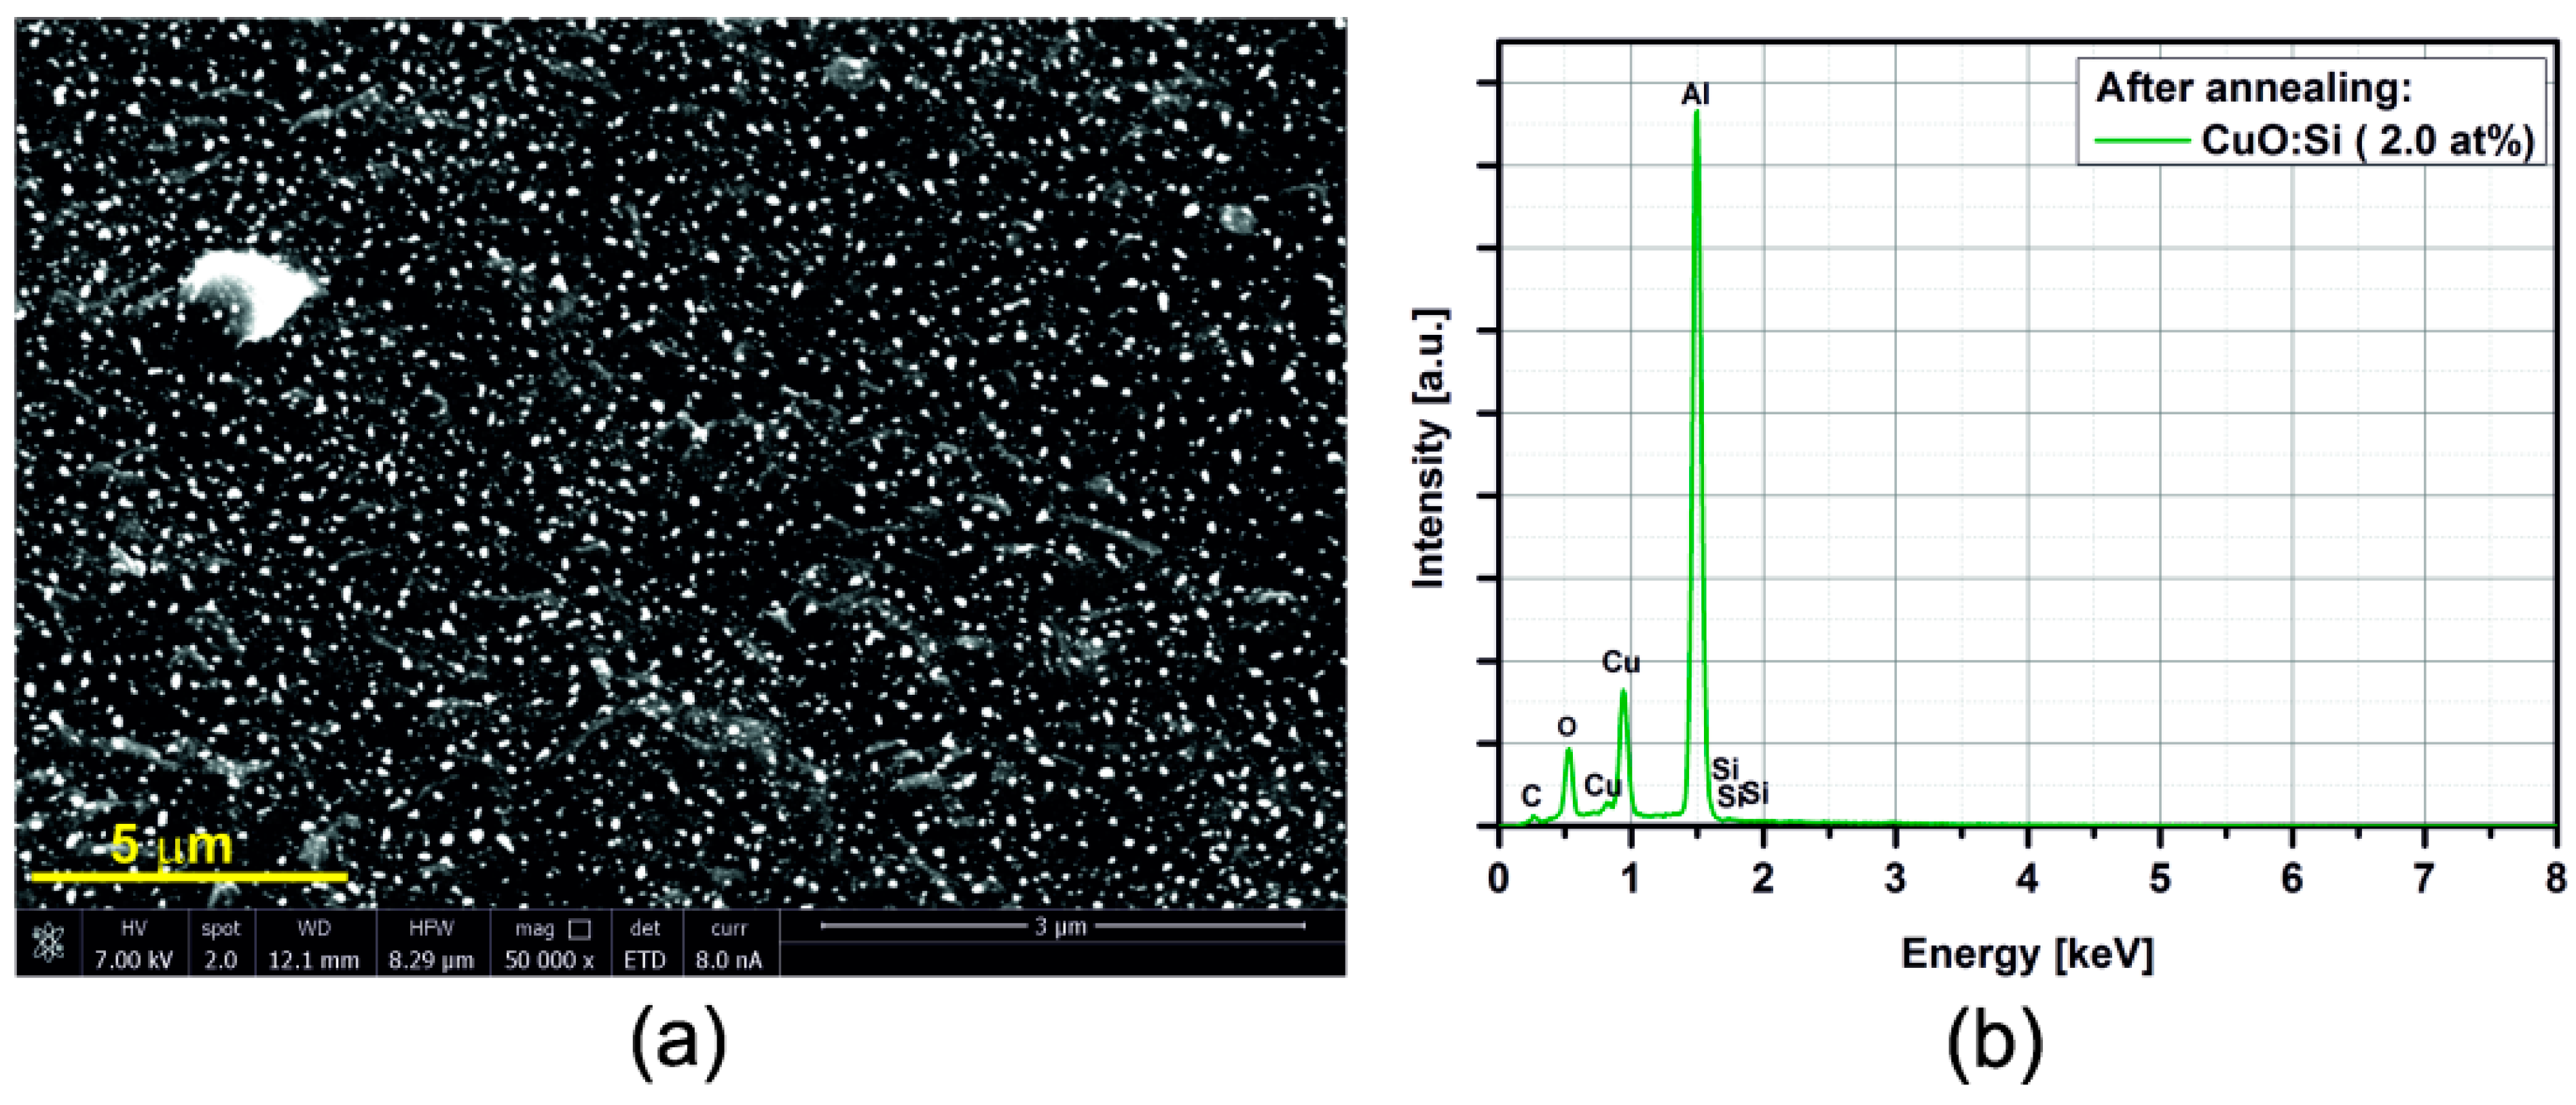
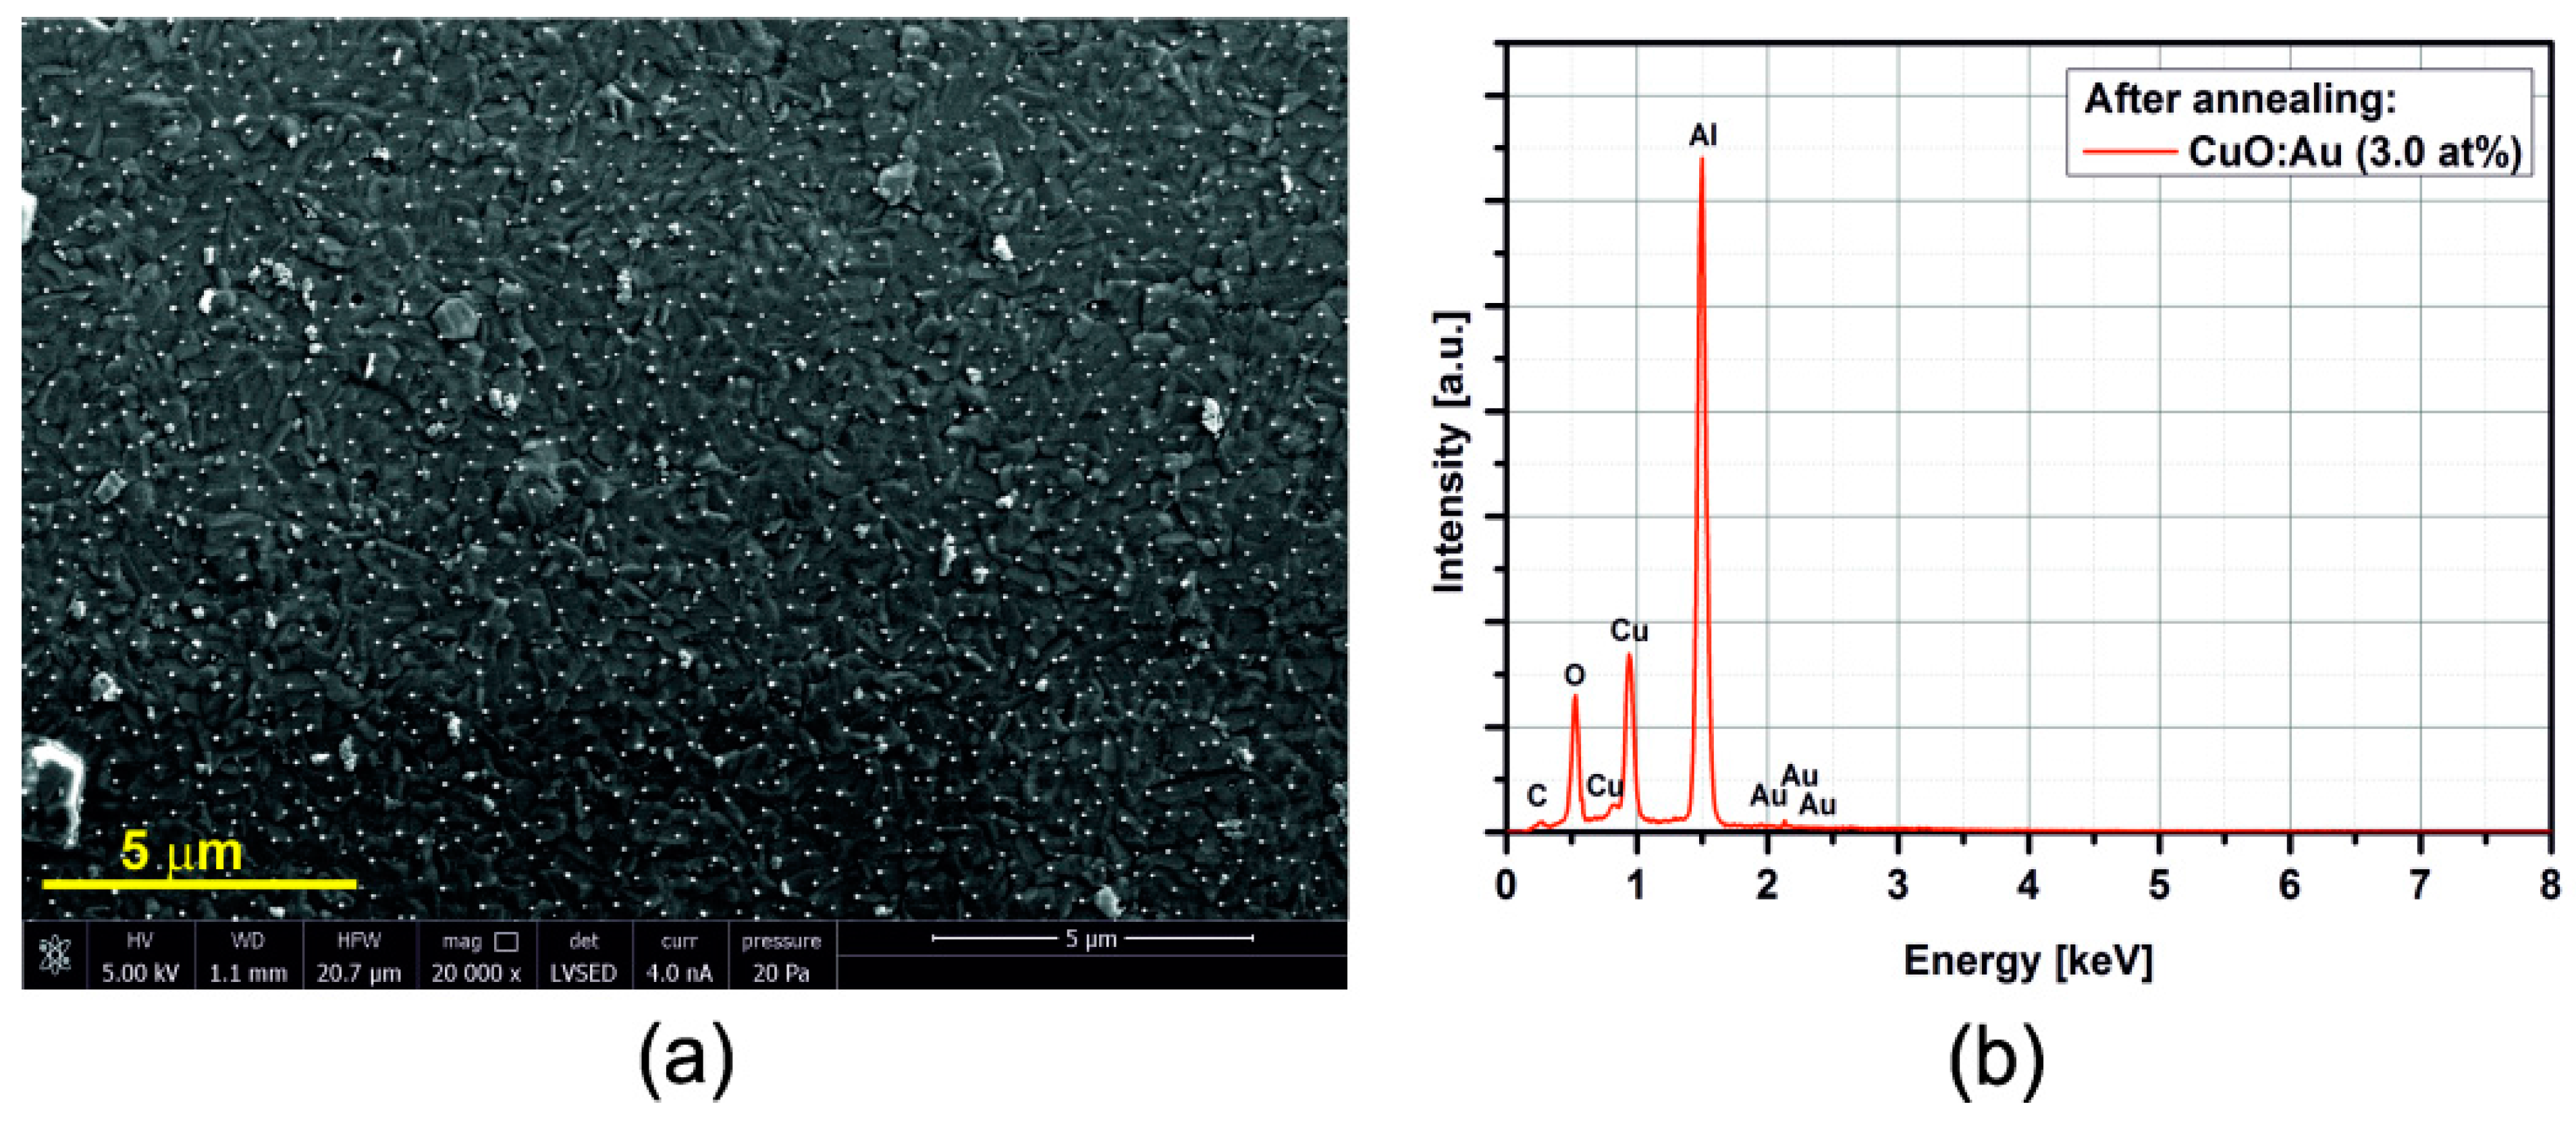
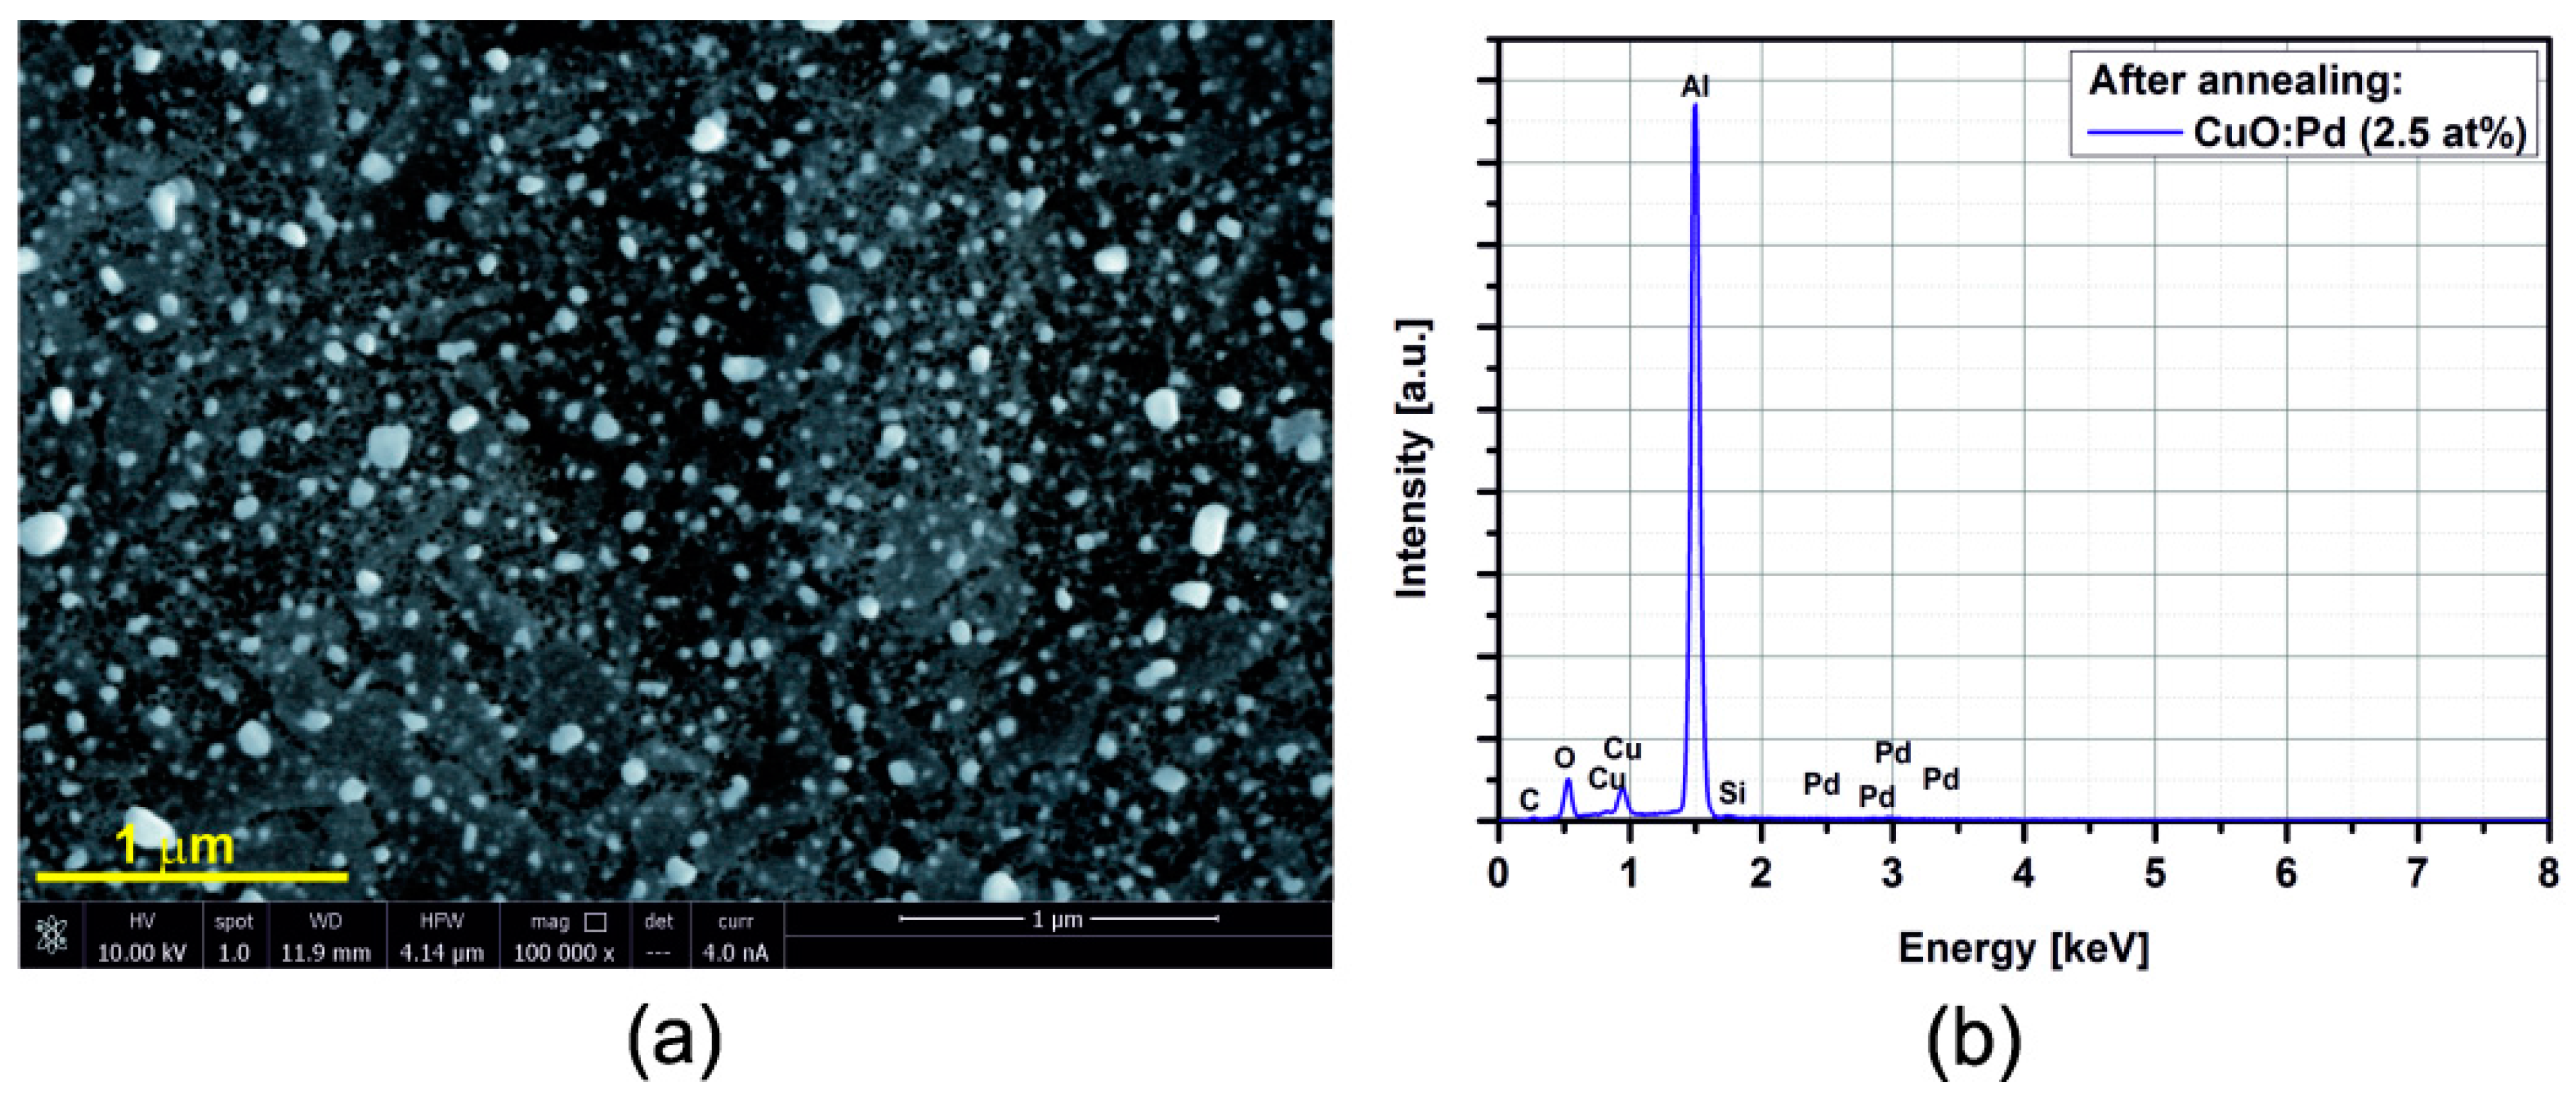
3.2. SEM/EDX


3.3. Electrical Resistance Measurements
| Thin Film | Baseline Resistance at Temperature (°C) | Temperature Coefficient of Resistance (1/°C) | |||
|---|---|---|---|---|---|
| 180 | 250 | 320 | 380 | ||
| CuO | 100 kΩ ± 0.5 kΩ | 30 kΩ ± 0.15 kΩ | 15 kΩ ± 0.07 Ω | 9 kΩ ± 0.04 Ω | −0.0045 |
| Au:CuO | 9000 kΩ ± 45 kΩ | 1335 kΩ ± 7 kΩ | 261 kΩ ± 1 kΩ | 103 kΩ ± 0.5 kΩ | −0.4400 |
| Ag:CuO | 1060 kΩ ± 4 kΩ | 405 kΩ ± 2 kΩ | 140 kΩ ± 0.7 kΩ | 80 kΩ ± 0.4 kΩ | −0.0490 |
| Cr:CuO | 530 kΩ ± 2.7 kΩ | 140 kΩ ± 0.7 kΩ | 45 kΩ ± 0.22 kΩ | 30 kΩ ± 0.15 kΩ | −0.0250 |
| Pd:CuO | 103 kΩ ± 0.5 kΩ | 45 kΩ ± 0.2 kΩ | 18 kΩ ± 0.1 kΩ | 11 kΩ ± 0.05 Ω | −0.0460 |
| Pt:CuO | 303 kΩ ± 1.5 kΩ | 107 kΩ ± 0.6 kΩ | 40 kΩ ± 0.2 kΩ | 23 kΩ ± 0.12 kΩ | −0.0140 |
| Sb:CuO | 1300 kΩ ± 6.5 kΩ | 325 kΩ ± 1.7 kΩ | 90 kΩ ± 0.5 kΩ | 40 kΩ ± 0.2 kΩ | −0.0630 |
| Si:CuO | 525 kΩ ± 2.7 kΩ | 100 kΩ ± 5 kΩ | 35 kΩ ± 0.18 kΩ | 20 kΩ ± 0.1 kΩ | −0.0250 |
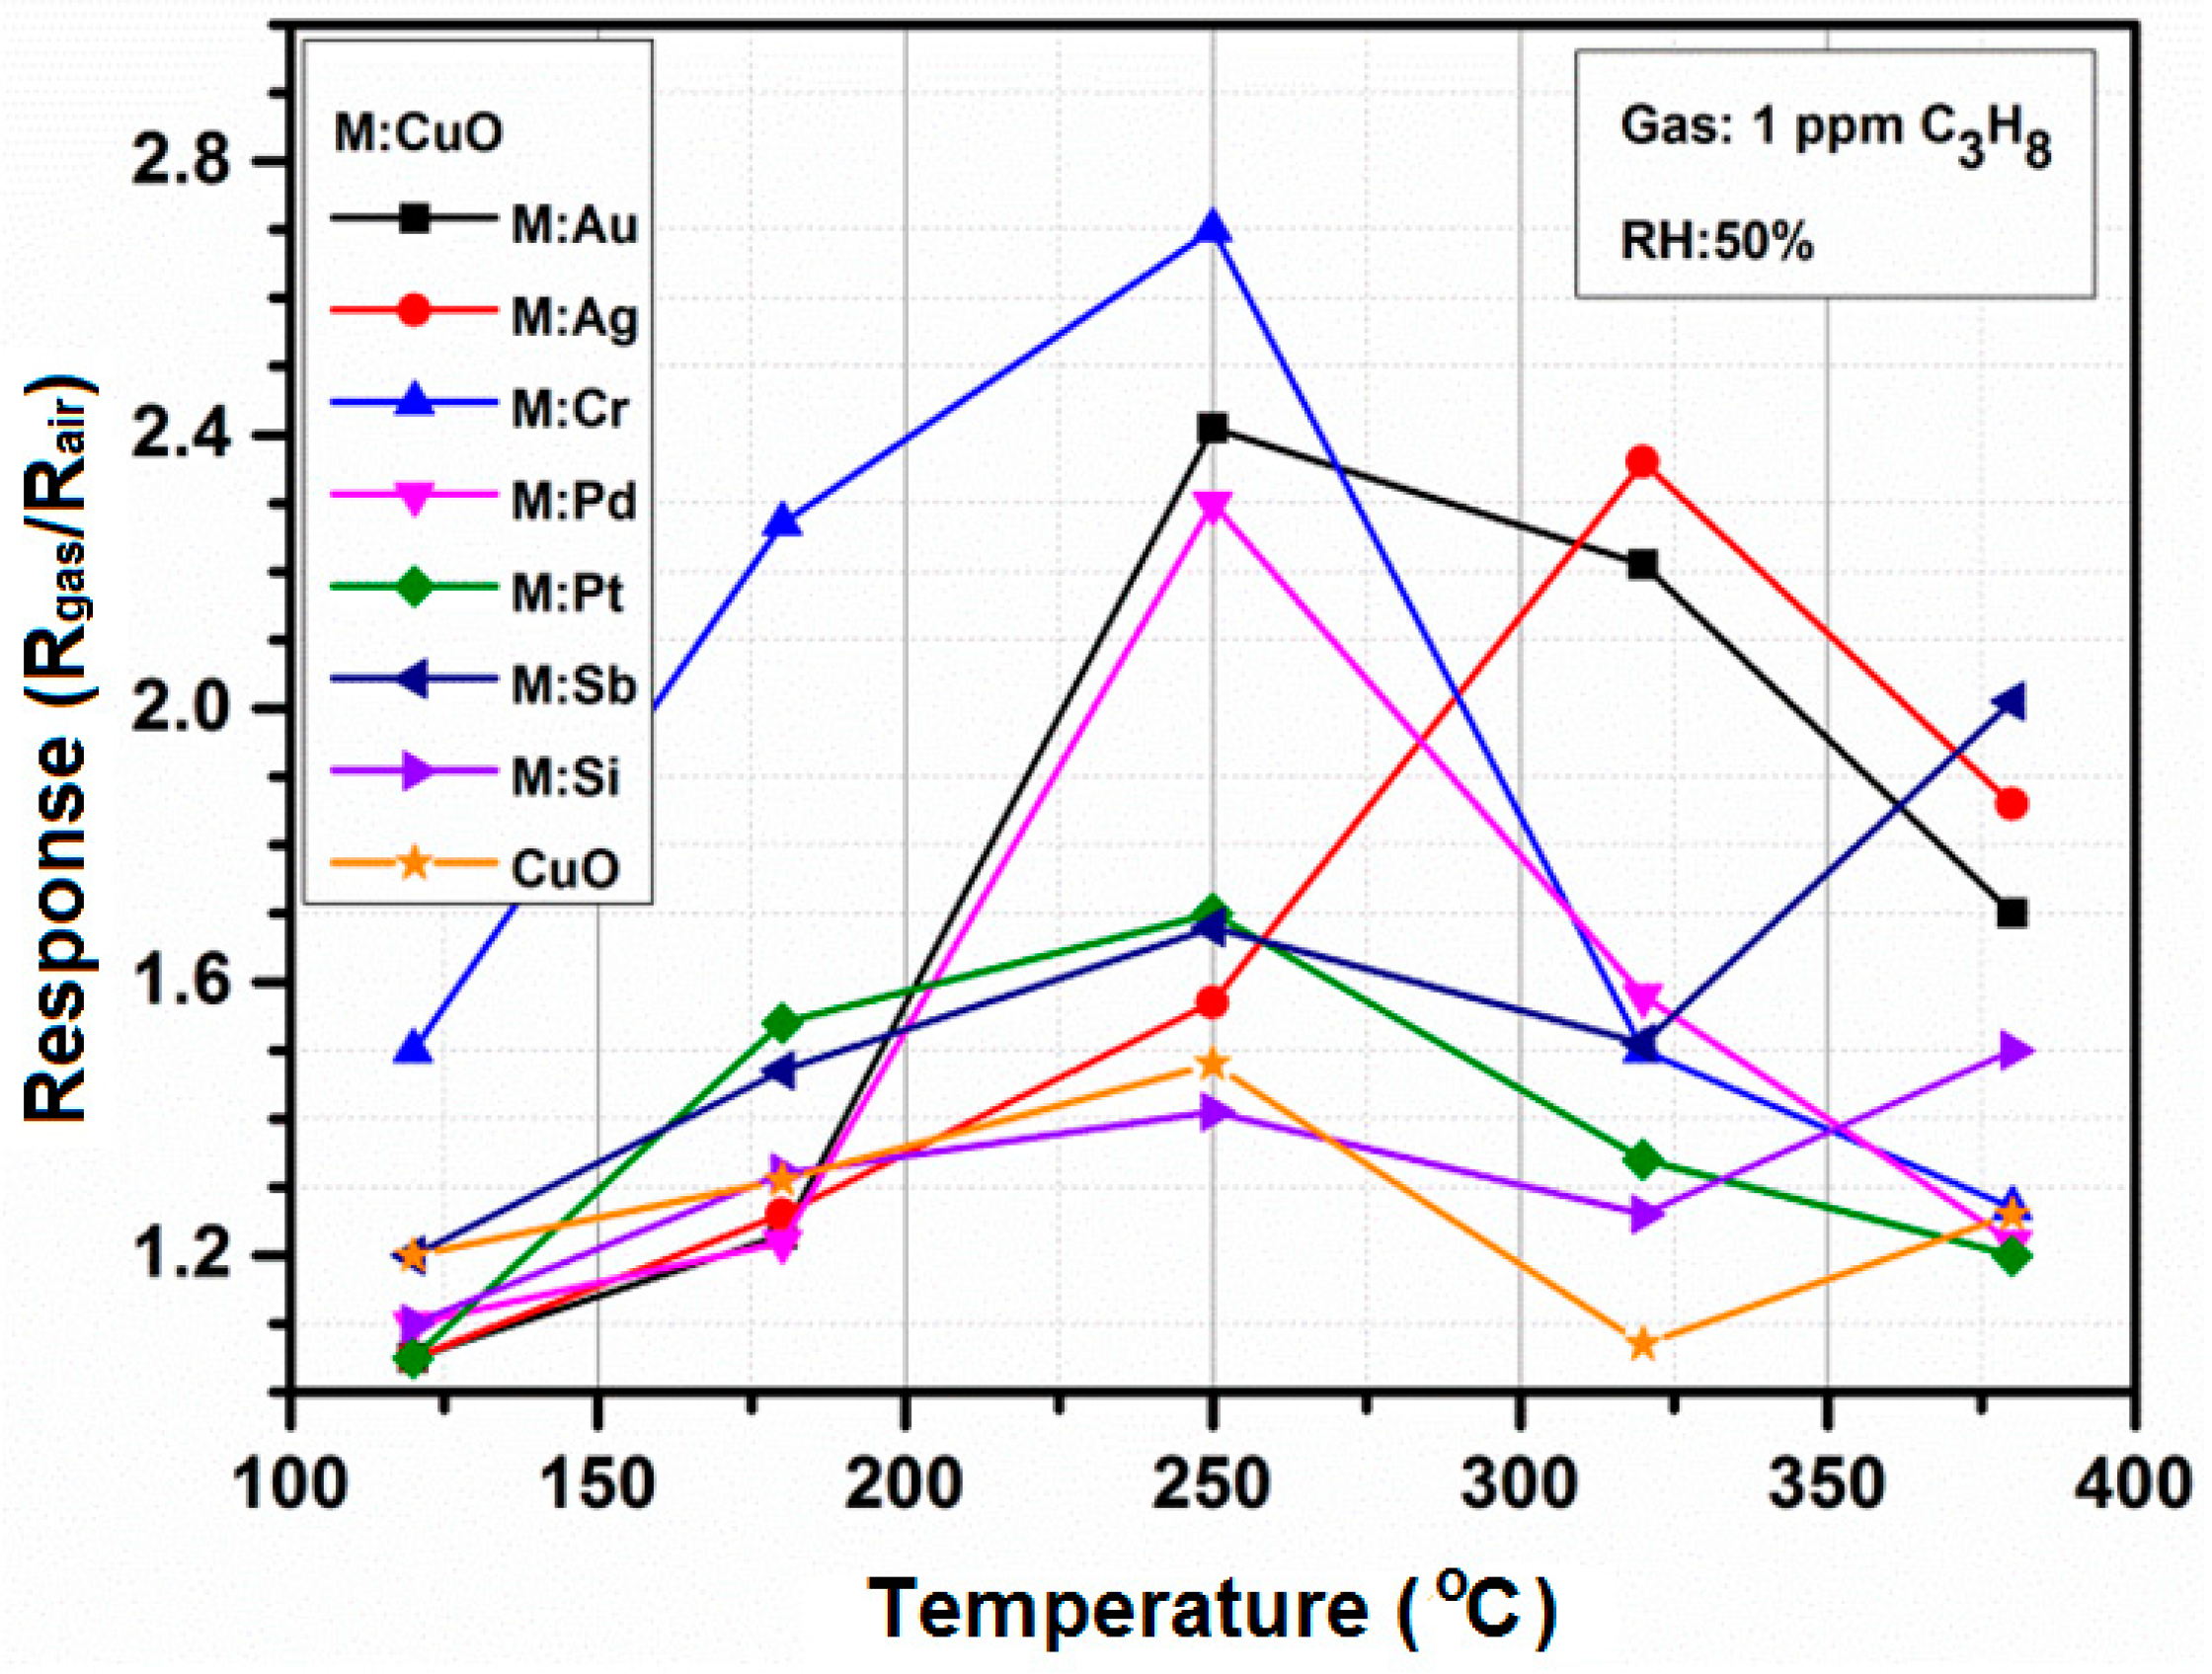
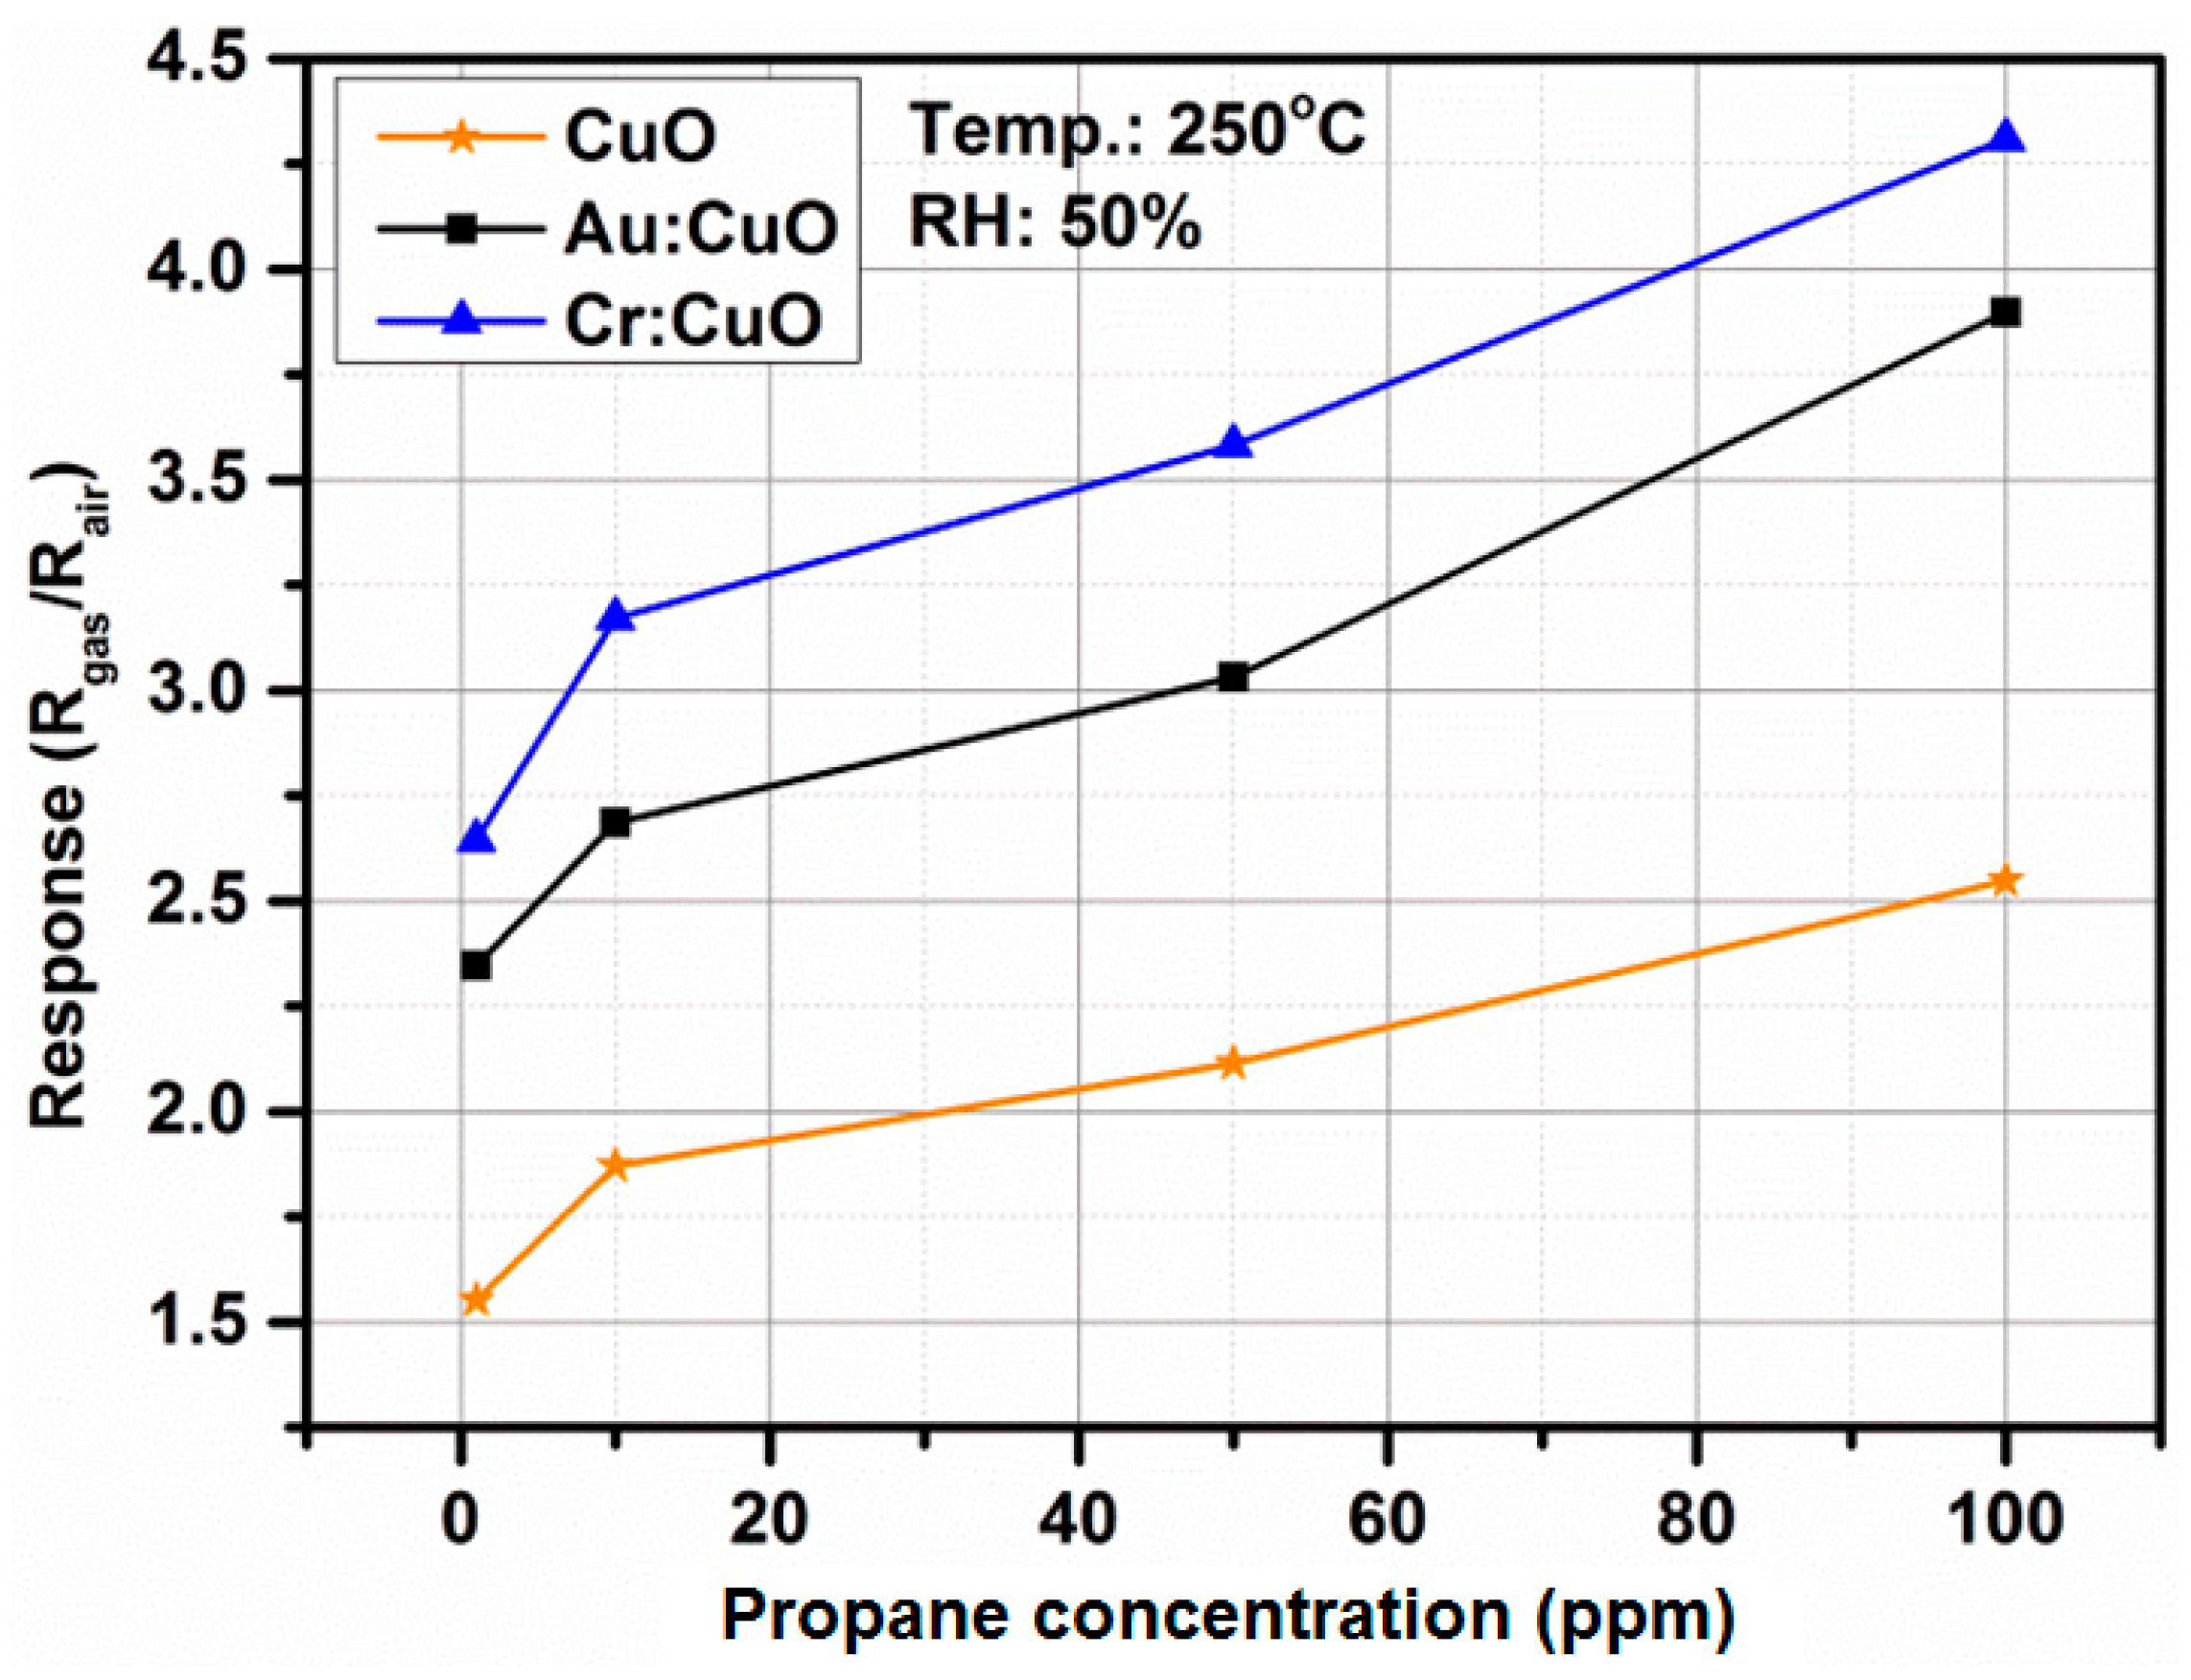
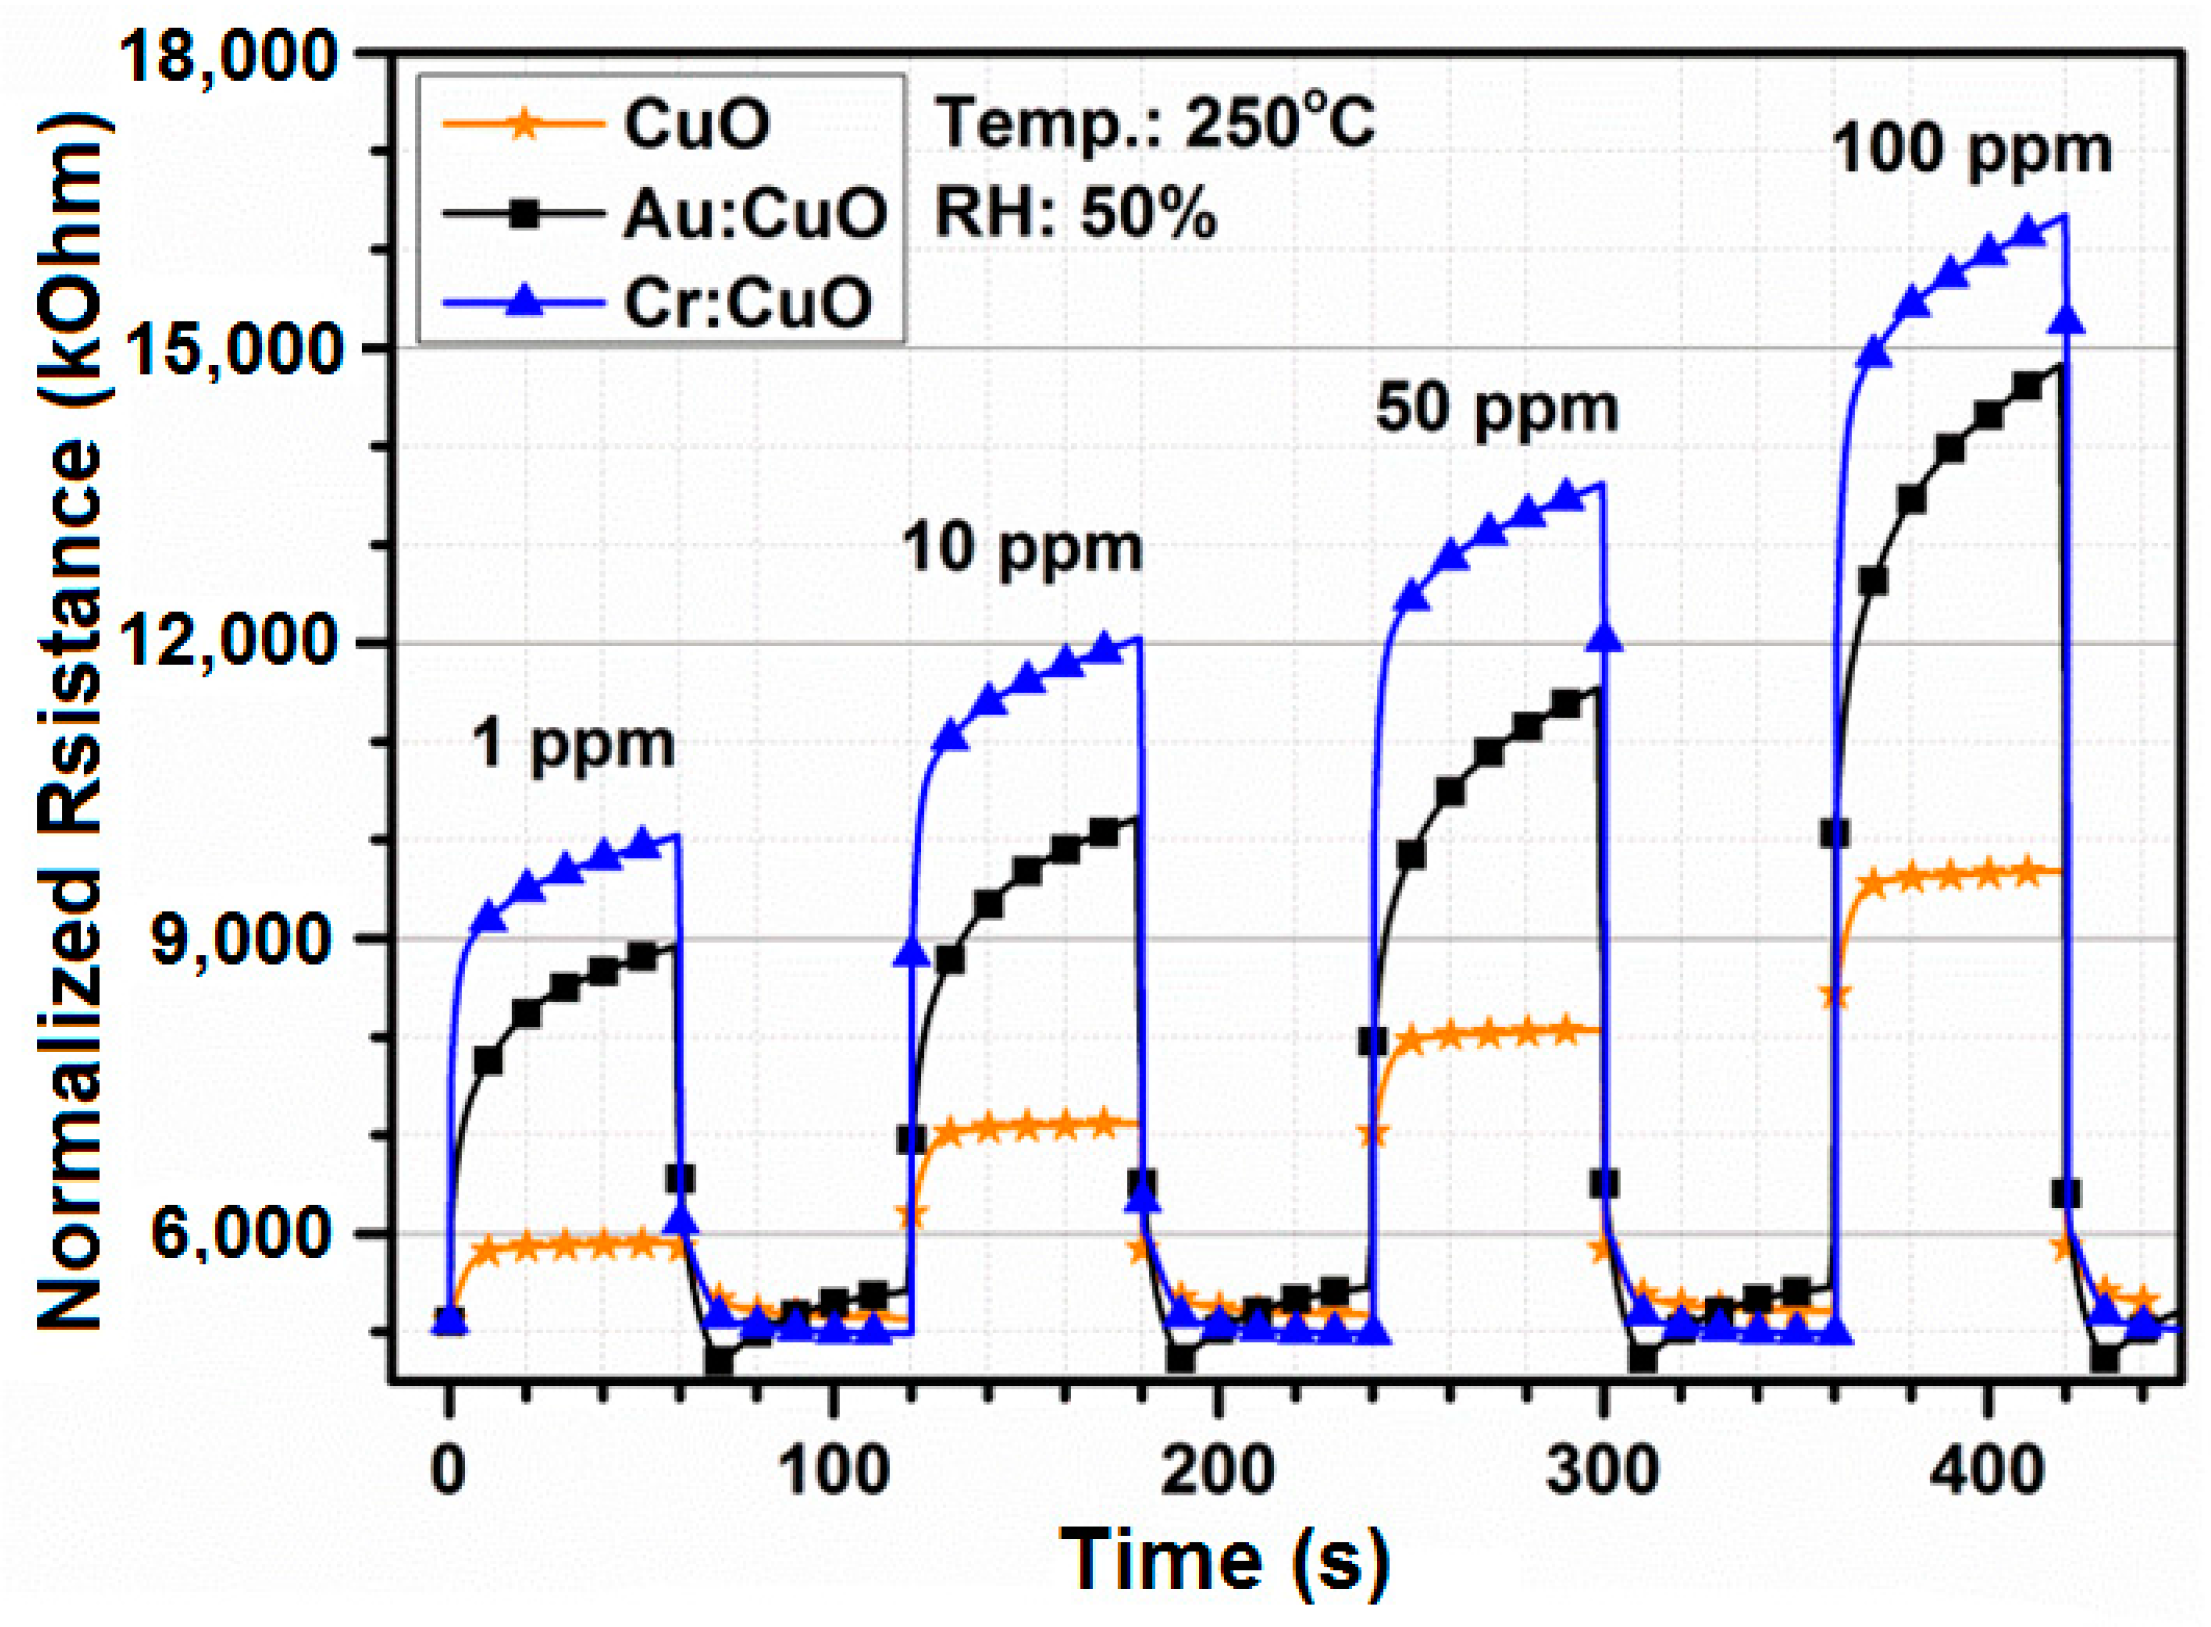
3.4. Gas Sensing Properties


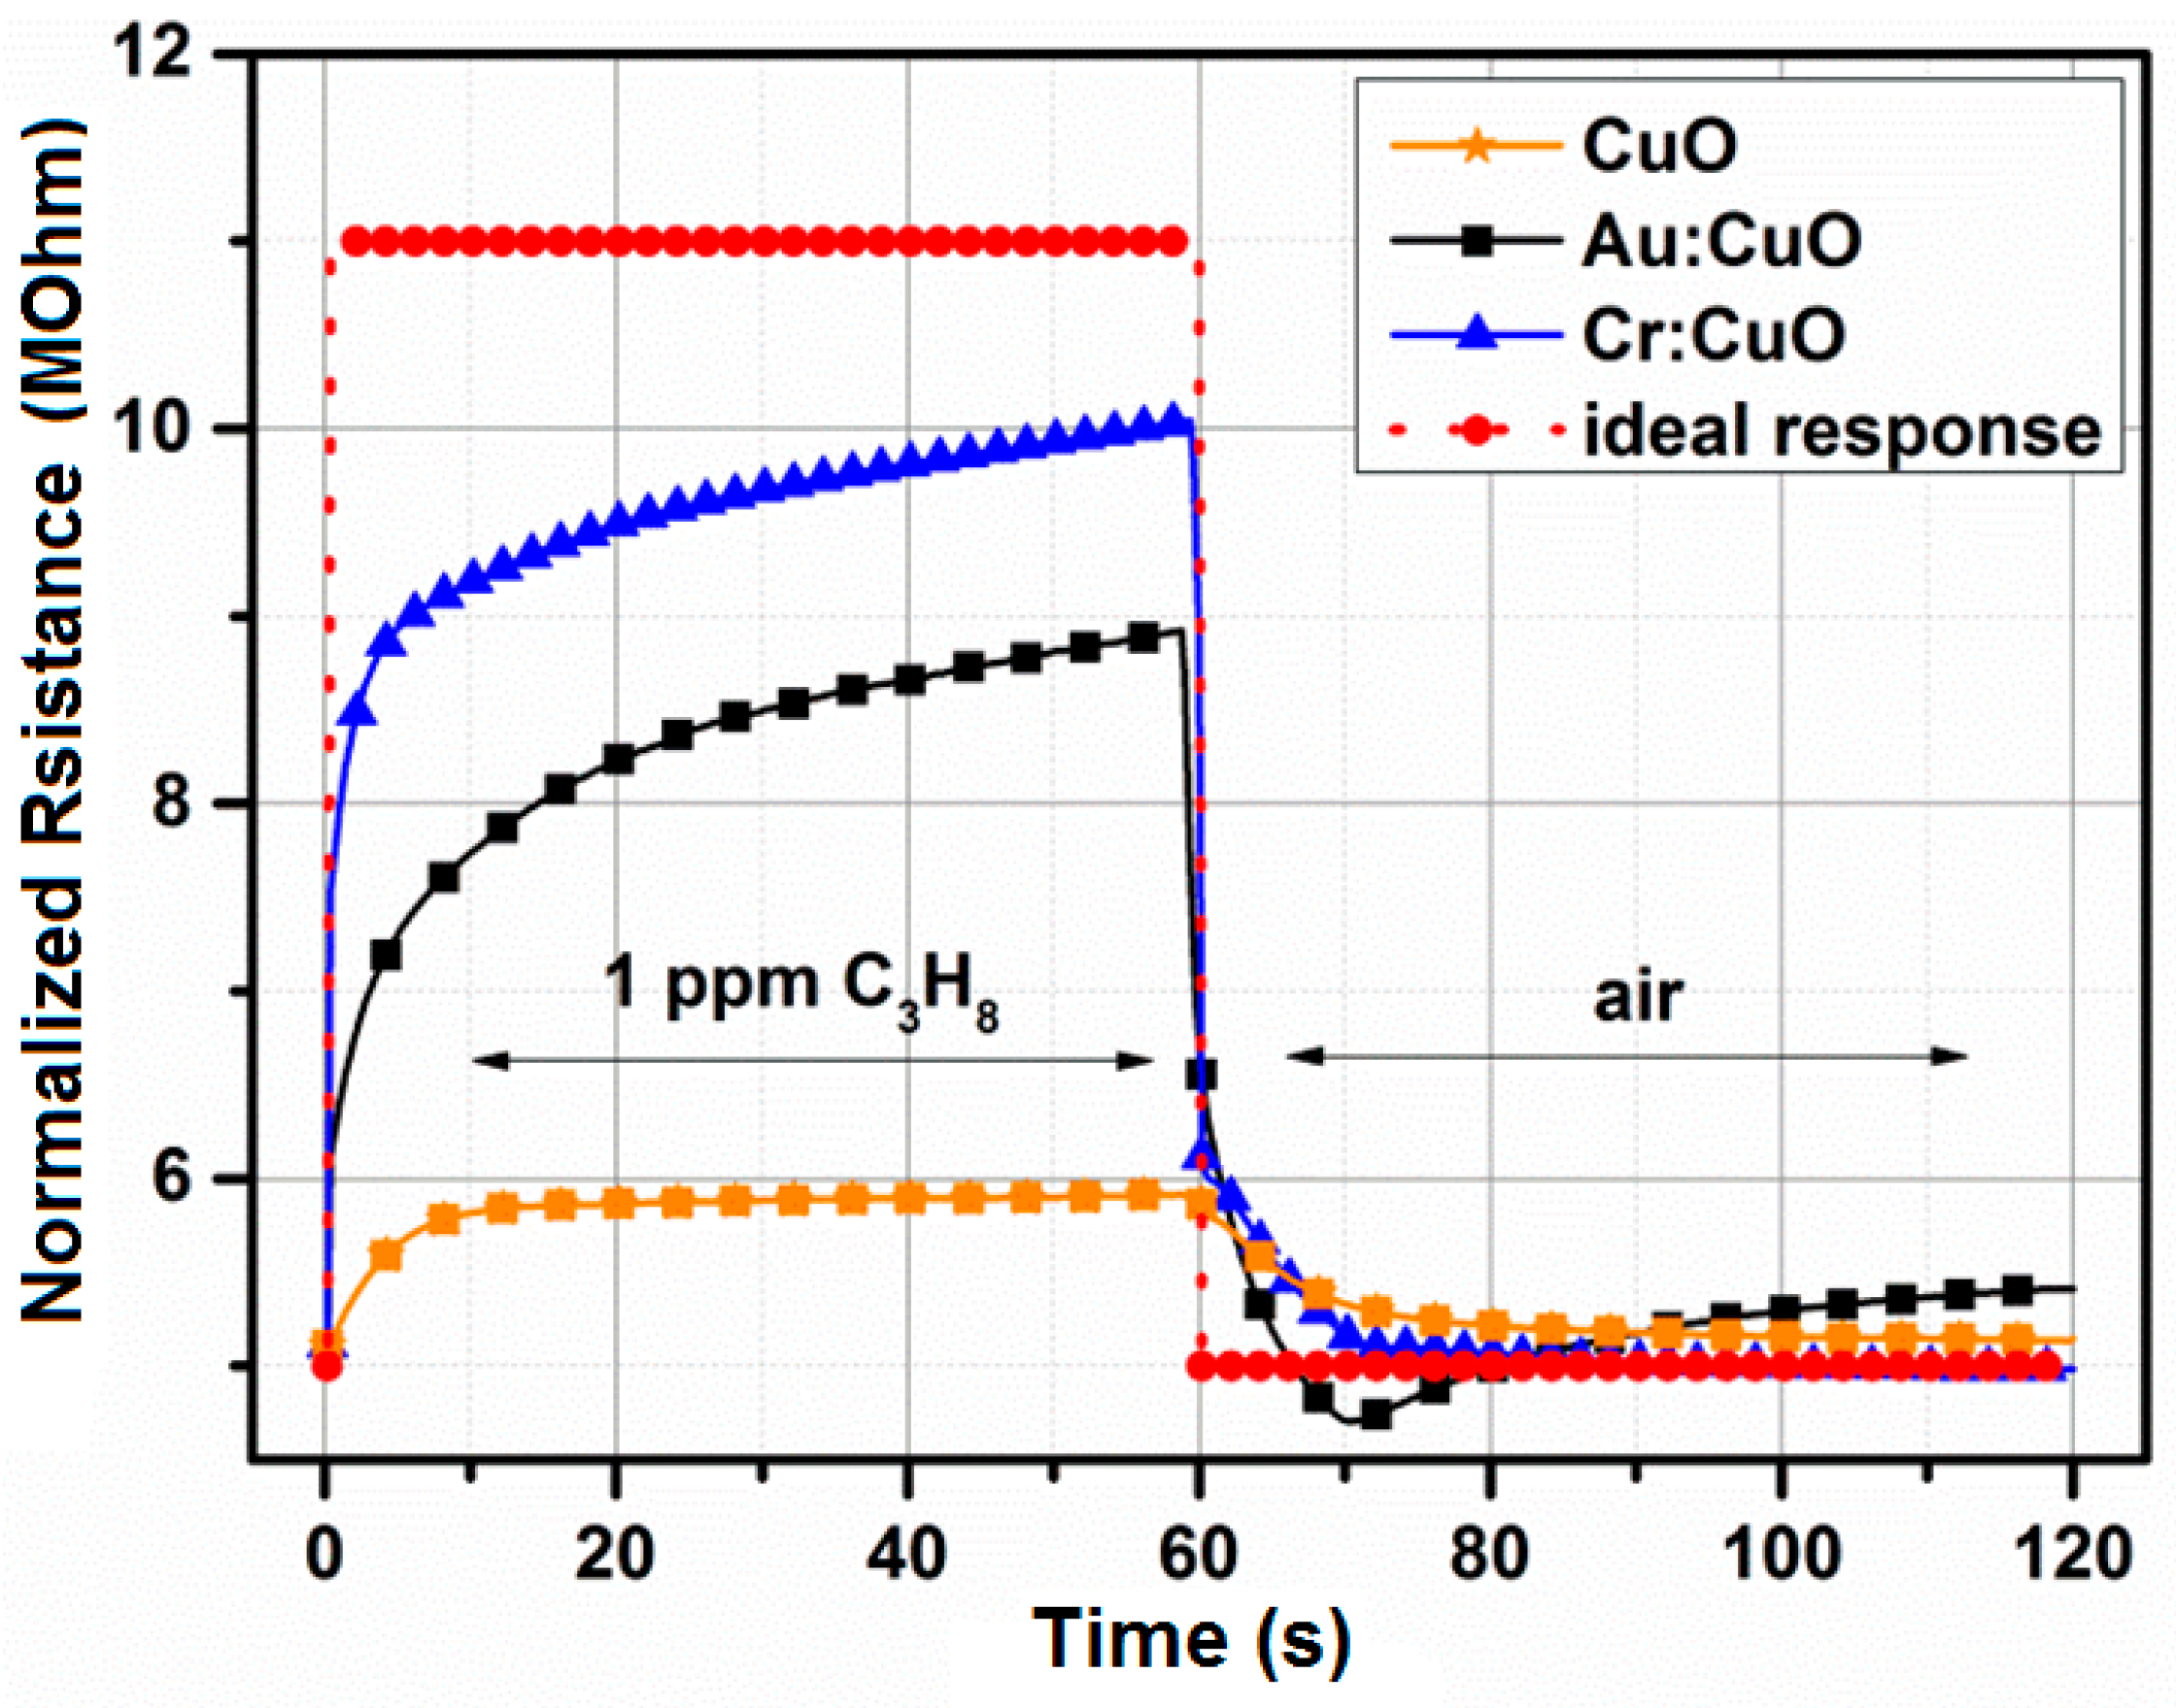
3.5. Response-Recovery Characteristics
| Thin Film | C3H8 (1 ppm) | |
|---|---|---|
| Trecovery (s) | Tresponse (s) | |
| CuO | 20 | 12 |
| Au:CuO | 30 | 34 |
| Ag:CuO | 26 | 18 |
| Cr:CuO | 10 | 24 |
| Pd:CuO | 35 | 15 |
| Pt:CuO | 55 | 12 |
| Sb:CuO | 92 | 30 |
| Si:CuO | 150 | 100 |
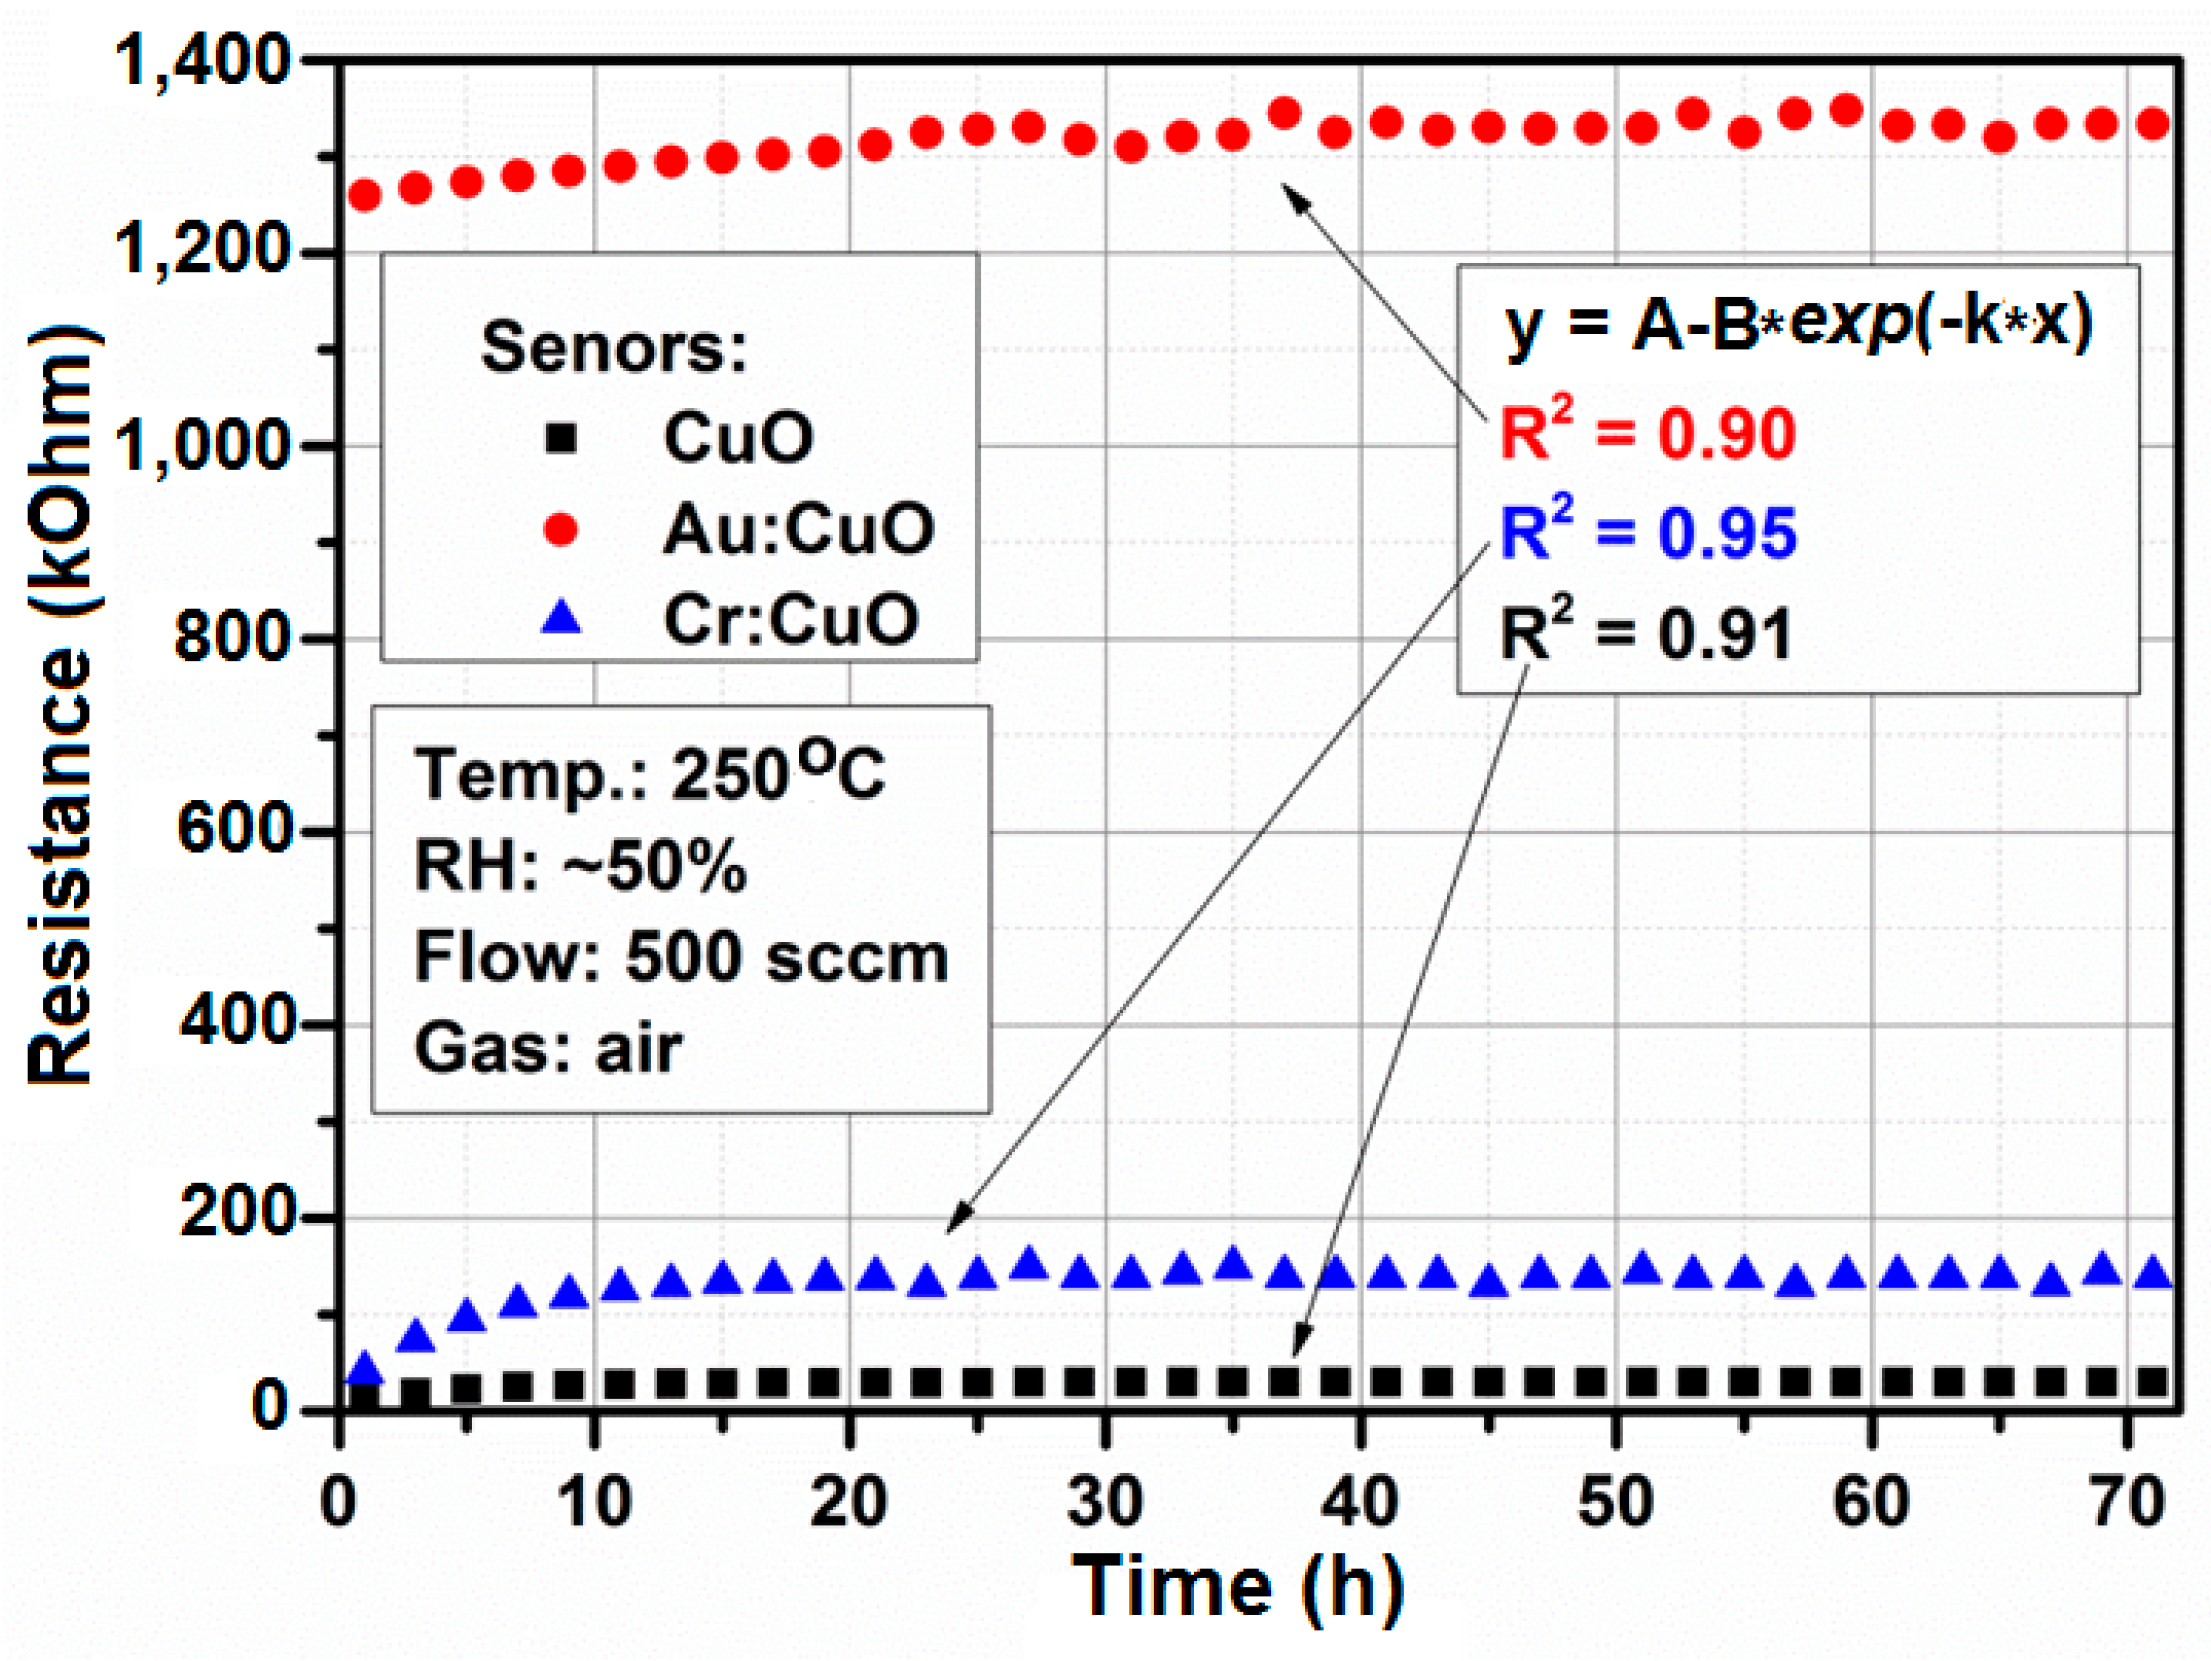
3.6. Long-Term Stability

4. Conclusions
Acknowledgments
Author Contributions
Conflicts of Interest
References
- Dweik, R.A.; Amman, A. Exhaled breath analysis: The new frontier in medical testing. J. Breath Res. 2008, 2, 030301–030303. [Google Scholar] [CrossRef] [PubMed]
- Kostikas, K.; Papaioannou, A.; Tanou, K.; Giouleka, P.; Koutsokera, A.; Minas, M.; Papiris, S.; Gourgoulianis, K.; Taylor, D.; Loukides, S. Exhaled NO and exhaled breath condensate pH in the evaluation of asthma control. Respir. Med. 2011, 105, 526–532. [Google Scholar] [CrossRef] [PubMed]
- Bessa, V.; Darwiche, K.; Teschler, H.; Sommerwerck, U.; Rabis, T.; Baumbach, J.I.; Freitag, L. Detection of volatile organic compounds (VOCs) in exhaled breath of patients with chronic obstructive pulmonary disease (COPD) by ion mobility spectrometry. Int. J. Ion Mobil. Spectrom. 2011, 14, 7–13. [Google Scholar] [CrossRef]
- Schmekel, B.; Winquist, F.; Vilkstrom, A. Analysis of breath samples for lung cancer survival. Anal. Chim. Acta 2014, 640, 82–86. [Google Scholar] [CrossRef] [PubMed]
- Minh, T.D.C.; Blake, D.R.; Galassetti, P.R. The clinical potential of exhaled breath analysis for diabetes mellitus. Diabetes Res. Clin. Pract. 2012, 97, 195–205. [Google Scholar] [CrossRef] [PubMed]
- Philips, M.; Cataneo, R.; Cheema, T.; Greenberg, J. Increased breath biomarkers of oxidative stress in diabetes mellitus. Clin. Chim. Acta 2004, 344, 189–194. [Google Scholar] [CrossRef] [PubMed]
- Buszewski, B.; Kesy, M.; Ligor, T.; Amman, A. Human exhaled air analytics: Biomarkery of diseases. Biomed. Chromatogr. 2007, 21, 553–566. [Google Scholar] [CrossRef] [PubMed]
- Frank Kneepkens, C.M.; Lepage, G.; Roy, C.C. The potential of the hydrocarbon breath test as a measure of lipid peroxidation. Free Radic. Biol. Med. 1994, 17, 127–160. [Google Scholar] [CrossRef]
- Barker, M.; Hengst, M.; Schmid, J.; Buers, H.-J.; Mittermaier, B.; Klemp, D.; Koppmann, R. Volatile organic compounds in the exhaled breath of young patients with cystic fibrosis. Eur. Respir. J. 2006, 27, 929–936. [Google Scholar] [CrossRef] [PubMed]
- Kulikov, V.Y.; Ruyatkina, L.A.; Sorokin, M.Y.; Shabanova, E.S.; Baldin, M.N.; Gruznov, V.M.; Efimenko, A.P.; Petrovsky, D.V.; Shnaider, E.P.; Moshkin, M.P. Concentration of light hydrocarbons in exhaled air depending on metabolic syndrome risk factors. Hum. Physiol. 2011, 37, 329–333. [Google Scholar] [CrossRef]
- Kischkel, S.; Miekisch, W.; Sawacki, A.; Sarker, E.M.; Trefz, P.; Amman, A.; Schubert, J.K. Breath biomarkers for lung cancer detection and assessment of smoking related effects—Confounding variables, influence of normalization and statistical algorithms. Clin. Chim. Acta 2010, 411, 1637–1644. [Google Scholar] [CrossRef] [PubMed]
- Rudnicka, J.; Kowalkowski, T.; Ligor, T.; Buszewski, B. Determination of volatile organic compounds as biomarkers of lung cancer by SPME-GC-TOF/MS and chemometrics. J. Chromatogr. B 2011, 879, 3360–3366. [Google Scholar] [CrossRef] [PubMed]
- Bujak, R.; Struck-Lewicka, W.; Markuszewski, M.J.; Kaliszan, R. Metabolomics for laboratory diagnostics. J. Pharm. Biomed. Anal. 2015. [Google Scholar] [CrossRef] [PubMed]
- Oliaee, S.N.; Khodadadi, A.; Mortazavi, Y.; Alipur, S. Highly selective Pt/SnO2 sensor to propane or methane in presence of CO and ethanol, using gold nanoparticles on Fe2O3 catalytic filter. Sens. Actuators B Chem. 2010, 147, 400–405. [Google Scholar] [CrossRef]
- Chai, G.Y.; Lupan, O.; Rusu, E.V.; Stratan, G.I.; Ursaki, V.V.; Sontea, V.; Khallaf, H.; Chow, L. Functionalized individual ZnO microwire for natural gas detection. Sens. Actuators A Phys. 2012, 176, 64–71. [Google Scholar] [CrossRef]
- Izu, N.; Oh-hori, N.; Shin, W.; Matsubara, I.; Murayama, N.; Itou, M. Response properties of resistive oxygen sensors using Ce1-xZrxO2 (x = 0.05, 0.10) thick films in propane combustion gas. Sens. Actuators B Chem. 2008, 130, 105–109. [Google Scholar] [CrossRef]
- Aguilar-Leyva, J.; Maldonado, A.; de la, L.; Olivera, M. Gas-sensing characteristics of undoped-SnO2 thin films and Ag/SnO2, and SnO2/Ag structures in a propane atmosphere. Mater. Charact. 2007, 58, 740–744. [Google Scholar] [CrossRef]
- Castro, R.H.R.; Hidalgo, P.; Perez, H.E.M.; Ramirez-Fernandez, F.J.; Gouvea, D. Relationship between surface segregation and rapid propane electrical response in Cd-doped SnO2 nanomaterials. Sens. Actuators B Chem. 2008, 133, 263–269. [Google Scholar] [CrossRef]
- Saberi, M.H.; Mortazavi, Y.; Khodadadi, A.A. Dual selective Pt/SnO2 sensor to CO and propane in exhaust gases of gasoline engine susing Pt/LaFeO3 filter. Sens. Actuators B Chem. 2015, 206, 617–623. [Google Scholar] [CrossRef]
- Sun, F.; Li, X.; Liu, L.; Wang, J. Novel Zn-M-O (M = Sn, Co) sensing electrodes for selective mixed potential CO/C3H8 sensor. Sens. Actuators B Chem. 2013, 184, 220–227. [Google Scholar] [CrossRef]
- Liu, Y.; Lei, Y. Pt-CeO2 nanofibres based high-frequency impedancemetric gas sensor for selective CO and C3H8 detection in high-temperature harsh environment. Sens. Actuators B Chem. 2013, 188, 1141–1147. [Google Scholar] [CrossRef]
- Rydosz, A.; Maziarz, W.; Pisarkiewicz, T. Formation a uniform temperature distribution in semiconductor resistance gas sensors in LTCC technology. Electr. Rev. 2011, 87, 249–252. [Google Scholar]
- Rydosz, A. Amorphous and nanocrystalline magnetron sputtered CuO thin films deposited on low temperature cofired ceramics substrates for gas sensor applications. IEEE Sens. J. 2014, 14, 1600–1607. [Google Scholar] [CrossRef]
- Korotcenkov, G. Metal oxides for solid-state gas sensors: What determines our choice? Mater. Sci. Eng. B 2007, 139, 1–23. [Google Scholar] [CrossRef]
- Yamazoe, N.; Schimanoe, K. Basic approach to the transducer function of oxide semiconductor gas sensors. Sens. Actuators B Chem. 2011, 160, 1352–1362. [Google Scholar] [CrossRef]
- Cheng, S.-L.; Chen, M.-F. Fabrication, characterization, and kinetic study of vertical single-crystalline CuO nanowires on Si substrates. Nanoscale Res. Lett. 2012, 7, 1–7. [Google Scholar] [CrossRef] [PubMed]
- Shao, C.; Chang, Y.; Long, Y. High performance of nanostructured ZnO film gas sensor at room temperature. Sens. Actuators B Chem. 2014, 204, 666–672. [Google Scholar] [CrossRef]
- Tian, S.; Lou, S.; Zhou, S. Monoclinic α-Ag2S hollow nanospheres: Promising candidates for ethanol gas sensors at room-temperature. Mater. Lett. 2014, 137, 382–384. [Google Scholar] [CrossRef]
- Kim, K.-M.; Jeong, H.-M.; Kim, H.-R.; Choi, K.-I.; Kim, H.-J.; Lee, J.-H. Selective detection of NO2 using Cr-doped CuO Nanorods. Sensors 2012, 12, 8013–8025. [Google Scholar] [CrossRef] [PubMed]
- Kida, T.; Kuroiwa, T.; Yuasa, M.; Shimanoe, K.; Yamazoe, N. Study on the response and recovery properties of semiconductor gas sensors using a high-speed gas-switching system. Sens. Actuators B Chem. 2008, 134, 928–933. [Google Scholar] [CrossRef]
- Savovic, S.; Djordjevich, A. Finite difference solution of the diffusion equation describing the response and recovery of thin film semiconductor gas sensors. Sens. Actuators B Chem. 2012, 166–167, 200–204. [Google Scholar] [CrossRef]
- Park, H.J.; Choi, N.-J.; Kang, H.; Jung, M.Y.; Park, J.W.; Park, K.H.; Lee, D.-S. A ppb-level formaldehyde gas sensor based on CuO-nanocubes prepared using a polyol process. Sens. Actuators B Chem. 2014, 203, 282–288. [Google Scholar] [CrossRef]
- Liang, X.; Kim, T.-H.; Yoon, J.-W.; Kwak, C.-H.; Lee, J.-H. Ultrasensitive and ultraselective detection of H2S using electruspun CuO-loaded In2O3 nanofiber sensors assisted by pulse heating. Sens. Actuators B Chem. 2015, 209, 934–942. [Google Scholar] [CrossRef]
- Kim, H.; Jin, C.; Park, S.; Kim, S.; Lee, C. H2S gas sensing properties of bare and Pd-functionalized CuO nanorods. Sens. Actuators B Chem. 2012, 161, 594–599. [Google Scholar] [CrossRef]
- Abaker, M.; Dar, G.N.; Umar, A.; Zaidi, S.A.; Ibrahim, A.; Baskoutas, S.; Al-Hajry, A. CuO nanocubes based higly-sensitive 4-nitrophenol chemical sensor. Sci. Adv. Mater. 2012, 4, 893–900. [Google Scholar] [CrossRef]
- Abaker, M.; Umar, A.; Baskoutas, S.; Kim, S.H.; Hwang, S.W. Structural and optical properties of CuO layered hexagonal discs synthesized by a low-temperature hydrothermal process. J. Phys. D Appl. Phys. 2011, 44, 773–780. [Google Scholar] [CrossRef]
© 2015 by the authors; licensee MDPI, Basel, Switzerland. This article is an open access article distributed under the terms and conditions of the Creative Commons Attribution license (http://creativecommons.org/licenses/by/4.0/).
Share and Cite
Rydosz, A.; Szkudlarek, A. Gas-Sensing Performance of M-Doped CuO-Based Thin Films Working at Different Temperatures upon Exposure to Propane. Sensors 2015, 15, 20069-20085. https://doi.org/10.3390/s150820069
Rydosz A, Szkudlarek A. Gas-Sensing Performance of M-Doped CuO-Based Thin Films Working at Different Temperatures upon Exposure to Propane. Sensors. 2015; 15(8):20069-20085. https://doi.org/10.3390/s150820069
Chicago/Turabian StyleRydosz, Artur, and Aleksandra Szkudlarek. 2015. "Gas-Sensing Performance of M-Doped CuO-Based Thin Films Working at Different Temperatures upon Exposure to Propane" Sensors 15, no. 8: 20069-20085. https://doi.org/10.3390/s150820069