
A Comparative Study on the Suitability of Smartphones and IMU for Mobile, Unsupervised Energy Expenditure Calculi

 ,
,
Abstract
:1. Introduction
2. Related Work
3. Energy Expenditure Assessment
- The use of digital counters to accrue the number of times the signal crosses a preset threshold.
- The use of an algorithm to determine the maximum value for a selected period of time.
- The use of the area under the curve (integration) algorithm.
4. Experiment Description
4.1. Previous/Original Experimentation
4.2. Current Experiment
- To design an experiment taking into account reasonable precautions, such as the simultaneous synchronization and measurement from each device in order to avoid any kind of bias or noise that could lead to erroneous conclusions;
- To perform several types of activities using five different accelerometers to measure the EE of these physical activities;
- To discuss the results, in order to find out whether there are any situations/contexts where it is appropriate to use one accelerometer or another depending on the PA;
- To determine which features of the accelerometers account for differences in the estimation of the EE of a series of daily life activities.
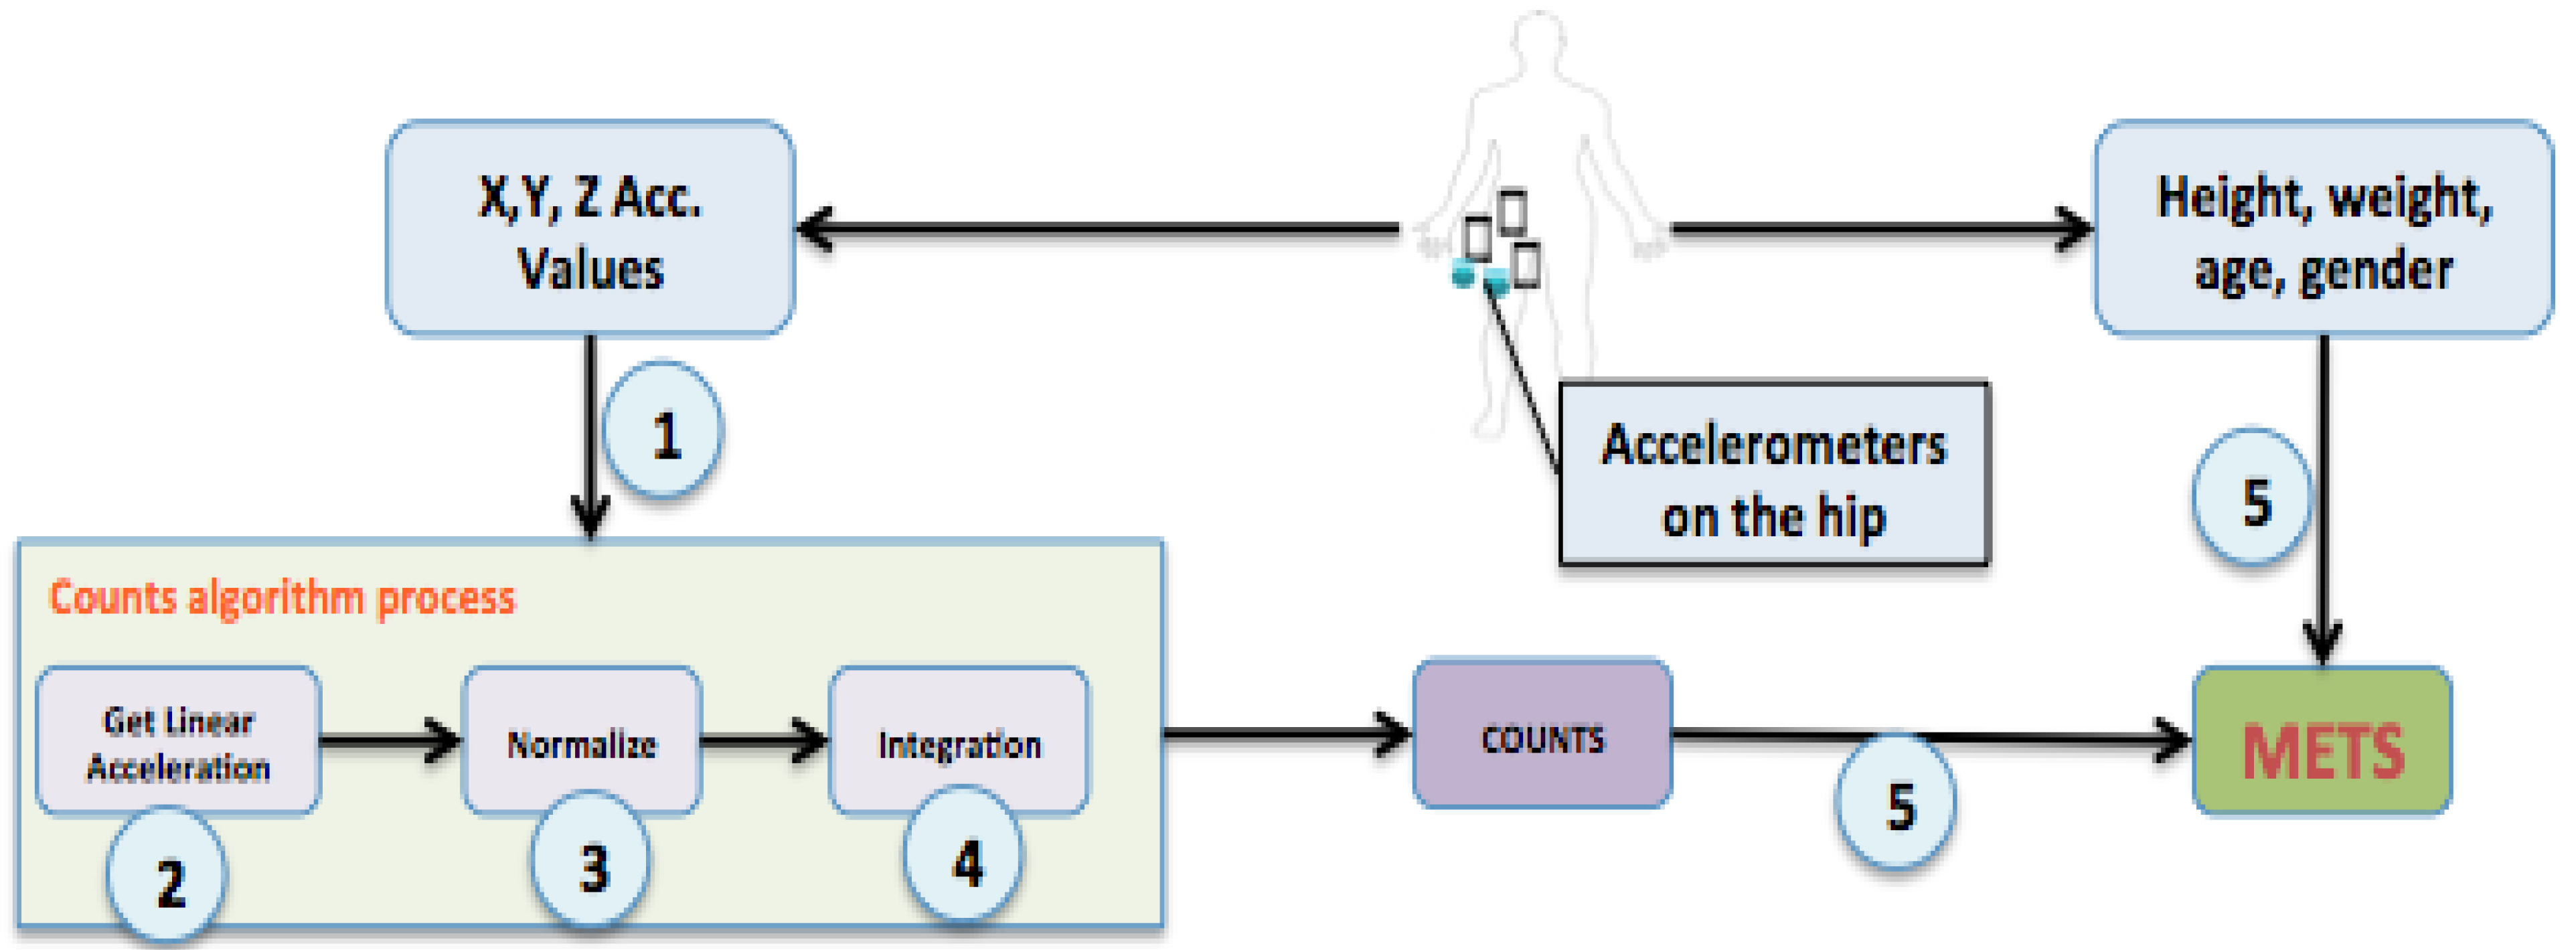
4.3. Energy Expenditure Estimation Procedure
- Obtain the x, y, z axis values from the accelerometer (raw data) for a period of time, i.e., the duration of the physical activity.
- There are many accelerometers on the market with values ranging from ±2 g, to ±16 g, through ±4 g, ±8 g, etc. in idle status, where g is the gravitational acceleration of an object on Earth. It is therefore necessary to filter the data obtained from each accelerometer so that the measures given can be normalized and this is a usual way of proceeding in research literature [22]. In particular, we applied a low-pass filter to isolate gravitational acceleration and a high-pass filter to remove gravity and obtain linear accelerationalpha = 0.8;//low-pass filtergravity_x = alpha * gravity_x + (1 – alpha) * x_value;gravity_y = alpha * gravity_y + (1 – alpha) * y_value;gravity_z = alpha * gravity_z + (1 – alpha) * z_value;//high-pass filterlinear_x = x_value – gravity_x;linear_y = y_value – gravity_y;linear_z = z_value – gravity_z;
- The linear acceleration values obtained in the previous step are normalized to obtain a representative positive value for each data recorded by the accelerometer as the values may range from negative to positive:
- Although the number of counts represents the amount of physical activity, in order to estimate the EE, other physiological user values such as height, weight, gender and age are considered. We used previously validated formulas [27] to obtain a good EE estimation (in METs units) from the number of counts and physiological information.
4.4. Study Activities, Subjects and Devices

| Subjects | Five Subjects: 1 Female: 20–40 Years Old 4 Males: 20–40 Years Old |
|---|---|
| Location(s) | Hip |
| Activities | Sweeping the floor Watching TV or Using the computer Walking at 4 km/h (treadmill) |
| Duration of the activities | 60 s |
| Experiment schedule | All subjects performed the same physical activities in the same order: Watching TV Sweeping the floor Walking at 4 km/h |
| Sensors | Five sensors: Smartphone 1 (Google Nexus): 15 Hz (−16 to 16 g) Smartphone 2 (Samsung Galaxy S3): 5 Hz (−16 to 16 g) Smartphone 3 (LG L9): 20 Hz (−16 to 16 g) Bluetooth Sensor 1 (SensorTag): 1 Hz (−2 to 2 g) Bluetooth Sensor 2 (Zephyr Bioharness 3): 50 Hz (−16 to 16 g) |

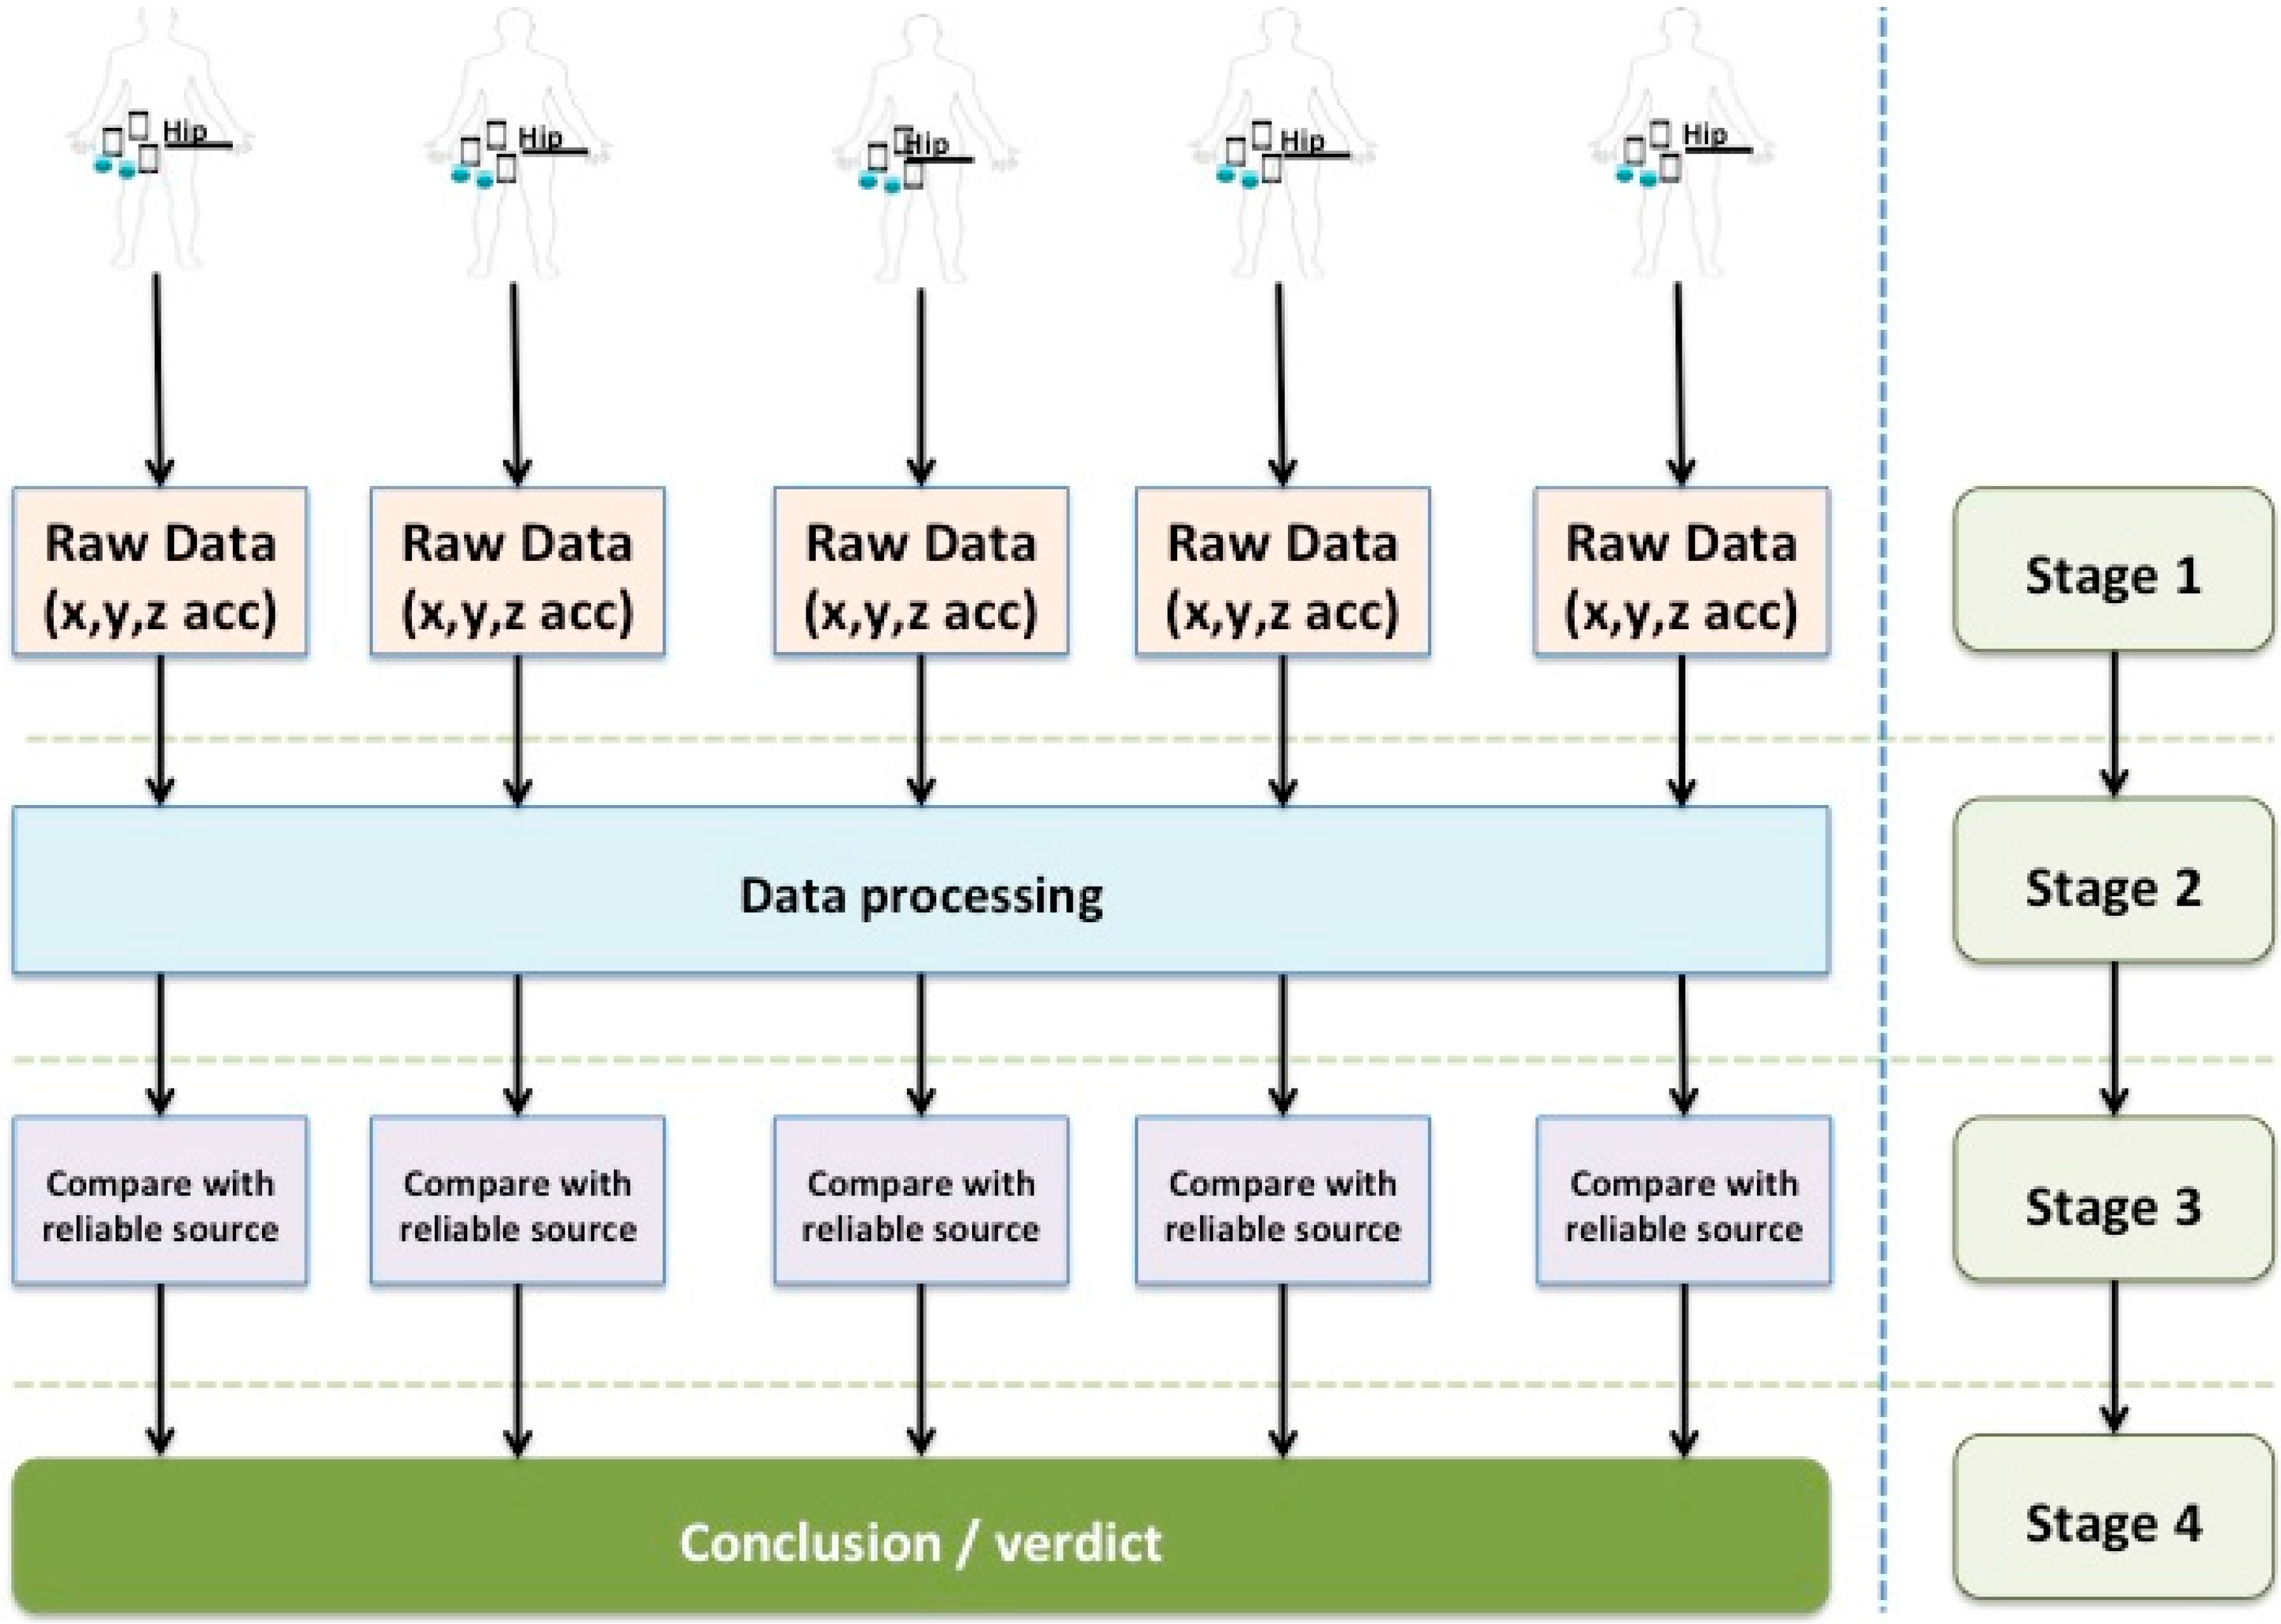
Stage 1: “In-the-Wild” Study

Stage 2: Data Processing
- the total number of values in each file (a file represents the values from one sensor in one physical activity for 60 s).
- the number of counts applying the algorithm procedure presented in Figure 1, using a fixed interval with two values. This variable should be adjusted according to the features of the devices and type of activities.
- the number of METs using the research formulas [27].
Stage 3: Results Review
Stage 4: Conclusions/Verdict
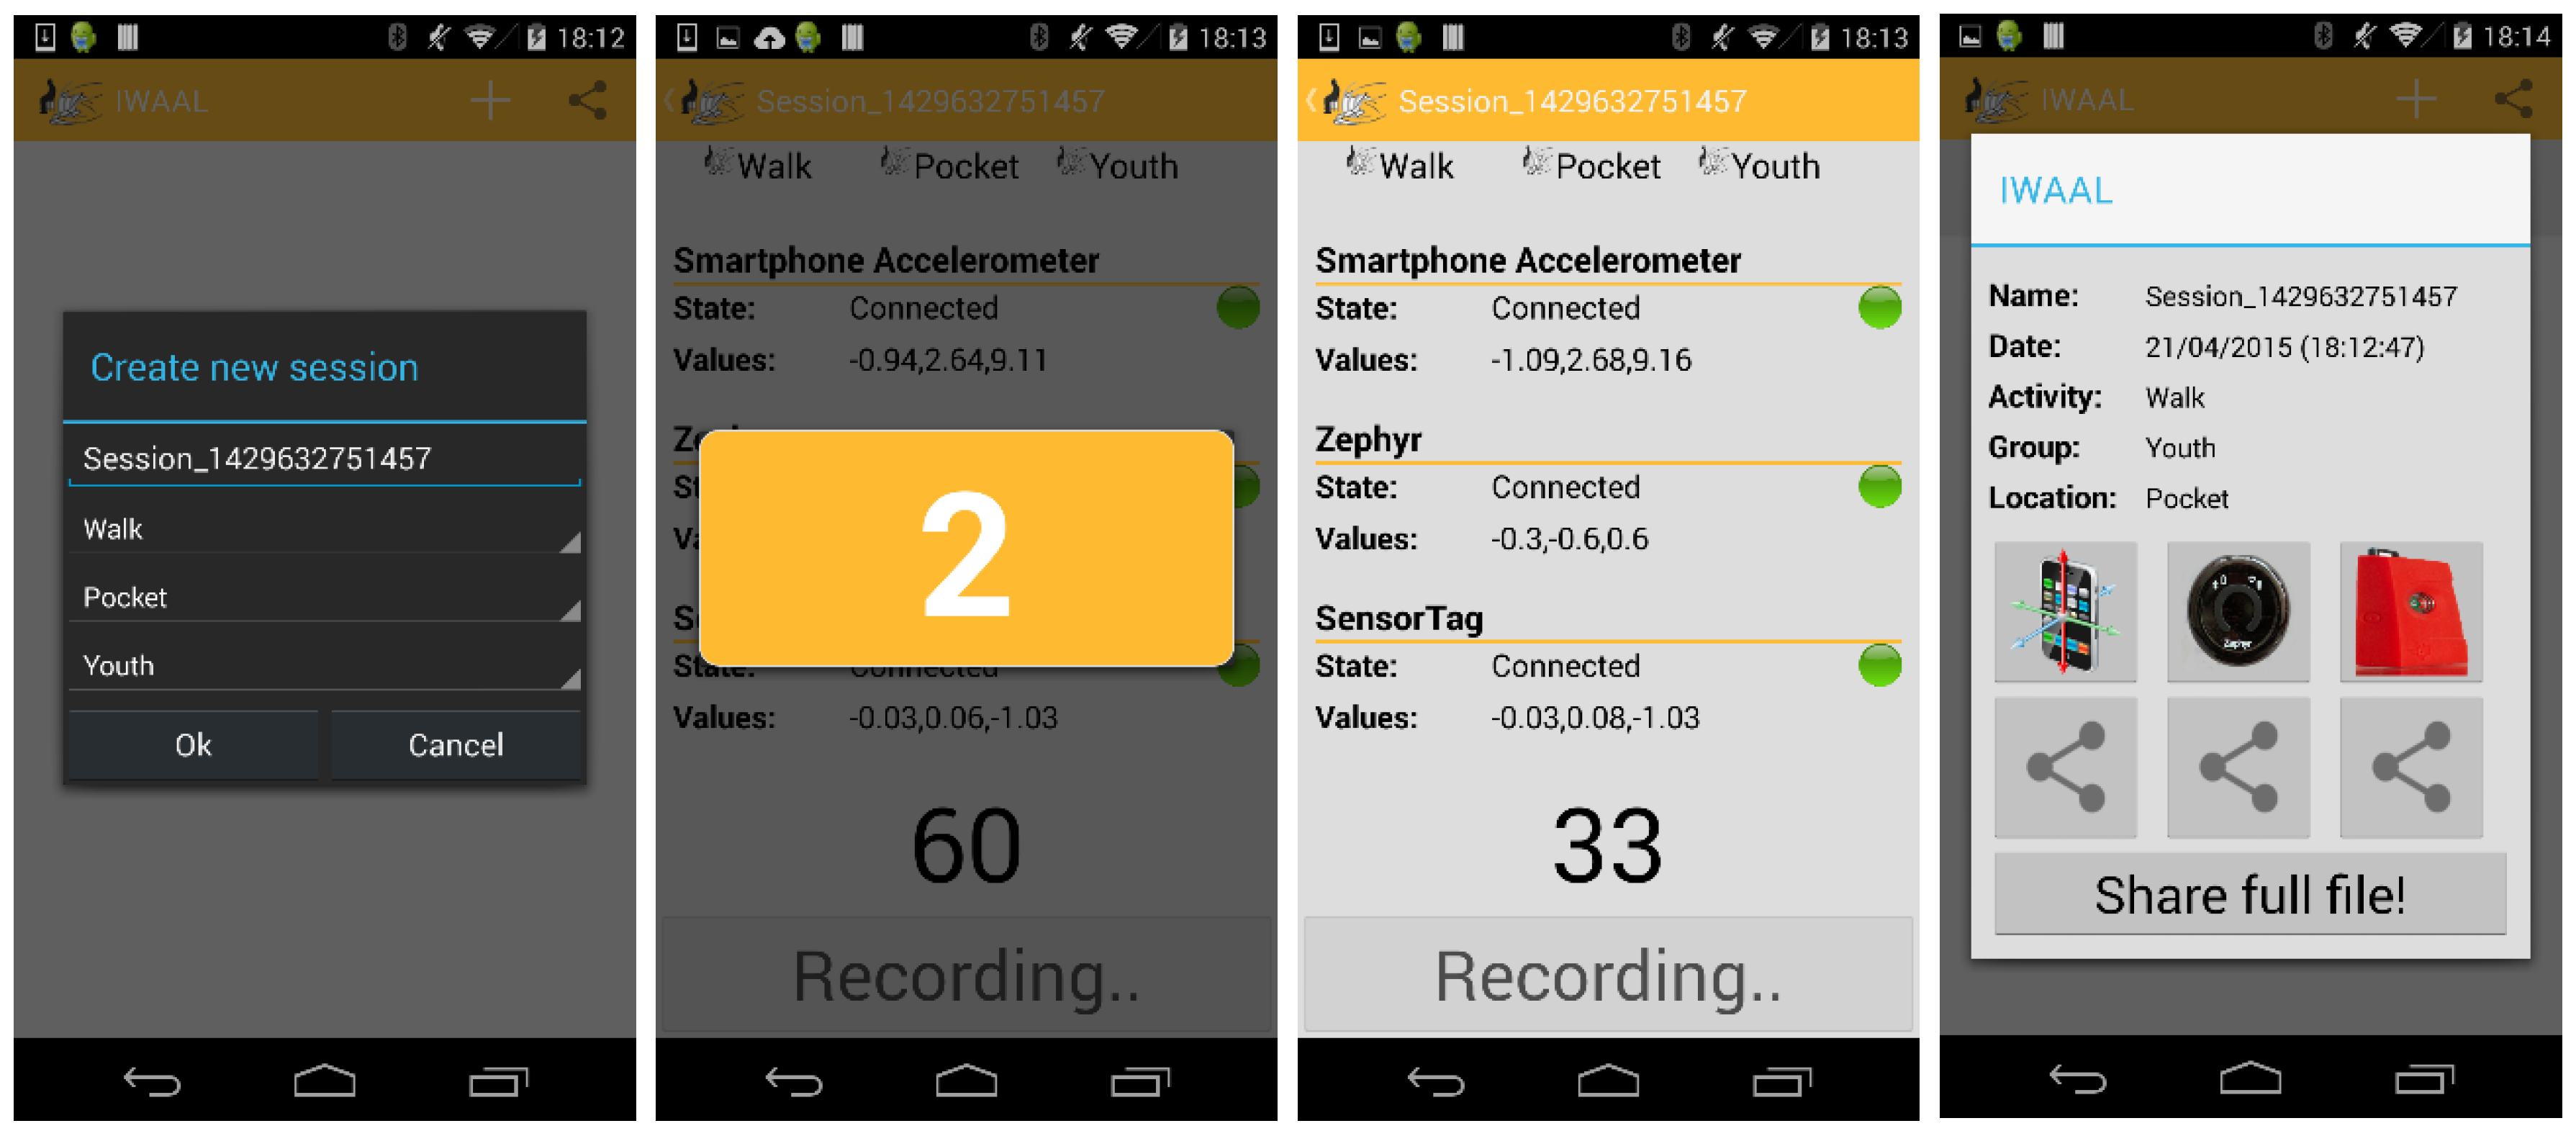
- A custom Android application was developed to ensure proper data management and proper connection with the sensors and information obtained from the wireless sensors (Figure 3). The application used some software components (to handle Bluetooth and the management of the data) of an open mobile platform [28].
- The application had a 3-second countdown to ensure that no data was lost and a warning sound to signal the end of monitoring (second picture of Figure 3).
- In order to be useful for future studies, the application specifies the physical activity to be performed (watching TV, walking, sweeping the floor, etc.), the location of the smartphone (chest, leg, arm, etc.) and the user’s age group (young person, adult, elderly person, etc.) (first picture in Figure 3). For the experiments conducted in this study, the second and third options were always the hip and young person, respectively. These options do not affect data collection and are only used so that the csv files can easily be classified with the raw data.
- Each raw data unit (x,y,z) from the different accelerometers has a timestamp to avoid duplicating data for transmission problems.
- Custom desktop-software was developed in order to process all the raw data obtained by the Android application. This software implements the EE estimation procedure described in Section 4.3.
- All the experiments were conducted with the devices worn on the same part of the hip.
5. Results and Discussion
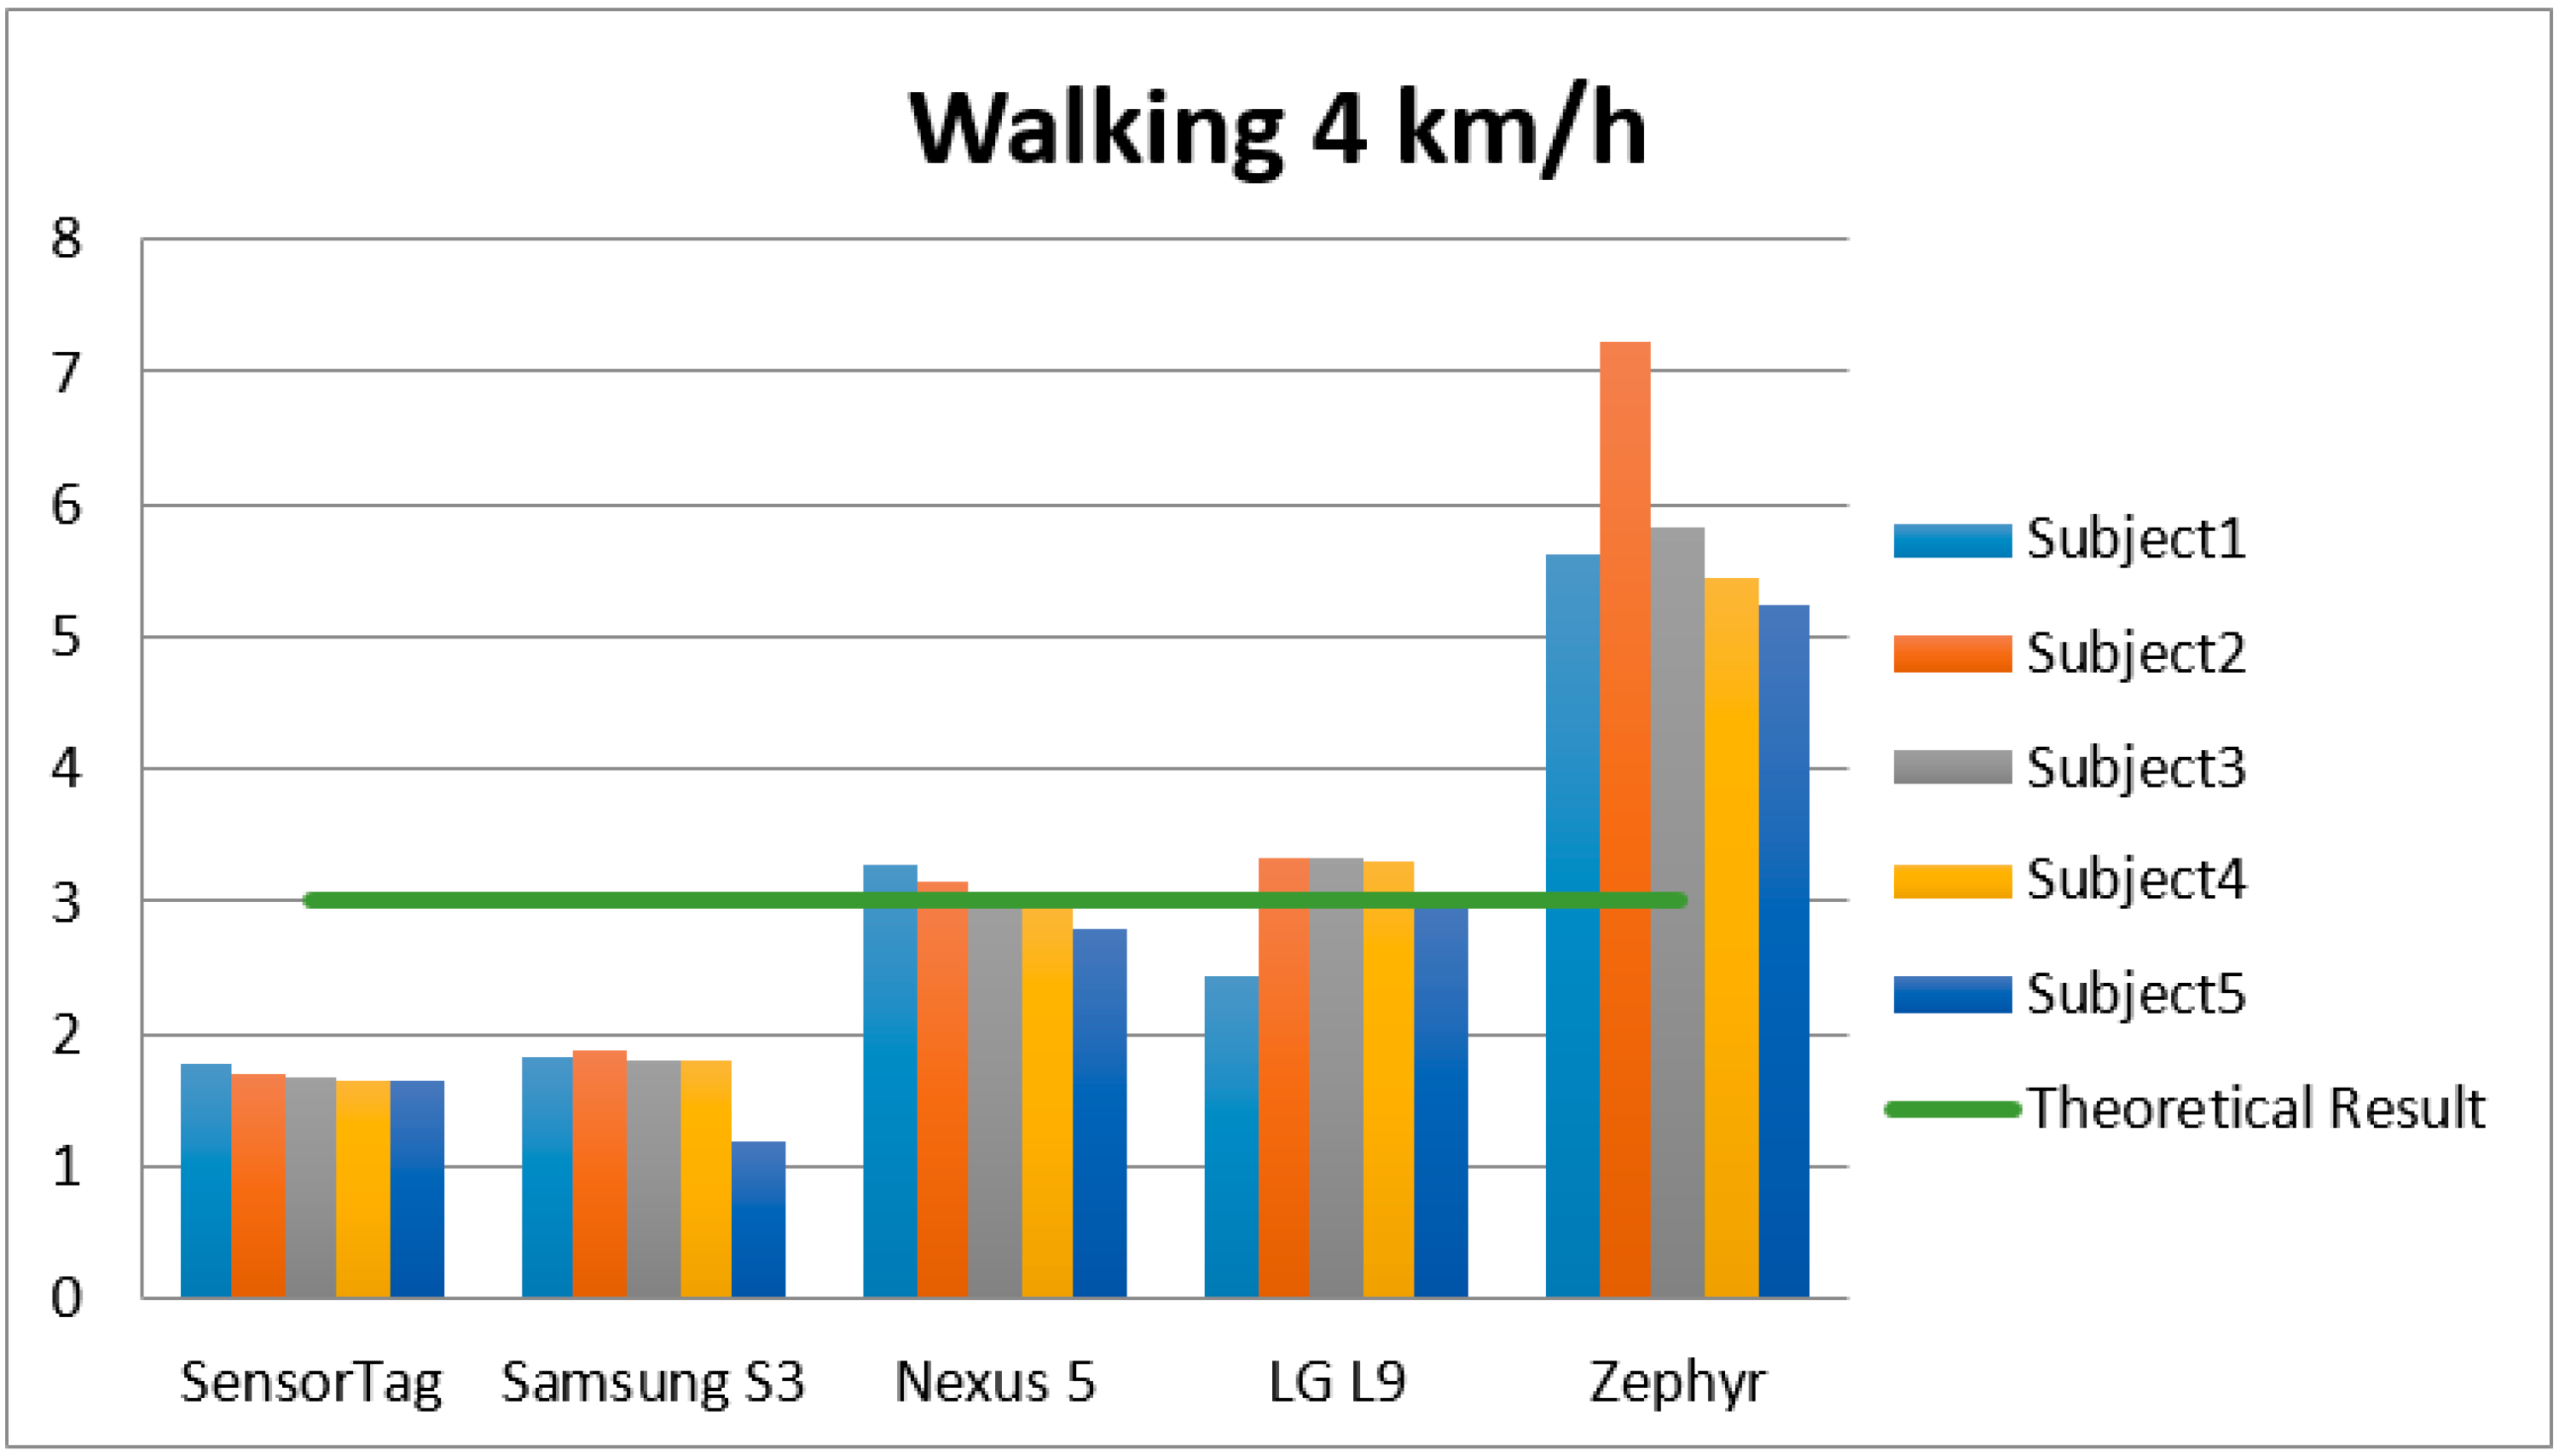
| Walking 4 km/h | Subject 1 | Subject 2 | Subject 3 | Subject 4 | Subject 5 | |||||
|---|---|---|---|---|---|---|---|---|---|---|
| Count | MET | Count | MET | Count | MET | Count | MET | Count | MET | |
| Nexus | 2624 | 3.27 | 2443 | 3.15 | 2199 | 2.99 | 2126 | 2.94 | 1913 | 2.8 |
| Samsung | 455 | 1.84 | 508 | 1.88 | 392 | 1.80 | 398 | 1.80 | 365 | 1.78 |
| LG L9 | 1350 | 2.43 | 2722 | 3.33 | 2728 | 3.34 | 2687 | 3.31 | 2243 | 3.02 |
| Zephyr | 6190 | 5.61 | 8632 | 7.22 | 6524 | 5.83 | 5936 | 5.45 | 5643 | 5.25 |
| SensorTag | 343 | 1.77 | 225 | 1.69 | 189 | 1.67 | 170 | 1.65 | 186 | 1.66 |
| Sweeping the Floor | Subject 1 | Subject 2 | Subject 3 | Subject 4 | Subject 5 | ||||||
|---|---|---|---|---|---|---|---|---|---|---|---|
| Count | MET | Count | MET | Count | MET | Count | MET | Count | MET | ||
| Nexus | 1323 | 2.41 | 1034 | 2.22 | 1230 | 2.35 | 838 | 2.09 | 882 | 2.12 | |
| Samsung | 376 | 1.79 | 325 | 1.76 | 413 | 1.81 | 282 | 1.73 | 360 | 1.78 | |
| LG L9 | 1516 | 2.54 | 1154 | 2.30 | 1149 | 2.30 | 833 | 2.09 | 1069 | 2.25 | |
| Zephyr | 3719 | 3.99 | 1711 | 2.67 | 2718 | 3.33 | 2129 | 2.94 | 2315 | 3.06 | |
| SensorTag | 121 | 1.62 | 95 | 1.60 | 118 | 1.62 | 93 | 1.60 | 122 | 1.62 | |
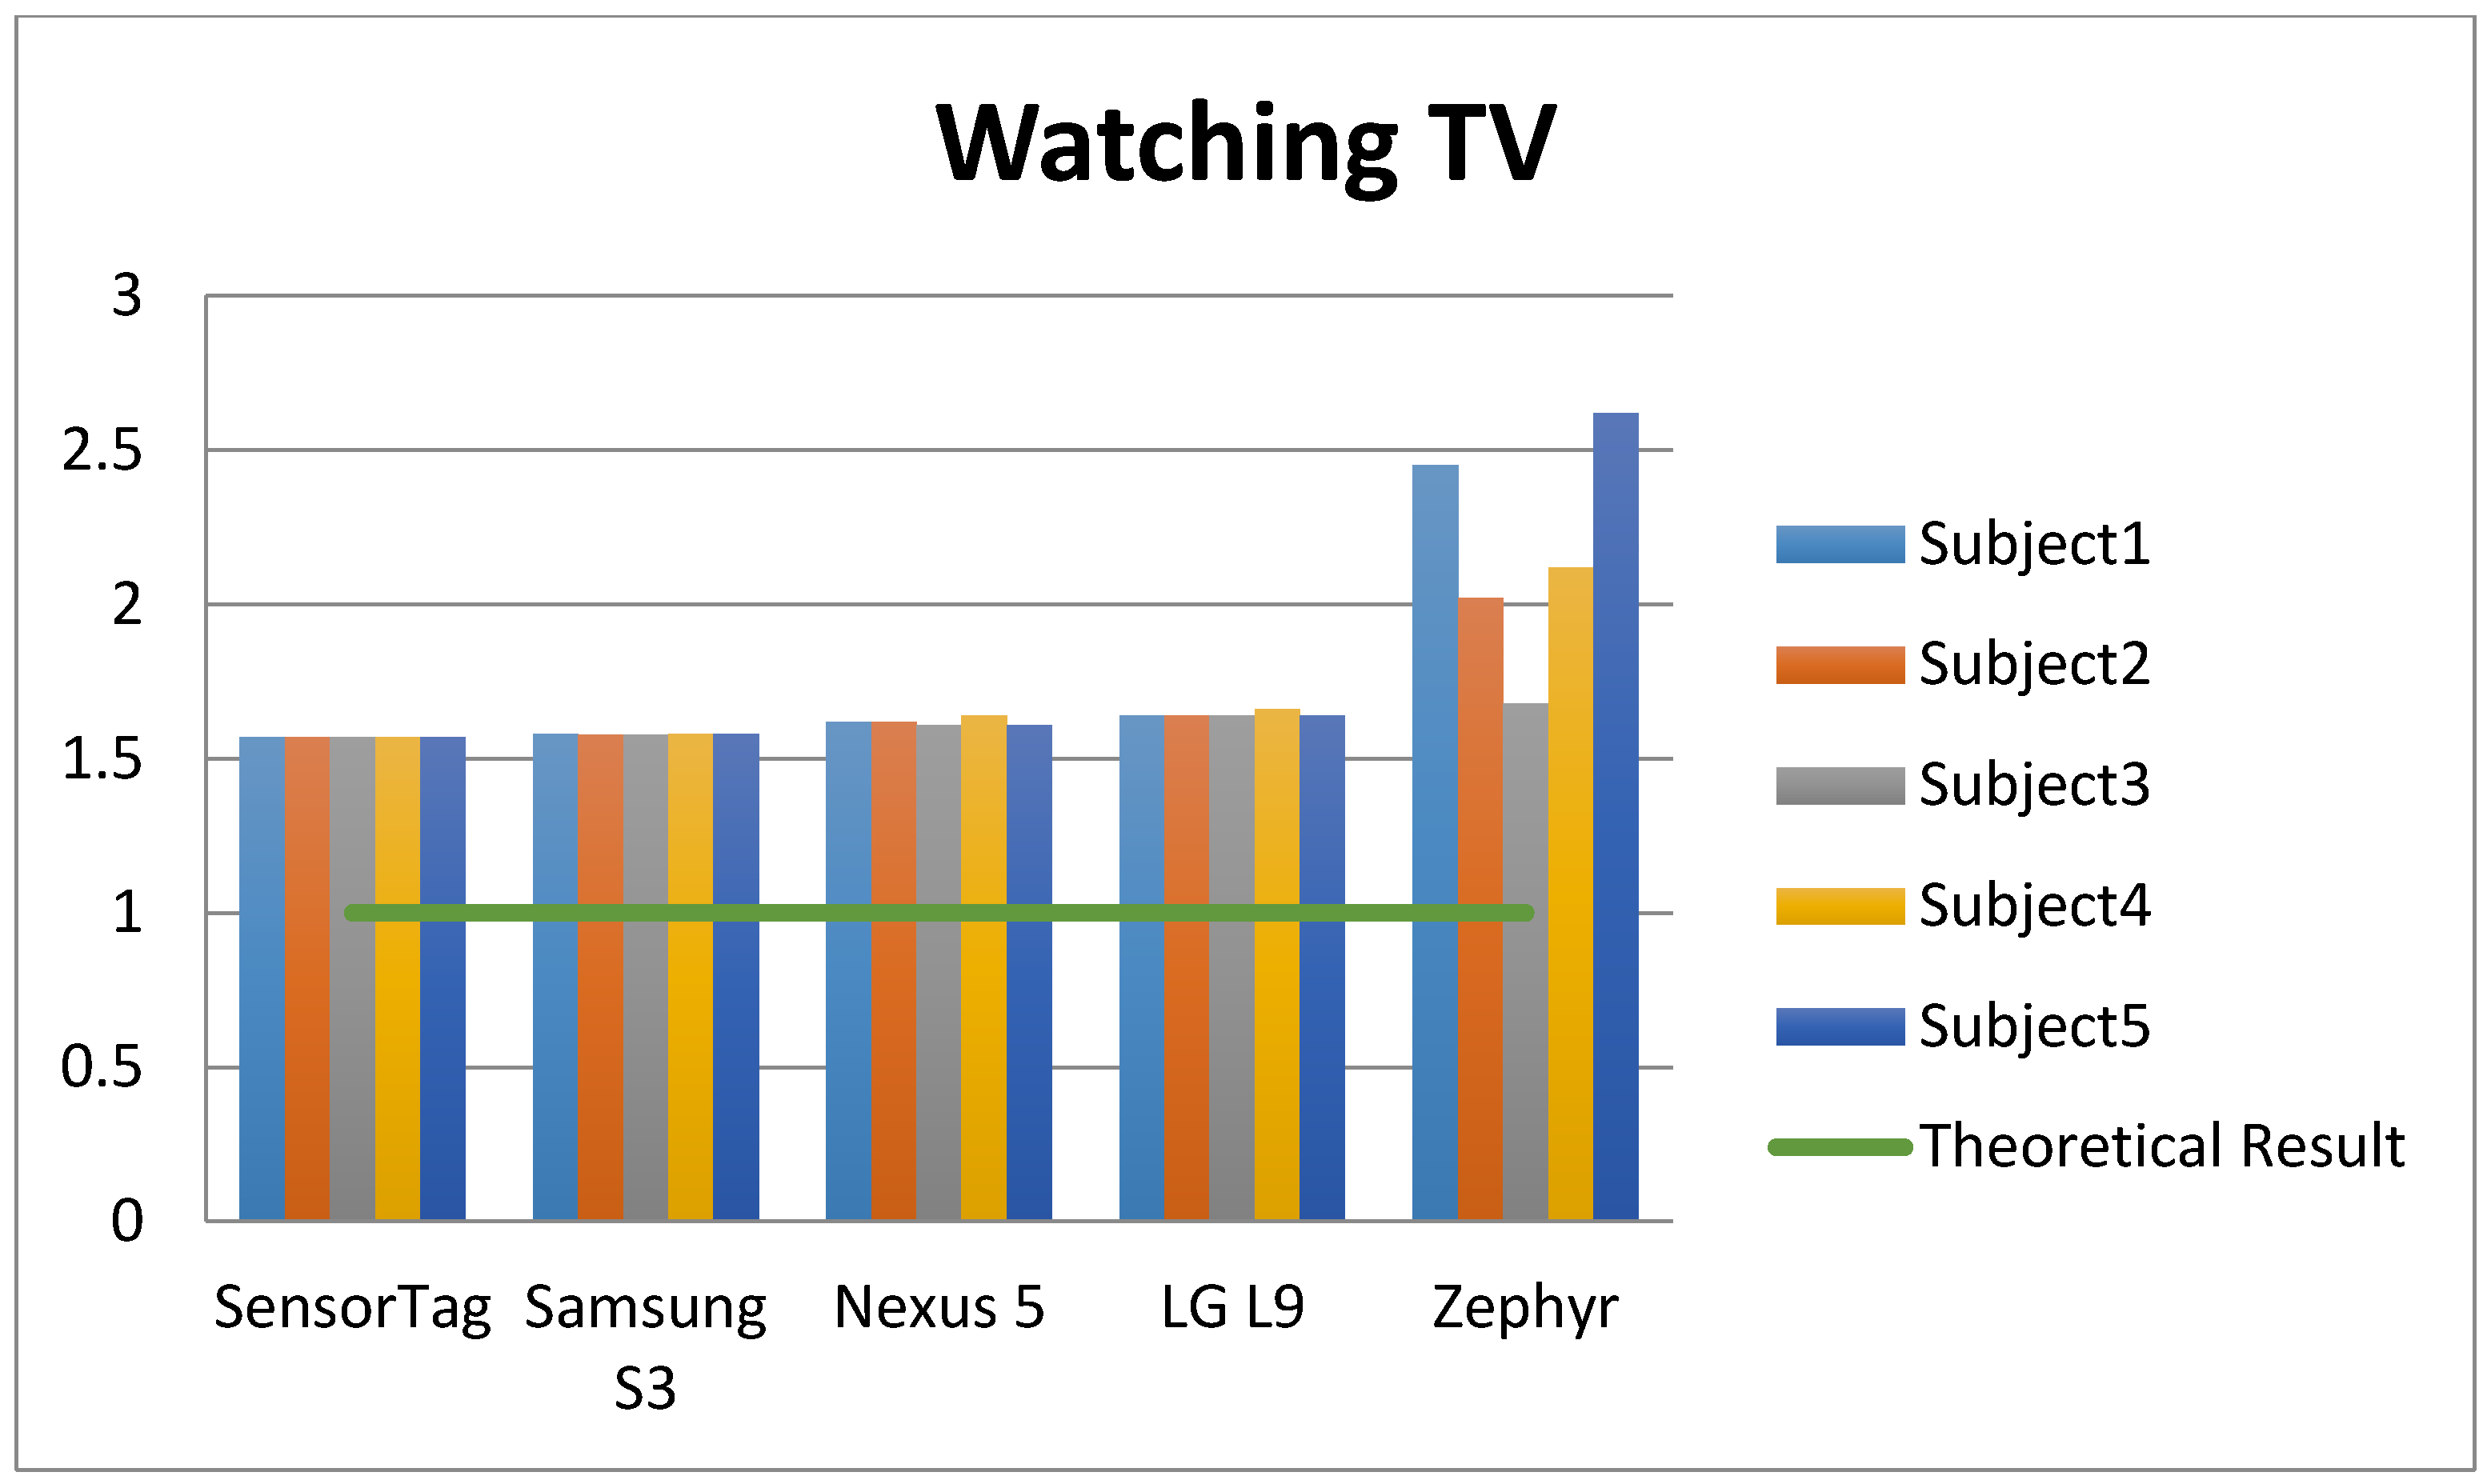
| Watching TV | Subject 1 | Subject 2 | Subject 3 | Subject 4 | Subject 5 | ||||||
|---|---|---|---|---|---|---|---|---|---|---|---|
| Count | MET | Count | MET | Count | MET | Count | MET | Count | MET | ||
| Nexus 5 | 126 | 1.62 | 112 | 1.62 | 102 | 1.61 | 143 | 1.64 | 105 | 1.61 | |
| Samsung | 58 | 1.58 | 48 | 1.57 | 48 | 1.57 | 60 | 1.58 | 56 | 1.58 | |
| LG | 155 | 1.64 | 151 | 1.64 | 152 | 1.64 | 178 | 1.66 | 142 | 1.64 | |
| Zephyr | 1381 | 2.45 | 720 | 2.02 | 208 | 1.68 | 883 | 2.12 | 1641 | 2.62 | |
| SensorTag | 43 | 1.57 | 40 | 1.57 | 42 | 1.57 | 44 | 1.57 | 41 | 1.57 | |


6. Conclusions
Acknowledgments
Author Contributions
Conflicts of Interest
References
- United States Department of Health & Human Services. Physical Activity and Health: A Report of the Surgeon General; DIANE Publishing: Darby, PA, USA, 1996.
- Kolbe-Alexander, T.L.; Lambert, E.V.; Harkins, J.B.; Ekelund, U. Comparison of two methods of measuring physical activity in South African older adults. J. Aging Phys. Act. 2006, 14, 98–114. [Google Scholar] [PubMed]
- Oshima, Y.; Kawaguchi, K.; Tanaka, S.; Ohkawara, K.; Hikihara, Y.; Ishikawa-Takata, K.; Tabata, I. Classifying household and locomotive activities using a triaxial accelerometer. Gait Posture 2010, 31, 370–374. [Google Scholar] [CrossRef] [PubMed]
- Jette, M.; Sidney, K.; Blümchen, G. Metabolic equivalents (METS) in exercise testing, exercise prescription, and evaluation of functional capacity. Clin. Cardiol. 1990, 13, 555–565. [Google Scholar] [CrossRef] [PubMed]
- Ainsworth, B.E.; Haskell, W.L.; Whitt, M.C.; Irwin, M.L.; Swartz, A.M.; Strath, S.J.; Leon, A.S. Compendium of physical activities: An update of activity codes and MET intensities. Med. Sci. Sports Exerc. 2000, 32, 498–504. [Google Scholar] [CrossRef]
- Byrne, N.M.; Hills, A.P.; Hunter, G.R.; Weinsier, R.L.; Schutz, Y. Metabolic equivalent: one size does not fit all. J. Appl. Phys. 2005, 99, 1112–1119. [Google Scholar] [CrossRef] [PubMed]
- Montoye, H.J.; Kemper, H.C.; Washburn, R.A.; Saris, W.H.M. Measuring physical activity and energy expenditure. Hum. Kinet. 1996, 61, 42–71. [Google Scholar]
- Albinali, F.; Intille, S.; Haskell, W.; Rosenberger, M. Using wearable activity type detection to improve physical activity energy expenditure estimation. In Proceedings of the 12th ACM International Conference on Ubiquitous Computing, Copenhagen, Denmark, 26–29 September 2010; pp. 311–320.
- Stewart, A.L.; Mills, K.M.; King, A.C.; Haskell, W.L.; Gillis, D.; Ritter, P.L. CHAMPS physical activity questionnaire for older adults: Outcomes for interventions. Med. Sci. Sports Exerc. 2001, 33, 1126–1141. [Google Scholar] [CrossRef] [PubMed]
- Freedson, P.S.; Lyden, K.; Kozey-Keadle, S.; Staudenmayer, J. Evaluation of artificial neural network algorithms for predicting METs and activity type from accelerometer data: Validation on an independent sample. J. Appl. Phys. 2011, 111, 1804–1812. [Google Scholar] [CrossRef] [PubMed]
- Bonomi, A.G.; Goris, A.H.; Yin, B.; Westerterp, K.R. Detection of type, duration, and intensity of physical activity using an accelerometer. Med. Sci. Sports Exerc. 2009, 41, 1770–1777. [Google Scholar] [CrossRef] [PubMed]
- Mathie, M.J.; Coster, A.C.; Lovell, N.H.; Celler, B.G. Accelerometry: Providing an integrated, practical method for long-term, ambulatory monitoring of human movement. Phys. Meas. 2004, 25, 1–20. [Google Scholar] [CrossRef]
- Yang, C.C.; Hsu, Y.L. A review of accelerometry-based wearable motion detectors for physical activity monitoring. Sensors 2010, 10, 7772–7788. [Google Scholar] [CrossRef] [PubMed]
- Chen, K.Y.; Bassett, D.R. The technology of accelerometry-based activity monitors: Current and future. Med. Sci. Sports Exerc. 2005, 37, 490–500. [Google Scholar] [CrossRef]
- Calloway, D.H.; Zanni, E. Energy requirements and energy expenditure of elderly men. Am. J. Clin. Nutr. 1980, 33, 2088–2092. [Google Scholar] [PubMed]
- Volp, A.P.; Oliveira, F.E.; Alves, R.D.; Esteves, E.A.; Bressan, J. Energy expenditure: Components and evaluation methods. Nutr. Hosp. 2011, 26, 430–440. [Google Scholar]
- Garatachea, N.; Torres Luque, G.; Gonzalez Gallego, J. Physical activity and energy expenditure measurements using accelerometers in older adults. Nutr. Hosp. 2010, 25, 224–230. [Google Scholar] [PubMed]
- Bourke, A.K.; Prescher, S.; Koehler, F.; Cionca, V.; Tavares, C.; Gomis, S.; Nelson, J. Embedded fall and activity monitoring for a wearable ambient assisted living solution for older adults. In Proceedings of the 34th Annual International Conference of the IEEE, San Diego, CA, USA, 28 August–1 September 2012; pp. 248–251.
- Goran, M.I.; Poehlman, E.T. Endurance training does not enhance total energy expenditure in healthy elderly persons. Am. J. Phys. 1992, 263, 950–957. [Google Scholar]
- Clegg, A.; Young, J.; Iliffe, S.; Rikkert, M.O.; Rockwood, K. Frailty in elderly people. Lancet 2013, 381, 752–762. [Google Scholar] [CrossRef]
- Lee, I.M.; Shiroma, E.J. Using accelerometers to measure physical activity in large-scale epidemiological studies: Issues and challenges. Br. J. Sports Med. 2014, 48, 197–201. [Google Scholar] [CrossRef] [PubMed]
- Rosenberger, M.E.; Haskell, W.L.; Albinali, F.; Mota, S.; Nawyn, J.; Intille, S. Estimating activity and sedentary behavior from an accelerometer on the hip or wrist. Med. Sci. Sports Exerc. 2013, 45, 964–975. [Google Scholar] [CrossRef] [PubMed]
- Crouter, S.E.; Clowers, K.G.; Bassett, D.R. A novel method for using accelerometer data to predict energy expenditure. J. Appl. Phys. 2006, 100, 1324–1331. [Google Scholar] [CrossRef] [PubMed]
- Ruiz-Zafra, Á.; Gonzalez, E.O.; Noguera, M.; Benghazi, K.; Jiménez, J.M.H. Energy expenditure analysis: A comparative research of based on mobile accelerometers. In Ambient Assisted Living and Daily Activities; Springer International Publishing: Cham, Switzerland, 2014; pp. 38–45. [Google Scholar]
- Murphy, S.L. Review of physical activity measurement using accelerometers in older adults: Considerations for research design and conduct. Prev. Med. 2009, 48, 108–114. [Google Scholar] [CrossRef] [PubMed]
- Tallarida, R.J.; Murray, R.B. Area under a curve: Trapezoidal and simpson’s rules. In Manual of Pharmacologic Calculations; Springer: New York, NY, USA, 1987; pp. 77–81. [Google Scholar]
- Santos-Lozano, A.; Santín-Medeiros, F.; Cardon, G.; Torres-Luque, G.; Bailón, R.; Bergmeir, C.; Garatachea, N. Actigraph GT3X: Validation and determination of physical activity intensity cut points. Int. J. Sports Med. 2013, 34, 975–982. [Google Scholar] [CrossRef] [PubMed]
- Ruiz-Zafra, Á.; Benghazi, K.; Noguera, M.; Garrido, J.L. Zappa: An open mobile platform to build cloud-based m-health systems. In Ambient Intelligence-Software and Applications; Springer International Publishing: Cham, Switzerland, 2013; pp. 87–94. [Google Scholar]
- Van Hees, V.T.; Pias, M.; Taherian, S.; Ekelund, U.; Brage, S. A method to compare new and traditional accelerometry data in physical activity monitoring. In Proceedings of the 2010 IEEE International Symposium, Montreal, QC, Canada, 14–17 June 2010; pp. 1–6.
© 2015 by the authors; licensee MDPI, Basel, Switzerland. This article is an open access article distributed under the terms and conditions of the Creative Commons Attribution license (http://creativecommons.org/licenses/by/4.0/).
Share and Cite
Ruiz-Zafra, A.; Orantes-González, E.; Noguera, M.; Benghazi, K.; Heredia-Jimenez, J. A Comparative Study on the Suitability of Smartphones and IMU for Mobile, Unsupervised Energy Expenditure Calculi. Sensors 2015, 15, 18270-18286. https://doi.org/10.3390/s150818270
Ruiz-Zafra A, Orantes-González E, Noguera M, Benghazi K, Heredia-Jimenez J. A Comparative Study on the Suitability of Smartphones and IMU for Mobile, Unsupervised Energy Expenditure Calculi. Sensors. 2015; 15(8):18270-18286. https://doi.org/10.3390/s150818270
Chicago/Turabian StyleRuiz-Zafra, Angel, Eva Orantes-González, Manuel Noguera, Kawtar Benghazi, and Jose Heredia-Jimenez. 2015. "A Comparative Study on the Suitability of Smartphones and IMU for Mobile, Unsupervised Energy Expenditure Calculi" Sensors 15, no. 8: 18270-18286. https://doi.org/10.3390/s150818270