
Fast T Wave Detection Calibrated by Clinical Knowledge with Annotation of P and T Waves


Abstract
:Background
There are limited studies on the automatic detection of T waves in arrhythmic electrocardiogram (ECG) signals. This is perhaps because there is no available arrhythmia dataset with annotated T waves. There is a growing need to develop numerically-efficient algorithms that can accommodate the new trend of battery-driven ECG devices. Moreover, there is also a need to analyze long-term recorded signals in a reliable and time-efficient manner, therefore improving the diagnostic ability of mobile devices and point-of-care technologies.
Methods
Here, the T wave annotation of the well-known MIT-BIH arrhythmia database is discussed and provided. Moreover, a simple fast method for detecting T waves is introduced. A typical T wave detection method has been reduced to a basic approach consisting of two moving averages and dynamic thresholds. The dynamic thresholds were calibrated using four clinically known types of sinus node response to atrial premature depolarization (compensation, reset, interpolation, and reentry).
Results
The determination of T wave peaks is performed and the proposed algorithm is evaluated on two well-known databases, the QT and MIT-BIH Arrhythmia databases. The detector obtained a sensitivity of 97.14% and a positive predictivity of 99.29% over the first lead of the validation databases (total of 221,186 beats).
Conclusions
We present a simple yet very reliable T wave detection algorithm that can be potentially implemented on mobile battery-driven devices. In contrast to complex methods, it can be easily implemented in a digital filter design.
1. Introduction
According to the World Health Organization, cardiovascular diseases (CVDs) are the number one cause of death globally; more people die annually from CVDs than from any other cause [1]. An estimated 17.3 million people died from CVDs in 2008, representing 30% of all global deaths [1]. Of these deaths, an estimated 7.3 million were due to coronary heart disease and 6.2 million were due to stroke [1]. Thus, medical researchers have placed significant importance on cardiac health research. This has led to a strong focus on technological advances with respect to cardiac function assessment. One such research pathway is the improvement of conventional cardiovascular diagnosis technologies used in hospitals and clinics.
The most common clinical cardiac test is electrocardiogram (ECG) analysis as it is simple, risk-free, and inexpensive [2]. The signal of each heart beat contains five main waves: the P, Q, R, S, and T waves. The automatic detection of these waves is critical for reliable cardiovascular assessment, such as diagnosing cardiac arrhythmias [3–6], understanding autonomic regulation of the cardiovascular system during sleep and hypertension [7,8], detecting breathing disorders such as obstructive sleep apnea syndrome [9,10], and monitoring other structural or functional cardiac disorders.
The detection of R peaks and QRS complexes has been extensively investigated over the past two decades [11]. Conversely, T wave detection has not been investigated as widely as QRS detection, and the T wave detection problem is still far from being solved [12–15]. Reliable T wave detection is more challenging than QRS complex detection for several reasons, including low amplitudes, low signal-to-noise ratio (SNR), amplitude and morphology variability, and possible overlapping of the P wave and T wave [11,16]. Nevertheless, accurate T wave detection is mandatory for a variety of (differential) diagnostic tasks, such as acute coronary syndrome [17], acute myocardial infarction [18], or potentially fatal arrhythmias [19]. To our knowledge, there was no attempt to develop an ECG detector based on existing clinical knowledge. Thus, in this paper, we investigated the possibility of applying clinical knowledge to build a T wave detection algorithm.
In addition, in the near future, it is expected that Holter devices, which are traditionally used for ECG analysis in the clinic, will be replaced by portable battery-operated devices, such as mobile phones [11]. Therefore, there is a need for a simple, fast, and computationally efficient algorithm to detect arrhythmias efficiently in real time. To develop fast robust algorithms for detecting Arrhythmia in ECG collected by portable, wearable, and battery-driven devices, first we require fully annotated arrhythmia ECG signals as a benchmark for evaluation. Unfortunately, the MIT-BIH Arrhythmia database [20] includes only the annotations of R peaks. Therefore, in this study, we annotated T waves in the MIT-BIH Arrhythmia database [20,21]. Moreover, a new fast robust algorithm consisting of two moving averages that are calibrated by a clinical knowledge base is presented.
2. Materials and Methods
2.1. Data Used
Several standard ECG databases are available for the evaluation of QRS detection algorithms for ECG signals. Most of these databases contain annotated files for R peaks but not for T waves. To demonstrate the applicability of the algorithm presented in this paper, two databases are used in this study: one self-annotated database and one standard annotated database.
2.1.1. Database Annotated Under This Study
An expert manually annotated the P and T peaks of the MIT-BIH Arrhythmia database [20,21] to be used in evaluation for the following reasons:
The MIT-BIH database contains 30-min recordings for each patient, which is considerably longer than the records in many other databases, such as the Common Standards for Electrocardiography database, which contains 10-s recordings [22].
The MIT-BIH Arrhythmia database contains records of normal ECG signals and records of ECG signals that are affected by non-stationary effects, low SNR, premature atrial complexes, premature ventricular complexes, left bundle blocks, and right bundle blocks. This provides an opportunity to test the robustness of T wave detection methods.
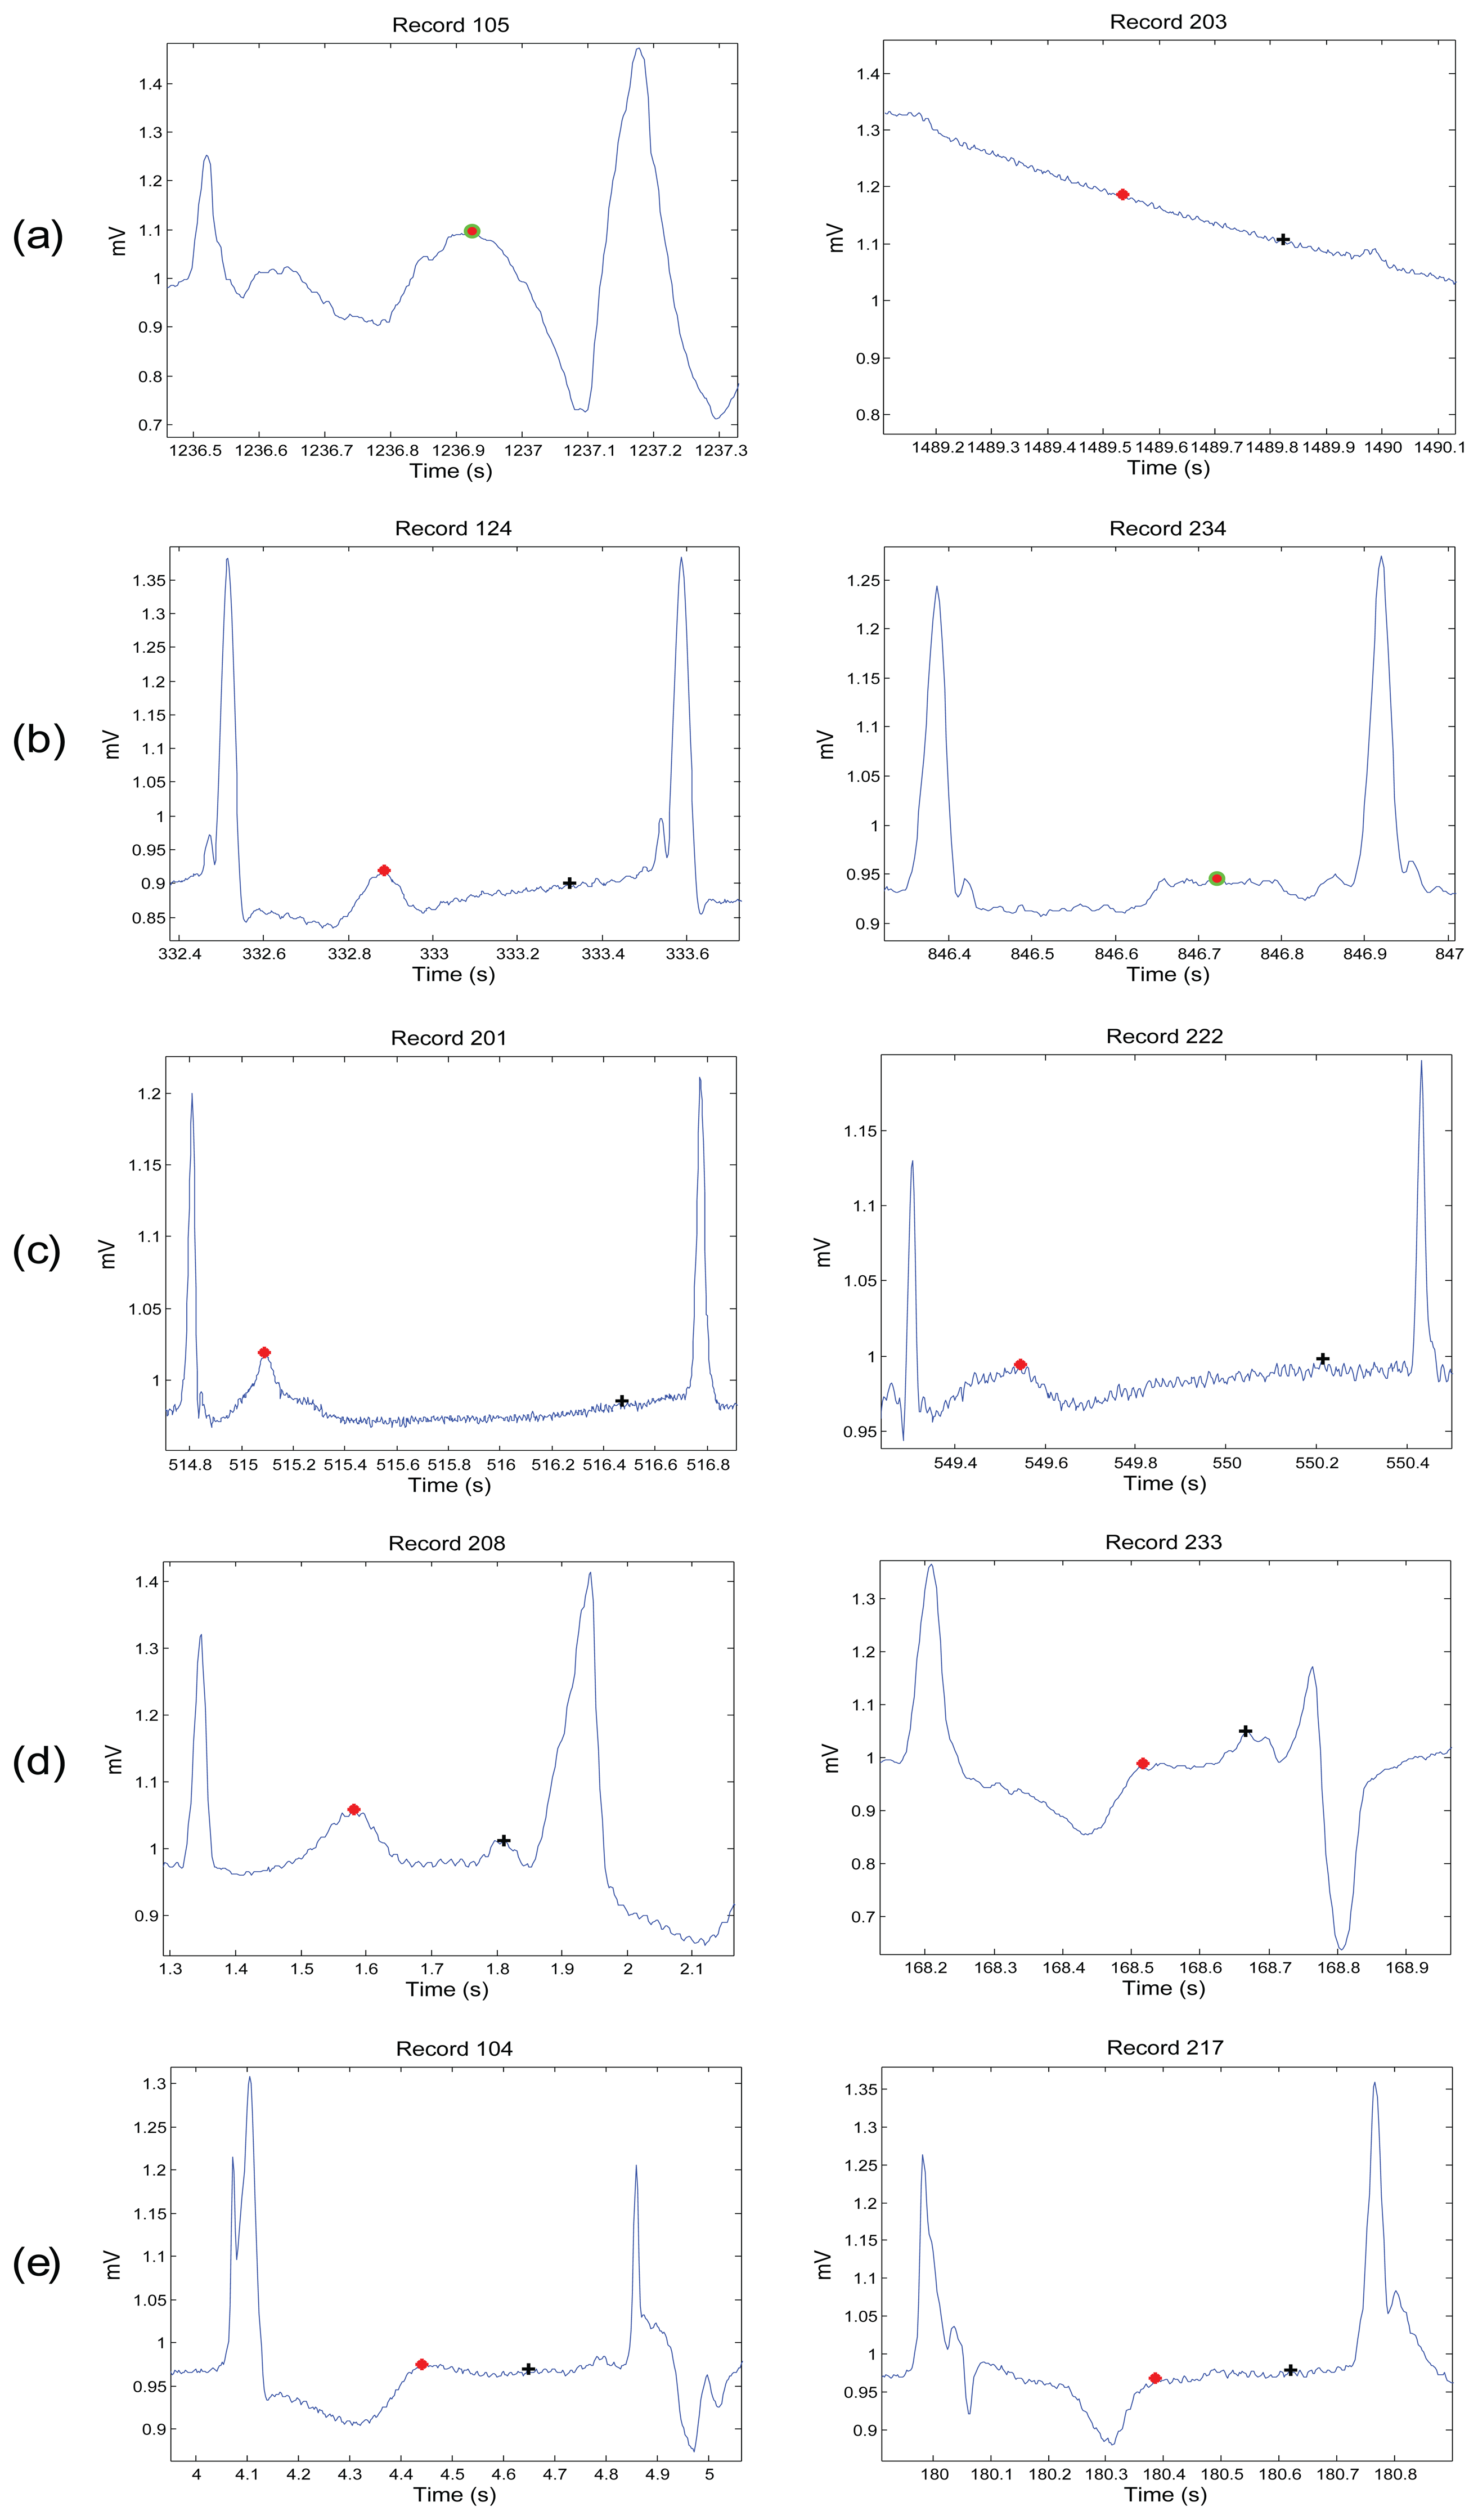
The database contains 23 records (the “100 series”) that were chosen at random from a set of more than 4000 24-h Holter tapes, and 25 records (the “200 series”) that were selected from the same set, including a variety of rare and clinically important ECG segments [20]. Several records in the 200 series have abnormal rhythms and QRS morphologies and they suffer from a low SNR. These issues are expected to present significant difficulties for any ECG signal analysis algorithm [20].
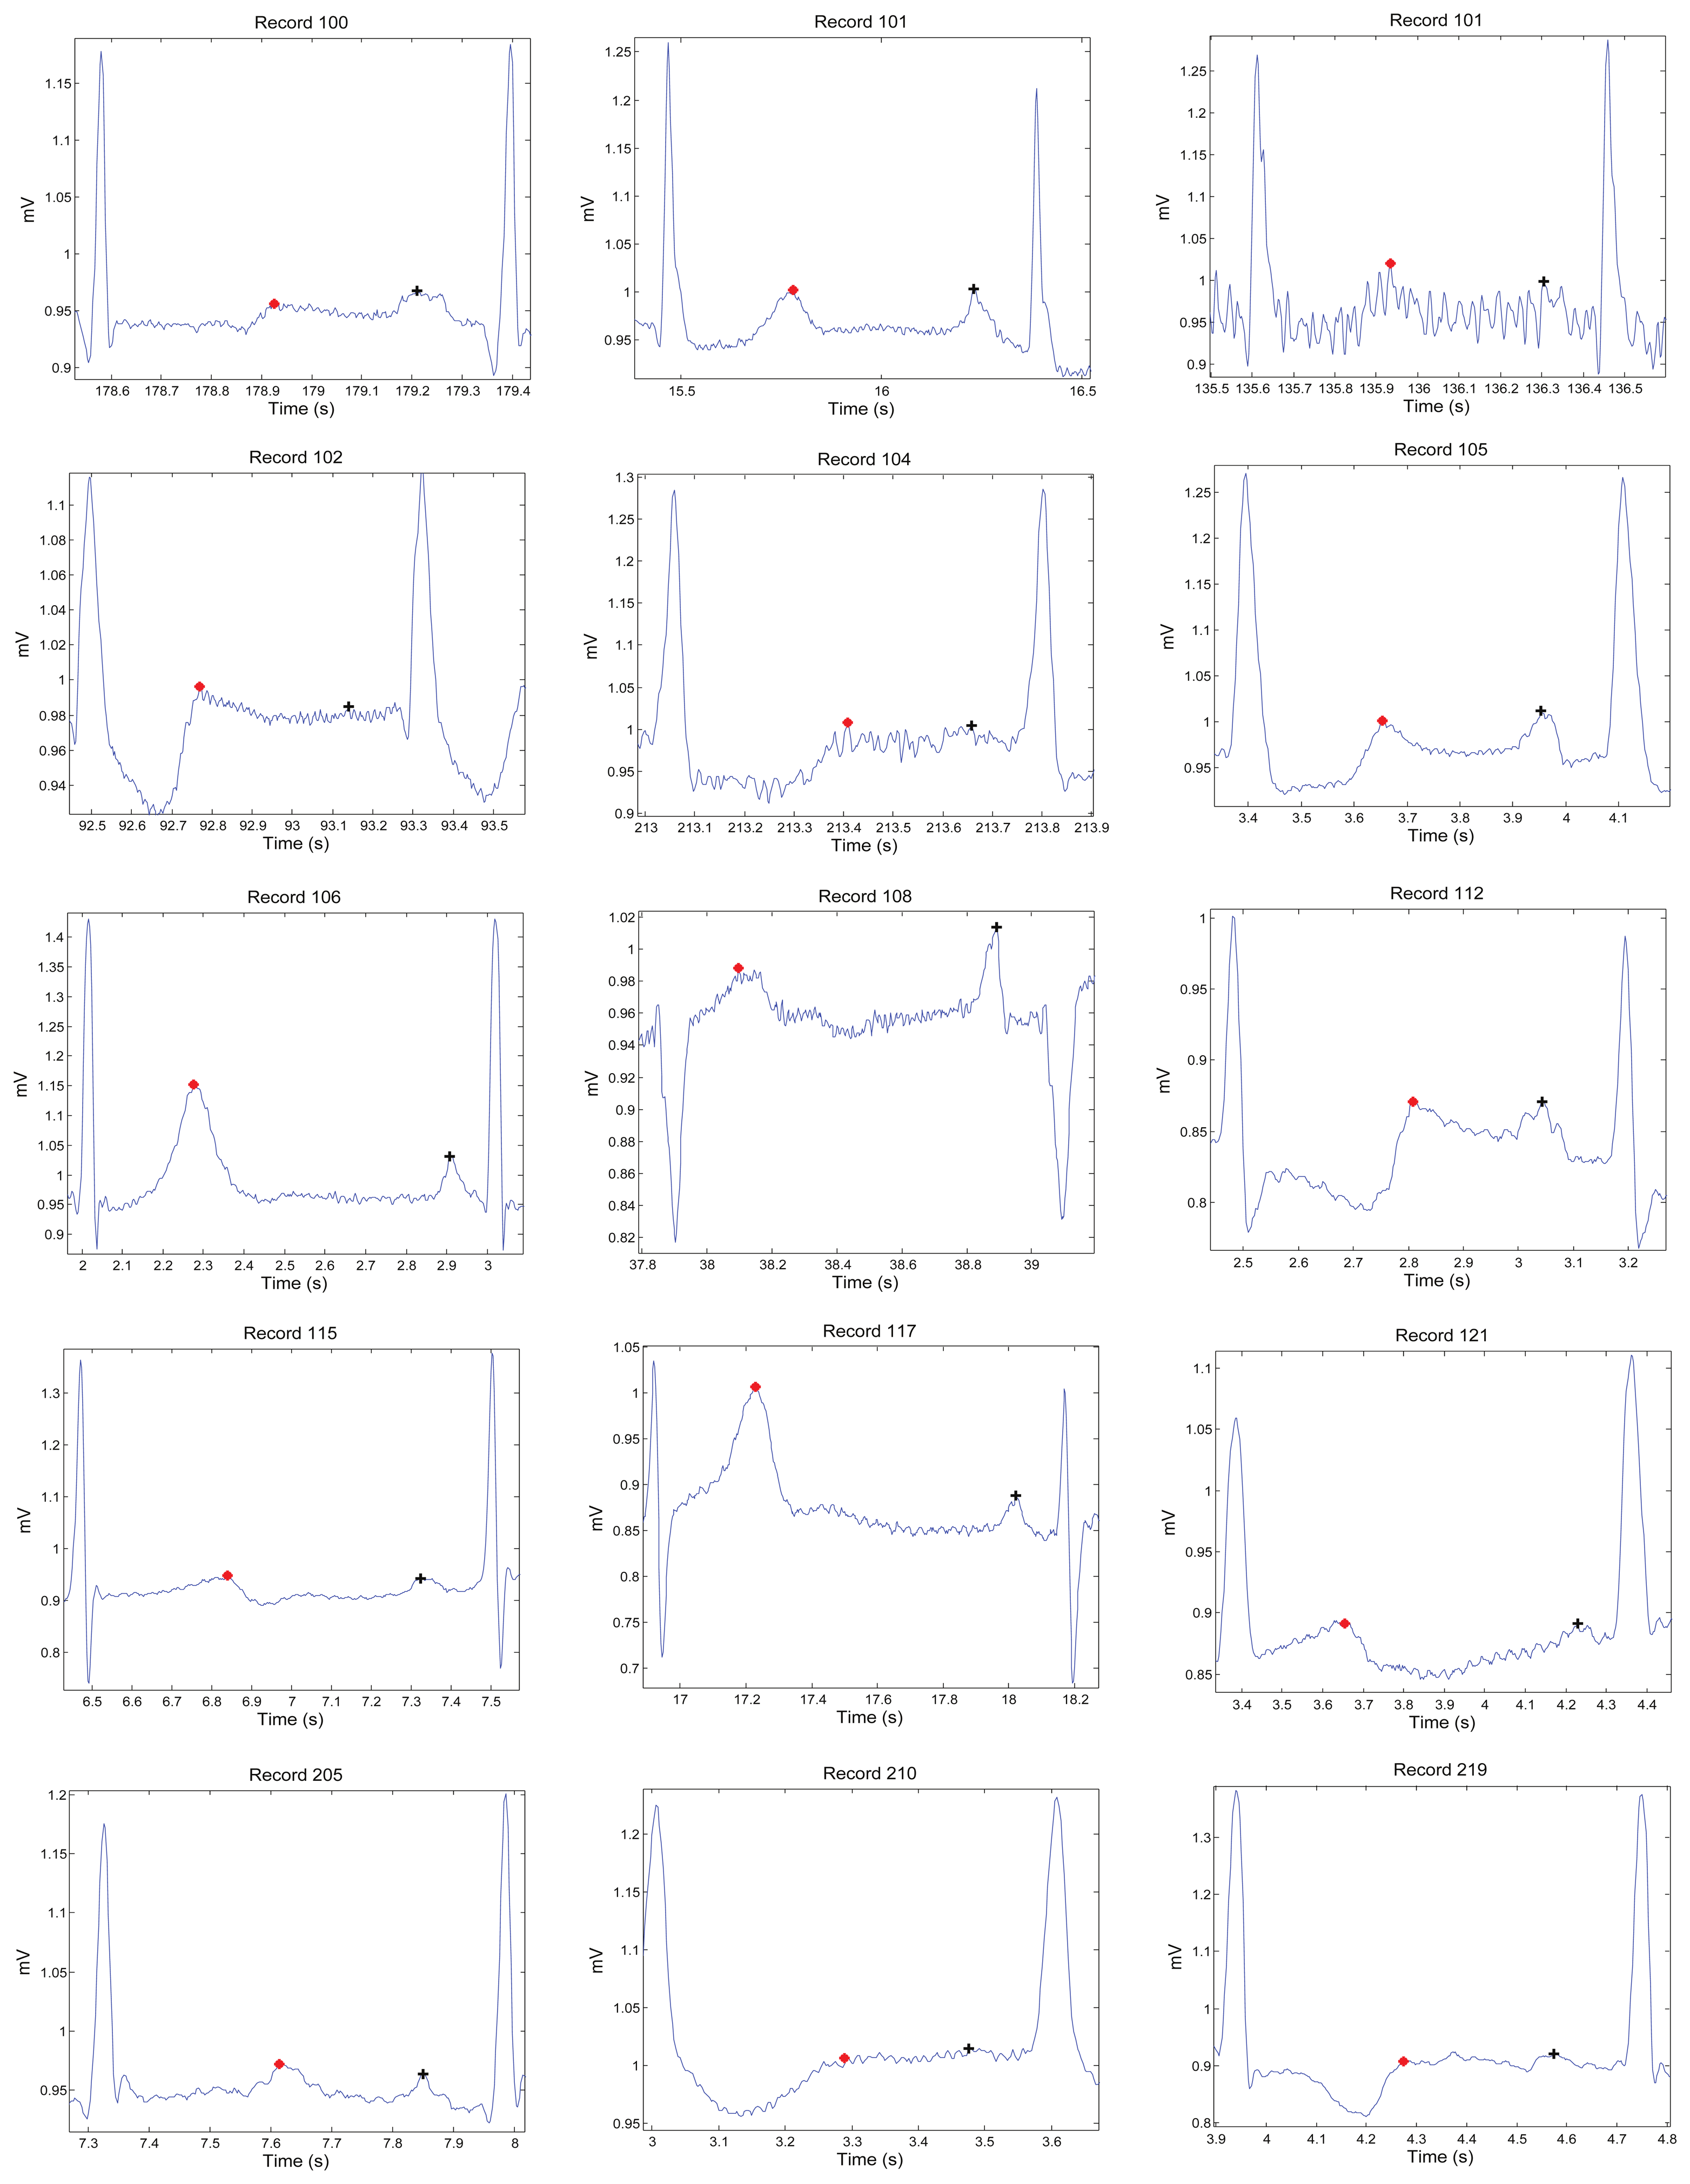
Figures 1, 2 and 3 demonstrate examples for annotation of T waves for different beats in the MIT-BIH Arrhythmia database. There was no automated aid provided during the annotation process and only channel one (Lead I) was annotated. For special cases, such as biphasic T waves, the middle point of the wave was considered as a T wave. The annotation file of P and T waves can be downloaded from [23].
2.1.2. Standard Annotated Database
As the MIT-BIH database is self-annotated, the validation of the detector must be carried out using a standard annotated database. For this purpose, the easily-available QT database [24] is used. This database was annotated by two cardiologists and includes different morphologies such as ST change, supraventricular arrhythmia, normal sinus rhythm, sudden death, and long-term ECG signals. The two cardiologists annotated only selected beats (3542 beats in a file called “.q1c”) in all recordings except two recordings: “sel35” and “sel37”. However, the automatic annotation of the whole database was carried using ecgpuwave software, which is saved in the “.pu” file. In this work, the T peaks of Lead I of the whole QT database are used for validation as they are more salient and certain compared to the onset and offset. In this work, the T peaks of the whole QT database are used for validation as they are more salient and certain compared to the onset and offset. Moreover, once the T peak is detected correctly, searching for the onset and offset is a relatively easy step; however, this is not the focus of this study.
2.2. T Wave Detection Algorithm
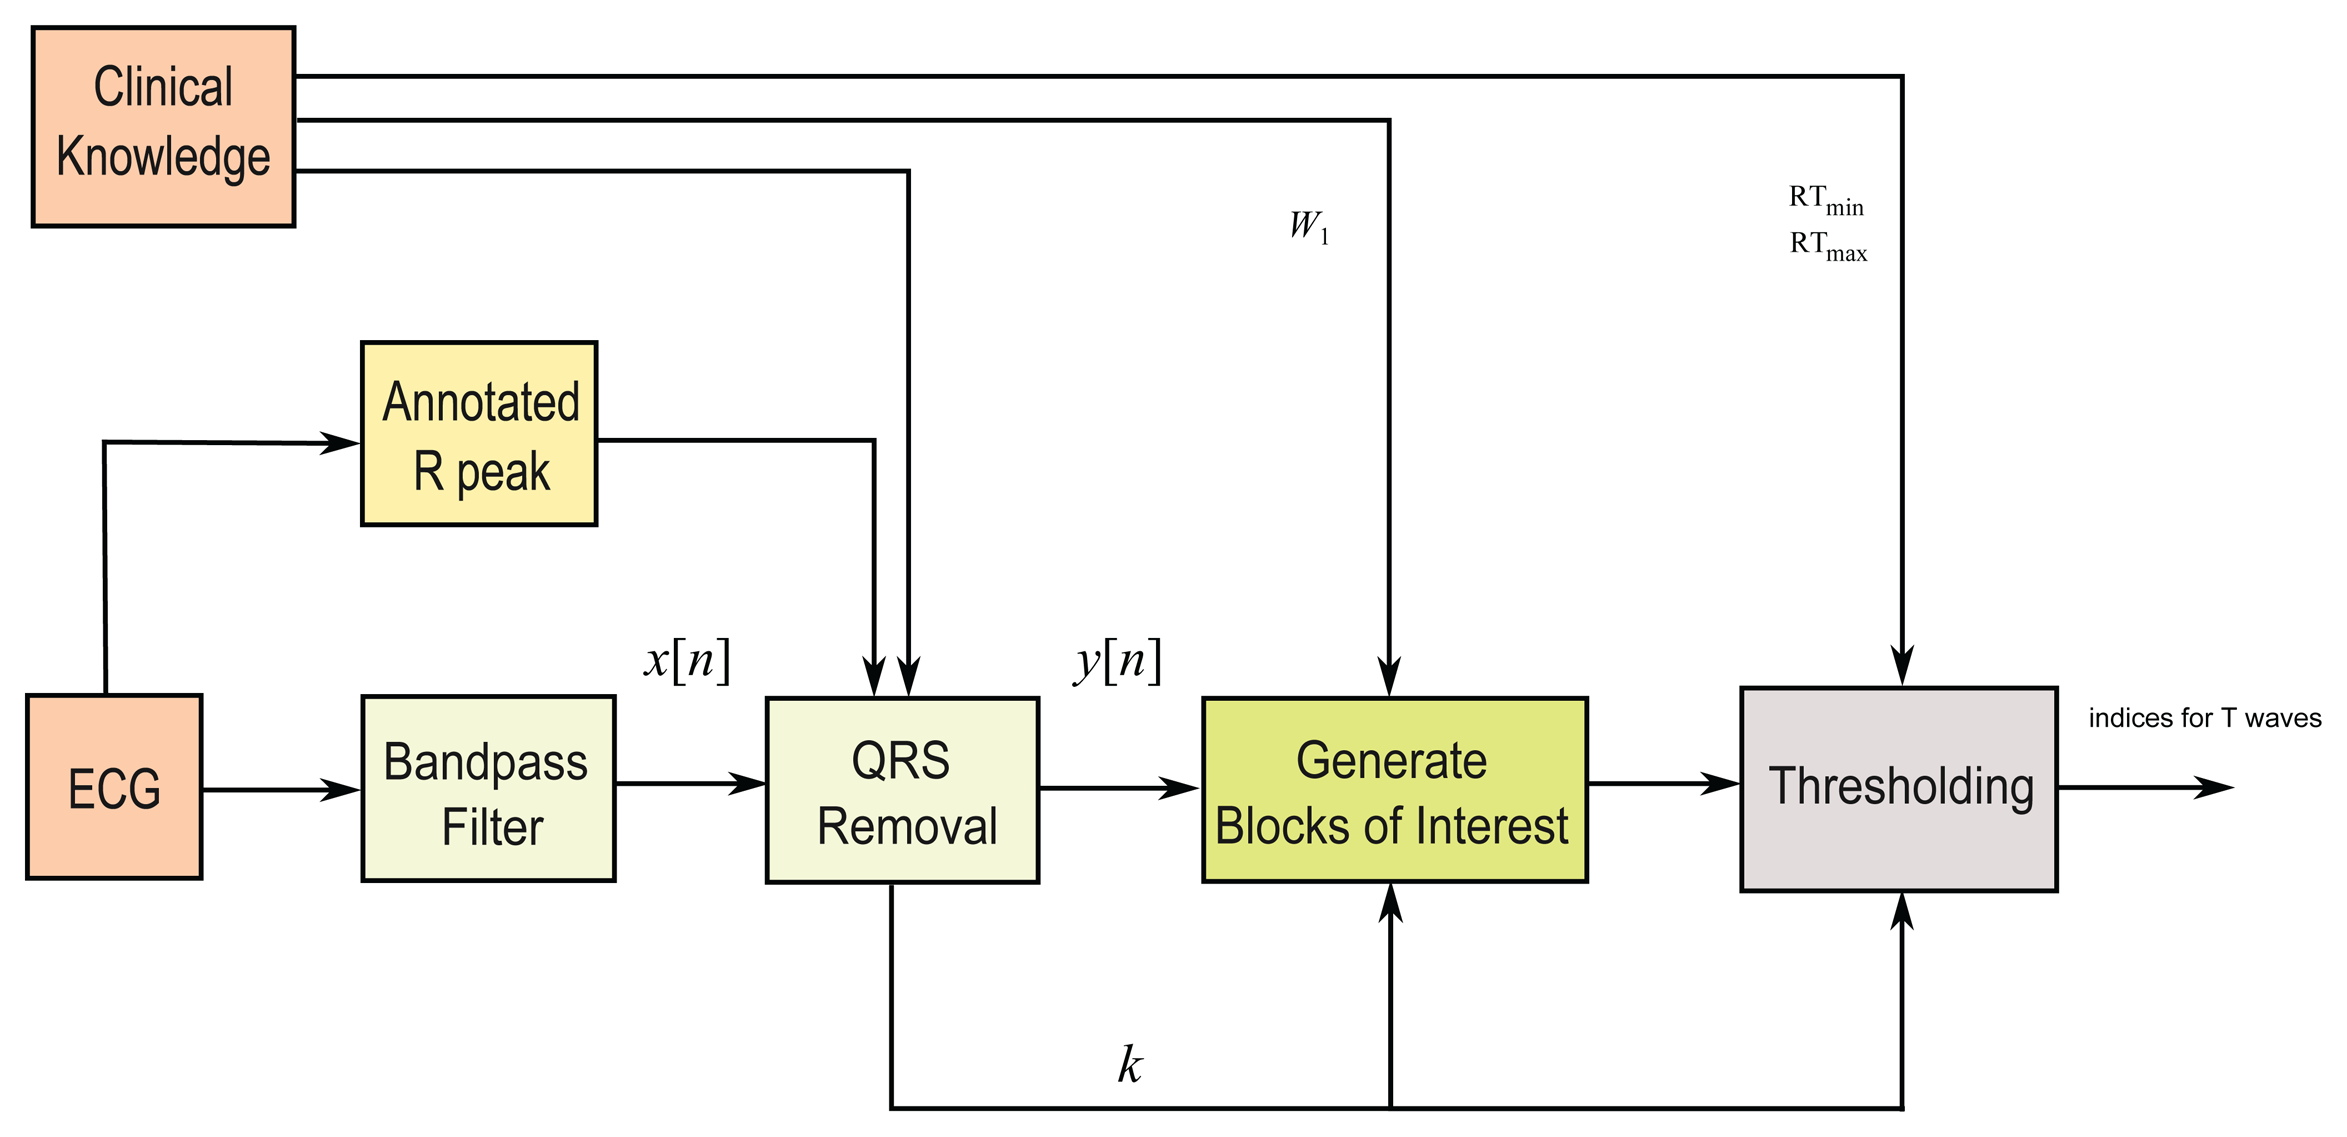
In this study, a fast robust knowledge-based T wave detection algorithm is discussed and evaluated. The algorithm is based on the framework proposed by Elgendi for detecting QRS complexes in ECG signals [25,26], for detecting systolic waves in photoplethysmogram signals [27], detecting a waves [28], and detecting c, d, e waves [29] in acceleration photoplethysmogram (PPG) signals. We build upon this approach to detect T waves. The method consists of three main stages: pre-processing (clinical knowledge, bandpass filtering, squaring, and QRS removal), feature extraction (generating potential blocks using two moving averages), and classification (thresholding). The structure of the algorithm is given in Figure 4.
2.2.1. Bandpass Filter
Most of the energy of T waves lies below 10 Hz [30,31]; thus, a zero-phase second-order Butterworth filter, with a 0.5–10 Hz bandpass, is implemented to remove the baseline wander and high frequencies that do not contribute to the T waves. The output of the zero-phase Butterworth filter applied to the ECG signal produces a filtered signal x[n].
2.2.2. QRS Removal
The QRS removal step based on the relative distance of the T wave to its associated R peak. Removing the QRS complex has two advantages: (1) T waves become the dominant feature in the processed signal; and (2) it simplifies the search for T waves relative to the position of R peaks. In this study, as proof of concept, the R peaks provided in the MIT-BIH Arrhythmia and QT databases are used. Removing the QRS complex is performed by setting the signal to zero for the duration of the QRS complex.
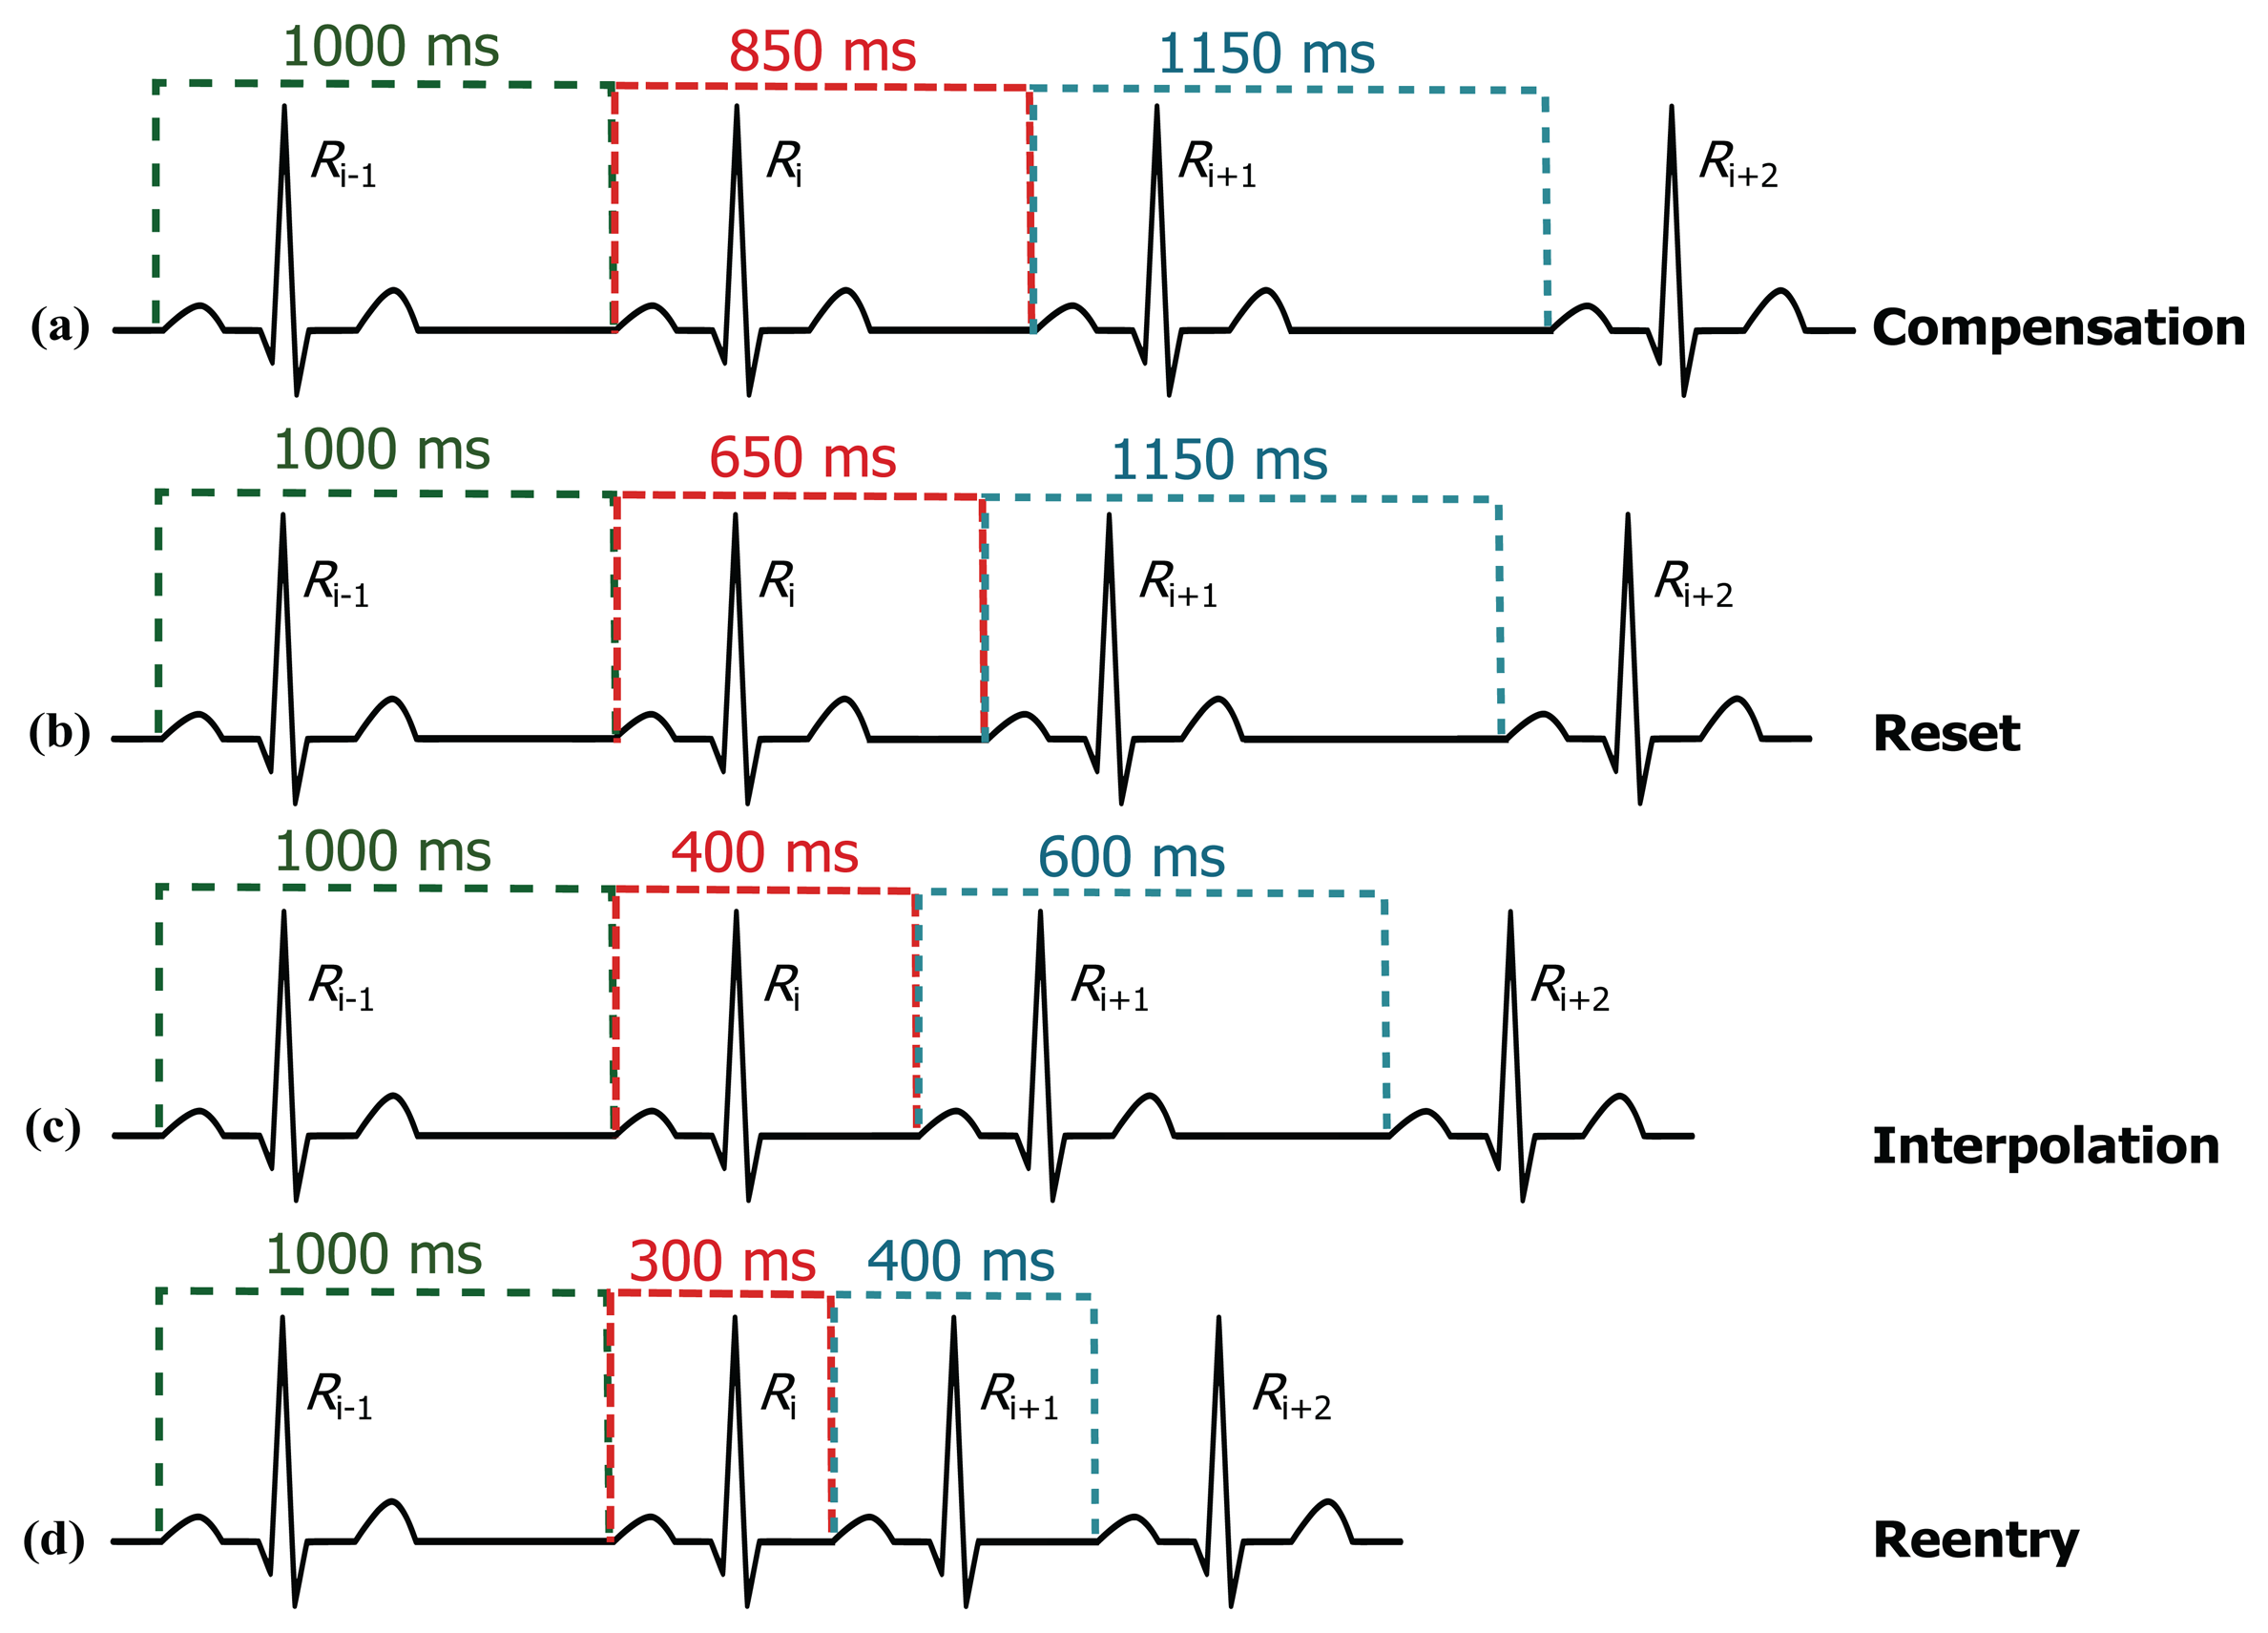
The limits (thresholds) of the RT distance are determined using ECG clinical knowledge. The signal y[n] is initialized as equal to the filtered ECG x[n] signal. The QRS removal length thresholds are determined based on the clinical phases of the RR intervals. As the duration of the QRS complex varies with the heart beat type, a clinical database is required to remove the QRS complex, according to its type. Roskamm and Csapo divided the ECG into four phases: compensation, reset, interpolation, and reentry [32]. Based on their analysis, in the compensation phase (Figure 5a), the second beat (850 ms) is followed by a prolonged beat (1150 ms) to compensate the two beats duration (2000 ms). During the reset phase (Figure 5b), the second beat (650 ms) is followed by a prolonged beat (1150 ms), while in the interpolation (Figure 5c), the second beat (400 ms) is followed by an irregular beat (600 ms). Finally, in the reentry phase (Figure 5d), the second beat (300 ms) is followed by a rapid irregular beat (400 ms); however, an extra category is added to capture complex arrhythmias (repetitive, bigeminy, or trigeminy). The output of this stage will produce an updated y[n] signal.
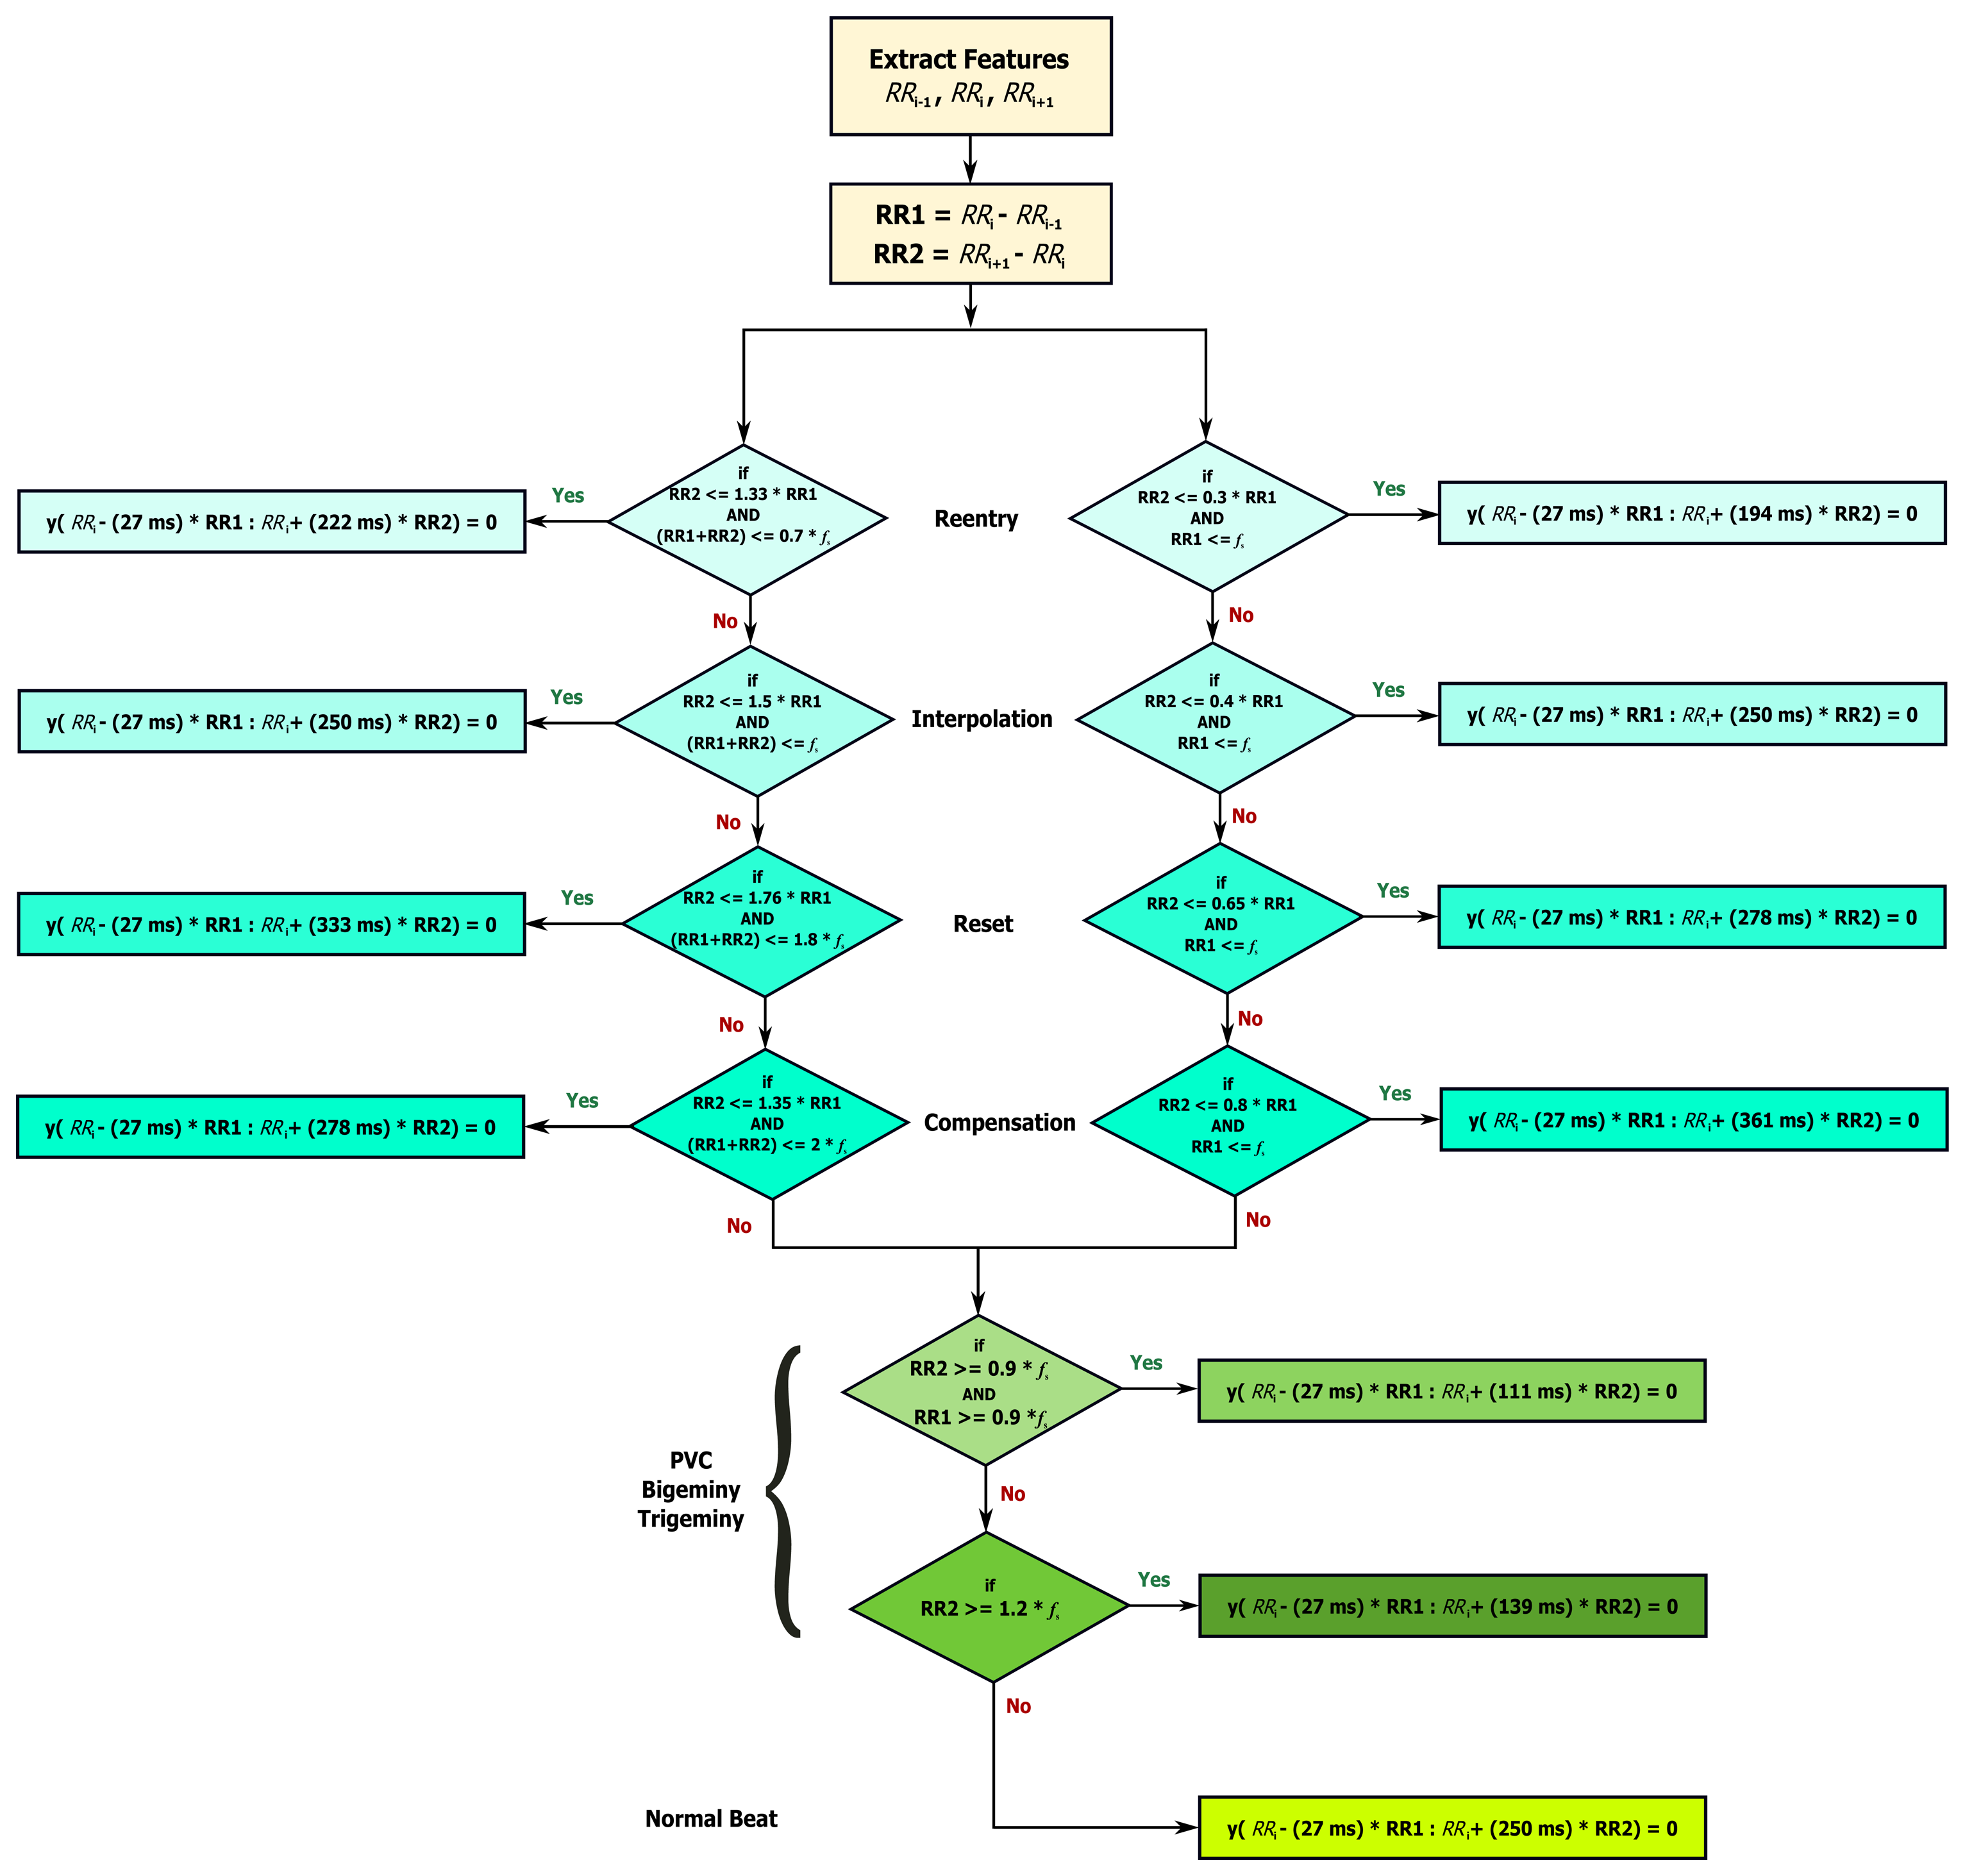
Based on the clinical information presented in Figure 5, the ratio of the second beat duration to the first and third beat duration generates a rule-based knowledge representation, as shown in Figure 6. For example, in the case of reentry (left branch of the flowchart in Figure 6), the first threshold is calculated by dividing the duration between the third and the fourth beat (Ri+2 − Ri+1 = 400 ms) by the duration between the two and the third beat (Ri+1 − Ri = 300 ms) resulting as 1.33; however, this value was calculated with reference to the duration between first beat and second beat (Ri − Ri−1 = 1000 ms)—this generates the first rule: RR2 ≤ 1.33 RR1, where RR1 = Ri − Ri−1, RR2 = Ri+1 − Ri, and i is the beat index. The second threshold is the expected total duration of the second and third beats (300 ms + 400 ms), which equals 0.7 s—this generates the second rule: (RR1 + RR2) ≤ 0.7fs. On the right side the flowchart in Figure 6, in the case of reentry, the first threshold is calculated by dividing the duration between the third and the fourth beat (Ri+1 − Ri = 300 ms) by the duration between the first and the second beat (Ri − Ri−1 = 1000 ms) resulting as 0.3—this generates the first rule: RR2 ≤ 0.3 RR1, while the second threshold is based on the duration between the first and the second beat (Ri − Ri−1 = 1000 ms) which is 1 s (or fs)—this generates the second rule: RR1 ≤ fs. Similarly, all other rules were created for the other four ECG phases.
During the QRS removal, the RR interval that satisfied each category is saved and referred to as RRk, where k is the category type (compensation, reset, interpolation, reentry, and complex arrhythmias). The normalized RR intervals average in each category is calculated as , where l is the number of RR intervals saved in category c, and fs is the sampling frequency Dividing Mc by fs is sufficient as it is equivalent to the average RR interval in healthy subjects.
2.2.3. Generating Blocks of Interest
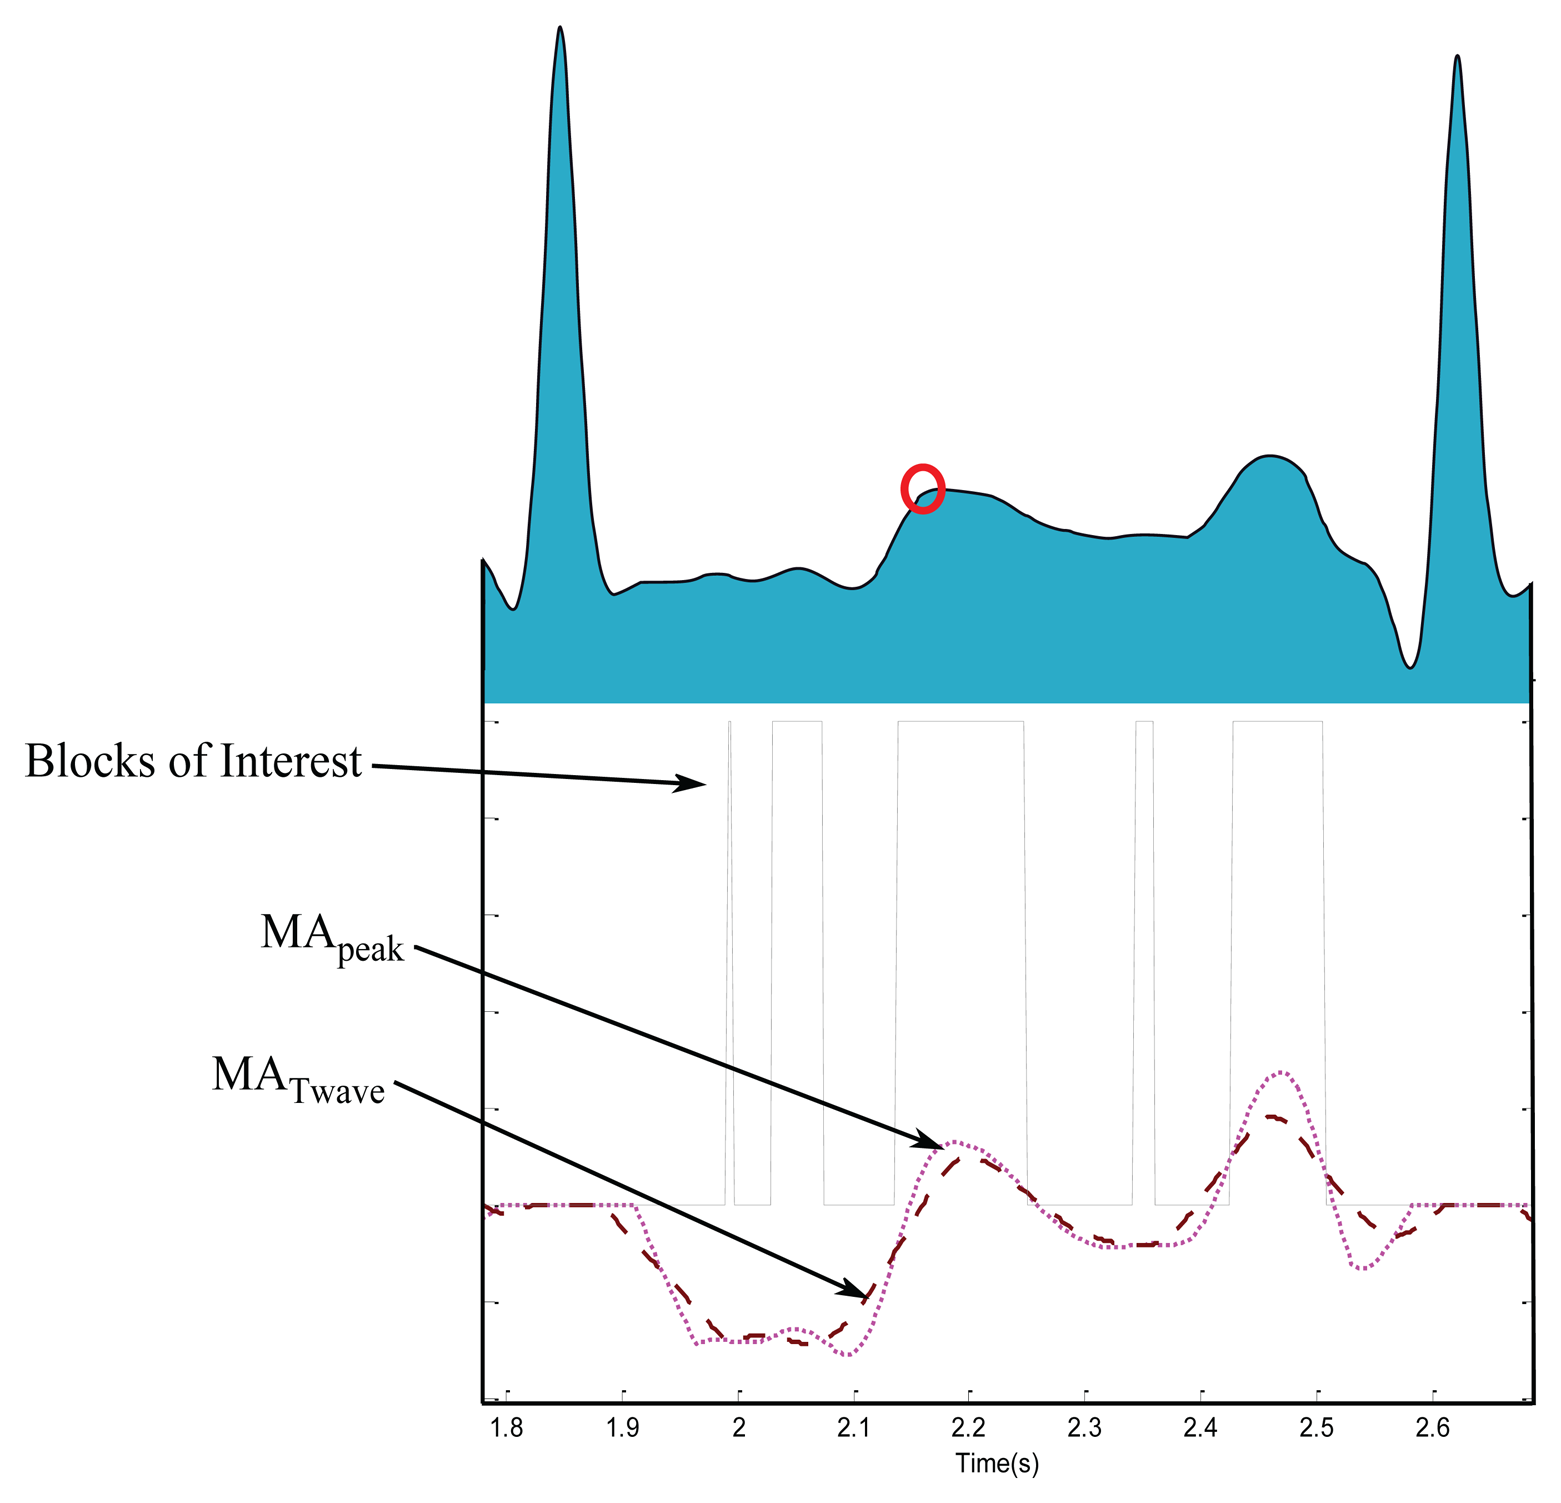
Blocks of interest are generated using two event-related moving averages that demarcate the areas of T waves, a method which was first introduced in [33]. The particular method used to generate blocks of interest has been mathematically shown to detect a waves [28], QRS complexes [25], and systolic waves in PPG signals [27]. In this procedure, the first moving average (MApeak) is used to emphasize the peak of the T wave area, as the dotted signal shown in Figure 7, and is given by
2.2.4. Thresholding
In this stage, the blocks of interest are generated by comparing the MApeak signal with MATwave. Many blocks of interest will be generated, some of which will contain the T wave and others will contain P waves, U waves, and noise. Therefore, the next step is to reject blocks that result from noise. Rejection is based on the relative positions of P and T waves to R peaks and anticipated peak width.
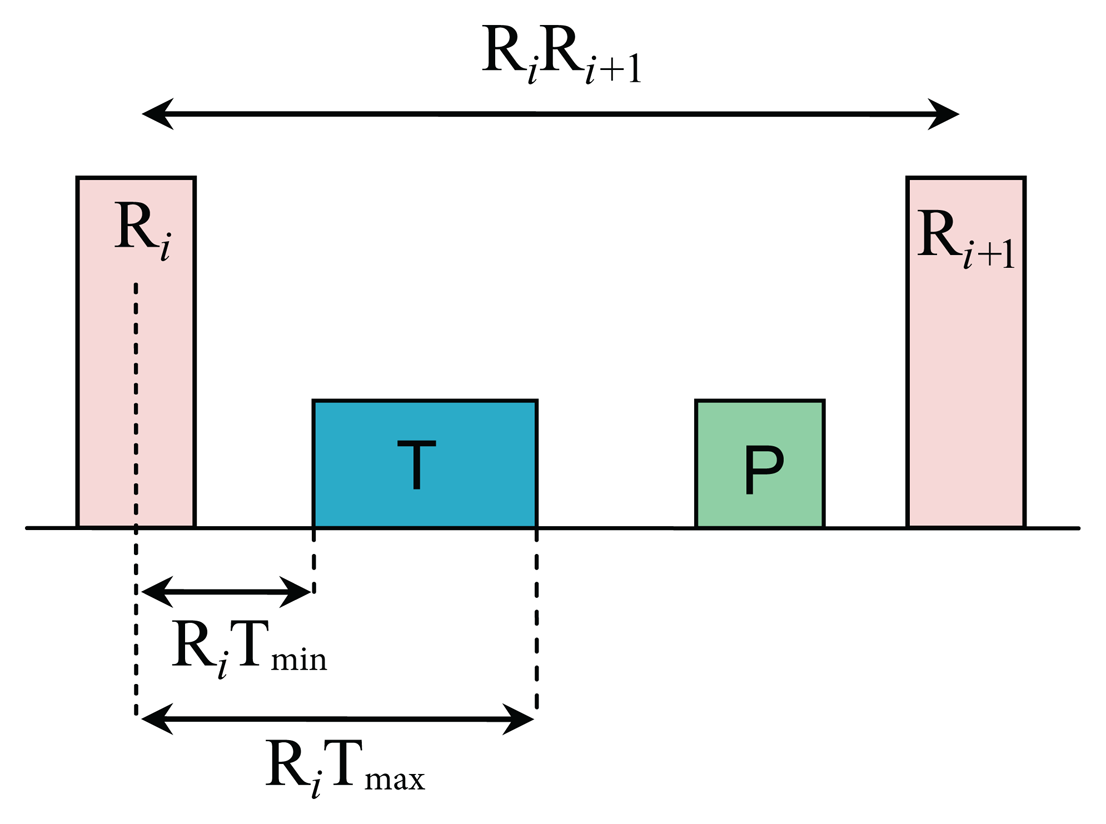
To determine whether the detected blocks contain T waves or not, the number of blocks in each consecutive RR interval is counted. A threshold based on the distance of the maximum point within a block to the R peak is applied to distinguish P waves from T waves and noise, as shown in Figure 8. The search regions for T waves in terms of time occurrence with respect to the current R peak (Ri) and the next R peak (Ri+1) are calculated as
After applying the relative-position thresholds, there are three possibilities for the number of detected blocks within the area of interest:
Zero: if there is no block detected, it means the algorithm failed to detect a T wave in the current RR interval.
One: if there is one detected block, it means the algorithm succeeds in detecting T wave, P and T waves are most likely merged within one block, which is marked as a circle with a black asterisk inside (see Figure 9i,j).
More than one: if there are multiple detected blocks, as shown in Figure 7, it means one of the detected blocks contains T waves. However, in this work the nearest block to the current R peak is considered a T wave.
The last stage is to find the maximum absolute value within each block to detect the peak of T wave. The detected T wave peaks are compared to the annotated T wave peaks to determine whether they were detected correctly. The search range for the true T wave peak is fixed to ±30 ms for both databases, to ensure consistency of comparison. The search region of 30 ms is good enough for diagnostics as it is less than W1.
3. Results
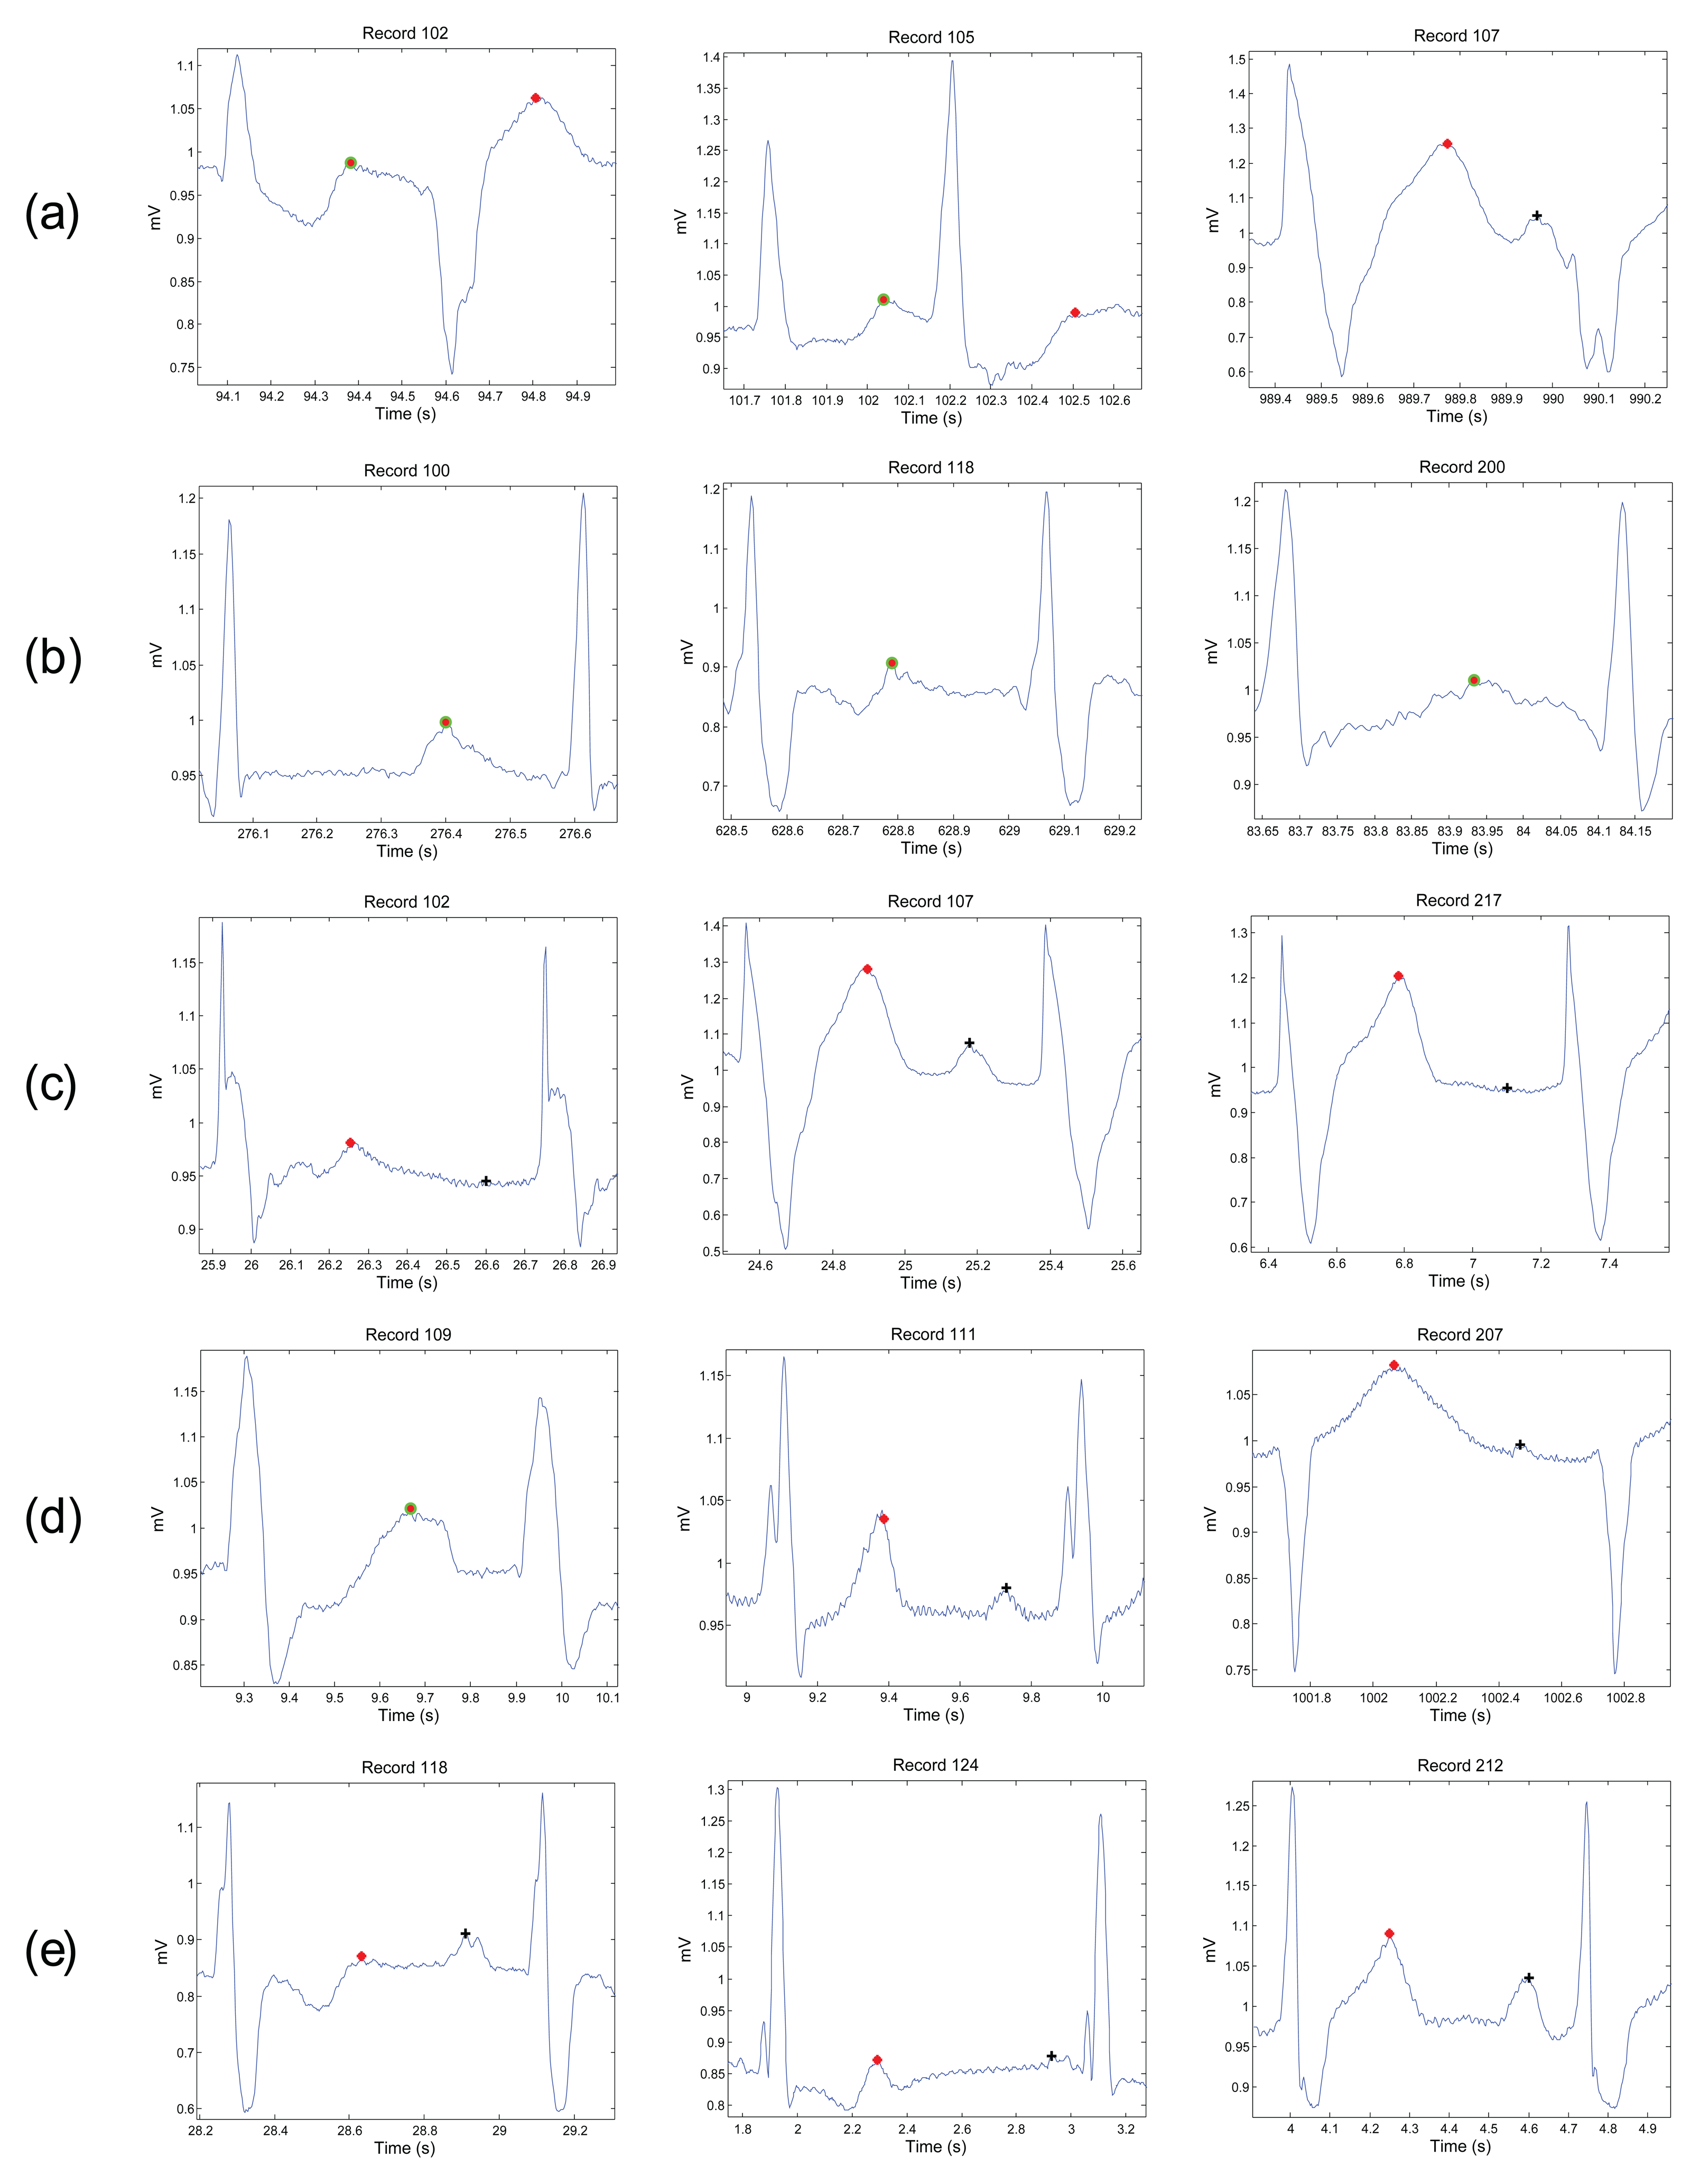
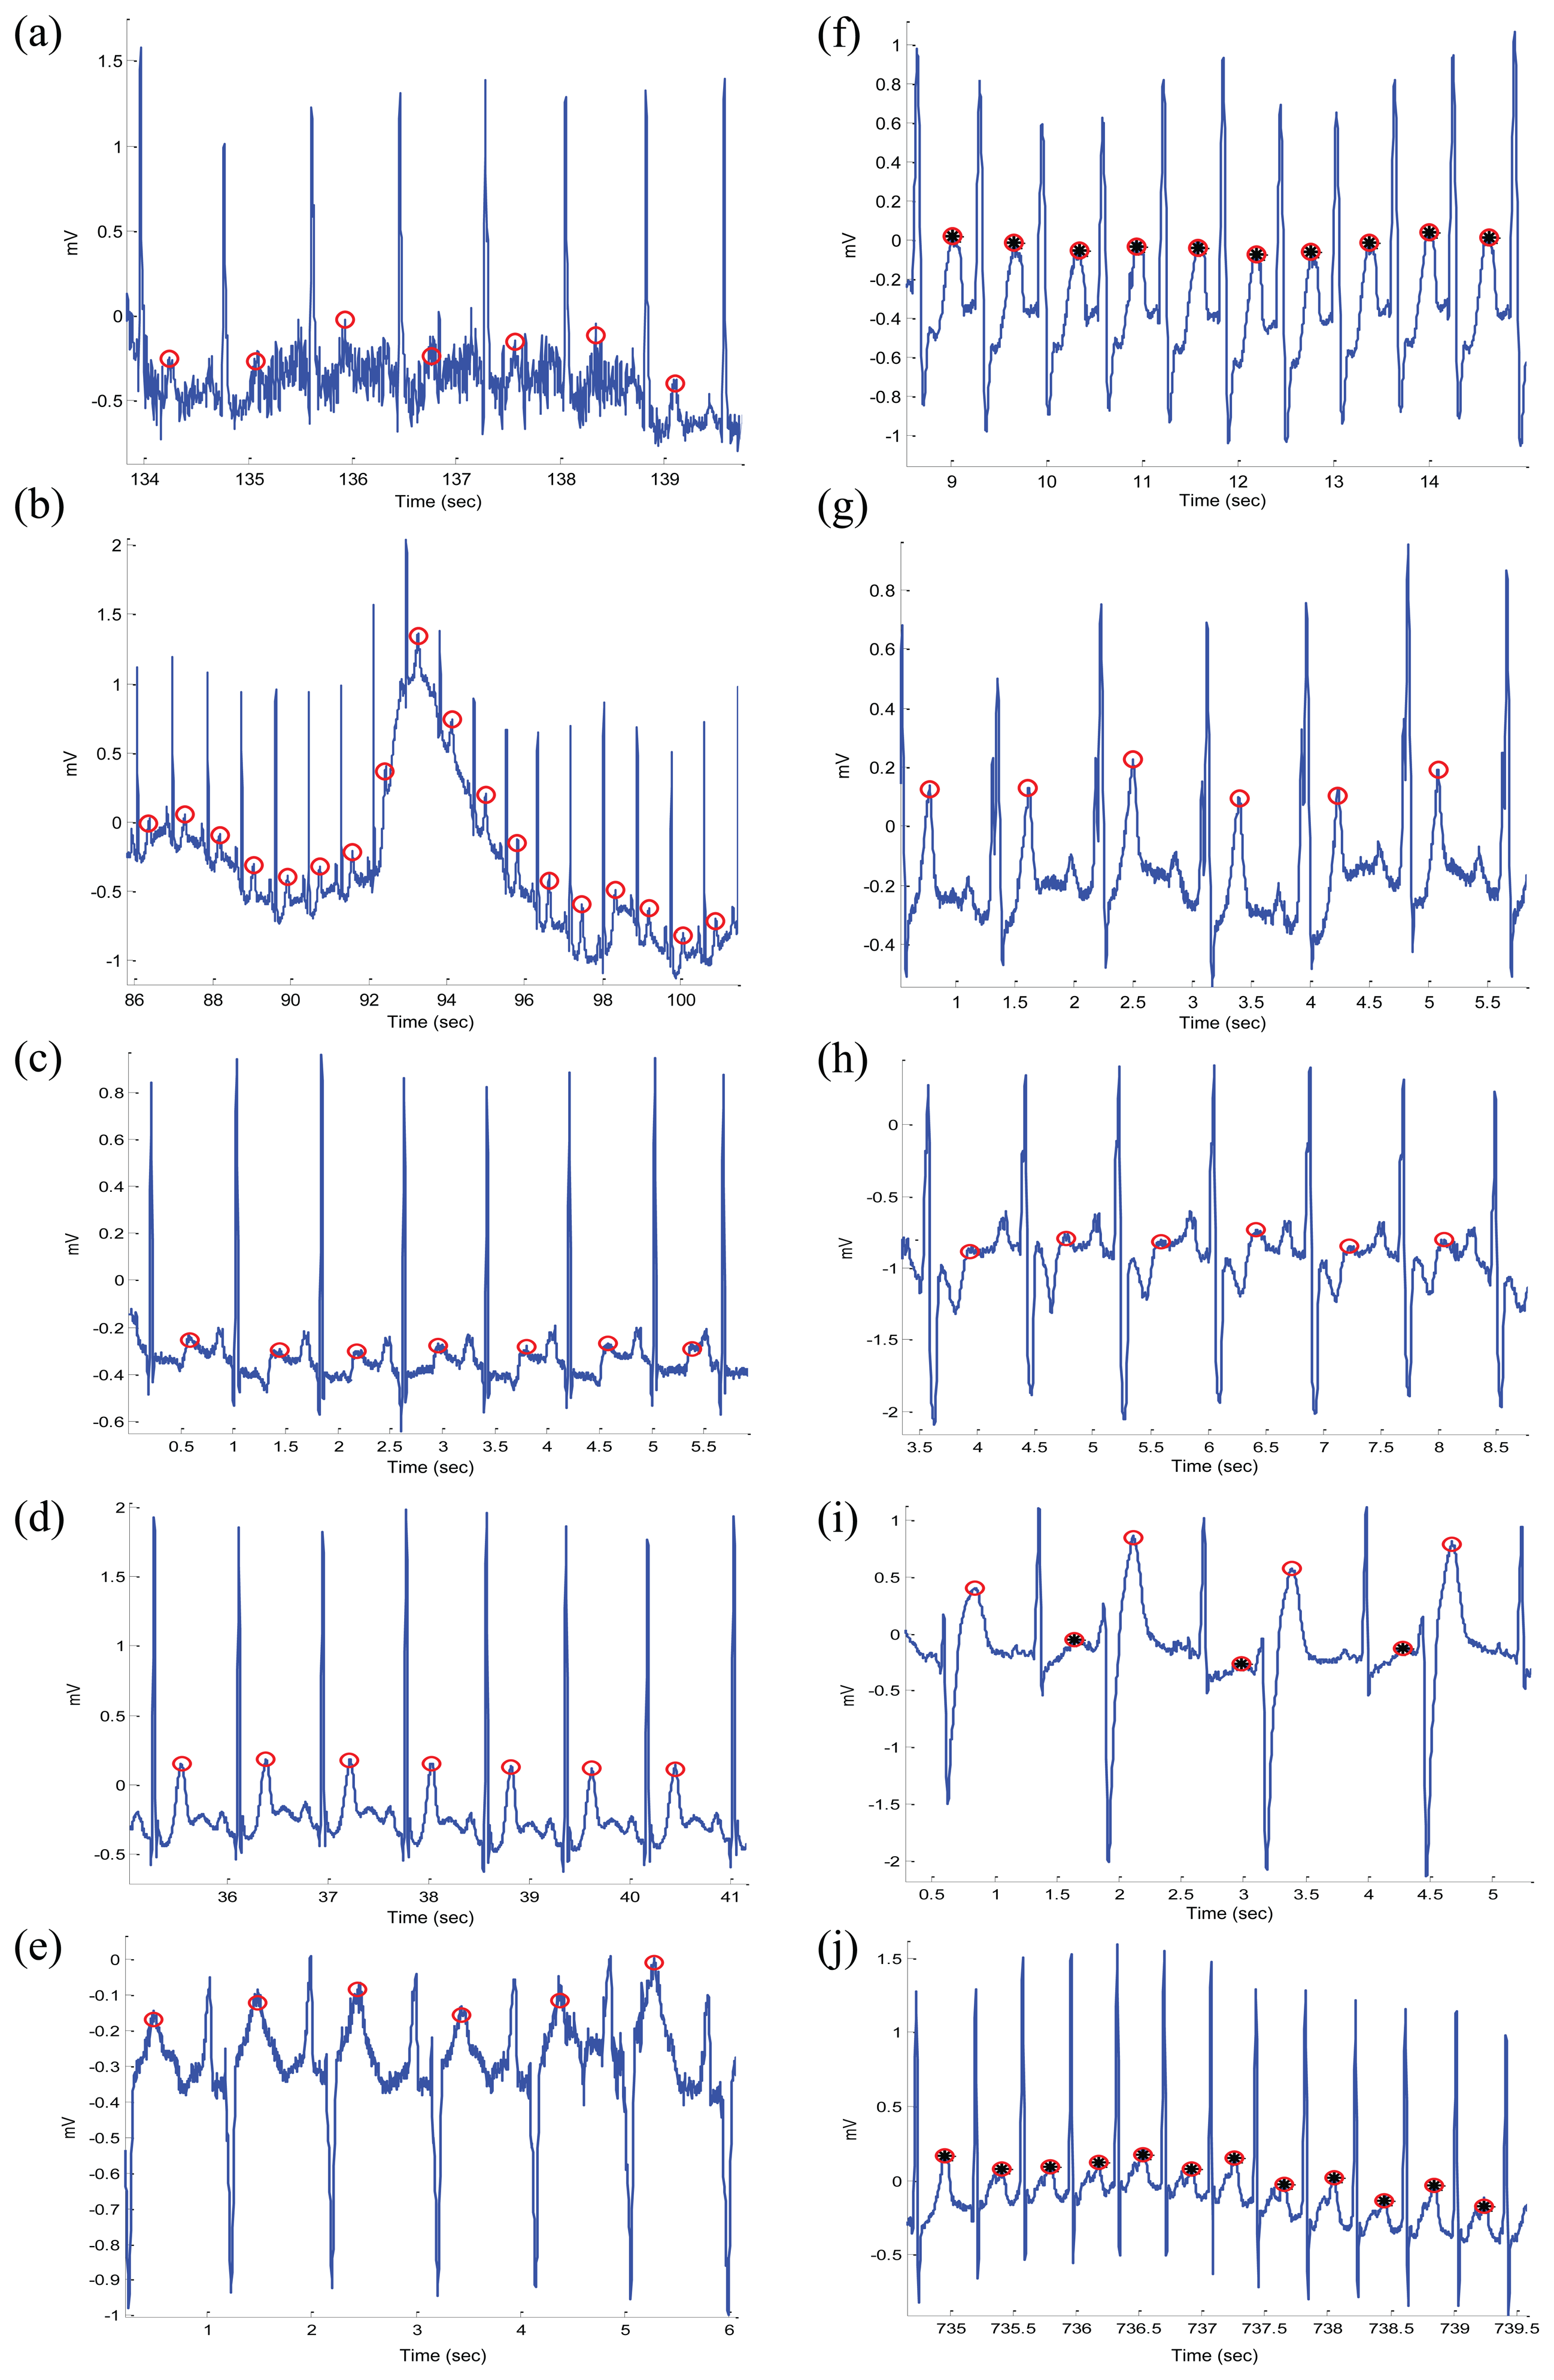
The algorithm was evaluated using the MIT-BIH database. The T waves were detected successfully even when the P and T waves are merged in Arrhythmia ECG signals that are affected by: high-frequency noise, baseline wander, normal sinus rhythm (NSR), left bundle branch block (LBBB), right bundle branch block (RBBB), premature ventricular contraction (PVC), and premature atrial contraction (PAC). All of the reasons for detection failure are described below. High-frequency noise results from the instrumentation amplifiers, recording system, and ambient electromagnetic signals received by the cables. The signal shown in Figure 9a has been corrupted by power-line interference at 60 Hz and its harmonics and other high frequencies. It can be seen that the proposed algorithm is robust to noise. Moreover, the proposed algorithm is not sensitive to baseline wander and detected the T waves correctly, as shown in Figure 9b. This is because the moving averages were applied to the bandpass filtered ECG signal—which is discussed in the Bandpass Filter Subsection.
The NSR is a normal ECG cycle; it is initiated by the sinoatrial node and consists of a P wave followed, after a brief pause, by a QRS complex and then a T wave [37]. The proposed algorithm correctly detected T waves in three types of normal beats: (1) NSR without U waves (record 100 of the MIT-BIH database), as shown in Figure 9c; (2) NSR with U waves (record 103), as shown Figure 9d; and (3) NSR with negative polarization (record 108), as shown Figure 9e. The LBBB results from conduction delays or blocks at any site in the intraventricular conduction system, including the main LBBB and the bundle of His. The result of an LBBB is an extensive reorganization of the activation pattern of the left ventricles [37]. The proposed algorithms successfully detected normal and merged P and T waves in two types of LBBBs: (1) LBBB beats with merged P and T waves (record 109), as shown in Figure 9f and (2) LBBB beats with normal T waves (record 111), as shown in Figure 9g. However, RBBB is a result of a conduction delay in a portion of the right-sided intra-ventricular conduction system. The delay can occur in the main RBBB itself, in the bundle of His, or in the distal right ventricular conduction system. The RBBBs may be caused by a minor trauma, such as right ventricular catheterization [37]. As shown in Figure 9h, the proposed algorithms succeeded in detecting the T waves in ECG signals of RBBB (record 118).
The PVCs are characterized by the premature occurrence of a QRS complex that is abnormal in shape, and that has a longer duration than normal QRS complexes, generally exceeding 120 ms [37]. The T wave is commonly large and opposite in direction to the major deflection of the QRS. In general, the QRS complex is not preceded by a P wave, but it can be preceded by a non-conducted sinus P wave occurring at the expected time [37]. In Figure 9i, a special case of PVC is shown, called bigeminy, where the premature ventricular beats occur after every normal beat in an alternating pattern.
The proposed algorithm succeeded in detecting the T waves in the normal beats and the T waves in the premature ventricular beats (record 200). Note that PACs are among the most common causes of irregular pulses and can originate from any area in the heart [37]. The impulse is discharged prematurely by an irritable focus in the atria giving rise to a distorted P wave, usually superimposed on the preceding T wave. As shown in Figure 9j, the proposed algorithms detected the merged T waves in PACs (record 209). As illustrated in Figure 9, the proposed method successfully detected T waves in ECG signals with a low SNR, baseline wander, and various arrhythmias. The performance of the T wave detection algorithms is evaluated using two statistical measures: SE = TP/(TP + FN) and +P = TP/(TP + FP), where TP is the number of true positives (T wave peak detected within the range of 30 ms of the annotated T wave peak), FN is the number of false negatives (annotated T wave peak has not been detected), and FP is the number of false positives (T wave peak detected outside the range of 30 ms of the annotated T wave peak). The sensitivity SE reports the percentage of true beats that were correctly detected by the algorithm. The positive predictivity +P reports the percentage of beat detections that were true beats.
The abnormal heart rhythms caused a large number of FNs compared to the FPs. Table 1 shows the result of T wave detection over 48 records of the MIT-BIH database. FNs are mainly caused by noise and PVC, as in record 219, and atrial fibrillation, as in record 202. The algorithm achieved a sensitivity of 99.86% and a positive predictivity of 99.65%, which are promising results for handling the non-stationary effects, low SNR, PACs, PVCs, LBBBs, and RBBBs in ECG signals.
3.1. Comparison of Performance on the QT Database
The detection performance on the QT database obtained by the proposed T wave detector record by record performance is shown in Tables 2 and 3. The overall comparison of our results with the existing T wave detection algorithms on the QT database is demonstrated in Table 4. It summarizes the performances in terms of number of beats, methodology, SE, and +P. Note that the proposed algorithm scored slightly higher overall performances (average of SE and +P) than Martínez et al. [38] and Laguna et al. [39] over the manually annotated T waves. It is clear that the proposed algorithm succeeds in handling long ECG recordings with high performance over the 111,201 automatically annotated heart beats. Moreover, the proposed T wave detector has not been re-tuned over any databases, thus the results are promising, and the algorithm can detect T peaks over different databases, sampling frequencies, types of arrhythmias, and noise.
3.2. Processing Time
Less computational time is achieved when the simplest method is used (i.e., the algorithm presented in this paper requires less computational time). This is advantageous in terms of future development of wearable and portable diagnostic devices, and in terms of helping online and real-time diagnoses.
It is misleading to suggest that mentioning the average speed of the proposed detector, over a certain time length of ECG signal, would provide a comparative result. This is because the processing time depends on the number of beats within each ECG recording, not on the record length. In this study, the T wave detector was implemented in MATLAB 2010b (The MathWorks, Inc., Natick, MA, USA) on Intel™ i5 CPU 2.27 GHz.
It is worth noting that the number of beats of the 15-min recordings category in QT database was relatively consistent—with a mean ± SD, number of beats 1059 ± 275—over all records of this category. On the contrary, the 30-min beat average, in MIT-BIH database, was 2291 with an SD of 448 beats. As the processing time depends on the number of beats rather than the recording length [25], we found, for example, the proposed detector took 2.58 s to process record 215-MITDB contains 3362 beats, while it took 0.28 s to process 527 beats in record 33-QTDB. In general, without taking the number of beats into consideration, the speed of the proposed detector is fast. The suggested detector handles 15-min recordings in 0.52 ± 0.14 s, while it takes 1.98 ± 0.32 s to handle 30-min ECG recordings.
4. Limitations of Study and Future Work
The preliminary results are promising, especially after testing the algorithm on the QT database; however, testing the algorithm on a larger sample size is necessary to generalize the findings. In addition, a more focused study is needed to investigate atrial fibrillation, atrial flutter, paroxysmal supraventricular tachycardia, junctional tachycardia, and multifocal atrial tachycardia as the morphology of T waves may differ.
The presented method assumes that the R peaks are correctly detected. There is a linear correlation between the detection of T waves and the detected R peaks. If the R peaks are misclassified, this method will fail as it depends on the position of R peaks. However, this study provides a positive proof of concept for detecting T waves in arrhythmic ECG beats.
We created a rule-based system based on the three RR interval window proposed in [32]. Perhaps, it is important to investigate the development of a rule-based system based on more than three RR intervals to examine if it will improve the overall T wave detection accuracy. Moreover, the proposed method is based on several thresholds, which are calibrated using clinical knowledge. Clinical knowledge is considered the gold standard in our work; thus, the obtained thresholds were considered optimal. However, an open question for future work is to optimize all thresholds to improve accuracy.
One of the next steps regarding the results of this study is to detect arrhythmic ECG beats using the RT or ST interval as a main feature. In addition, the detection of P waves based on the accurate detection of T wave peaks needs to be examined. Moreover, perhaps, an optimization over the clinical parameters after splitting the databases into a training set and test set may improve the detection rate of the T waves. There is also a need to investigate the T-waves with different morphology, e.g., biphasic T-waves.
Technically, exploring the event-related moving average methodology for detecting events in ECG signals is promising in terms of computational complexity and efficiency. This can be further improved by investigating other bandpass filters with different orders and also by developing fast-moving average (or median) techniques for real-time analysis and mobile phone applications.
5. Conclusions
There is a limitation when evaluating T wave detection algorithms as datasets with annotated T waves are lacking. Consequently, comparing existing algorithms becomes even more difficult. Therefore, annotation of T waves is discussed and provided. Using these approaches, it is possible to support diagnostic analysis, delivering important information for (differential) diagnosis to medical experts. Using mobile technologies with automatic analysis software driven by medical expert knowledge, it will be furthermore possible to provide screening and monitoring solutions in places where medical expertise is scarce, such as remote rural areas and developing countries.
The use of two moving averages is simple and computationally efficient for mobile electronic health tools, such as cell phones and telemedicine technologies. The assessment of the T detector has been reliably carried out over the existing standard databases (QT and MIT-BIH), which contain different beat types and morphologies found in ECG signals. The developed algorithm was evaluated on all ECG recordings in the MIT-BIH database, 48 self-annotated records containing a total of 109,985 heart beats. It achieved a sensitivity of 95% and a positive predictivity of 98.59% over the MIT-BIH ECG signals, which contain low SNR, baseline wander, paced beats, and various arrhythmias. Interestingly, the proposed algorithm succeeded in scoring the highest overall accuracy of 98.84% over the manually annotated QT database (3542 heart beats) when compared to the other three algorithms (cf. Table 4). Moreover, the algorithm scored a high overall accuracy of 96.7% over the automaticlly annotated QT database (111,201 heart beats). Overall, simplicity and efficiency are required in developing T wave detection algorithms for processing long-term recordings and large databases as well as for expanding our telemedicine capabilities in the near future.
Acknowledgements
Mohamed Elgendi gratefully acknowledges the Australian government and Charles Darwin University whose generous scholarships towards his PhD set the foundation for this research. He appreciates the support of Friso De Boer and acknowledges Gari Clifford for helpful discussions.
Author Contributions
ME designed the experiment. ME, BE, and DA performed the statistical analysis. ME, BE, and DA conceived of the study and drafted the manuscript. The authors approved the final manuscript.
Conflicts of Interest
The authors declare no conflict of interest.
References
- Alwan, A. Global Status Report on Noncommunicable Diseases 2010; World Health Organization: Geneva, Switzerland, 2011. [Google Scholar]
- Dilaveris, P.E.; Gialafos, E.J.; Sideris, S.K.; Theopistou, A.M.; Andrikopoulos, G.K.; Kyriakidis, M.; Gialafos, J.E.; Toutouzas, P.K. Simple electrocardiographic markers for the prediction of paroxysmal idiopathic atrial fibrillation. Am. Heart J. 1998, 135, 733–738. [Google Scholar]
- Tsipouras, M.G.; Fotiadis, D.I.; Sideris, D. Arrhythmia classification using the RR-interval duration signal. Proceedings of 2002 Computers in Cardiology, 22–25 September 2002; pp. 485–488.
- Tran, T.; McNames, J.; Aboy, M.; Goldstein, B. Prediction of paroxysmal atrial fibrillation by analysis of atrial premature complexes. IEEE Trans. Biomed. Eng. 2004, 51, 561–569. [Google Scholar]
- De Chazal, P.; O'Dwyer, M.; Reilly, R.B. Automatic classification of heartbeats using ECG morphology and heartbeat interval features. IEEE Trans. Biomed. Eng. 2004, 51, 1196–1206. [Google Scholar]
- Krasteva, V.T.; Jekova, I.I.; Christov, I.I. Automatic detection of premature atrial contractions in the electrocardiogram. Electrotech. Electron. E+E 2006, 9–10, 49–55. [Google Scholar]
- Scholz, U.J.; Bianchi, A.M.; Cerutti, S.; Kubicki, S. Vegetative background of sleep: Spectral analysis of the heart rate variability. Physiol. Behav. 1997, 62, 1037–1043. [Google Scholar]
- Trinder, J.; Kleiman, J.; Carrington, M.; Smith, S.; Breen, S.; Tan, N.; Kim, Y. Autonomic activity during human sleep as a function of time and sleep stage. J. Sleep Res. 2001, 10, 253–264. [Google Scholar]
- Zapanta, L.; Poon, C.; White, D.; Marcus, C.; Katz, E. Heart rate chaos in obstructive sleep apnea in children. Proceedings of the 26th Annual International Conference of the IEEE Engineering in Medicine and Biology Society (IEMBS′04), San Francisco, CA, USA, 1–5 September 2004; pp. 3889–3892.
- Shouldice, R.; O'Brien, L.; O'Brien, C.; de Chazal, P.; Gozal, D.; Heneghan, C. Detection of obstructive sleep apnea in pediatric subjects using surface lead electrocardiogram features. Sleep 2004, 27, 784–792. [Google Scholar]
- Elgendi, M.; Eskofier, B.; Dokos, S.; Abbott, D. Revisiting QRS Detection Methodologies for Portable, Wearable, Battery-Operated, and Wireless ECG Systems. PLoS ONE 2014, 9, e84018. [Google Scholar]
- Goutas, A.; Ferdi, Y.; Herbeuval, J.P.; Boudraa, M.; Boucheham, B. Digital fractional order differentiation-based algorithm for P and T-waves detection and delineation. ITBM-RBM 2005, 26, 127–132. [Google Scholar]
- Wan, X.; Xu, D. An ECG T waves detection scheme based on the compensatory criterion. Proceedings of the 2010 3rd International Conference on Biomedical Engineering and Informatics (BMEI), Yantai, China, 16–18 October 2010; Volume 2, pp. 730–734.
- Vazquez-Seisdedos, C.; Neto, J.; Maranon Reyes, E.; Klautau, A.; de Oliveira, R.C.L. New approach for T-wave end detection on electrocardiogram: Performance in noisy conditions. Biomed. Eng. Online 2011, 10. [Google Scholar] [CrossRef]
- Nair, A.; Marziliano, P. P and T wave detectionon multichannel ECG using FRI. Proceedings of the 2014 36th Annual International Conference of the IEEE Engineering in Medicine and Biology Society (EMBC), Chicago, IL, USA, 26–30 August 2014; pp. 2269–2273.
- Clifford, G.D.; Azuaje, F.; McSharry, P. Advanced Methods and Tools for ECG Data Analysis; Artech House Inc.: Norwood, MA, USA, 2006. [Google Scholar]
- Hayden, G.; Brady, W.; Perron, A.; Somers, M.; Mattu, A. Electrocardiographic T-wave inversion: Differential diagnosis in the chest pain patient. Am. J. Emerg. Med. 2002, 20, 252–262. [Google Scholar]
- Michael, S.; Brady, W.; Perron, A.; Mattu, A. The prominent T wave: Electrocardiographic differential diagnosis. Am. J. Emerg. Med. 2002, 20, 243–251. [Google Scholar]
- Smith, D.; Nowacki, D.; Li, J.J. ECG T-Wave Monitor for Potential Early Detection and Diagnosis of Cardiac Arrhythmias. Cardiovasc. Eng. 2010, 10, 201–206. [Google Scholar]
- Moody, G.B.; Mark, R.G. The impact of the MIT-BIH Arrhythmia Database. IEEE Eng. Med. Biol. Mag. 2001, 20, 45–50. [Google Scholar]
- Goldberger, A.L.; Amaral, L.A.N.; Glass, L.; Hausdorff, J.M.; Ivanov, P.C.; Mark, R.G.; Mietus, J.E.; Moody, G.B.; Peng, C.K.; Stanley, H.E.; et al. PhysioBank, PhysioToolkit, and PhysioNet: Components of a New Research Resource for Complex Physiologic Signals. Circulation 2000, 101, e215–e220. [Google Scholar]
- Willems, J.L.; Arnaud, P.; Bemmel, J.H.V.; Bourdillon, P.J.; Degani, R.; Denis, B.; Graham, I.; Harms, F.M.; Macfarlane, P.W.; Mazzocca, G.; et al. A reference data base for multilead electrocardiographic computer measurement programs. J. Am. Coll. Cardiol. 1987, 10, 1313–1321. [Google Scholar]
- Elgendi, M. Annotation of P and T waves in MIT-BIH Arrhythmia Database. Available online: http://www.elgendi.net/databases.htm (accessed on 20 July 2015).
- Laguna, P.; Mark, R.G.; Goldberg, A.; Moody, G.B. A database for evaluation of algorithms for measurement of QT and other waveform intervals in the ECG. Proceedings of the IEEE Computers in Cardiology, Lund, Sweden, 7–10 September 1997; pp. 673–676.
- Elgendi, M. Fast QRS Detection with an Optimized Knowledge-Based Method: Evaluation on 11 Standard ECG Databases. PLoS ONE 2013, 8, e73557. [Google Scholar]
- Elgendi, M.; Jonkman, M.; de Boer, F. Frequency Bands Effects on QRS Detection. Proceedings of the 3rd International Conference on Bio-Inspired Systems and Signal Processing (BIOSIGNALS 2010), Valencia, Spain, 20–23 January 2010; pp. 428–431.
- Elgendi, M.; Norton, I.; Brearley, M.; Abbott, D.; Schuurmans, D. Systolic Peak Detection in Acceleration Photoplethysmograms Measured from Emergency Responders in Tropical Conditions. PLoS ONE 2013, 8, e76585. [Google Scholar]
- Elgendi, M.; Norton, I.; Brearley, M.; Abbott, D.; Schuurmans, D. Detection of a and b waves in the acceleration photoplethysmogram. Biomed. Eng. Online. 2014, 13. [Google Scholar] [CrossRef]
- Elgendi, M. Detection of c, d, and e waves in the acceleration photoplethysmogram. Comput. Methods Programs Biomed. 2014, 117, 125–136. [Google Scholar]
- Thakor, N.V.; Webster, J.G.; Tompkins, W.J. Optimal QRS detector. Med. Biol. Eng. 1983, 21, 343–350. [Google Scholar]
- Sahambi, J.S.; Tandon, S.N.; Bhatt, R.K.P. Using wavelet transforms for ECG characterization: An on-line digital signal processing system. IEEE Eng. Med. Biol. Mag. 1997, 16, 77–83. [Google Scholar]
- Roskamm, H.; Csapo, G. Disorders of Cardiac Function, 1st ed.; Dekker: New York, NY, USA, 1982. [Google Scholar]
- Elgendi, M.; Jonkman, M.; de Boer, F. Recognition of T waves in ECG signals. Proceedings of the IEEE 35th Annual Northeast Bioengineering Conference, Boston, MA, USA, 3–5 April 2009; pp. 1–2.
- Trahanias, P. An approach to QRS complex detection using mathematical morphology. IEEE Trans. Biomed. Eng. 1993, 40, 201–205. [Google Scholar]
- Laguna, P.; Thakor, N.; Caminal, P.; Jané, R.; Yoon, H.R.; de Luna, A.B.; Marti, V.; Guindo, J. New algorithm for QT interval analysis in 24-h Holter ECG: Performance and applications. Med. Biol. Eng. Comput. 1990, 28, 67–73. [Google Scholar]
- Schimpf, R.; Wolpert, C.; Bianchi, F.; Giustetto, C.; Gaita, F.; Bauersfeld, U.; Borggrefe, M. Congenital short QT syndrome and implantable cardioverter defibrillator treatment: Inherent risk for inappropriate shock delivery. J. Cardiovasc. Electrophysiol. 2003, 14, 1273–1277. [Google Scholar]
- Braunwald, E.; Zipes, D.; Libby, P.; Bonow, R. Braunwald's Heart Disease: A Textbook of Cardiovascular Medicine, 7th ed.; Saunders: Philadelphia, PA, USA, 2004. [Google Scholar]
- Martínez, J.P.; Almeida, R.; Olmos, S.; Rocha, A.P.; Laguna, P. A wavelet-based ECG delineator: Evaluation on standard databases. IEEE Trans. Biomed. Eng. 2004, 51, 570–581. [Google Scholar]
- Laguna, P.; Jané, R.; Caminal, P. Automatic detection of wave boundaries in multilead ECG signals: Validation with the CSE database. Comput. Biomed. Res. 1994, 27, 45–60. [Google Scholar]
- Vila, J.; Gang, Y.; Presedo, J.; Fernandez-Delgado, M.; Barro, S.; Malik, M. A new approach for TU complex characterization. IEEE Trans. Biomed. Eng. 2000, 47, 764–772. [Google Scholar]


| Record | No of beats | TP | FP | FN | SE (%) | +P (%) |
|---|---|---|---|---|---|---|
| 100 | 2274 | 2272 | 0 | 0 | 100.00 | 100.00 |
| 101 | 1866 | 1863 | 1 | 4 | 99.79 | 99.95 |
| 102 | 2187 | 2185 | 0 | 0 | 100.00 | 100.00 |
| 103 | 2084 | 2082 | 0 | 4 | 99.81 | 100.00 |
| 104 | 2229 | 2227 | 0 | 1 | 99.96 | 100.00 |
| 105 | 2602 | 2586 | 0 | 2 | 99.92 | 100.00 |
| 106 | 2026 | 2024 | 0 | 56 | 97.23 | 100.00 |
| 107 | 2136 | 2134 | 0 | 3 | 99.86 | 100.00 |
| 108 | 1763 | 1757 | 0 | 13 | 99.26 | 100.00 |
| 109 | 2533 | 2530 | 0 | 0 | 100.00 | 100.00 |
| 111 | 2123 | 2121 | 0 | 16 | 99.25 | 100.00 |
| 112 | 2539 | 2537 | 0 | 0 | 100.00 | 100.00 |
| 113 | 1794 | 1792 | 0 | 0 | 100.00 | 100.00 |
| 114 | 1890 | 1885 | 0 | 69 | 96.34 | 100.00 |
| 115 | 1953 | 1951 | 0 | 19 | 99.03 | 100.00 |
| 116 | 2395 | 2392 | 0 | 2 | 99.92 | 100.00 |
| 117 | 1535 | 1533 | 0 | 0 | 100.00 | 100.00 |
| 118 | 2278 | 2276 | 0 | 4 | 99.82 | 100.00 |
| 119 | 1988 | 1986 | 0 | 4 | 99.80 | 100.00 |
| 121 | 1863 | 1860 | 0 | 46 | 97.53 | 100.00 |
| 122 | 2476 | 2474 | 0 | 0 | 100.00 | 100.00 |
| 123 | 1519 | 1517 | 0 | 0 | 100.00 | 100.00 |
| 124 | 1619 | 1617 | 0 | 7 | 99.57 | 100.00 |
| 200 | 2601 | 2599 | 0 | 9 | 99.65 | 100.00 |
| 201 | 1949 | 1947 | 0 | 57 | 97.07 | 100.00 |
| 202 | 2138 | 2134 | 0 | 113 | 94.70 | 100.00 |
| 203 | 2988 | 2965 | 0 | 1 | 99.97 | 100.00 |
| 205 | 2656 | 2556 | 0 | 0 | 100.00 | 100.00 |
| 207 | 2324 | 2139 | 0 | 9 | 99.58 | 100.00 |
| 208 | 2953 | 2949 | 0 | 0 | 100.00 | 100.00 |
| 209 | 3006 | 3003 | 0 | 5 | 99.83 | 100.00 |
| 210 | 2652 | 2637 | 0 | 0 | 100.00 | 100.00 |
| 212 | 2748 | 2746 | 0 | 0 | 100.00 | 100.00 |
| 213 | 3250 | 3247 | 0 | 0 | 100.00 | 100.00 |
| 214 | 2262 | 2184 | 0 | 0 | 100.00 | 100.00 |
| 215 | 3362 | 3354 | 0 | 0 | 100.00 | 100.00 |
| 217 | 2208 | 2205 | 0 | 3 | 99.86 | 100.00 |
| 219 | 2154 | 2152 | 0 | 144 | 93.31 | 100.00 |
| 220 | 2048 | 2046 | 0 | 2 | 99.90 | 100.00 |
| 221 | 2427 | 2424 | 0 | 0 | 100.00 | 100.00 |
| 222 | 2485 | 2472 | 0 | 33 | 98.67 | 100.00 |
| 223 | 2604 | 2601 | 0 | 1 | 99.96 | 100.00 |
| 228 | 2060 | 2056 | 0 | 52 | 97.47 | 100.00 |
| 230 | 2256 | 2254 | 0 | 39 | 98.27 | 100.00 |
| 231 | 1571 | 1569 | 0 | 0 | 100.00 | 100.00 |
| 232 | 1783 | 1781 | 0 | 1 | 99.94 | 100.00 |
| 233 | 3077 | 2914 | 0 | 1 | 99.97 | 100.00 |
| 234 | 2751 | 2749 | 0 | 0 | 100.00 | 100.00 |
| 109985 | 109284 | 1 | 720 | 99.28 | 100.00 | |
| Record | No of beats | TP | FP | FN | SE (%) | +P (%) |
|---|---|---|---|---|---|---|
| sel100 | 30 | 30 | 0 | 0 | 100.00 | 100.00 |
| sel102 | 85 | 85 | 0 | 0 | 100.00 | 100.00 |
| sel103 | 30 | 30 | 0 | 0 | 100.00 | 100.00 |
| sel104 | 77 | 75 | 0 | 0 | 100.00 | 100.00 |
| sel114 | 50 | 50 | 0 | 0 | 100.00 | 100.00 |
| sel116 | 50 | 49 | 0 | 0 | 100.00 | 100.00 |
| sel117 | 30 | 30 | 0 | 0 | 100.00 | 100.00 |
| sel123 | 30 | 30 | 0 | 0 | 100.00 | 100.00 |
| sel213 | 71 | 71 | 0 | 0 | 100.00 | 100.00 |
| sel221 | 30 | 29 | 1 | 1 | 96.67 | 96.67 |
| sel223 | 31 | 31 | 0 | 0 | 100.00 | 100.00 |
| sel230 | 50 | 42 | 9 | 8 | 84.00 | 82.35 |
| sel231 | 50 | 50 | 0 | 0 | 100.00 | 100.00 |
| sel232 | 30 | 30 | 0 | 0 | 100.00 | 100.00 |
| sel233 | 30 | 30 | 0 | 0 | 100.00 | 100.00 |
| sel301 | 30 | 30 | 0 | 0 | 100.00 | 100.00 |
| sel302 | 30 | 30 | 0 | 0 | 100.00 | 100.00 |
| sel306 | 36 | 32 | 0 | 0 | 100.00 | 100.00 |
| sel307 | 30 | 30 | 0 | 0 | 100.00 | 100.00 |
| sel308 | 50 | 40 | 10 | 10 | 80.00 | 80.00 |
| sel310 | 30 | 30 | 0 | 0 | 100.00 | 100.00 |
| sel803 | 30 | 30 | 4 | 0 | 100.00 | 88.24 |
| sel808 | 30 | 30 | 0 | 0 | 100.00 | 100.00 |
| sel811 | 30 | 30 | 0 | 0 | 100.00 | 100.00 |
| sel820 | 30 | 30 | 0 | 0 | 100.00 | 100.00 |
| sel821 | 30 | 30 | 0 | 0 | 100.00 | 100.00 |
| sel840 | 70 | 70 | 0 | 0 | 100.00 | 100.00 |
| sel847 | 33 | 33 | 0 | 0 | 100.00 | 100.00 |
| sel853 | 30 | 30 | 0 | 0 | 100.00 | 100.00 |
| sel871 | 70 | 70 | 0 | 0 | 100.00 | 100.00 |
| sel872 | 30 | 30 | 0 | 0 | 100.00 | 100.00 |
| sel873 | 33 | 33 | 0 | 0 | 100.00 | 100.00 |
| sel883 | 30 | 30 | 0 | 0 | 100.00 | 100.00 |
| sel891 | 71 | 71 | 0 | 0 | 100.00 | 100.00 |
| sel16265 | 30 | 30 | 0 | 0 | 100.00 | 100.00 |
| sel16272 | 30 | 30 | 0 | 0 | 100.00 | 100.00 |
| sel16273 | 30 | 30 | 0 | 0 | 100.00 | 100.00 |
| sel16420 | 30 | 30 | 0 | 0 | 100.00 | 100.00 |
| sel16483 | 30 | 30 | 0 | 0 | 100.00 | 100.00 |
| sel16539 | 30 | 30 | 0 | 0 | 100.00 | 100.00 |
| sel16773 | 30 | 21 | 9 | 9 | 70.00 | 70.00 |
| sel16786 | 30 | 30 | 0 | 0 | 100.00 | 100.00 |
| sel16795 | 30 | 30 | 0 | 0 | 100.00 | 100.00 |
| sel17453 | 30 | 30 | 0 | 0 | 100.00 | 100.00 |
| sele0104 | 30 | 30 | 0 | 0 | 100.00 | 100.00 |
| sele0106 | 30 | 30 | 0 | 0 | 100.00 | 100.00 |
| sele0107 | 34 | 34 | 0 | 0 | 100.00 | 100.00 |
| sele0110 | 30 | 30 | 0 | 0 | 100.00 | 100.00 |
| sele0111 | 30 | 30 | 0 | 0 | 100.00 | 100.00 |
| sele0112 | 50 | 50 | 0 | 0 | 100.00 | 100.00 |
| sele0114 | 30 | 30 | 0 | 0 | 100.00 | 100.00 |
| sele0116 | 30 | 30 | 0 | 0 | 100.00 | 100.00 |
| sele0121 | 30 | 30 | 0 | 0 | 100.00 | 100.00 |
| sele0122 | 30 | 30 | 0 | 0 | 100.00 | 100.00 |
| sele0124 | 50 | 50 | 0 | 0 | 100.00 | 100.00 |
| sele0126 | 30 | 25 | 4 | 5 | 83.33 | 86.21 |
| sele0129 | 30 | 30 | 0 | 0 | 100.00 | 100.00 |
| sele0133 | 30 | 30 | 0 | 0 | 100.00 | 100.00 |
| sele0136 | 30 | 30 | 0 | 0 | 100.00 | 100.00 |
| sele0166 | 36 | 36 | 0 | 0 | 100.00 | 100.00 |
| sele0170 | 30 | 30 | 0 | 0 | 100.00 | 100.00 |
| sele0203 | 30 | 30 | 0 | 0 | 100.00 | 100.00 |
| sele0210 | 30 | 30 | 0 | 0 | 100.00 | 100.00 |
| sele0211 | 30 | 30 | 0 | 0 | 100.00 | 100.00 |
| sele0303 | 30 | 30 | 0 | 0 | 100.00 | 100.00 |
| sele0405 | 30 | 30 | 0 | 0 | 100.00 | 100.00 |
| sele0406 | 31 | 31 | 0 | 0 | 100.00 | 100.00 |
| sele0409 | 30 | 30 | 0 | 0 | 100.00 | 100.00 |
| sele0411 | 30 | 30 | 0 | 0 | 100.00 | 100.00 |
| sele0509 | 30 | 30 | 0 | 0 | 100.00 | 100.00 |
| sele0603 | 30 | 30 | 0 | 0 | 100.00 | 100.00 |
| sele0604 | 30 | 30 | 0 | 0 | 100.00 | 100.00 |
| sele0606 | 30 | 30 | 0 | 0 | 100.00 | 100.00 |
| sele0607 | 30 | 30 | 0 | 0 | 100.00 | 100.00 |
| sele0609 | 30 | 30 | 0 | 0 | 100.00 | 100.00 |
| sele0612 | 30 | 30 | 0 | 0 | 100.00 | 100.00 |
| sele0704 | 30 | 30 | 0 | 0 | 100.00 | 100.00 |
| sel30 | 30 | 30 | 0 | 0 | 100.00 | 100.00 |
| sel31 | 30 | 26 | 4 | 4 | 86.67 | 86.67 |
| sel32 | 30 | 30 | 0 | 0 | 100.00 | 100.00 |
| sel33 | 30 | 30 | 0 | 0 | 100.00 | 100.00 |
| sel34 | 30 | 30 | 0 | 0 | 100.00 | 100.00 |
| sel36 | 31 | 30 | 1 | 1 | 96.77 | 96.77 |
| sel38 | 30 | 30 | 0 | 0 | 100.00 | 100.00 |
| sel40 | 30 | 30 | 1 | 0 | 100.00 | 96.77 |
| sel41 | 30 | 30 | 0 | 0 | 100.00 | 100.00 |
| sel42 | 30 | 30 | 0 | 0 | 100.00 | 100.00 |
| sel43 | 30 | 28 | 0 | 0 | 100.00 | 100.00 |
| sel44 | 30 | 30 | 0 | 0 | 100.00 | 100.00 |
| sel45 | 30 | 29 | 1 | 1 | 96.67 | 96.67 |
| sel46 | 30 | 30 | 0 | 0 | 100.00 | 100.00 |
| sel47 | 30 | 27 | 2 | 2 | 93.10 | 93.10 |
| sel48 | 30 | 30 | 0 | 0 | 100.00 | 100.00 |
| sel49 | 30 | 30 | 0 | 0 | 100.00 | 100.00 |
| sel50 | 30 | 30 | 0 | 0 | 100.00 | 100.00 |
| sel51 | 32 | 32 | 0 | 0 | 100.00 | 100.00 |
| sel51 | 30 | 30 | 0 | 0 | 100.00 | 100.00 |
| sel52 | 30 | 30 | 0 | 0 | 100.00 | 100.00 |
| sel17152 | 30 | 30 | 0 | 0 | 100.00 | 100.00 |
| sel14046 | 31 | 31 | 0 | 0 | 100.00 | 100.00 |
| sel14157 | 30 | 30 | 0 | 0 | 100.00 | 100.00 |
| sel14172 | 50 | 50 | 0 | 0 | 100.00 | 100.00 |
| sel15814 | 30 | 30 | 0 | 0 | 100.00 | 100.00 |
| 3542 | 3491 | 46 | 41 | 98.90 | 98.77 | |
| Record | No of beats | TP | FP | FN | SE (%) | +P (%) |
|---|---|---|---|---|---|---|
| sel100 | 1134 | 1132 | 0 | 1 | 99.91 | 100.00 |
| sel102 | 1088 | 1086 | 0 | 2 | 99.82 | 100.00 |
| sel103 | 1048 | 1046 | 4 | 5 | 99.52 | 99.62 |
| sel104 | 1109 | 1107 | 9 | 10 | 99.10 | 99.19 |
| sel114 | 867 | 864 | 1 | 7 | 99.19 | 99.88 |
| sel116 | 1186 | 1184 | 0 | 25 | 97.89 | 100.00 |
| sel117 | 766 | 764 | 0 | 1 | 99.87 | 100.00 |
| sel123 | 756 | 754 | 0 | 0 | 100.00 | 100.00 |
| sel213 | 1641 | 1639 | 1 | 2 | 99.88 | 99.94 |
| sel221 | 1247 | 1244 | 0 | 116 | 90.68 | 100.00 |
| sel223 | 1309 | 1307 | 0 | 6 | 99.54 | 100.00 |
| sel230 | 1077 | 1075 | 115 | 200 | 81.41 | 88.40 |
| sel231 | 732 | 730 | 0 | 1 | 99.86 | 100.00 |
| sel232 | 866 | 864 | 18 | 19 | 97.80 | 97.92 |
| sel233 | 1532 | 1265 | 13 | 112 | 91.79 | 98.97 |
| sel301 | 1352 | 1348 | 0 | 0 | 100.00 | 100.00 |
| sel302 | 1501 | 1498 | 1 | 2 | 99.87 | 99.93 |
| sel306 | 1040 | 1038 | 0 | 30 | 97.11 | 100.00 |
| sel307 | 853 | 851 | 0 | 1 | 99.88 | 100.00 |
| sel308 | 1294 | 1292 | 19 | 21 | 98.38 | 98.53 |
| sel310 | 2012 | 2008 | 0 | 3 | 99.85 | 100.00 |
| sel803 | 1026 | 1024 | 0 | 84 | 91.80 | 100.00 |
| sel808 | 903 | 901 | 24 | 29 | 96.78 | 97.32 |
| sel811 | 704 | 702 | 0 | 1 | 99.86 | 100.00 |
| sel820 | 1159 | 1157 | 1 | 3 | 99.74 | 99.91 |
| sel821 | 1557 | 1555 | 2 | 3 | 99.81 | 99.87 |
| sel840 | 1180 | 1178 | 1 | 2 | 99.83 | 99.92 |
| sel847 | 803 | 799 | 0 | 3 | 99.62 | 100.00 |
| sel853 | 1113 | 1110 | 6 | 8 | 99.28 | 99.46 |
| sel871 | 917 | 915 | 2 | 3 | 99.67 | 99.78 |
| sel872 | 990 | 988 | 0 | 2 | 99.80 | 100.00 |
| sel873 | 859 | 857 | 0 | 1 | 99.88 | 100.00 |
| sel883 | 892 | 890 | 30 | 36 | 95.96 | 96.61 |
| sel891 | 1267 | 1265 | 0 | 1 | 99.92 | 100.00 |
| sel16265 | 1031 | 1029 | 10 | 11 | 98.93 | 99.03 |
| sel16272 | 851 | 849 | 0 | 1 | 99.88 | 100.00 |
| sel16273 | 1112 | 1110 | 4 | 5 | 99.55 | 99.64 |
| sel16420 | 1063 | 1061 | 0 | 1 | 99.91 | 100.00 |
| sel16483 | 1087 | 1085 | 1 | 2 | 99.82 | 99.91 |
| sel16539 | 922 | 920 | 0 | 1 | 99.89 | 100.00 |
| sel16773 | 1008 | 1006 | 168 | 328 | 67.43 | 80.17 |
| sel16786 | 925 | 923 | 0 | 1 | 99.89 | 100.00 |
| sel16795 | 761 | 759 | 0 | 1 | 99.87 | 100.00 |
| sel17453 | 1047 | 1045 | 0 | 1 | 99.90 | 100.00 |
| sele0104 | 804 | 802 | 0 | 1 | 99.88 | 100.00 |
| sele0106 | 897 | 894 | 0 | 1 | 99.89 | 100.00 |
| sele0107 | 823 | 810 | 25 | 34 | 95.81 | 96.88 |
| sele0110 | 872 | 870 | 1 | 3 | 99.66 | 99.88 |
| sele0111 | 908 | 906 | 1 | 1 | 99.89 | 99.89 |
| sele0112 | 684 | 682 | 121 | 189 | 72.33 | 80.33 |
| sele0114 | 698 | 696 | 23 | 28 | 95.98 | 96.68 |
| sele0116 | 560 | 557 | 1 | 3 | 99.46 | 99.82 |
| sele0121 | 1434 | 1432 | 2 | 2 | 99.86 | 99.86 |
| sele0122 | 1414 | 1412 | 0 | 1 | 99.93 | 100.00 |
| sele0124 | 1121 | 1119 | 4 | 5 | 99.55 | 99.64 |
| sele0126 | 945 | 943 | 83 | 793 | 16.00 | 64.53 |
| sele0129 | 672 | 670 | 40 | 55 | 91.80 | 93.90 |
| sele0133 | 840 | 838 | 0 | 1 | 99.88 | 100.00 |
| sele0136 | 810 | 808 | 3 | 4 | 99.51 | 99.63 |
| sele0166 | 813 | 811 | 0 | 1 | 99.88 | 100.00 |
| sele0170 | 897 | 895 | 0 | 1 | 99.89 | 100.00 |
| sele0203 | 1246 | 1244 | 0 | 4 | 99.68 | 100.00 |
| sele0210 | 1063 | 1061 | 0 | 1 | 99.91 | 100.00 |
| sele0211 | 1575 | 1573 | 0 | 1 | 99.94 | 100.00 |
| sele0303 | 1045 | 1043 | 1 | 2 | 99.81 | 99.90 |
| sele0405 | 1216 | 1214 | 0 | 57 | 95.30 | 100.00 |
| sele0406 | 959 | 957 | 0 | 1 | 99.90 | 100.00 |
| sele0409 | 1737 | 1735 | 0 | 1 | 99.94 | 100.00 |
| sele0411 | 1202 | 1200 | 0 | 2 | 99.83 | 100.00 |
| sele0509 | 1028 | 1026 | 0 | 39 | 96.20 | 100.00 |
| sele0603 | 869 | 867 | 30 | 84 | 90.33 | 96.32 |
| sele0604 | 1031 | 1029 | 0 | 2 | 99.81 | 100.00 |
| sele0606 | 1442 | 1440 | 0 | 4 | 99.72 | 100.00 |
| sele0607 | 1184 | 1182 | 0 | 0 | 100.00 | 100.00 |
| sele0609 | 1127 | 1125 | 3 | 4 | 99.64 | 99.73 |
| sele0612 | 751 | 749 | 0 | 1 | 99.87 | 100.00 |
| sele0704 | 1094 | 1092 | 0 | 214 | 80.40 | 100.00 |
| sel30 | 1018 | 1014 | 0 | 3 | 99.70 | 100.00 |
| sel31 | 1087 | 1084 | 45 | 385 | 64.52 | 93.96 |
| sel32 | 1196 | 1194 | 0 | 3 | 99.75 | 100.00 |
| sel33 | 527 | 525 | 0 | 4 | 99.24 | 100.00 |
| sel34 | 897 | 895 | 0 | 0 | 100.00 | 100.00 |
| sel35 | 882 | 880 | 0 | 384 | 56.36 | 100.00 |
| sel36 | 948 | 946 | 135 | 227 | 76.03 | 84.21 |
| sel37 | 682 | 679 | 0 | 511 | 24.74 | 100.00 |
| sel38 | 1563 | 1561 | 0 | 0 | 100.00 | 100.00 |
| sel40 | 1171 | 1169 | 0 | 9 | 99.23 | 100.00 |
| sel41 | 1069 | 1067 | 0 | 24 | 97.75 | 100.00 |
| sel42 | 1366 | 1363 | 2 | 24 | 98.24 | 99.85 |
| sel43 | 1247 | 1245 | 0 | 63 | 94.94 | 100.00 |
| sel44 | 1430 | 1427 | 0 | 46 | 96.78 | 100.00 |
| sel45 | 1337 | 1335 | 0 | 57 | 95.73 | 100.00 |
| sel46 | 971 | 968 | 66 | 96 | 90.09 | 92.97 |
| sel47 | 856 | 854 | 0 | 98 | 88.52 | 100.00 |
| sel48 | 886 | 884 | 0 | 88 | 90.05 | 100.00 |
| sel49 | 1398 | 1396 | 0 | 4 | 99.71 | 100.00 |
| sel50 | 833 | 831 | 0 | 4 | 99.52 | 100.00 |
| sel51 | 661 | 659 | 0 | 32 | 95.14 | 100.00 |
| sel51 | 749 | 747 | 0 | 29 | 96.12 | 100.00 |
| sel52 | 1411 | 1409 | 0 | 1 | 99.93 | 100.00 |
| sel17152 | 1628 | 1626 | 0 | 0 | 100.00 | 100.00 |
| sel14046 | 1260 | 1258 | 0 | 0 | 100.00 | 100.00 |
| sel14157 | 1081 | 1079 | 0 | 9 | 99.17 | 100.00 |
| sel14172 | 663 | 661 | 0 | 73 | 88.96 | 100.00 |
| sel15814 | 1036 | 1034 | 0 | 34 | 96.71 | 100.00 |
| 111201 | 110696 | 1016 | 4840 | 95.00 | 98.59 | |
| Publication | Method | # Beats | Annotation (File Name) | SE | +P |
|---|---|---|---|---|---|
| This work | Blocks of interest | 111,201 | Automatic (.pu) | 95.0 | 98.59 |
| This work | Blocks of interest | 3542 | Manual (.q1c) | 98.90 | 98.77 |
| Martinez et al. [38] | Wavelet | 3542 | Manual (.q1c) | 99.77 | 97.79 |
| Laguna et al. [39] | Low-pass-differentiator | 3542 | Manual (.q1c) | 99.0 | 97.74 |
| Vila et al. [40] | Modelling | 3542 | Manual (.q1c) | 96.2 | N/R |
© 2015 by the authors; licensee MDPI, Basel, Switzerland. This article is an open access article distributed under the terms and conditions of the Creative Commons Attribution license (http://creativecommons.org/licenses/by/4.0/).
Share and Cite
Elgendi, M.; Eskofier, B.; Abbott, D. Fast T Wave Detection Calibrated by Clinical Knowledge with Annotation of P and T Waves. Sensors 2015, 15, 17693-17714. https://doi.org/10.3390/s150717693
Elgendi M, Eskofier B, Abbott D. Fast T Wave Detection Calibrated by Clinical Knowledge with Annotation of P and T Waves. Sensors. 2015; 15(7):17693-17714. https://doi.org/10.3390/s150717693
Chicago/Turabian StyleElgendi, Mohamed, Bjoern Eskofier, and Derek Abbott. 2015. "Fast T Wave Detection Calibrated by Clinical Knowledge with Annotation of P and T Waves" Sensors 15, no. 7: 17693-17714. https://doi.org/10.3390/s150717693