
Estimation of Prestress Force Distribution in the Multi-Strand System of Prestressed Concrete Structures


Abstract
:1. Introduction

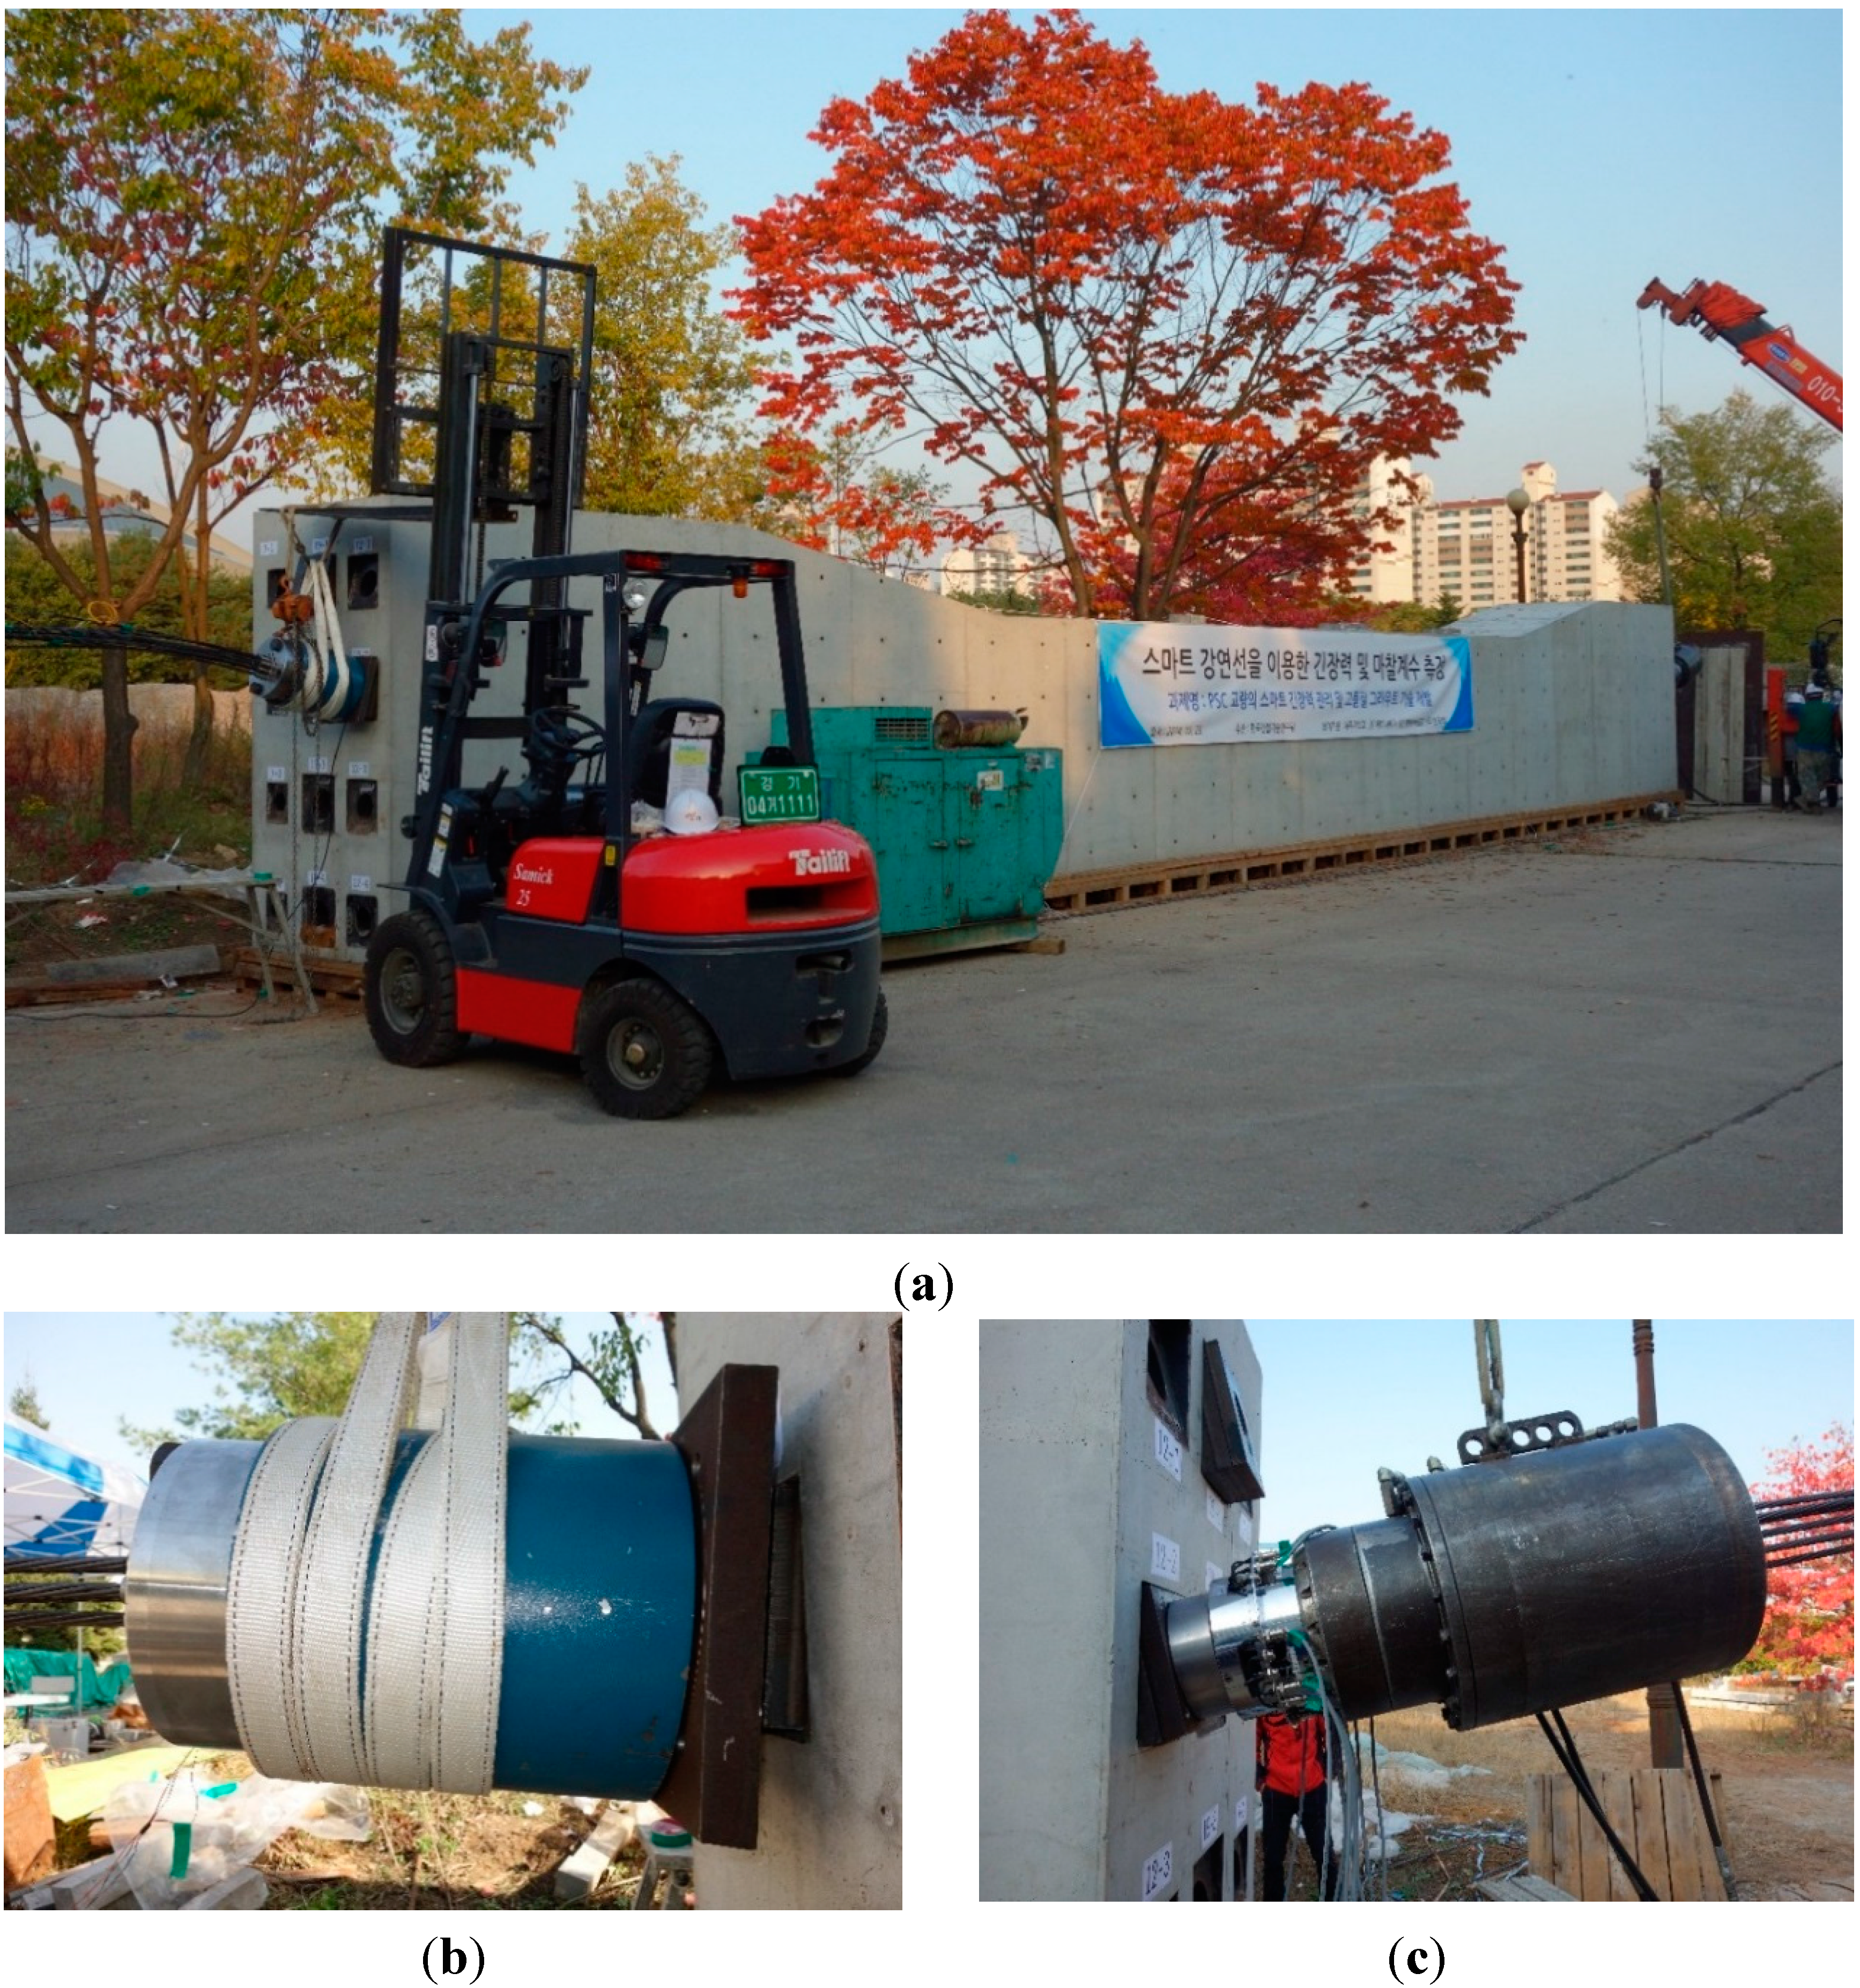
2. Experimental Section


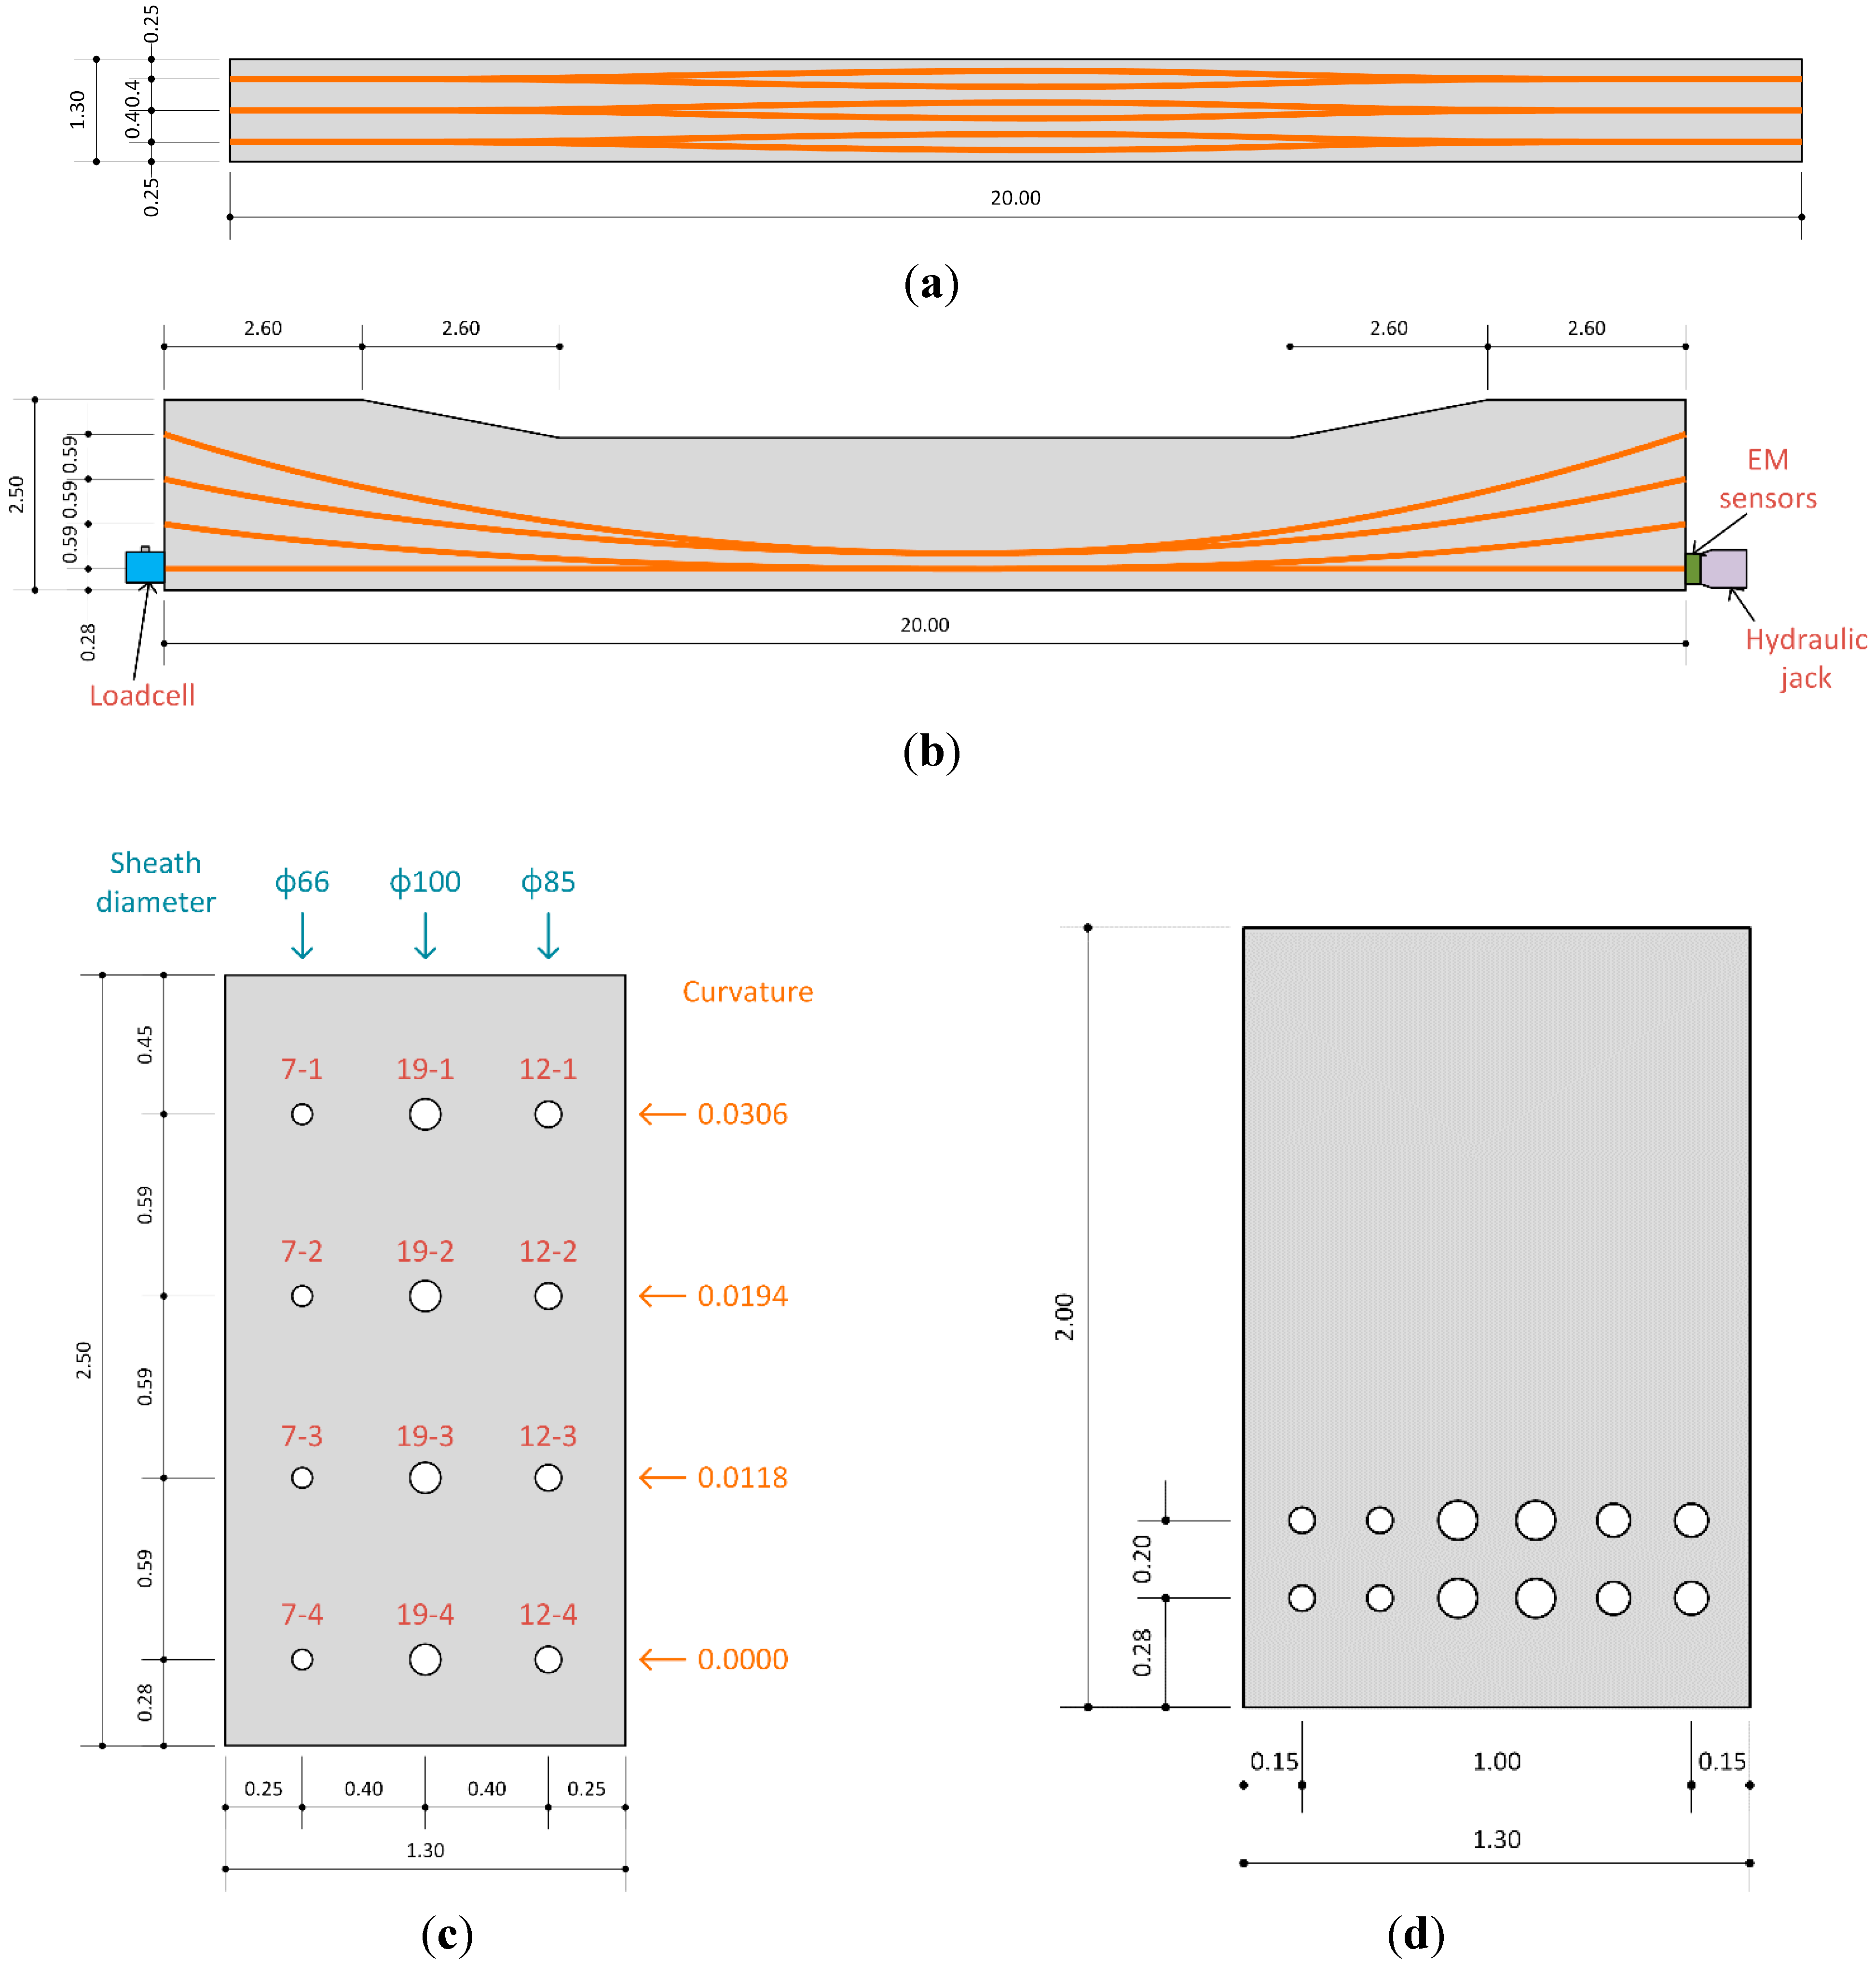
| Designation | Number of Tendons | Diameter of Sheath (mm) | Curvature (1/m) |
|---|---|---|---|
| 7-1 | 7 | 66 | 0.0306 |
| 7-2 | 0.0194 | ||
| 7-3 | 0.0118 | ||
| 7-4 | 0.0000 | ||
| 12-1 | 12 | 85 | 0.0306 |
| 12-2 | 0.0194 | ||
| 12-3 | 0.0118 | ||
| 12-4 | 0.0000 | ||
| 19-1 | 19 | 100 | 0.0306 |
| 19-2 | 0.0194 | ||
| 19-3 | 0.0118 | ||
| 19-4 | 0.0000 |

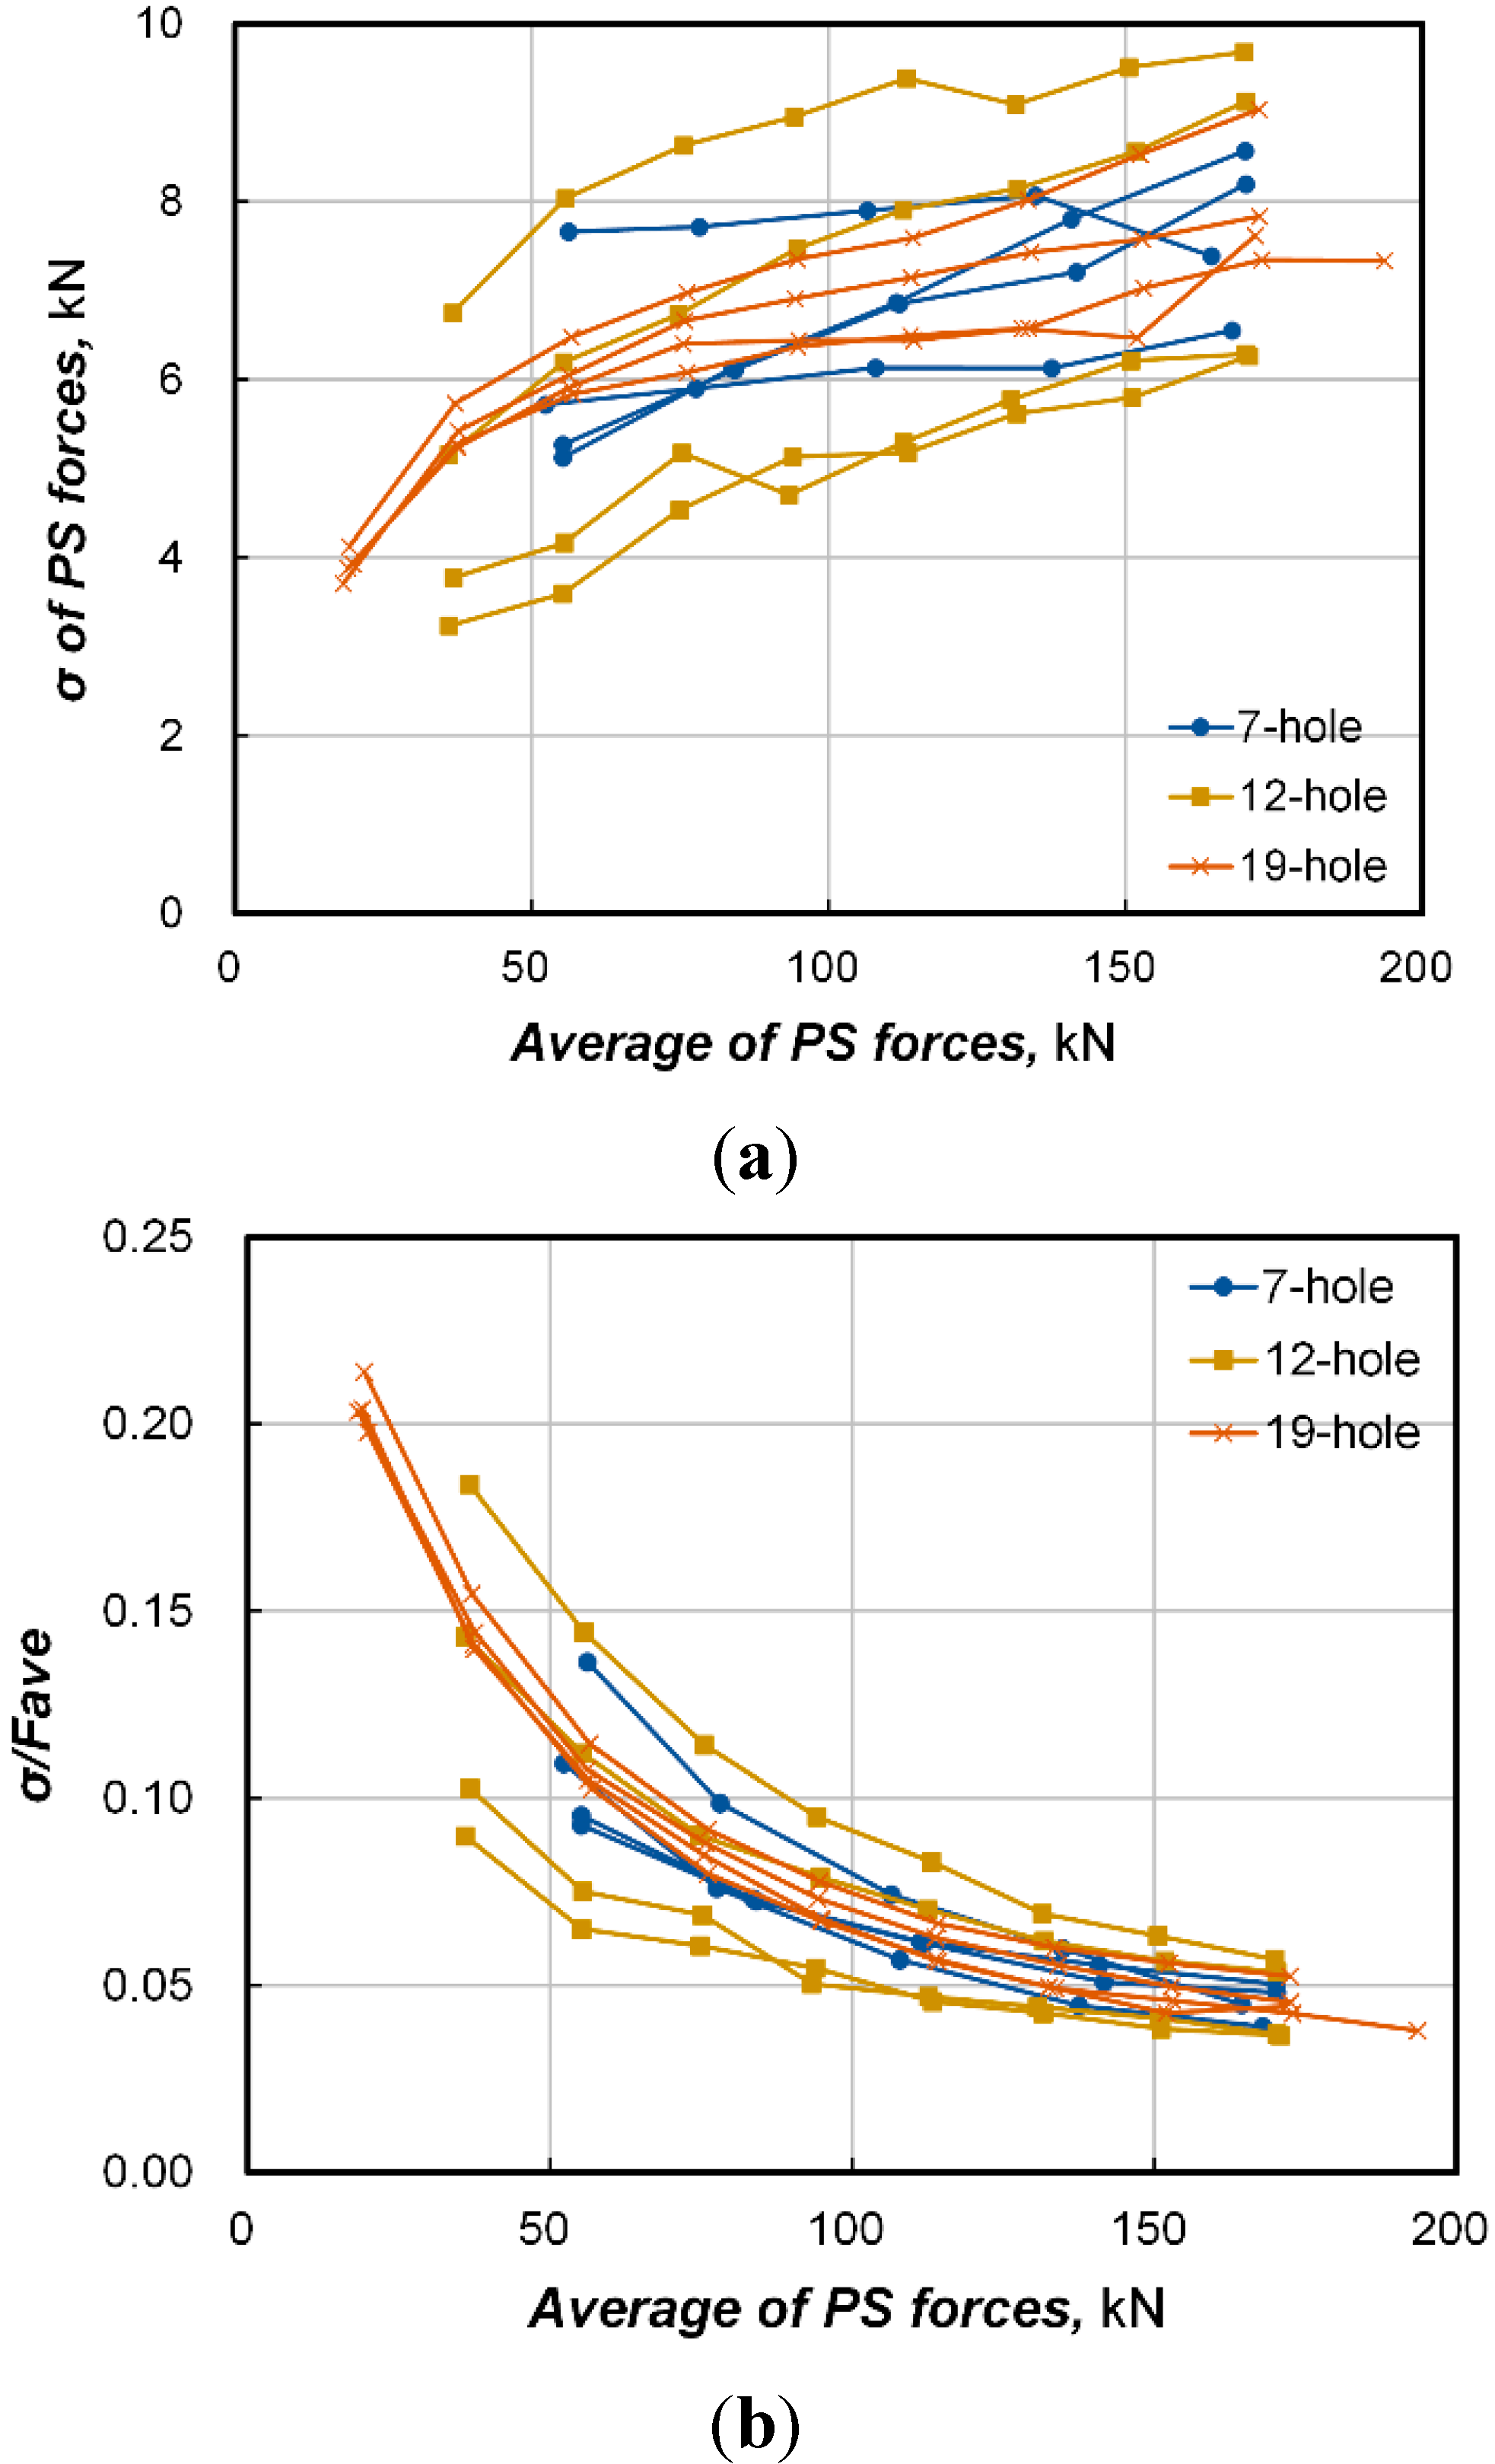
3. Results
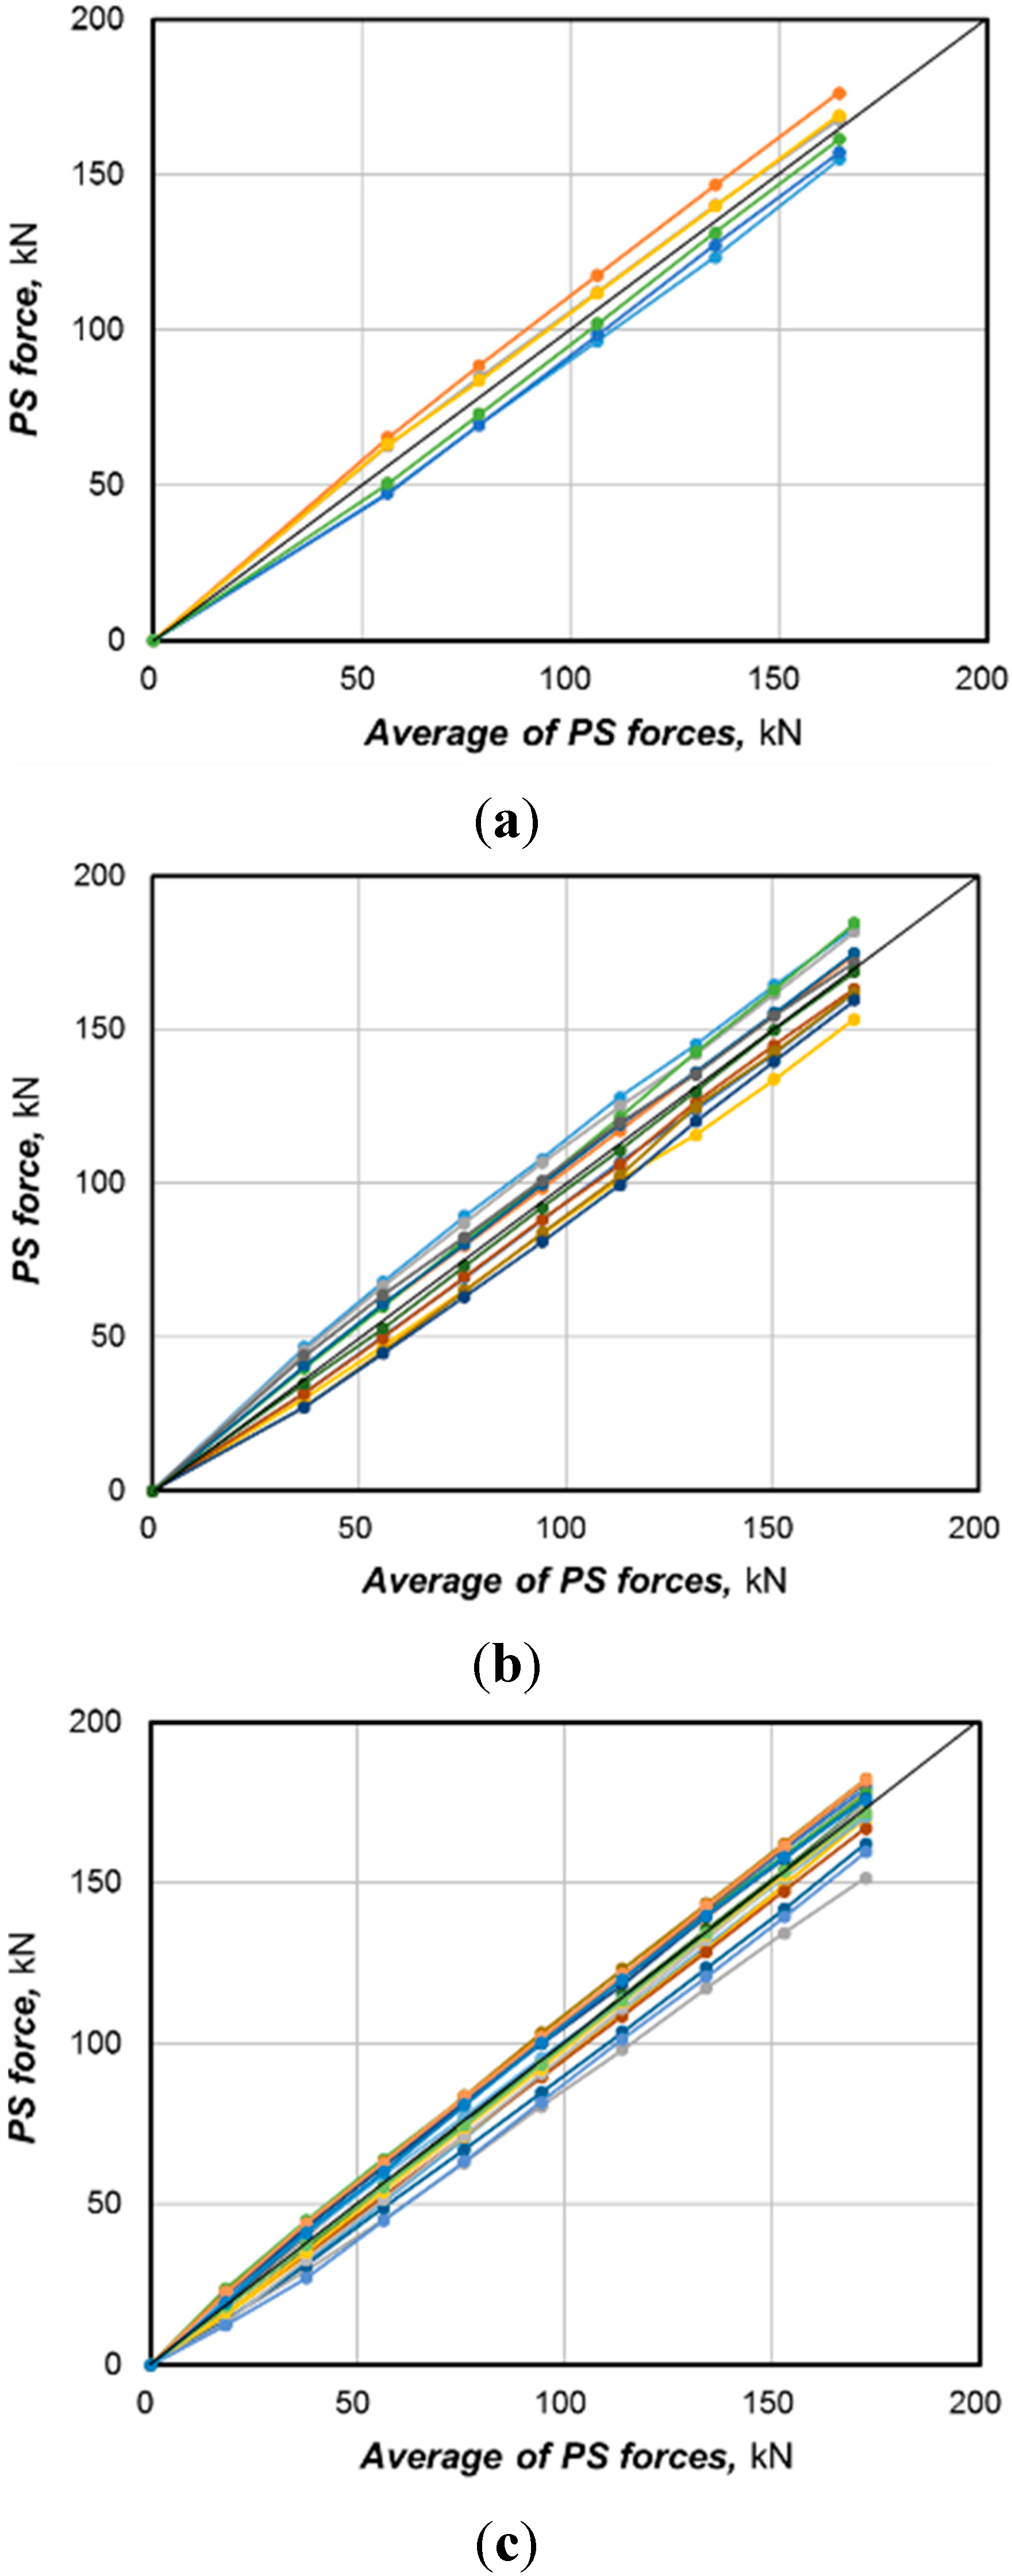
| Specimen | Number of Holes | Curvature, 1/m | Average Prestress Force, kN | Std. Deviation of Prestress Force, kN | Min. Prestress Force, kN | Min. Prestress Force, kN |
|---|---|---|---|---|---|---|
| 7-1 | 7 | 0.0306 | 164.5 | 7.4 | 155.0 | 176.4 |
| 7-2 | 7 | 0.0194 | 168.0 | 6.6 | 158.8 | 177.9 |
| 7-3 | 7 | 0.0118 | 170.2 | 8.6 | 156.7 | 187.8 |
| 7-4 | 7 | 0.0000 | 170.3 | 8.2 | 160.1 | 187.8 |
| 12-1 | 12 | 0.0306 | 170.0 | 9.7 | 153.5 | 184.7 |
| 12-2 | 12 | 0.0194 | 170.3 | 9.1 | 155.4 | 183.8 |
| 12-3 | 12 | 0.0118 | 170.8 | 6.3 | 161.2 | 181.7 |
| 12-4 | 12 | 0.0000 | 170.3 | 6.3 | 161.1 | 183.9 |
| 19-1 | 19 | 0.0306 | 172.5 | 7.8 | 151.5 | 182.3 |
| 19-2 | 19 | 0.0194 | 172.9 | 7.3 | 158.7 | 190.6 |
| 19-3 | 19 | 0.0118 | 172.5 | 9.0 | 148.6 | 187.2 |
| 19-4 | 19 | 0.0000 | 171.8 | 7.6 | 159.2 | 188.6 |
| Average | 170.3 | 7.8 | 156.7 | 184.4 | ||

4. Discussion
4.1. Check for Normality

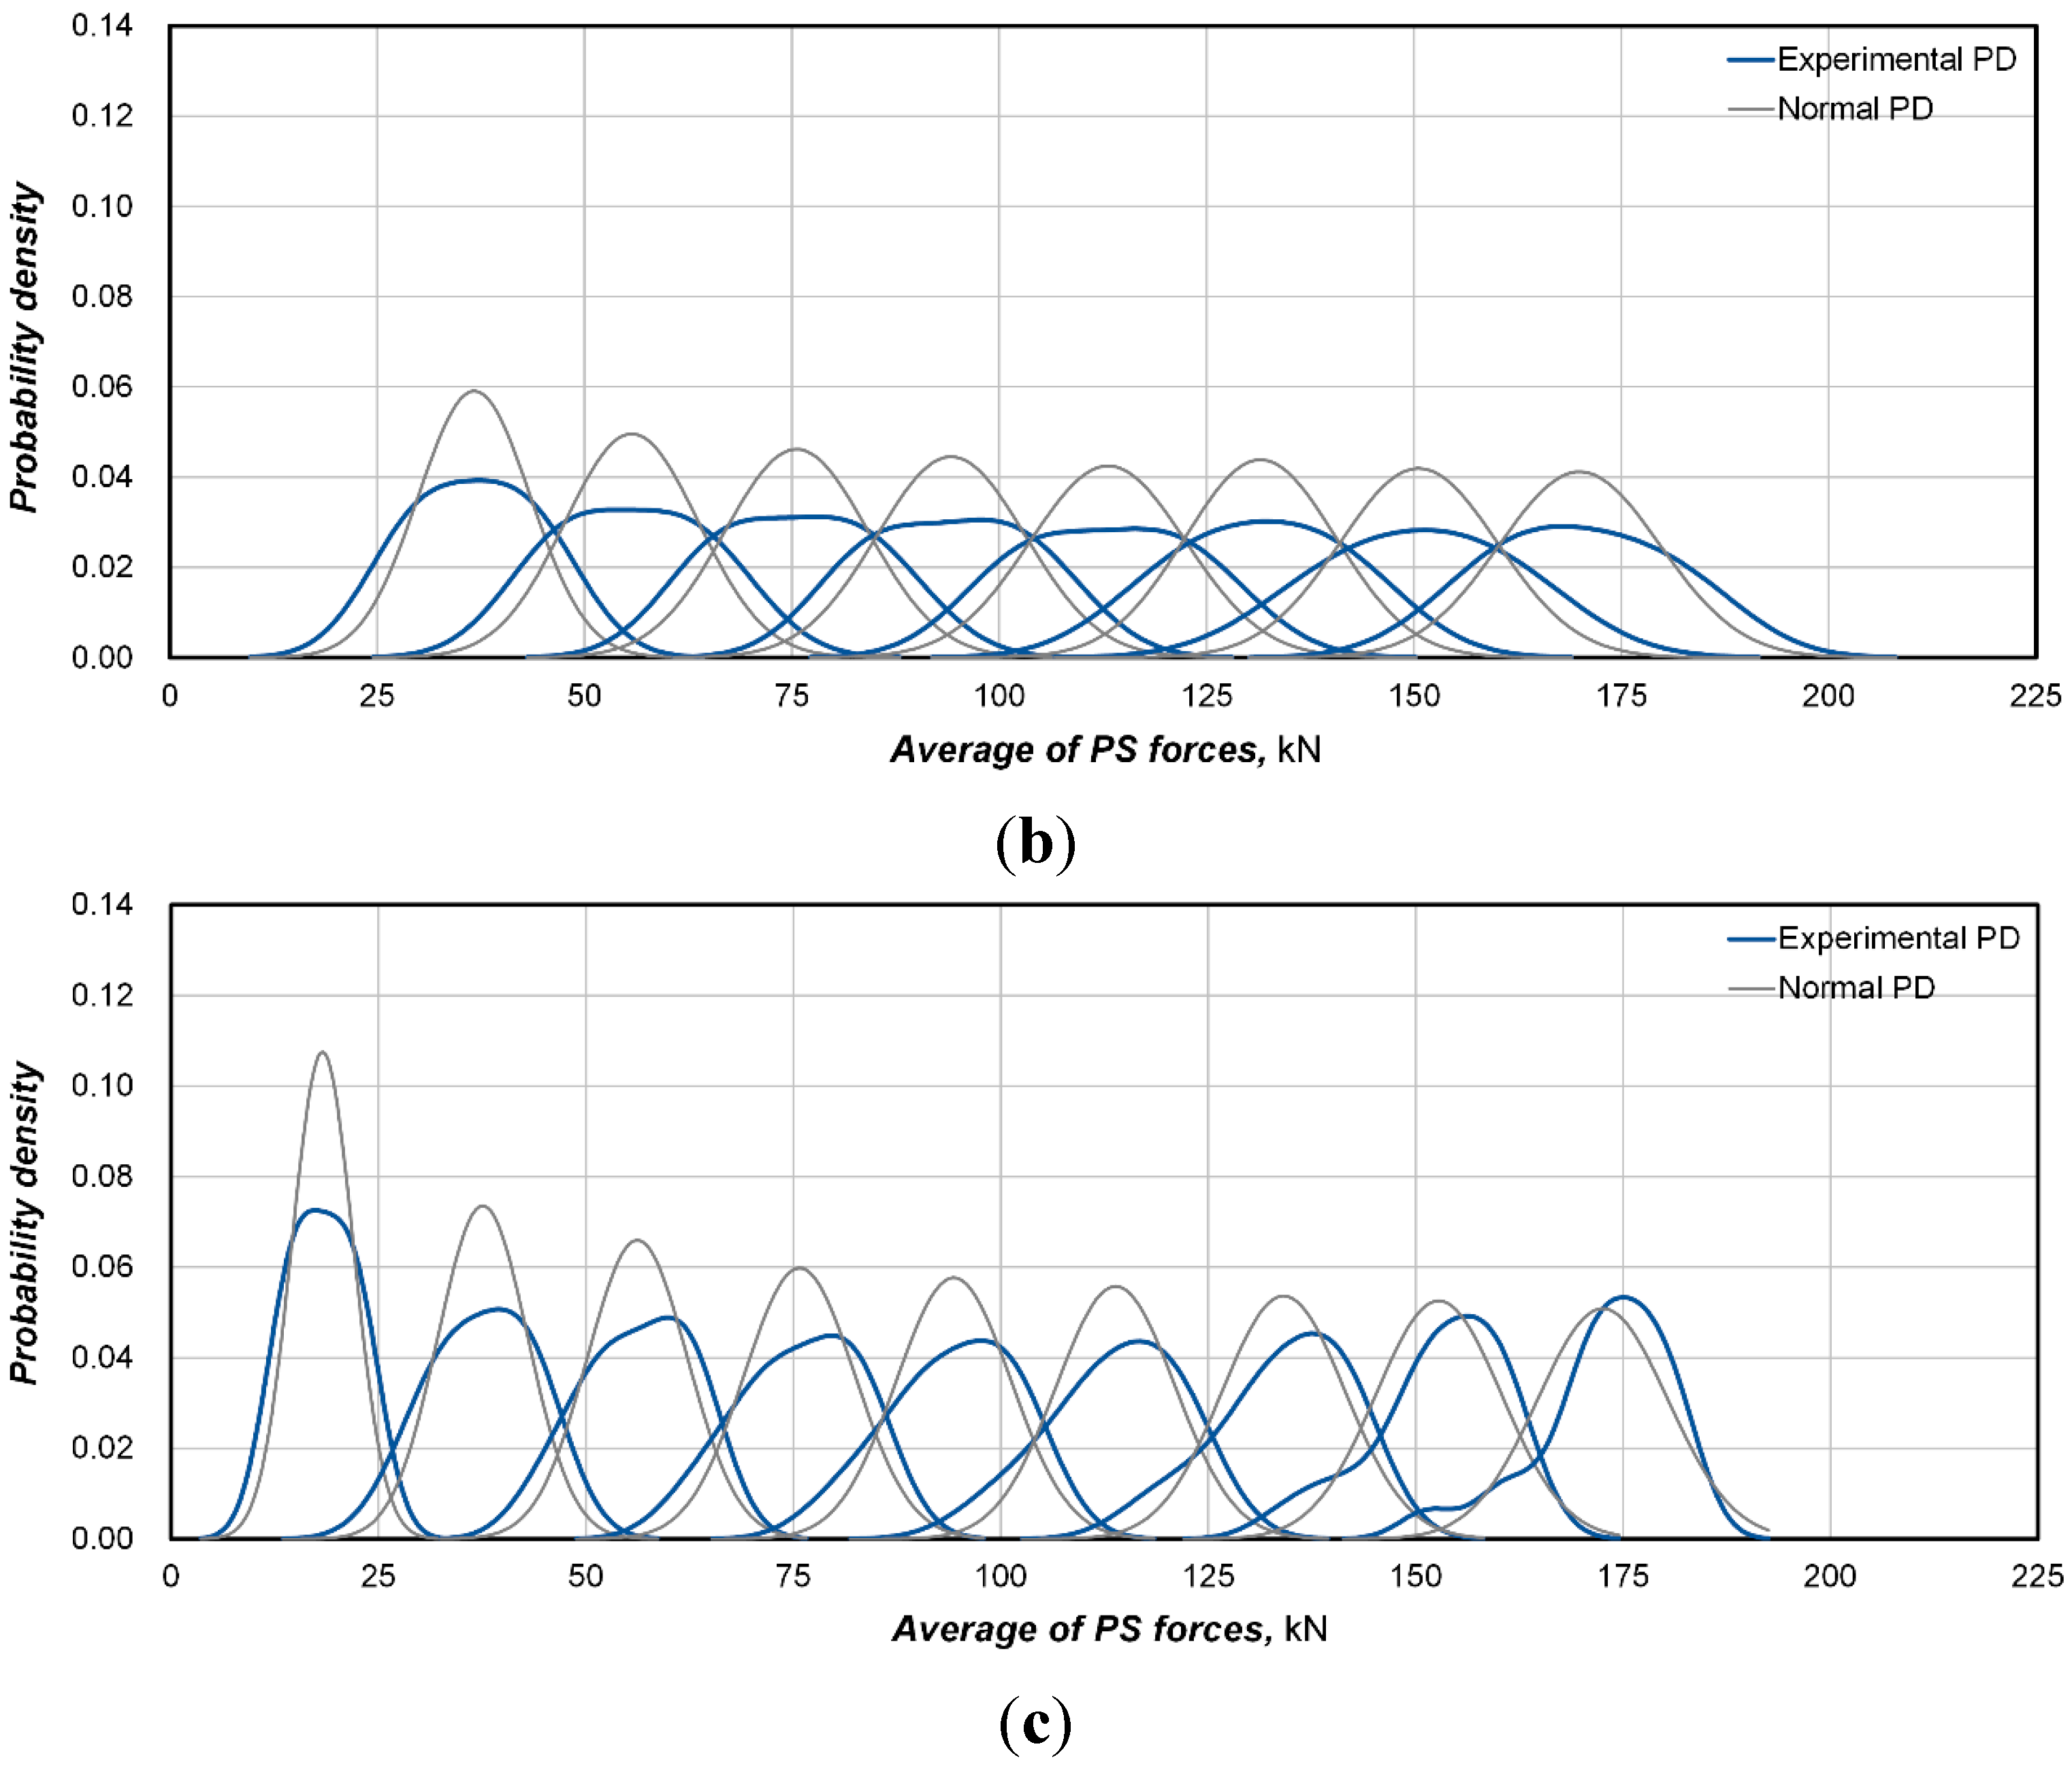
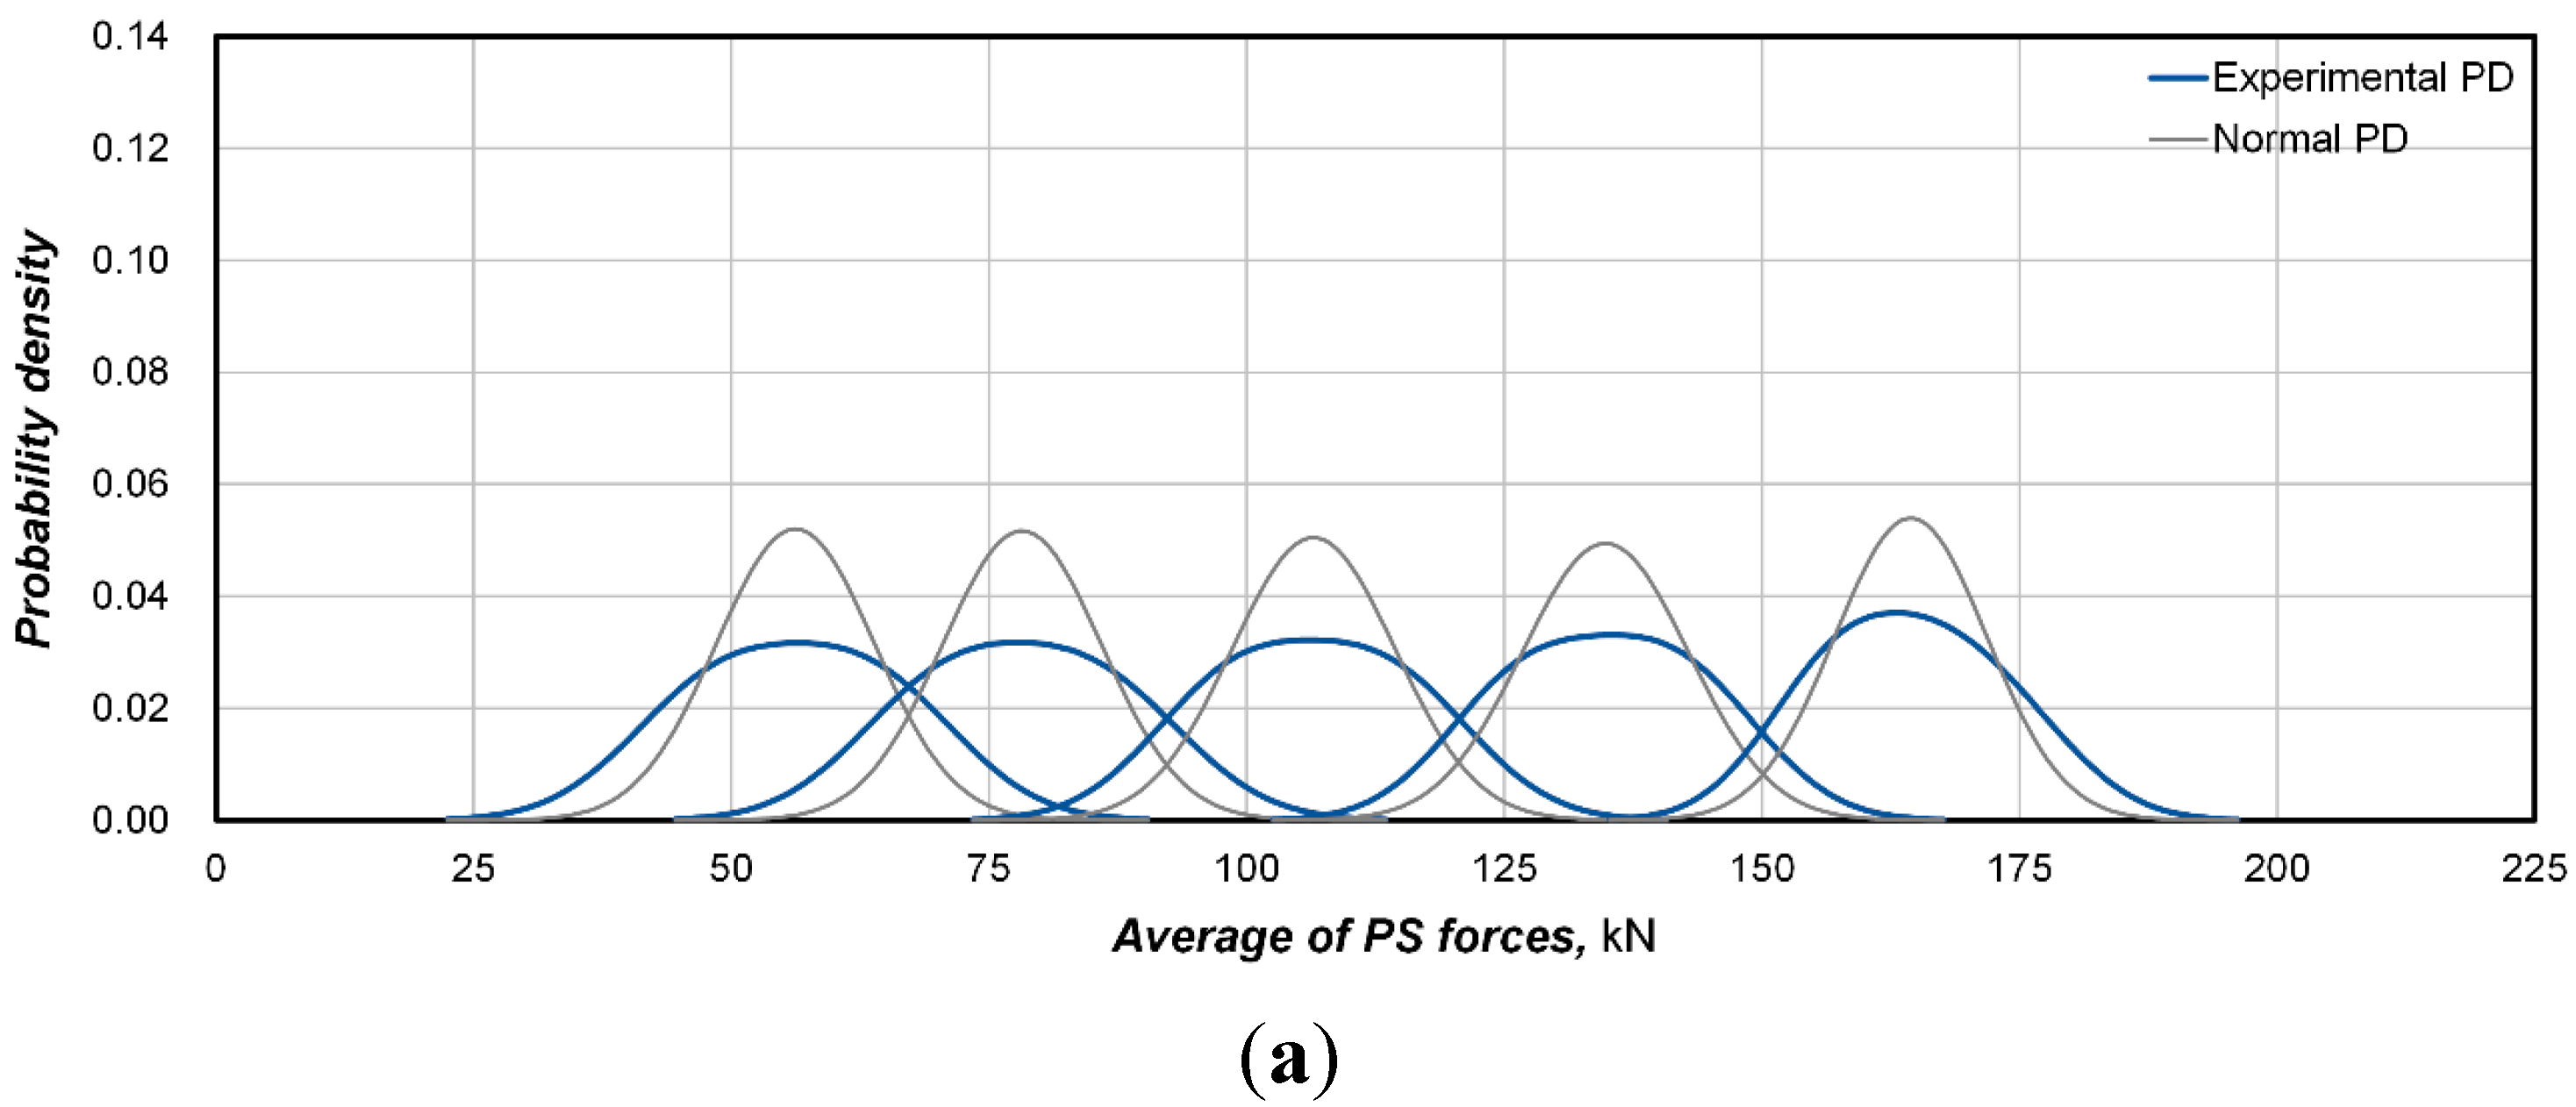
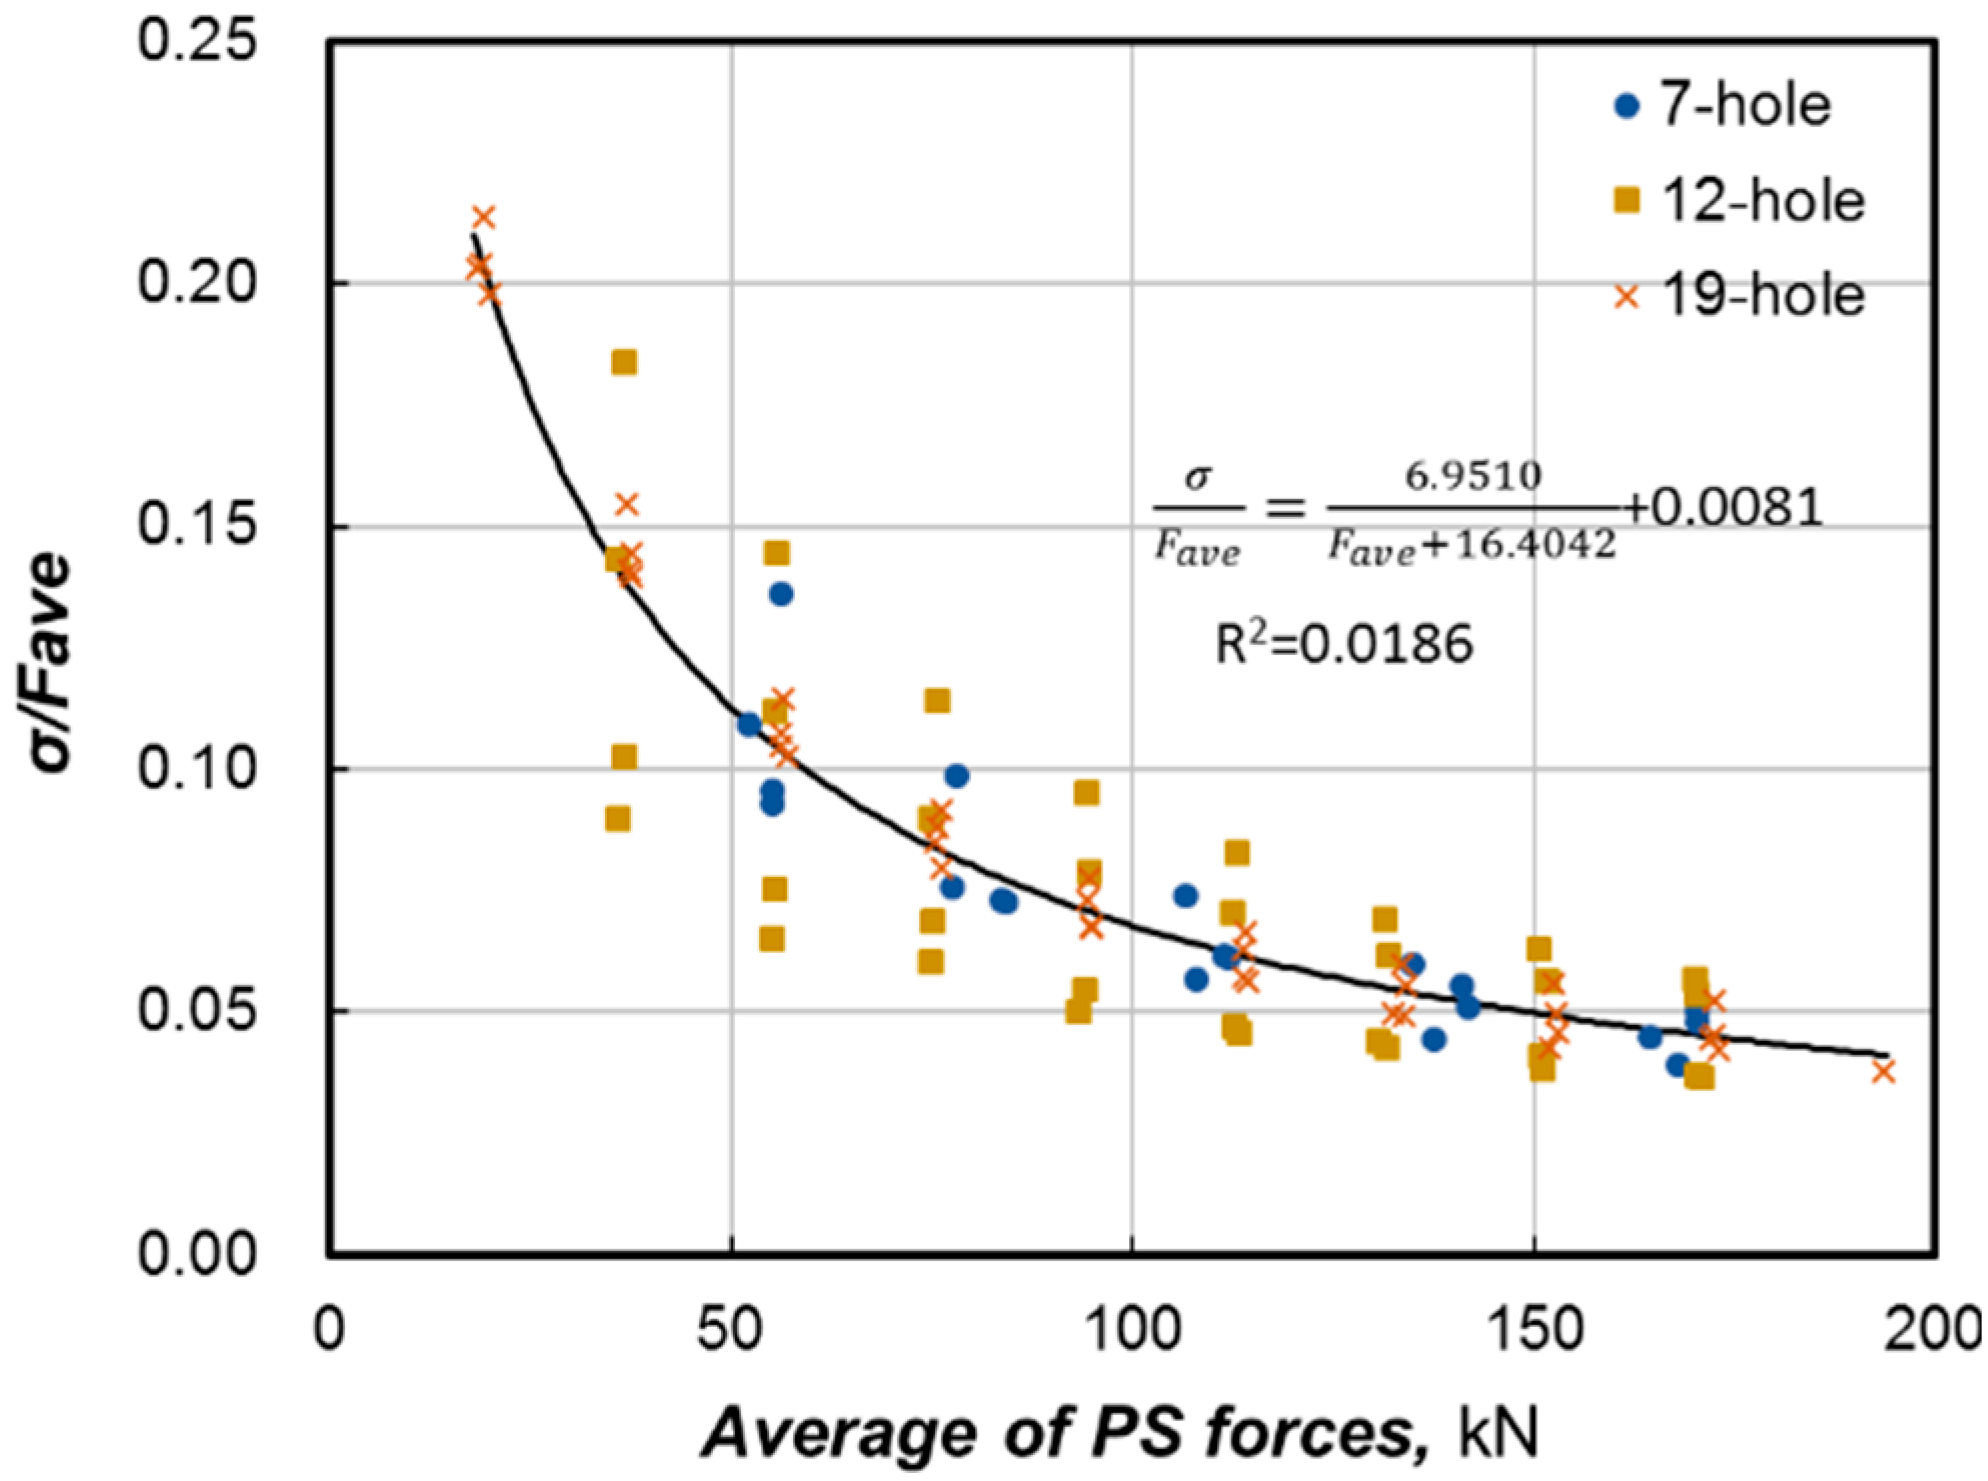
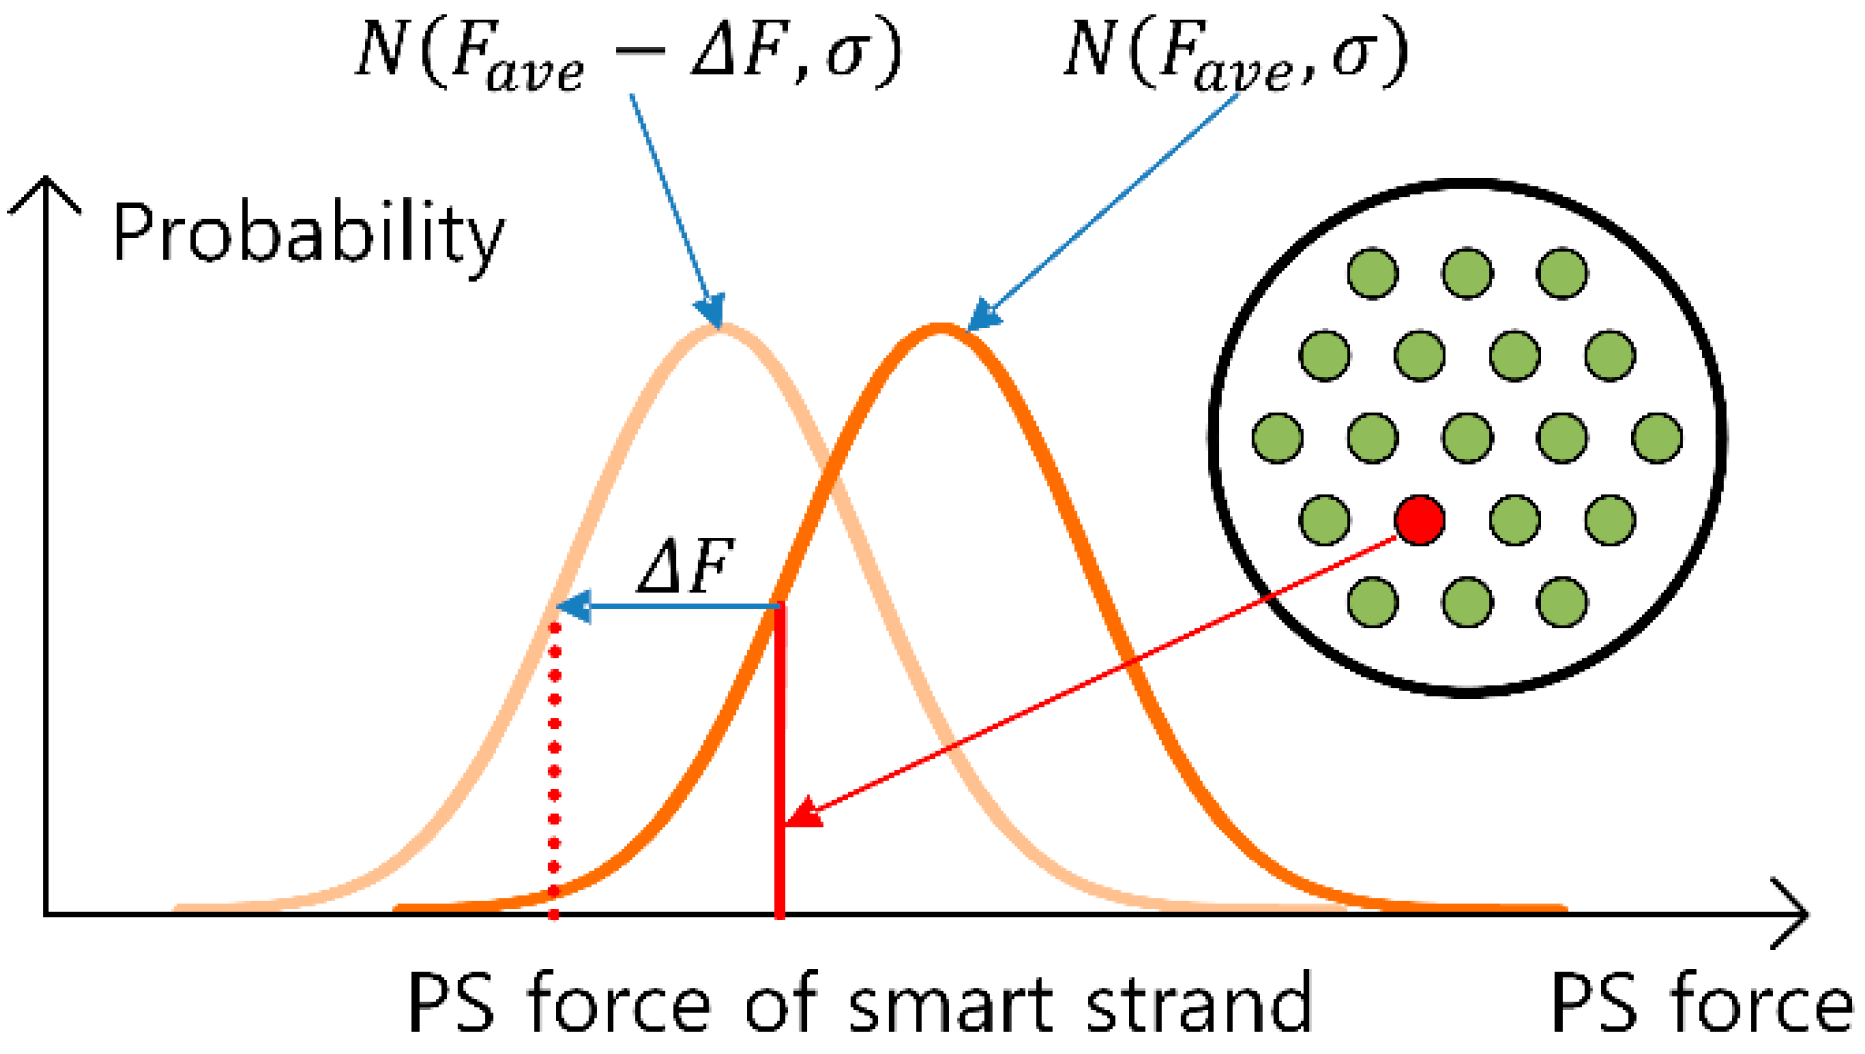
4.2. Derivation of Prestress Force Distribution Curve

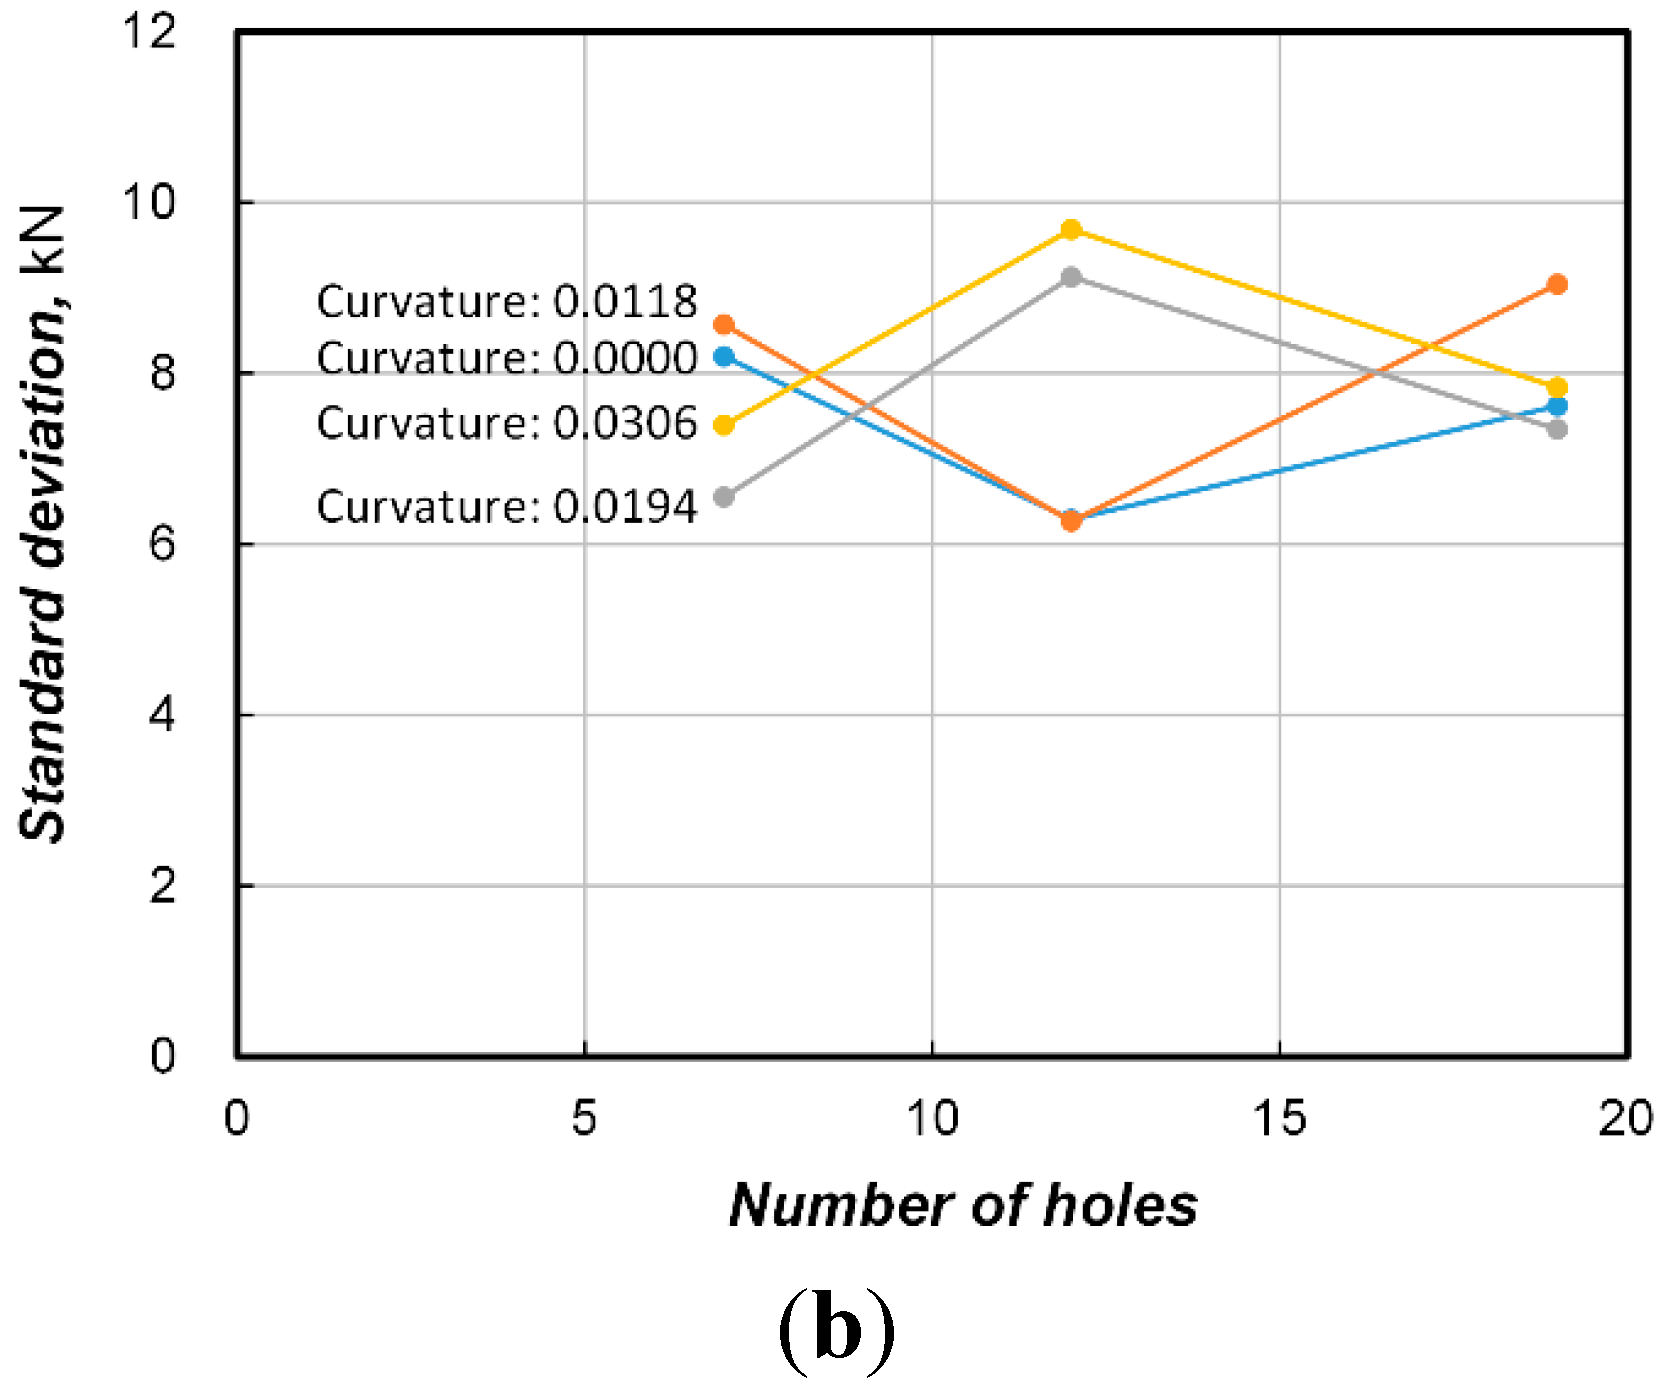
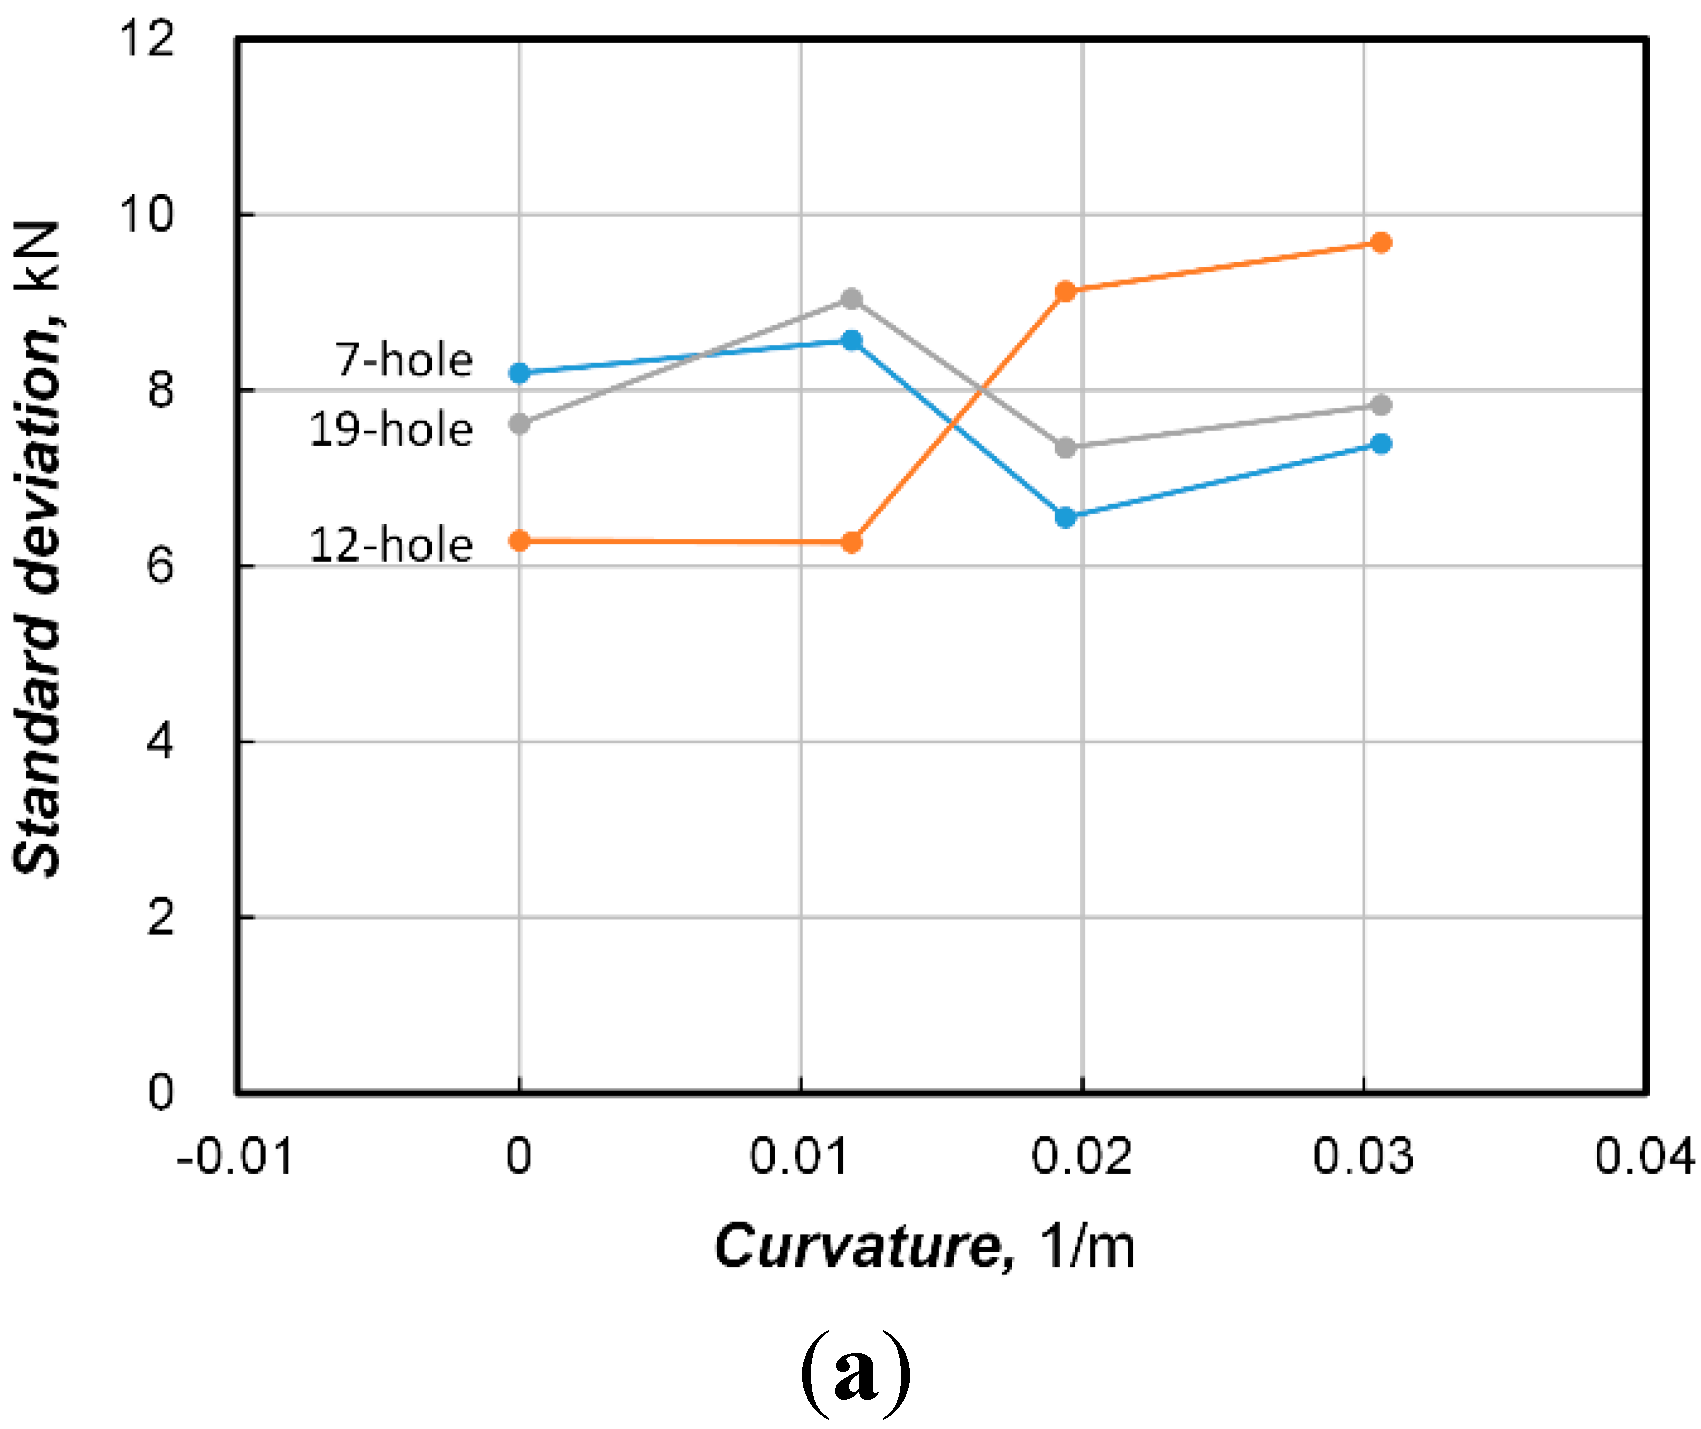
4.3. Estimation of Changes in Prestress Force Distribution

5. Conclusions
Acknowledgments
Author Contributions
Conflicts of Interest
References
- Kim, J.-M.; Kim, H.-W.; Park, Y.-H.; Yang, I.-H.; Kim, Y.-S. FBG sensors encapsulated into 7-wire steel strand for tension monitoring of a prestressing tendon. Adv. Struct. Eng. 2012, 15, 907–918. [Google Scholar]
- Kim, S.T.; Park, Y.; Park, S.Y.; Cho, K.; Cho, J.-R. A sensor-type pc strand with an embedded FBG sensor for monitoring prestress forces. Sensors 2015, 15, 1060–1070. [Google Scholar] [CrossRef] [PubMed]
- Zhou, Z.; He, J.P.; Chen, G.D.; Ou, J.P. A smart steel strand for the evaluation of prestress loss distribution in post-tensioned concrete structures. J. Intell. Mater. Syst. Struct. 2009, 20, 1901–1912. [Google Scholar] [CrossRef]
- Zhou, Z.; He, J.P.; Ou, J.P. Integrated optical fiber sensing system by combing large-scale distributed BOTDA/R and localized FBGs. Int. J. Distrib. Sens. Netw. 2012, 2012. [Google Scholar] [CrossRef]
- Xuan, F.-Z.; Tang, H.; Tu, S.-T. In situ monitoring on prestress losses in the reinforced structure with fiber-optic sensors. Measurement 2009, 42, 107–111. [Google Scholar] [CrossRef]
- Chandoga, M.; Jaroševič, A. Rehabilitation and monitored prestressing of corroded tendons. In Proceedings of the Fib Symposium: Structural Concrete and Time, La Plata, Argentina, 28–30 September 2005; pp. 1–8.
- Sumitro, S.; Jaroševič, A.; Wang, M.L. Elasto-magnetic sensor utilization on steel cable stress measurement. In Proceedings of the 1st Fib Congress: Concrete Structures in the 21th Century, Osaka, Japan, 13–19 October 2002; pp. 13–19.
- Fabo, P.; Jaroševič, A.; Chandoga, M. The smart tendons––A new approach to prestressing. In Proceedings of the Fib Symposium on Concrete Structures: The Challenge of Creativity, Avignon, France, 26–28 April 2004.
- Chandoga, M.; Fabo, P.; Jaroševič, A. Measurement of forces in the cable stays of the apollo bridge. In Proceedings of the 2nd Fib Congress, Naples, Italy, 5–8 June 2006; pp. 674–675.
- Bowman, A.W.; Azzalini, A. Applied Smoothing Techniques for Data Analysis; Clarendon Press: Gloucestershire, UK, 2004. [Google Scholar]
- Lilliefors, H.W. On the kolmogorov-smirnov test for normality with mean and variance unknown. J. Am. Stat. Assoc. 1967, 62, 399–402. [Google Scholar] [CrossRef]
© 2015 by the authors; licensee MDPI, Basel, Switzerland. This article is an open access article distributed under the terms and conditions of the Creative Commons Attribution license (http://creativecommons.org/licenses/by/4.0/).
Share and Cite
Cho, K.; Park, S.Y.; Cho, J.-R.; Kim, S.T.; Park, Y.-H. Estimation of Prestress Force Distribution in the Multi-Strand System of Prestressed Concrete Structures. Sensors 2015, 15, 14079-14092. https://doi.org/10.3390/s150614079
Cho K, Park SY, Cho J-R, Kim ST, Park Y-H. Estimation of Prestress Force Distribution in the Multi-Strand System of Prestressed Concrete Structures. Sensors. 2015; 15(6):14079-14092. https://doi.org/10.3390/s150614079
Chicago/Turabian StyleCho, Keunhee, Sung Yong Park, Jeong-Rae Cho, Sung Tae Kim, and Young-Hwan Park. 2015. "Estimation of Prestress Force Distribution in the Multi-Strand System of Prestressed Concrete Structures" Sensors 15, no. 6: 14079-14092. https://doi.org/10.3390/s150614079