
Discomfort Evaluation of Truck Ingress/Egress Motions Based on Biomechanical Analysis

Abstract
: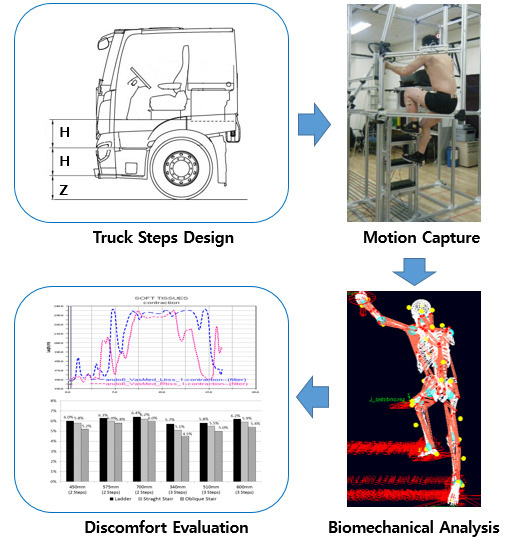
1. Introduction
1.1. Research Background
1.2. Related Work

| Category | Namamoto et al. [7] | Kim and Lee [17] | This Study | |
|---|---|---|---|---|
| Target Area | Car Ingress/Egress | Car Ingress | Truck Ingress/Egress | |
| Independent Variables of Experiments | Height of Hip Point, Height of Floor | Height and Width of Side Panel, Location of A-Pillar | Type And Number of Footsteps, Height of First Step | |
| Parameters for Discomfort Evaluation | MVC Ratio of Muscle Myoelectricity | Muscle Force | MVC Ratio of Muscle Force | |
| Muscle Force Estimation | EMG Test | Biomechanical Analysis | Biomechanical Analysis | |
| (No. of Subjects) | Data Acquisition | 10 | 1 | 1 |
| Subjective Evaluation | 10 | 1 | 10 | |
| Muscles Measured or Estimated | 13 Muscles | All Muscles | All Muscles | |
| Muscles Used for Discomfort Evaluation | 3 Muscles | 11 Muscles | All Muscles | |
| Correlation between Muscle Forces and Subjective Discomfort | Linear Regression | Fuzzy Logic | Linear Regression | |
2. Experimental Methods
2.1. Experimental Design
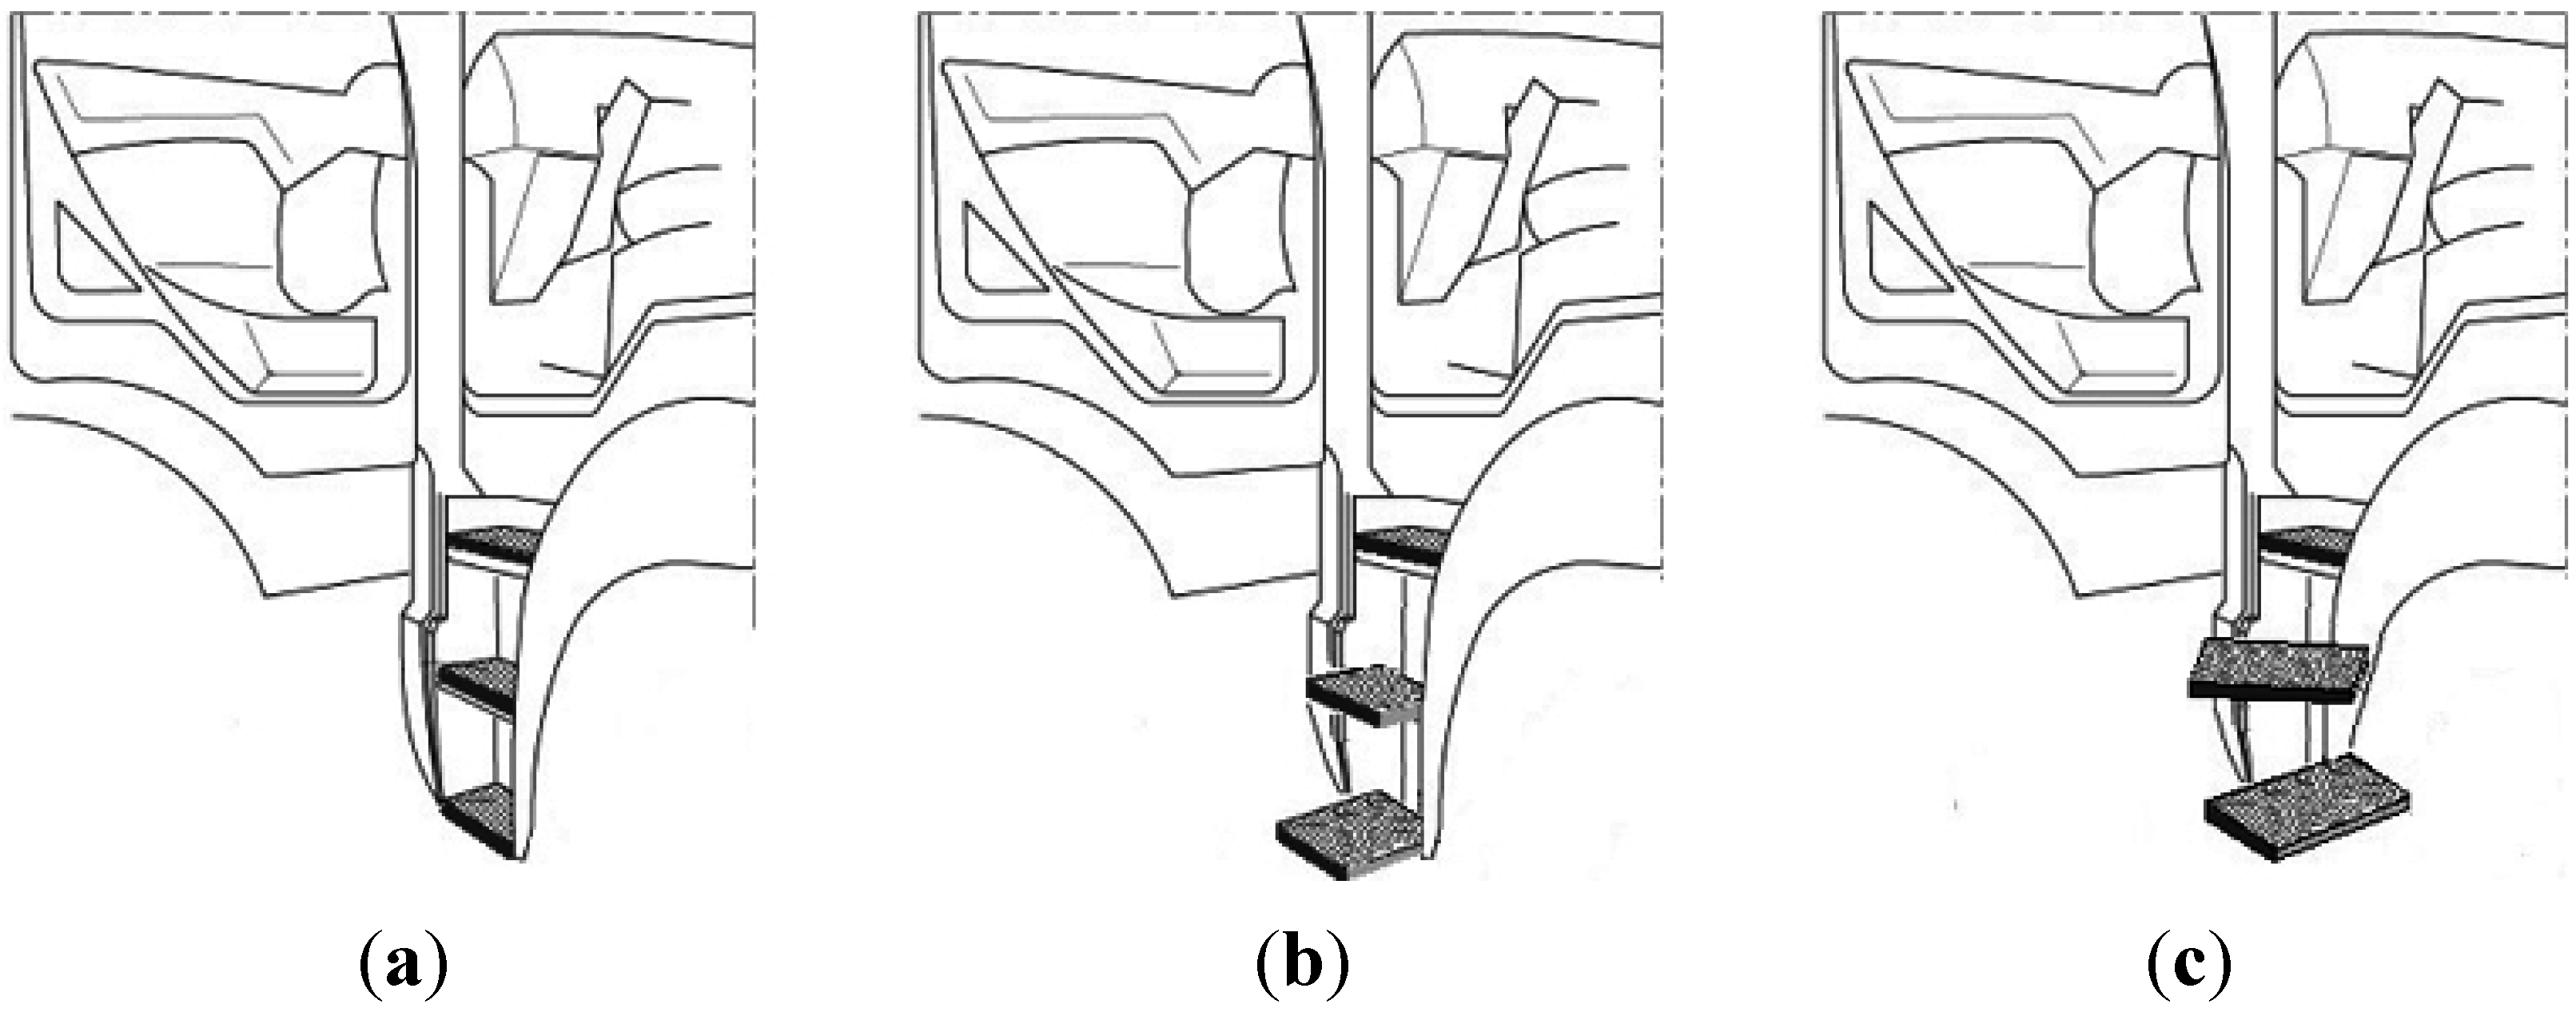
2.1.1. Independent Variables

2.1.2. Dependent Variable
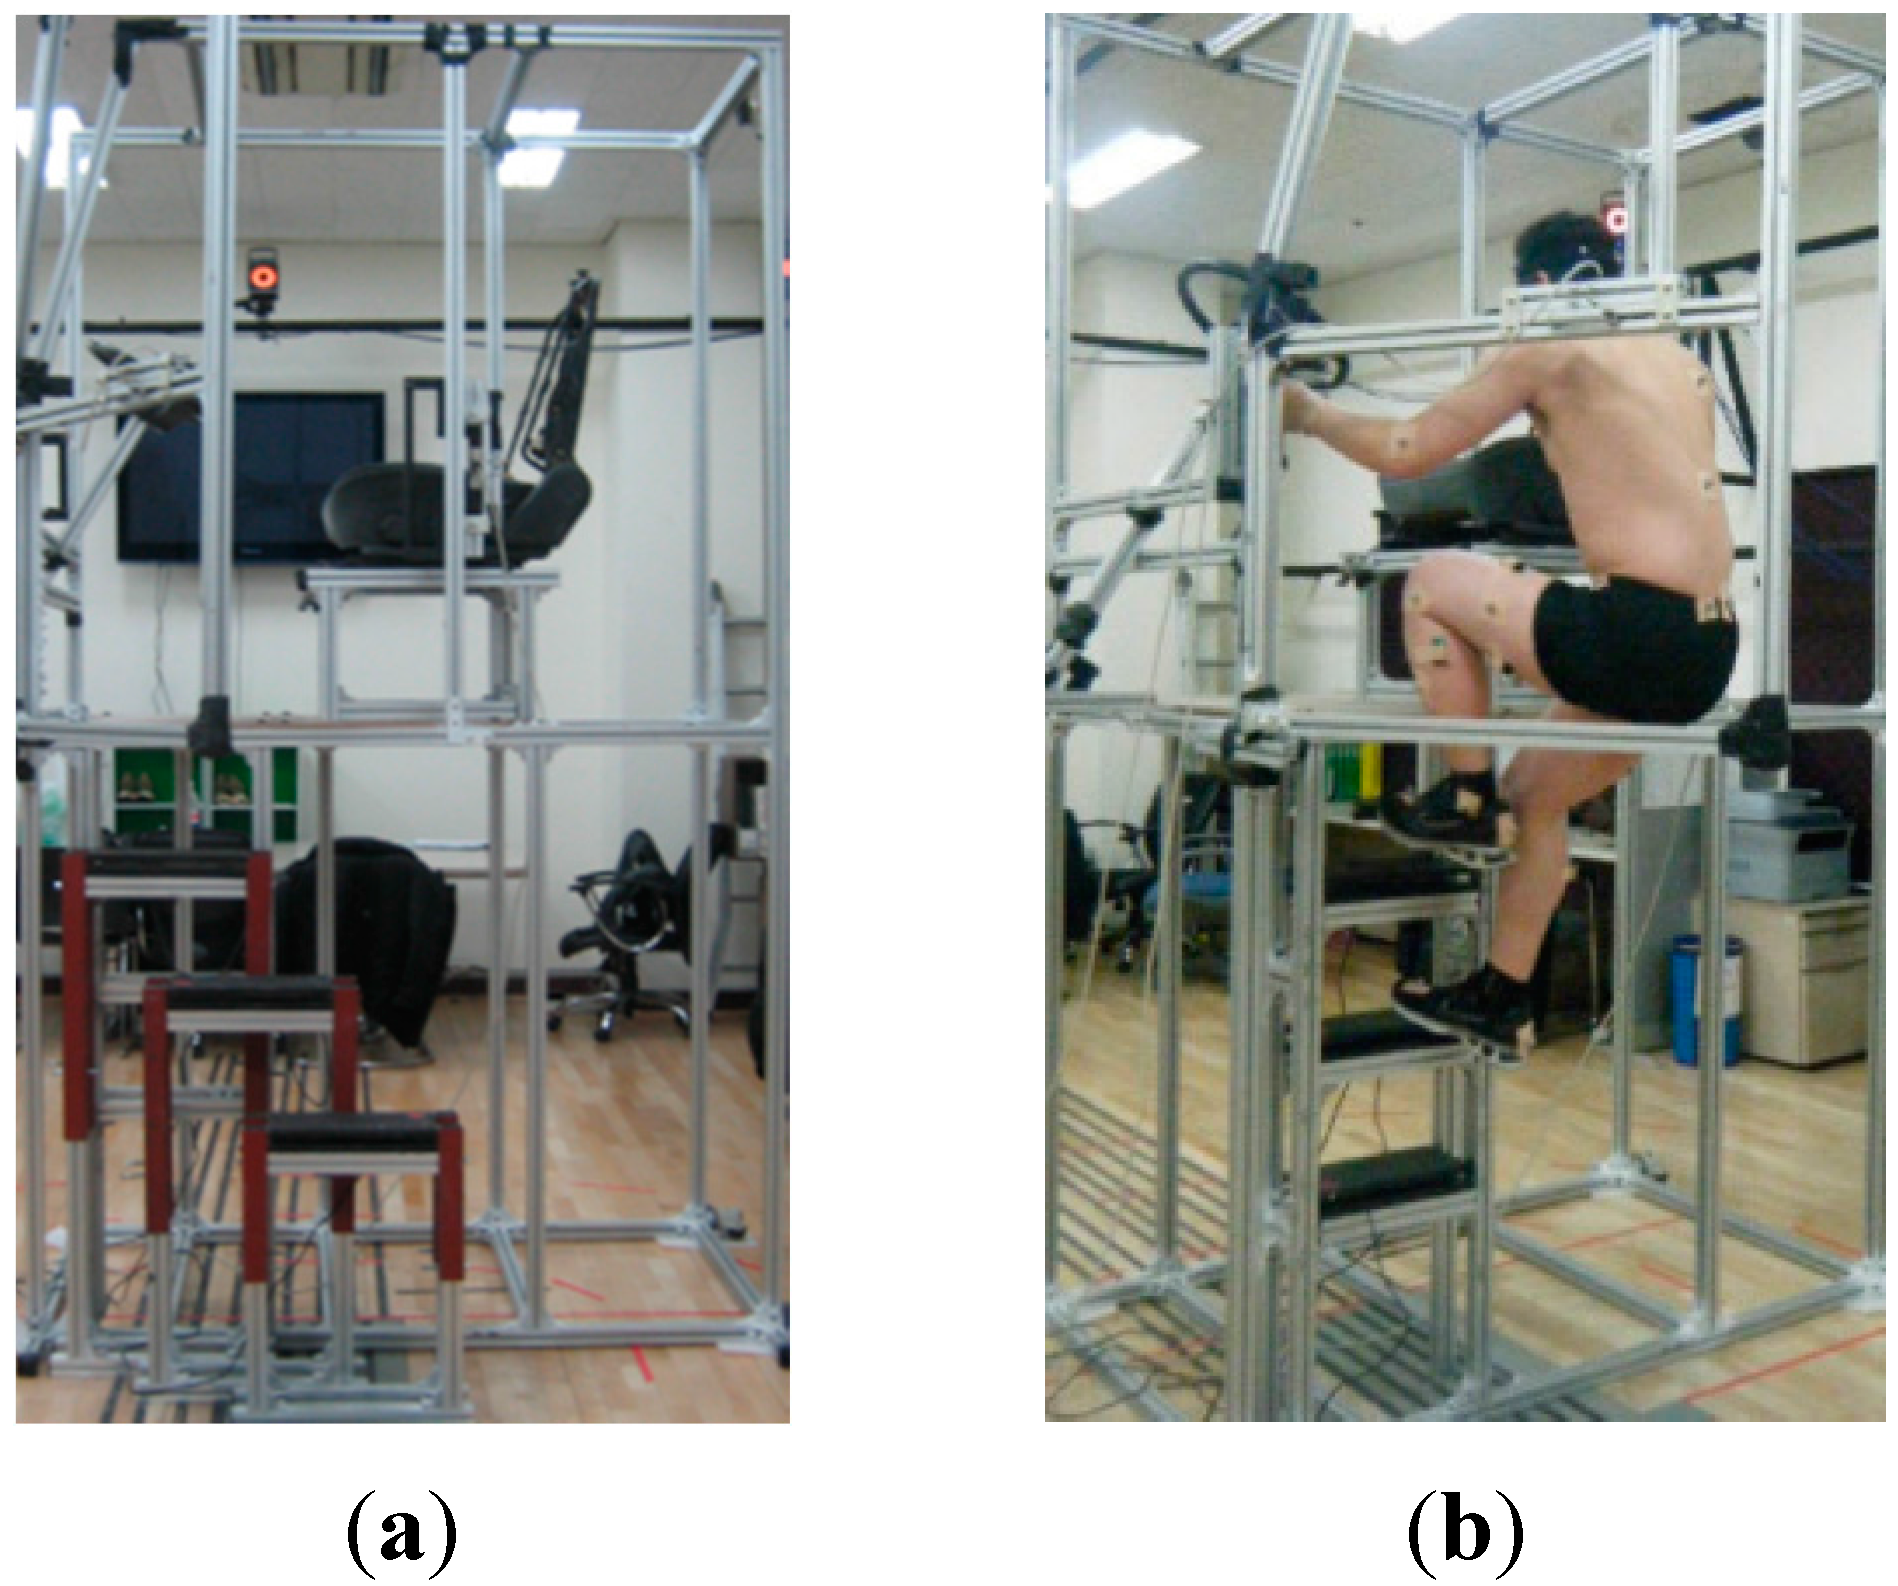
2.2. Apparatus
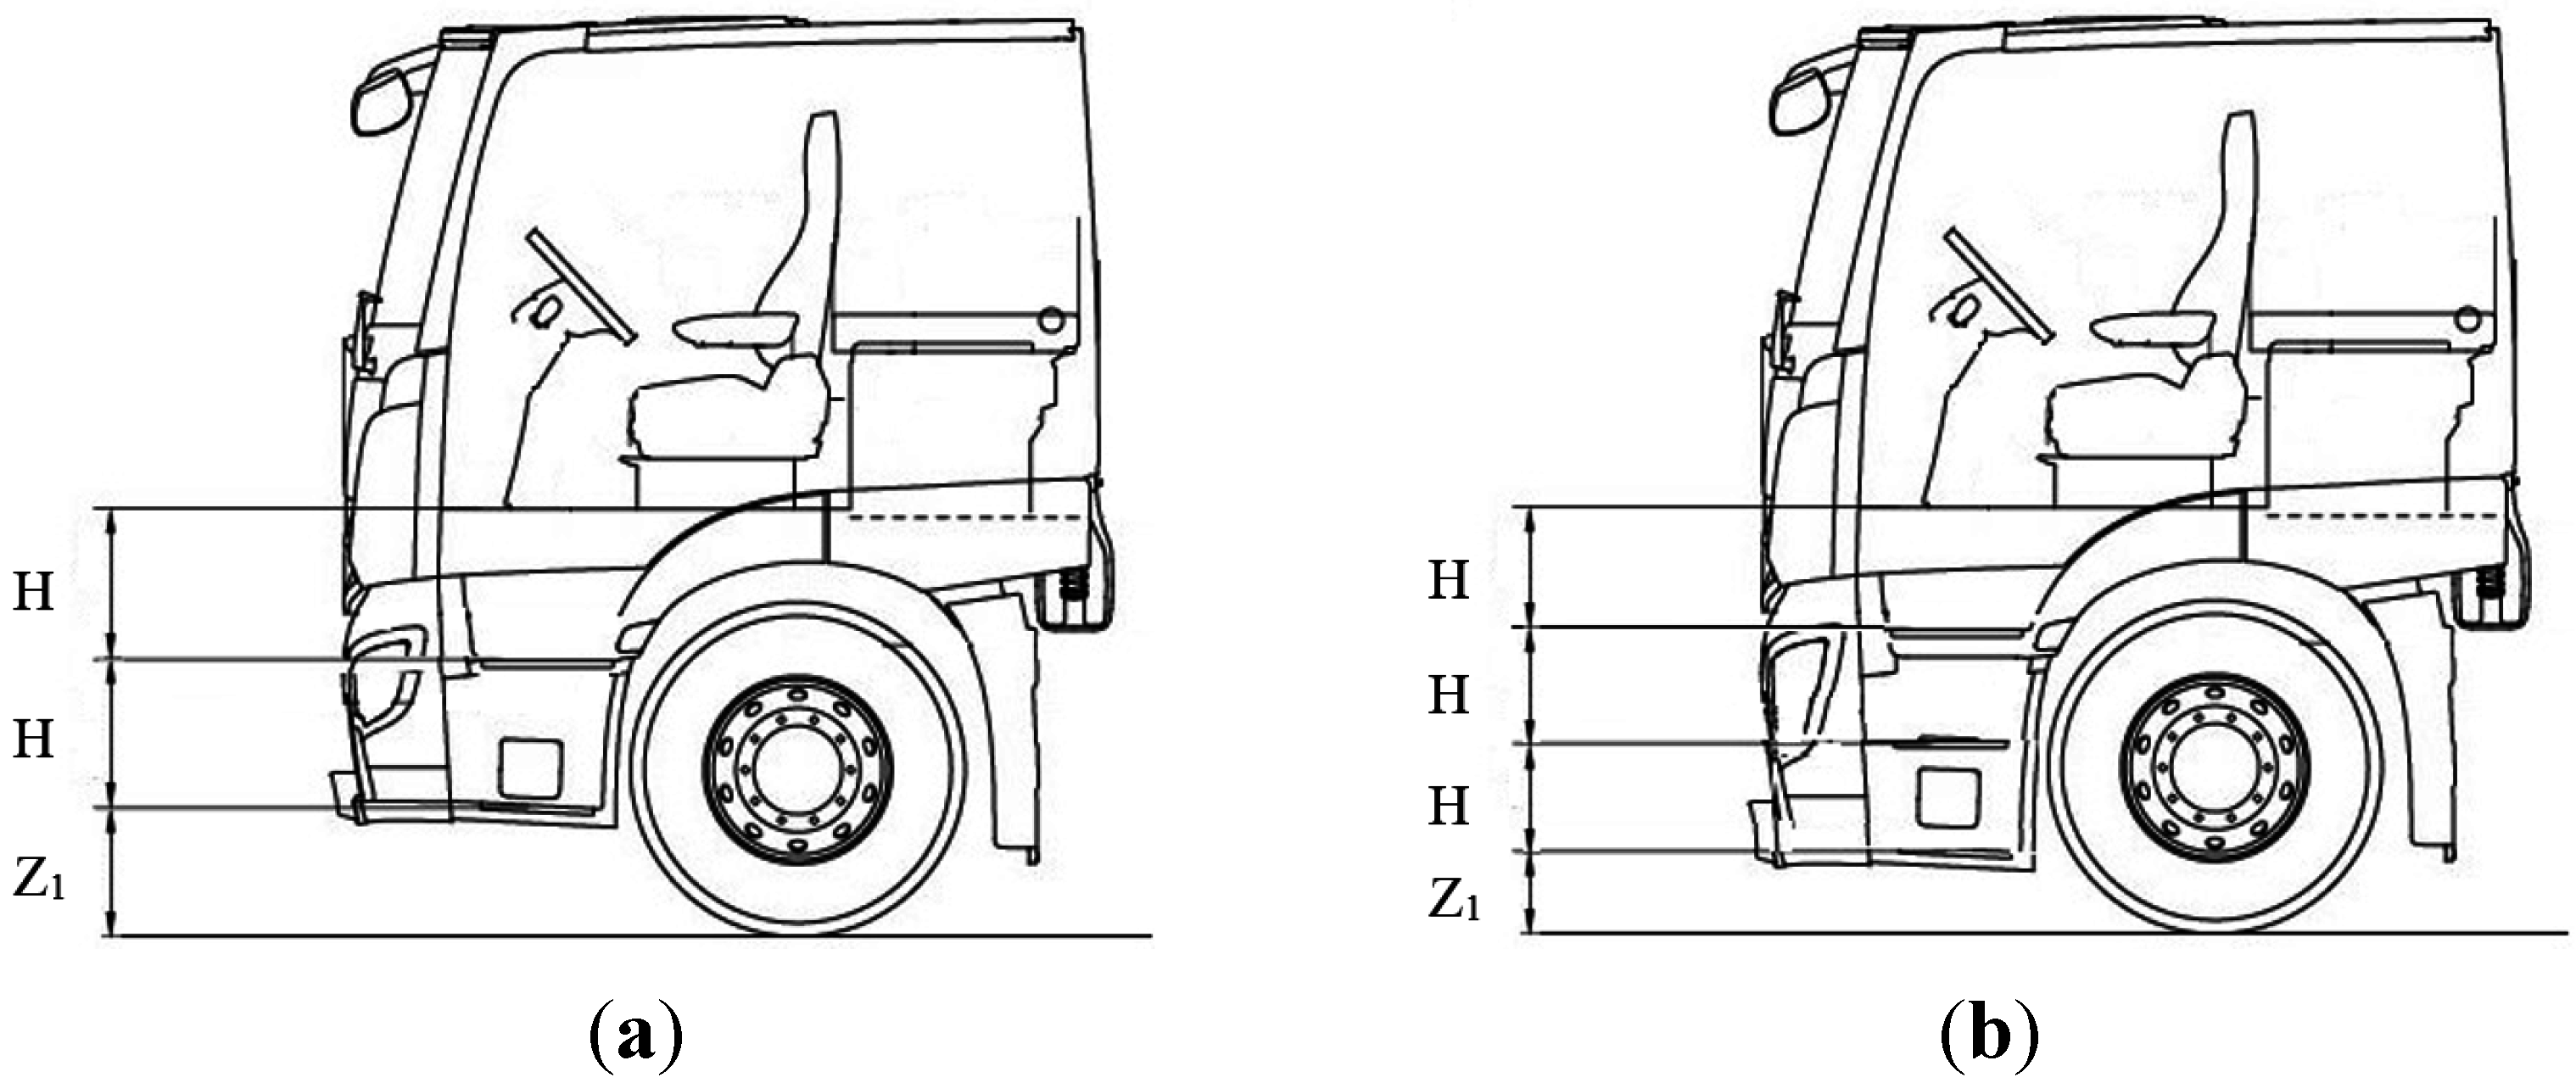
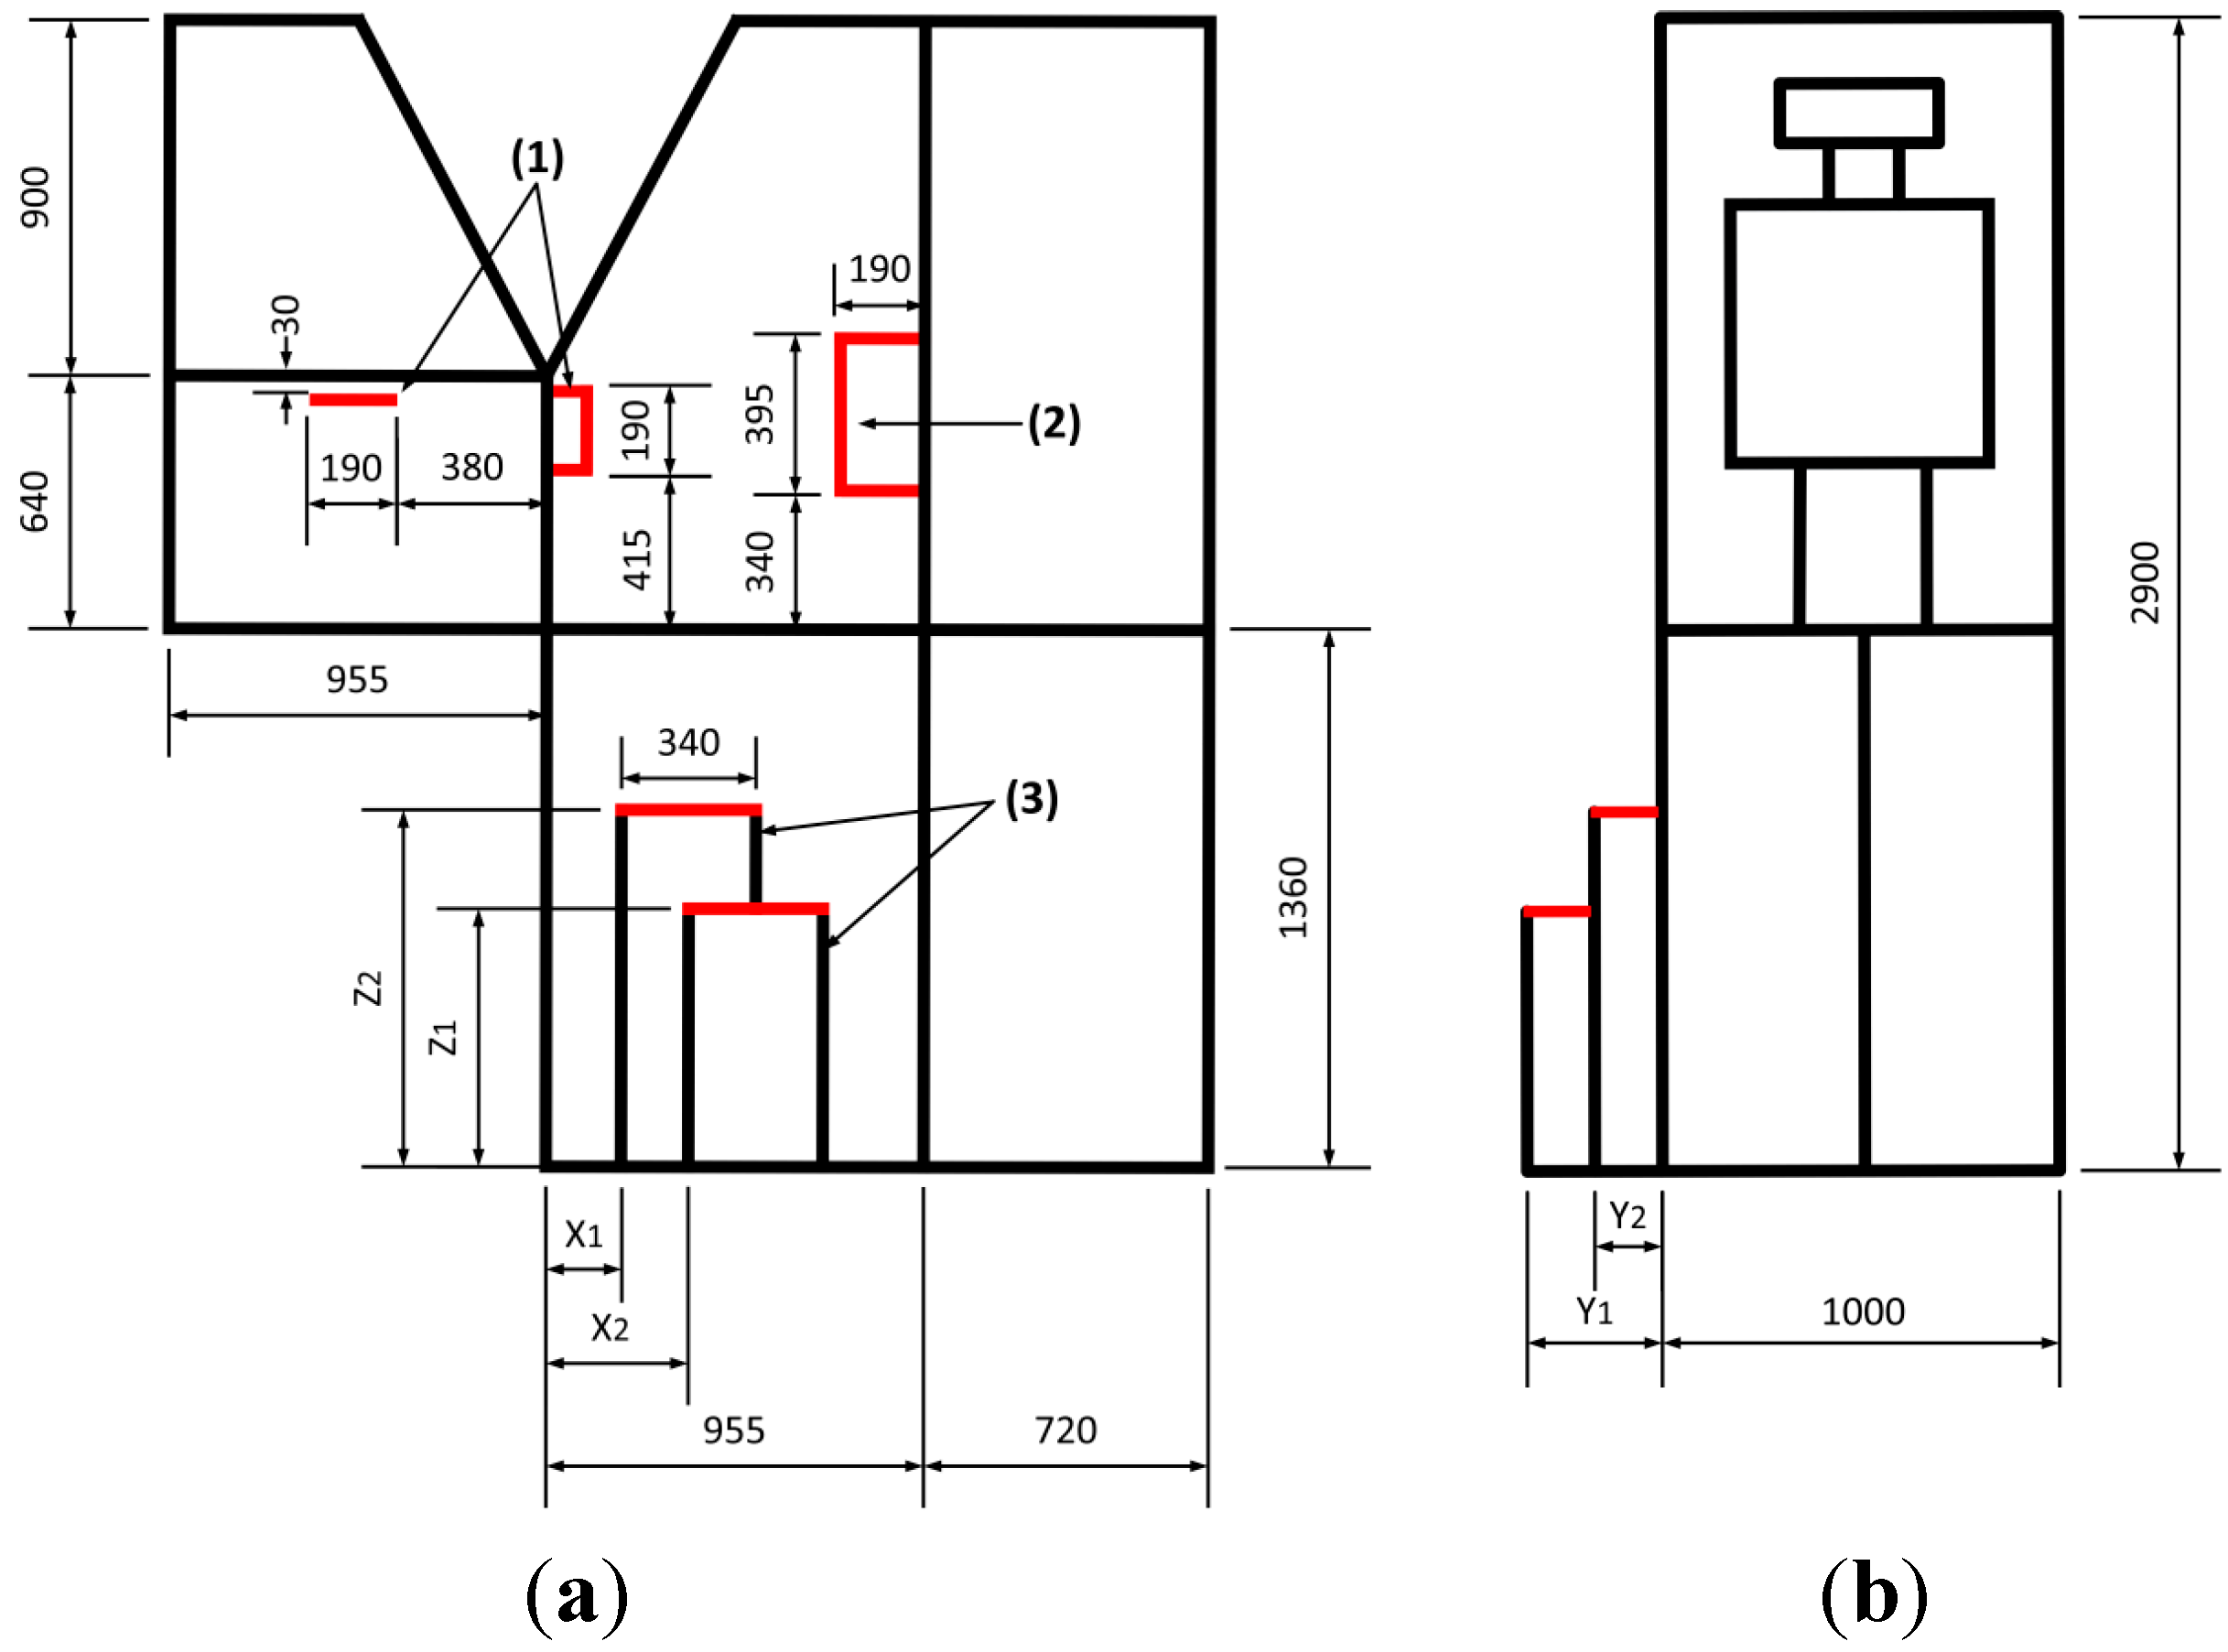
2.2.1. Mockup of the Truck Cabin and Steps

| No. of Steps | Type of Step | Step Location and Height (mm) | Case No. | ||||||||
|---|---|---|---|---|---|---|---|---|---|---|---|
| First Step | Second Step | Third Step | |||||||||
| X1 | Y1 | Z1 | X2 | Y2 | Z2 | X3 | Y3 | Z3 | |||
| 2 | Ladder | 0 | 0 | 450 | 0 | 0 | 905 | - | - | - | 1 |
| 0 | 0 | 575 | 0 | 0 | 967 | - | - | - | 2 | ||
| 0 | 0 | 700 | 0 | 0 | 1030 | - | - | - | 3 | ||
| Straight Stair | 0 | 340 | 450 | 0 | 170 | 905 | - | - | - | 4 | |
| 0 | 340 | 575 | 0 | 170 | 967 | - | - | - | 5 | ||
| 0 | 340 | 700 | 0 | 170 | 1030 | - | - | - | 6 | ||
| Oblique Stair | 340 | 340 | 450 | 170 | 170 | 905 | - | - | - | 7 | |
| 340 | 340 | 575 | 170 | 170 | 967 | - | - | - | 8 | ||
| 340 | 340 | 700 | 170 | 170 | 1030 | - | - | - | 9 | ||
| 3 | Ladder | 0 | 0 | 340 | 0 | 0 | 680 | 0 | 0 | 1020 | 10 |
| 0 | 0 | 510 | 0 | 0 | 793 | 0 | 0 | 1076 | 11 | ||
| 0 | 0 | 600 | 0 | 0 | 853 | 0 | 0 | 1106 | 12 | ||
| Straight Stair | 0 | 510 | 340 | 0 | 340 | 680 | 0 | 170 | 1020 | 13 | |
| 0 | 510 | 510 | 0 | 340 | 793 | 0 | 170 | 1076 | 14 | ||
| 0 | 510 | 600 | 0 | 340 | 853 | 0 | 170 | 1106 | 15 | ||
| Oblique Stair | 510 | 510 | 340 | 340 | 340 | 680 | 170 | 170 | 1020 | 16 | |
| 510 | 510 | 510 | 340 | 340 | 793 | 170 | 170 | 1076 | 17 | ||
| 510 | 510 | 600 | 340 | 340 | 853 | 170 | 170 | 1106 | 18 | ||
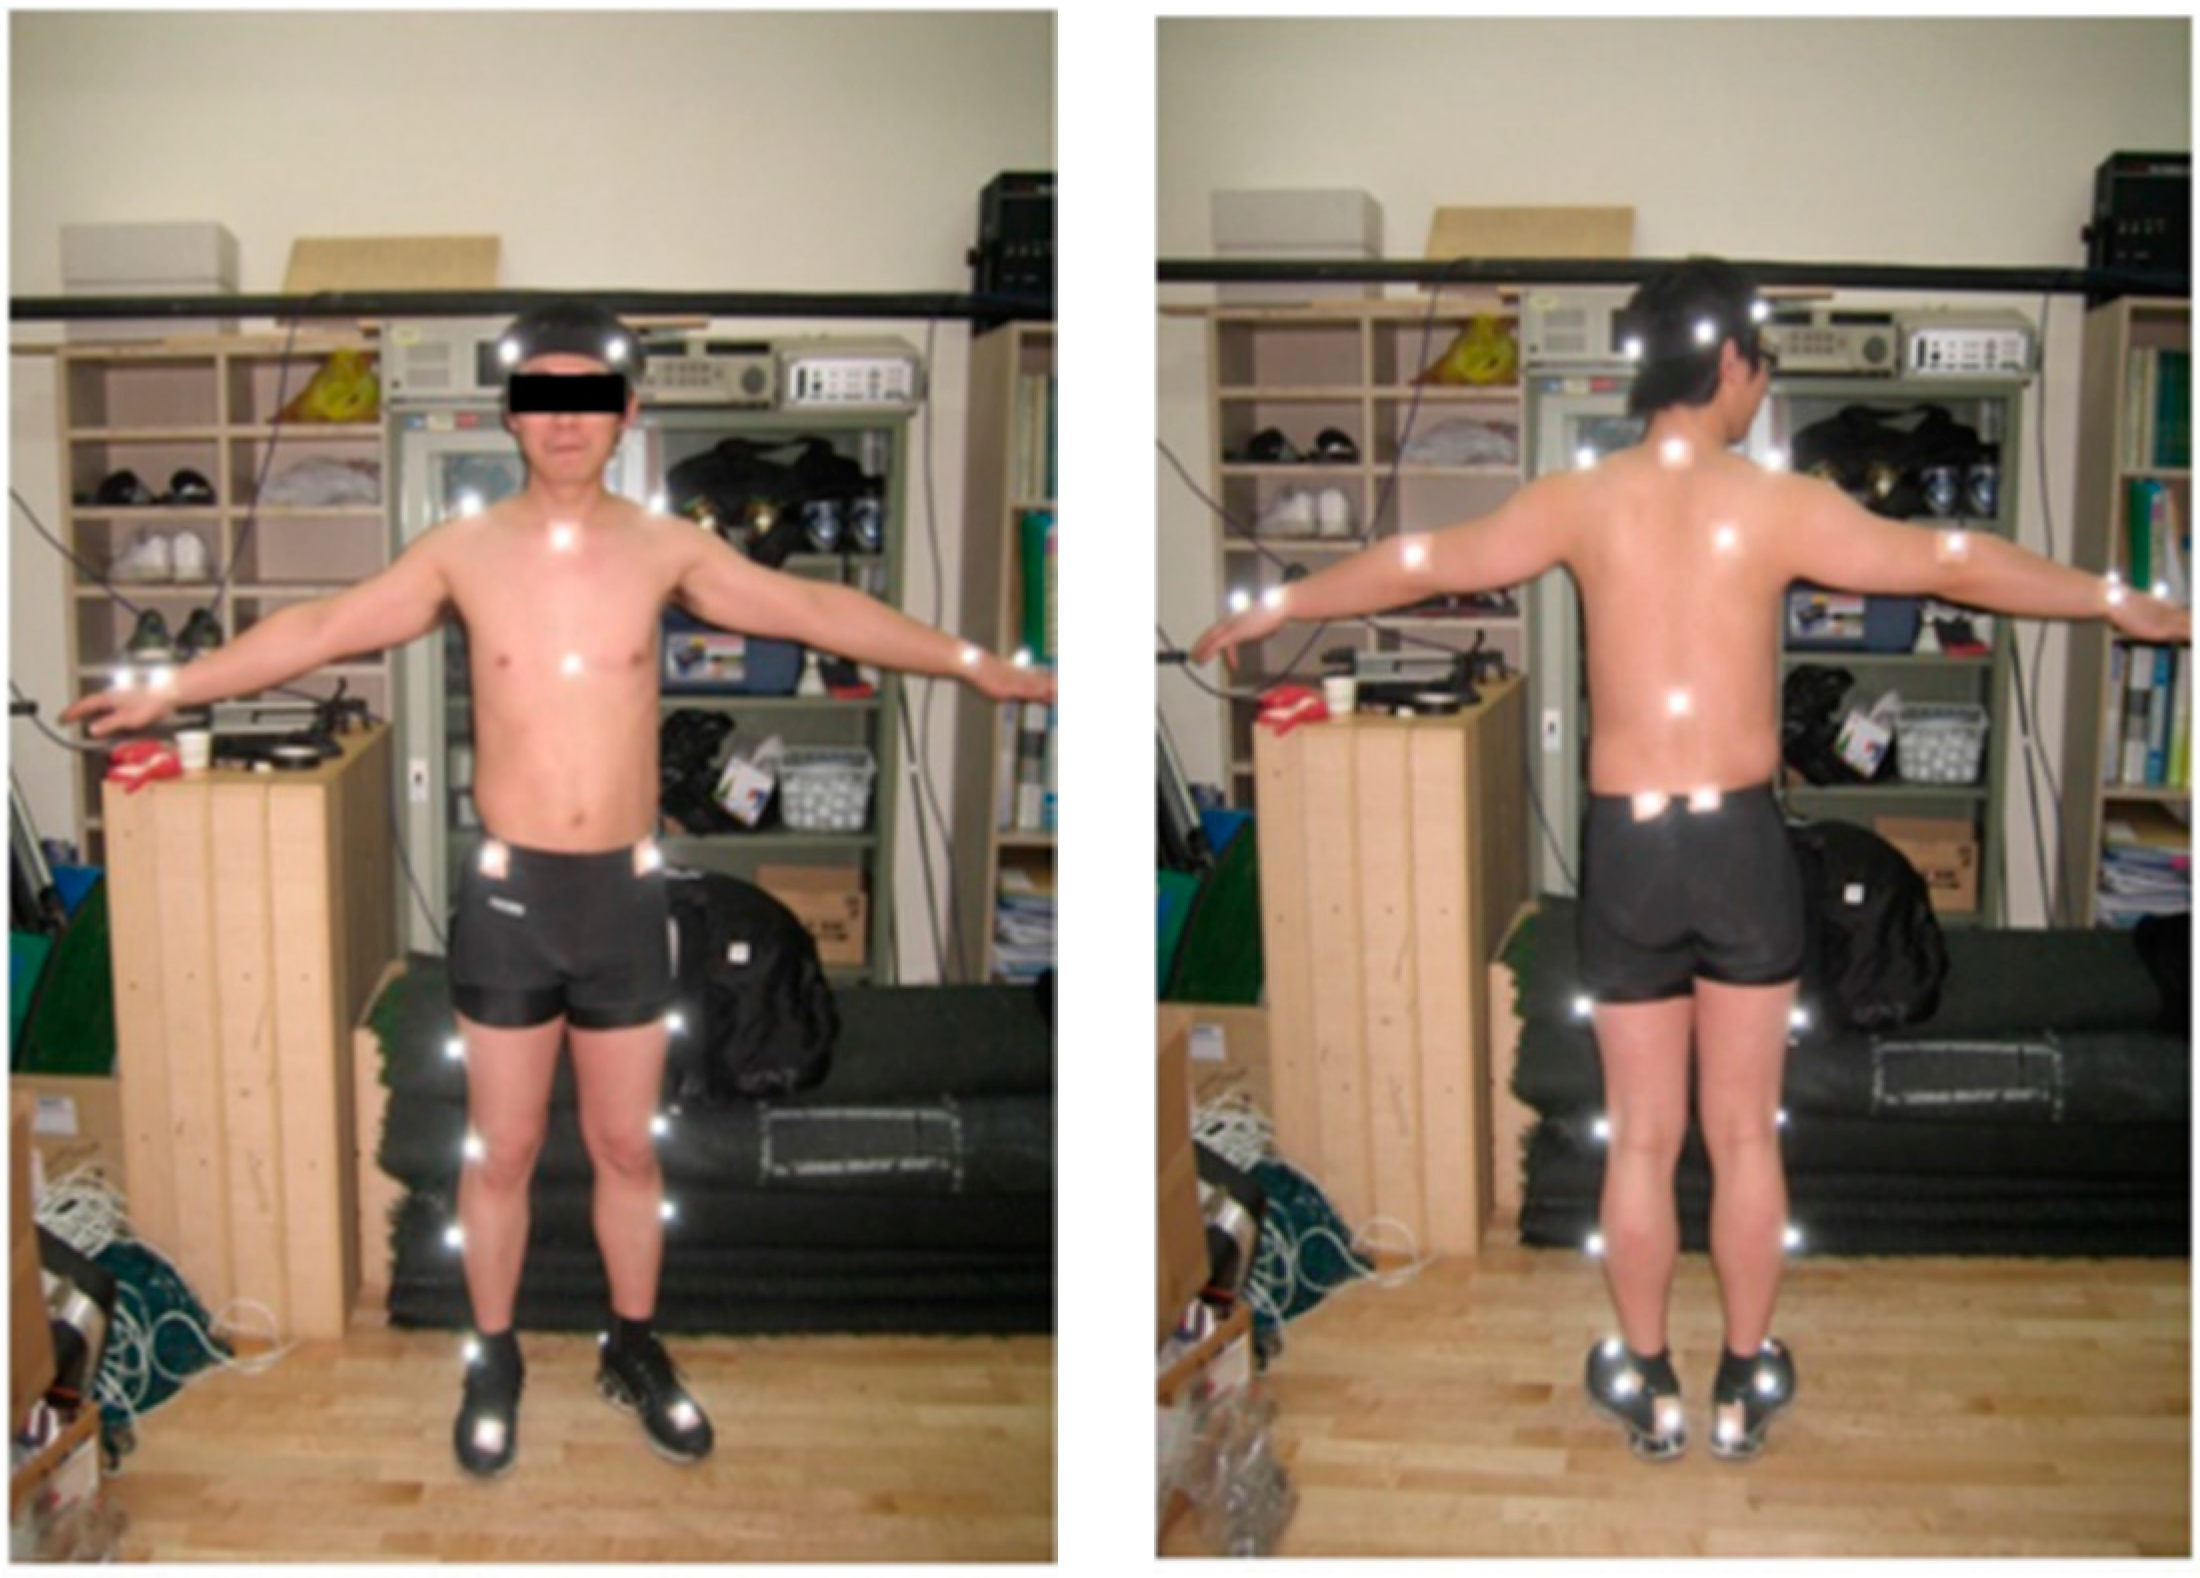
2.2.2. Motion Capture System

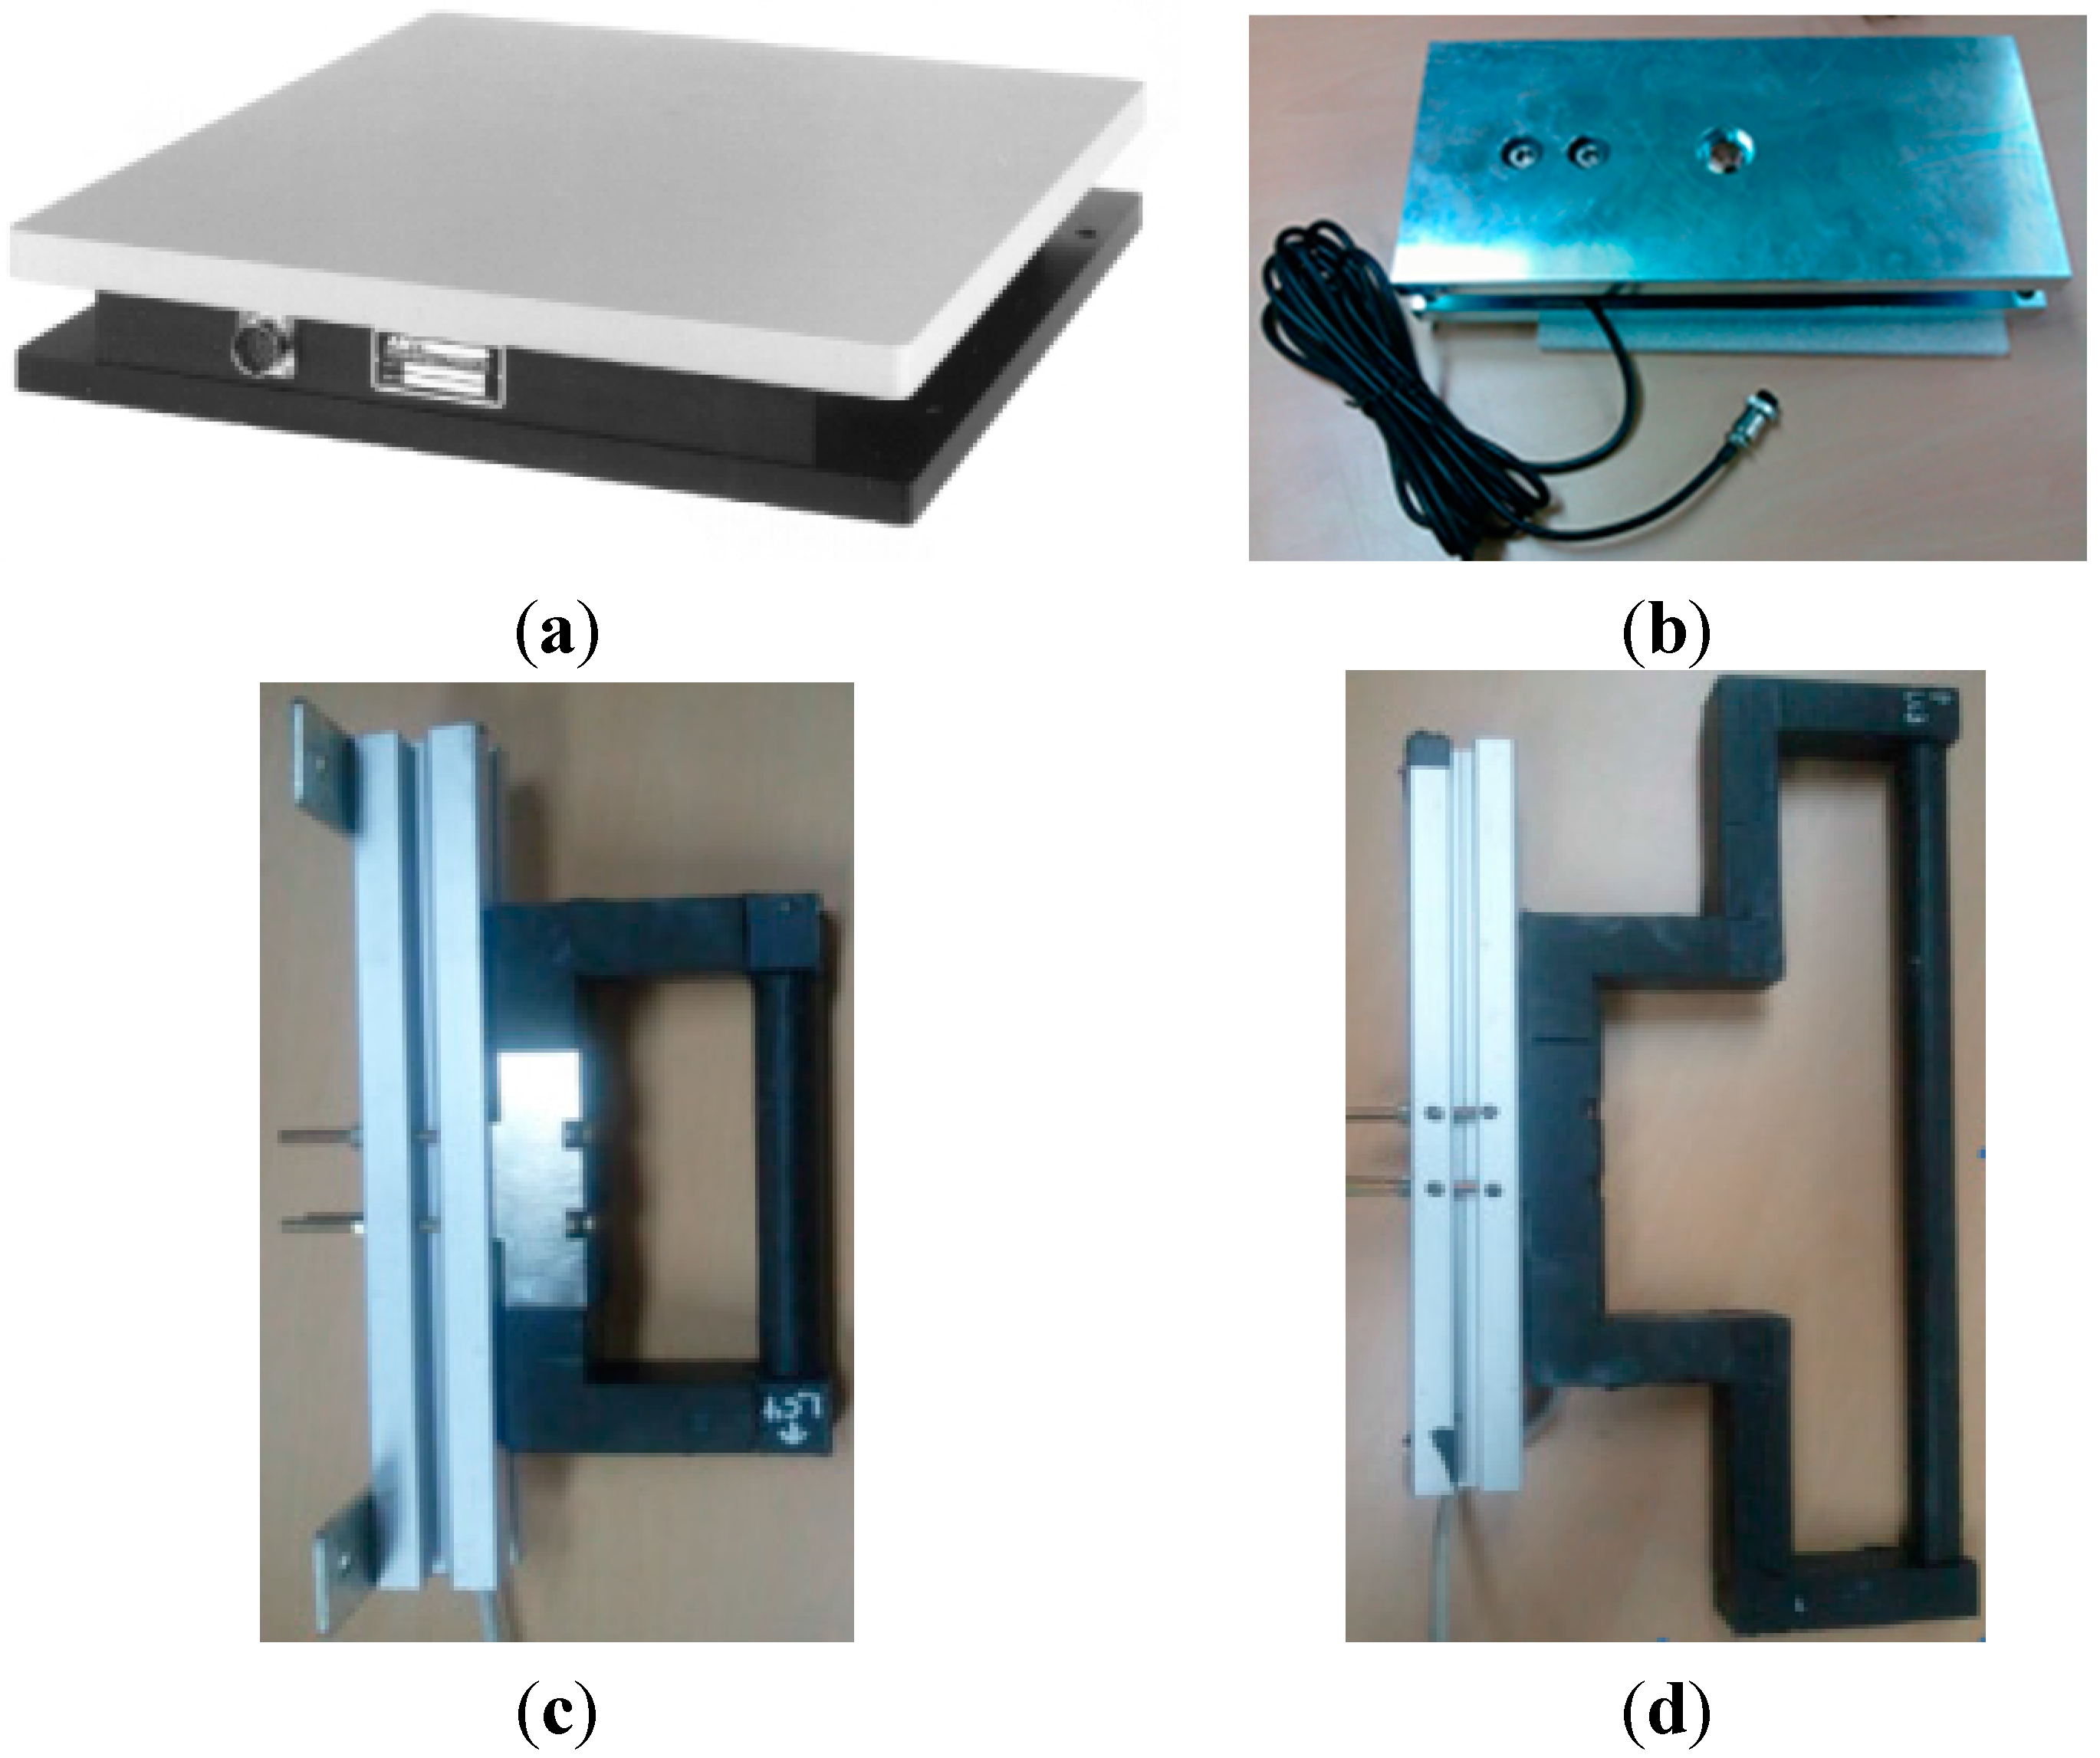
2.2.3. Force Measurement Instruments

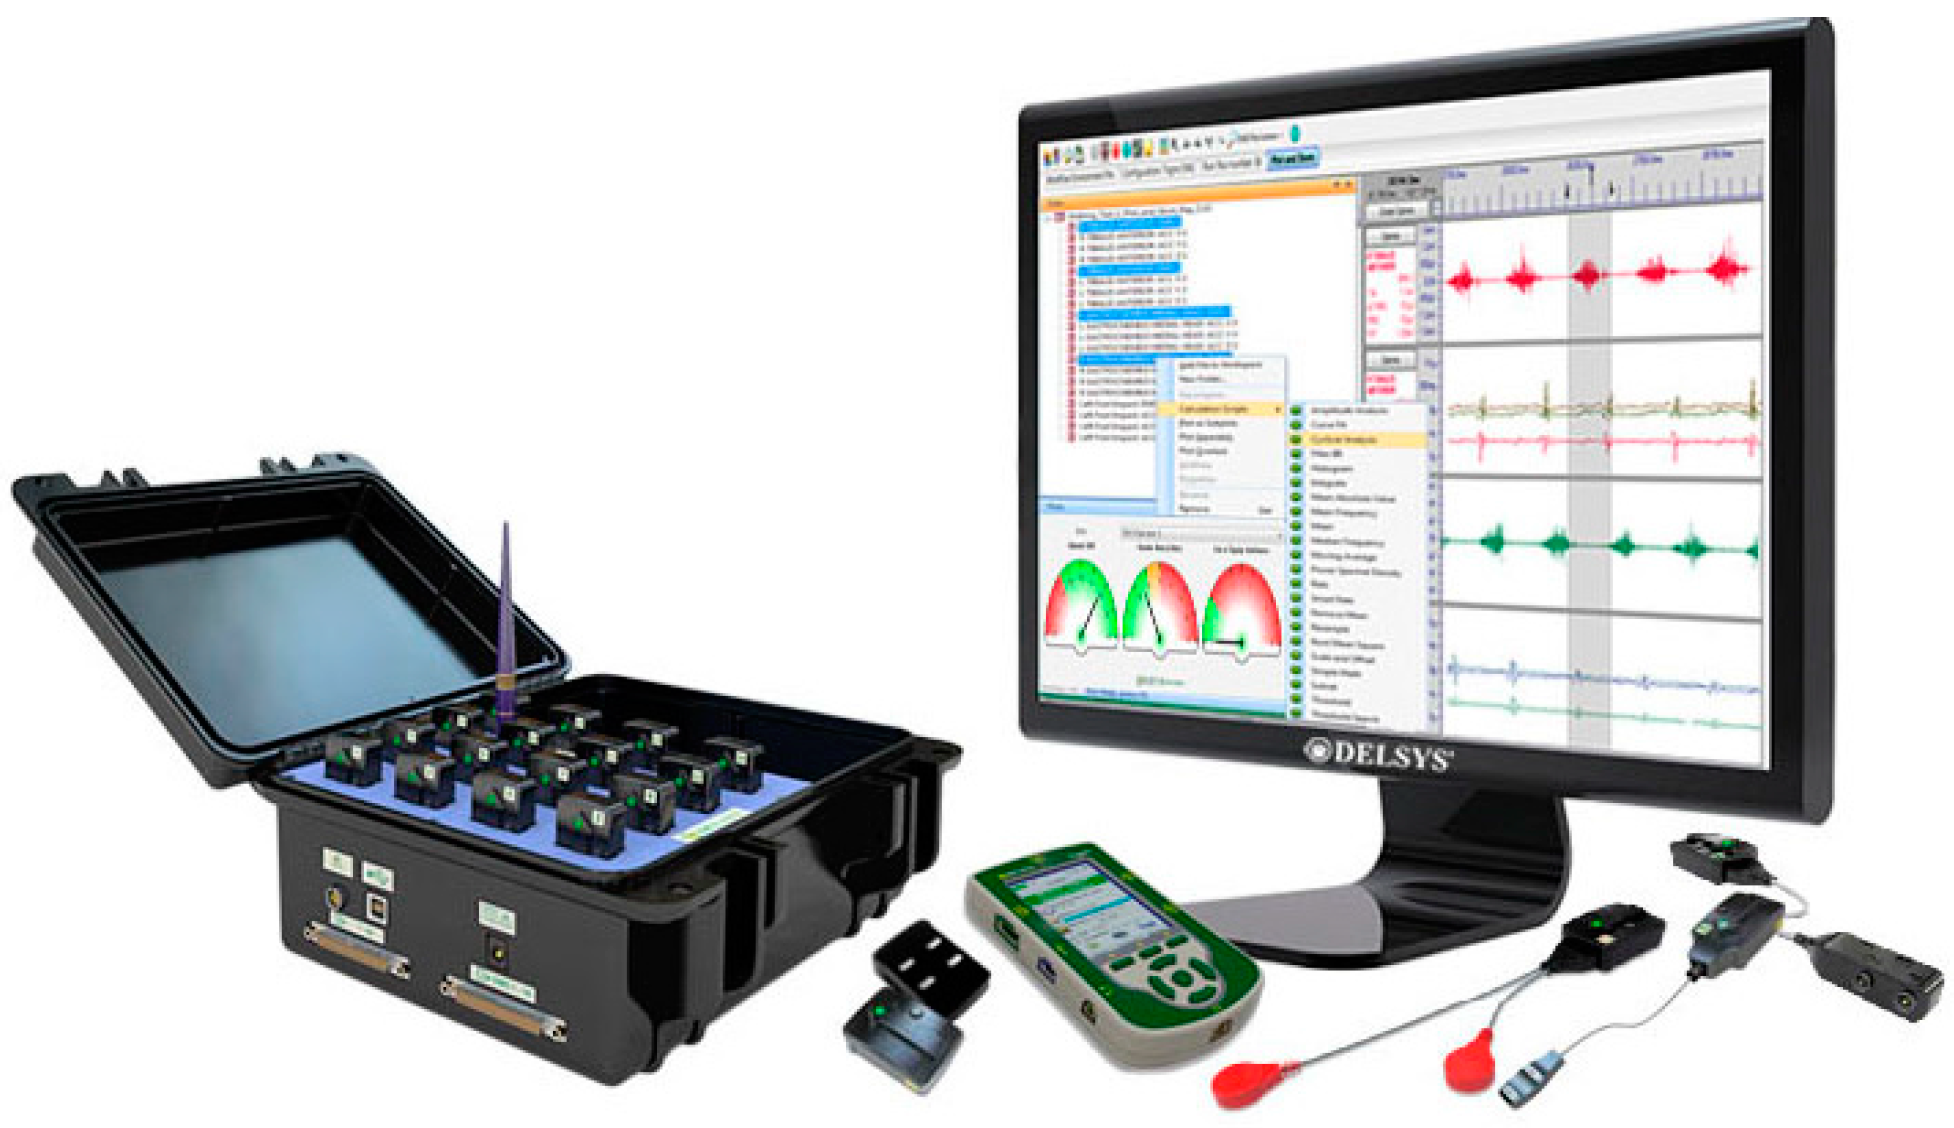
2.2.4. EMG Measurement Instrument
3. Biomechanical Analysis
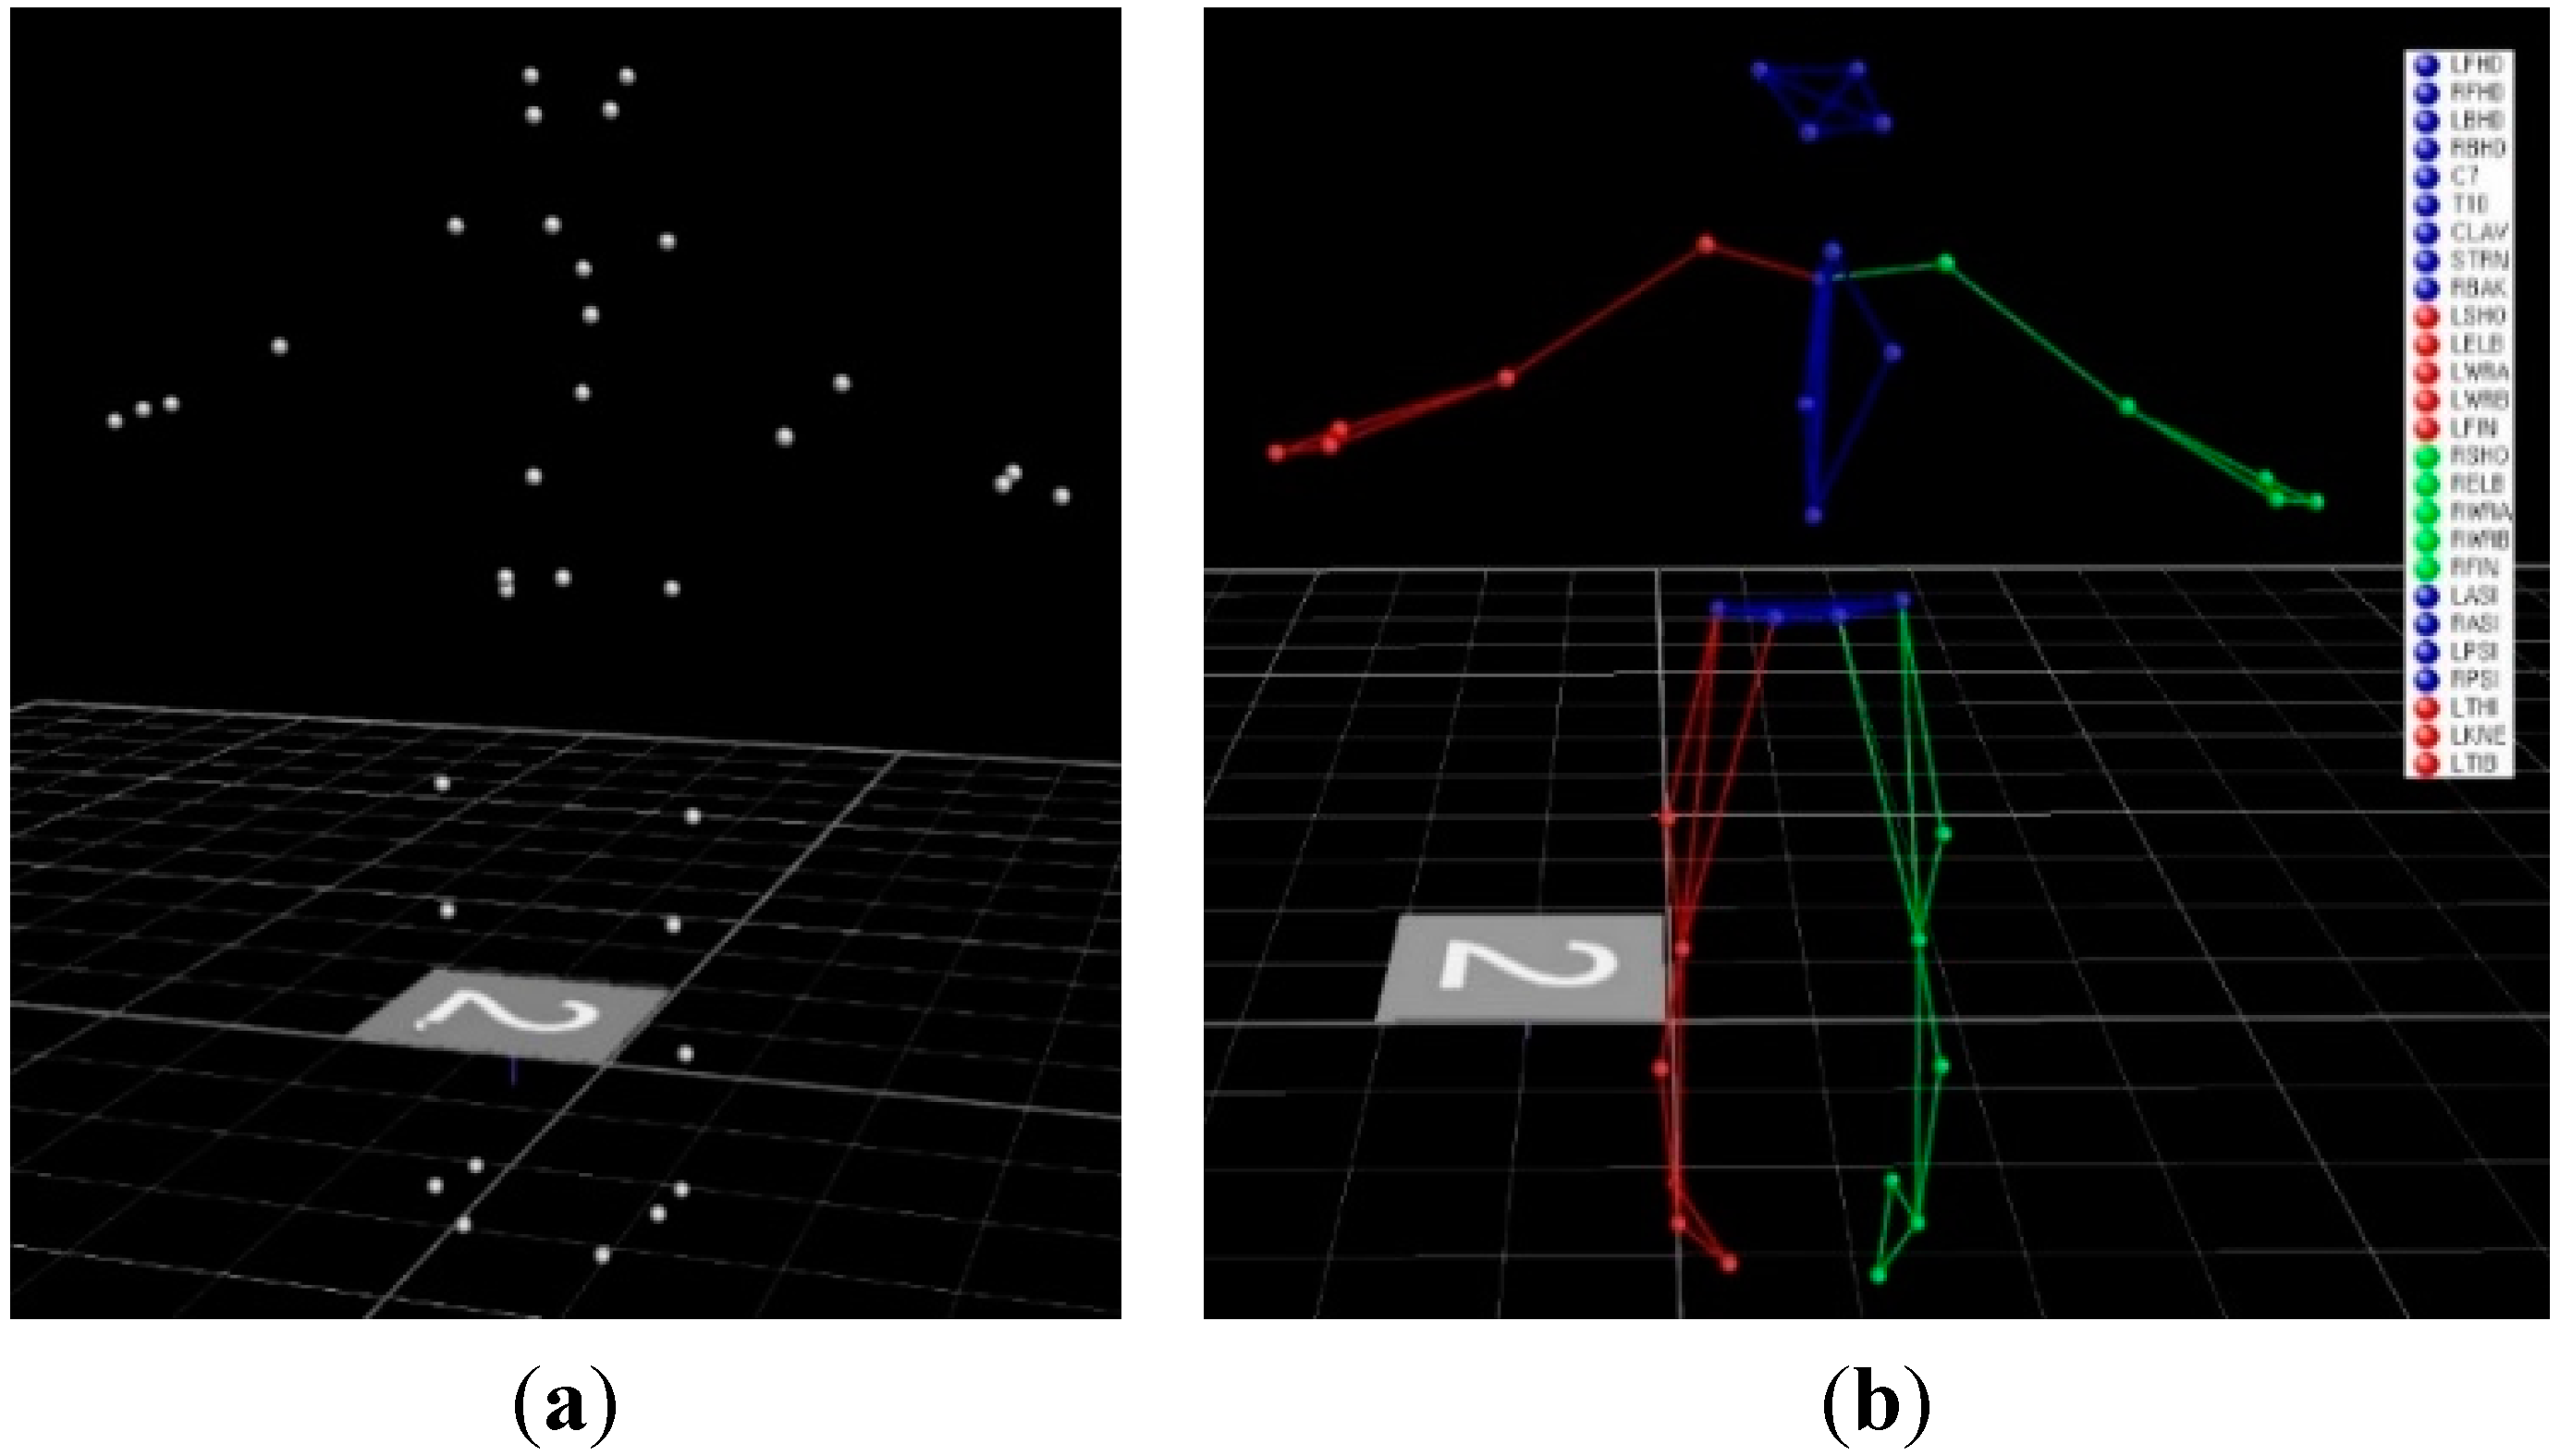
3.1. Markers and Motion Data

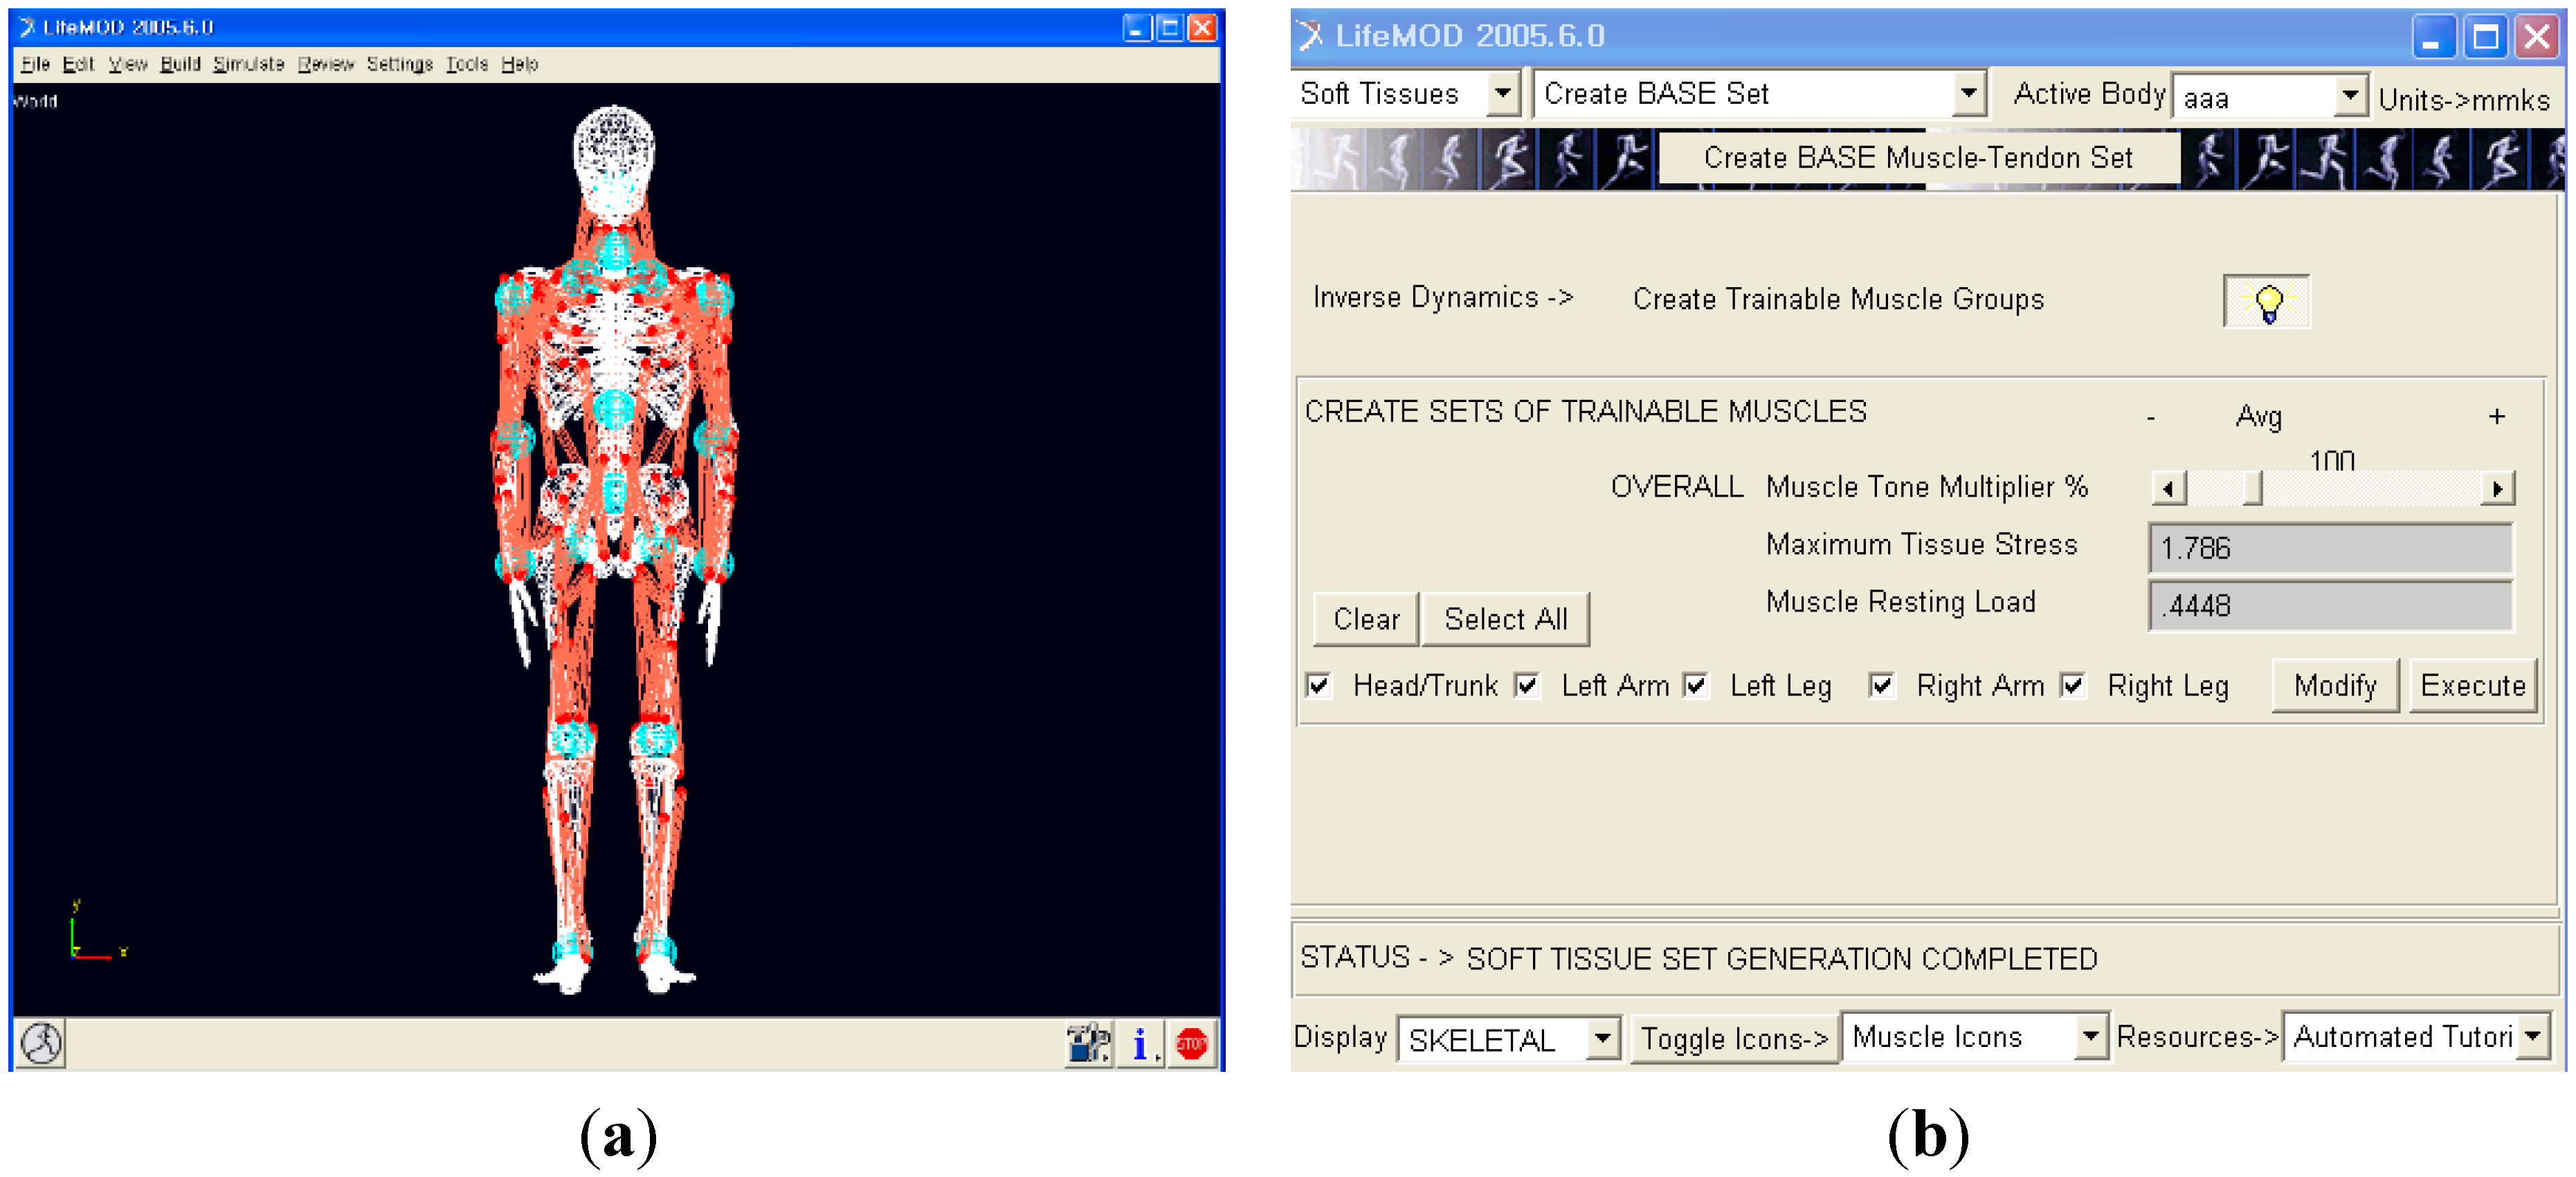
3.2. Musculoskeletal Human Body Model

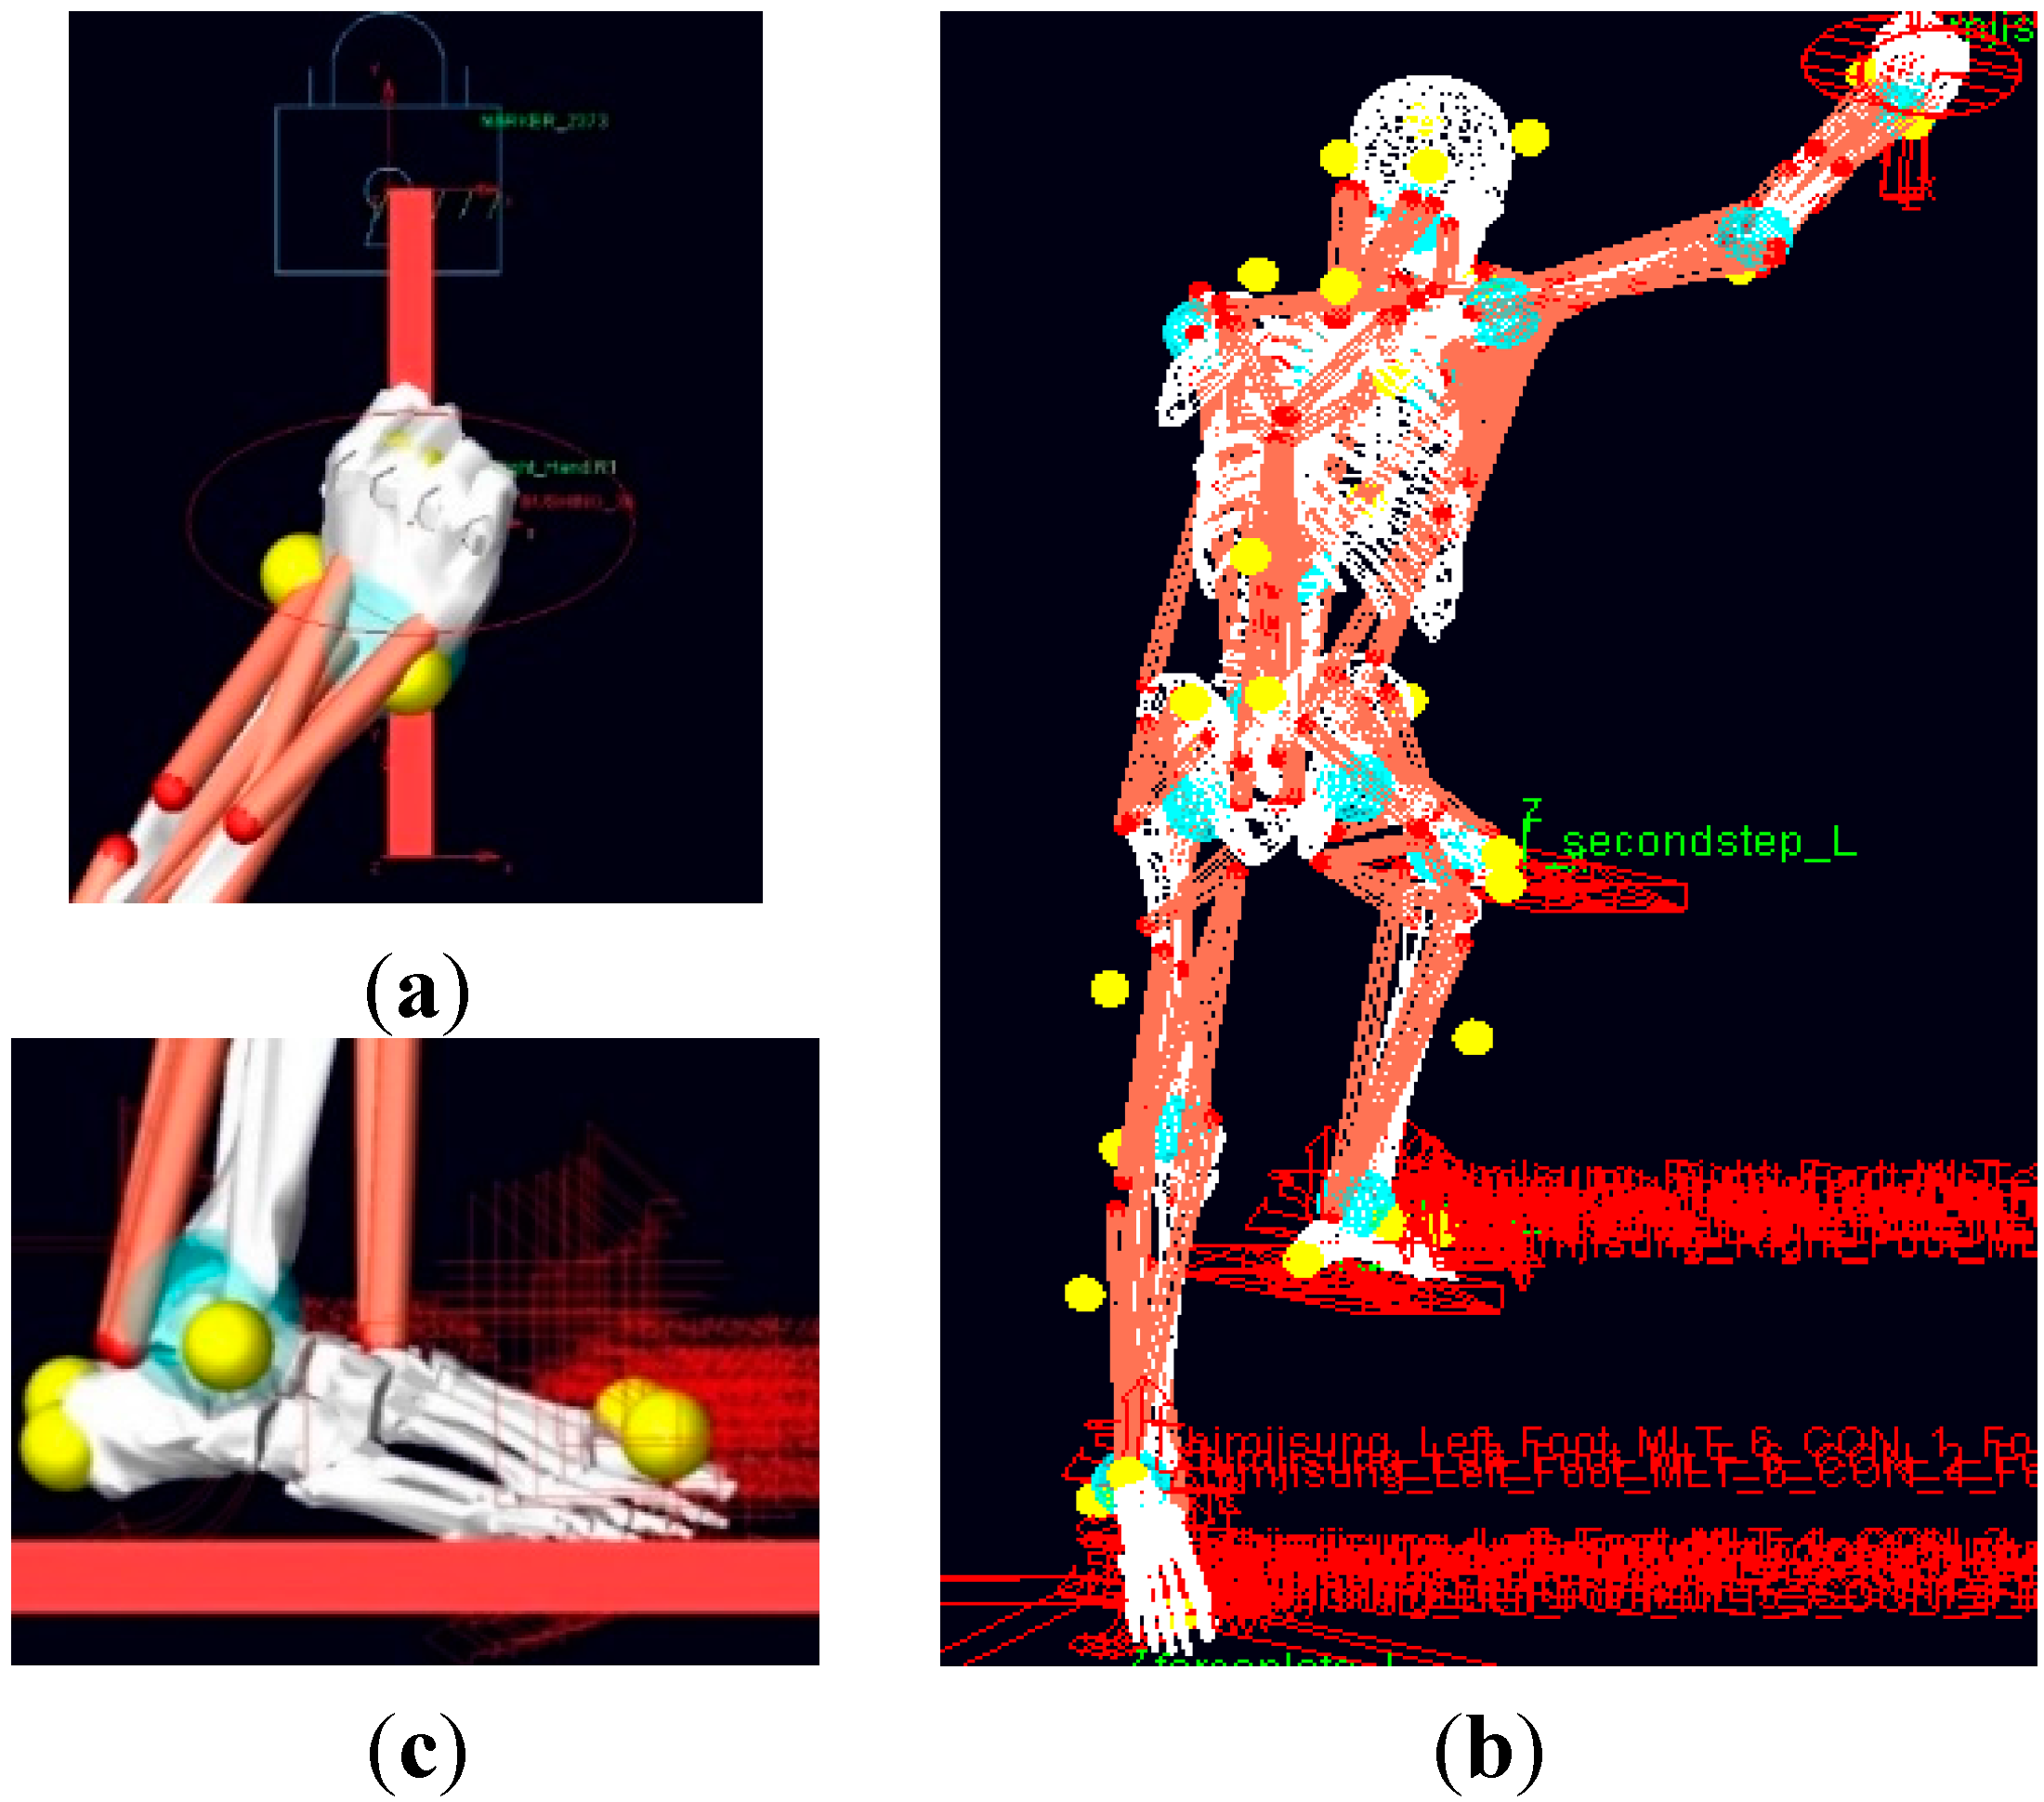
3.3. Boundary Conditions for Biomechanical Analysis

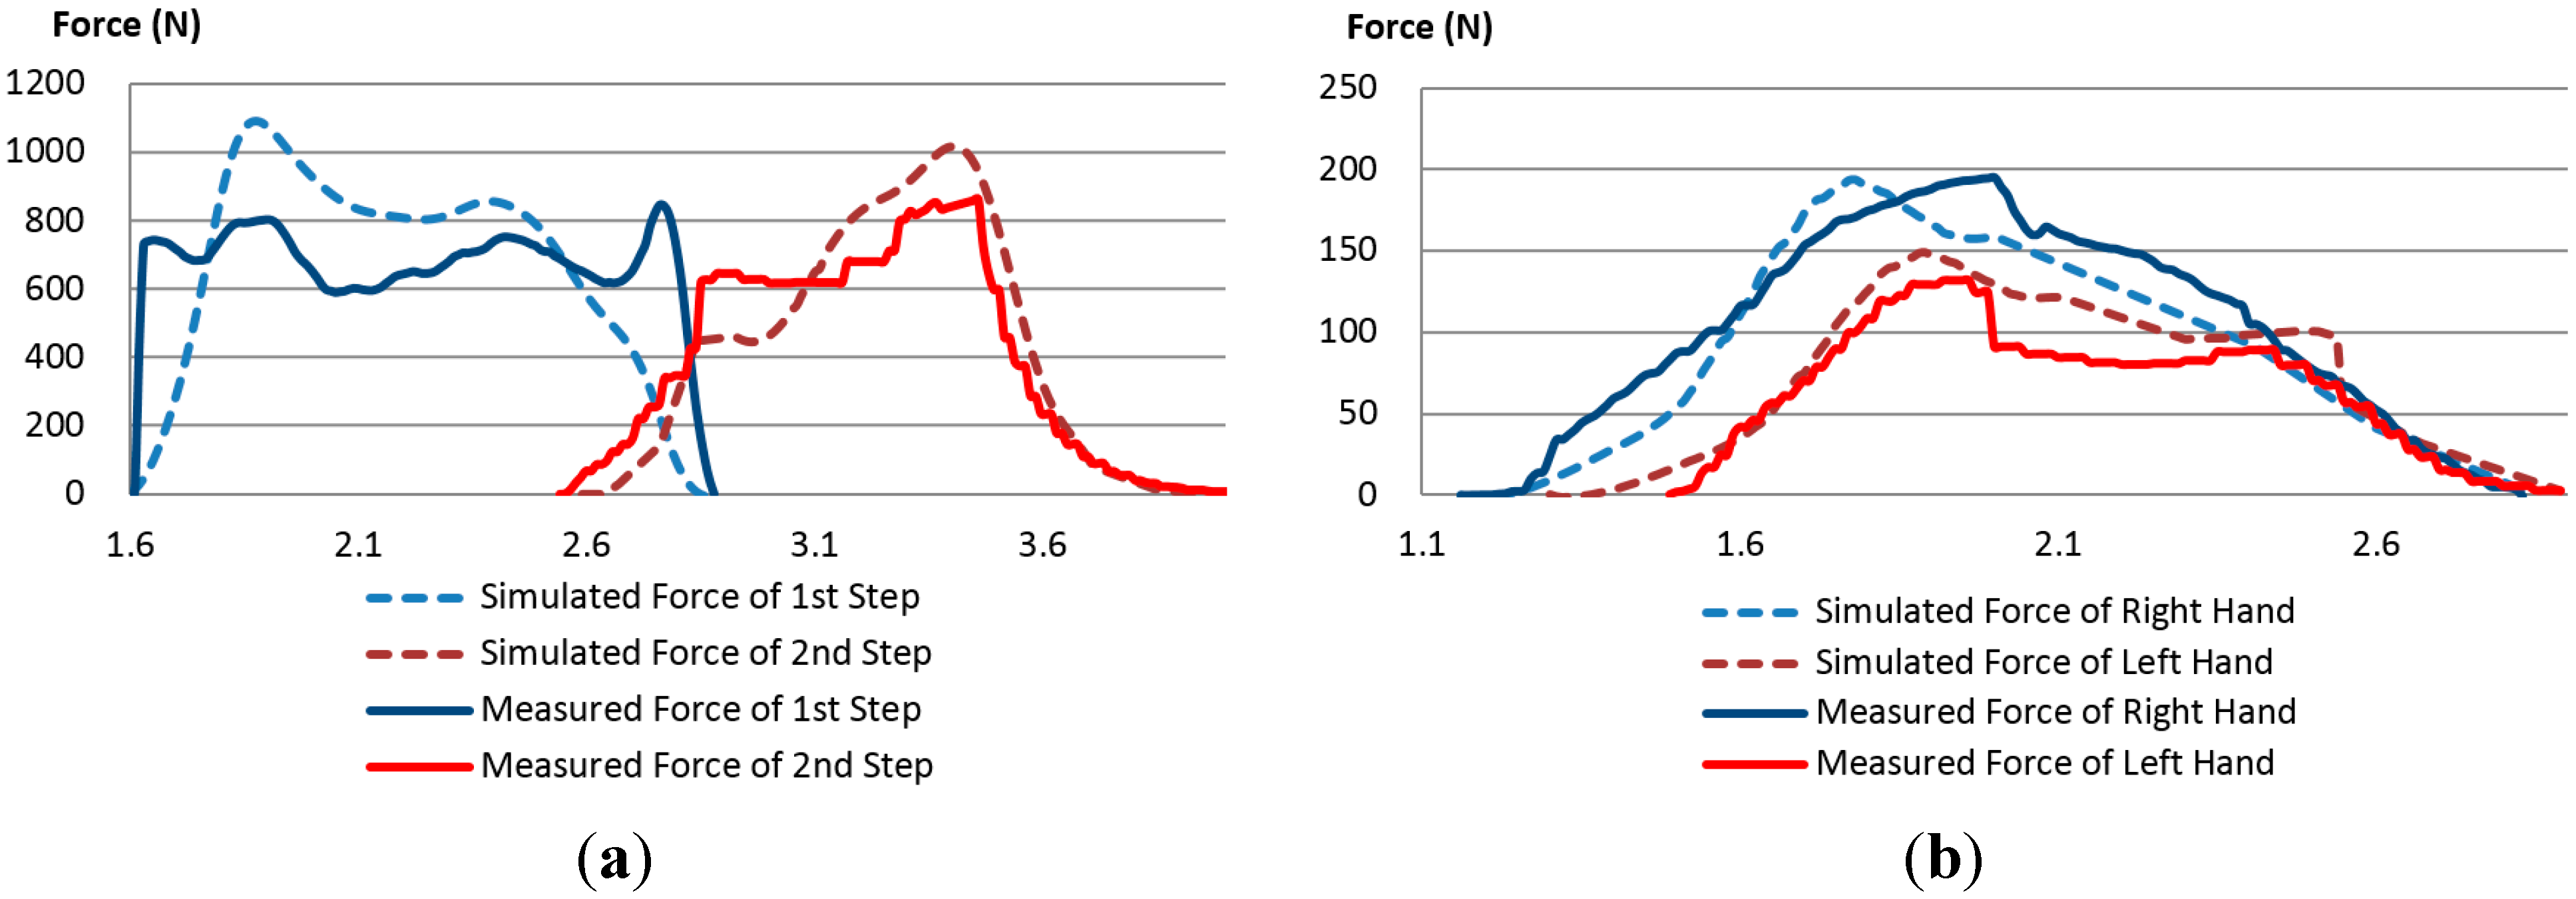
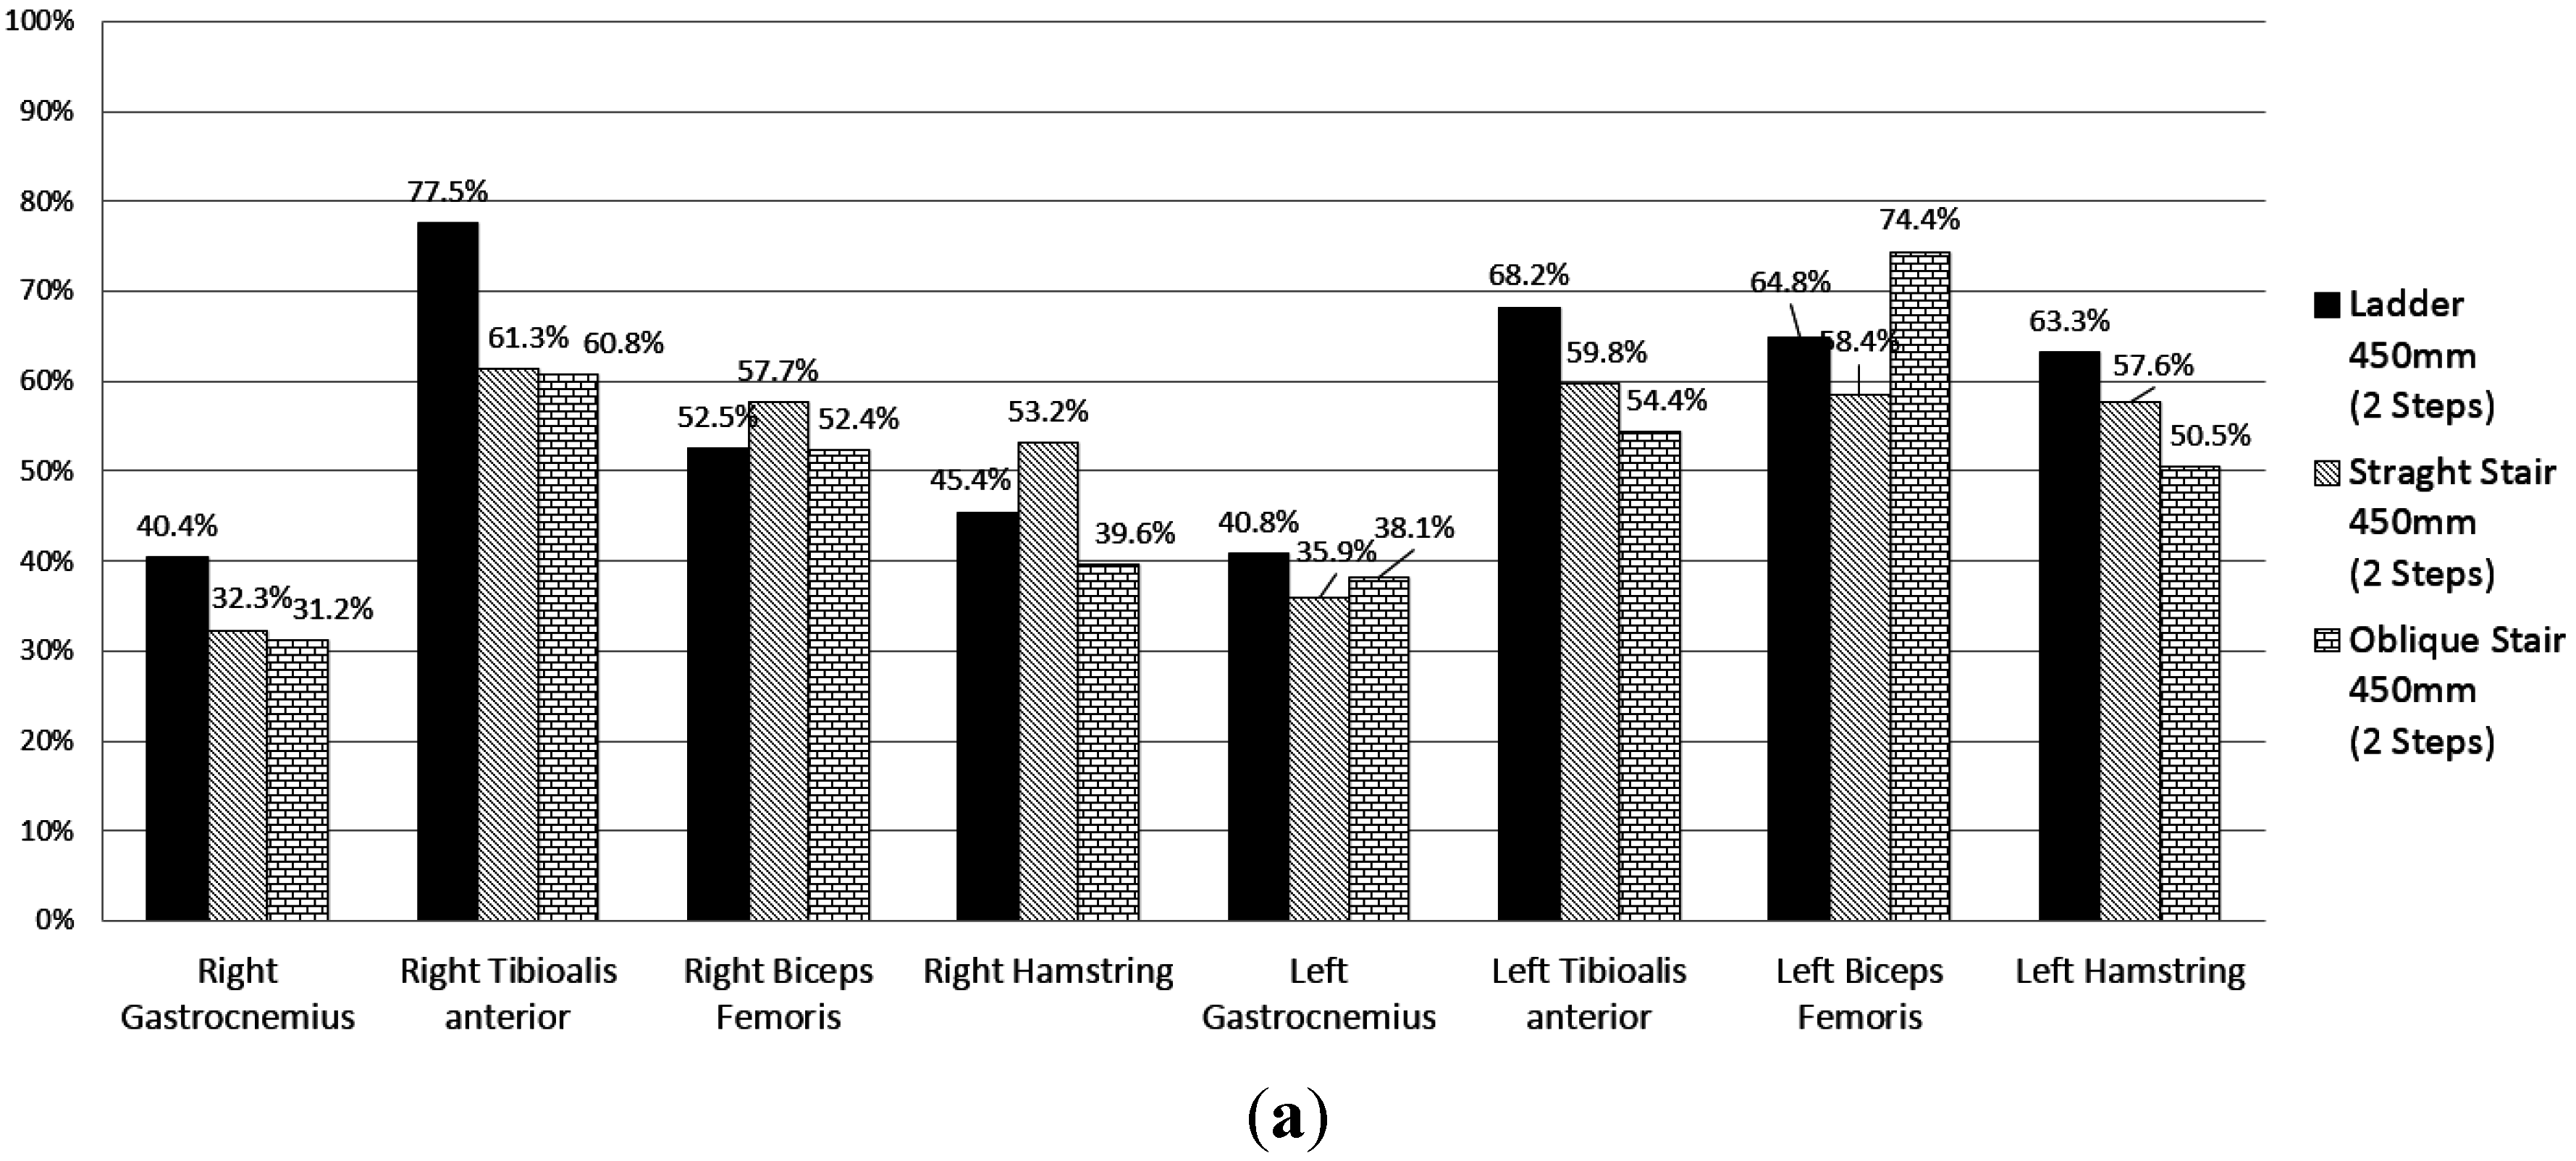
3.4. Validation of the Model with Measured Data


4. Discomfort Evaluation Based on the Biomechanical Analysis Results
4.1. Discomfort Model Based on Muscle Forces
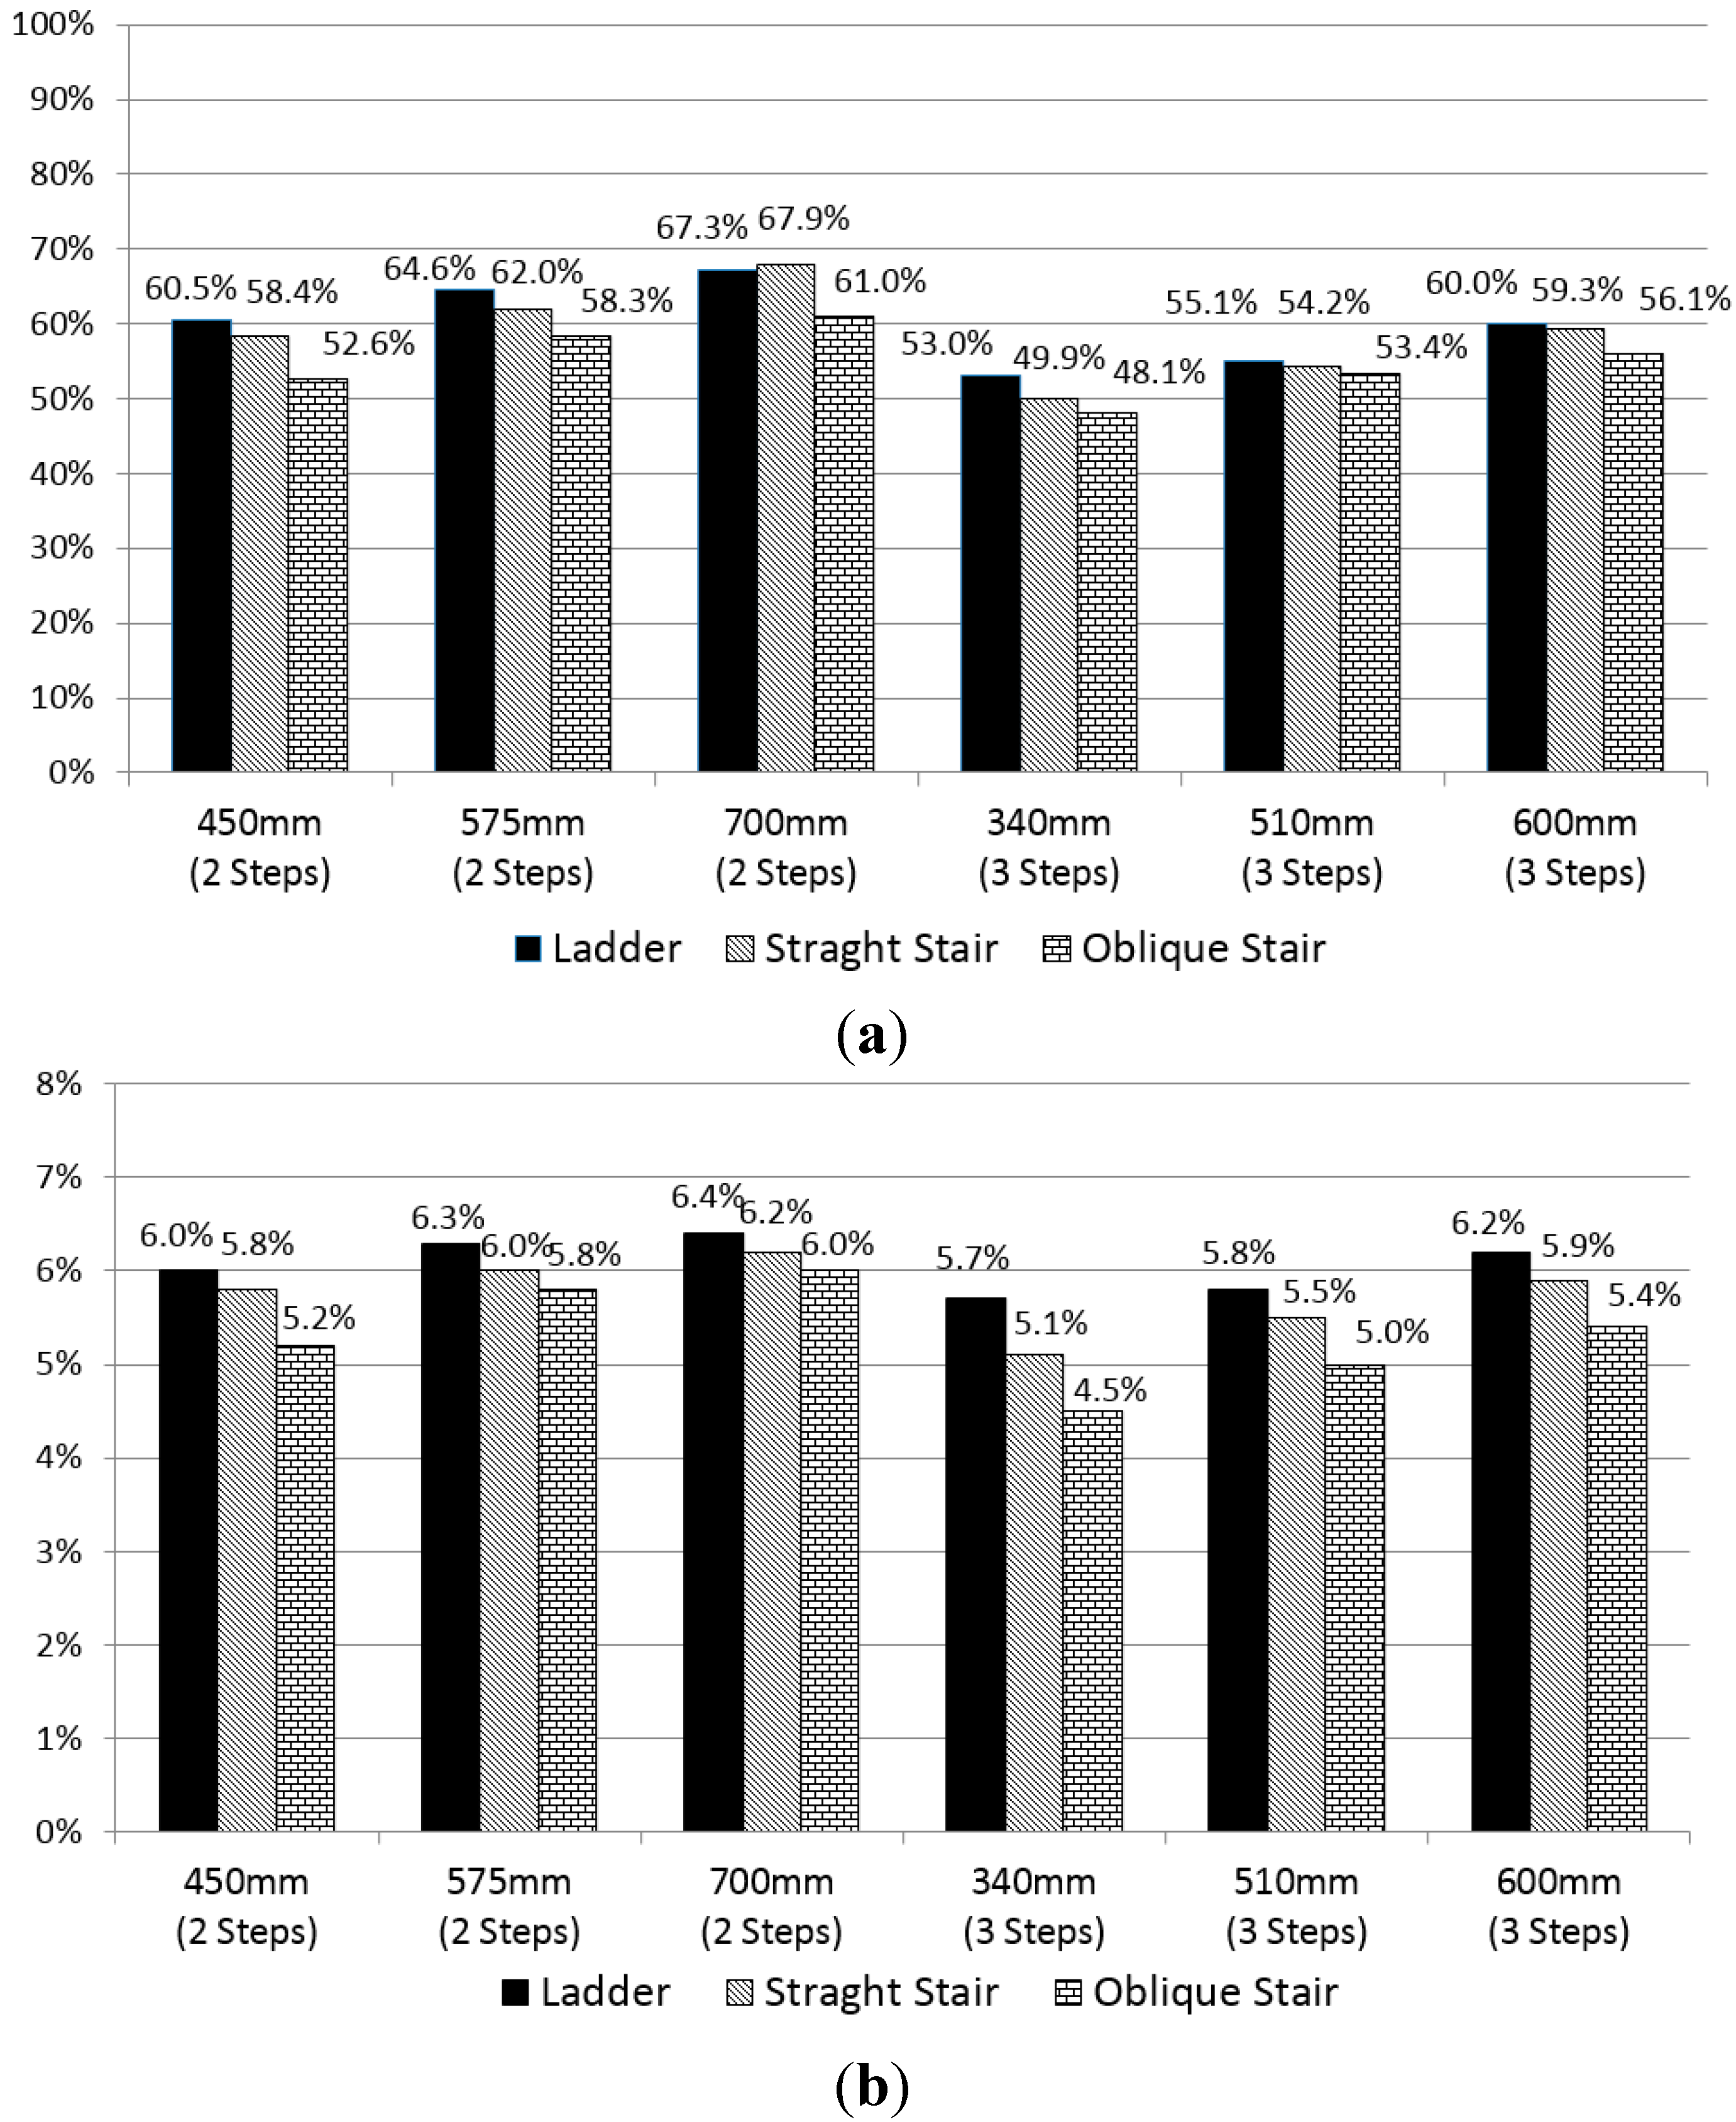
4.2. Evaluation of Objective Discomfort Using Discomfort Models Based on the MVC Ratio
| No. of Steps | Stair Type | Height of First Step (mm) | Case No. | Maximum-%MVC Discomfort | Average-%MVC Discomfort | ||
|---|---|---|---|---|---|---|---|
| Value (%) | Change in Rate (%) | Value (%) | Change in Rate (%) | ||||
| 2 | Ladder | 450 | 1 | 60.5 | 0.0 | 6.0 | 0.0 |
| 575 | 2 | 64.5 | 6.6 | 6.3 | 4.6 | ||
| 700 | 3 | 67.3 | 11.3 | 6.4 | 6.5 | ||
| Straight Stair | 450 | 4 | 58.4 | −3.5 | 5.8 | −3.6 | |
| 575 | 5 | 62.0 | 2.5 | 6.0 | 0.0 | ||
| 700 | 6 | 67.9 | 12.2 | 6.2 | 2.0 | ||
| Oblique Stair | 450 | 7 | 52.6 | −13.2 | 5.2 | −13.6 | |
| 575 | 8 | 58.3 | −3.8 | 5.8 | −3.3 | ||
| 700 | 9 | 61.0 | 0.8 | 6.0 | −1.5 | ||
| 3 | Ladder | 340 | 10 | 53.0 | −12.5 | 5.7 | −5.6 |
| 510 | 11 | 55.1 | −9.0 | 5.8 | −4.1 | ||
| 600 | 12 | 60.0 | −0.9 | 6.2 | 1.8 | ||
| Straight Stair | 340 | 13 | 49.9 | −17.6 | 5.1 | −15.9 | |
| 510 | 14 | 54.2 | −10.4 | 5.5 | −8.3 | ||
| 600 | 15 | 59.3 | −2.1 | 5.9 | −3.1 | ||
| Oblique Stair | 340 | 16 | 48.1 | −20.5 | 4.5 | −25.7 | |
| 510 | 17 | 53.4 | −11.8 | 5.0 | −17.6 | ||
| 600 | 18 | 56.1 | −7.3 | 5.4 | −11.3 | ||
5. Evaluation of Subjective Discomfort
5.1. Participants
5.2. Experimental Procedure
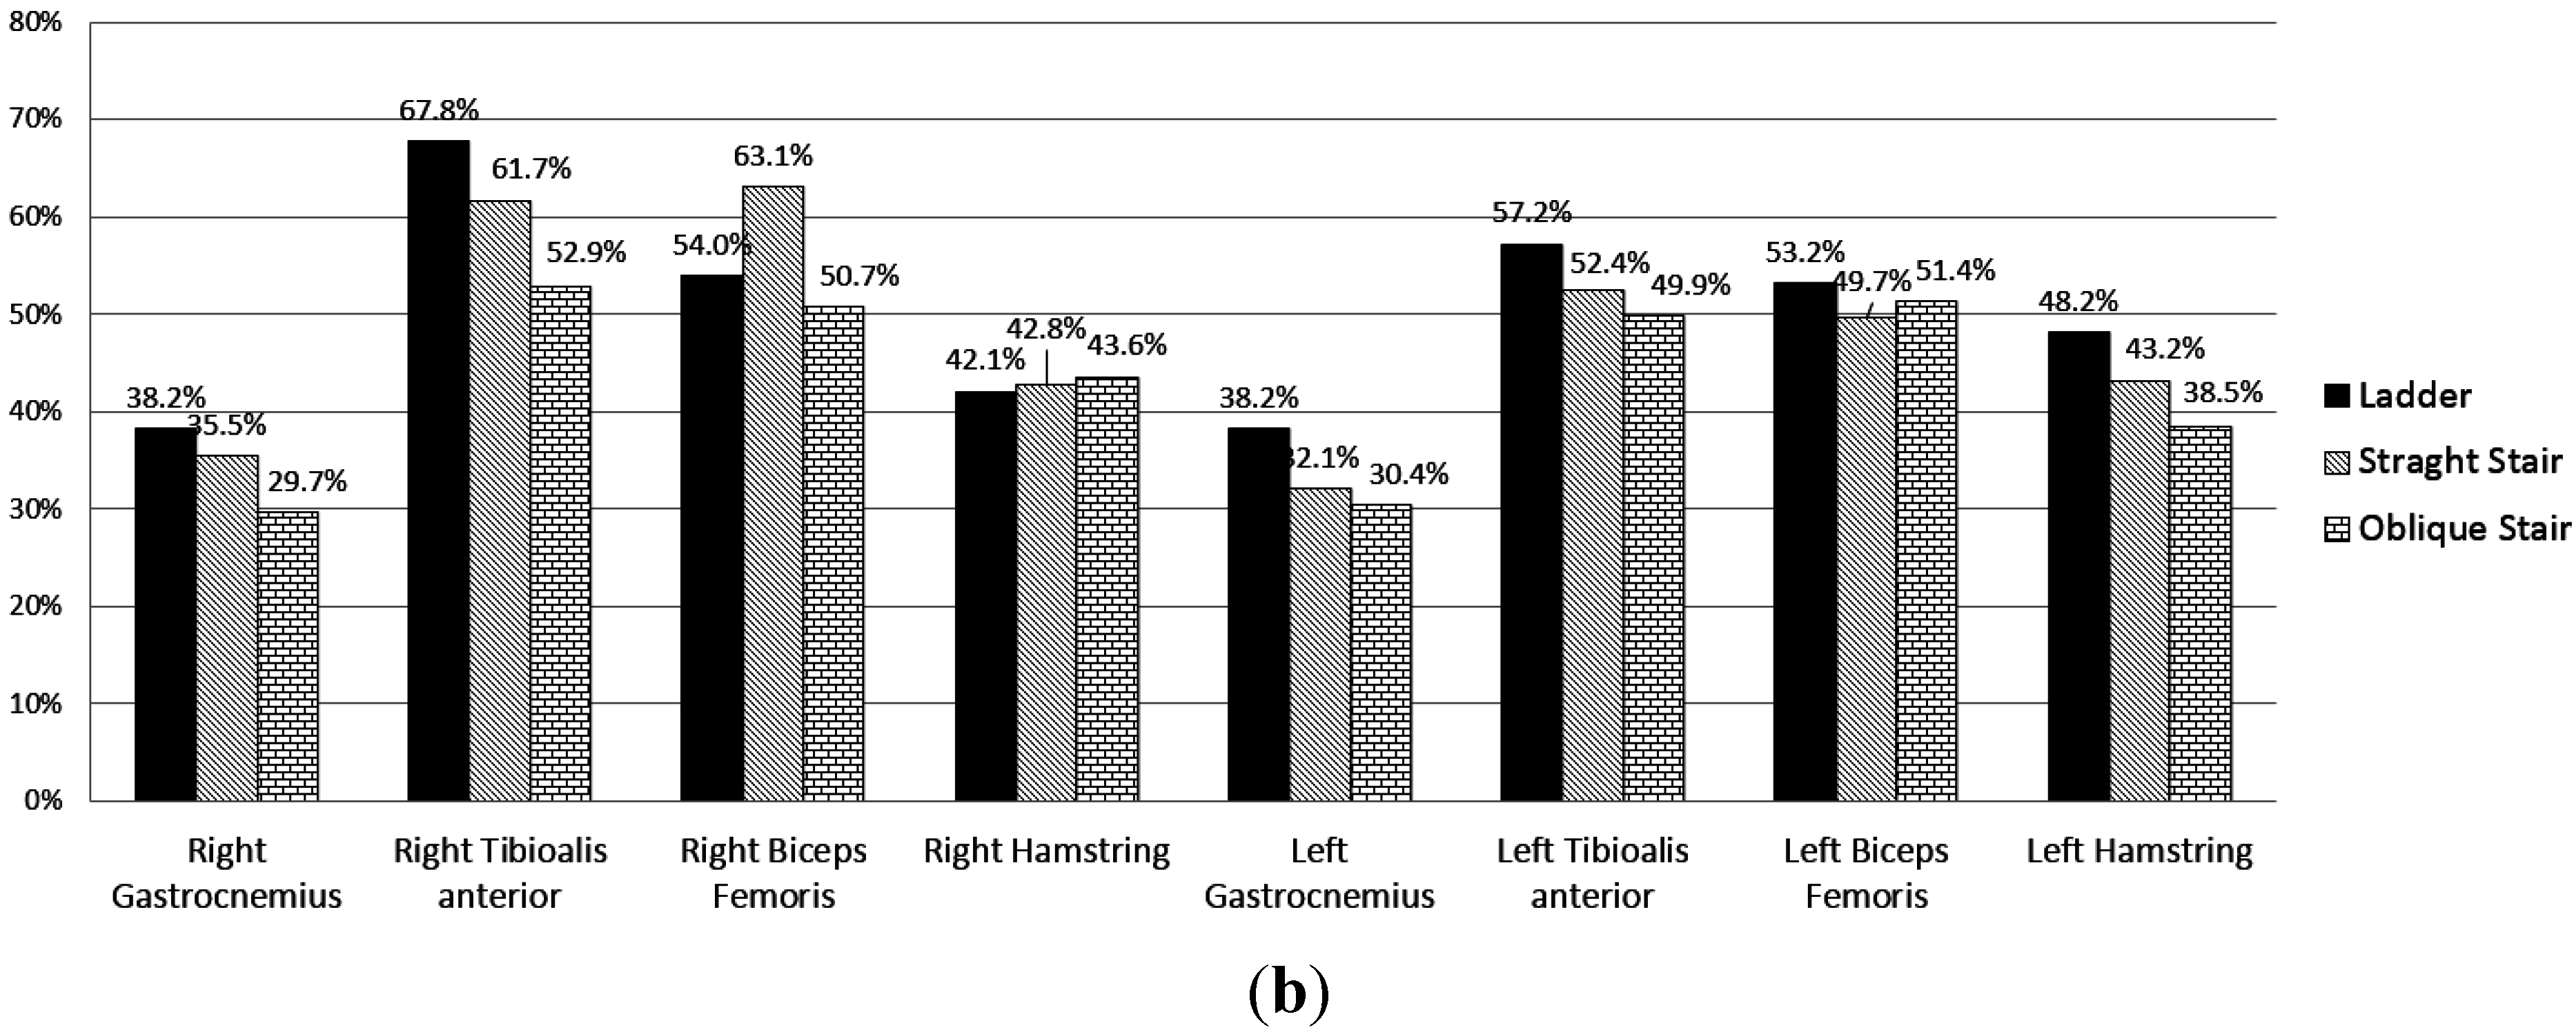
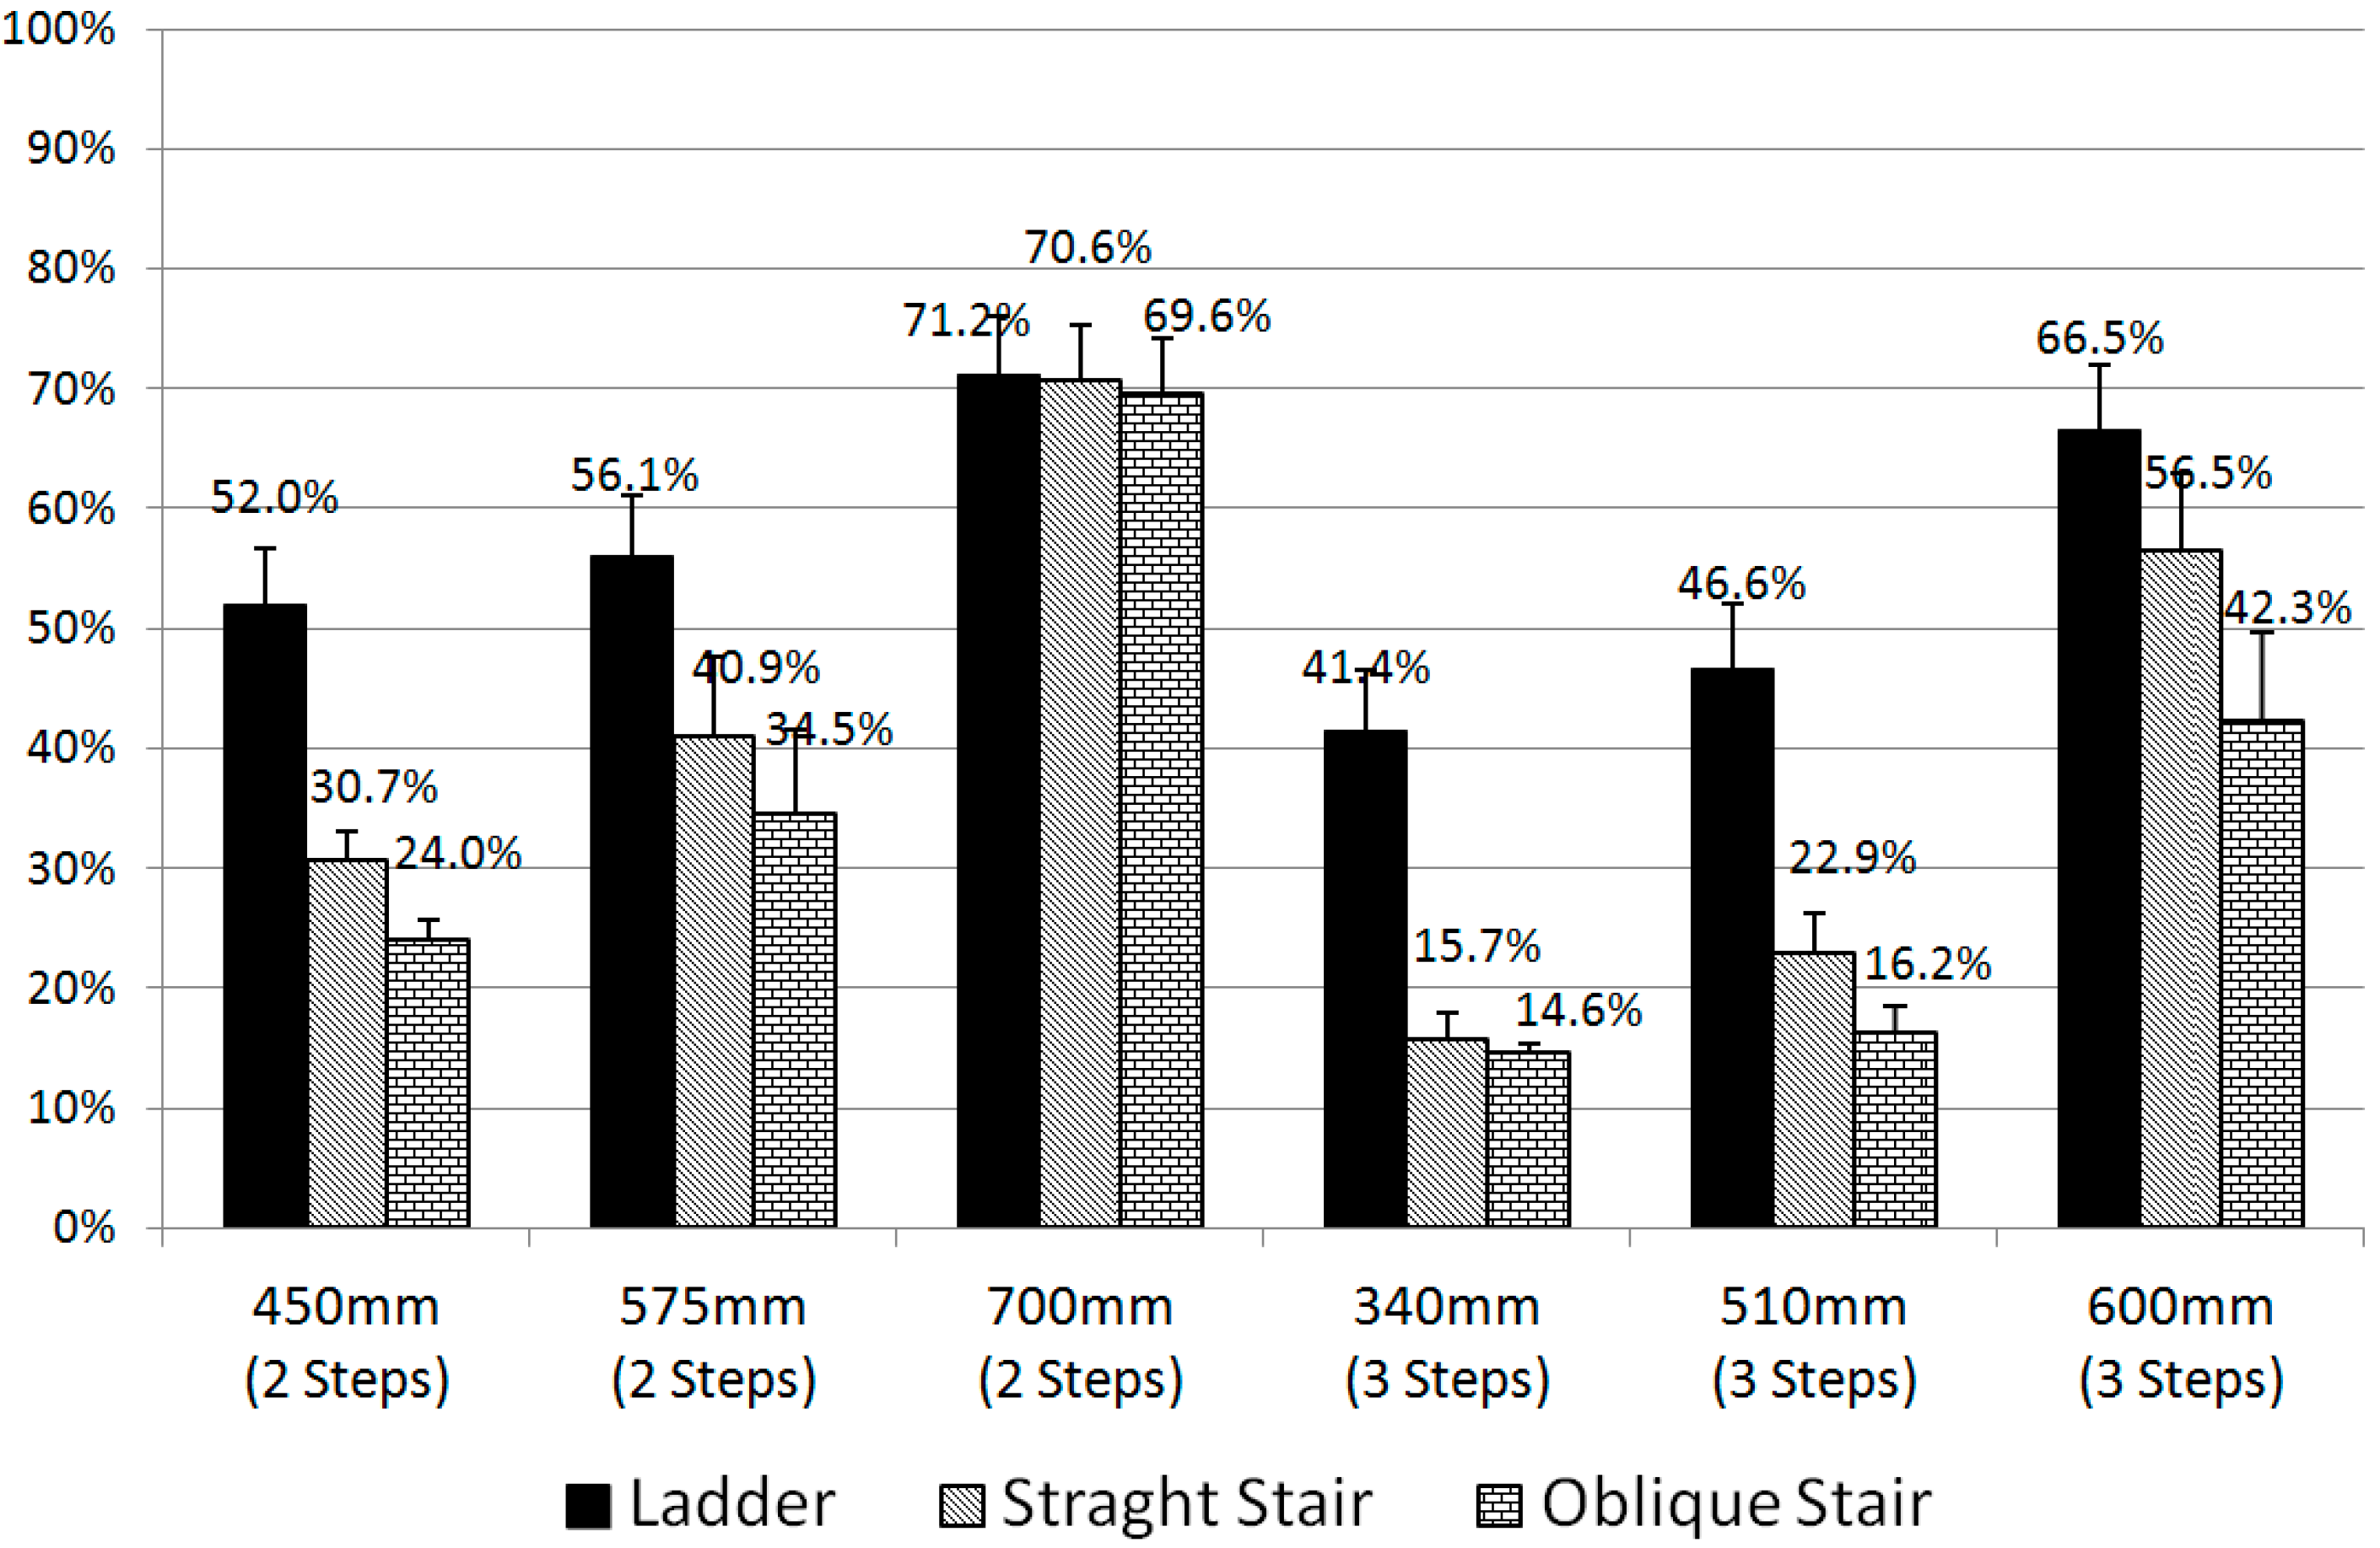
5.3. Experimental Results
| No. of Steps | Stair Type | Height of First Step (mm) | Case No. | Subjective Discomfort | ||
|---|---|---|---|---|---|---|
| Value (%) | Change in Rate (%) | Standard Error (%) | ||||
| 2 | Ladder | 450 | 1 | 52.0 | 0.0 | 4.6 |
| 575 | 2 | 56.1 | 7.9 | 5.0 | ||
| 700 | 3 | 71.2 | 36.9 | 4.8 | ||
| Straight Stair | 450 | 4 | 30.7 | −41.0 | 2.4 | |
| 575 | 5 | 40.9 | −21.3 | 6.8 | ||
| 700 | 6 | 70.6 | 35.8 | 4.7 | ||
| Oblique Stair | 450 | 7 | 24.0 | −53.8 | 1.7 | |
| 575 | 8 | 34.5 | −33.8 | 7.1 | ||
| 700 | 9 | 69.6 | 33.8 | 4.6 | ||
| 3 | Ladder | 340 | 10 | 41.4 | −20.4 | 5.1 |
| 510 | 11 | 46.6 | −10.4 | 5.5 | ||
| 600 | 12 | 66.5 | 27.9 | 5.5 | ||
| Straight Stair | 340 | 13 | 15.7 | −69.8 | 2.2 | |
| 510 | 14 | 22.9 | −56.0 | 3.4 | ||
| 600 | 15 | 56.5 | 8.7 | 6.5 | ||
| Oblique Stair | 340 | 16 | 14.6 | −71.9 | 0.8 | |
| 510 | 17 | 16.2 | −68.8 | 2.3 | ||
| 600 | 18 | 42.3 | −18.7 | 7.4 | ||
6. Discussions
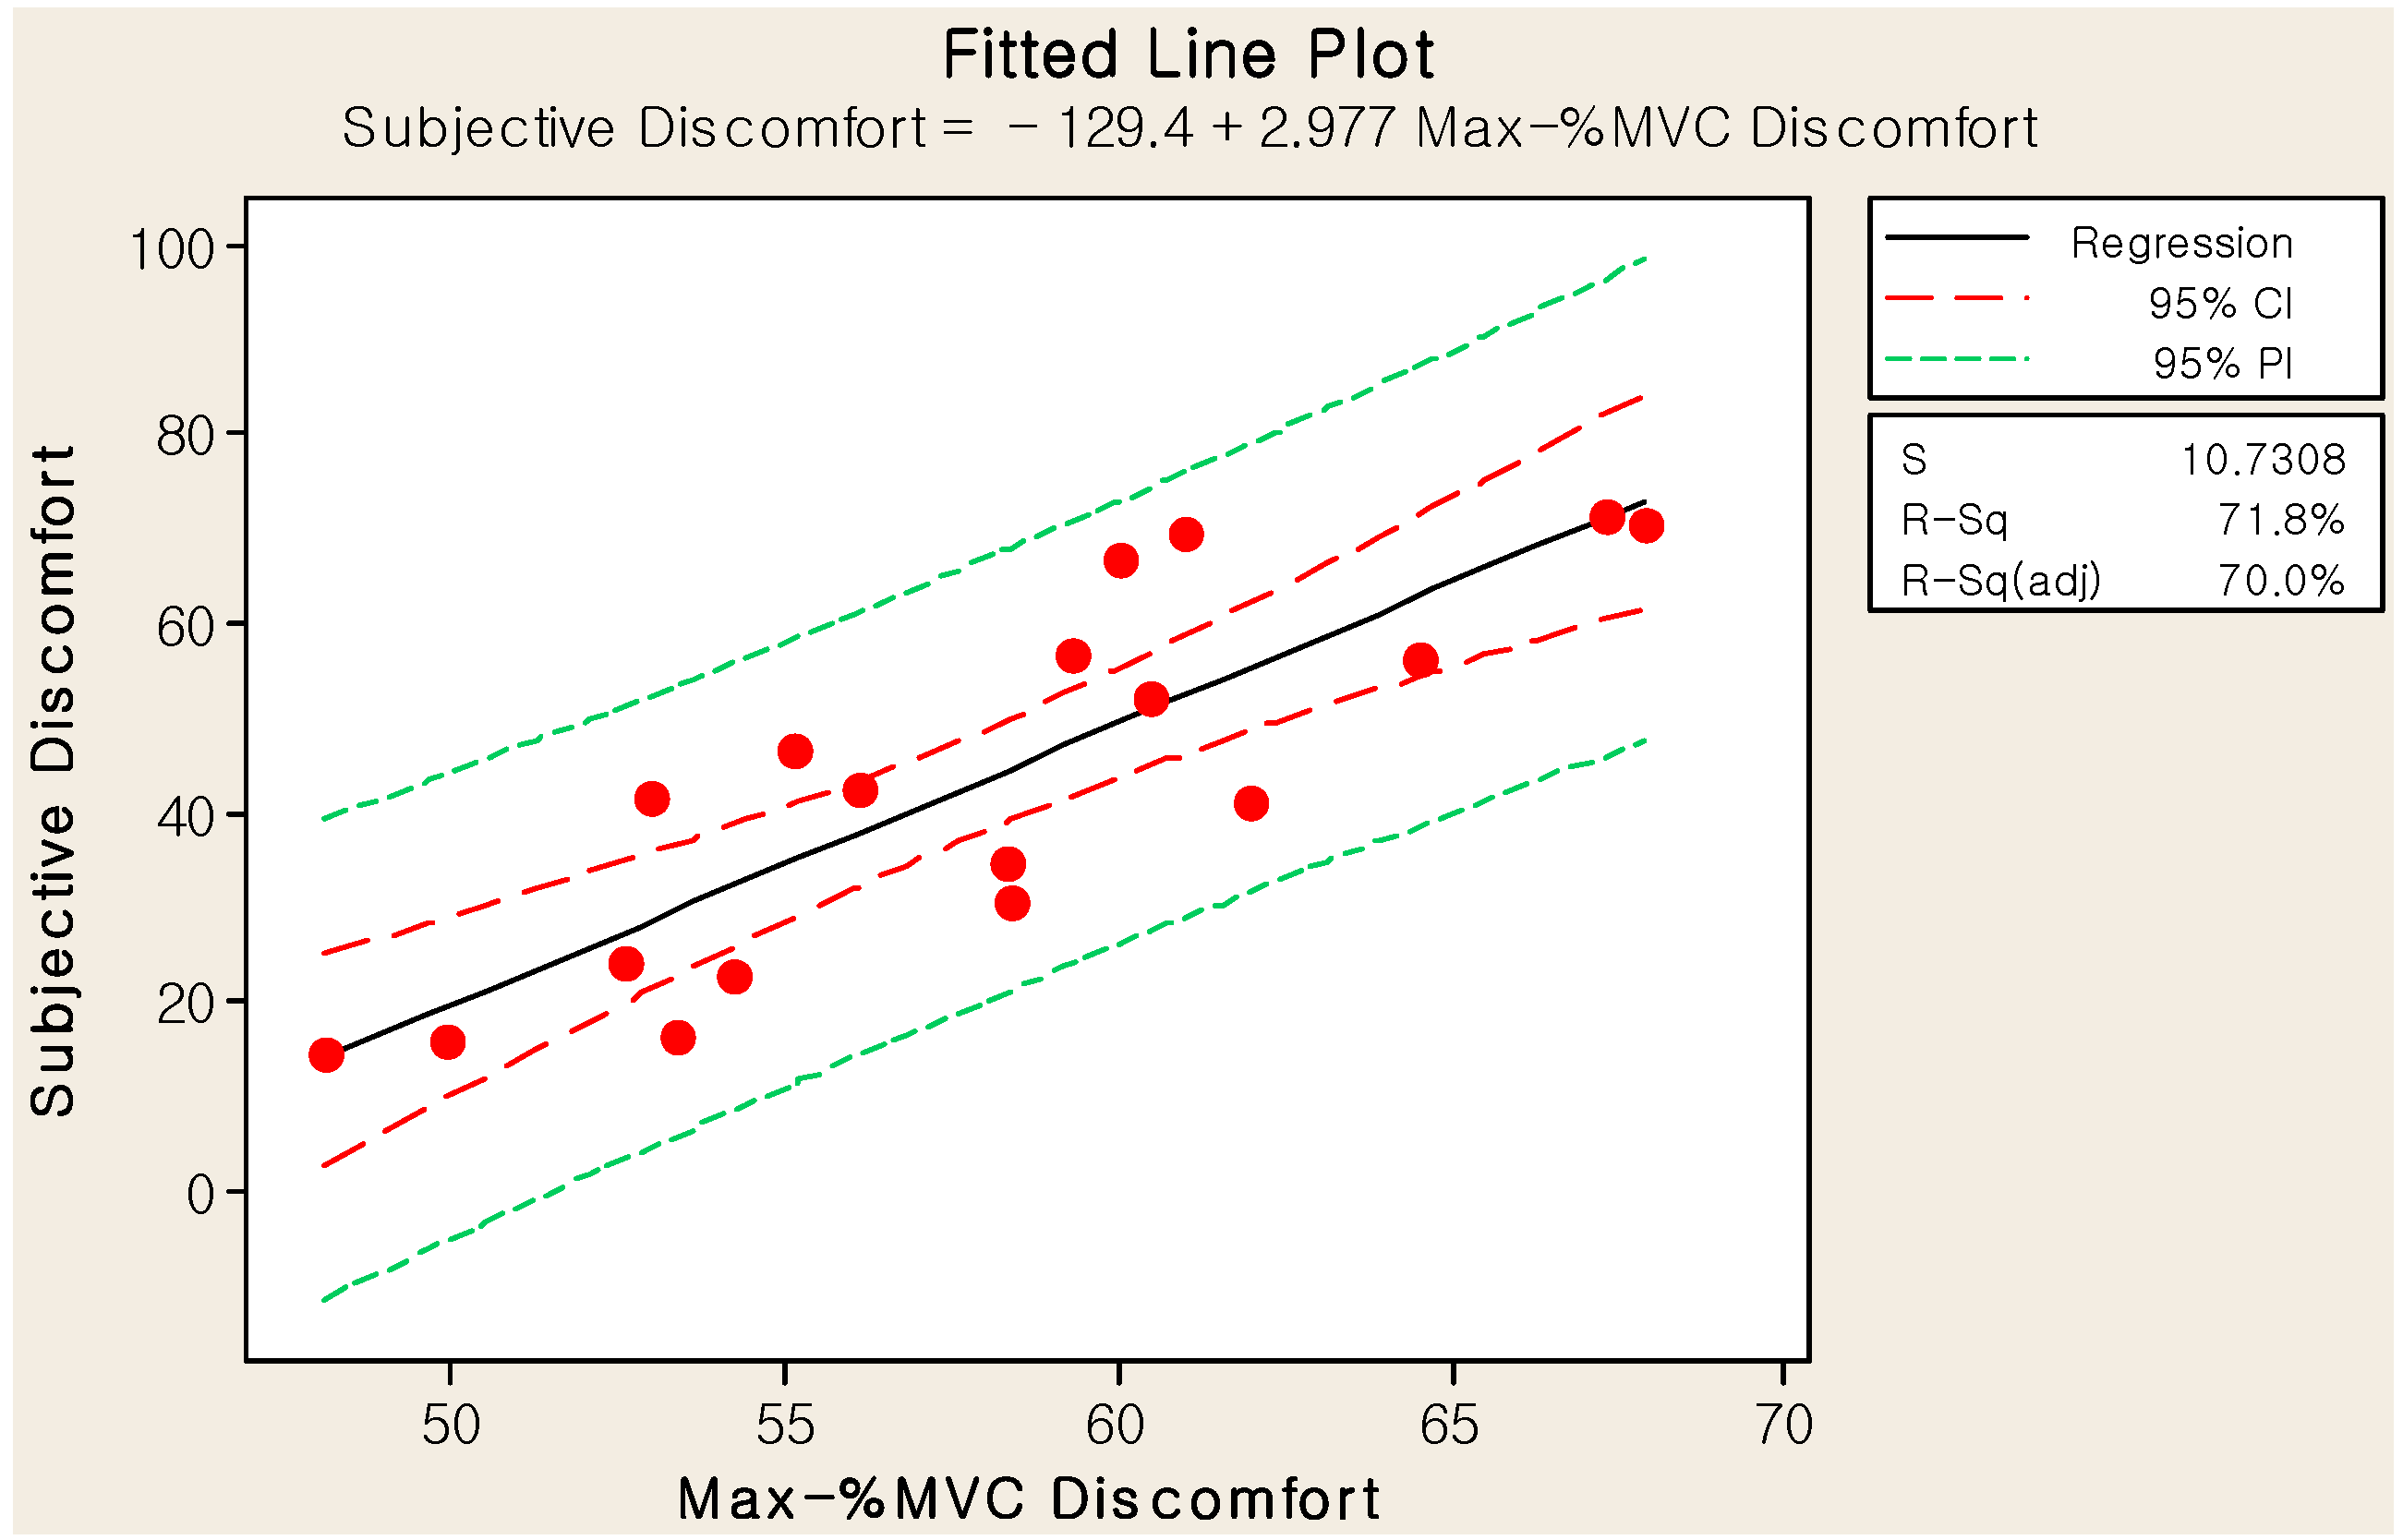
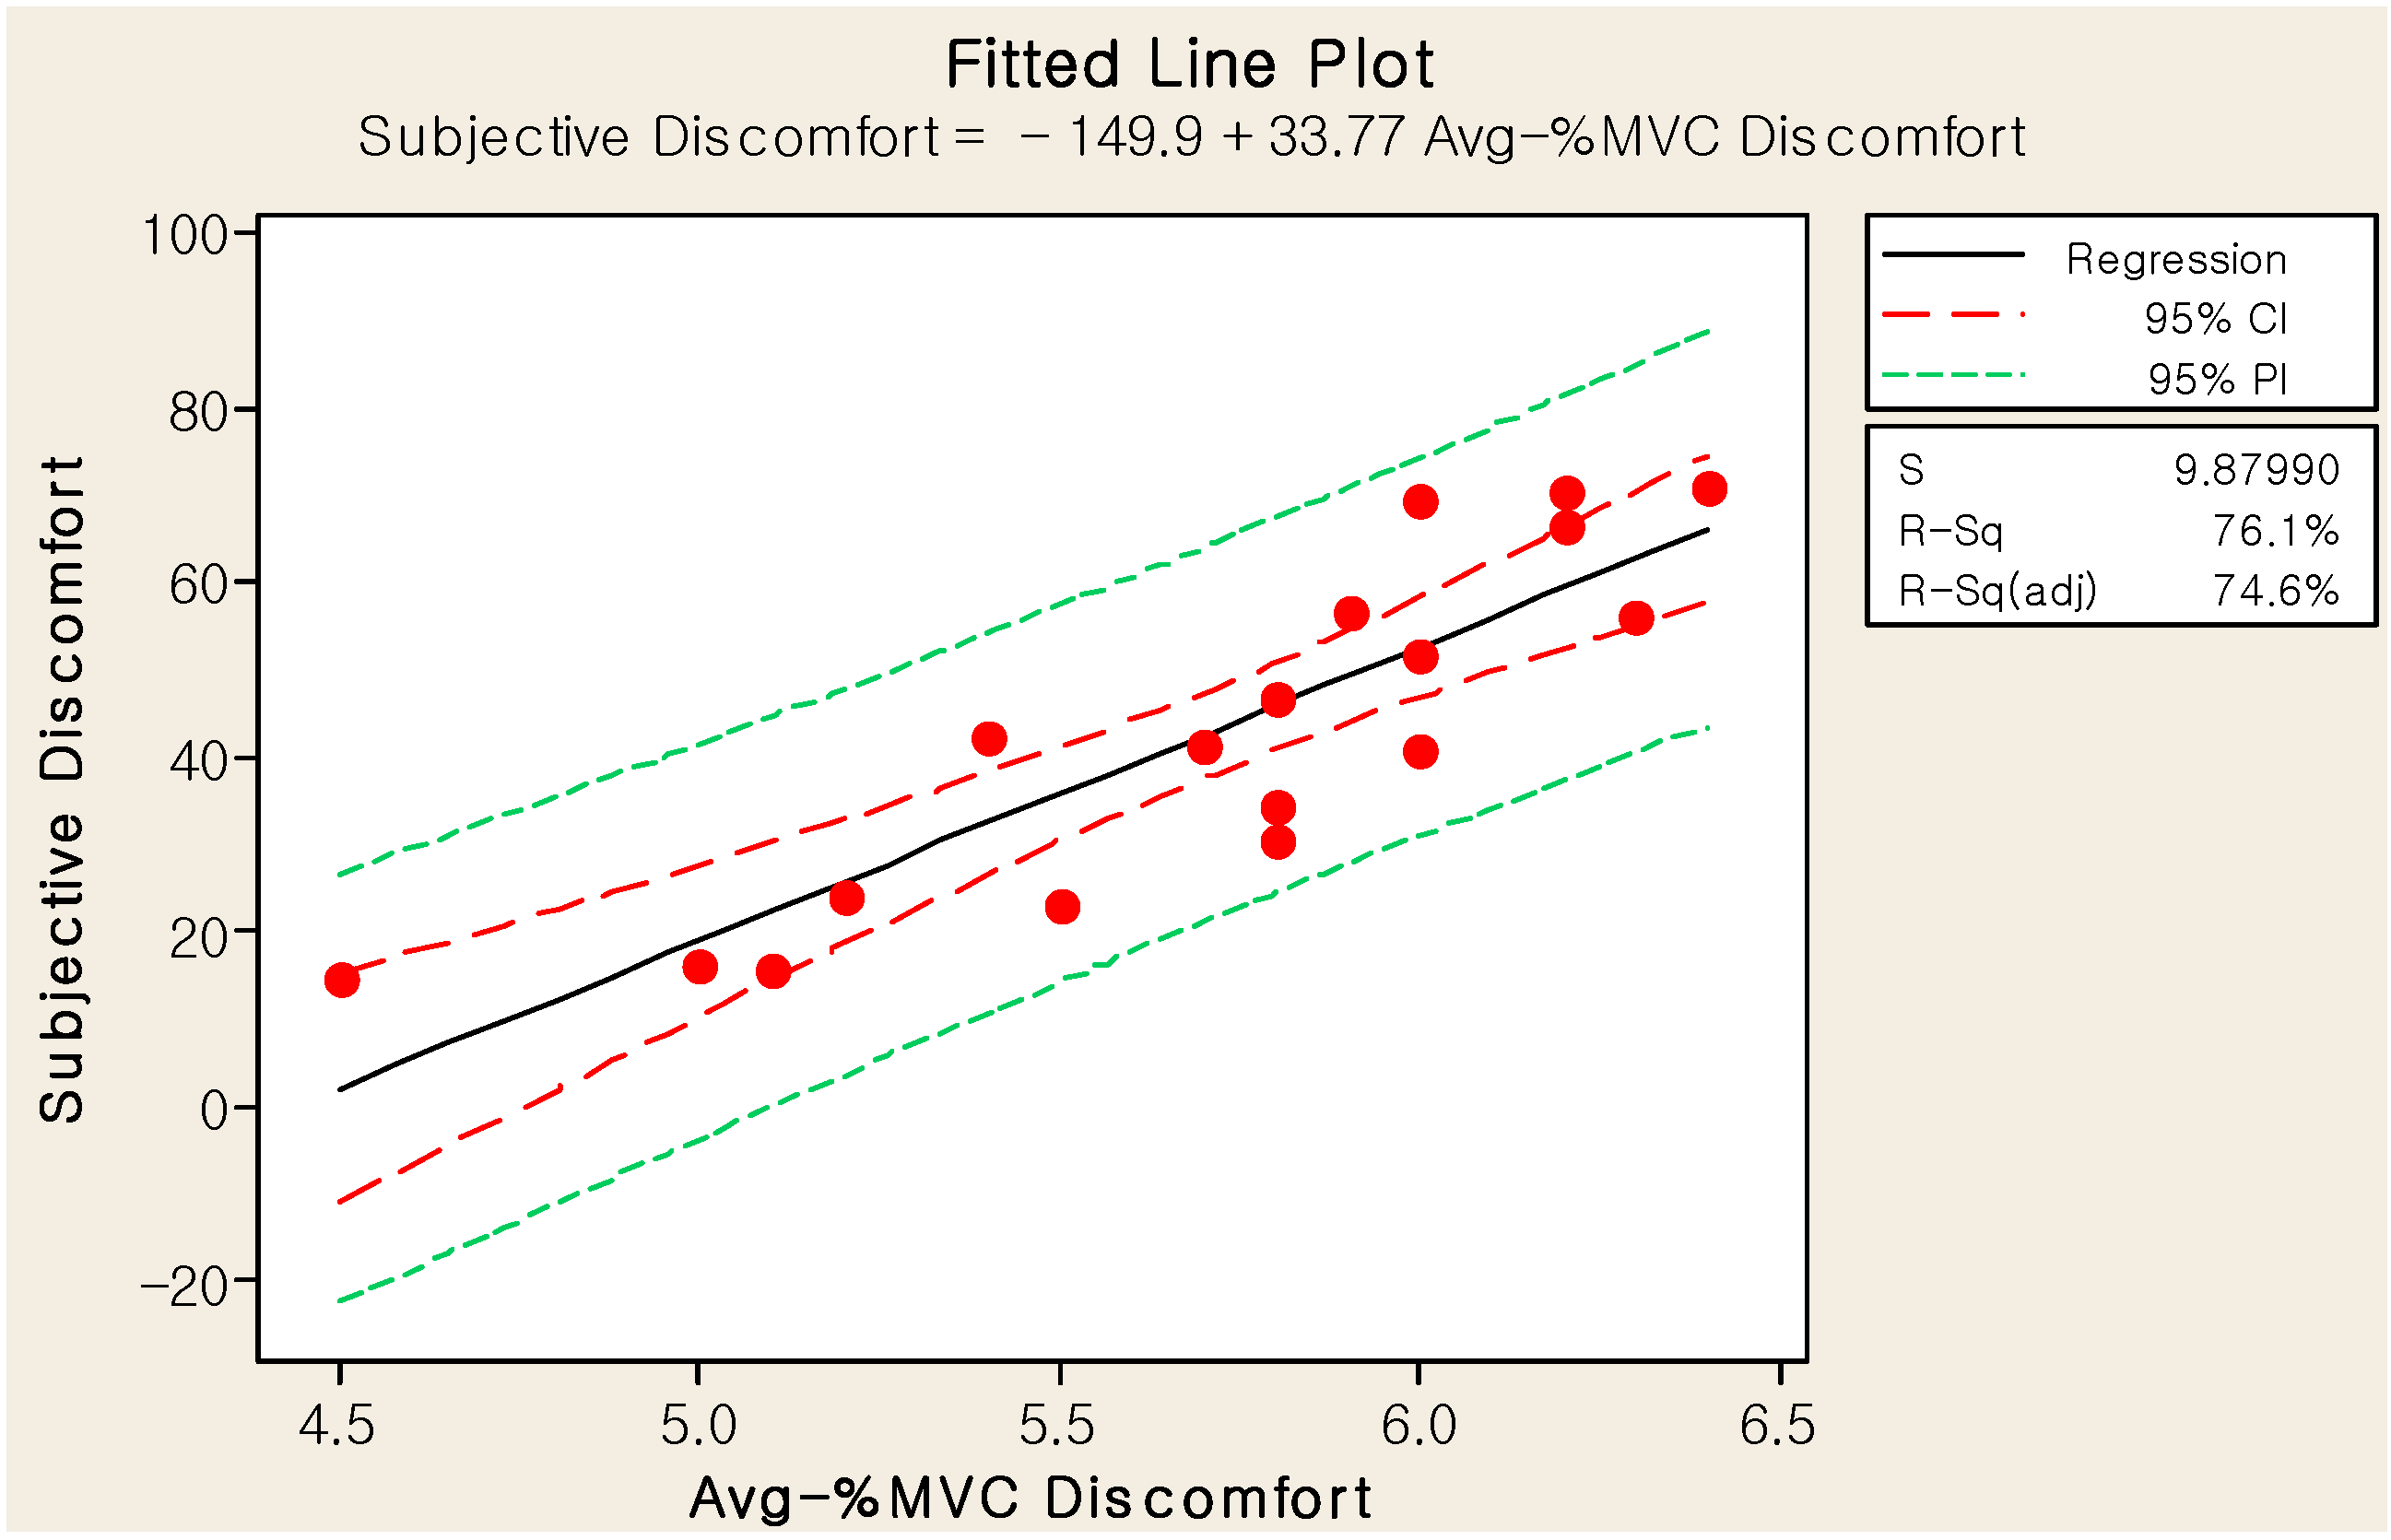
6.1. Regression Analyses of the Subjective and Objective Discomfort Values

6.2. Comparison of the Subjective and Objective Discomforts
6.3. Limitations of the Proposed Method
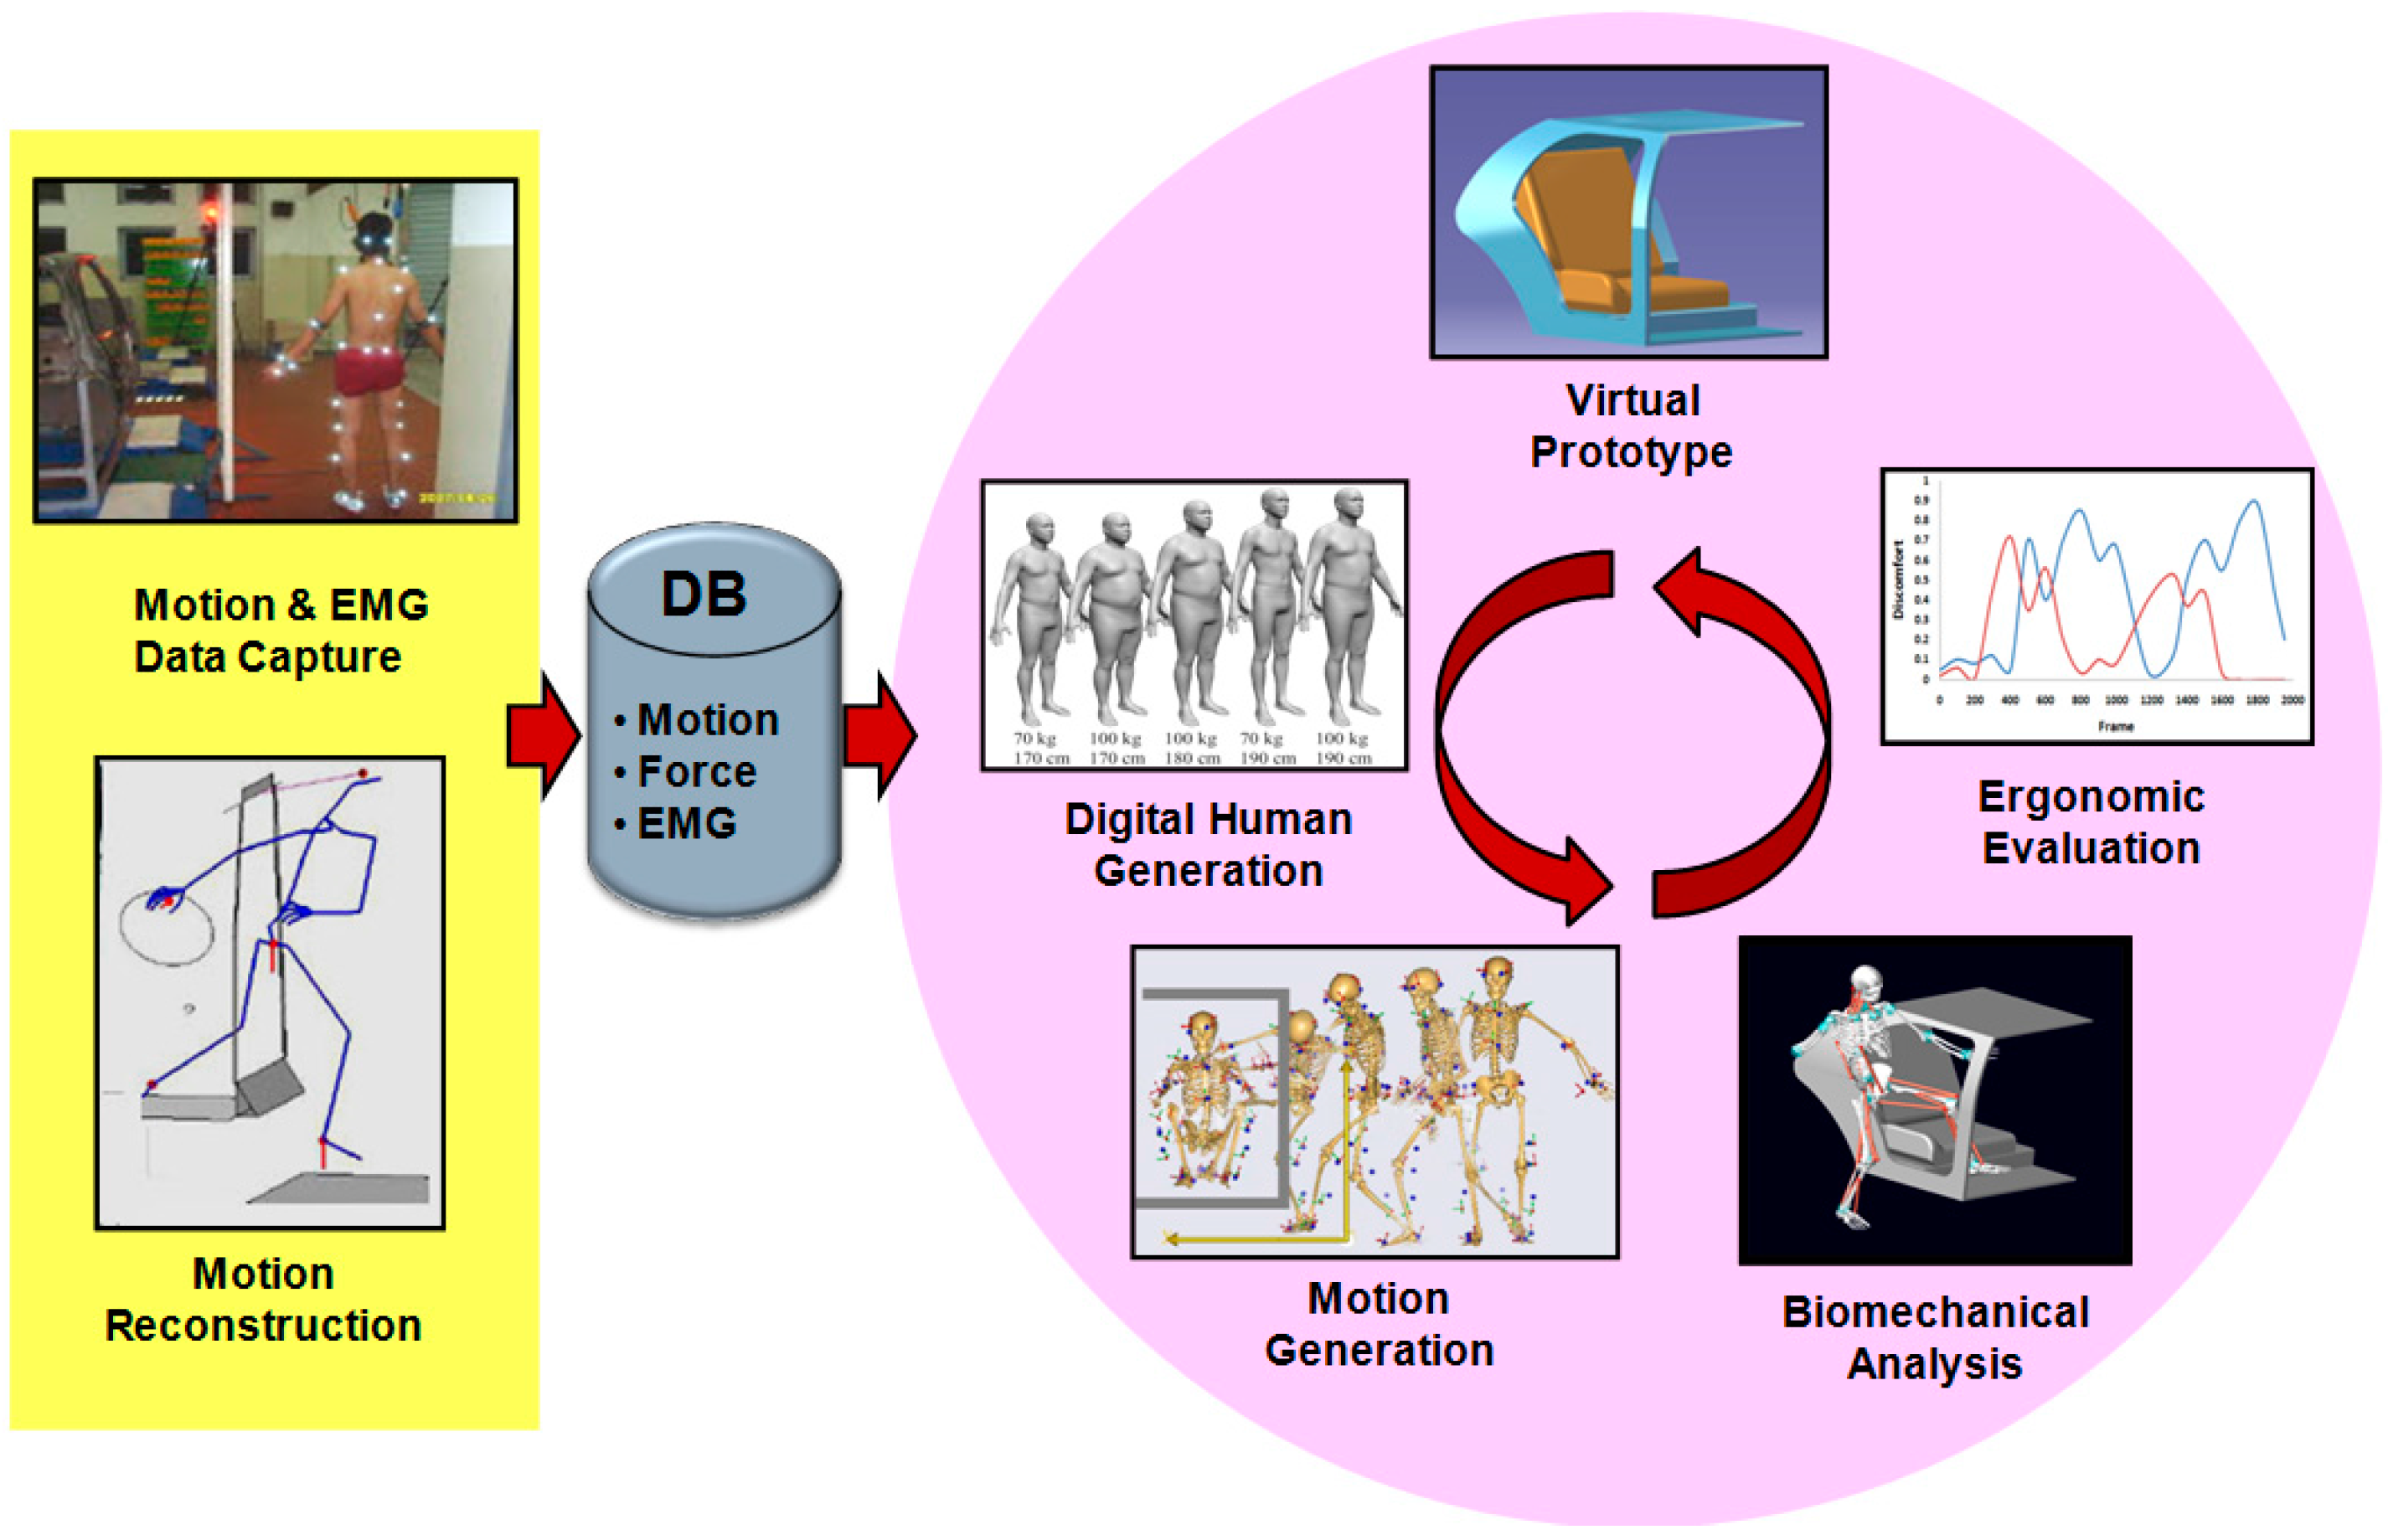
6.4. Virtual Product Development Process

7. Conclusions
Acknowledgments
Author Contributions
Conflicts of Interest
References
- Gavan, G.; Strassel, D.; Johnson, D. The Development of Improved Ingress/Egress Systems for Large Haulage Trucks; SAE Technical Paper 800680; SAE International: Troy, MI, USA, 1980. [Google Scholar]
- Lin, L.-J.; Cohen, H.H. Accidents in the trucking industry. J. Ind. Ergon. 1997, 20, 287–300. [Google Scholar] [CrossRef]
- Paschke, J.; von Mayenburg, M.; Novoa, L.A.; Good, D.; Blakewood, C.H.; Hurayt, M.S. Retractable Stairway for Entering and Exiting a Vehicle. U.S. Patent 6,179,312, 30 January 2001. [Google Scholar]
- Reed, M.P. Simulating crew ingress and egress for ground vehicles. In Proceedings of the 2009 Ground Vehicle Systems Engineering and Technology Symposium, Troy, MI, USA, 18–20 August 2009.
- Chateauroux, E.; Wang, X. Car egress analysis of younger and older drivers for motion simulation. Appl. Ergon. 2010, 42, 169–177. [Google Scholar] [CrossRef] [PubMed]
- Wang, X. Discomfort evaluation and motion measurement. In Handbook of Digital Human Modeling: Research for Applied Ergonomics and Human Factors; Duffy, V.G., Ed.; CRC Press: Boca Raton, FL, USA, 2008; pp. 25-1–25-8. [Google Scholar]
- Namamoto, K.; Atsumi, B.; Kodera, H.; Kanamori, H. Quantitative analysis of muscle stress during ingress/egress of the vehicle. JSAE Rev. 2003, 6, 335–339. [Google Scholar] [CrossRef]
- Dufour, F.; Wang, X. Discomfort Assessment of Car Ingress/Egress Motions Using the Concept of Neutral Movement; SAE Technical Paper 2005-01-2706; SAE International: Troy, MI, USA, 2005. [Google Scholar]
- Causse, J.; Chateauroux, E.; Monnier, G.; Wang, X.; Denninger, L. Dynamic analysis of car ingress/egress movement: an experimental protocol and preliminary results. SAE Int. J. Passeng. Cars Mech. Syst. 2009, 2, 1633–1640. [Google Scholar] [CrossRef]
- Monnier, G.; Chateauroux, E.; Wang, X.; Roybin, C. Inverse dynamic reconstruction of truck cabin ingress/egress motions. SAE Int. J. Passeng. Cars Mech. Syst. 2009, 2, 1593–1599. [Google Scholar] [CrossRef]
- Debril, J.F.; ait El Menceur, M.O. Articular Efforts Developed by a Disabled Subject during the Automobile Vehicle Accessibility Movement—A Discomfort Index; SAE Technical Paper 2007-01-2462; SAE International: Troy, MI, USA, 2007. [Google Scholar]
- Choi, W.; Choi, H.; Sah, S.; Lee, S. Biomechanical Discomfort Factors in Egress of Older Drivers; SAE Technical Paper 2009-01-2283; SAE International: Troy, MI, USA, 2009. [Google Scholar]
- Zacher, I.; Bubb, H. Strength Based Discomfort Model of Posture and Movement; SAE Technical Paper 2004-01-2139; SAE International: Troy, MI, USA, 2004. [Google Scholar]
- Rasmussen, J.; Christensen, S. Musculoskeletal Modeling of Egress with the Anybody Modeling System; SAE Technical Paper 2005-01-2721; SAE International: Troy, MI, USA, 2005. [Google Scholar]
- Kee, D.; Karwowski, W. Ranking systems for evaluation of joint and joint motion stressfulness based on perceived discomforts. Appl. Ergon. 2003, 34, 67–176. [Google Scholar] [CrossRef]
- Anderson, D.E.; Madigan, M.L.; Nassbaum, M.A. Maximum voluntary joint torque as a function of joint angle and angular velocity: Model development and application to the lower limb. J. Biomech. 2007, 3, 3105–3113. [Google Scholar] [CrossRef] [PubMed]
- Kim, S.H.; Lee, K. Development of discomfort evaluation method for car ingress motion. Int. J. Automot. Technol. 2009, 10, 619–627. [Google Scholar] [CrossRef]
- LifeModeler—Bringing Simulation to Life. Available online: http://www.lifemodeler.com (accessed on 8 June 2015).
- Vicon. MX Series. Available online: http://www.vicon.com/ (accessed on 8 June 2015).
- Advanced Mechanical Technology Inc. (AMTI). OR6-7 Force Platform. Available online: http://www.amti.uk.com/products/or6-7-force-platform.php (accessed on 8 June 2015).
- Delsys. Trigno Wireless EMG. Available online: http://www.delsys.com/products/wireless-emg/ (accessed on 8 June 2015).
- LifModeler Manual. Contact Force Parameters. Available online: http://www.lifemodeler.com/LM_Manual/A_parameters.shtml#j3 (accessed on 8 June 2015).
- Cecil, J.; Kanchanapiboon, A. Virtual engineering approaches in product and process design. Int. J. Adv. Manuf. Technol. 2007, 31, 846–856. [Google Scholar] [CrossRef]
- Huizinga, F.T.M.J.M.; van Ostaijen, R.A.A.; van Oosten Slingeland, A. A practical approach to virtual testing in automotive engineering. J. Eng. Des. 2010, 13, 33–47. [Google Scholar] [CrossRef]
- Tran, T.A.; Park, J.Y. Development of integrated design methodology for various types of product-service systems. J. Comput. Des. Eng. 2014, 1, 37–47. [Google Scholar] [CrossRef]
© 2015 by the authors; licensee MDPI, Basel, Switzerland. This article is an open access article distributed under the terms and conditions of the Creative Commons Attribution license (http://creativecommons.org/licenses/by/4.0/).
Share and Cite
Choi, N.-C.; Lee, S.H. Discomfort Evaluation of Truck Ingress/Egress Motions Based on Biomechanical Analysis. Sensors 2015, 15, 13568-13590. https://doi.org/10.3390/s150613568
Choi N-C, Lee SH. Discomfort Evaluation of Truck Ingress/Egress Motions Based on Biomechanical Analysis. Sensors. 2015; 15(6):13568-13590. https://doi.org/10.3390/s150613568
Chicago/Turabian StyleChoi, Nam-Chul, and Sang Hun Lee. 2015. "Discomfort Evaluation of Truck Ingress/Egress Motions Based on Biomechanical Analysis" Sensors 15, no. 6: 13568-13590. https://doi.org/10.3390/s150613568