Article

Investigation of Two Novel Approaches for Detection of Sulfate Ion and Methane Dissolved in Sediment Pore Water Using Raman Spectroscopy

1
Optics and Optoelectronics Laboratory, Ocean University of China, Qingdao 266100, China
2
Key Lab of Marine Geology and Environment, Institute of Oceanology, Chinese Academy of Sciences, Qingdao 266071, China
*
Author to whom correspondence should be addressed.
Sensors 2015, 15(6), 12377-12388; https://doi.org/10.3390/s150612377
Submission received: 7 March 2015 / Accepted: 12 May 2015 / Published: 26 May 2015
(This article belongs to the Special Issue Chemical Sensors based on In Situ Spectroscopy)

Abstract

:
The levels of dissolved sulfate and methane are crucial indicators in the geochemical analysis of pore water. Compositional analysis of pore water samples obtained from sea trials was conducted using Raman spectroscopy. It was found that the concentration of SO42− in pore water samples decreases as the depth increases, while the expected Raman signal of methane has not been observed. A possible reason for this is that the methane escaped after sampling and the remaining concentration of methane is too low to be detected. To find more effective ways to analyze the composition of pore water, two novel approaches are proposed. One is based on Liquid Core Optical Fiber (LCOF) for detection of SO42−. The other one is an enrichment process for the detection of CH4. With the aid of LCOF, the Raman signal of SO42− is found to be enhanced over 10 times compared to that obtained by a conventional Raman setup. The enrichment process is also found to be effective in the investigation to the prepared sample of methane dissolved in water. By CCl4 extraction, methane at a concentration below 1.14 mmol/L has been detected by conventional Raman spectroscopy. All the obtained results suggest that the approach proposed in this paper has great potential to be developed as a sensor for SO42− and CH4 detection in pore water.

1. Introduction

Seafloor sediments constitute some of the most extreme environments ever known [1,2], and are characterized by low temperatures, high pressures and little oxygen. Due to the oxic conditions that prevail in the world’s oceans, the dominant sulfur species in seawater is the sulfate ion (SO42−), which with a concentration of 29 mmol/L (2.71 g/kg) in seawater, the second most abundant anion [3], and it moves from the oceans to the sediments via various mechanisms. This makes marine sediments the main sink for seawater sulfate. Sulfate in marine sediments participates in the degradation of organic matter as a dominant electron acceptor until it is exhausted in the deeper subsurface sediment [4] where methanogenesis becomes the main terminal pathway of organic carbon mineralization [5]. Methane, as a stable end product of organic carbon mineralization, is produced exclusively by anaerobic archaea [6], and accumulates in subsurface sediments. Strong gradients in dissolved sulfate ion with depth are frequently observed, especially in the pore water that bathes gas hydrates. Methane slowly diffuses up to the sulfate zone, which is referred to as “sulfate-methane transition” (SMT), and reacts with sulfate in pore water. The coupled sulfate-methane reaction equation is CH4 + SO42− → HCO3 + H2S + H2O, and both the methane and sulfate are consumed to depletion. The sulfate concentration gradient in pore water can be taken as a universal indicator of depth to the sulfate-methane interface (SMI) [7], which is a fundamental biogeochemical redox boundary in methane-rich and methane-gas-hydrate-bearing marine sediments [8,9,10,11]. The anomaly of methane concentration is also regarded as evidence of the existence of natural gas hydrates [9].
Much of the geochemical knowledge sought does not come from the sediments themselves but from the pore waters that contain the signature of the reactions at work [12]. Geochemical studies in the deep ocean have traditionally relied upon sample recovery by bottles, cores, and dredges deployed from surface ships, or collected by manned submersibles and remotely operated vehicles (ROVs), to provide specimens for ship or shore based analysis [13]. Each year hundreds of ocean sediment cores are taken on purpose for geochemistry analysis [14]. However, it has been found that the methane concentrations differ greatly (up to 103) in conventionally recovered cores and pore water sampling with pressurized core recovery [15]. Thus an in situ technique for geochemistry analysis is highly desirable.
Commercial methane sensors have been developed and used for methane monitoring and underwater detection. METS, as an electrochemical sensor, has been widely used for the detection of methane [16,17]. HydroC (Contros GmbH, Kiel, Germany) is also a commercial methane sensor, which is based on direct IR absorption spectroscopy [18]. Due to the stipulation that the targets must be gaseous methane, a gas-permeable membrane is indispensable for the two methane sensors, which limits the underwater application of the sensors.
Raman spectroscopy is regarded as a powerful technique for the geochemical analysis of pore water. This is especially true in the study of the oceanic gas hydrates near the seafloor. However, although the challenges of carrying out in situ Raman spectroscopy detection are formidable [13], in recent years, Raman spectroscopy applications for in situ detection have become increasingly popular. While in most instances, the concentration of methane in sea water is too low to be detected for conventional Raman spectroscopy, technologies for improving the sensitivity of Raman spectroscopy have been developed to broaden its underwater applications. In this paper, investigations for the improvement of the limit of detection for sulfate ion and methane dissolved in pore water using Raman spectroscopy have been carried out. Samples have been prepared in the laboratory (sodium sulfate solutions and saturated aqueous solution of methane) and pore water samples have been squeezed from sediment cores as samples for analysis. The potential application of Raman spectroscopy technology, based on the approaches proposed in this paper for in situ detection of sulfate ion and methane dissolved in pore water, is also discussed in this paper.

2. Methods

2.1. The Principle of Raman Signal Enhancement

The intensity of a solute’s Raman signal in water can be described by Equation (1):
R = KIσPC
where R is the intensity of Raman signal, K is a coefficient that is determined by the spectra acquisition system, I is the excitation laser power, σ is the Raman cross-section of the samples under investigation, P is the effective optical path length, and C is the molecular density of the sample [19]. K, I and σ are determined by the experimental setup, while P can be improved in order to enhance the Raman signals of the samples. Due to the total internal reflection, the excitation laser is confined in the LCOF because of the total internal reflection, and the effective optical path length (P) is significantly enhanced [20]. Thus, a better sensitivity can be achieved for Raman spectroscopy.

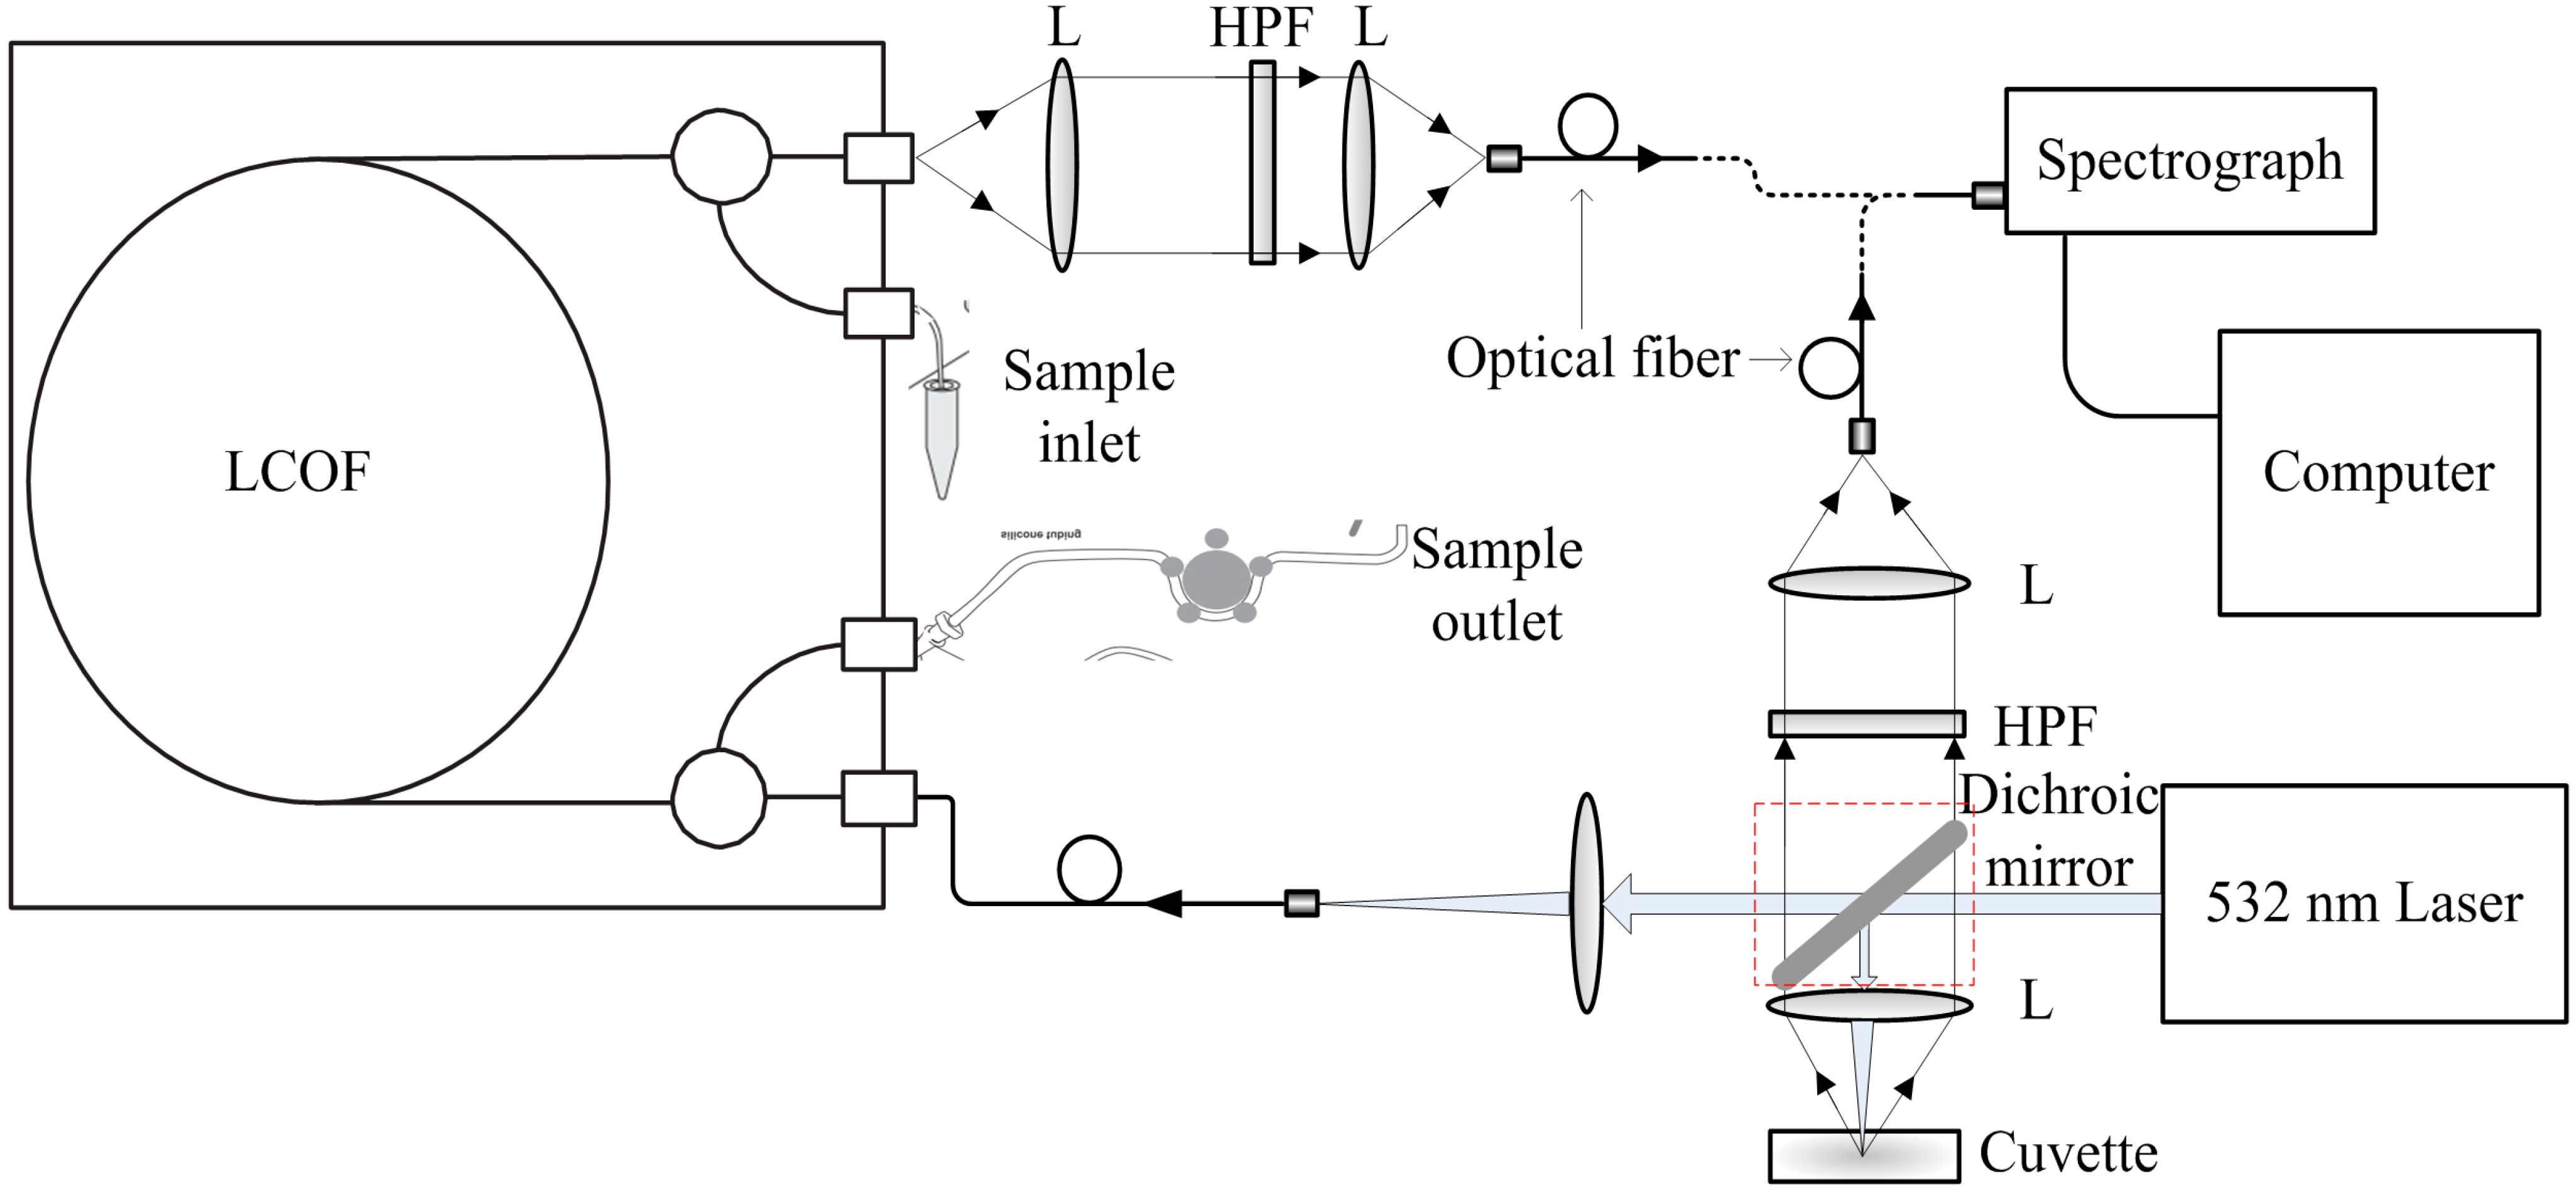
2.2. Instrumental Setup

A specific Raman spectroscopy setup with LCOF is established using commercially available components. The schematic diagram of experimental setup is presented in Figure 1. A diode-pumped, solid state laser that emits at 532 nm and outputs power at 300 mW is used as the light source (LMX-532S, from Oxxius, Lannion, France). The dichroic mirror in the dotted box is detachable in order to obtain Raman spectra of the samples using the conventional Raman spectroscopy experimental setup as well as the Raman experimental setup based on LCOF.

2.3. Sampling

The pore water samples were acquired in sea trials of “Science III”, a research vessel that belongs to the Chinese Academy of Sciences Institute of Oceanology. A 2 m length sediment core was taken from the seafloor at a depth of 53 m in North Yellow Sea basin (E 122°40′, N 38°46′), and cut into four pieces. The pore water samples were squeezed from different sediment pieces using an improved pore water sampler [21], and taken back to laboratory for Raman spectroscopy analysis.
In order to conduct quantitative analysis of SO42−, a series of Na2SO4 solutions are prepared in 250 mL volumetric flasks, with 2, 5, 10, 15, 20, 25, 30, 40, 50, and 60 mmol/L of SO42 respectively. The solutions are transferred into 5 mL cuvette for acquisition of Raman spectra in the conventional way when the dichroic mirror is placed in the optical path, and pumped into the LCOF for acquisition of Raman spectra when the dichroic mirror is removed from the optical path.
Figure 1. Schematic diagram of the LCOF-Raman experimental setup (R, dichroic mirror; L, optical lens; HPF, high pass filter).
Sensors 15 12377 g001
To prepare a saturated aqueous solution of CH4 under laboratory conditions (the concentration of methane in water is about 1.14 mmol/L), CH4 is pumped into deionized water (DI water) for 1 h. During the enrichment process, CCl4 is injected into the saturated aqueous solution of CH4 and stirred for 0.5 h. The solution is then left for 0.5 h so the water and CCl4 is separated in order to get the CCl4 solution after extraction. A magnetic stirring device (IKA-RCT basic model, IKA, Aachen, Germany) is employed to make the dissolution and extraction more efficient.

2.4. Spectra Acquisition

For each sample, 10 spectra are recorded and averaged for analysis. The background and the dark current are measured and automatically subtracted from each subsequent spectrum. The laser power is set at 0.3 W. All the spectra are processed in Origin 8.1.

3. Results and Discussion

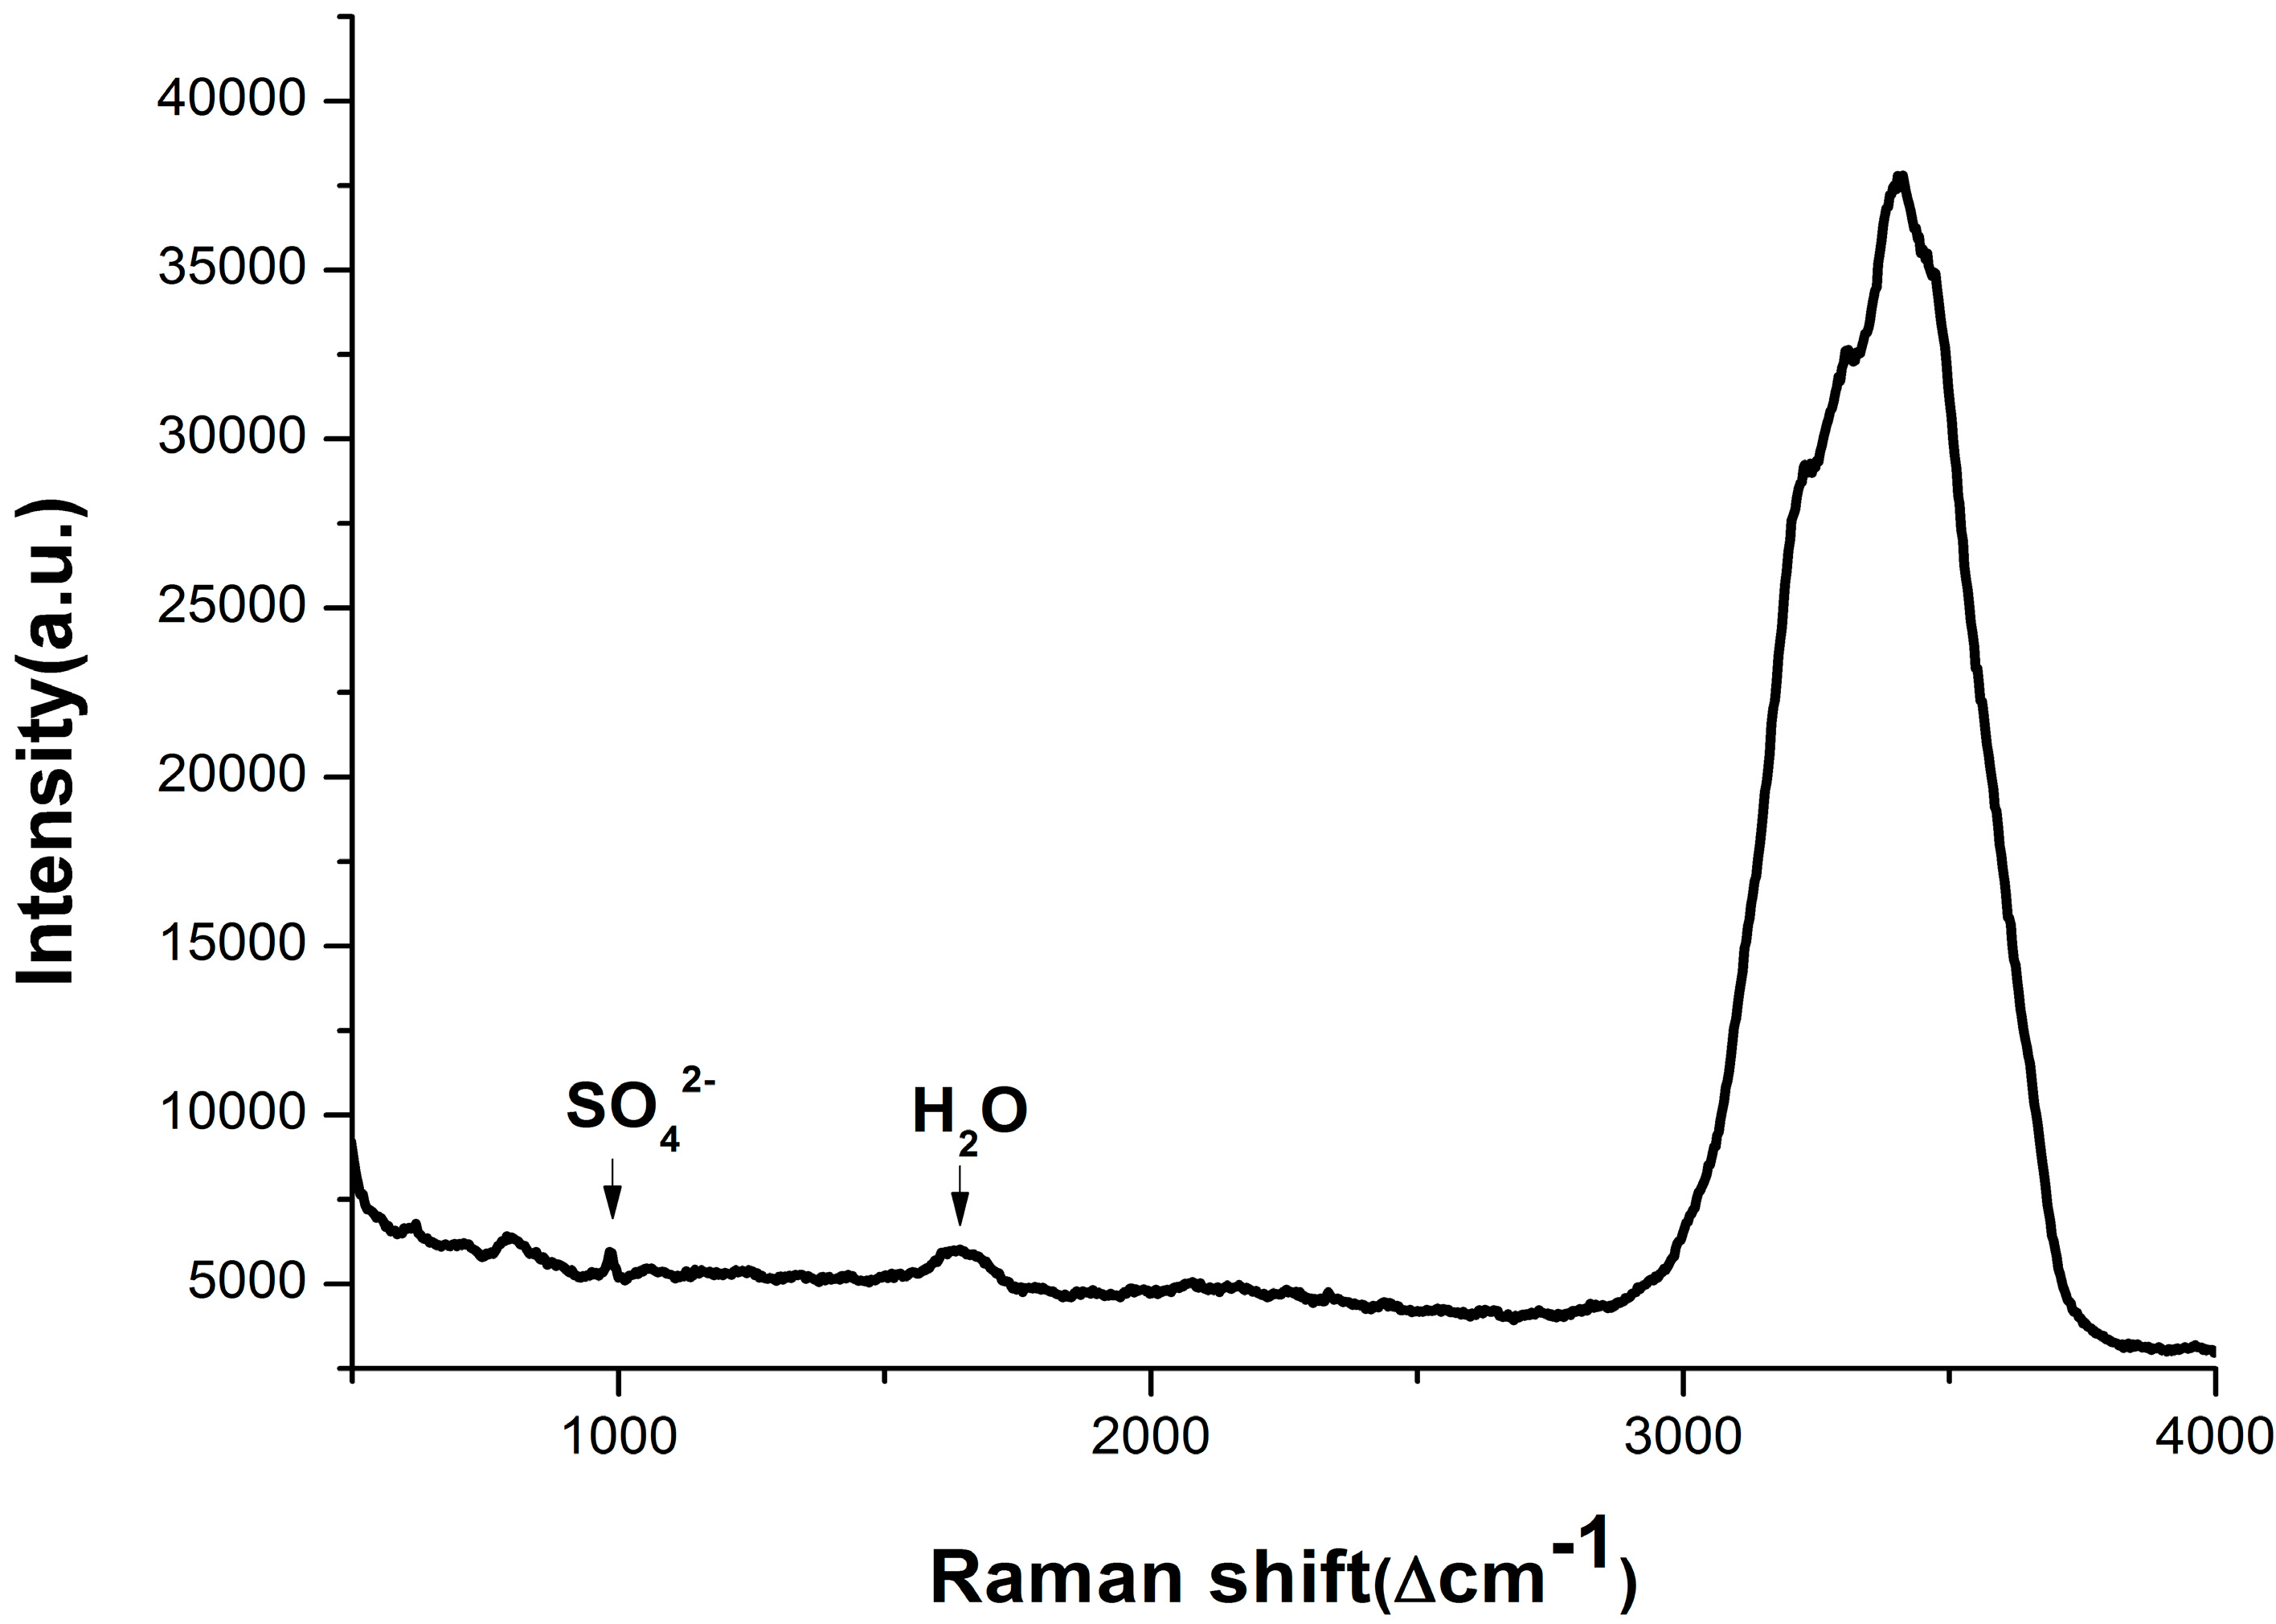
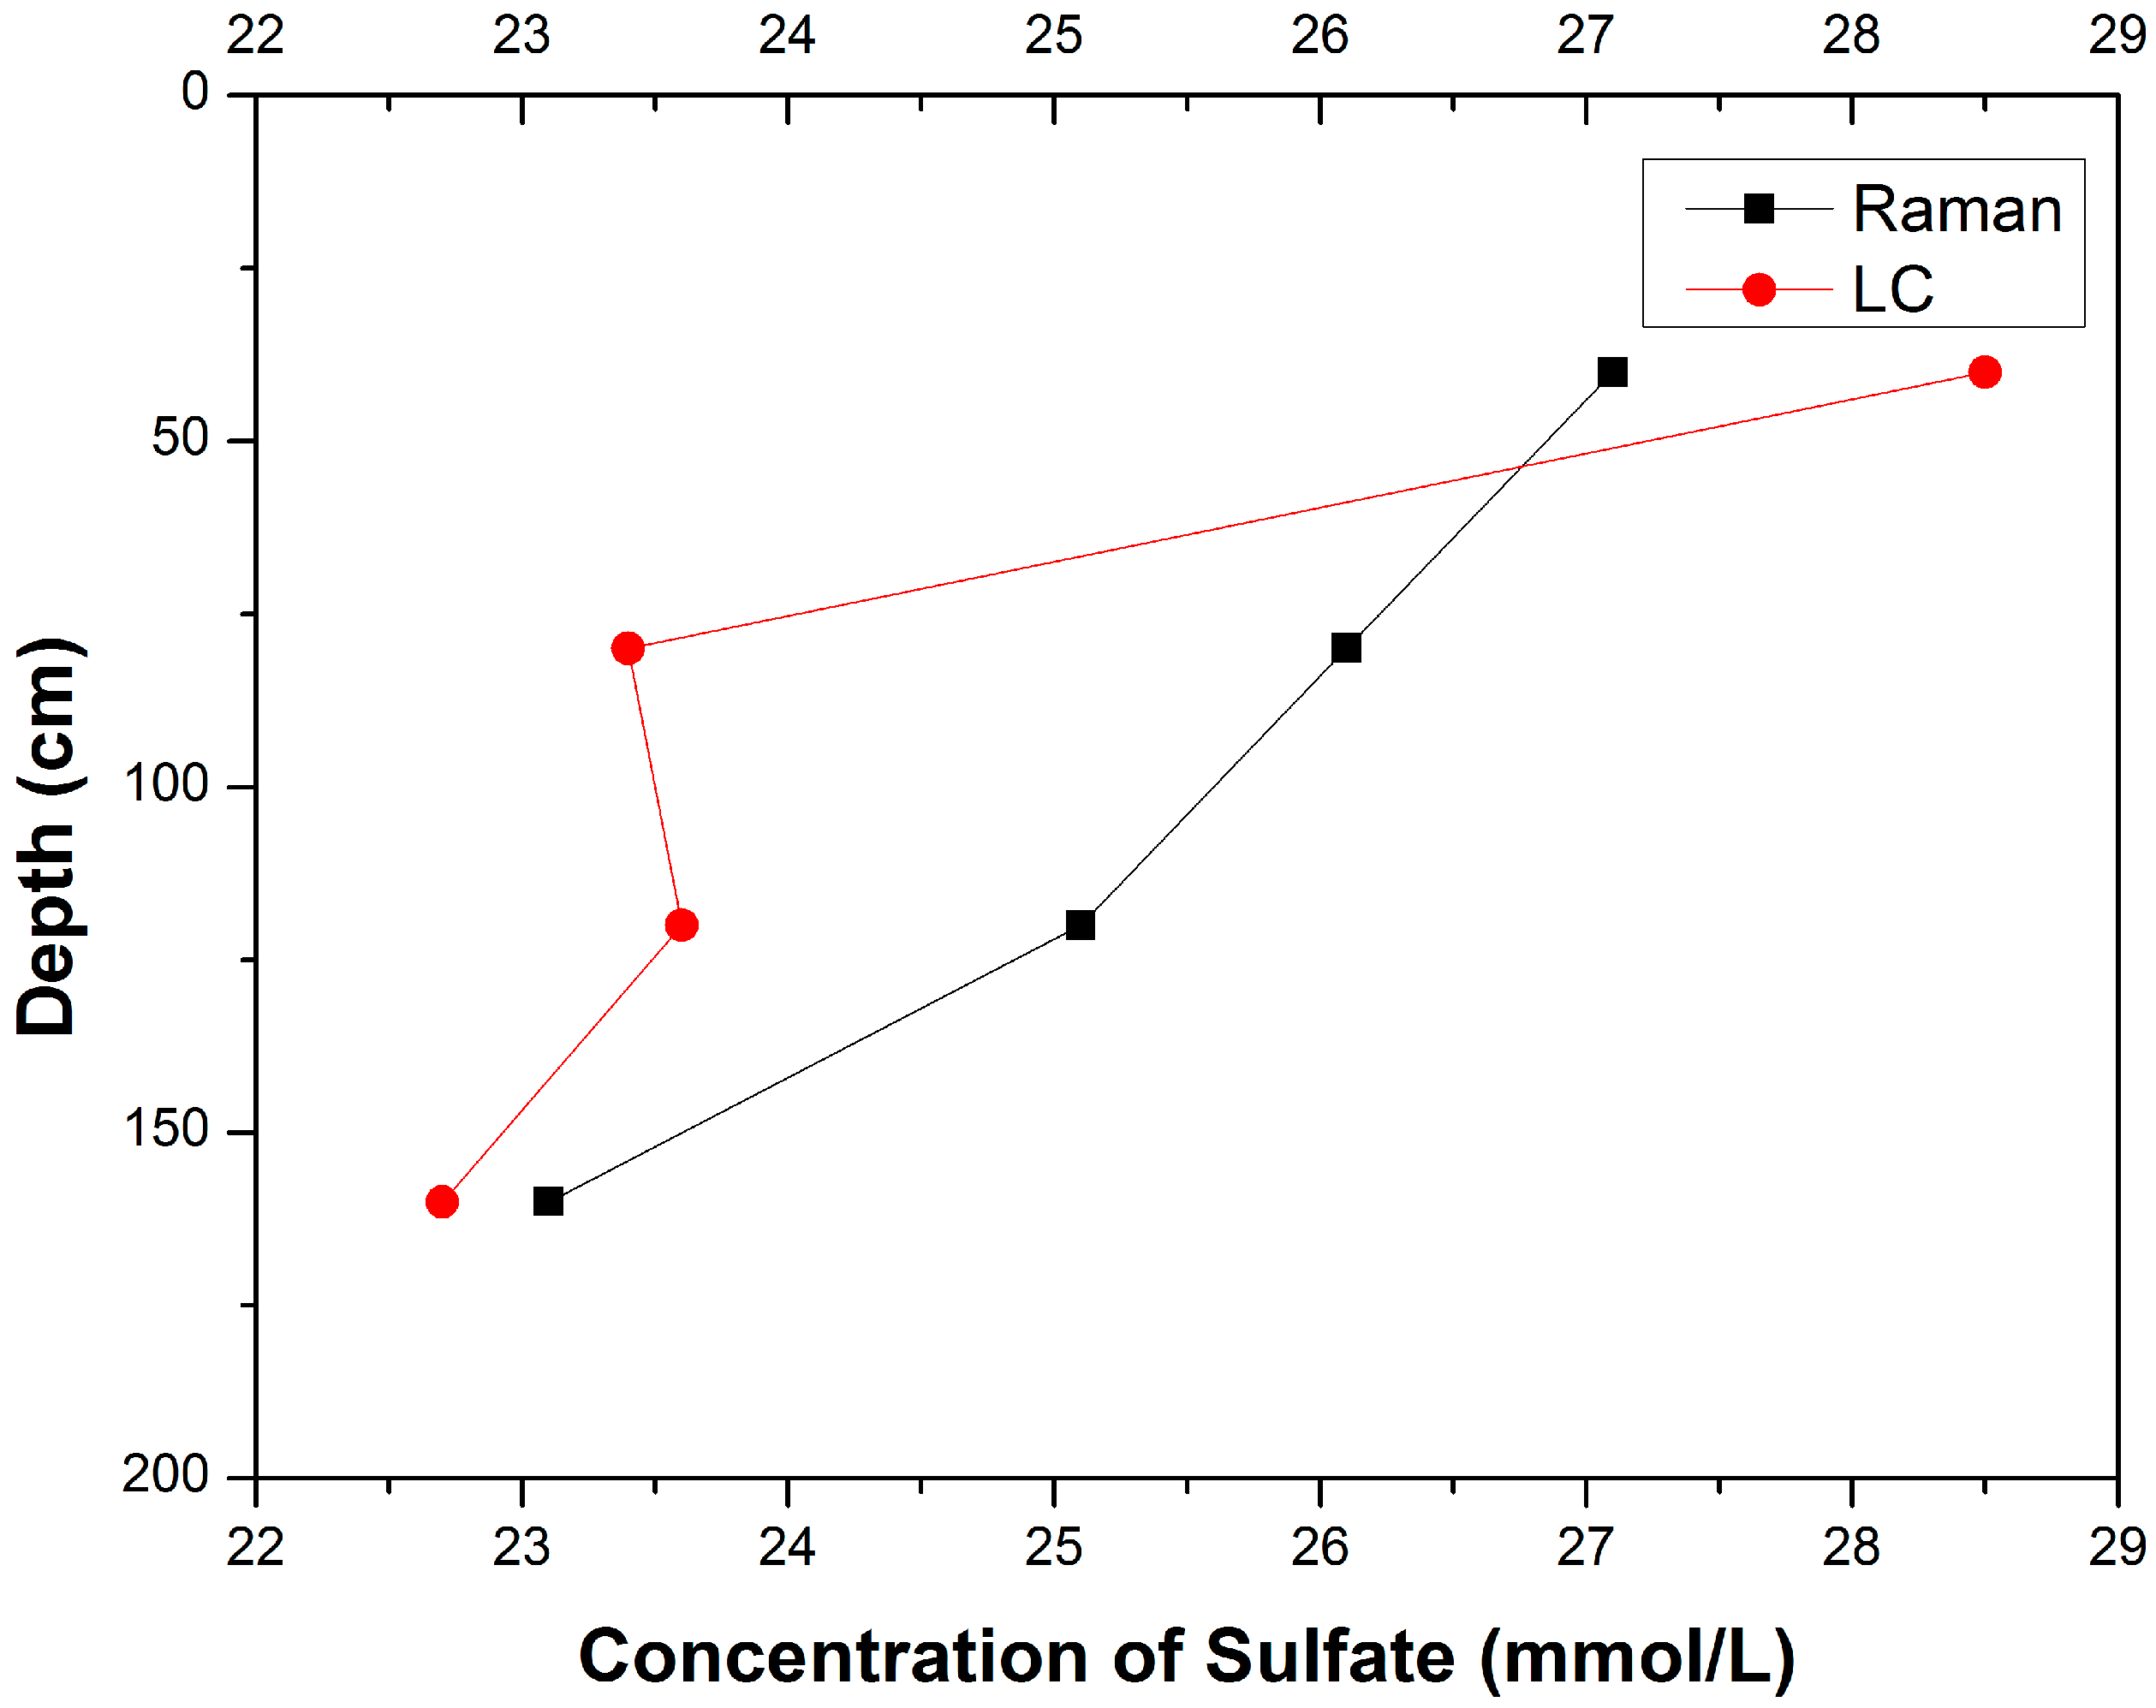
3.1. Composition Analysis of Pore Water Samples with Different Depth

A compact spectrometer (QE65000 Pro, from Ocean Optics, Dunedin, FL, USA) is used to acquire Raman spectra of pore water samples with an integration time of 1 s, and the original Raman spectrum of the pore water samples is shown in Figure 2. The results show that the Raman peak of SO42− at 981 cm−1 is obviously detected, while the expected Raman peak of methane at 2917 cm−1 cannot be detected. A possible reason for this s that the methane dissolved in pore water has escaped after sampling and the concentration of the remaining methane is too low to be detected.
Figure 2. Typical Raman spectrum of the pore water samples.
Sensors 15 12377 g002
The Raman spectra of the Na2SO4 solutions prepared in laboratory are acquired, and the internal standard normalization method is used in data processing. The Raman peak of SO42 (located at 981 cm−1) is normalized with the Raman peak of water molecular (located at 1640 cm−1) in this paper. The calibration curve is shown in Figure 3, and the fitted linear function is R* = 0.012C + 0.534, where R* is the normalized Raman intensity of SO42−, C is the concentration of the SO42−.
Figure 3. The calibration curve of sulfate concentration with conventional Raman spectroscopy.
Sensors 15 12377 g003
Then the fitted linear function derived from the calibration curve, is used for quantitative analysis of the sulfate ion dissolved in pore water. According to the fitted linear function, concentrations of SO42− in pore water samples are obtained. The concentrations of SO42− in pore water are also measured by liquid chromatography. The results are demonstrated in Table 1, and the profiles of the SO42 concentrations in pore water is presented in Figure 4.
Table 1. Concentrations of SO42 in pore water samples measured by Raman spectroscopy and liquid chromatography.
SamplesSampling Depth (cm)Concentrations of SO42− (mmol/L)Relative Deviation │CRaman − CLC│/CLC
CRamanCLC
A-12-a20–6027.128.54.91%
B-12-a60–10026.123.411.54%
C-12-a100–14025.123.66.36%
D-12-a140–18023.122.71.76%
CRaman concentrations measured by Raman spectroscopy; CLC concentrations measured by liquid chromatography.
Figure 4. Profiles of SO42− concentrations in pore water measured by Raman spectroscopy and LC.
Sensors 15 12377 g004
It can be seen that there is no significant difference between the concentrations of SO42 measured by Raman spectroscopy and LC, and the minimum relative deviation can reach 1.76%. Figure 5 also shows that the concentration of SO42− in pore water decreases as the depth increases, which indicates the existence of sulfate reduction in sediments. Because of the sulfate-methane reaction, the sulfate could be exhausted in the deeper sediment [5]. Furthermore, the concentration of SO42− would be too low to be detected for Raman spectroscopy. Thus, an enhancement technology for Raman signal of SO42− is highly desired for geochemical analysis of pore water.

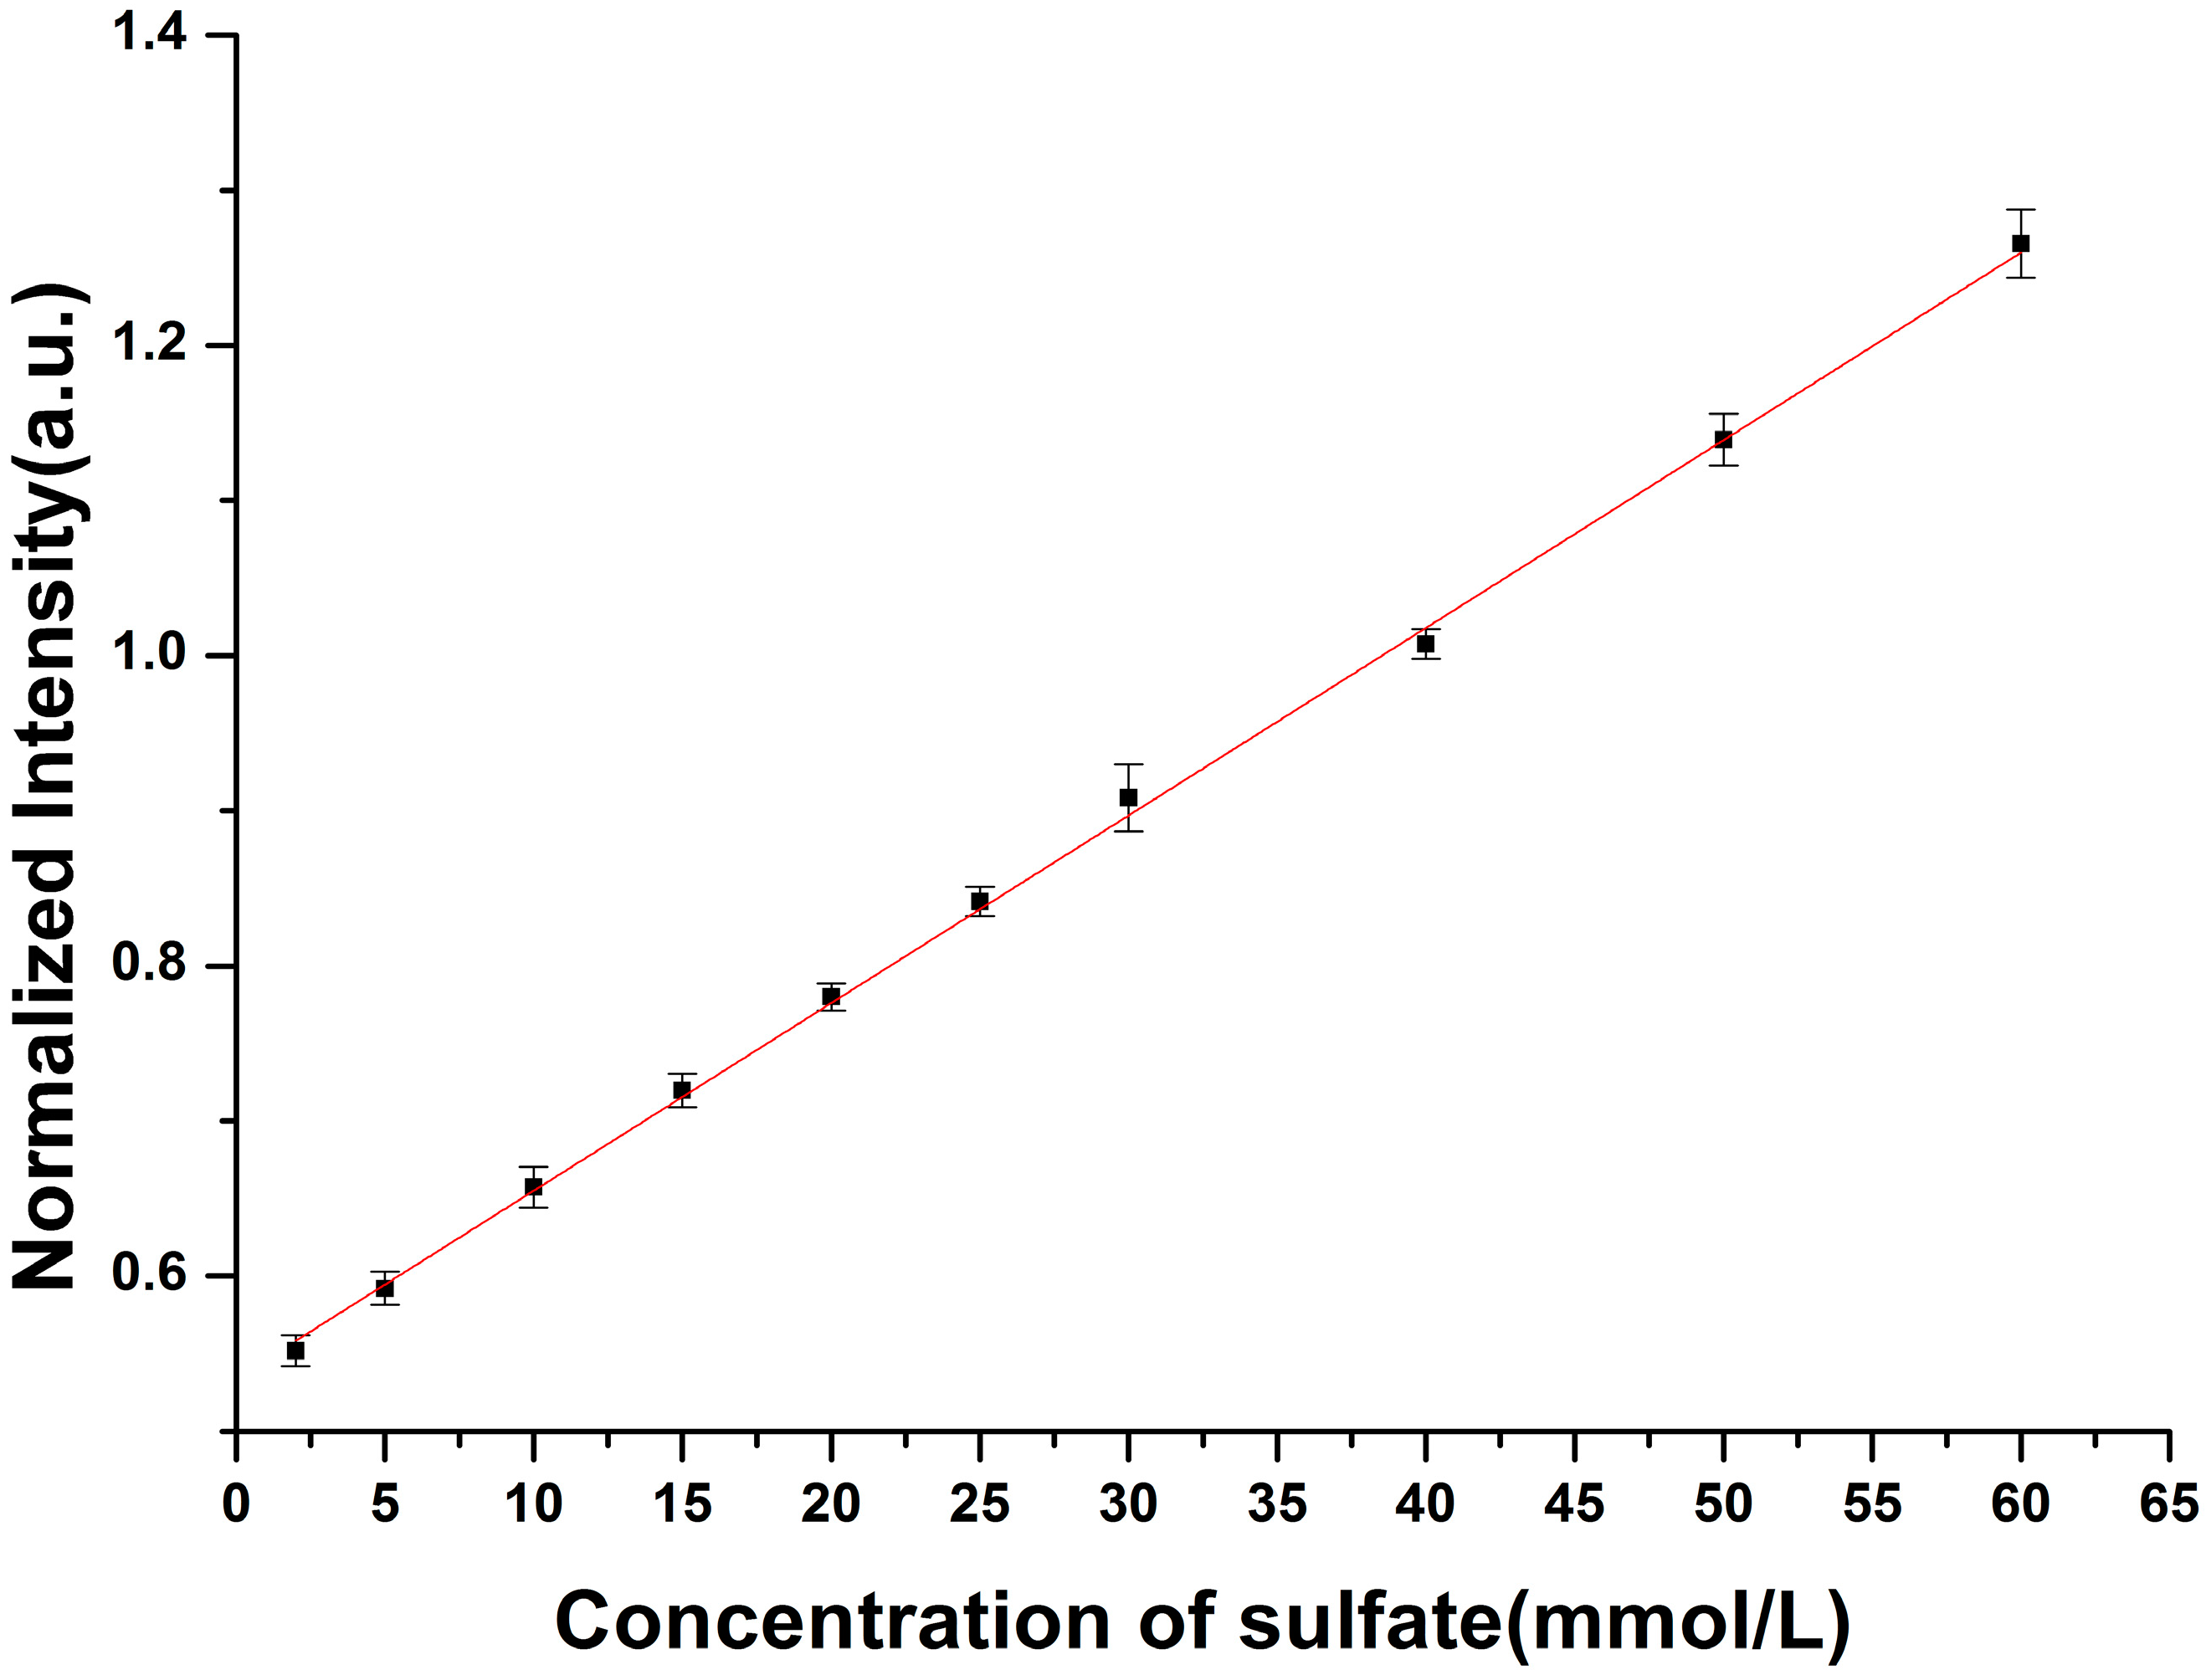
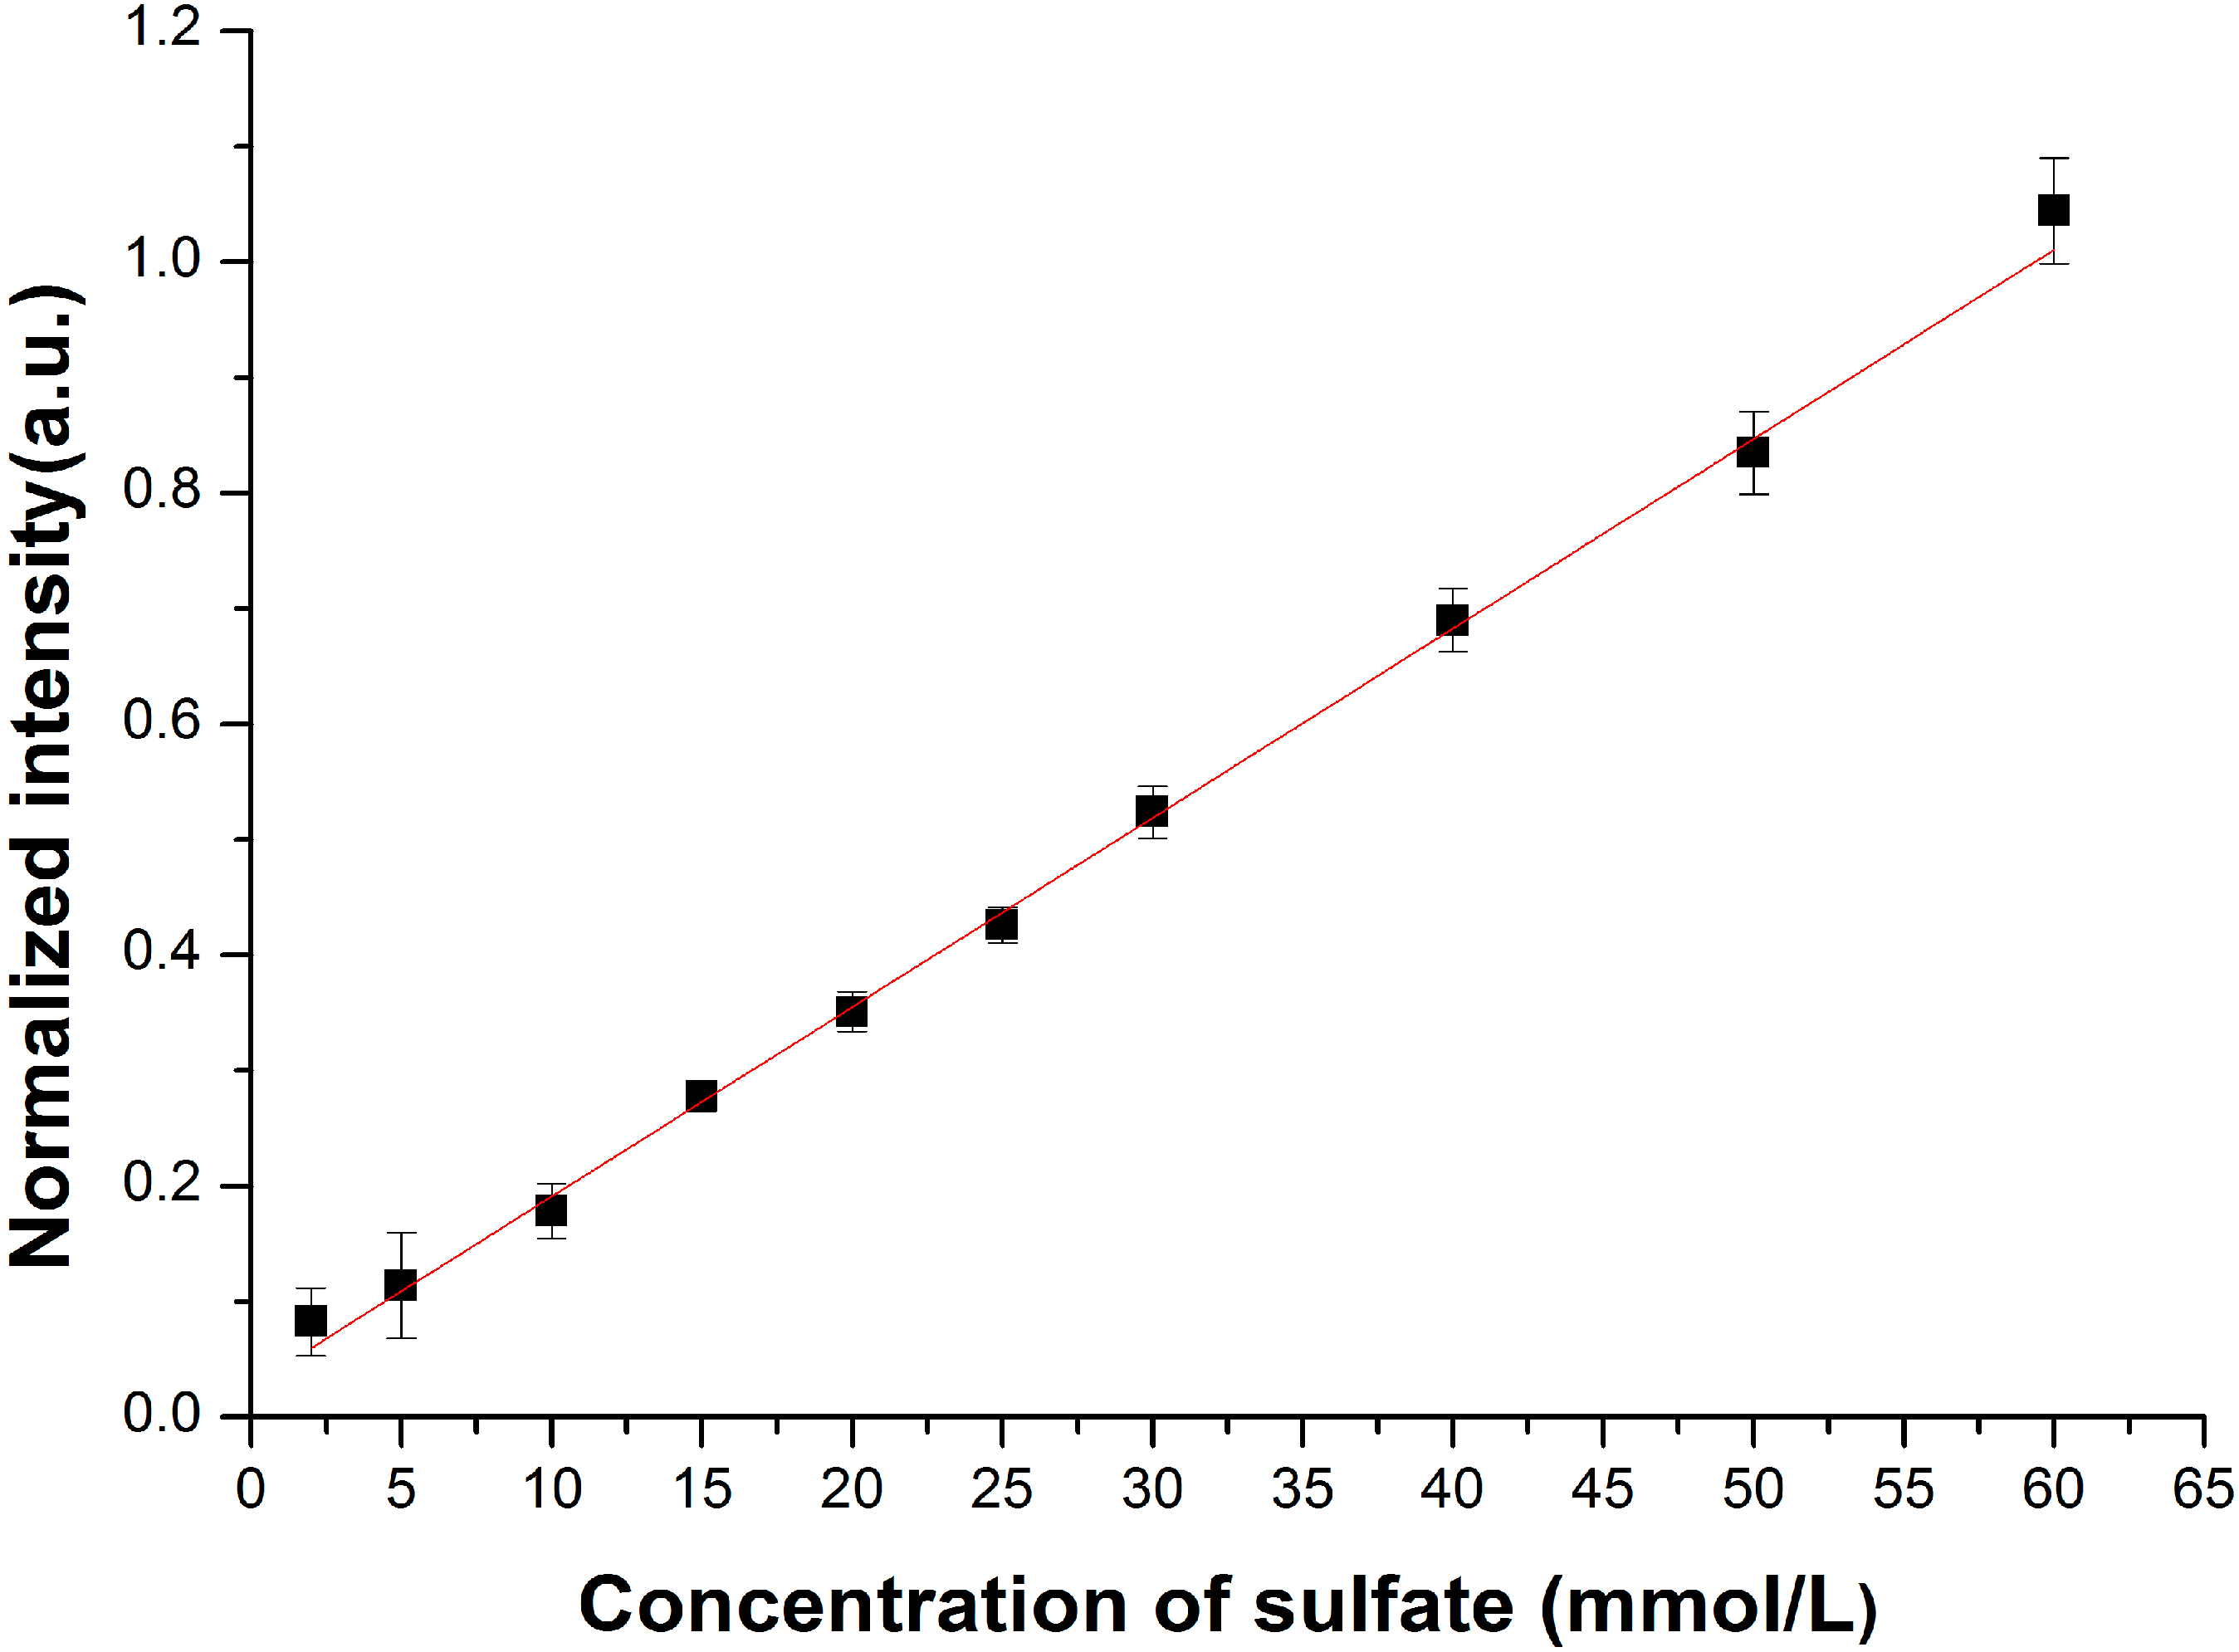
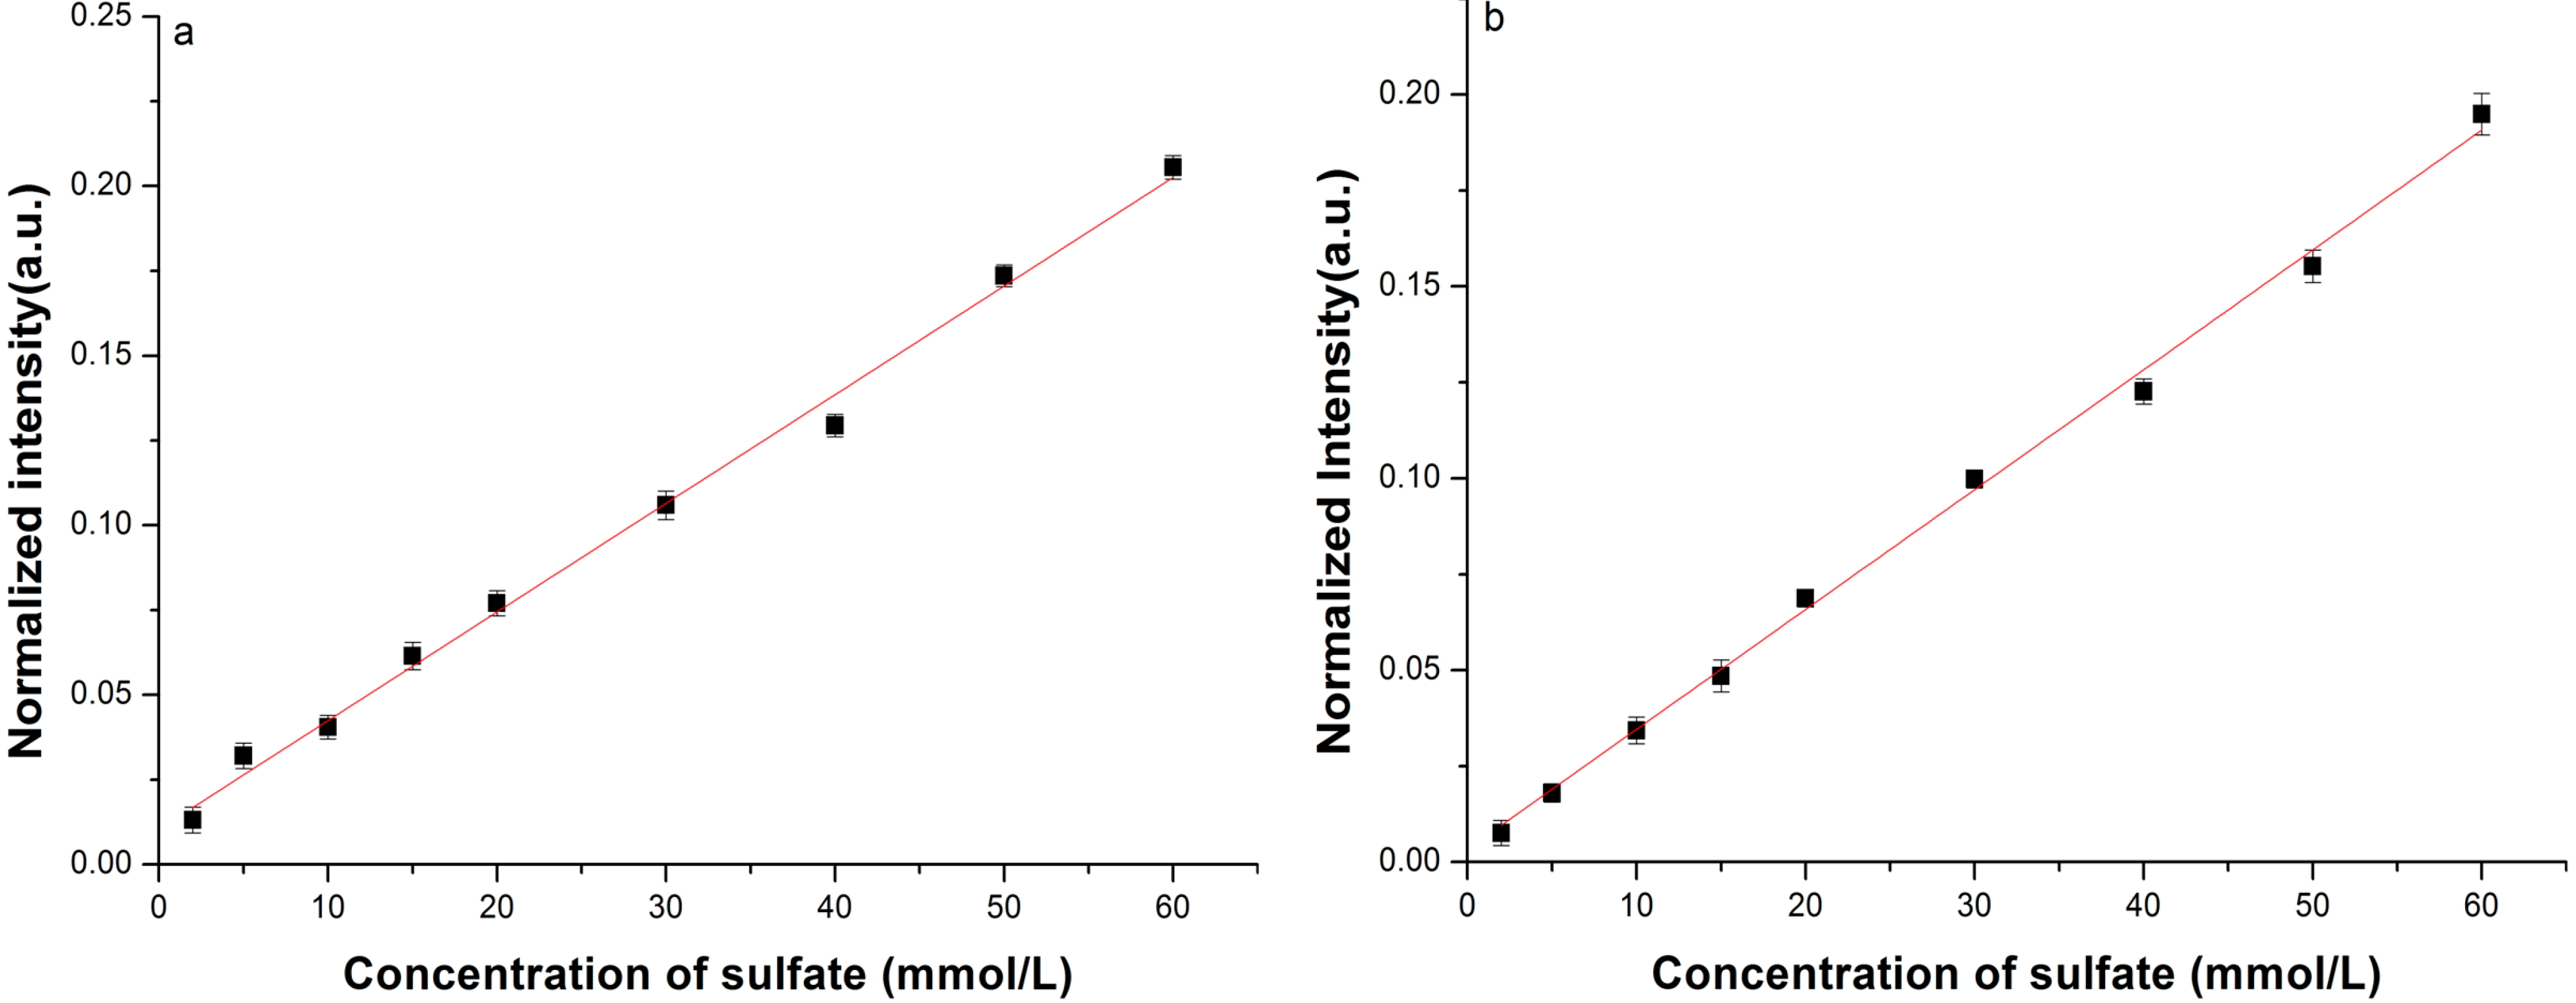
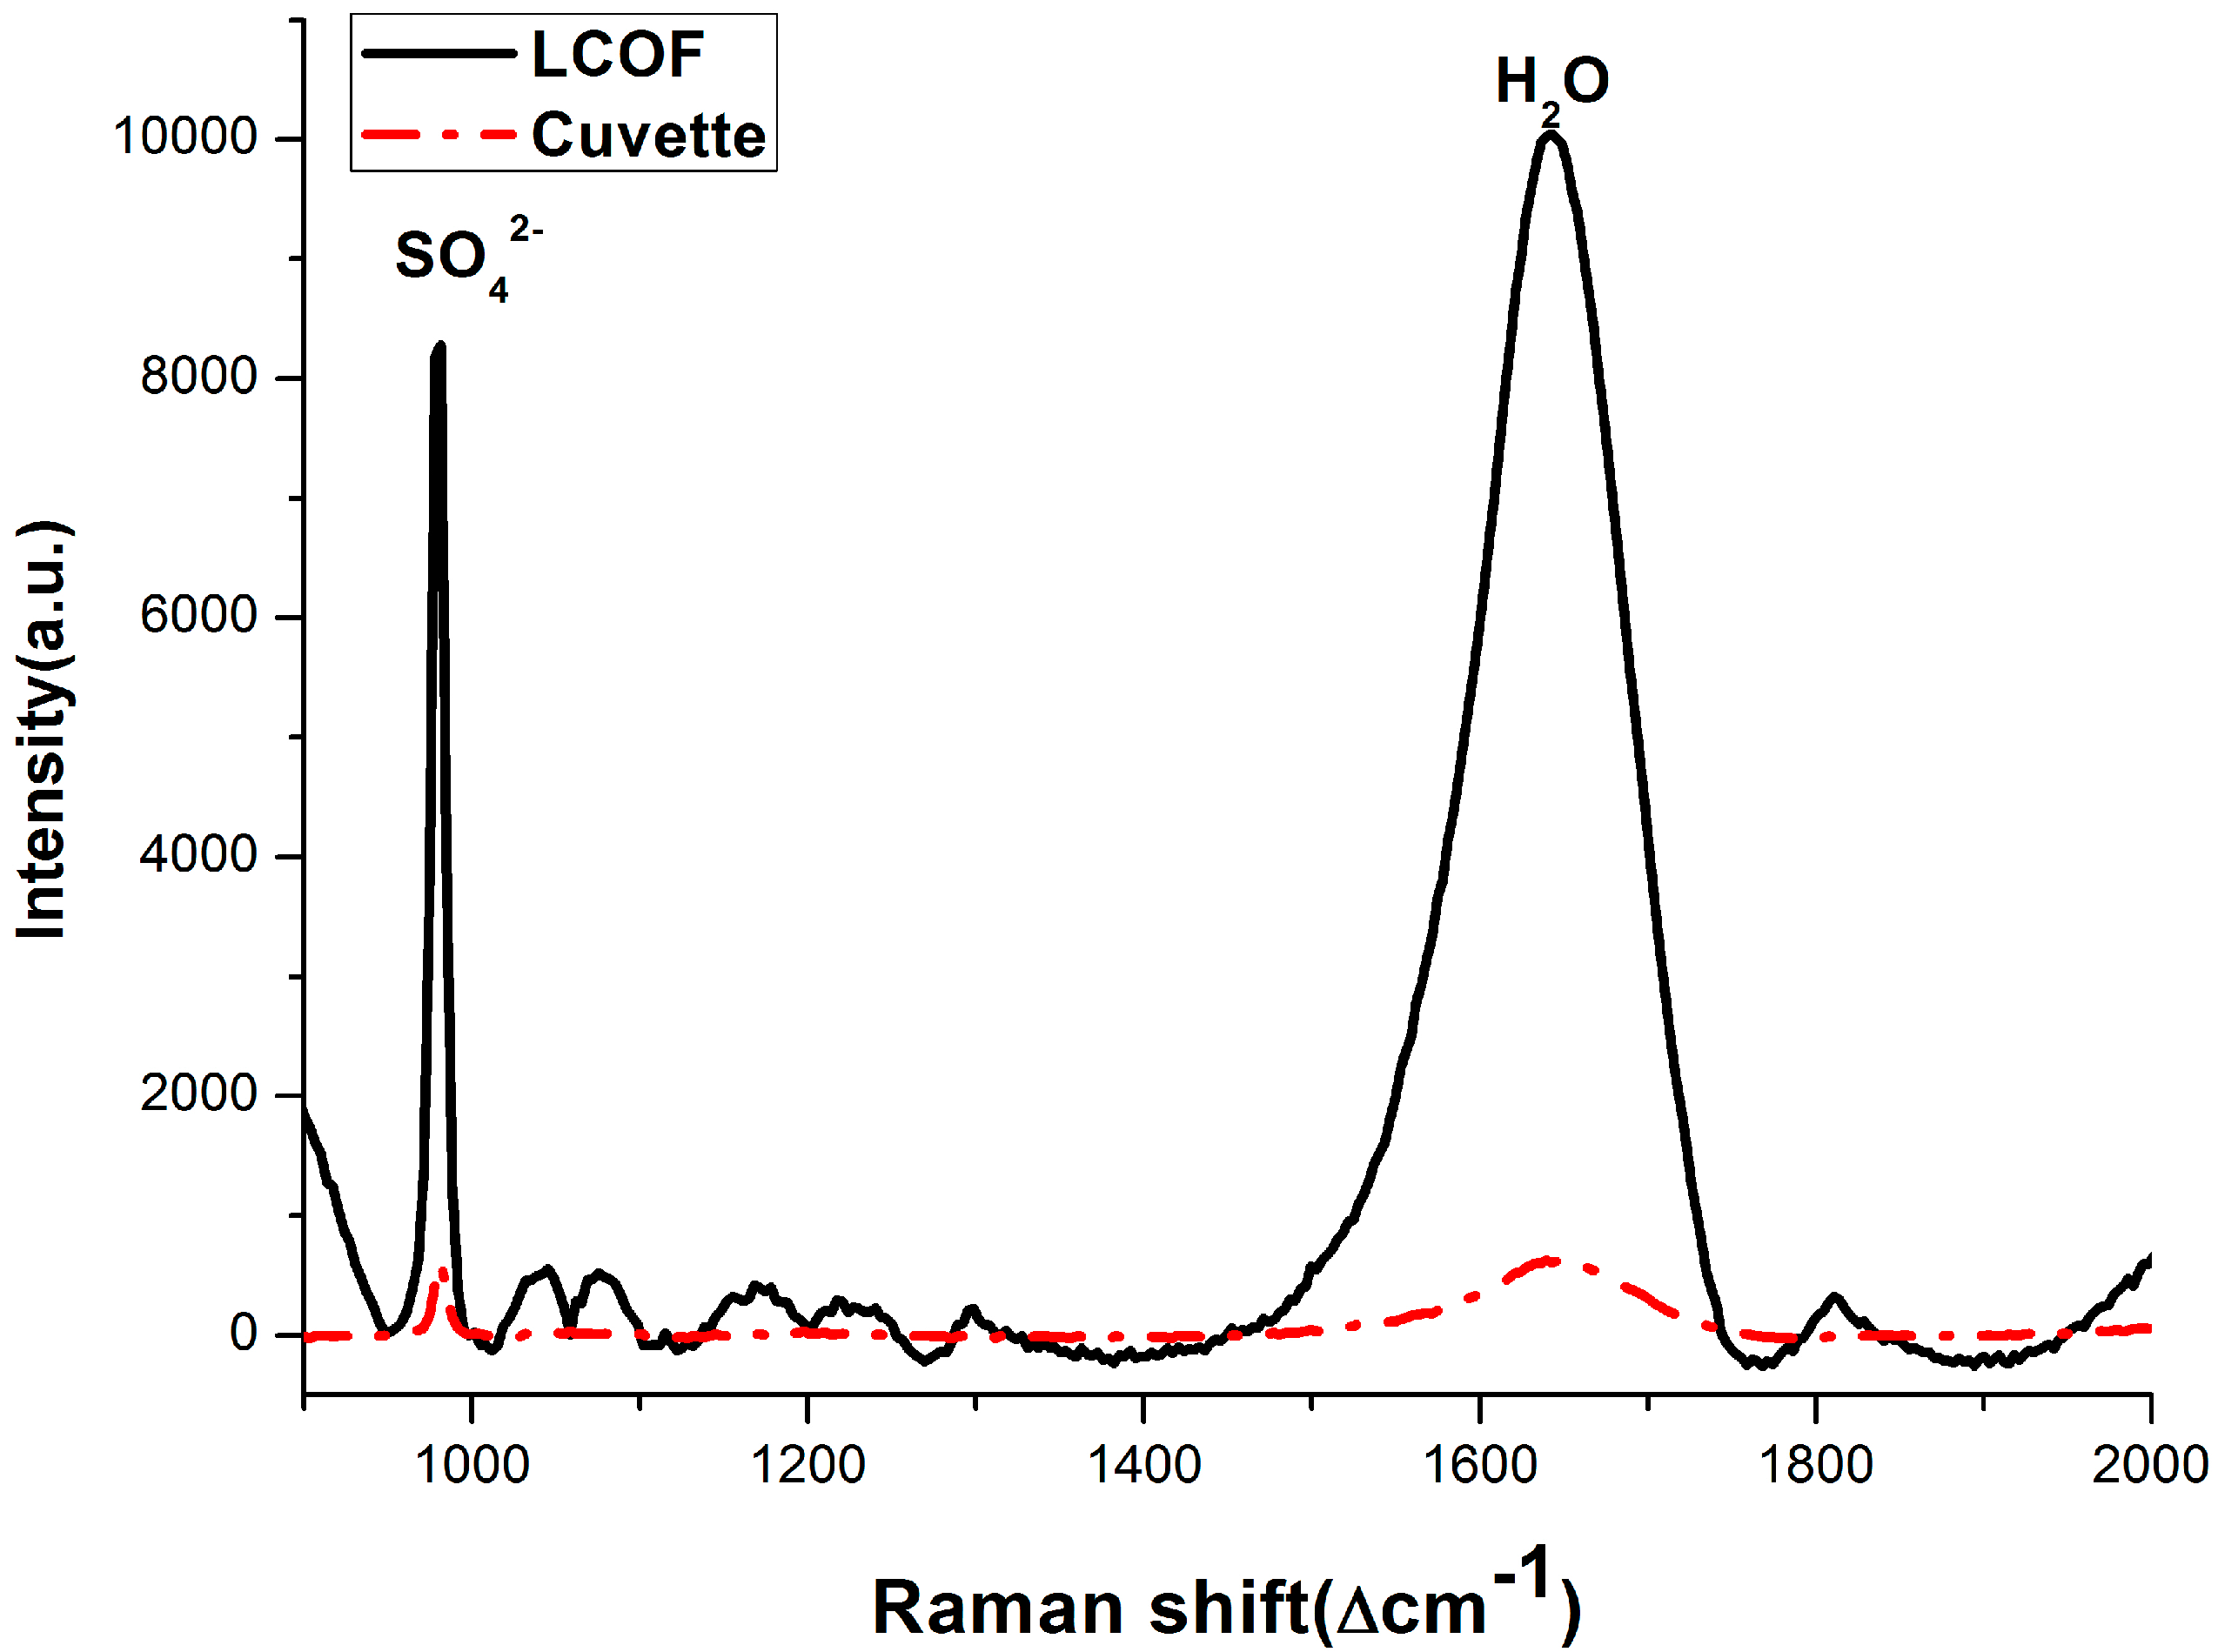
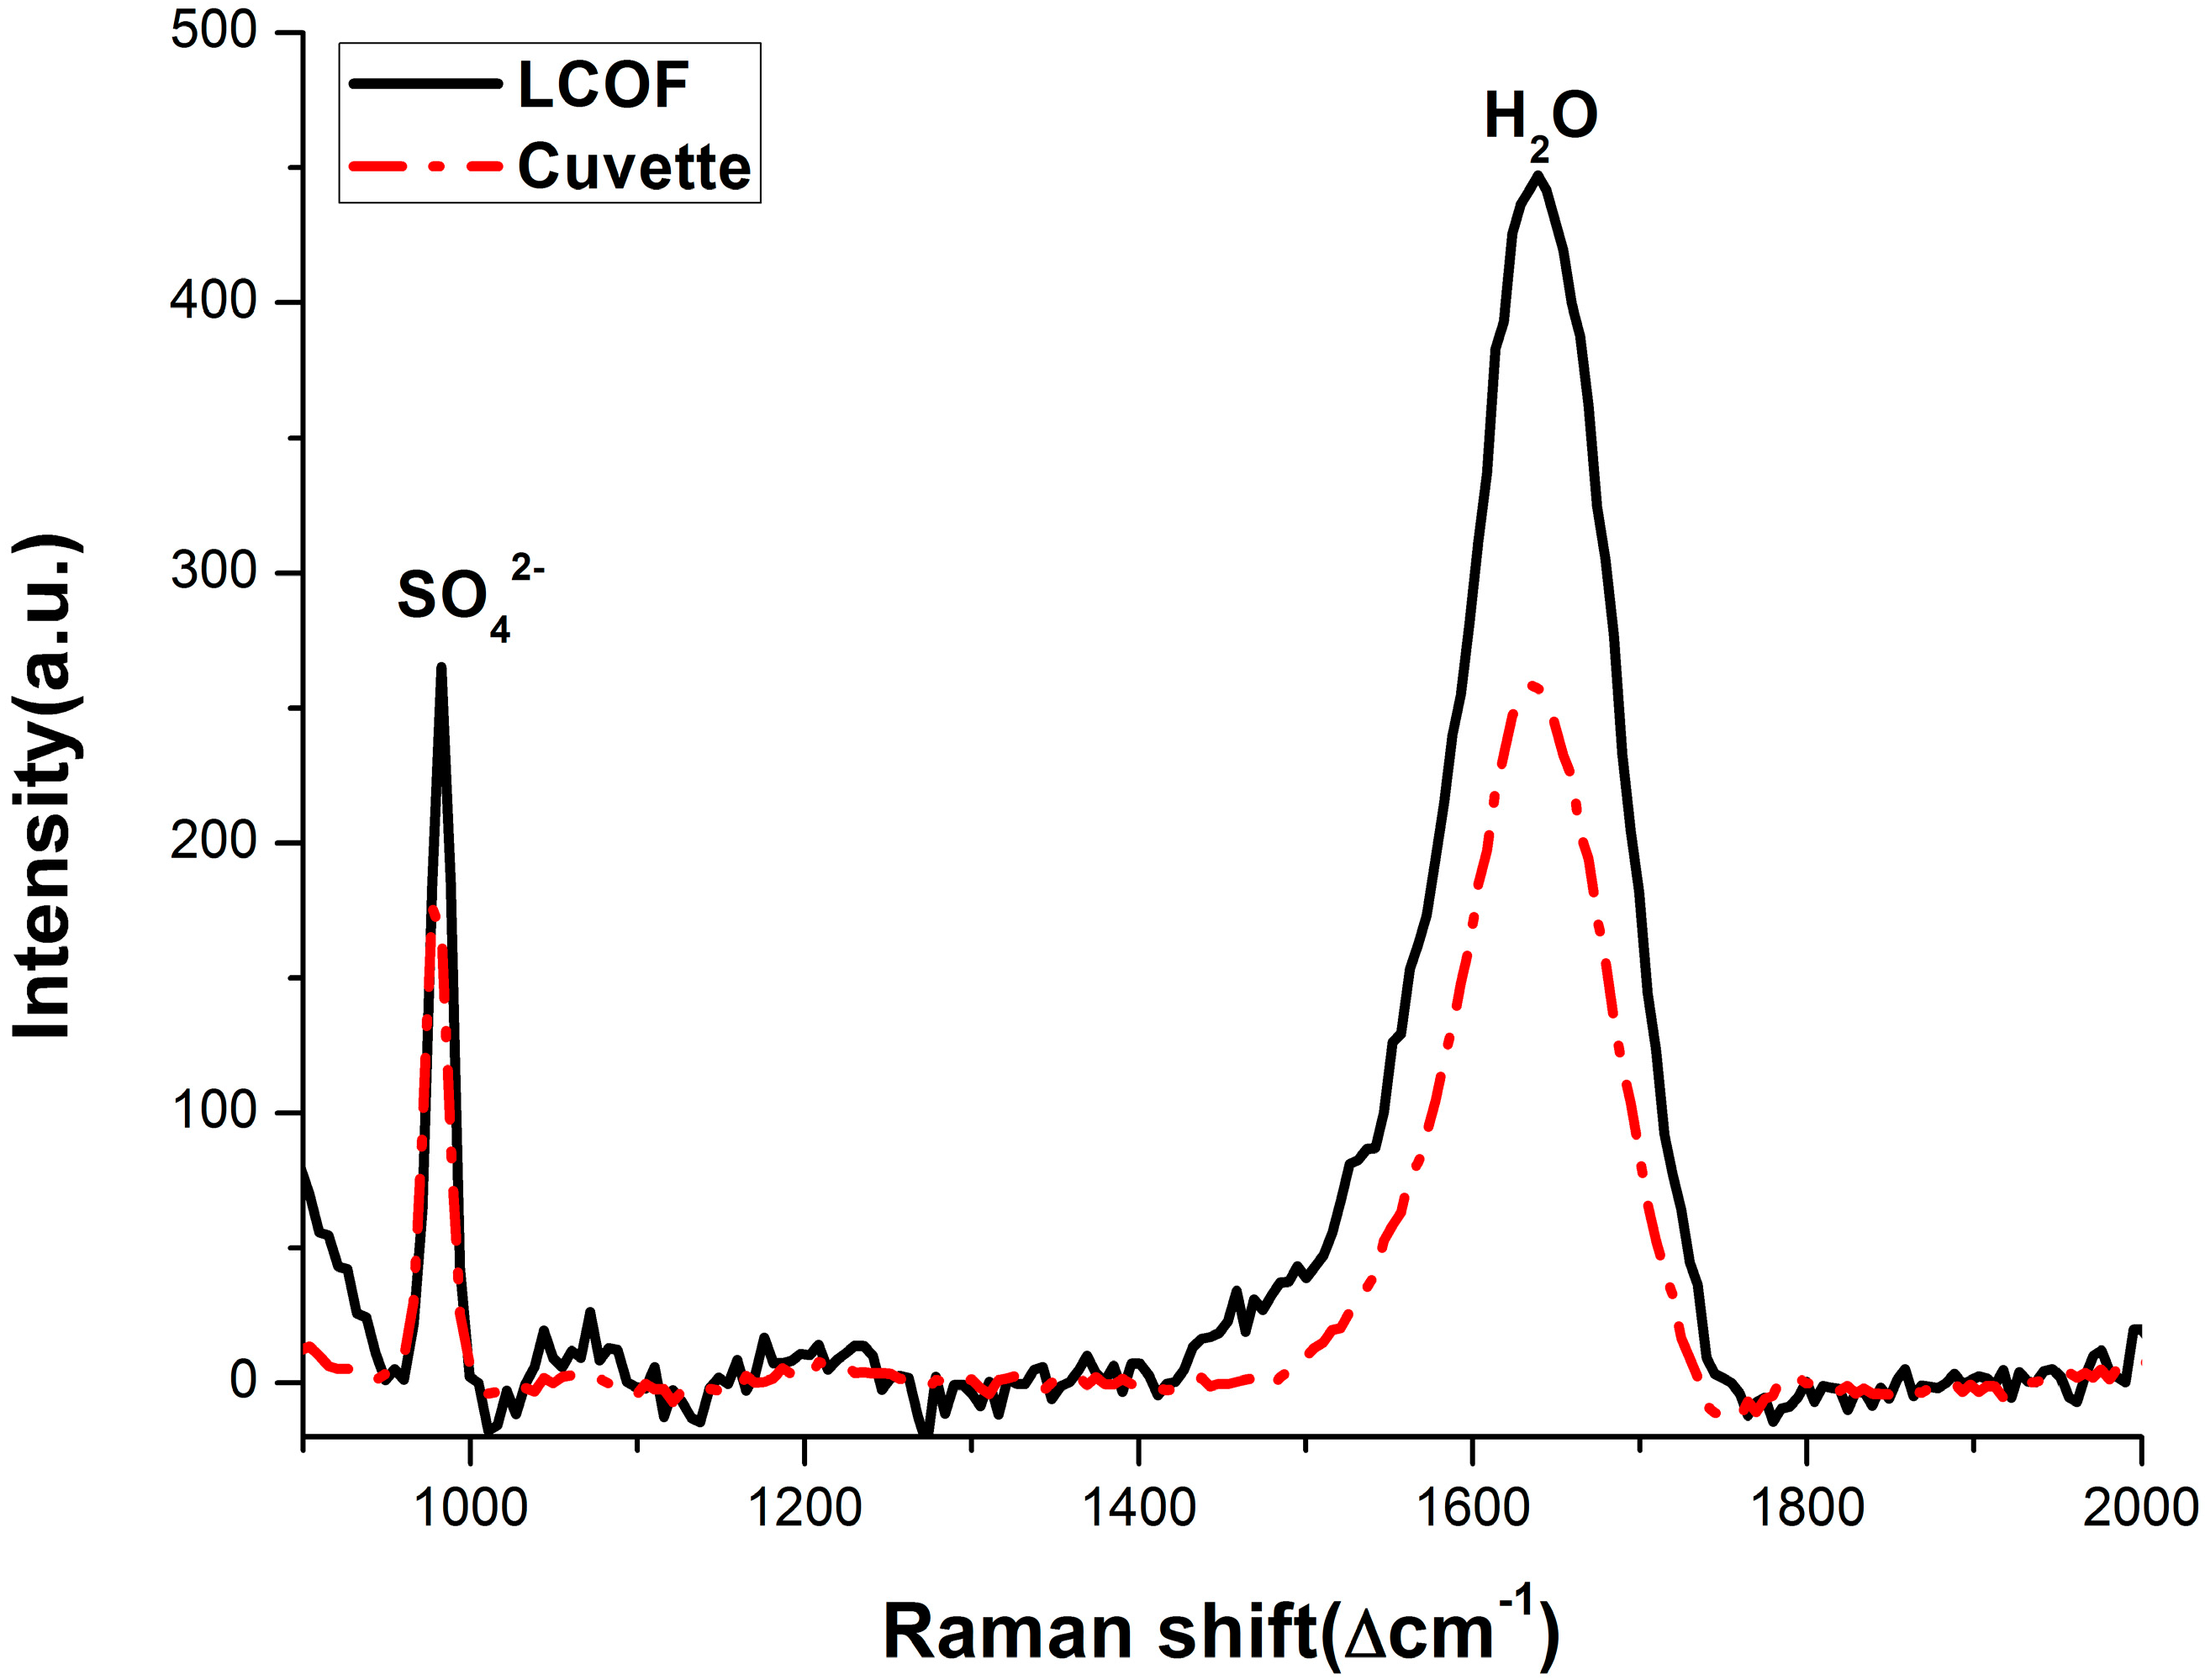
3.2. Enhancement for Raman Signal of SO42− with LCOF

It is reported that up to a 100-fold improvement of Raman signals can be observed using the LCOF-Raman experimental setup compared to the conventional Raman experimental setup [22], and the performance of different LCOF geometries differs greatly [23].
Figure 5. The calibration curve of sulfate concentration with LCOF-Raman spectroscopy.
Sensors 15 12377 g005
A special LCOF-Raman experimental setup is established in laboratory. The physical length of the LCOF is about 100 cm (LWCC-2100, from Ocean Optics), and the spectrometer is a QE65000 Pro (from Ocean Optics) with an integration time of 1 s for each measurement. Raman spectra of the Na2SO4 solutions prepared in laboratory are also acquired by the LCOF-Raman experimental setup. The internal standard normalization method is used in data processing. The calibration curve is shown in Figure 5, and the fitted linear function is R* = 0.016C + 0.027. Table 2 presents the limit of detection (LOD) of the conventional Raman and the LCOF-Raman experimental setups.
Table 2. The fitted linear functions and LODs of conventional Raman and LCOF-Raman experimental setup. (QE65000 is employed as spectrometer, and the length of the LCOF is 100 cm.)
Fitted Linear FunctionLOD (mmol/L)
Conventional Raman setupR* = 0.012C + 0.5342.15
LCOF-Raman setupR* = 0.016C + 0.0271.50
Figure 6 shows the Raman spectra of 30 mmol/L solution of Na2SO4 using both the LWCC-2100 and a cuvette as sample container. The solid line is the Raman spectrum acquired by the LCOF-Raman (LWCC-2100) setup, while the dashed-dot line is the Raman spectrum acquired by the conventional Raman setup as a comparison. The backgrounds are subtracted for both spectra. The comparison of the spectra shows an increase in the Raman signal using the LCOF: the peak intensity and area are amplified by approximately two fold.
Figure 6. Raman spectra of 30 mmol/L sulfate solution using the LCOF-Raman experimental (LWCC-2100) setup and conventional experimental setup, respectively. The Raman peak of SO42 is located at 981 cm−1, and the Raman peak of H2O is located at 1640 cm−1.
Sensors 15 12377 g006
In another updated setup, a LCOF (LWCC-3050, from Ocean Optics) with the same samples (Na2SO4 water solutions prepared in laboratory) pumped in and with 50 cm physical length, has been chosen for comparison. To achieve a better performance, a more sensitive spectrometer (PPO Raman, from P&P Optica, Waterloo, ON, Canada) together with a 2000 × 256 back illuminated CCD (DU416A-LDC-DD, from Andor Technology, Belfast, UK) is used. The spectra are averaged from ten measurements taken with an integration time of 0.1 s for each measurement. Then the calibration curves of sulfate concentration with the conventional Raman and LCOF-Raman spectroscopy can be obtained.
Figure 7. The calibration curve of sulfate concentration with (a) conventional Raman spectroscopy and (b) LCOF-Raman spectroscopy.
Sensors 15 12377 g007
Table 3. The fitted linear functions and LODs of conventional Raman and LCOF-Raman experimental setup. (PPO Raman is employed as spectrometer, and the length of the LCOF is 50 cm.)
Fitted Linear FunctionLOD (mmol/L)
Conventional Raman setupR* = 0.0032C + 0.0101.80
LCOF-Raman setupR *= 0.0031C + 0.00340.35
Figure 7 shows the calibration curves, and Table 3 presents the LOD of the conventional Raman and the LCOF-Raman experimental setups. Figure 8 shows the typical Raman spectra obtained using both LWCC-3050 and cuvette as sample containers, with solid line and dash-dot line represented respectively. It can be seen from Figure 8 that the Raman signal of SO42− obtained with the LCOF-Raman setup is much higher than that with conventional Raman setup. Over 10-fold enhancement is achieved with the LCOF approach.
Figure 8. Raman spectra of 30 mmol/L sulfate solution using the LCOF-Raman experimental (LWCC-3050) setup and conventional experimental setup respectively.
Sensors 15 12377 g008
Table 2 and Table 3 present the LODs of the Raman experimental setups, and it is found that the LOD of Raman spectroscopy can be improved with LCOF assistance. The obtained results indicate that the physical length of the LCOF has a great influence on the enhancement of the Raman signals. It seems that the 50 cm LCOF has a better Raman signal enhancement than the 100 cm LCOF.

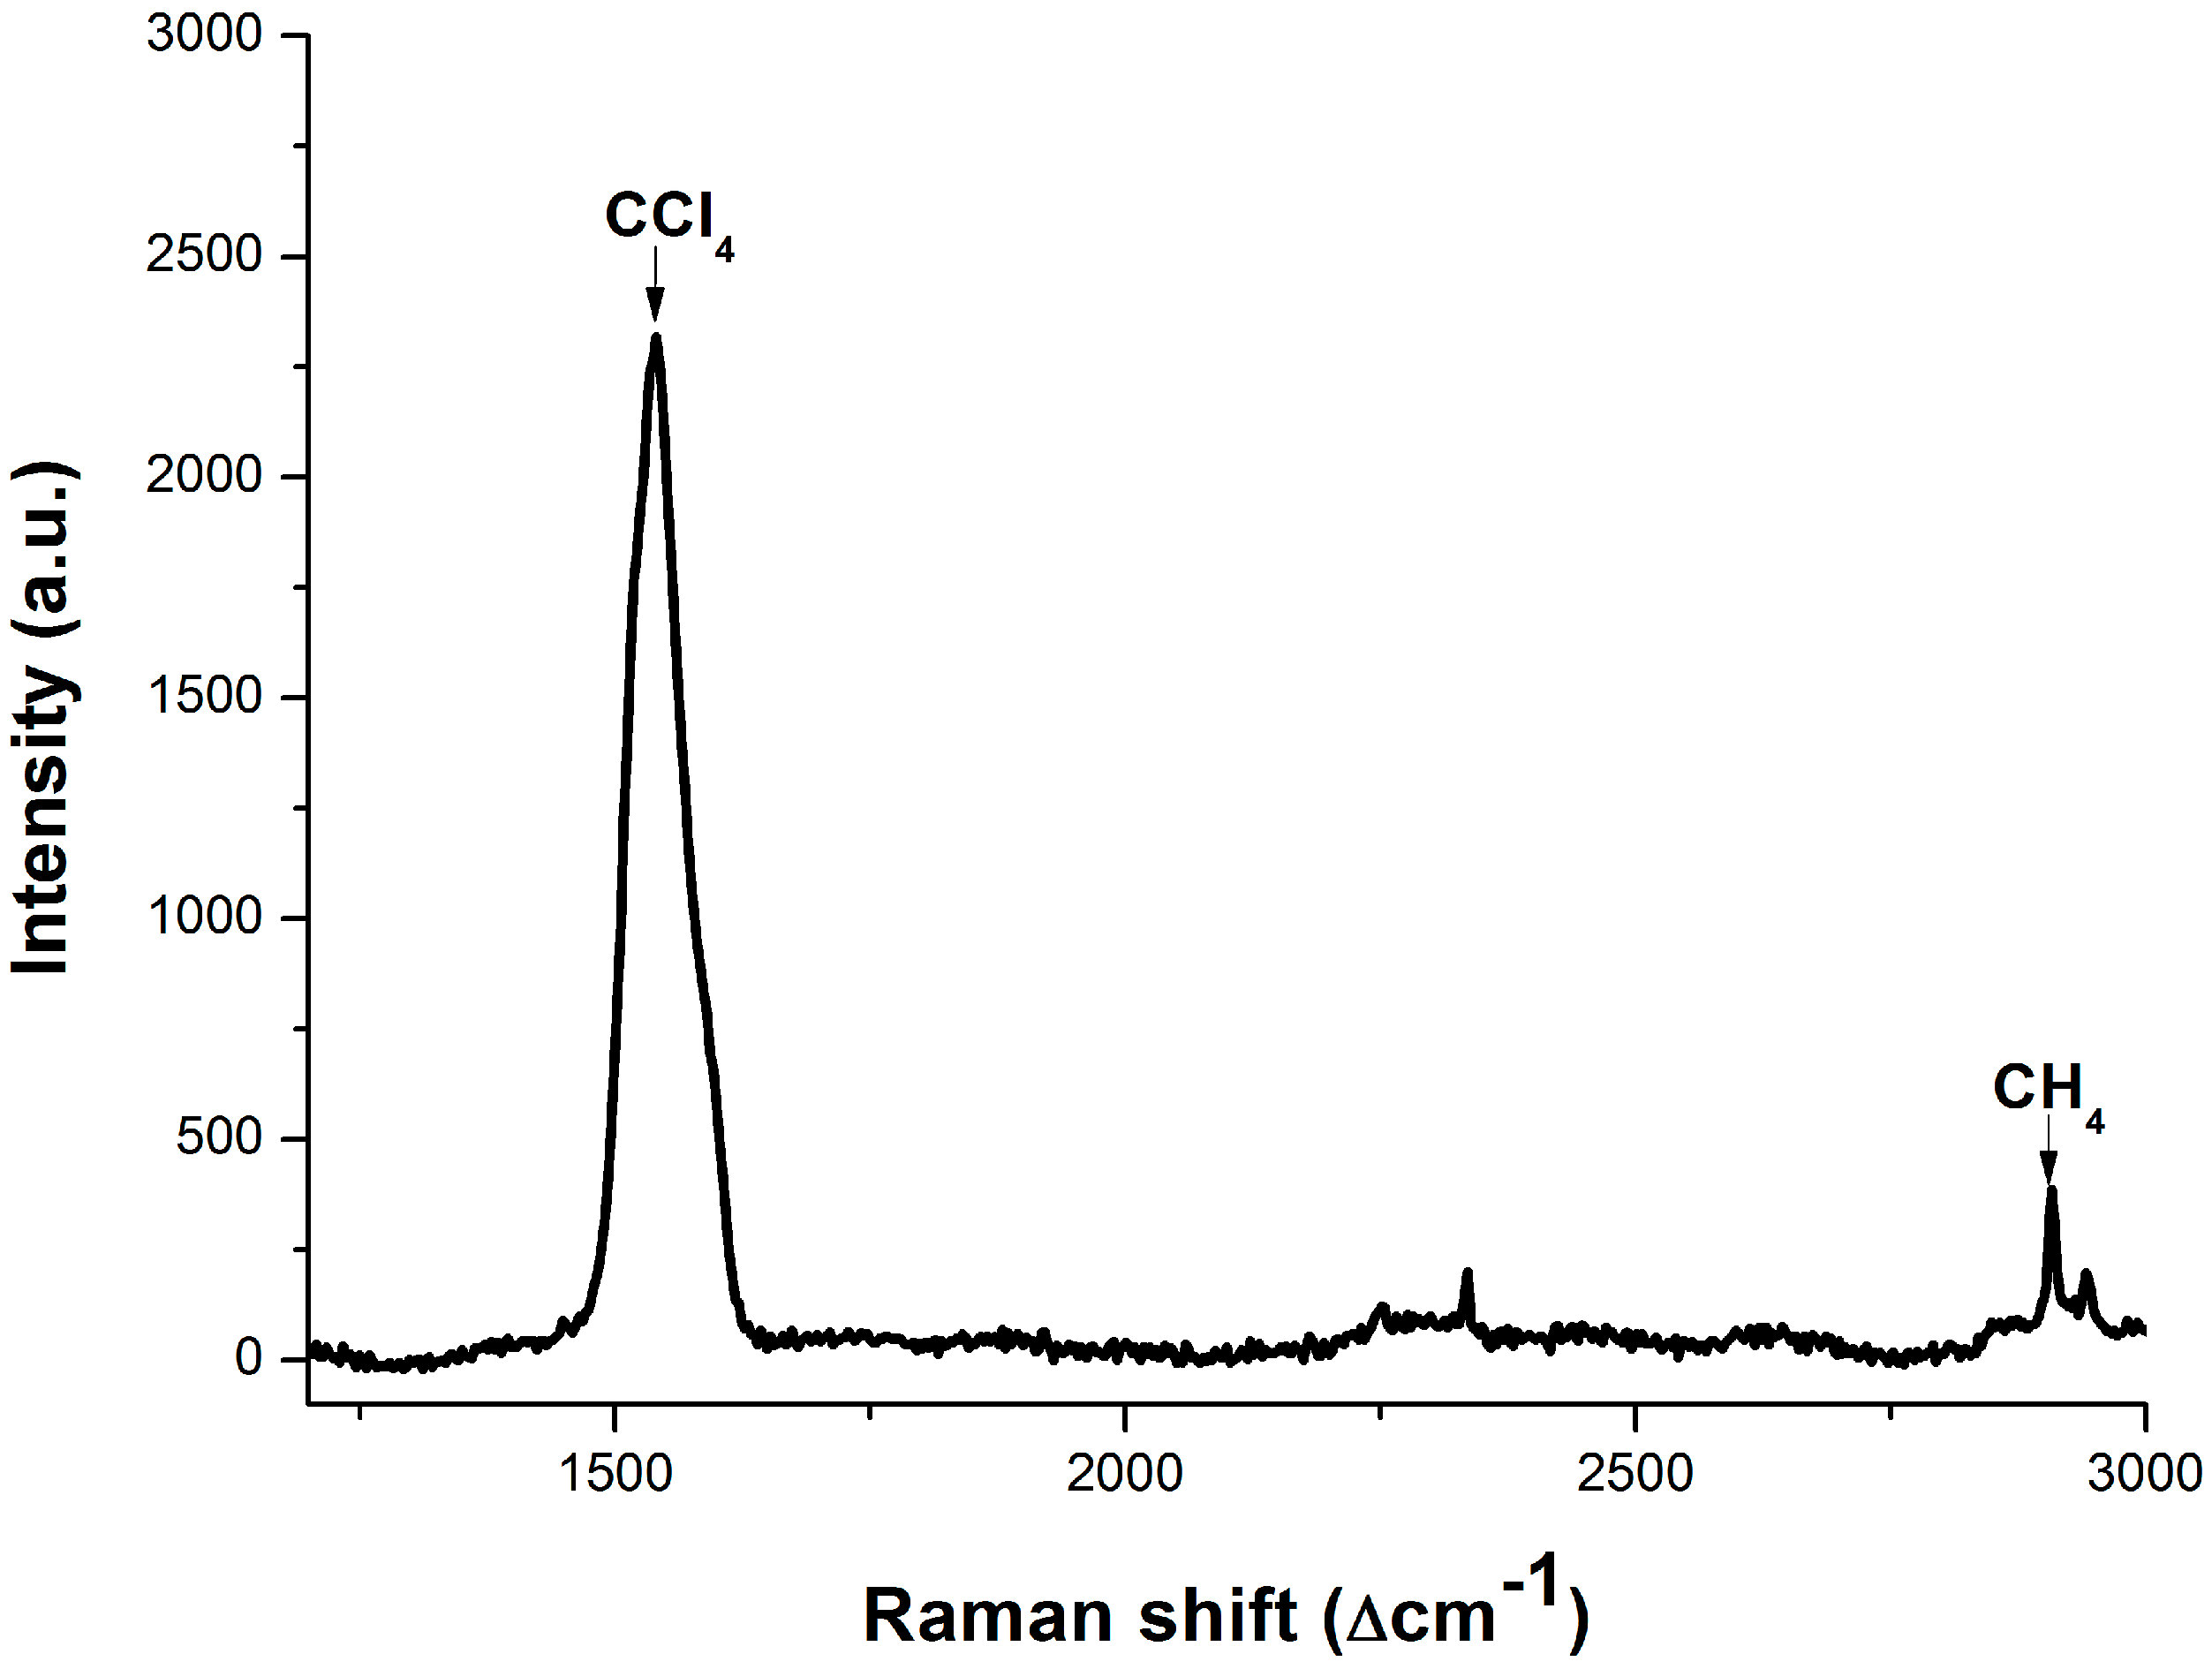
3.3. Dissolved Methane Detection Aided with an Enrichment Process

As is known, the maximum concentration of dissolved methane is about 1.14 mmol/L (the concentration of its saturated solution under laboratory conditions), which is still too low to be detected by the LCOF-Raman (LWCC-3050) experimental setup. In order to detect the methane dissolved in water, an approach based on CCl4 extraction is introduced in this work. CCl4 is chosen as an extraction agent for two reasons: the solubility of CH4 in CCl4 is much larger than that in H2O and CCl4 is immiscible with water. Thus, the trace CH4 dissolved in water is enriched into CCl4 after the extraction. Then, the CCl4 after extraction is taken as samples for Raman spectrum acquisition. The molecular density of CH4 (C in Equation (1)) in CCl4 is much bigger than that in H2O. Finally, the Raman spectrum of CCl4 after the extraction acquired by the conventional experimental setup with an integration time of 0.1 s, which is an average result of ten measurements, is shown in Figure 9.
Figure 9. Raman spectrum of CCl4 after extraction after conventional experimental setup.
Sensors 15 12377 g009
The Raman peak of methane is located at 2907 cm−1 and can be clearly observed in Figure 9. This indicates that, after the extraction, the methane dissolved in water is enriched into the CCl4. The preliminary result shows that the methane dissolved in water with concentration below 1.14 mmol/L could be indirectly detected assisted by CCl4 extraction. There are still many opportunities for optimizing this approach, and there is a long way to go in order to achieve a quantitative analysis of methane dissolved in water.

4. Conclusions

For the compositional analysis of pore water, Raman spectra of the pore water samples obtained from the sea trials were acquired. According to the linear function obtained from the calibration curve, the concentration of SO42− in pore water is inversely calculated according to the linear function obtained from the calibration curve. It is found that the concentration of SO42− in pore water samples decreases as the depth increases. However, methane cannot be detected using Raman spectroscopy because of its low concentration. Two approaches are proposed and used for a better analysis of pore water samples. One approach uses a LCOF as a sample container to enlarge the optical path length for detection of SO42−. The other approach is an enrichment process for methane with CCl4 extraction. With the assistance of a LCOF whose physical length is 50 cm, the LOD of Raman spectroscopy is significantly improved, and the Raman signal of SO42− is amplified over 10 times compared to that obtained with a conventional Raman experimental setup. By the means of extraction, the trace methane dissolved in water is enriched into CCl4 because the solubility of methane in water and CCl4 differs immensely. Hence the methane dissolved in water with concentration below 1.14 mmol/L could be indirectly detected. There are still opportunities to optimize the performance of these two approaches. Furthermore, all of the obtained results suggest that the proposed approaches in this paper have great potential to be developed to a sensor for detection of sulfate ion and methane dissolved in sediment pore water.

Acknowledgments

The work was supported by National High Technology Research and Development Program of China (Grant No. 2012AA09A405) and Natural Science Foundation of China (Grant No. 41006059).

Author Contributions

Ronger Zheng supervised the research project and revised the draft. Zengfeng Du and Jinjia Guo proposed the idea. Xing Zhang provided the pore water samples and discussed the results. Zengfeng Du and Wangquan Ye performed the experiments. Jing Chen processed the data. Zengfeng Du wrote the manuscript.

Conflicts of Interest

The authors declare no conflict of interest.

References

  1. Prieur, D.; Erauso, G.; Jeanthon, C. Hyperthermophilic life at deep-sea hydrothermal vents. Planet. Space Sci. 1995, 43, 115–122. [Google Scholar] [CrossRef]
  2. Simoneit, B.R.T.; Schoell, M.; Dias, R.F.; de Auuino Neto, F.R. Unusual carbon isotope compositions of biomarker hydrocarbons in a Permian tasmanite. Geochim. Cosmochim. Acta 1993, 57, 4205–4211. [Google Scholar] [CrossRef]
  3. Vairavamurthy, M.A.; Orr, W.L.; Manowitz, B. Geochemical transformations of sedimentary sulfur: An introduction. In ACS Symposium Series; American Chemical Society: Washington, DC, USA, 1995; pp. 1–15. [Google Scholar]
  4. Henrichs, S.M.; Reeburgh, W.S. Anaerobic mineralization of marine sediment organic matter: Rates and the role of anaerobic processes in the oceanic carbon economy. Geomicrobiol. J. 1987, 5, 191–237. [Google Scholar] [CrossRef]
  5. Jorgensen, B.B.; Kasten, S. Sulfur Cycling and Methane Oxidation. In Marine Geochemistry; Horst, D.S., Matthias, Z., Eds.; Springer: Berlin/Heidelberg, Germany, 2006; pp. 271–309. [Google Scholar]
  6. Whitman, W.B.; Bowen, T.L.; Boone, D.R. The methanogenic bacteria. In The Prokaryotes; Dworkin, M., Balows, A., Eds.; Springer US: New York, NY, USA, 2006; pp. 165–207. [Google Scholar]
  7. Borowski, W.S.; Paull, C.K.; Ussler, W. Carbon cycling within the upper methanogenic zone of continental rise sediments; an example from the methane-rich sediments overlying the Blake Ridge gas hydrate deposits. Mar. Chem. 1997, 57, 299–311. [Google Scholar] [CrossRef]
  8. Claypool, G.E.; Kaplan, I.R. The origin and distribution of methane in marine sediments. In Natural Gases in Marine Sediments; Isaac, R.K., Ed.; Springer US: New York, NY, USA, 1974; pp. 99–139. [Google Scholar]
  9. Borowski, W.S.; Paull, C.K.; Ussler, W. Marine pore-water sulfate profiles indicate in situ methane flux from underlying gas hydrate. Geology 1996, 24, 655–658. [Google Scholar] [CrossRef]
  10. Borowski, W.S.; Paull, C.K.; Ussler, W. Global and local variations of interstitial sulfate gradients in deep-water, continental margin sediments: Sensitivity to underlying methane and gas hydrates. Mar. Geol. 1999, 159, 131–154. [Google Scholar] [CrossRef]
  11. Ussler, W.; Paull, C.K. Rates of anaerobic oxidation of methane and authigenic carbonate mineralization in methane-rich deep-sea sediments inferred from models and geochemical profiles. Earth Planet. Sci. Lett. 2008, 266, 271–287. [Google Scholar] [CrossRef]
  12. Zhang, X.; Walz, P.M.; Kirkwood, W.J.; Hester, K.C.; Ussler, W.; Peltzer, E.T.; Brewer, P.G. Development and deployment of a deep-sea Raman probe for measurement of pore water geochemistry. Deep Sea Res. Part I Oceanogr. Res. Pap. 2010, 57, 297–306. [Google Scholar] [CrossRef]
  13. Brewer, P.G.; Malby, G.; Pasteris, J.D.; White, S.N.; Peltzer, E.T.; Wopenka, B.; Freeman, J.; Brown, M.O. Development of a laser Raman spectrometer for deep-ocean science. Deep Sea Res. Part I Oceanogr. Res. Pap. 2004, 51, 739–753. [Google Scholar] [CrossRef]
  14. Reeburgh, W.S. Oceanic Methane Biogeochemistry. Chem. Rev. 2007, 107, 486–513. [Google Scholar] [CrossRef] [PubMed]
  15. Paull, C.K.; Ussler, W. History and Significance of Gas Sampling During DSDP and ODP Drilling Associated with Gas Hydrates. In Natural Gas Hydrates: Occurrence, Distribution, and Detection; Paull, C.K., Dillon, W.P., Eds.; American Geophysical Union: Washington, DC, USA, 2001; pp. 53–65. [Google Scholar]
  16. Newman, K.R.; Cormier, M.H.; Weissel, J.K.; Driscoll, N.W.; Kastner, M.; Solomon, E.A.; Robertson, G.; Hill, J.C.; Singh, H.; Camilli, R.; et al. Active methane venting observed at giant pockmarks along the US mid-atlantic shelf break. Earth Planet. Sci. Lett. 2008, 267, 341–352. [Google Scholar] [CrossRef]
  17. Marinaro, G.; Etiope, G.; Bue, N.L.; Favali, P.; Papatheodorou, G.; Christodoulou, D.; Furlan, F.; Gasparoni, F.; Ferentinos, G.; Masson, M.; et al. Monitoring of a methane-seeping pockmark by cabled benthic observatory (Patras Gulf, Greece). Geo-Mar. Lett. 2006, 26, 297–302. [Google Scholar] [CrossRef]
  18. Fietzek, P.; Kramer, S.; Esser, D. Deployments of the HydroC™(CO2/CH4) on stationary and mobile platforms-Merging trends in the field of platform and sensor development. In Proceedings of the IEEE OCEANS, Waikoloa, HI, USA, 19–22 September 2011; pp. 1–9.
  19. Pelletier, M.J. Analytical Applications of Raman Spectroscopy; Blackwell Science Ltd.: Osney Mead, Oxford, UK, 1999; p. 478. [Google Scholar]
  20. Altkorn, R.; Koev, I.; van Duyne, R.P.; Litorja, M. Low-loss liquid-core optical fiber for low-refractive-index liquids fabrication, characterization, and application in Raman spectroscopy. Appl. Opt. 1997, 36, 8892–8898. [Google Scholar] [CrossRef]
  21. Reeburgh, W.S. An improved interstitial water sampler. Limnol. Oceanogr. 1967, 12, 163–165. [Google Scholar] [CrossRef]
  22. Qi, D.; Berger, A.J. Quantitative analysis of Raman signal enhancement from aqueous samples in liquid core optical fibers. Appl. Spectrosc. 2004, 58, 1165–1171. [Google Scholar] [CrossRef] [PubMed]
  23. Altkron, R.; Malinsky, M.D.; van Duyne, R.P.; Koev, I. Intensity considerations in liquid core optical fiber Raman spectroscopy. Appl. Spectrosc. 2001, 55, 373–381. [Google Scholar] [CrossRef]

