
Highly Stable Liquid Metal-Based Pressure Sensor Integrated with a Microfluidic Channel

Abstract
:1. Introduction
2. Experimental Section
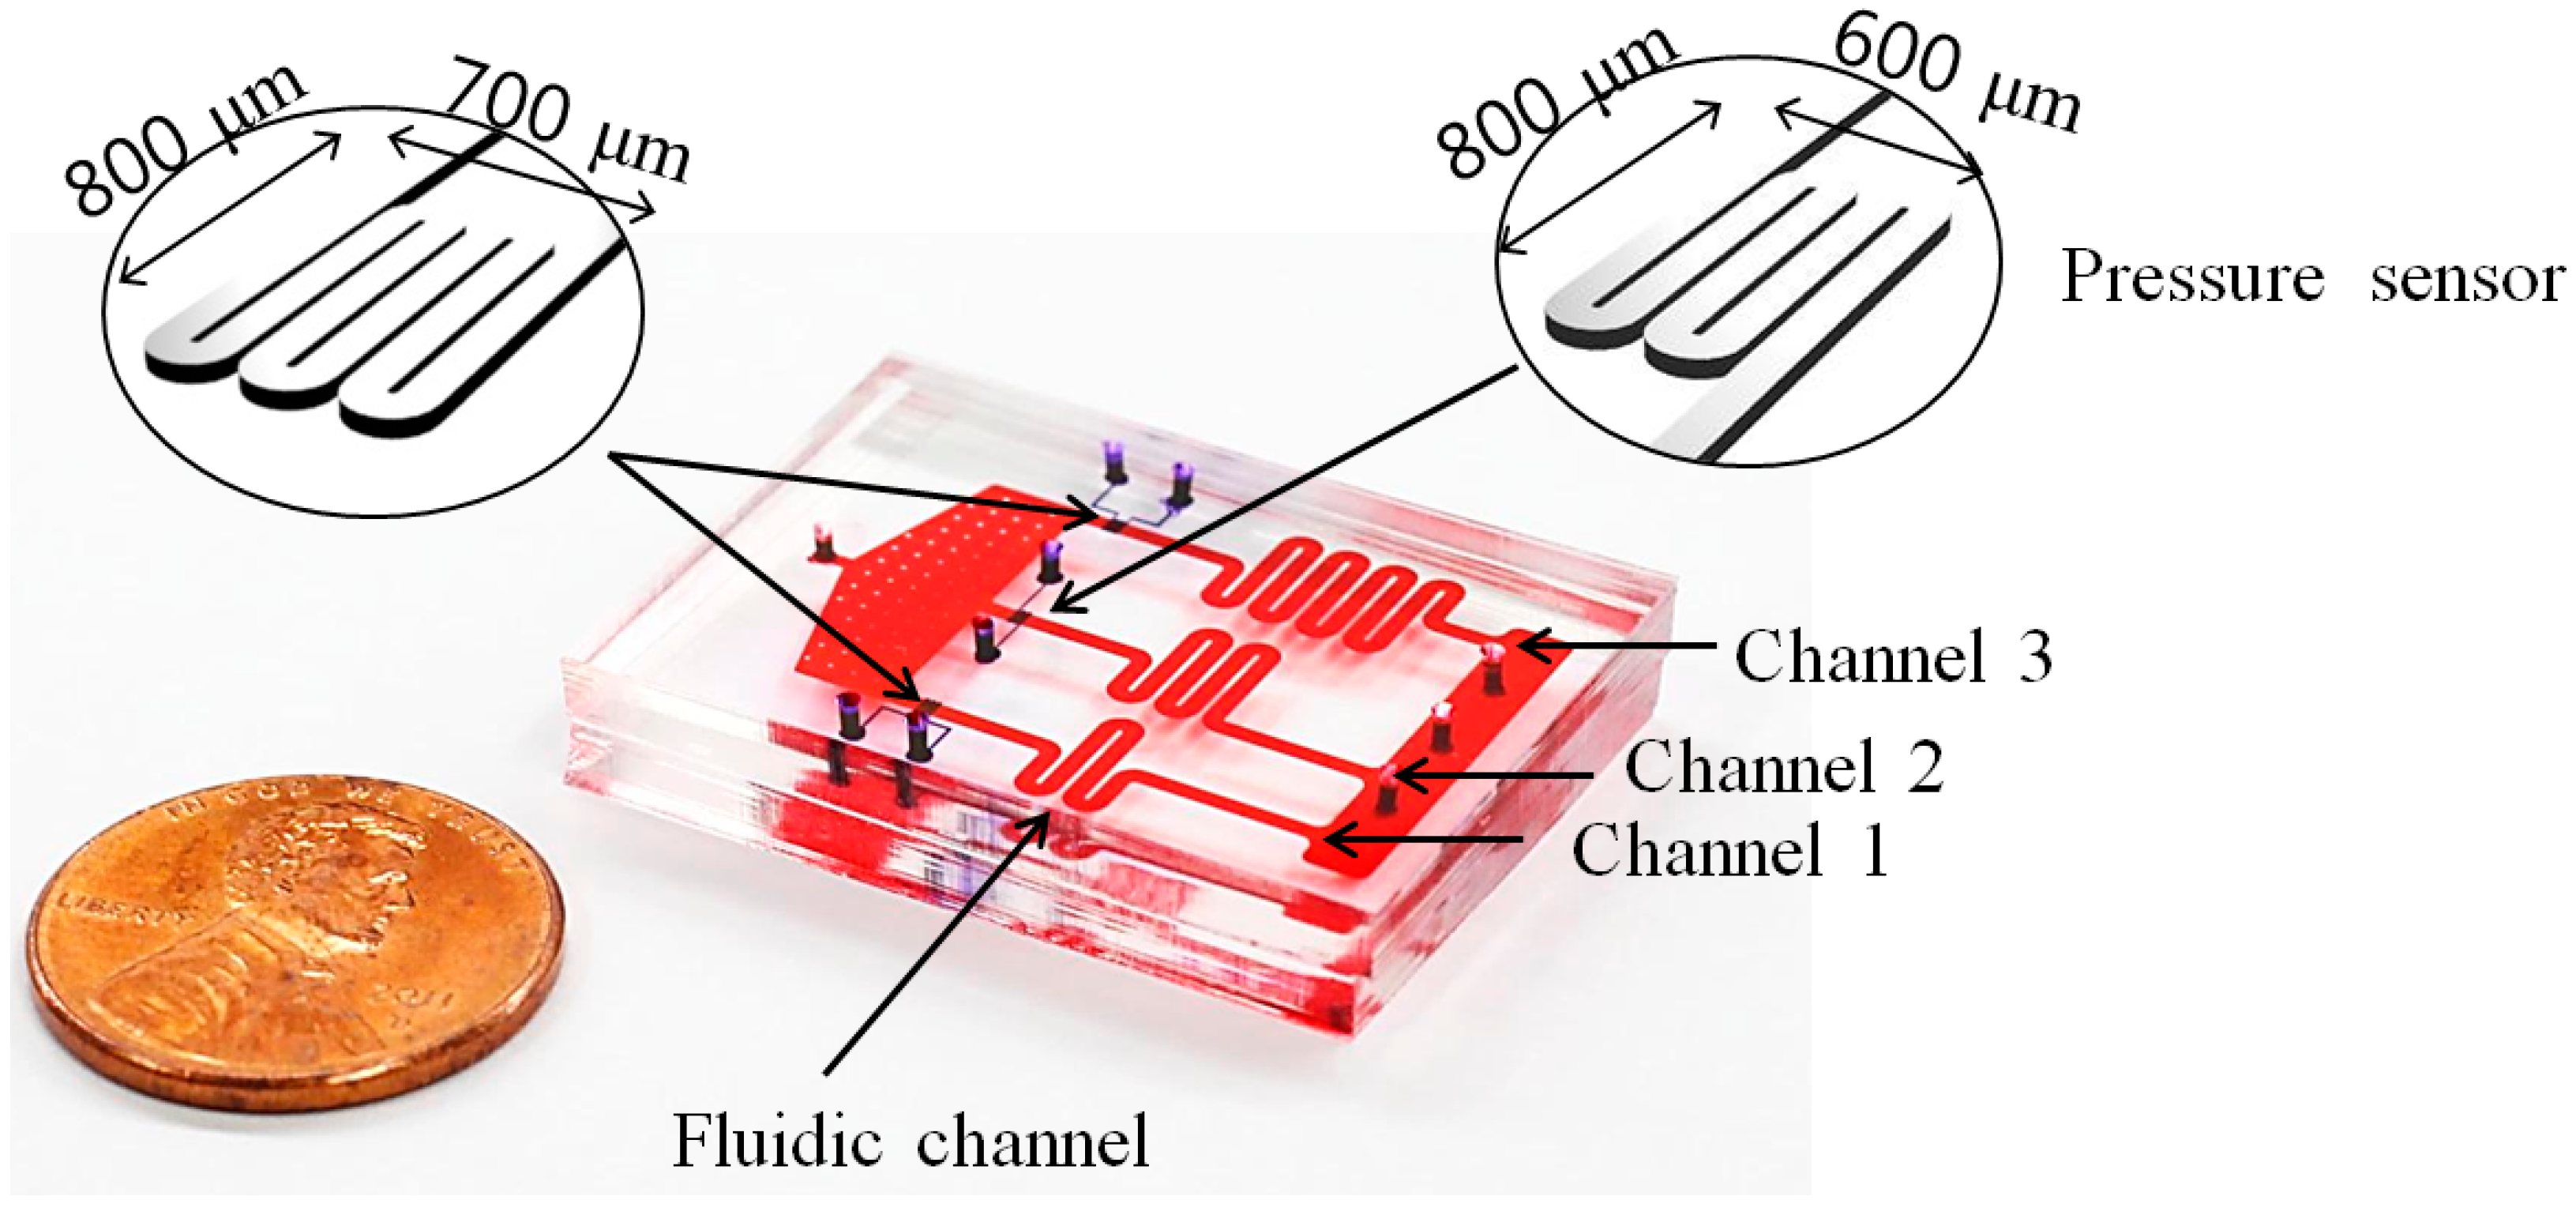
2.1. Device Design

2.2. Pressure Measurement

3. Results
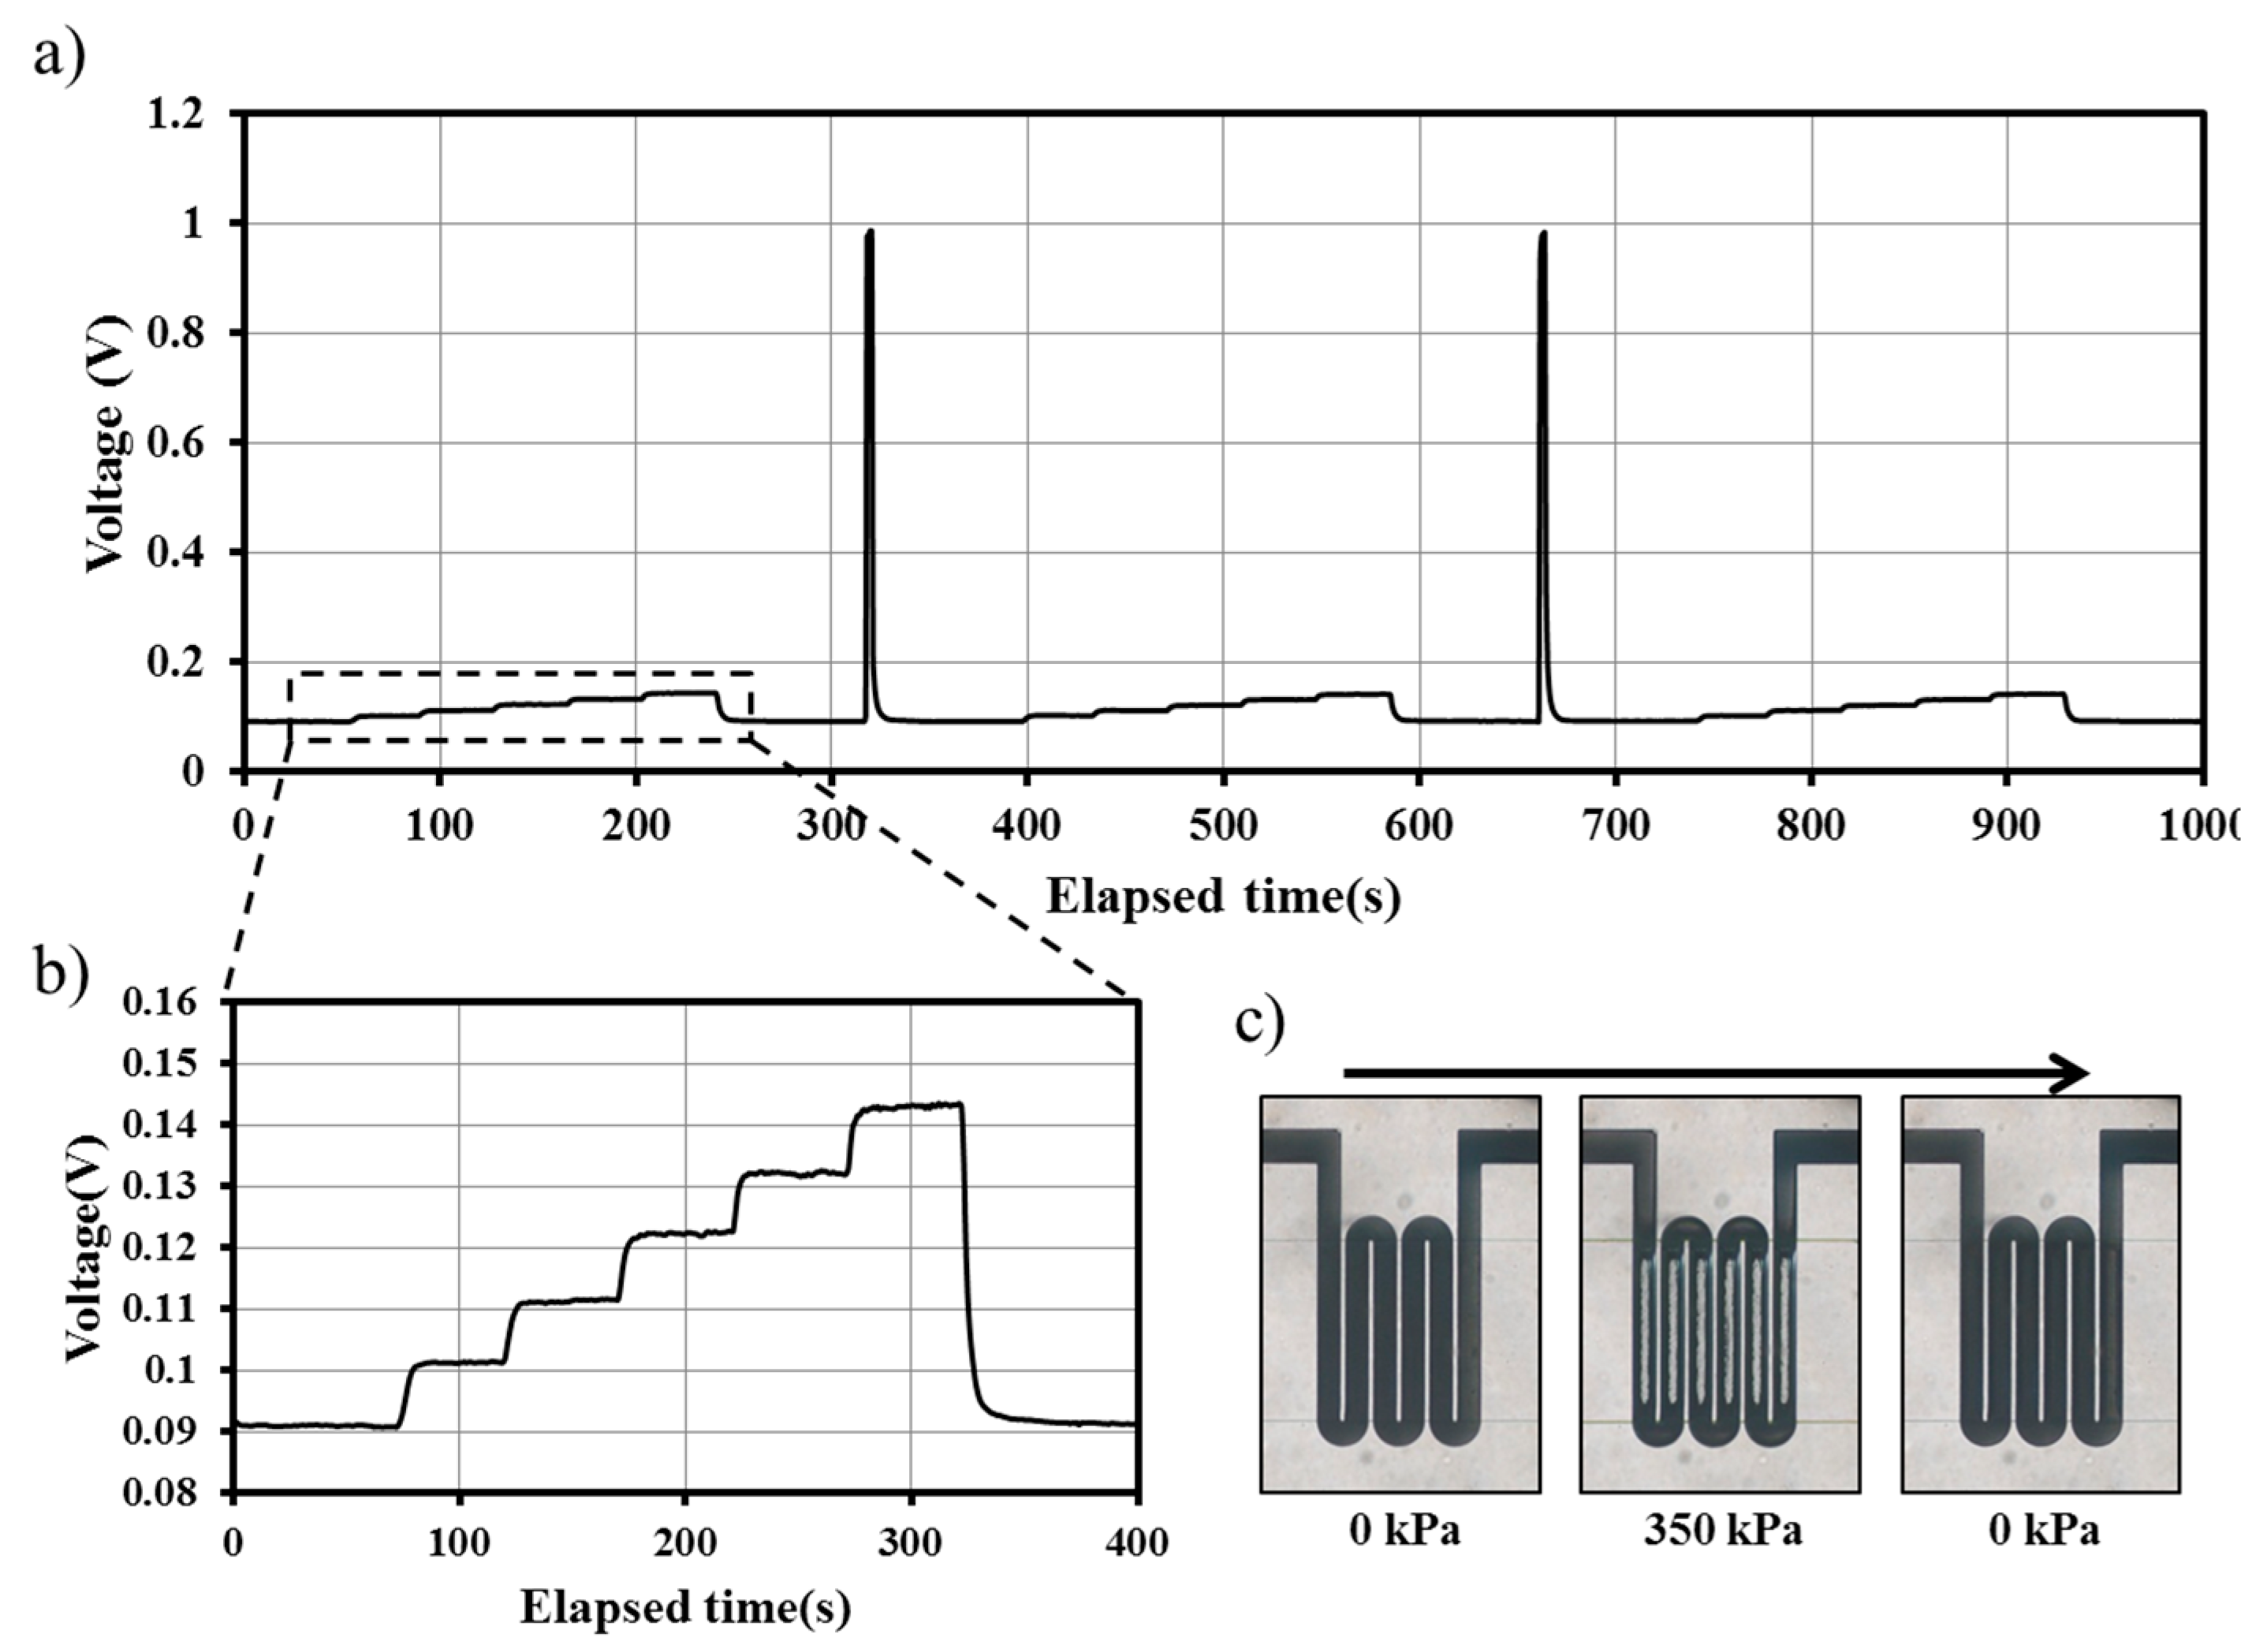
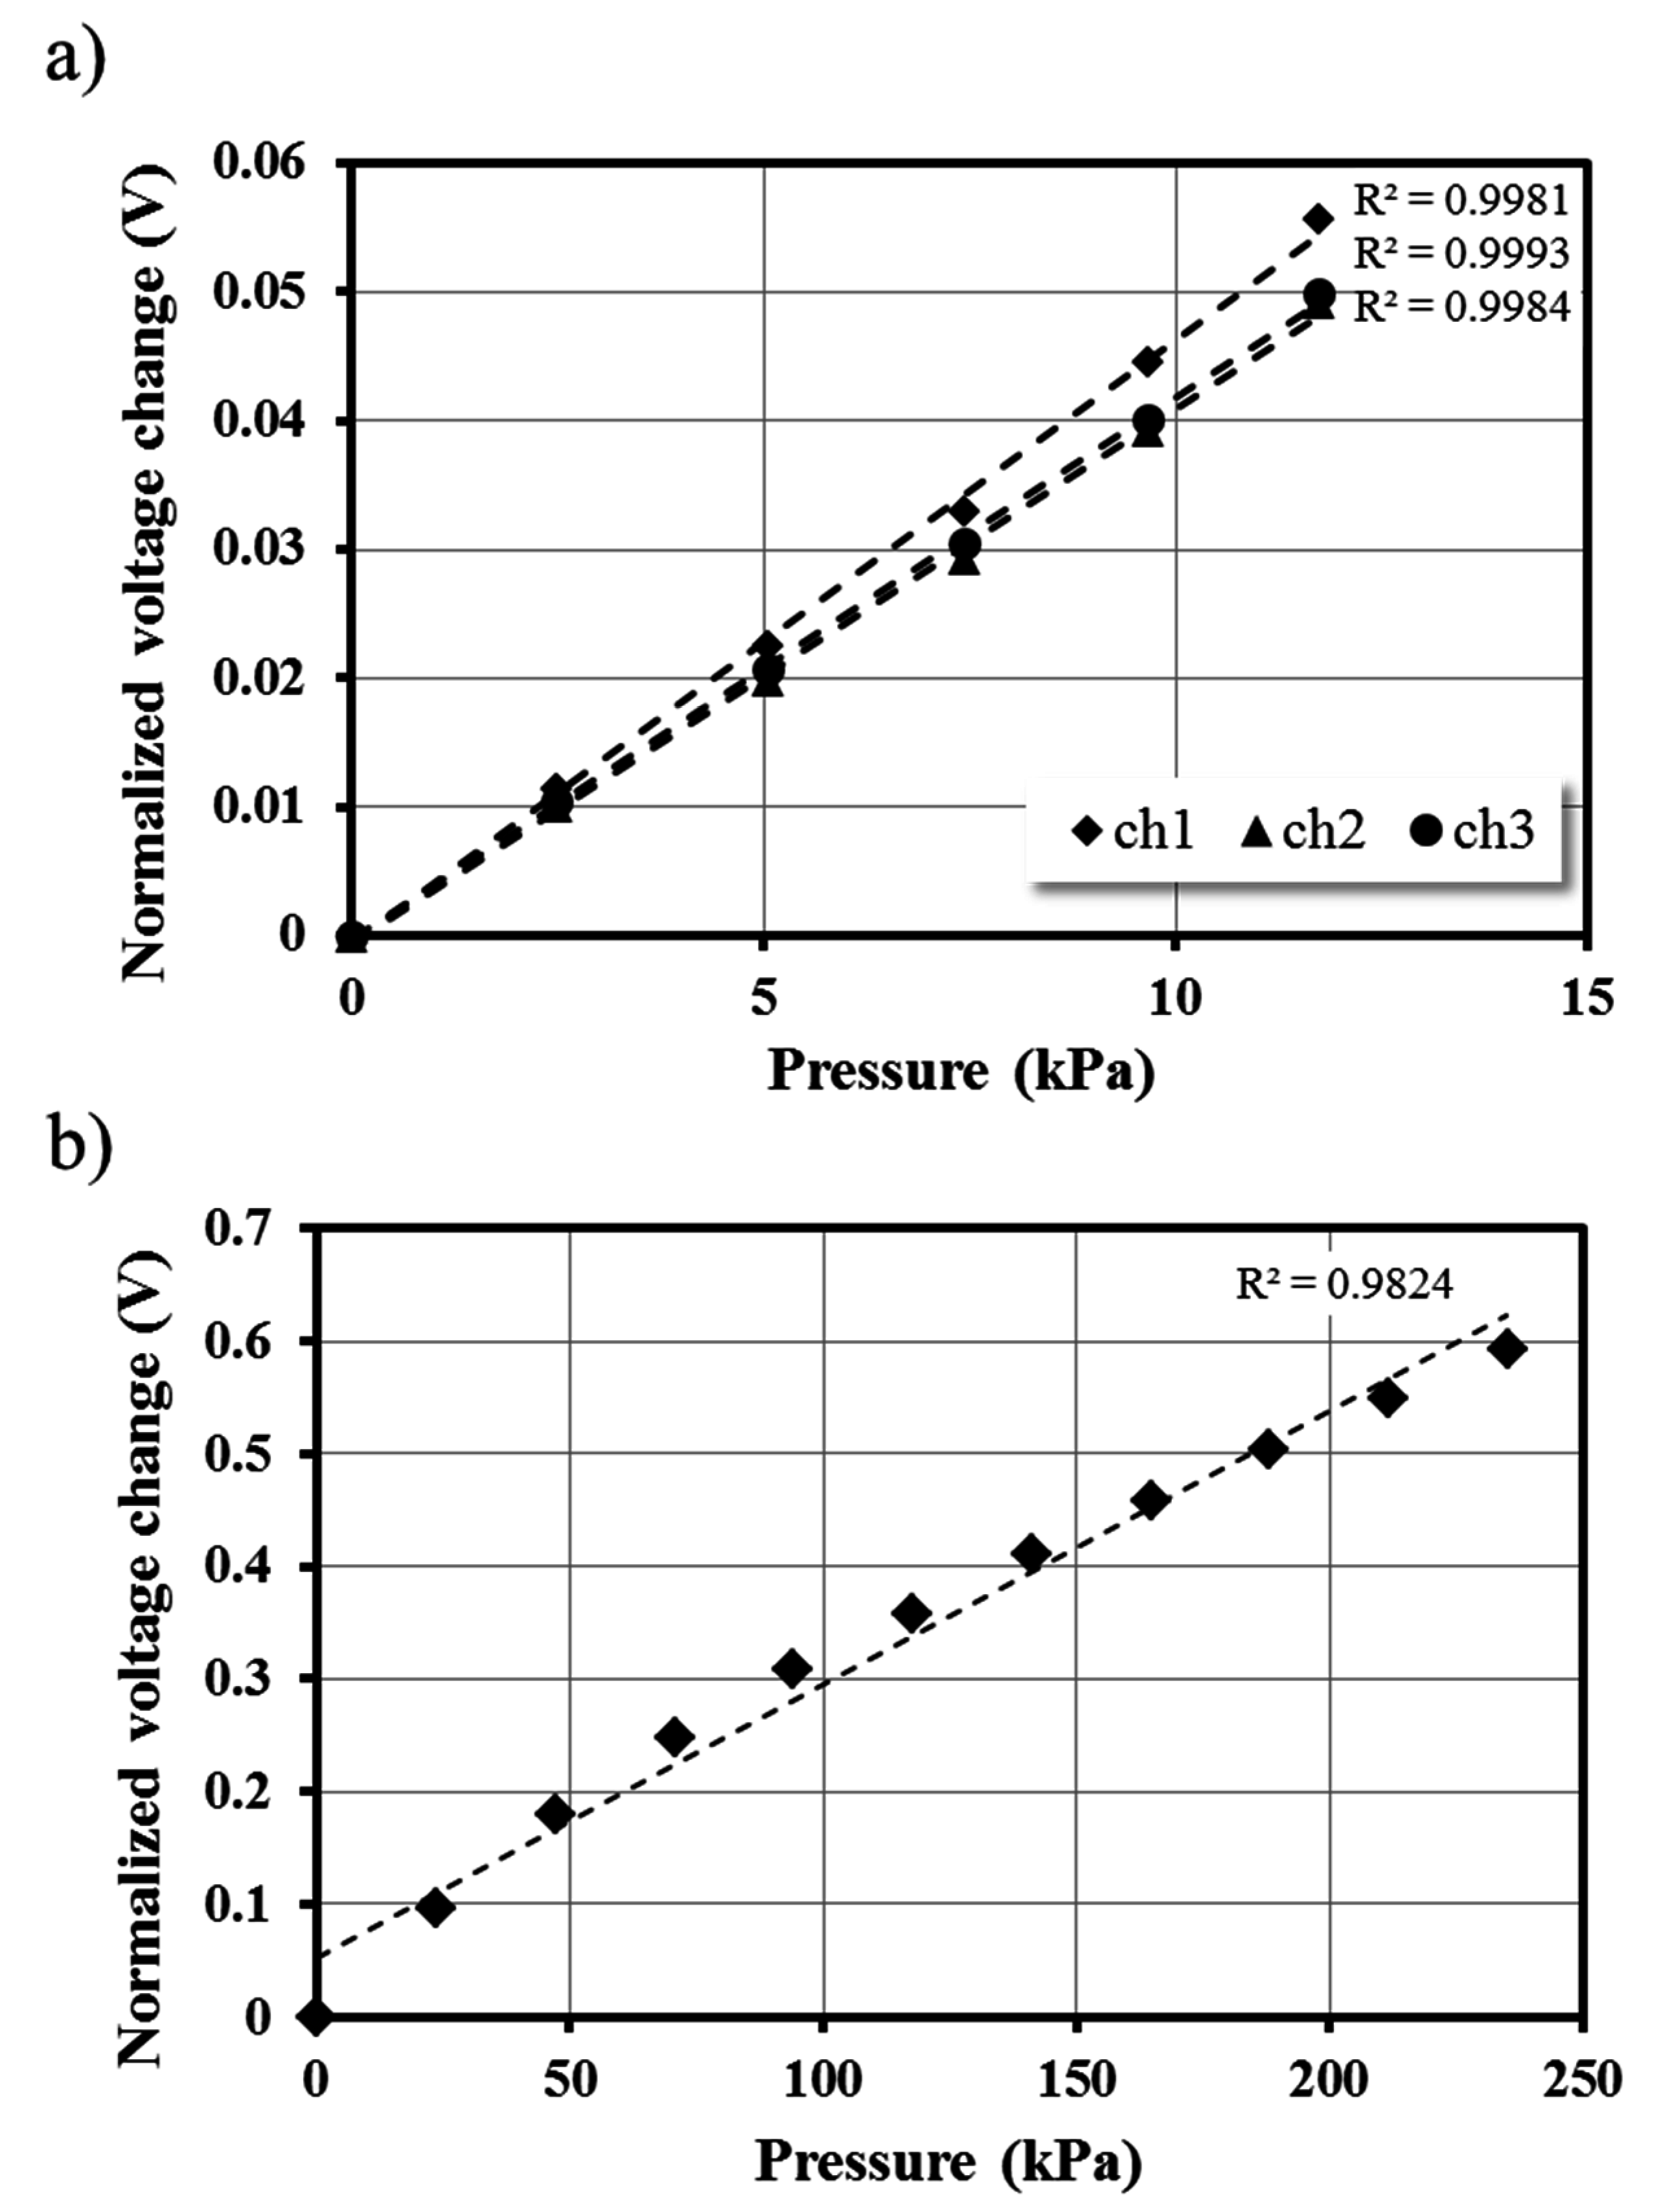
3.1. Calibration
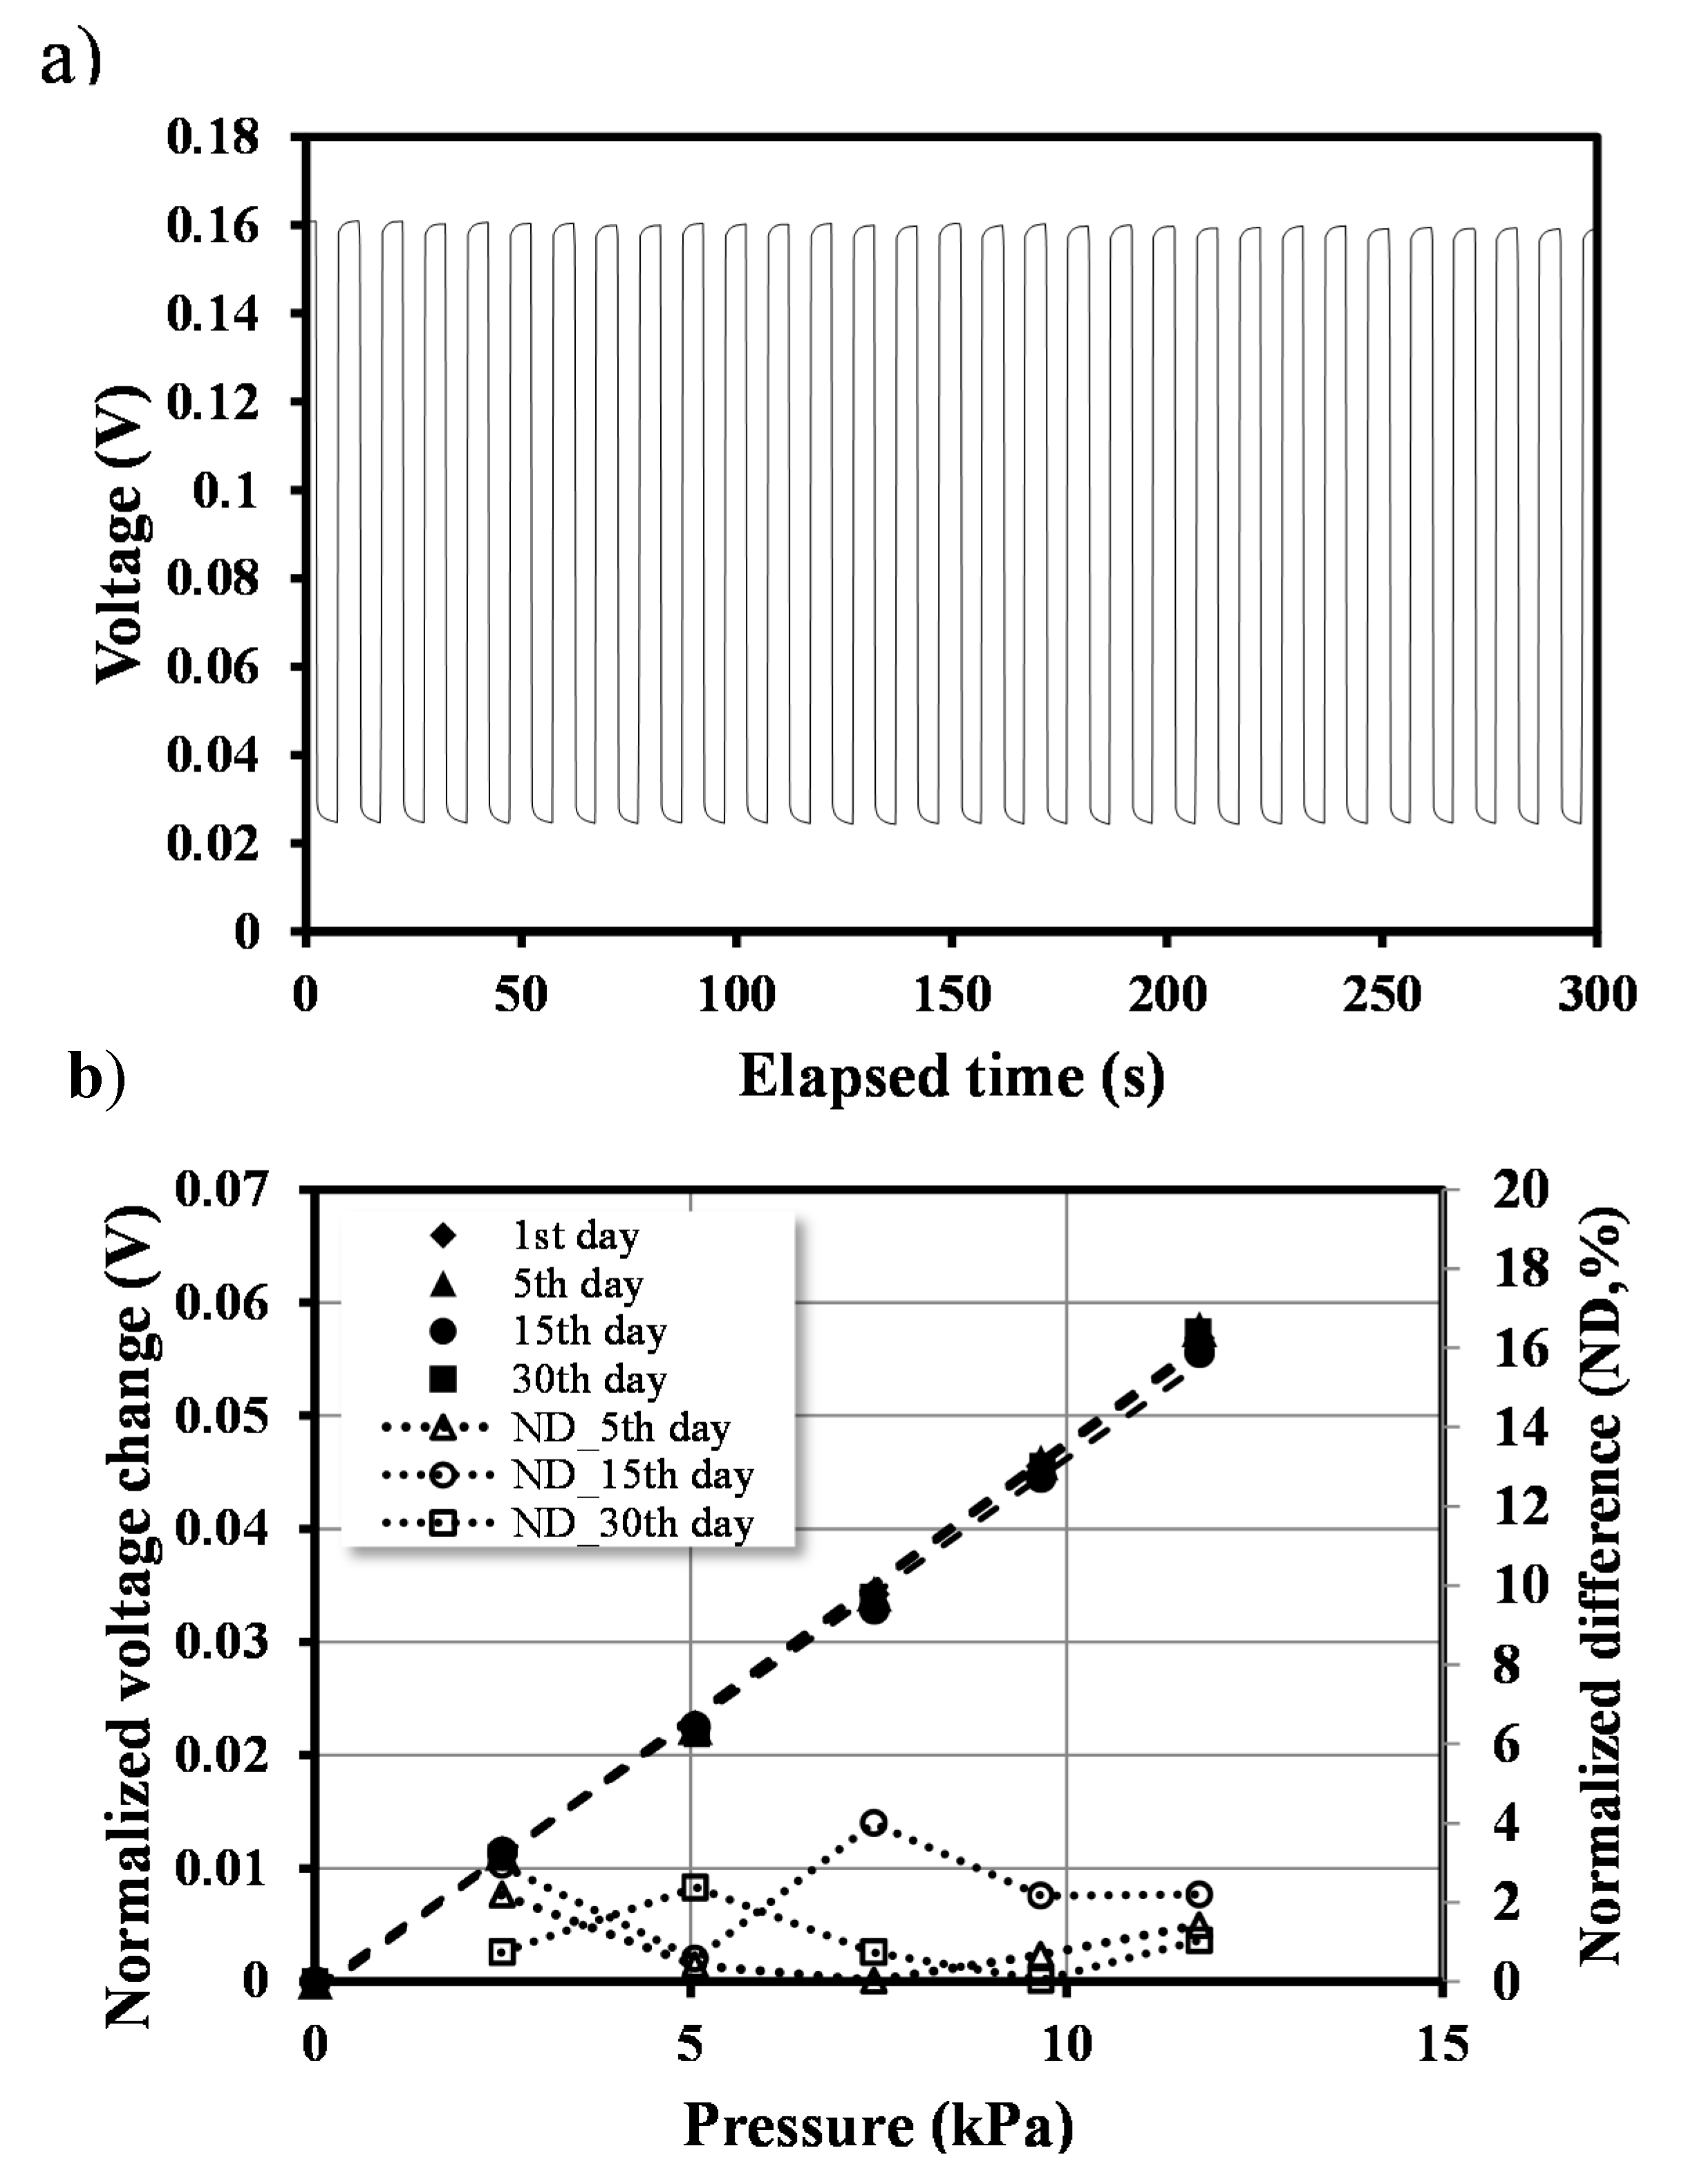
3.2. Long-Term Stability


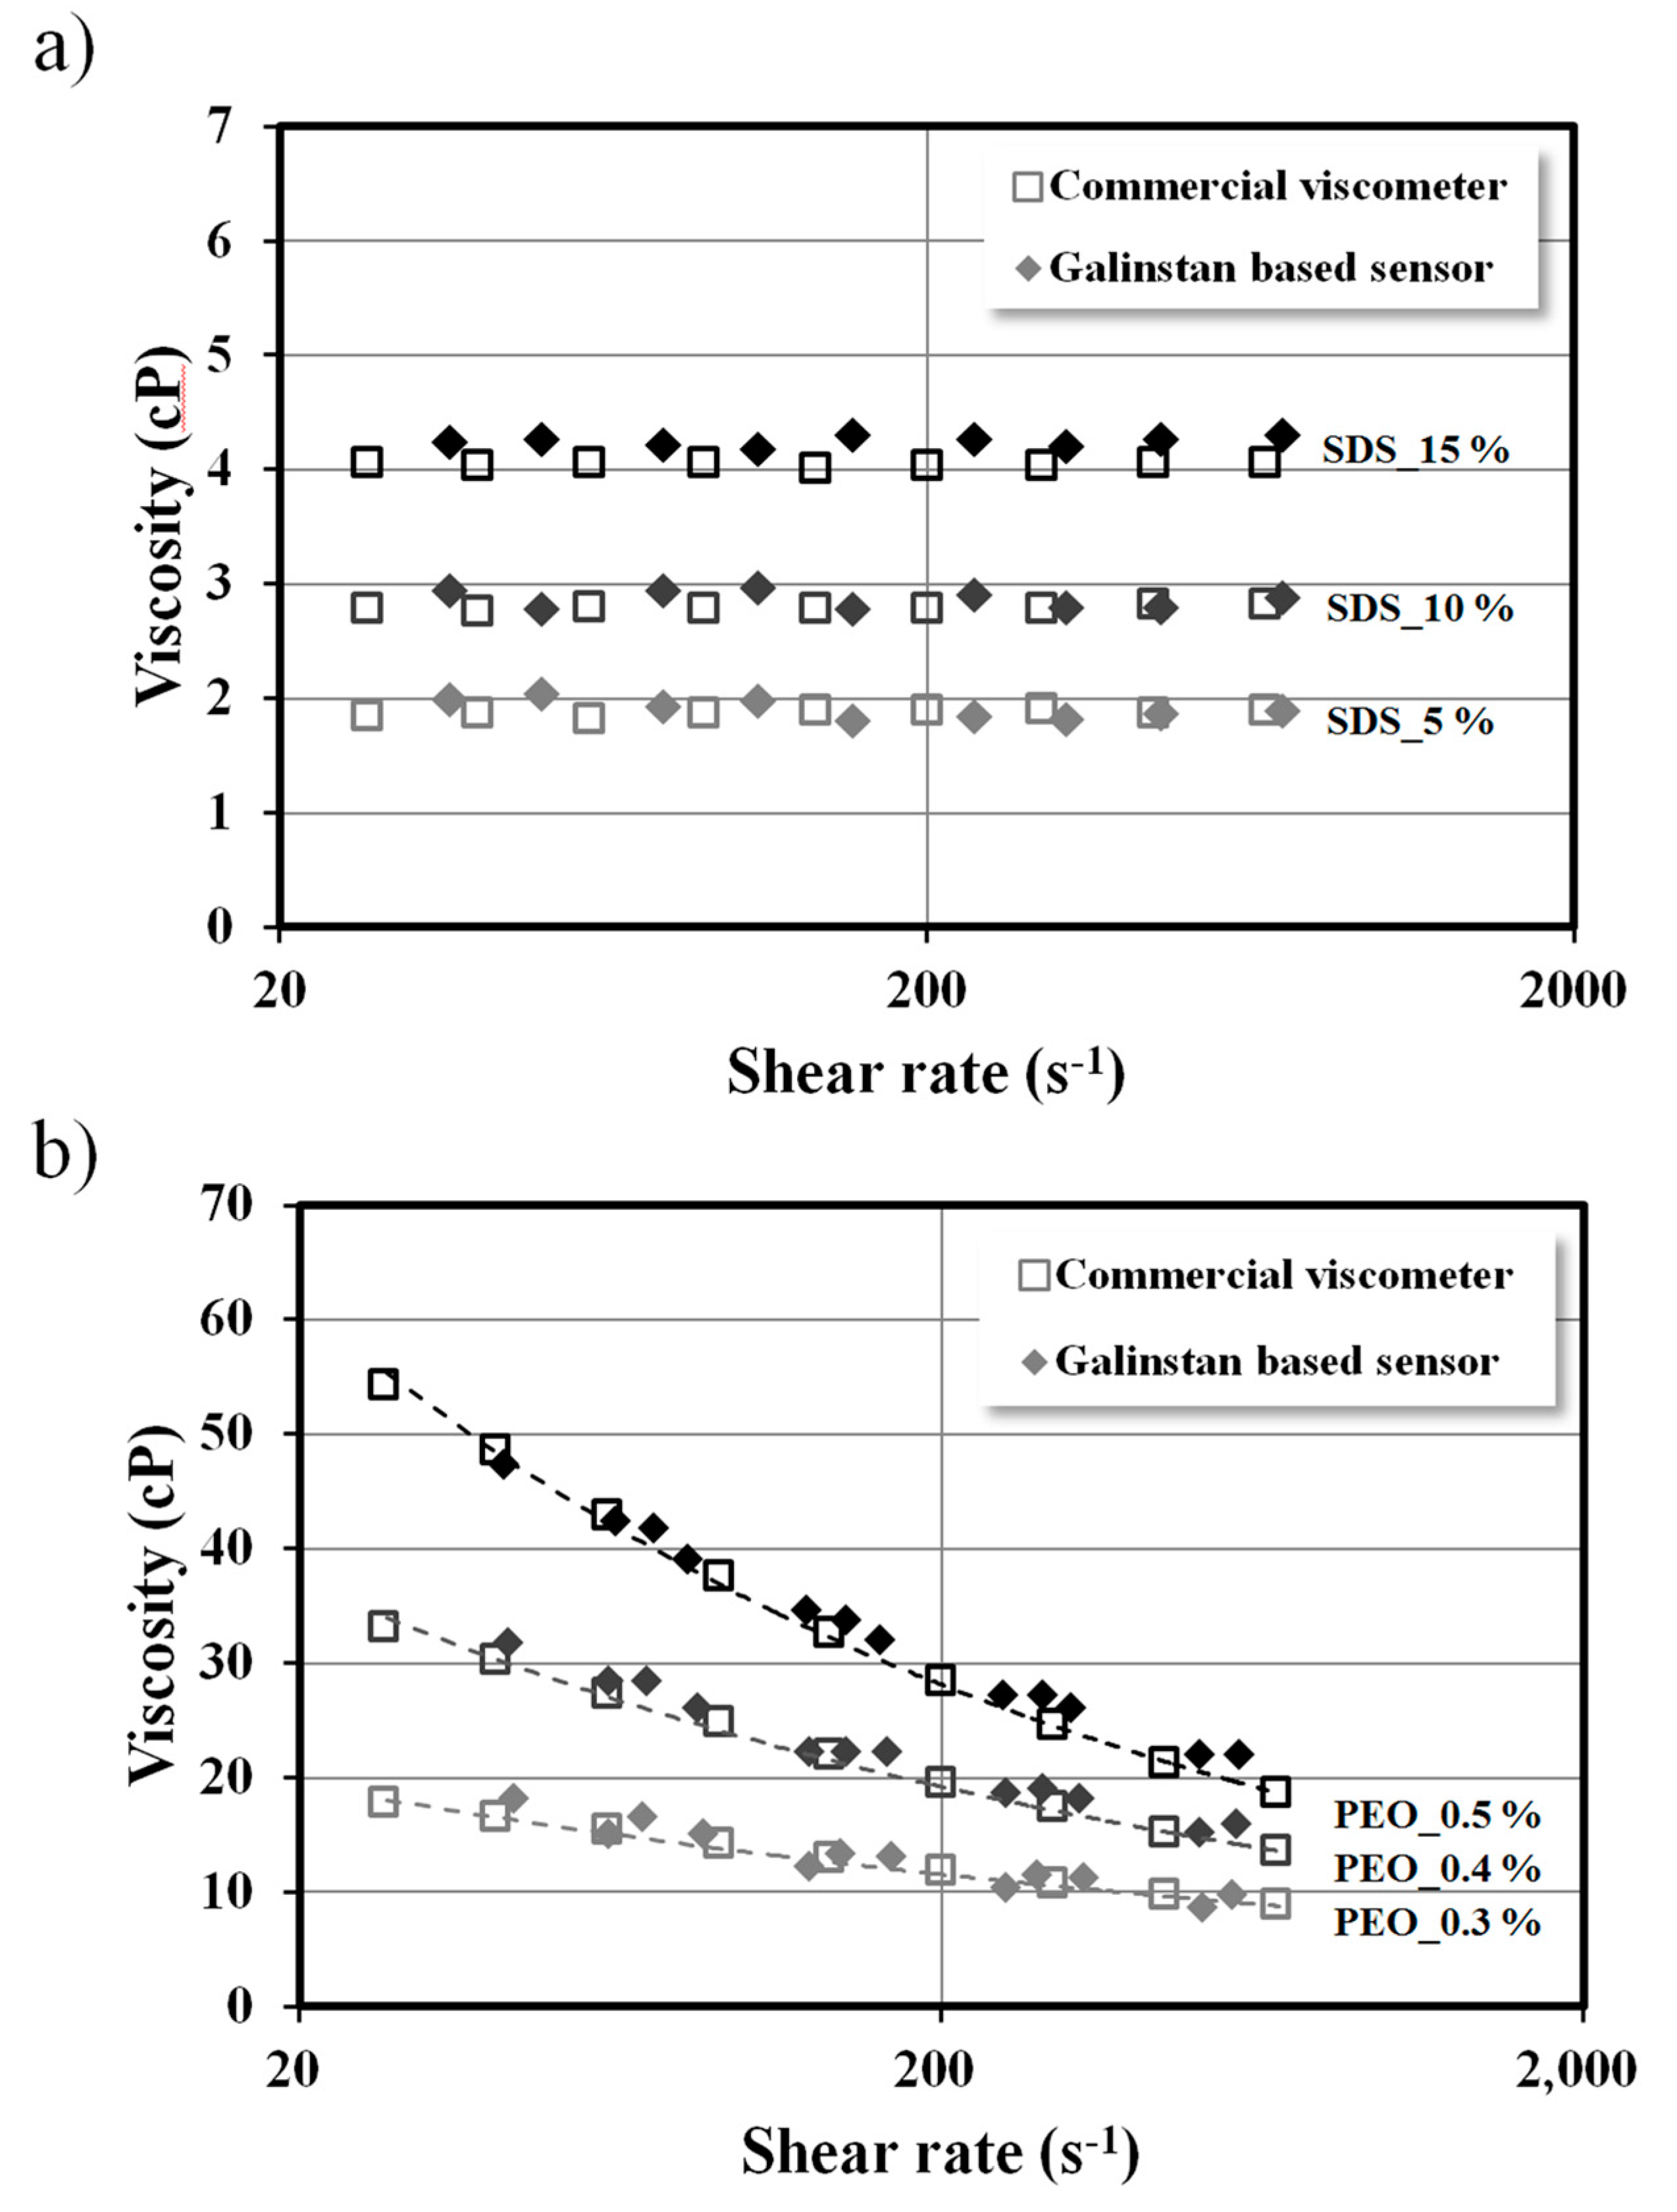
3.3. Viscosity Measurement

4. Conclusions
Acknowledgments
Author Contributions
Conflicts of Interest
References
- Wheeler, A.R.; Throndset, W.R.; Whelan, R.J.; Leach, A.M.; Zare, R.N.; Liao, Y.H.; Farrell, K.; Manger, I.D.; Daridon, A. Microfluidic Device for Single-Cell Analysis. Anal. Chem. 2003, 75, 3581–3586. [Google Scholar] [CrossRef] [PubMed]
- Gao, J.; Yin, X.F.; Fang, Z.L. Integration of Single Cell Injection, Cell Lysis, Separation and Detection of Intracellular Constituents on a Microfluidic Chip. Lab Chip 2004, 4, 47–52. [Google Scholar] [CrossRef] [PubMed]
- Chung, K.; Crane, M.M.; Lu, H. Automated on-Chip Rapid Microscopy, Phenotyping and Sorting of C. elegans. Nat. Method 2008, 5, 637–643. [Google Scholar] [CrossRef]
- Yeon, J.H.; Park, J.K. Microfluidic Cell Culture Systems for Cellular Analysis. Biochip J. 2007, 1, 17–27. [Google Scholar]
- Liu, M.C.; Shih, H.C.; Wu, J.G.; Weng, T.W.; Wu, C.Y.; Lu, J.C.; Tung, Y.C. Electrofluidic Pressure Sensor Embedded Microfluidic Device: A Study of Endothelial Cells Under Hydrostatic Pressure and Shear Stress Combinations. Lab Chip 2013, 13, 1743–1753. [Google Scholar] [CrossRef] [PubMed]
- Hohne, D.N.; Younger, J.G.; Solomon, M.J. Flexible Microfluidic Device for Mechanical Property Characterization of Soft Viscoelastic Solids such as Bacterial Biofilms. Langmuir 2009, 25, 7743–7751. [Google Scholar] [CrossRef] [PubMed]
- Shackman, J.G.; Dahlgren, G.M.; Peters, J.L.; Kennedy, R.T. Perfusion and Chemical Monitoring of Living Cells on a Microfluidic Chip. Lab Chip 2005, 5, 56–63. [Google Scholar] [CrossRef] [PubMed]
- Mestres-Ventura, P.; Morguet, A.; de las Heras, S.G. Multi-Sensor Arrays for Online Monitoring of Cell Dynamics in Vitro Studies with Choroid Plexus Epithelial Cells. Sensors 2012, 12, 1383–1397. [Google Scholar] [CrossRef] [PubMed]
- Chitnis, G.; Maleki, T.; Samuels, B.; Cantor, L.B.; Ziaie, B. A Minimally Invasive Implantable Wireless Pressure Sensor for Continuous IOP Monitoring. IEEE Trans. Biomed. Eng. 2013, 60, 250–256. [Google Scholar] [CrossRef] [PubMed]
- Varel, C.; Shih, Y.C.; Otis, B.P.; Shen, T.S.; Böhringer, K.F. A Wireless Intraocular Pressure Monitoring Device with a Solder-Filled Microchannel Antenna. J. Micromech. Microeng. 2014, 24, 045012. [Google Scholar] [CrossRef]
- Majerus, S.J.; Garverick, S.L.; Suster, M.A.; Fletter, P.C.; Damaser, M.S. Wireless, Ultra-Low-Power Implantable Sensor for Chronic Bladder Pressure Monitoring. ACM J. Emerg. Technol. Comput. Syst. 2012, 8, 11. [Google Scholar] [CrossRef]
- Chow, E.Y.; Chlebowski, A.L.; Chakraborty, S.; Chappell, W.J.; Irazoqui, P.P. Fully Wireless Implantable Cardiovascular Pressure Monitor Integrated with a Medical Stent. IEEE Trans. Biomed. Eng. 2010, 57, 1487–1496. [Google Scholar] [CrossRef] [PubMed]
- Springer, F.; Günther, R.W.; Schmitz-Rode, T. Aneurysm Sac Pressure Measurement with Minimally Invasive Implantable Pressure Sensors: An Alternative to Current Surveillance Regimes after EVAR? Cardiovas. Interv. Radiol. 2008, 31, 460–467. [Google Scholar] [CrossRef]
- Kohl, M.J.; Abdel-Khalik, S.I.; Jeter, S.M.; Sadowski, D.L. A Microfluidic Experimental Platform with Internal Pressure Measurements. Sens. Actuators A Phys. 2005, 118, 212–221. [Google Scholar] [CrossRef]
- Wang, X.; Xu, J.; Zhu, Y.; Cooper, K.L.; Wang, A. All-Fused-Silica Miniature Optical Fiber Tip Pressure Sensor. Opt. Lett. 2006, 31, 885–887. [Google Scholar] [CrossRef] [PubMed]
- Orth, A.; Schonbrun, E.; Crozier, K.B. Multiplexed Pressure Sensing with Elastomer Membranes. Lab Chip 2011, 11, 3810–3815. [Google Scholar] [CrossRef] [PubMed]
- Song, W.; Psaltis, D. Optofluidic Pressure Sensor Based on Interferometric Imaging. Opt. Lett. 2010, 35, 3604–3606. [Google Scholar] [CrossRef] [PubMed]
- Padron, I.; Fiory, A.T.; Ravindra, N.M. Integrated Optical and Electronic Pressure Sensor. IEEE Sens. J. 2011, 11, 343–350. [Google Scholar] [CrossRef]
- Wang, Q.; Zhang, L.; Sun, C.; Yu, Q. Multiplexed Fiber-Optic Pressure and Temperature Sensor System for Down-Hole Measurement. IEEE Sens. J. 2008, 8, 1879–1883. [Google Scholar] [CrossRef]
- Abkarian, M.; Faivre, M.; Stone, H.A. High-Speed Microfluidic Differential Manometer for Cellular-Scale Hydrodynamics. Proc. Natl. Acad. Sci. USA 2006, 103, 538–542. [Google Scholar] [CrossRef] [PubMed]
- Chung, K.; Lee, H.; Lu, H. Multiplex Pressure Measurement in Microsystems Using Volume Displacement of Particle Suspensions. Lab Chip 2009, 9, 3345–3353. [Google Scholar] [CrossRef] [PubMed]
- Lee, H.K.; Chang, S.I.; Yoon, E. A Flexible Polymer Tactile Sensor: Fabrication and Modular Expandability for Large Area Deployment. J. Microelectromech. Syst. 2006, 15, 1681–1686. [Google Scholar] [CrossRef]
- Kang, D.; Pikhitsa, P.V.; Choi, Y.W.; Lee, C.; Shin, S.S.; Piao, L.; Park, B.; Suh, K.Y.; Kim, T.I.; Choi, M. Ultrasensitive Mechanical Crack-Based Sensor Inspired by the Spider Sensory System. Nature 2014, 516, 222–226. [Google Scholar] [CrossRef] [PubMed]
- Dai, C.L.; Lu, P.W.; Chang, C.; Liu, C.Y. Capacitive Micro Pressure Sensor Integrated with a Ring Oscillator Circuit on Chip. Sensors 2009, 9, 10158–10170. [Google Scholar] [CrossRef] [PubMed]
- Lee, D.W.; Choi, Y.S. A Novel Pressure Sensor with a PDMS Diaphragm. Microelectron. Eng. 2008, 85, 1054–1058. [Google Scholar] [CrossRef]
- Wang, L.; Zhang, M.; Yang, M.; Zhu, W.; Wu, J.; Gong, X.; Wen, W. Polydimethylsiloxane-Integratable Micropressure Sensor for Microfluidic Chips. Biomicrofluidics 2009, 3, 034105. [Google Scholar] [CrossRef]
- Liu, X.; Zhu, Y.; Nomani, M.W.; Wen, X.; Hsia, T.Y.; Koley, G. A Highly Sensitive Pressure Sensor Using a Au-Patterned Polydimethylsiloxane Membrane for Biosensing Applications. J. Micromech. Microeng. 2013, 23, 025022. [Google Scholar] [CrossRef]
- Tian, B.; Zhao, Y.; Jiang, Z.; Zhang, L.; Liao, N.; Liu, Y.; Meng, C. Fabrication and Structural Design of Micro Pressure Sensors for Tire Pressure Measurement Systems (TPMS). Sensors 2009, 9, 1382–1393. [Google Scholar] [CrossRef] [PubMed]
- Cheng, S.; Wu, Z. Microfluidic Stretchable RF Electronics. Lab Chip 2010, 10, 3227–3234. [Google Scholar] [CrossRef] [PubMed]
- Ota, H.; Chen, K.; Lin, Y.; Kiriya, D.; Shiraki, H.; Yu, Z.; Ha, T.J.; Javey, A. Highly Deformable Liquid-State Heterojunction Sensors. Nat. Commun. 2014, 5, 5032. [Google Scholar] [CrossRef] [PubMed]
- Tabatabai, A.; Fassler, A.; Usiak, C.; Majidi, C. Liquid-Phase Gallium-Indium Alloy Electronics with Microcontact Printing. Langmuir ACS J. Surf. Coll. 2013, 29, 6194–6200. [Google Scholar] [CrossRef]
- So, J.H.; Dickey, M.D. Inherently Aligned Microfluidic Electrodes Composed of Liquid Metal. Lab Chip 2011, 11, 905–911. [Google Scholar] [CrossRef] [PubMed]
- Tang, S.Y.; Khoshmanesh, K.; Sivan, V.; Petersen, P.; O’Mullane, A.P.; Abbott, D.; Mitchell, A.; Kalantar-zadeh, K. Liquid Metal Enabled Pump. Proc. Natl Acad. Sci. 2014, 111, 3304–3309. [Google Scholar] [CrossRef] [PubMed]
- Hardy, B.S.; Uechi, K.; Zhen, J.; Kavehpour, H.P. The Deformation of Flexible PDMS Microchannels Under a Pressure Driven Flow. Lab Chip 2009, 9, 935–938. [Google Scholar] [CrossRef] [PubMed]
- Lötters, J.C.; Olthuis, W.; Veltink, P.H.; Bergveld, P. The Mechanical Properties of the Rubber Elastic Polymer Polydimethylsiloxane for Sensor Applications. J. Micromech. Microeng. 1997, 7, 145–147. [Google Scholar] [CrossRef]
- Nguyen, N.T.; Wereley, S.T. Fundamentals and Applications of Microfluidics; Artech House: Boston, MA, USA, 2002. [Google Scholar]
- Dickey, M.D.; Chiechi, R.C.; Larsen, R.J.; Weiss, E.A.; Weitz, D.A.; Whitesides, G.M. Eutectic Gallium-Indium (EGaIn): A Liquid Metal Alloy for the Formation of Stable Structures in Microchannels at Room Temperature. Adv. Funct. Mater. 2008, 18, 1097–1104. [Google Scholar] [CrossRef]
- Li, G.; Parmar, M.; Kim, D.; Lee, J.B.; Lee, D.W. PDMS Based Coplanar Microfluidic Channels for the Surface Reduction of Oxidized Galinstan. Lab Chip 2014, 14, 200–209. [Google Scholar] [CrossRef] [PubMed]
© 2015 by the authors; licensee MDPI, Basel, Switzerland. This article is an open access article distributed under the terms and conditions of the Creative Commons Attribution license (http://creativecommons.org/licenses/by/4.0/).
Share and Cite
Jung, T.; Yang, S. Highly Stable Liquid Metal-Based Pressure Sensor Integrated with a Microfluidic Channel. Sensors 2015, 15, 11823-11835. https://doi.org/10.3390/s150511823
Jung T, Yang S. Highly Stable Liquid Metal-Based Pressure Sensor Integrated with a Microfluidic Channel. Sensors. 2015; 15(5):11823-11835. https://doi.org/10.3390/s150511823
Chicago/Turabian StyleJung, Taekeon, and Sung Yang. 2015. "Highly Stable Liquid Metal-Based Pressure Sensor Integrated with a Microfluidic Channel" Sensors 15, no. 5: 11823-11835. https://doi.org/10.3390/s150511823