
Measuring Kinematic Variables in Front Crawl Swimming Using Accelerometers: A Validation Study

Abstract
:
1. Introduction


| Author(s) | Number of Sensors | Location(s) | Sensor Type | Lap Time | Velocity | Stroke Rate | Stroke Count | Breathing side | Distance Per Stroke | Stroke Duration | Kick Count | Fatigue | Hand Pitch at Entry | 3D Display of Stroke | Upper Body Roll Angle | Lower Body Angle | Body Roll Timing | Body Pitch | Body Roll | Velocity | Stroke Phases | IdC | Symmetry | Body Roll Consistency | Output for Coach |
|---|---|---|---|---|---|---|---|---|---|---|---|---|---|---|---|---|---|---|---|---|---|---|---|---|---|
| Ohgi et al. [10] | 1 | LW | A | ⏍ | ⏍ | ||||||||||||||||||||
| Ohgi et al. [11] | 1 | LW | A | ⏍ | ⏍ | ||||||||||||||||||||
| Ohgi and Ichikawa [12] | 1 | LW | B | ⏍ | ⏍ | ⏍ | |||||||||||||||||||
| Ichikawa et al. [13] | 1 | LW | B | ||||||||||||||||||||||
| Ichikawa, et al. [14] | 1 | LW | B | ||||||||||||||||||||||
| Davey, Anderson and James [15] | 1 | LB | A | ⏍◊ | ⏍◊ | ⏍◊ | |||||||||||||||||||
| Daukantas et al. [16] | 1 | LB | A | ⏍ | ⏍* | ||||||||||||||||||||
| Fulton et al. [17] | 1 | Thigh | G | ⏍◊ | |||||||||||||||||||||
| Bächlin et al. [18], Bächlin and Tröster [19], Bächlin and Tröster [20] | 4 | LW, RW, UB, LB | A | ⏍ | ⏍ | ⏍ | ⏍ | ⏍ | ⏍ | ⏍* | ⏍* | ⏍* | ⏍* | ||||||||||||
| Pansiot et al. [21] | 1 | Head | A | ⏍ | ⏍ | ⏍ | ⏍ | ||||||||||||||||||
| Nakashima et al. [22] | 1 | LW | B | ⏍* | |||||||||||||||||||||
| Le Sage, Justham, Slawson and West [23] | 1 | LB | B | ⏍◊ | ⏍◊ | ⏍◊ | ⏍ | ||||||||||||||||||
| Stamm et al. [24] | 1 | LB | B | ⏍◊ | |||||||||||||||||||||
| Stamm et al. [25] | 1 | LB | B | ⏍◊ | |||||||||||||||||||||
| Dadashi et al. [26,27] | 3 | LW, RW, LB | B | ⏍◊ | ⏍◊ | ⏍◊ | ⏍◊ |
“...demands of the swimming coach and athlete, objective data on the swim performance is required”
2. Method
2.1. Participants
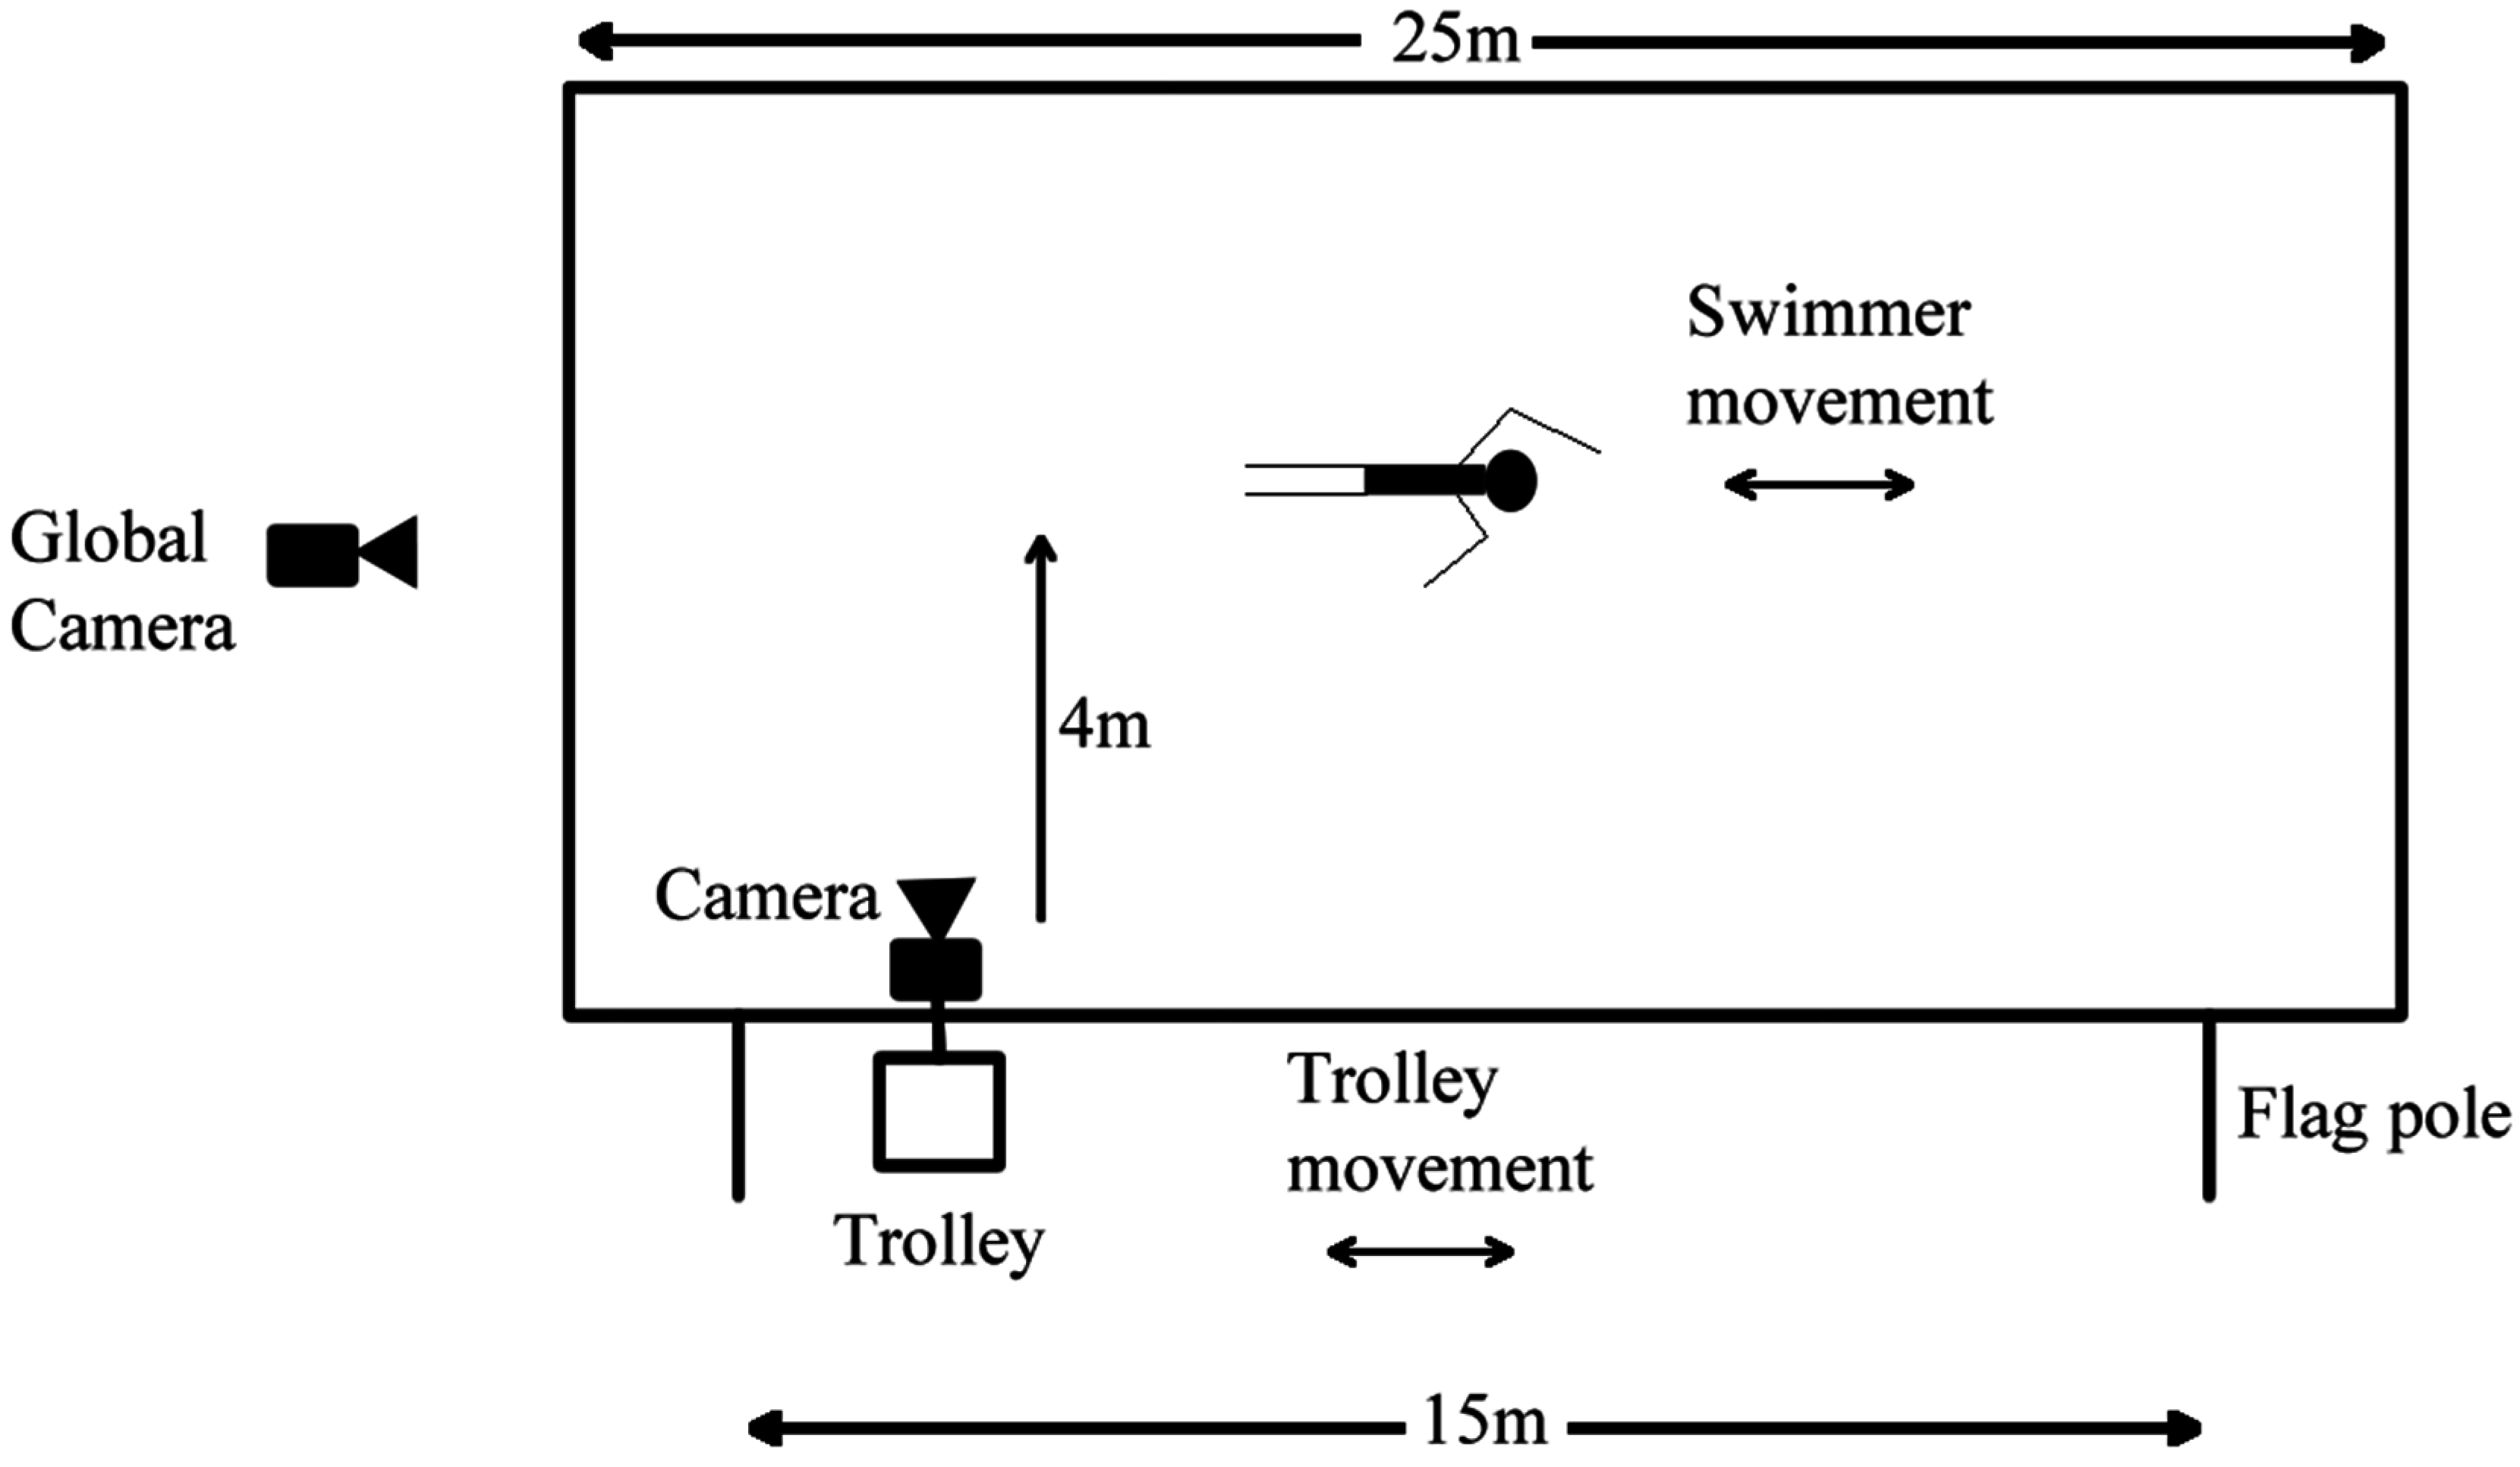
2.2. Experimental Setup
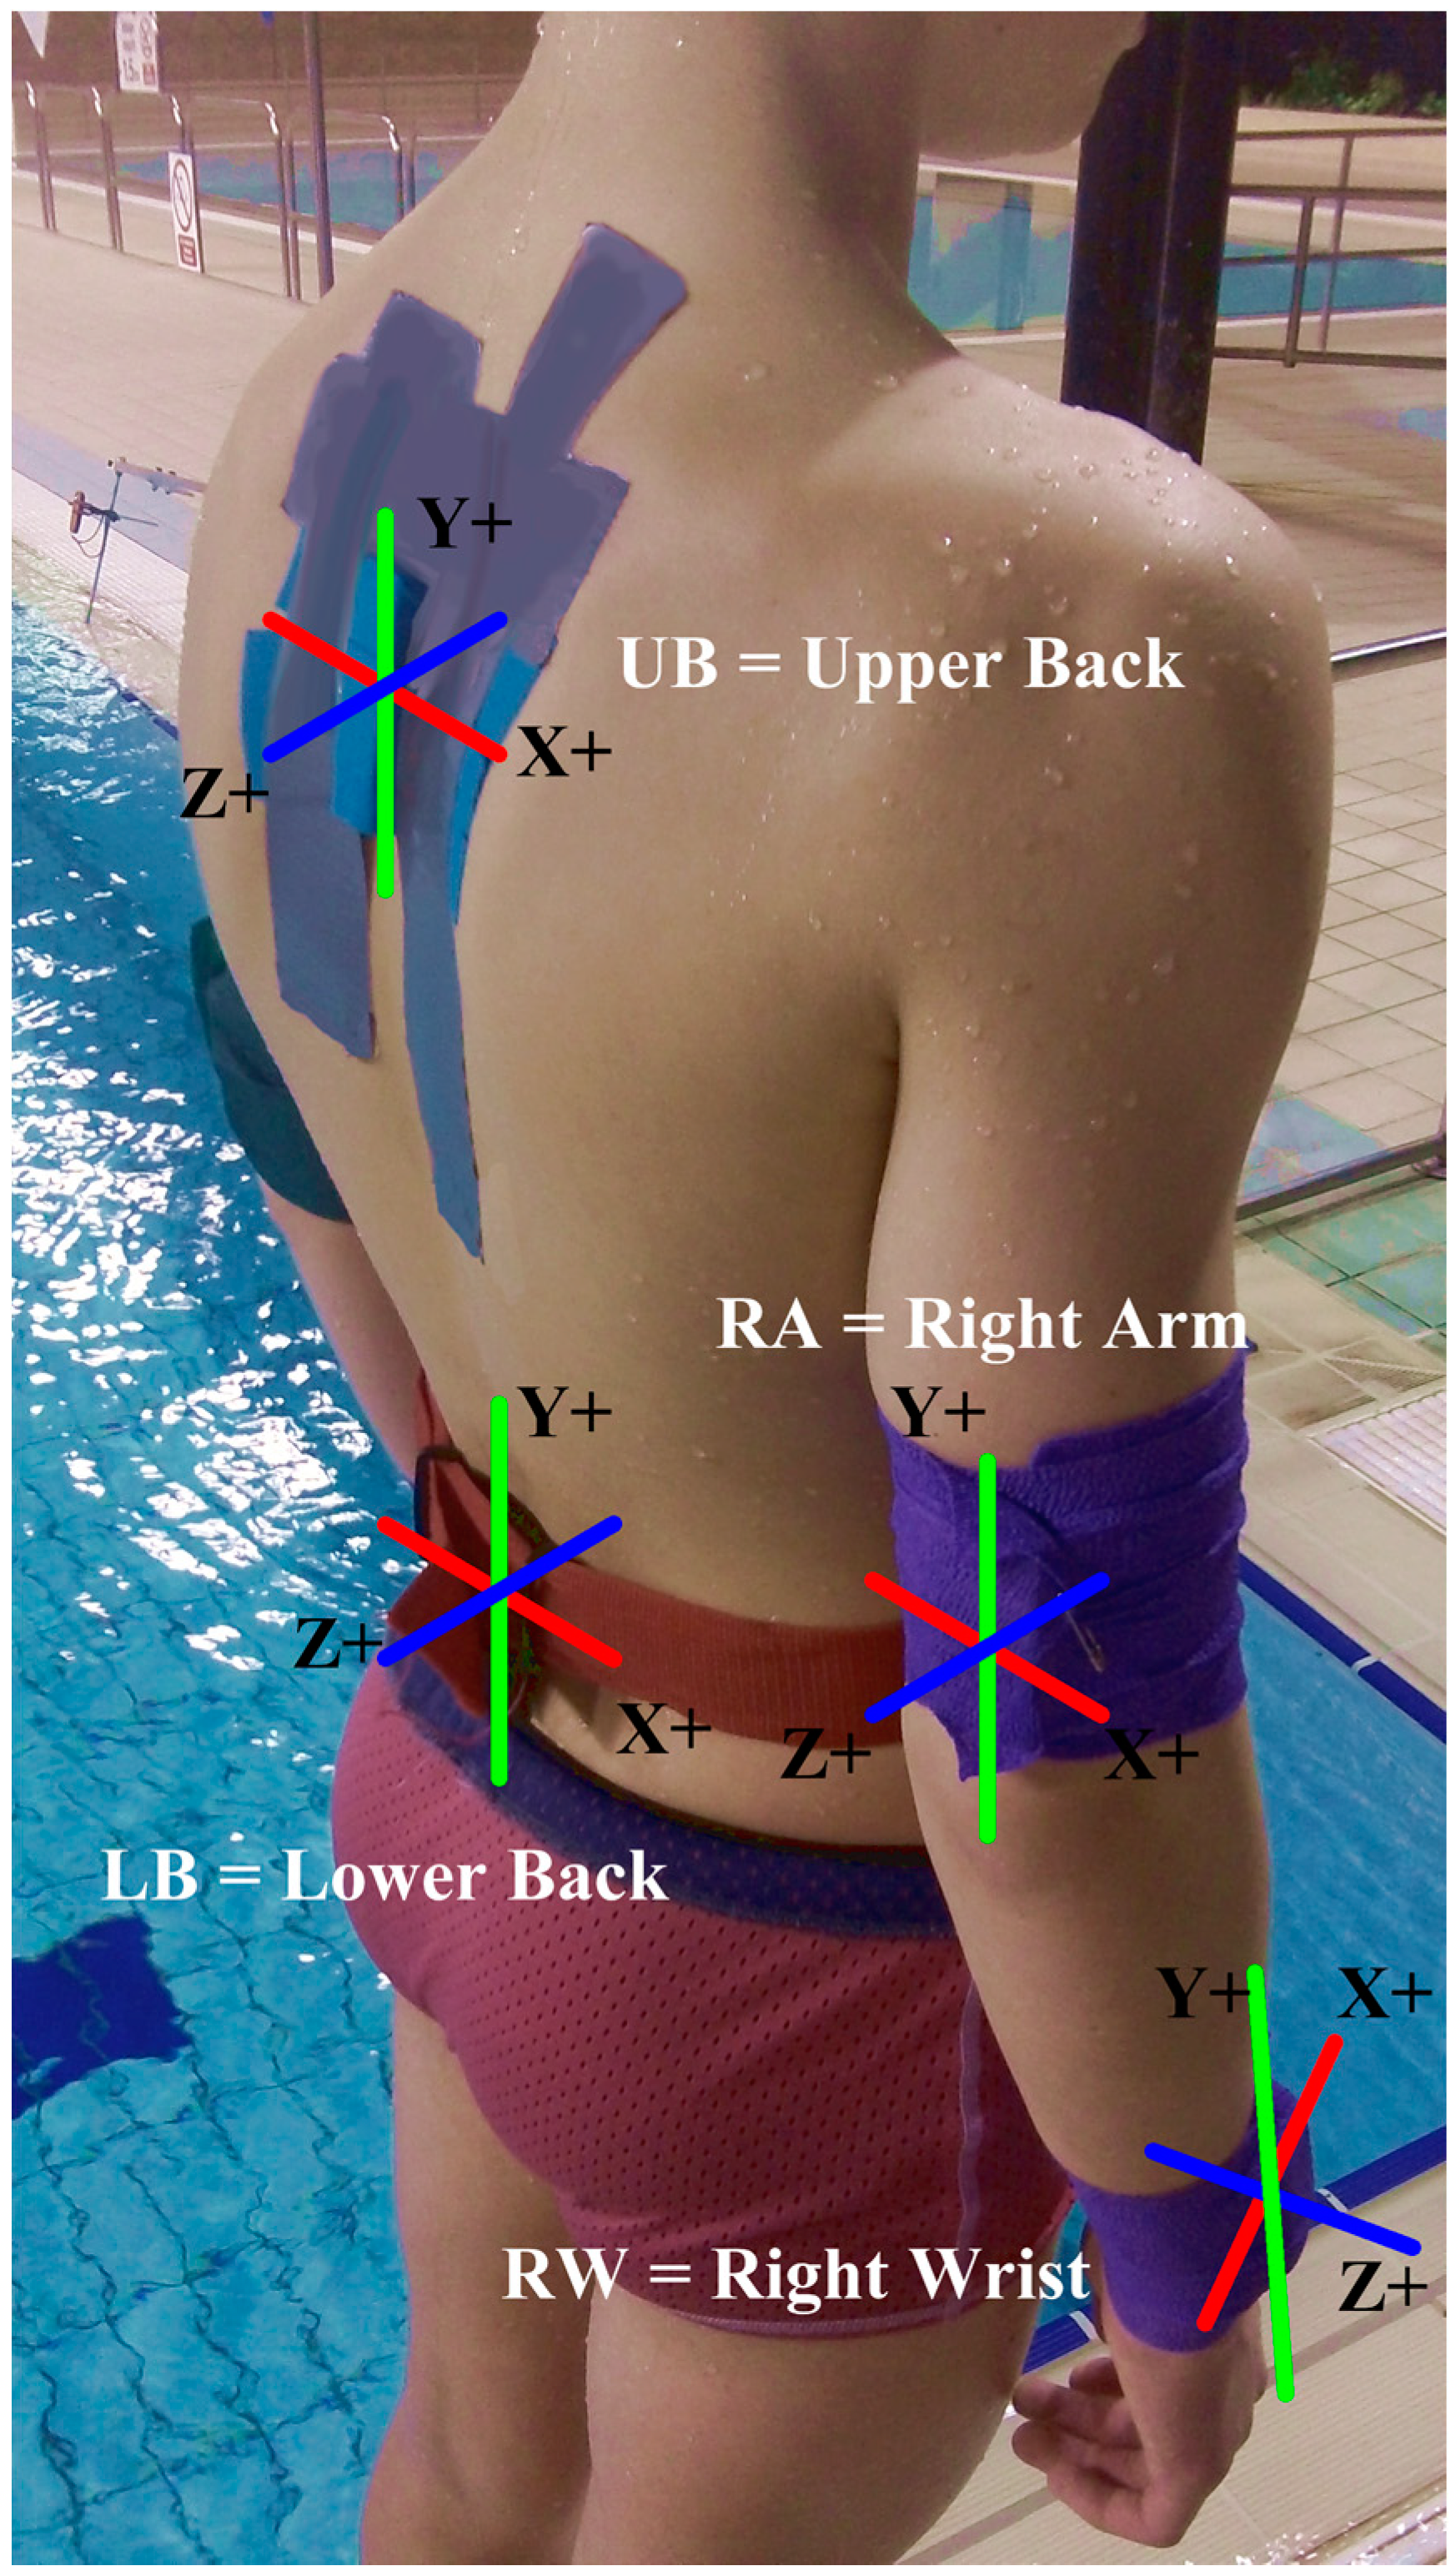
2.3. Devices
2.4. Calculation Methods of Factors Recorded
| Equation | Variable | Calculation Method |
|---|---|---|
| 1 | Lap Time | Wall push off from lower back y axis |
| 2 | Velocity | |
| 3 | Stroke Count | Peak Detection Wrist x axis |
| 4 | Stroke Duration | |
| 5 | Stroke Rate | |
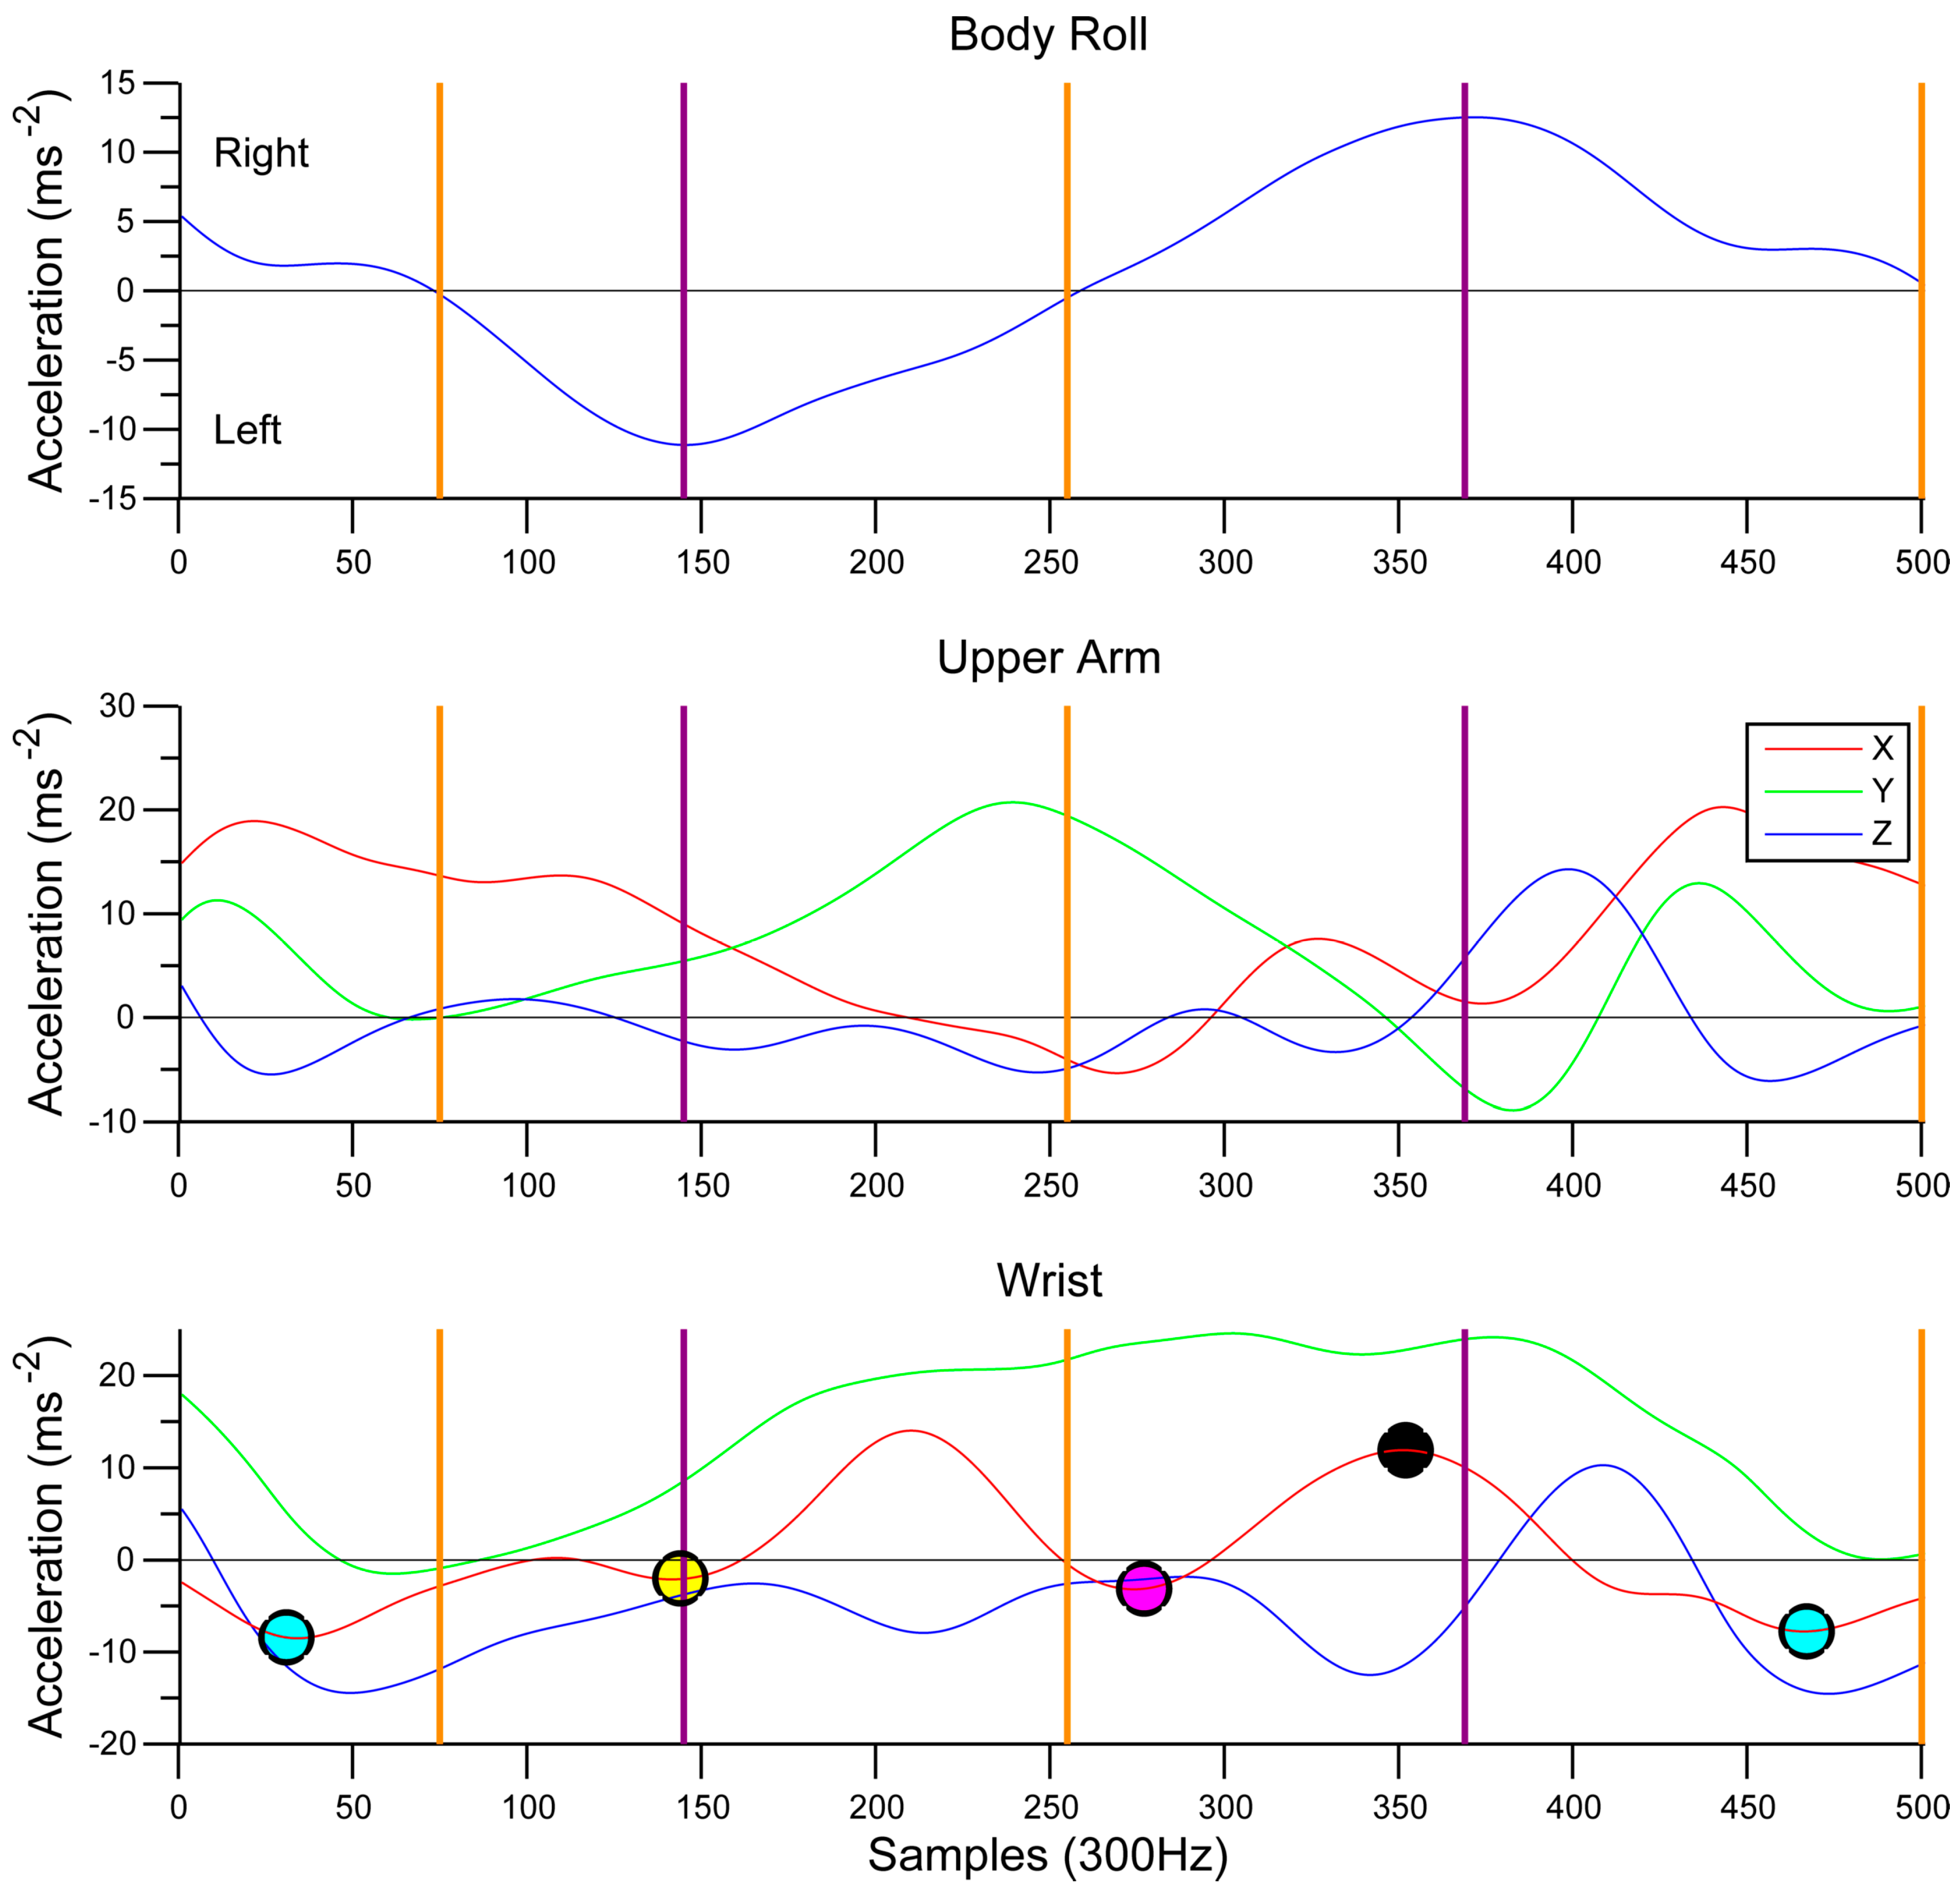
| 6 | Phases of the Stroke | Wrist Sensors in relation to Body Roll |
2.4.1. Lap Time
2.4.2. Stroke Count
2.4.3. Stroke Rate and Duration
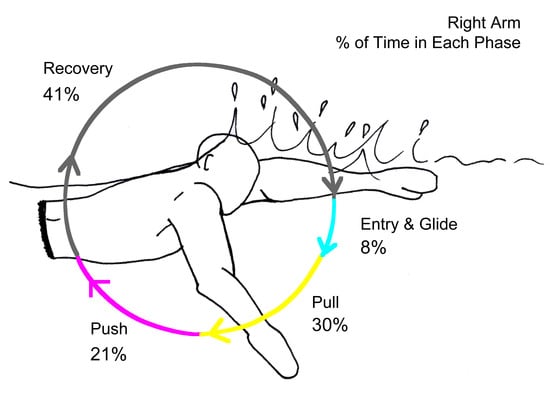
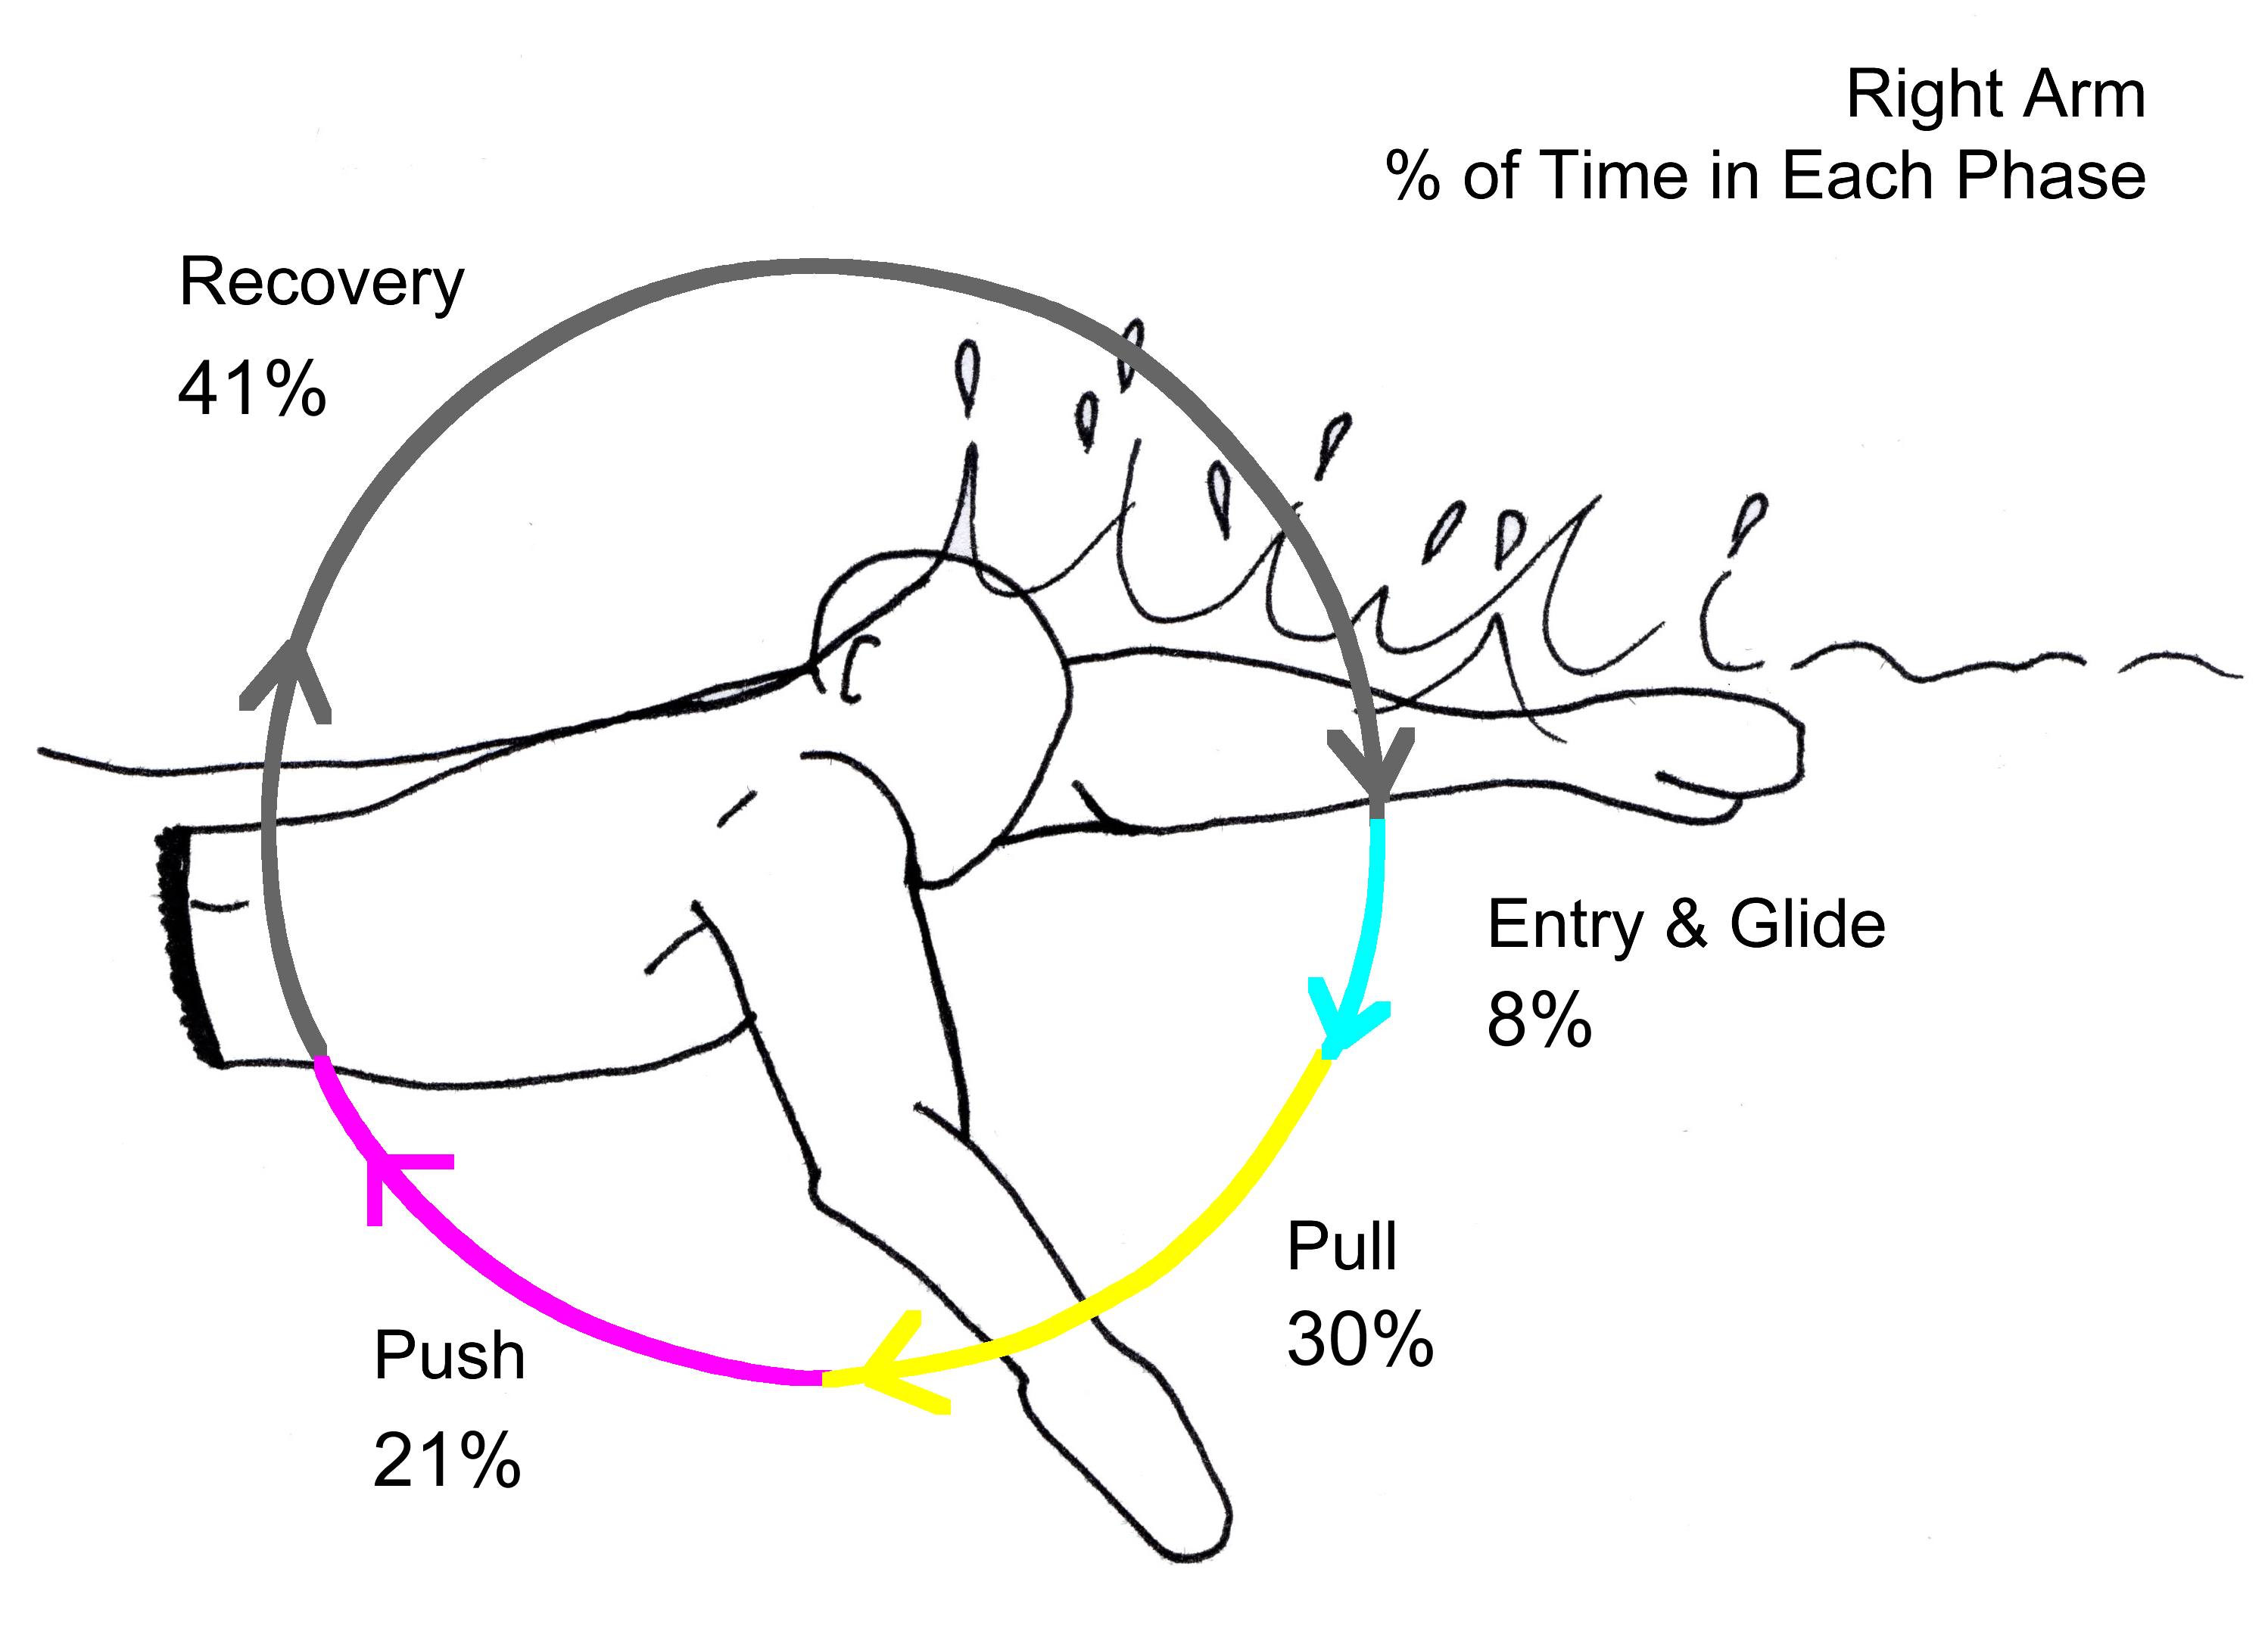
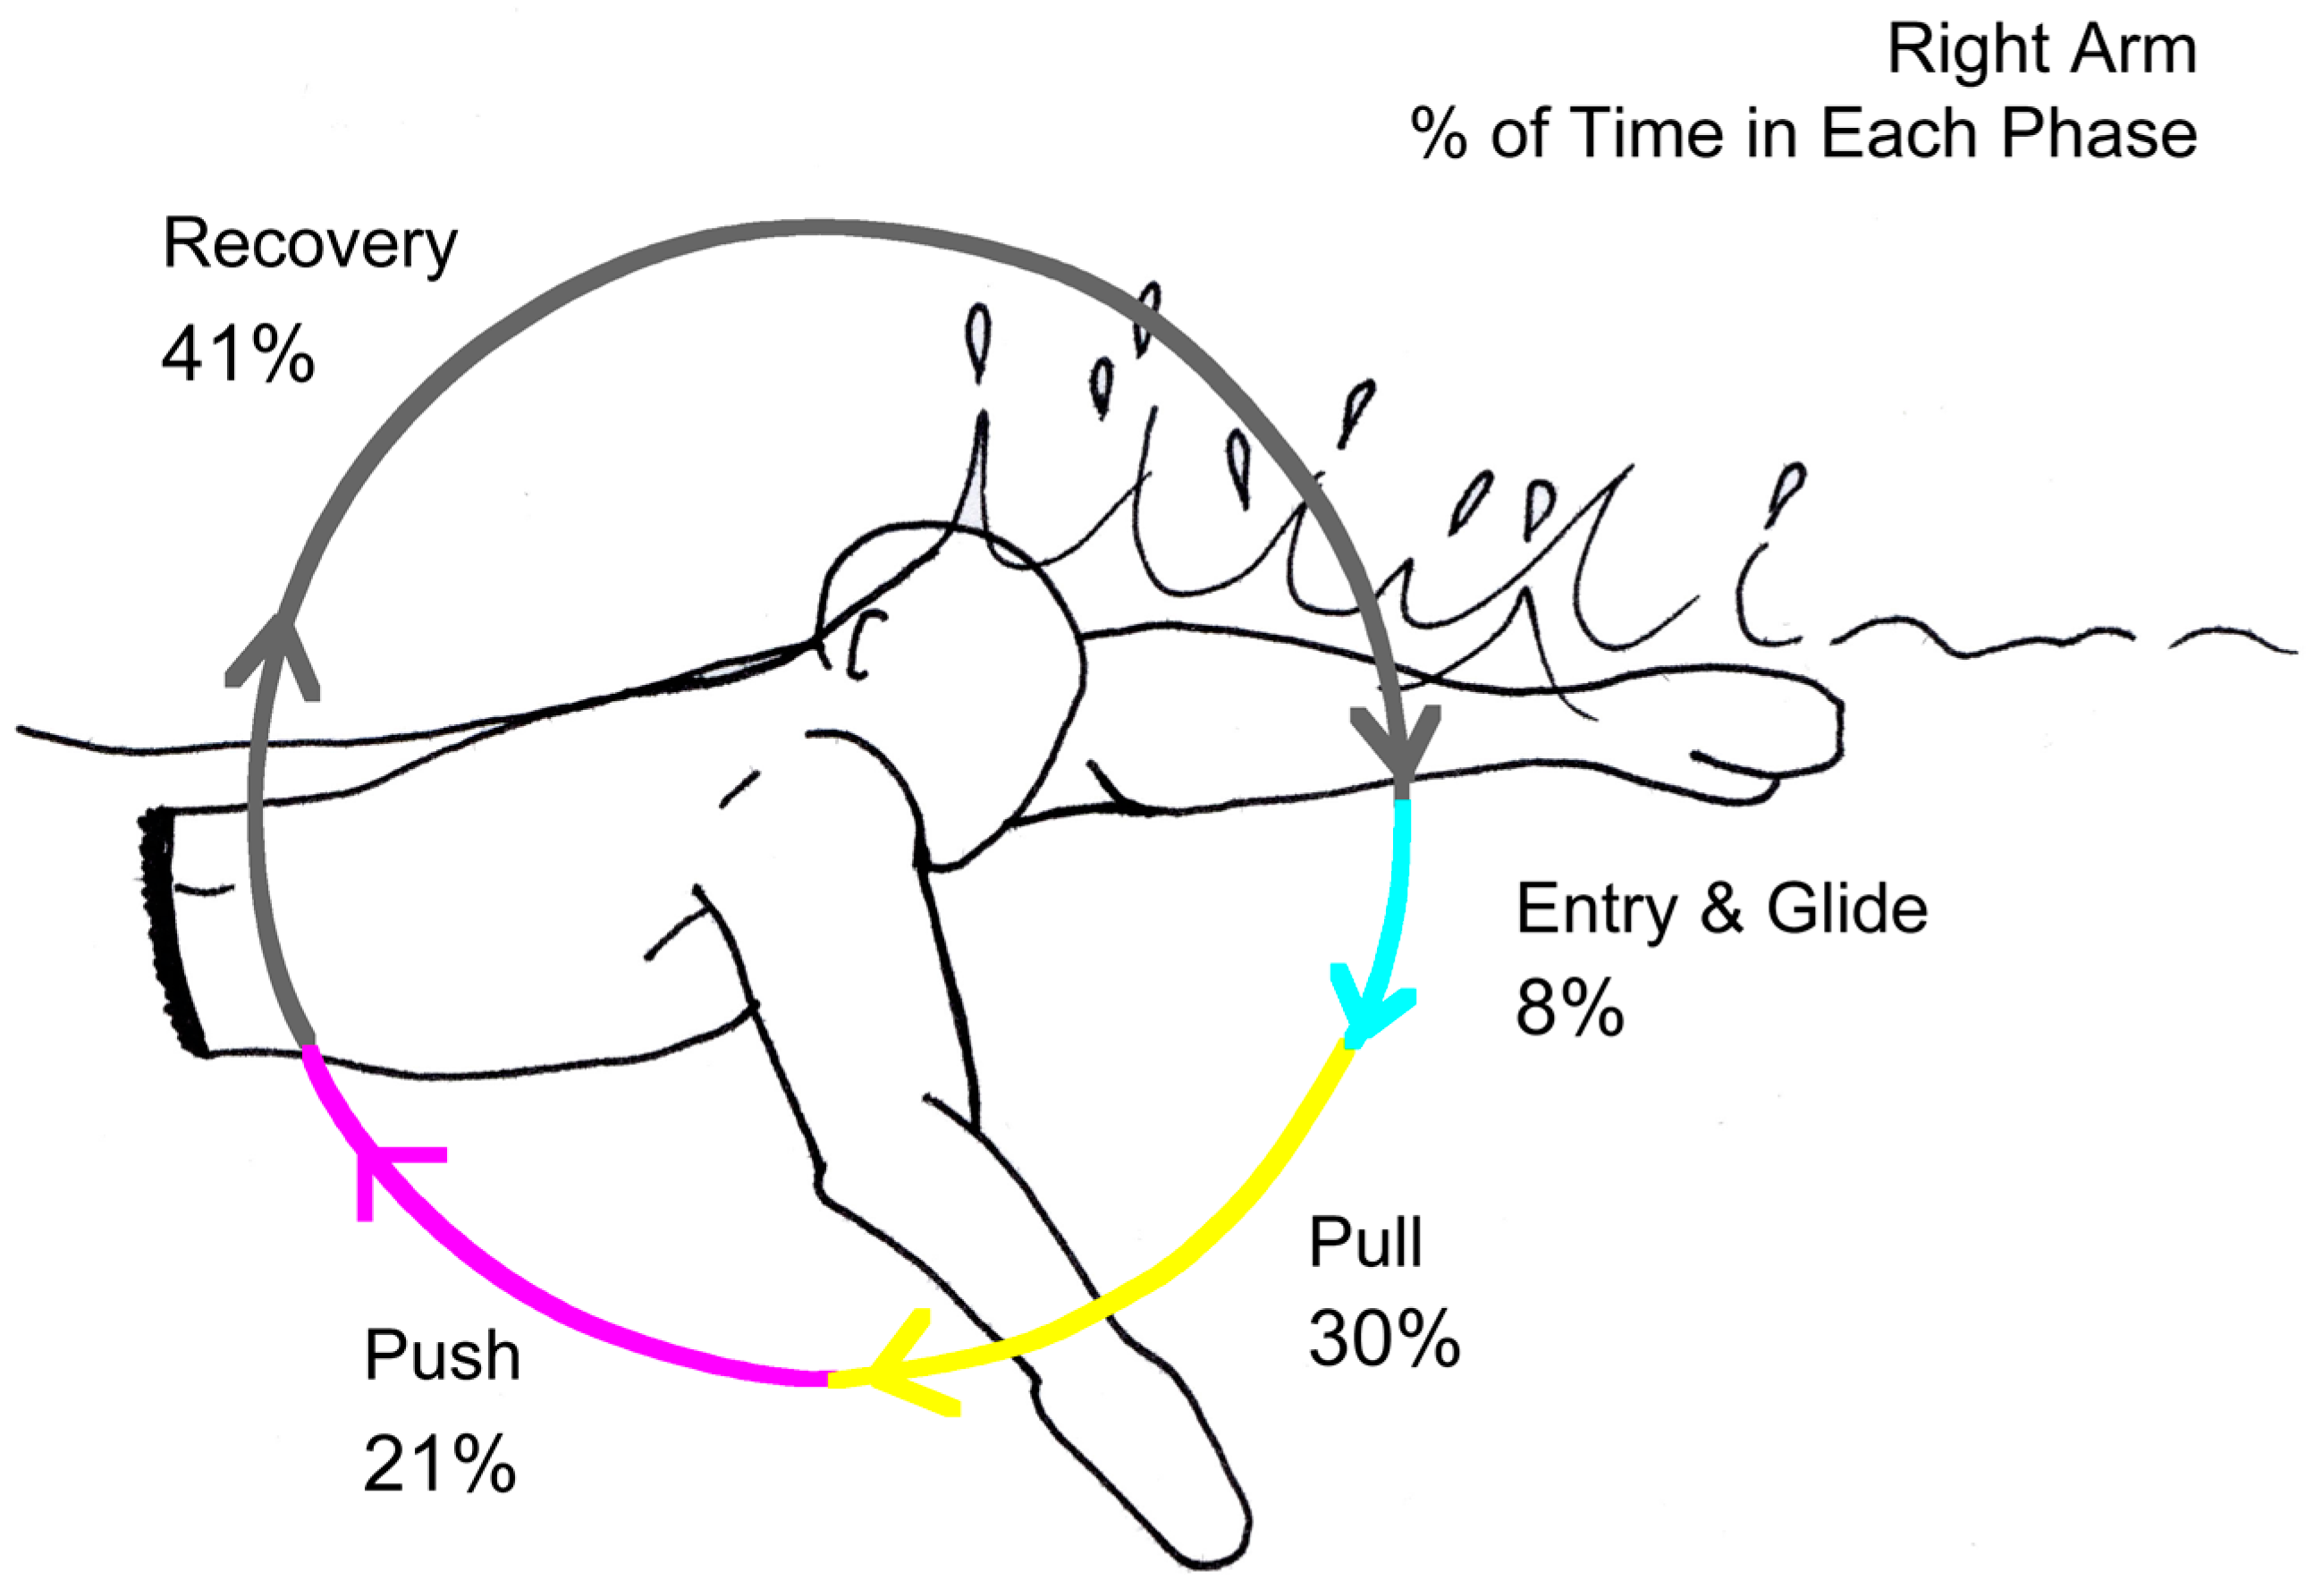
2.4.4. Stroke Phases
3. Results and Discussion
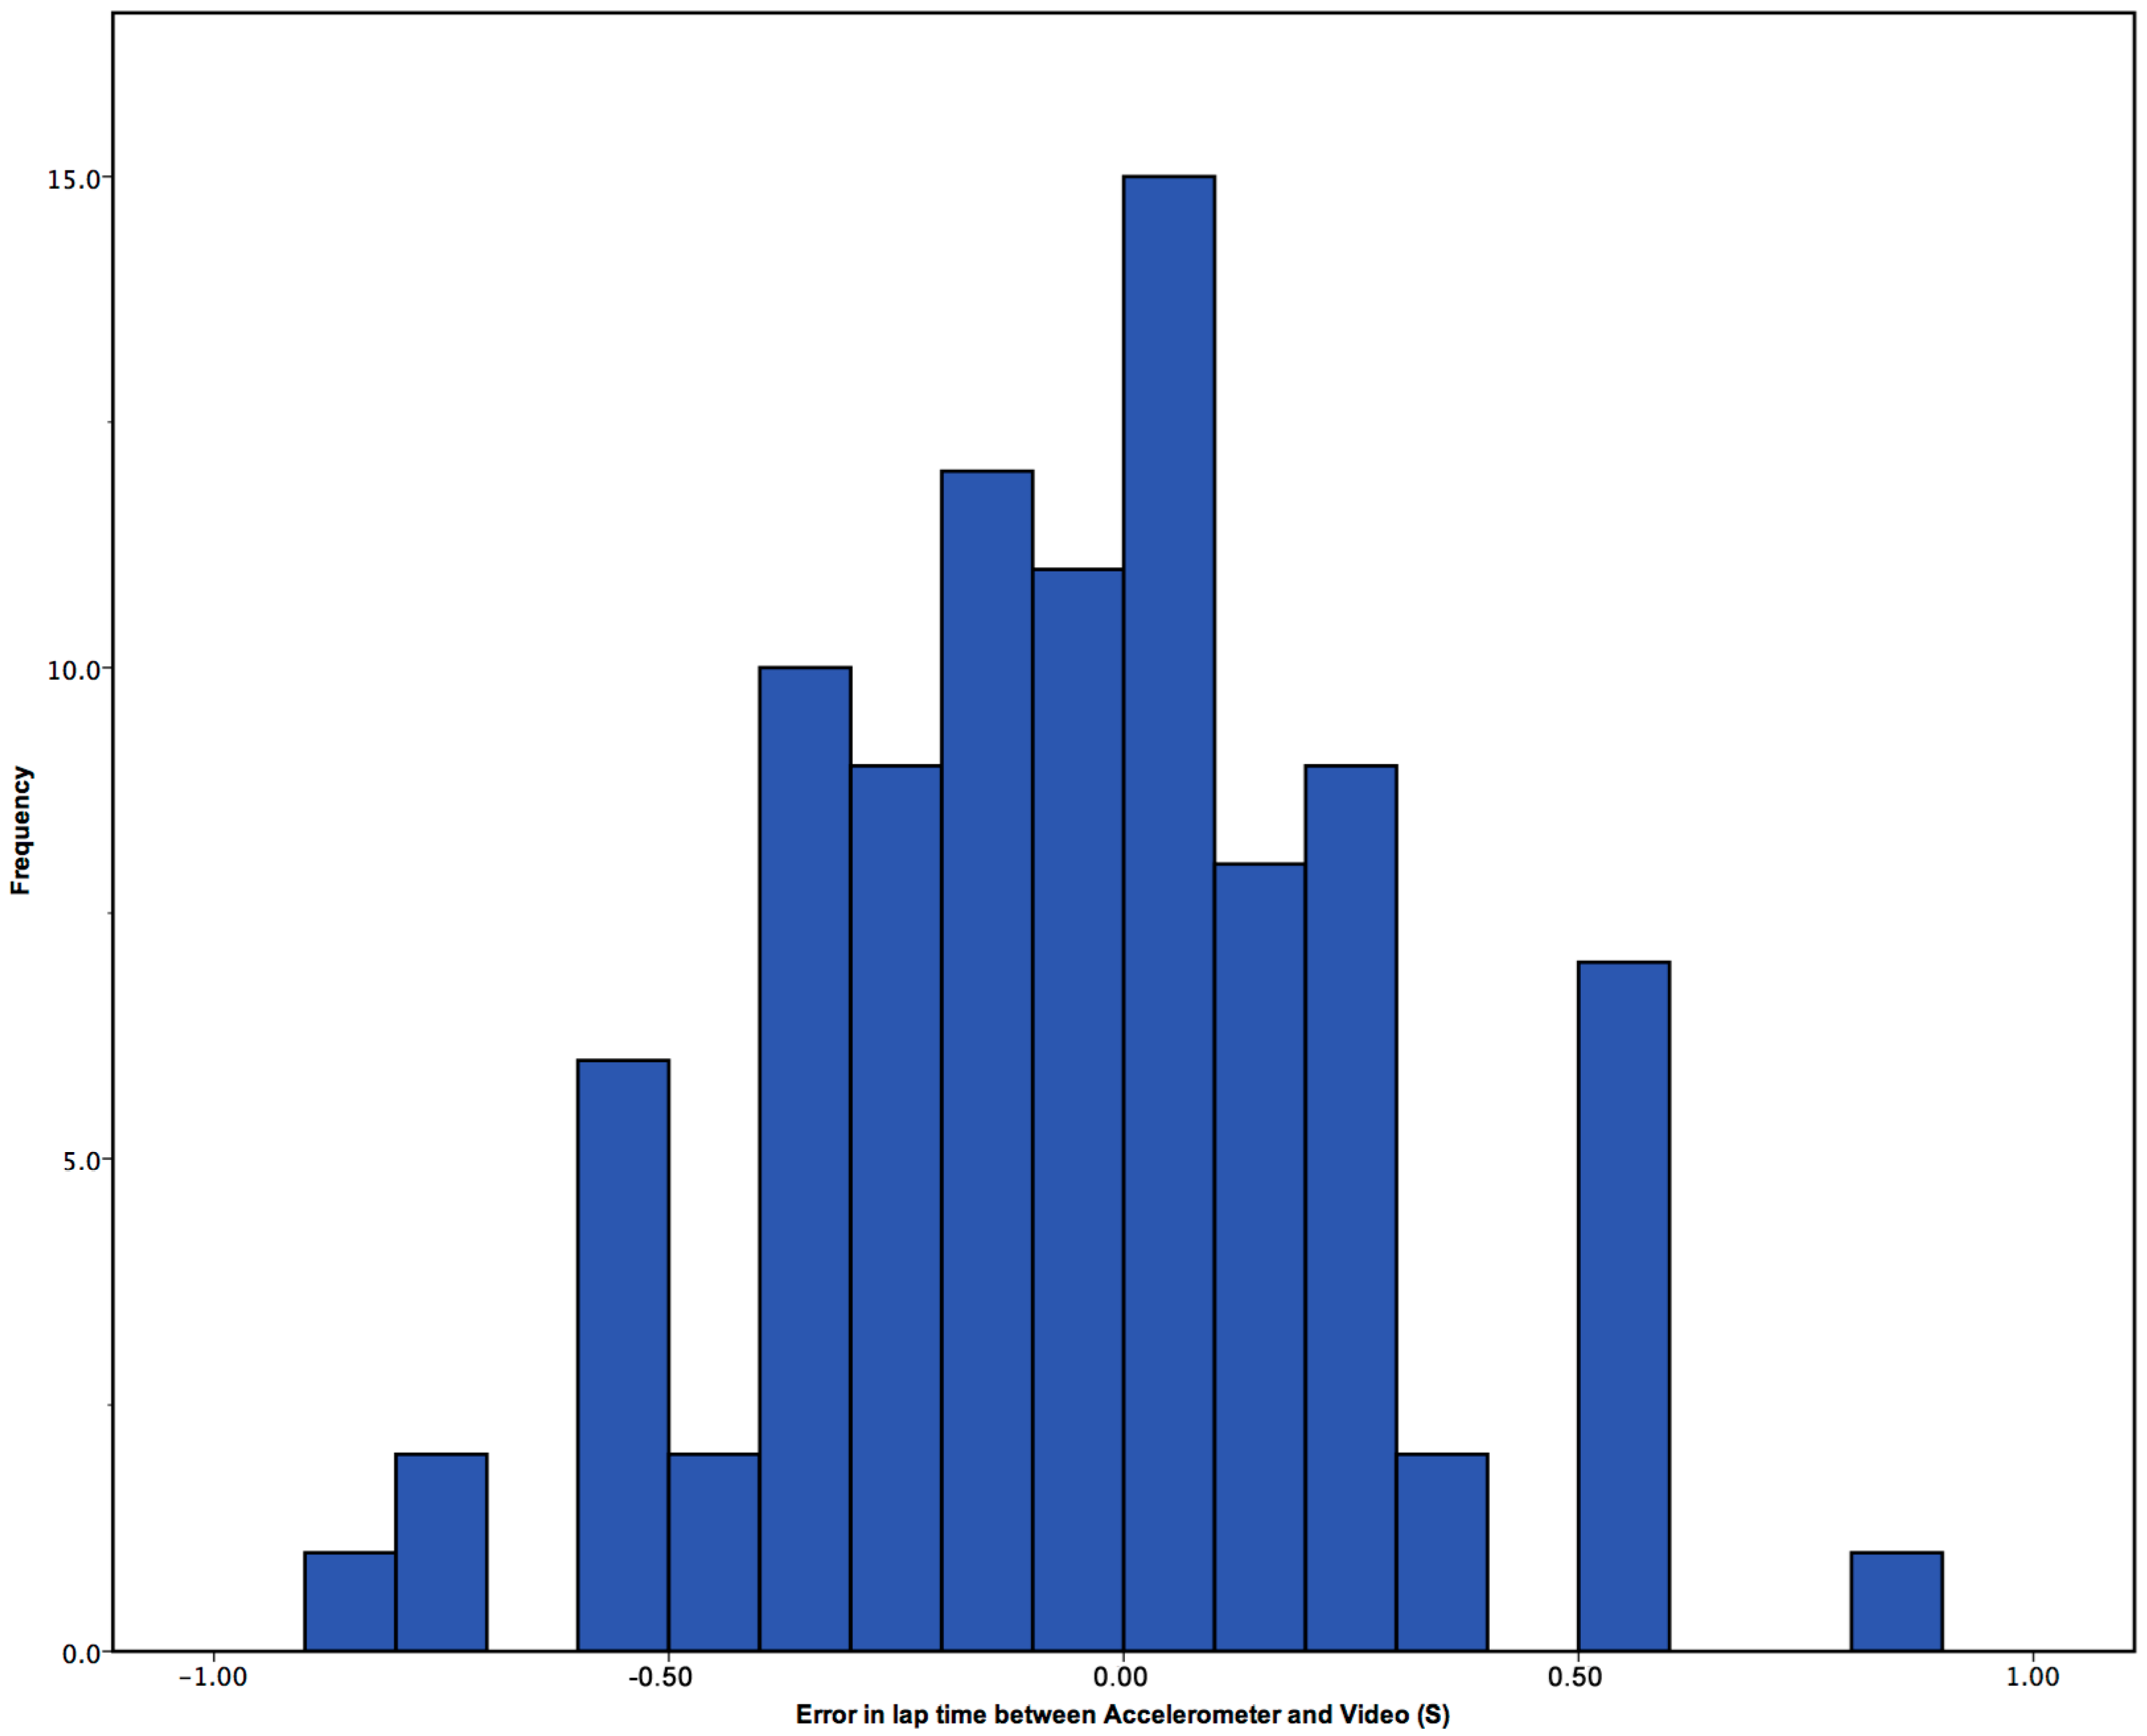
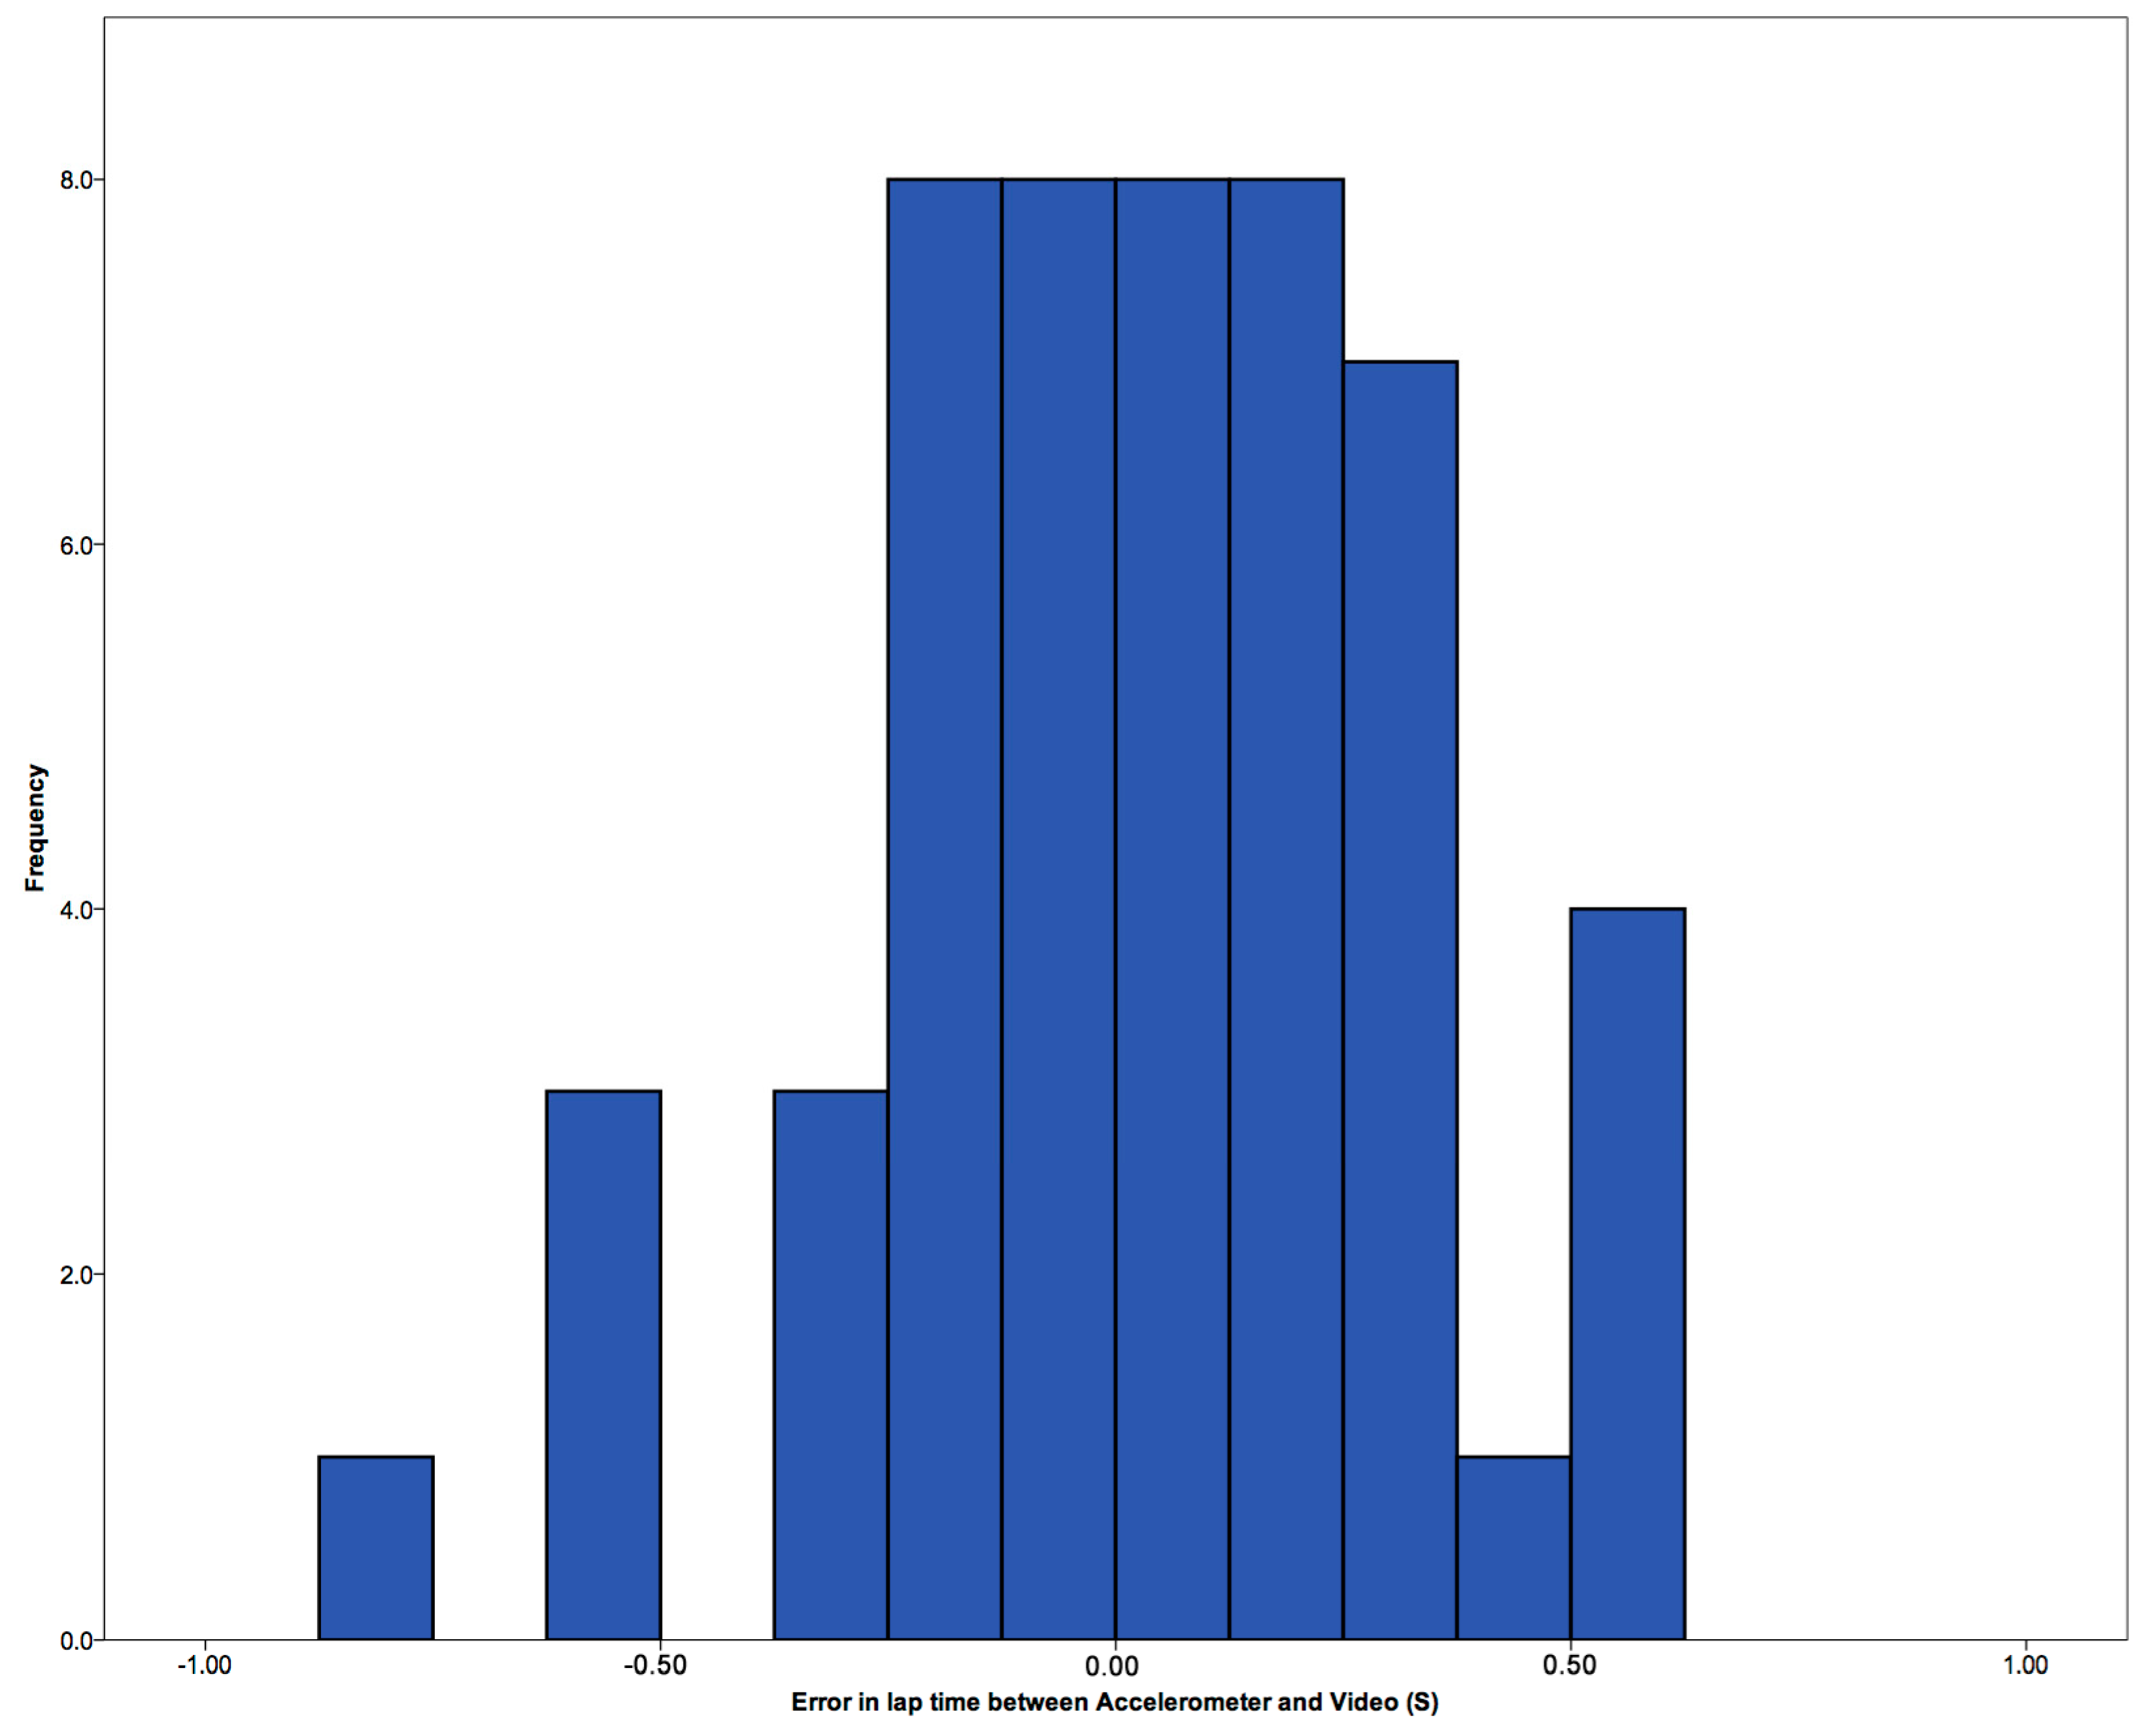
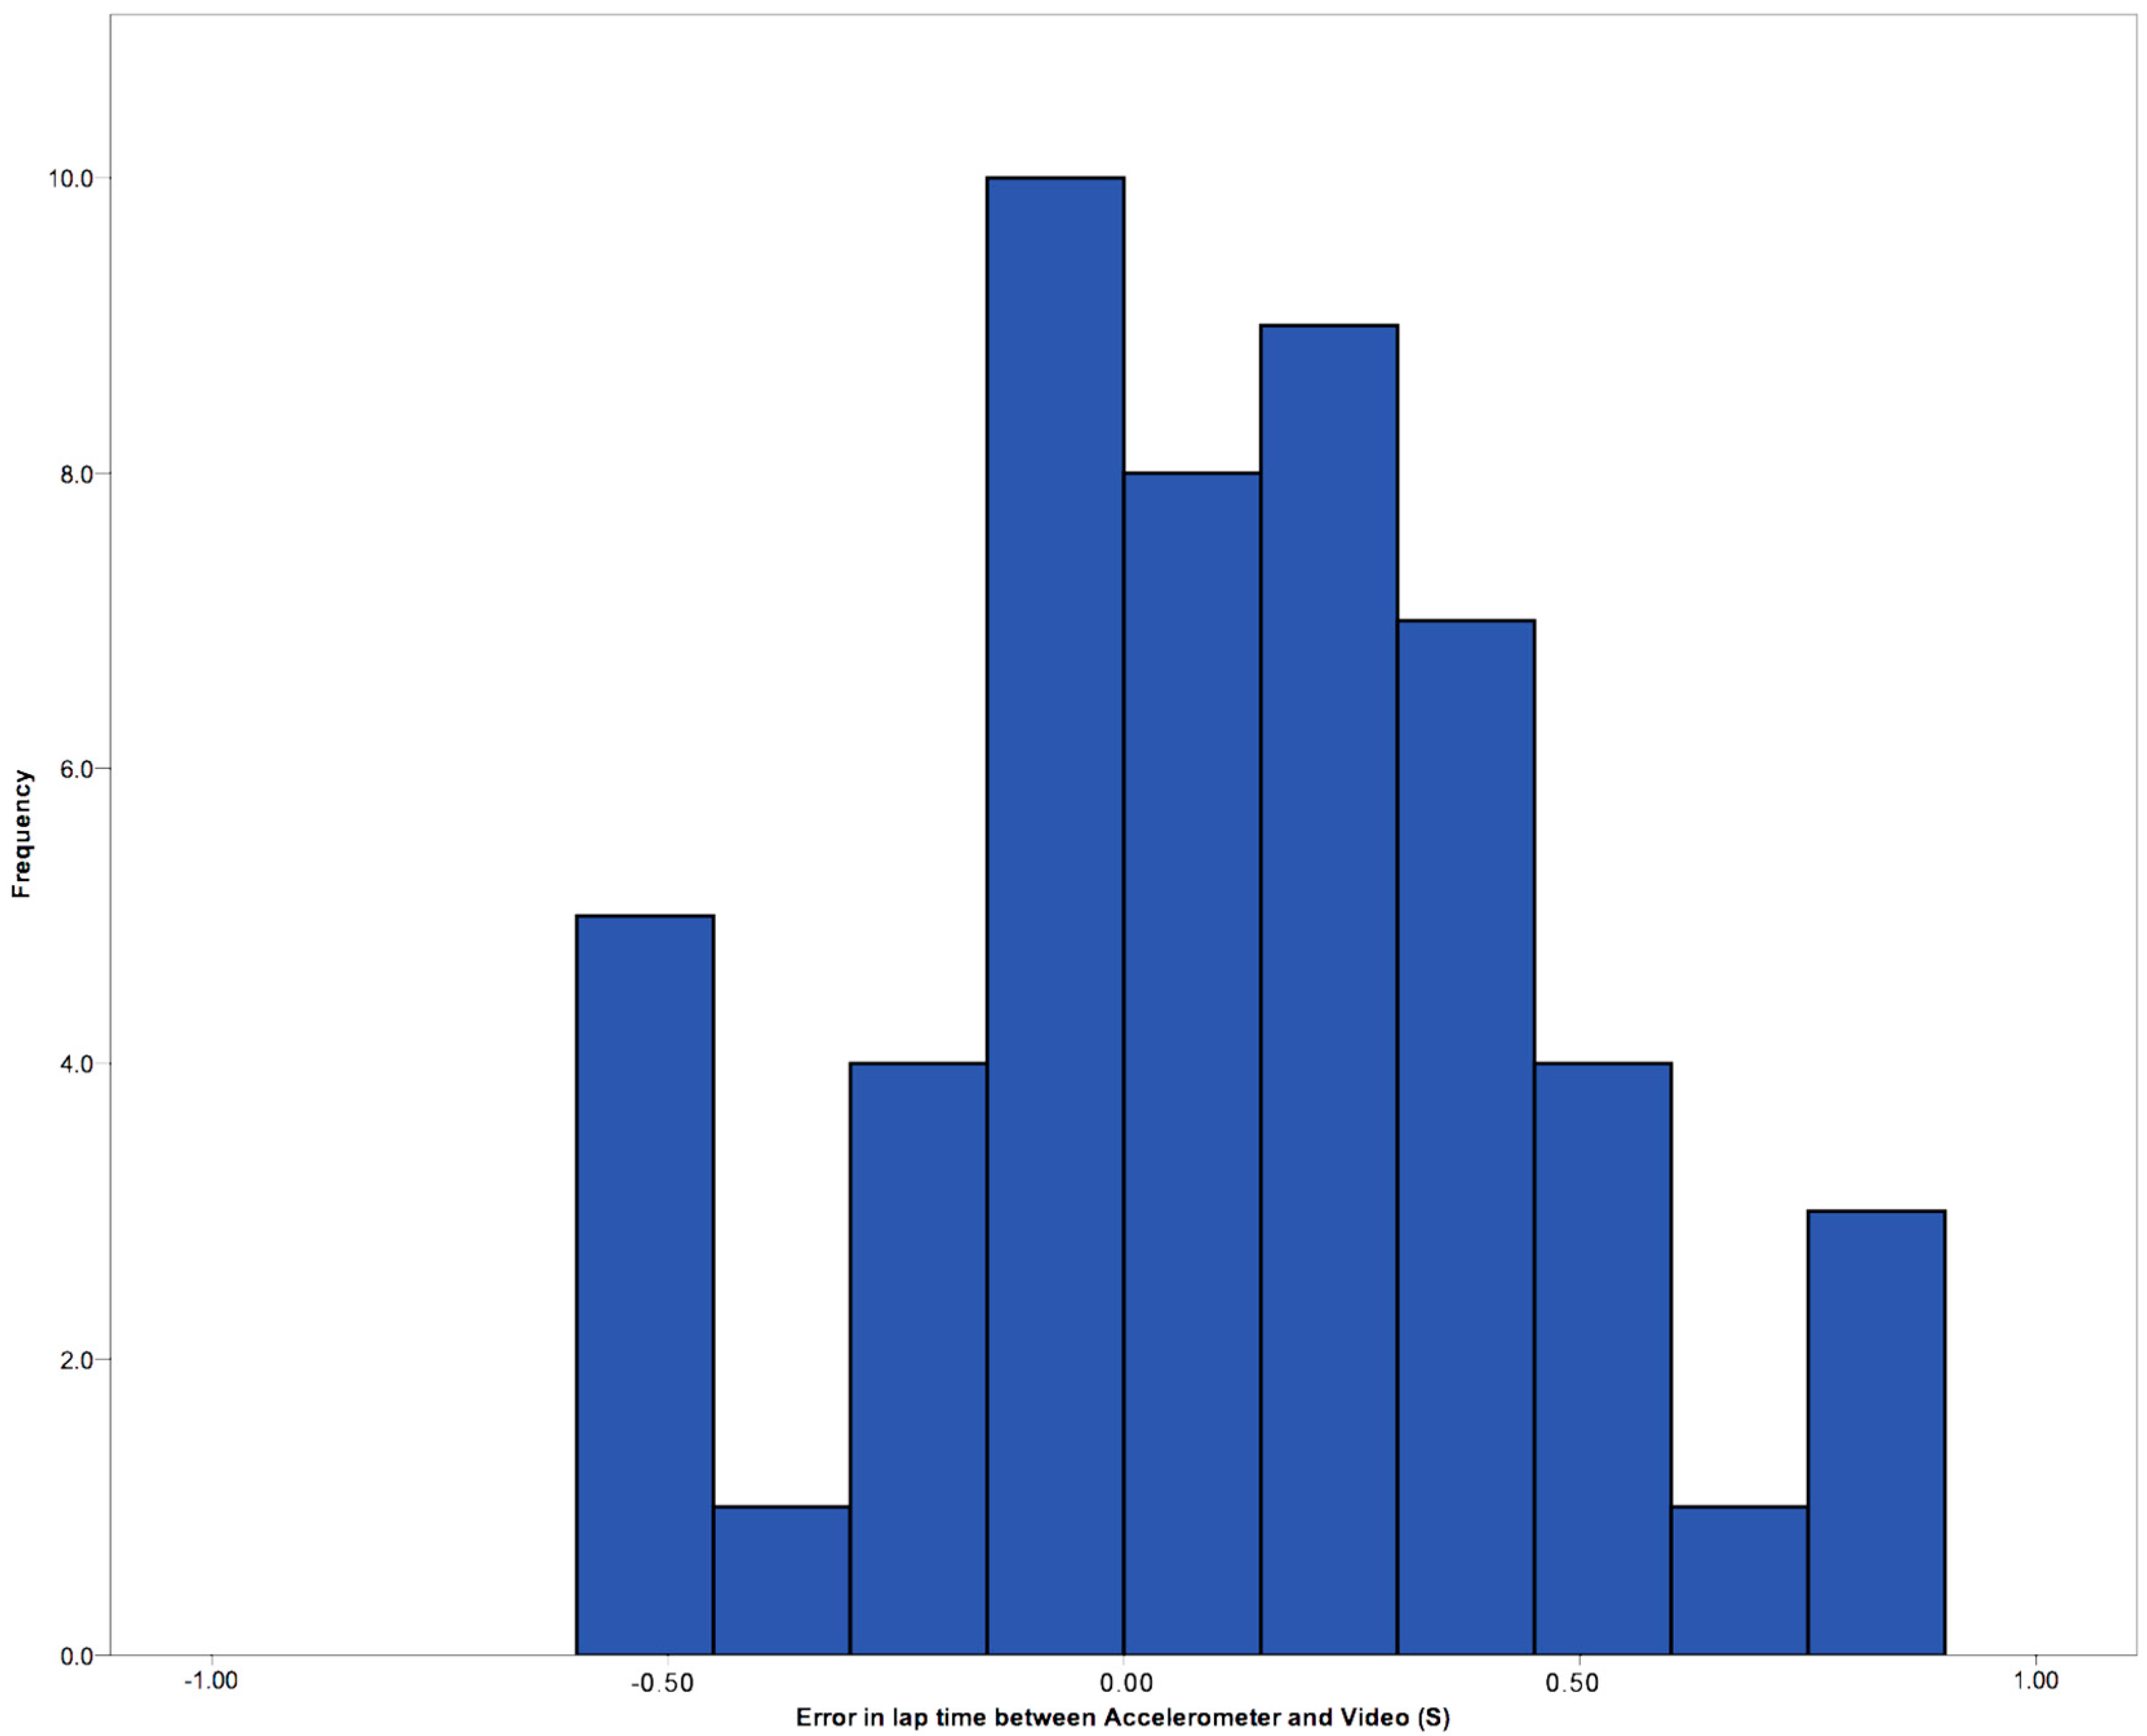
3.1. Lap Times

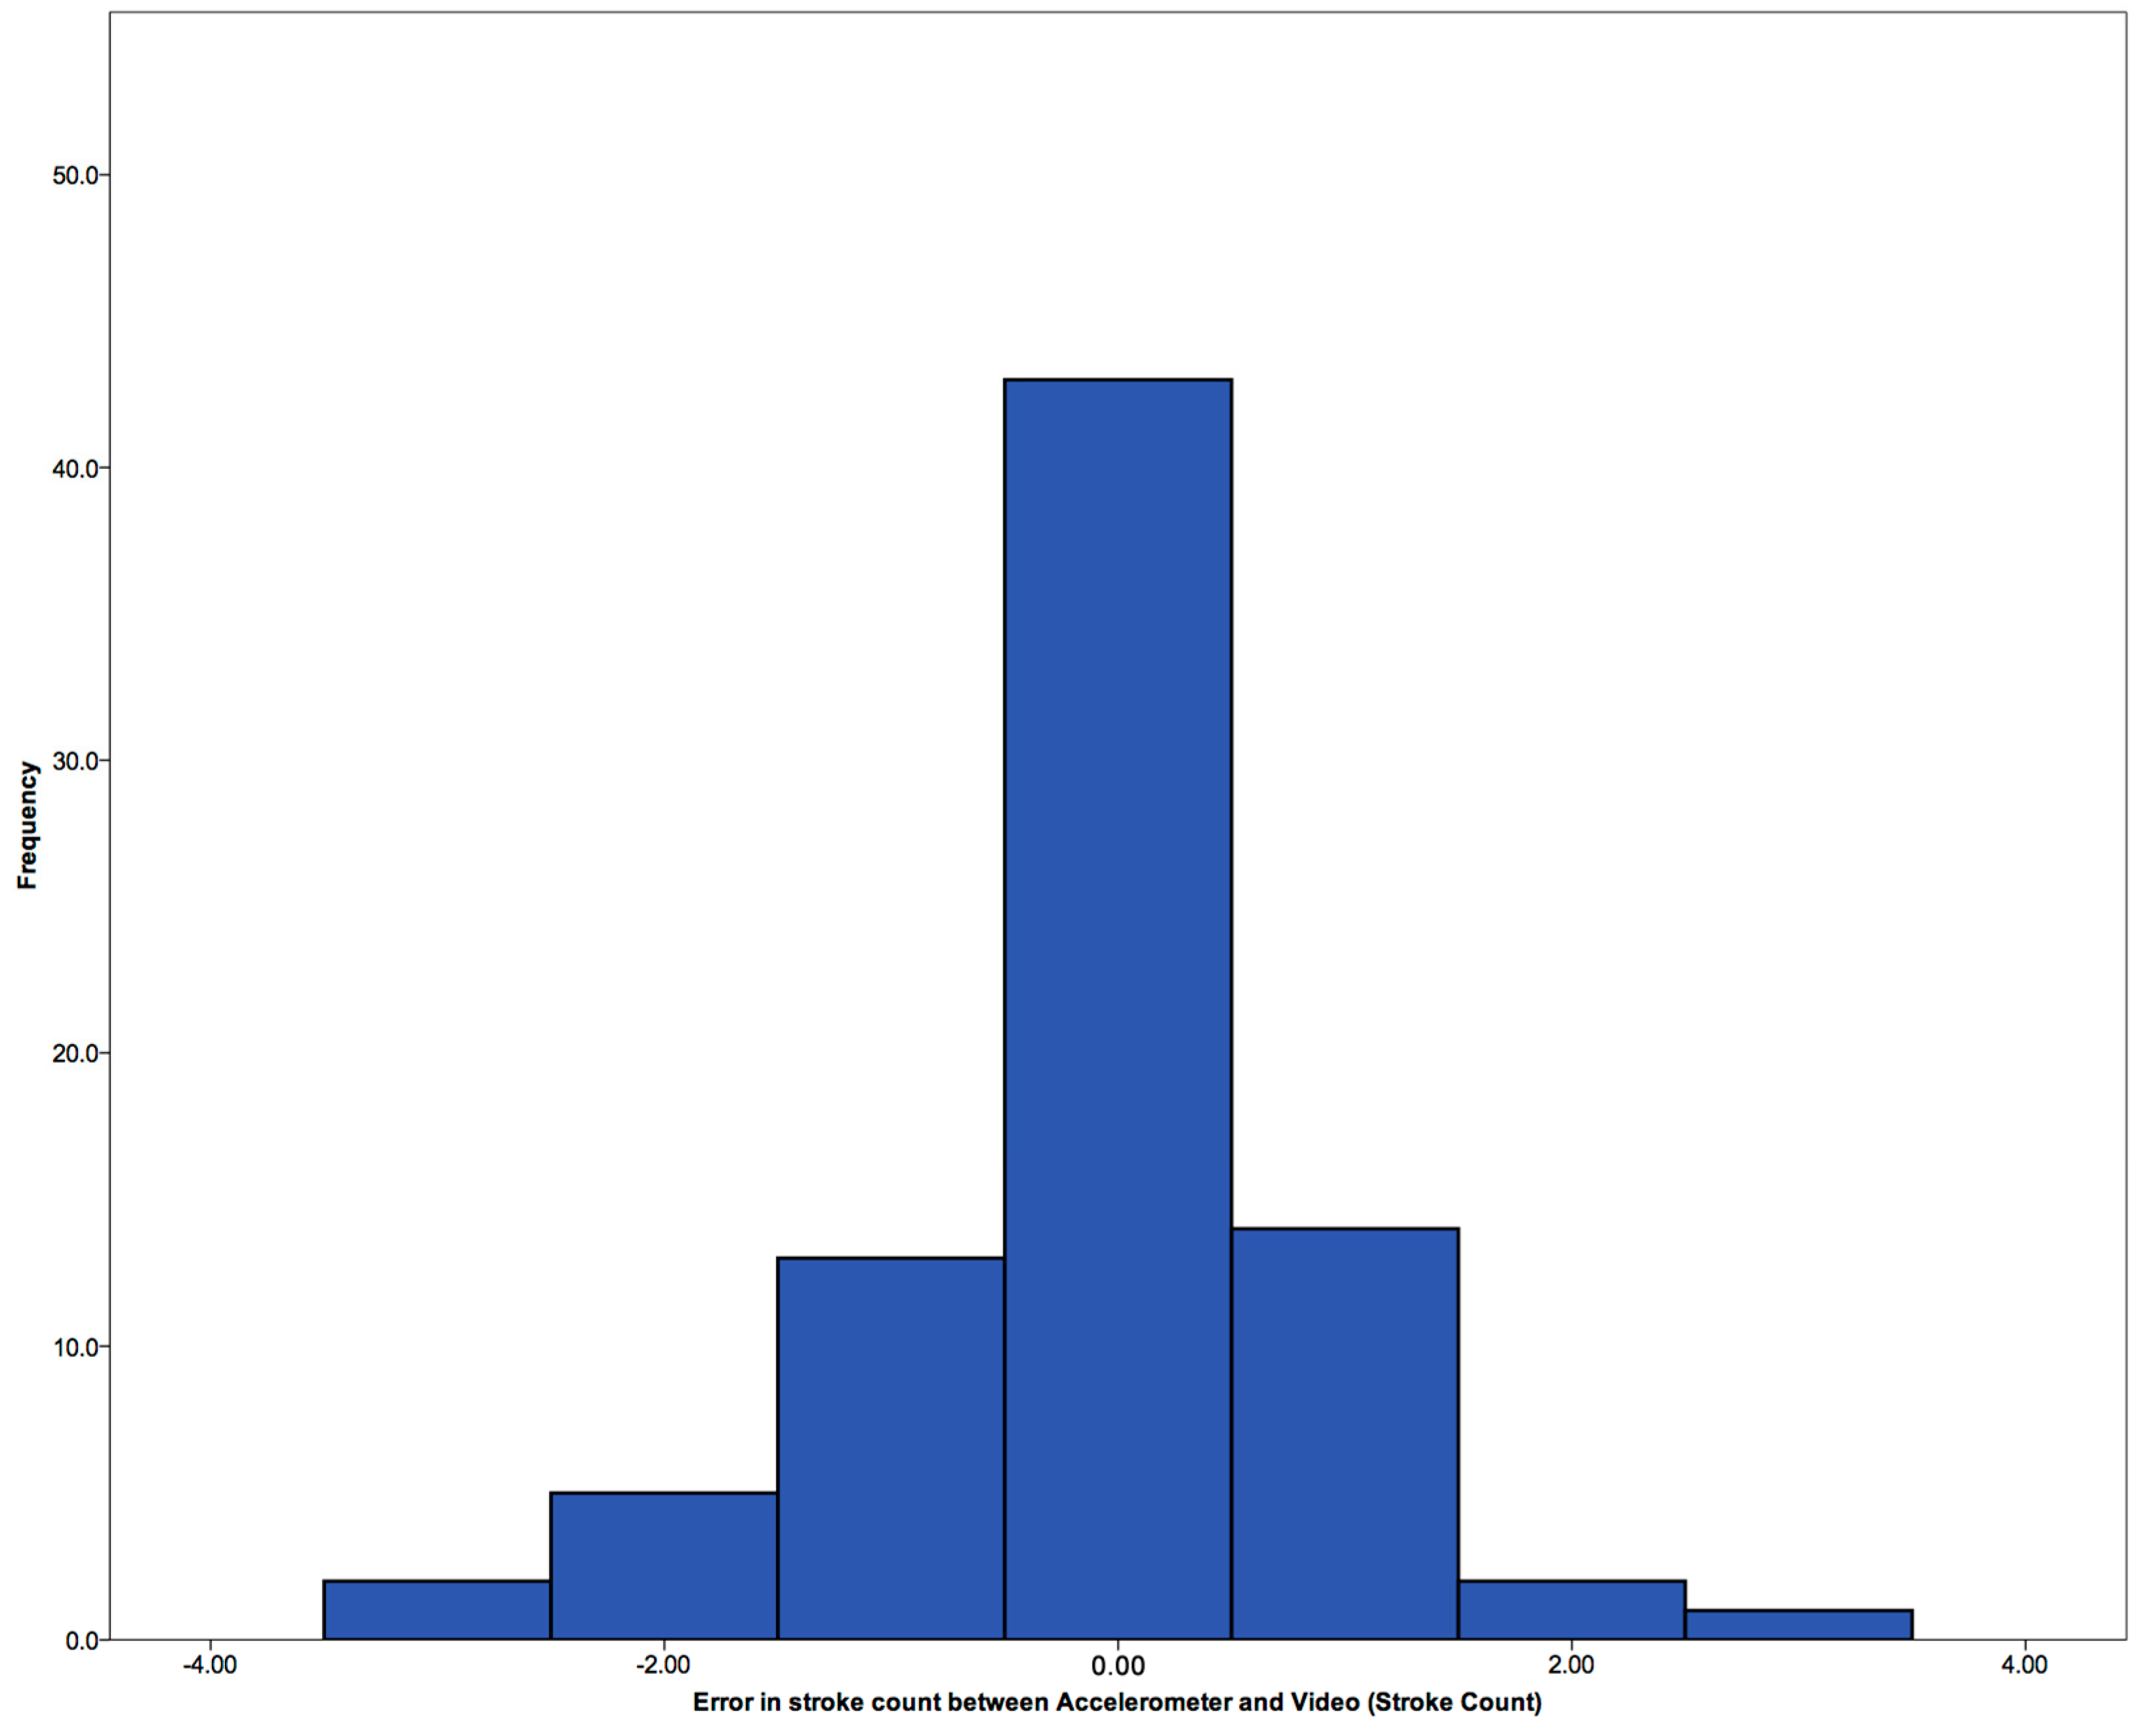
3.2. Validation of Stroke Count
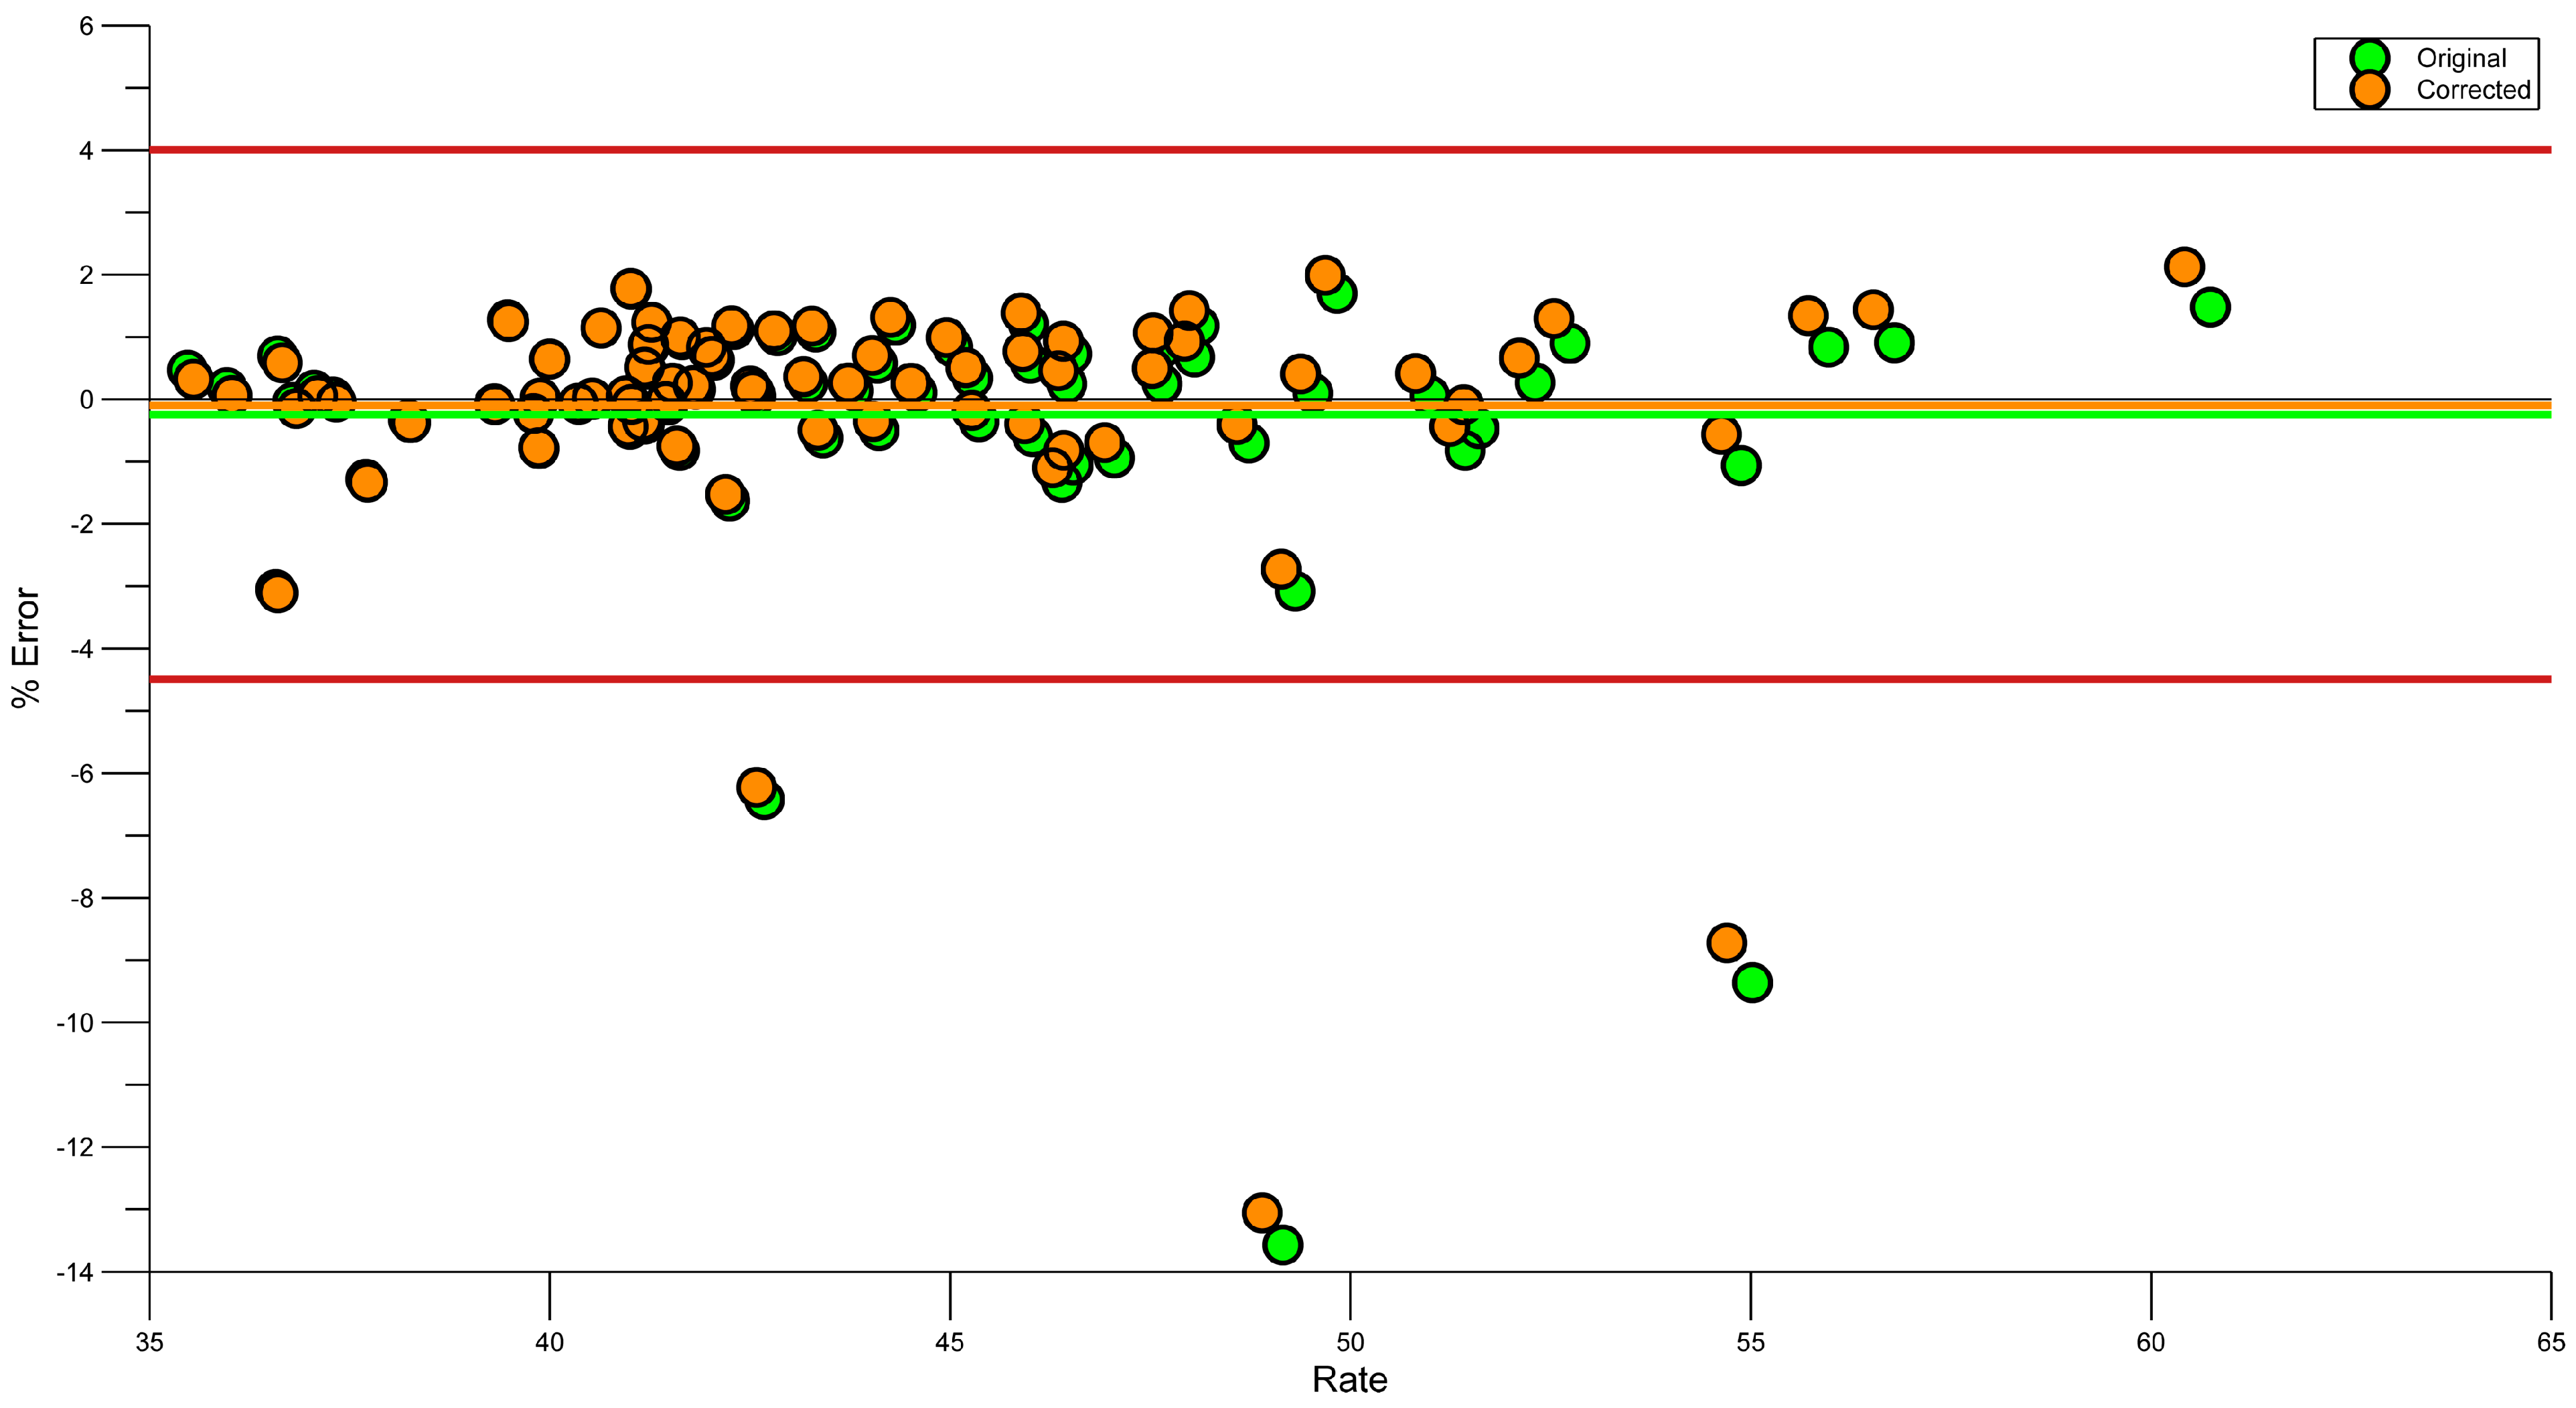
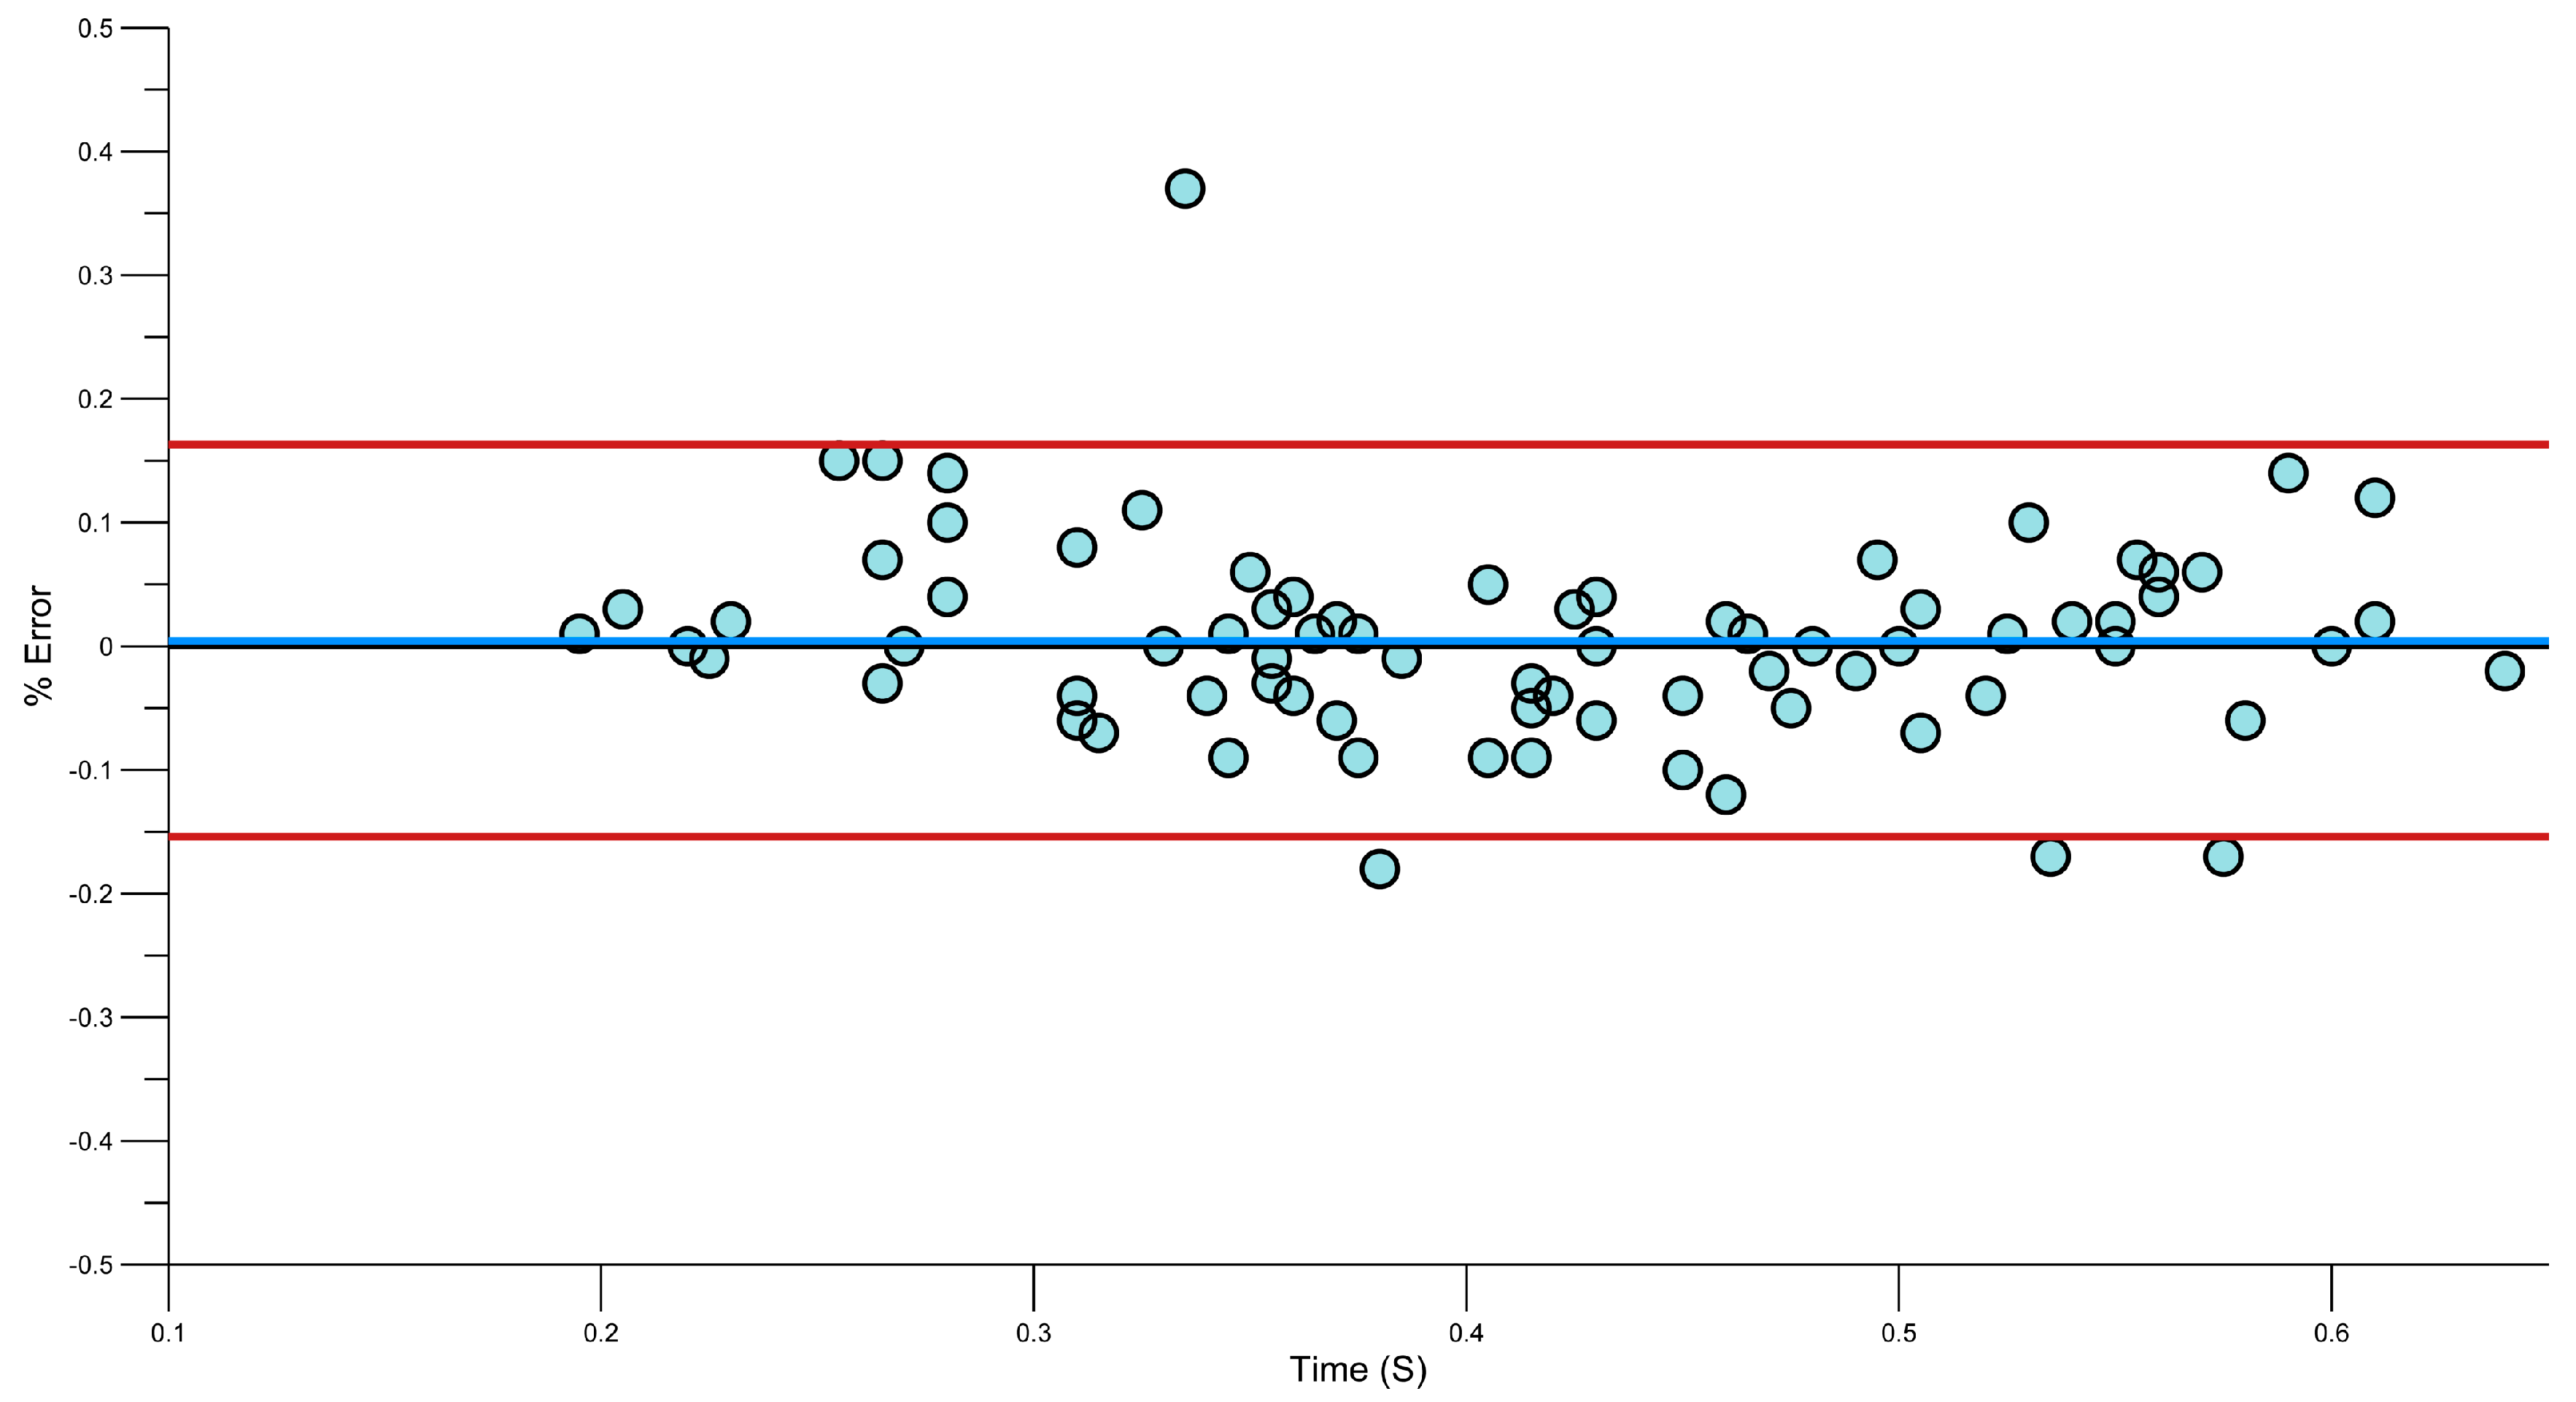
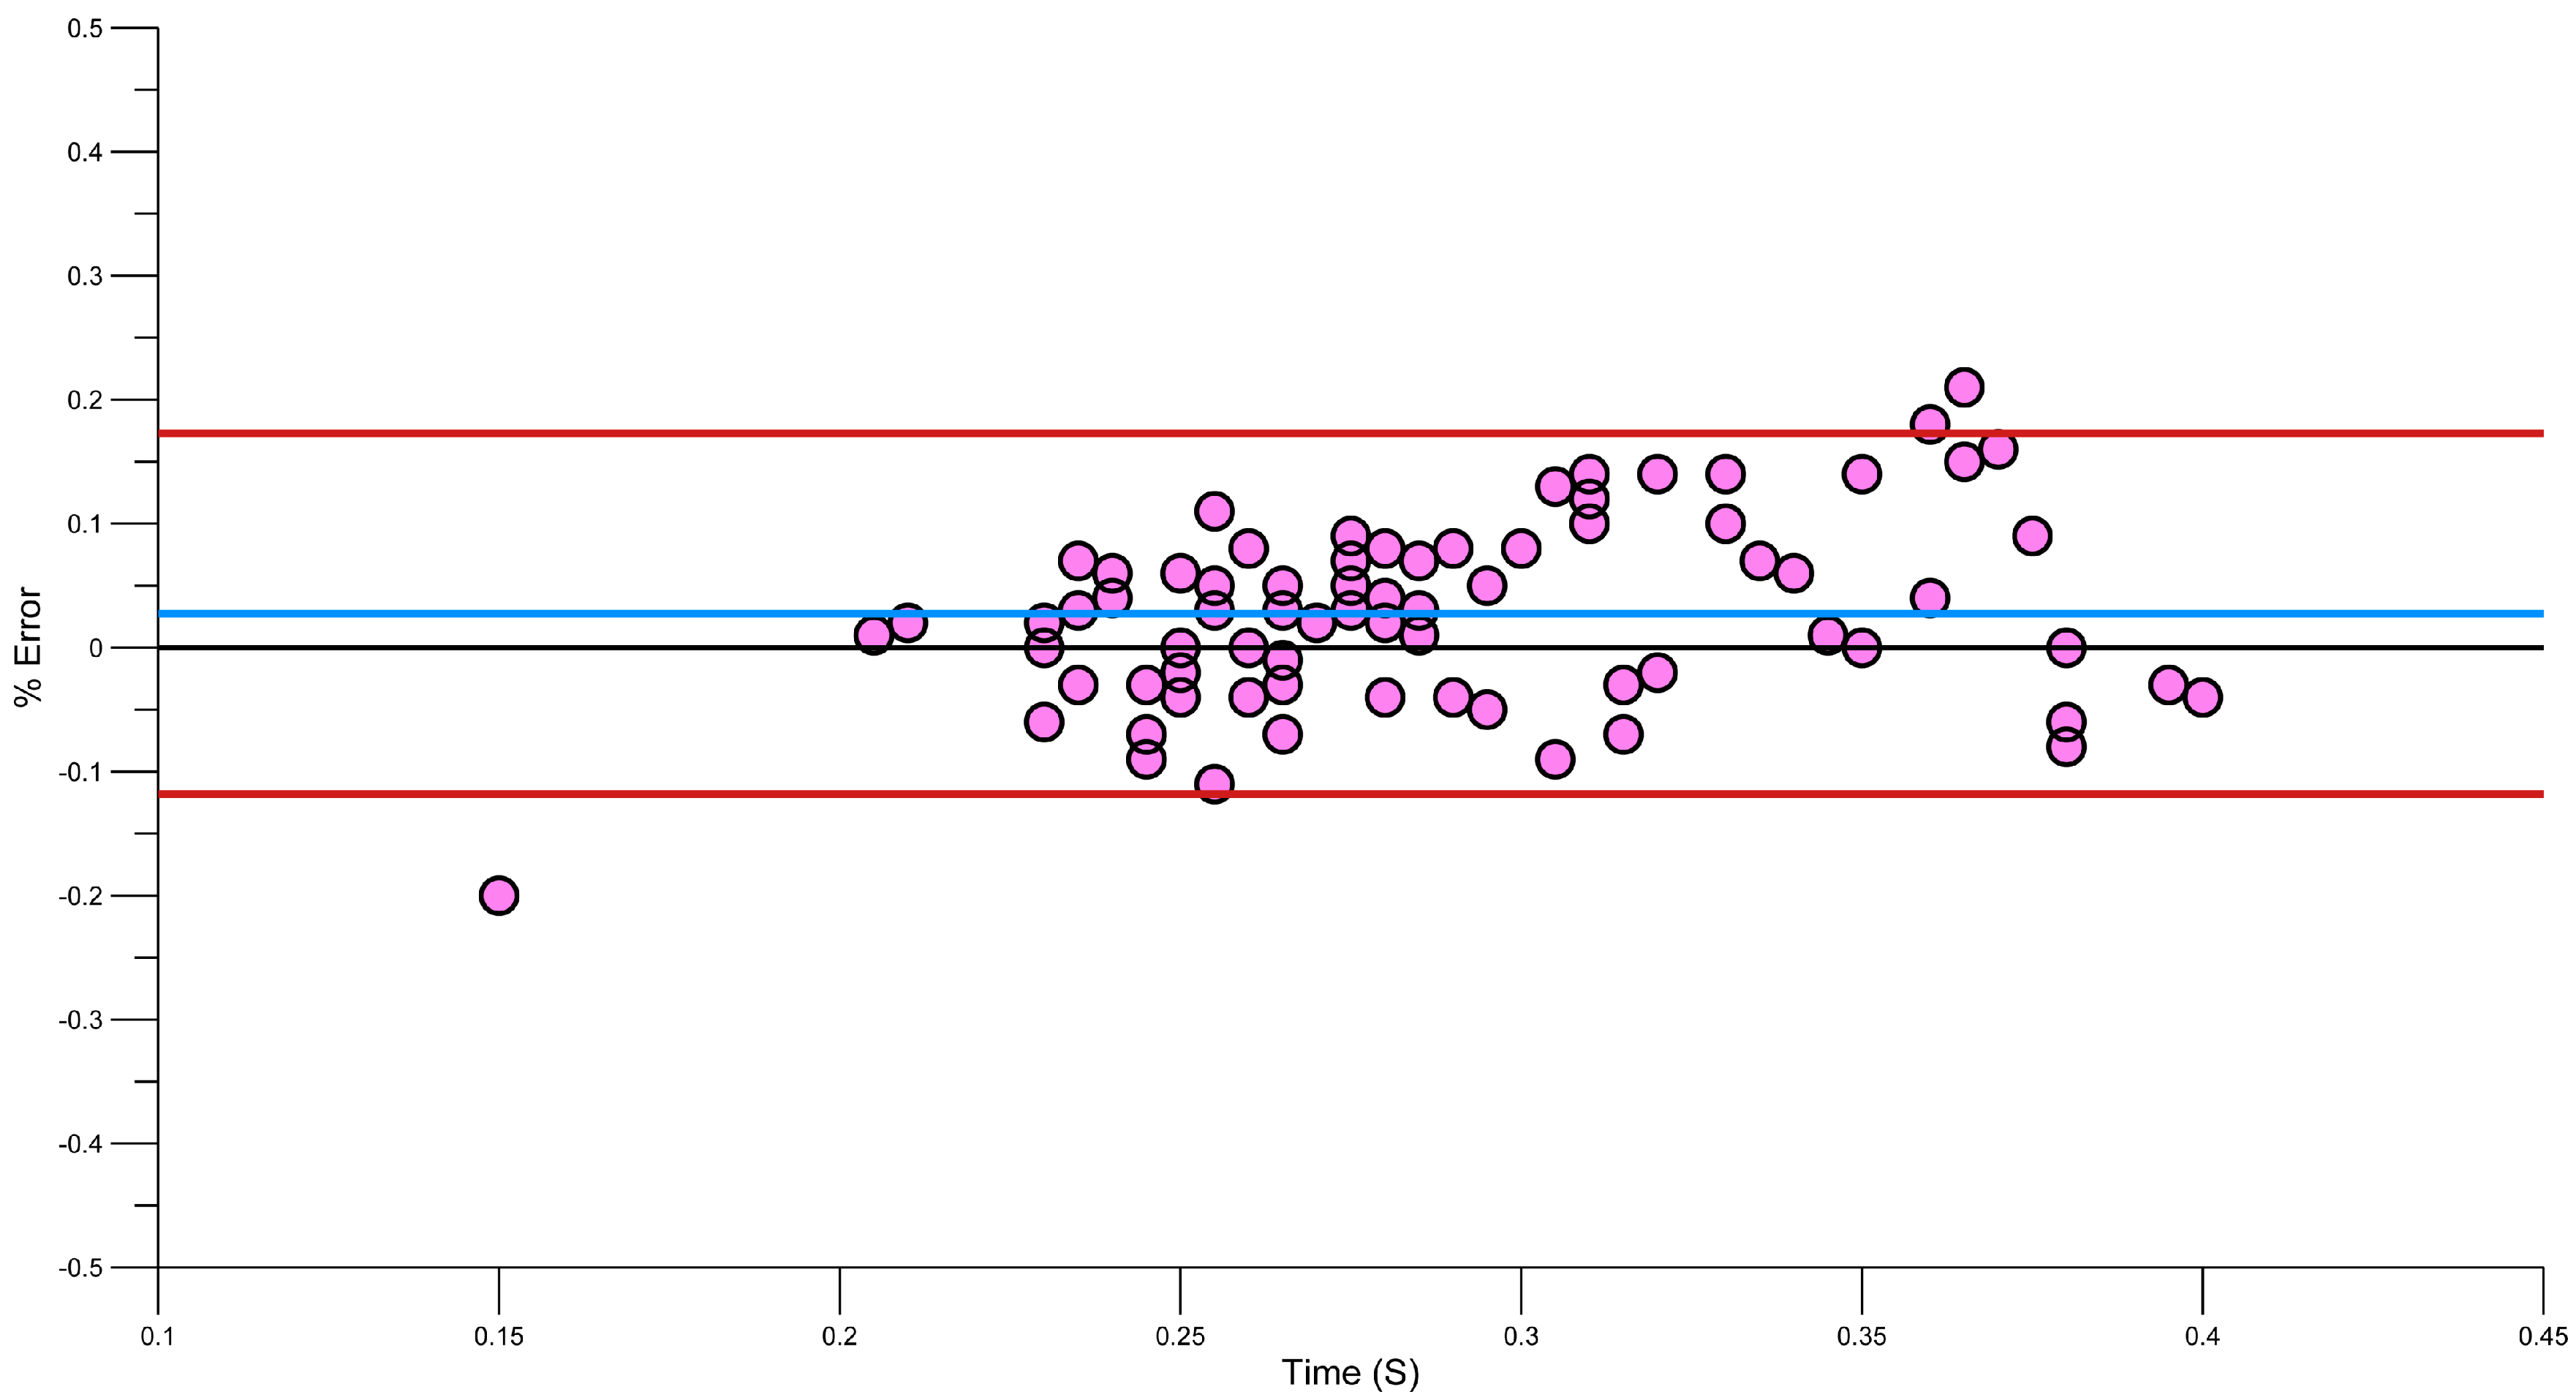
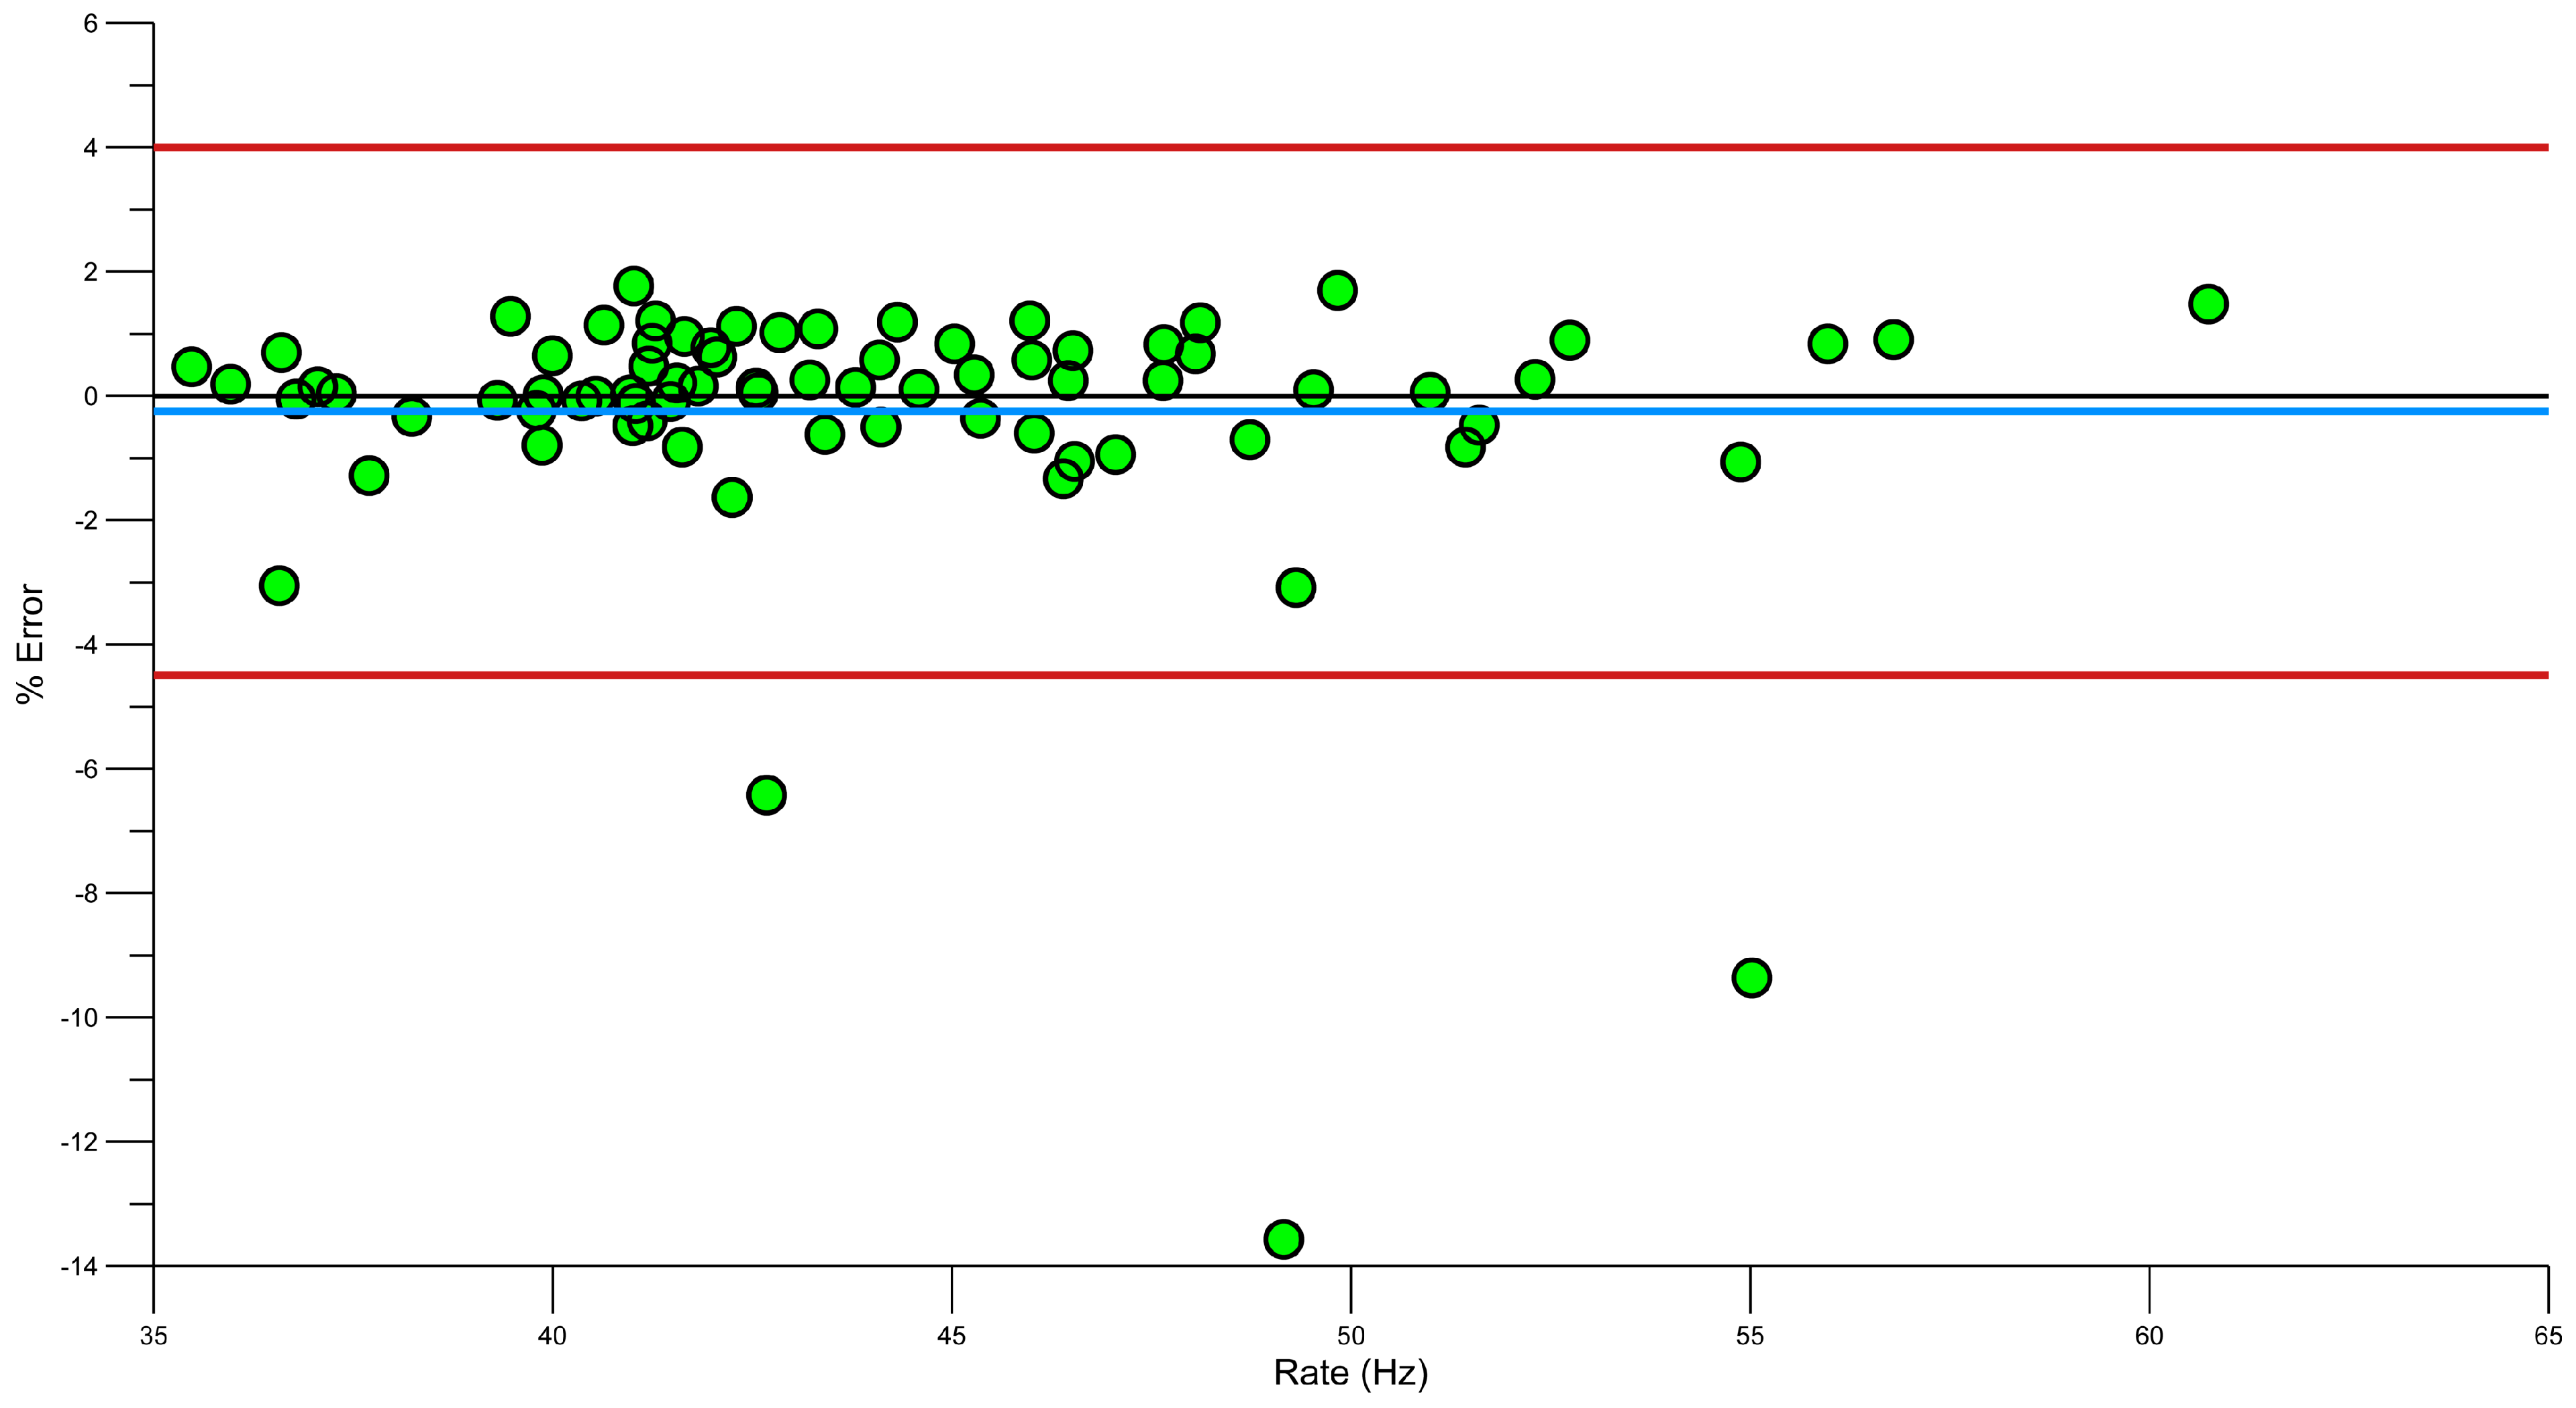
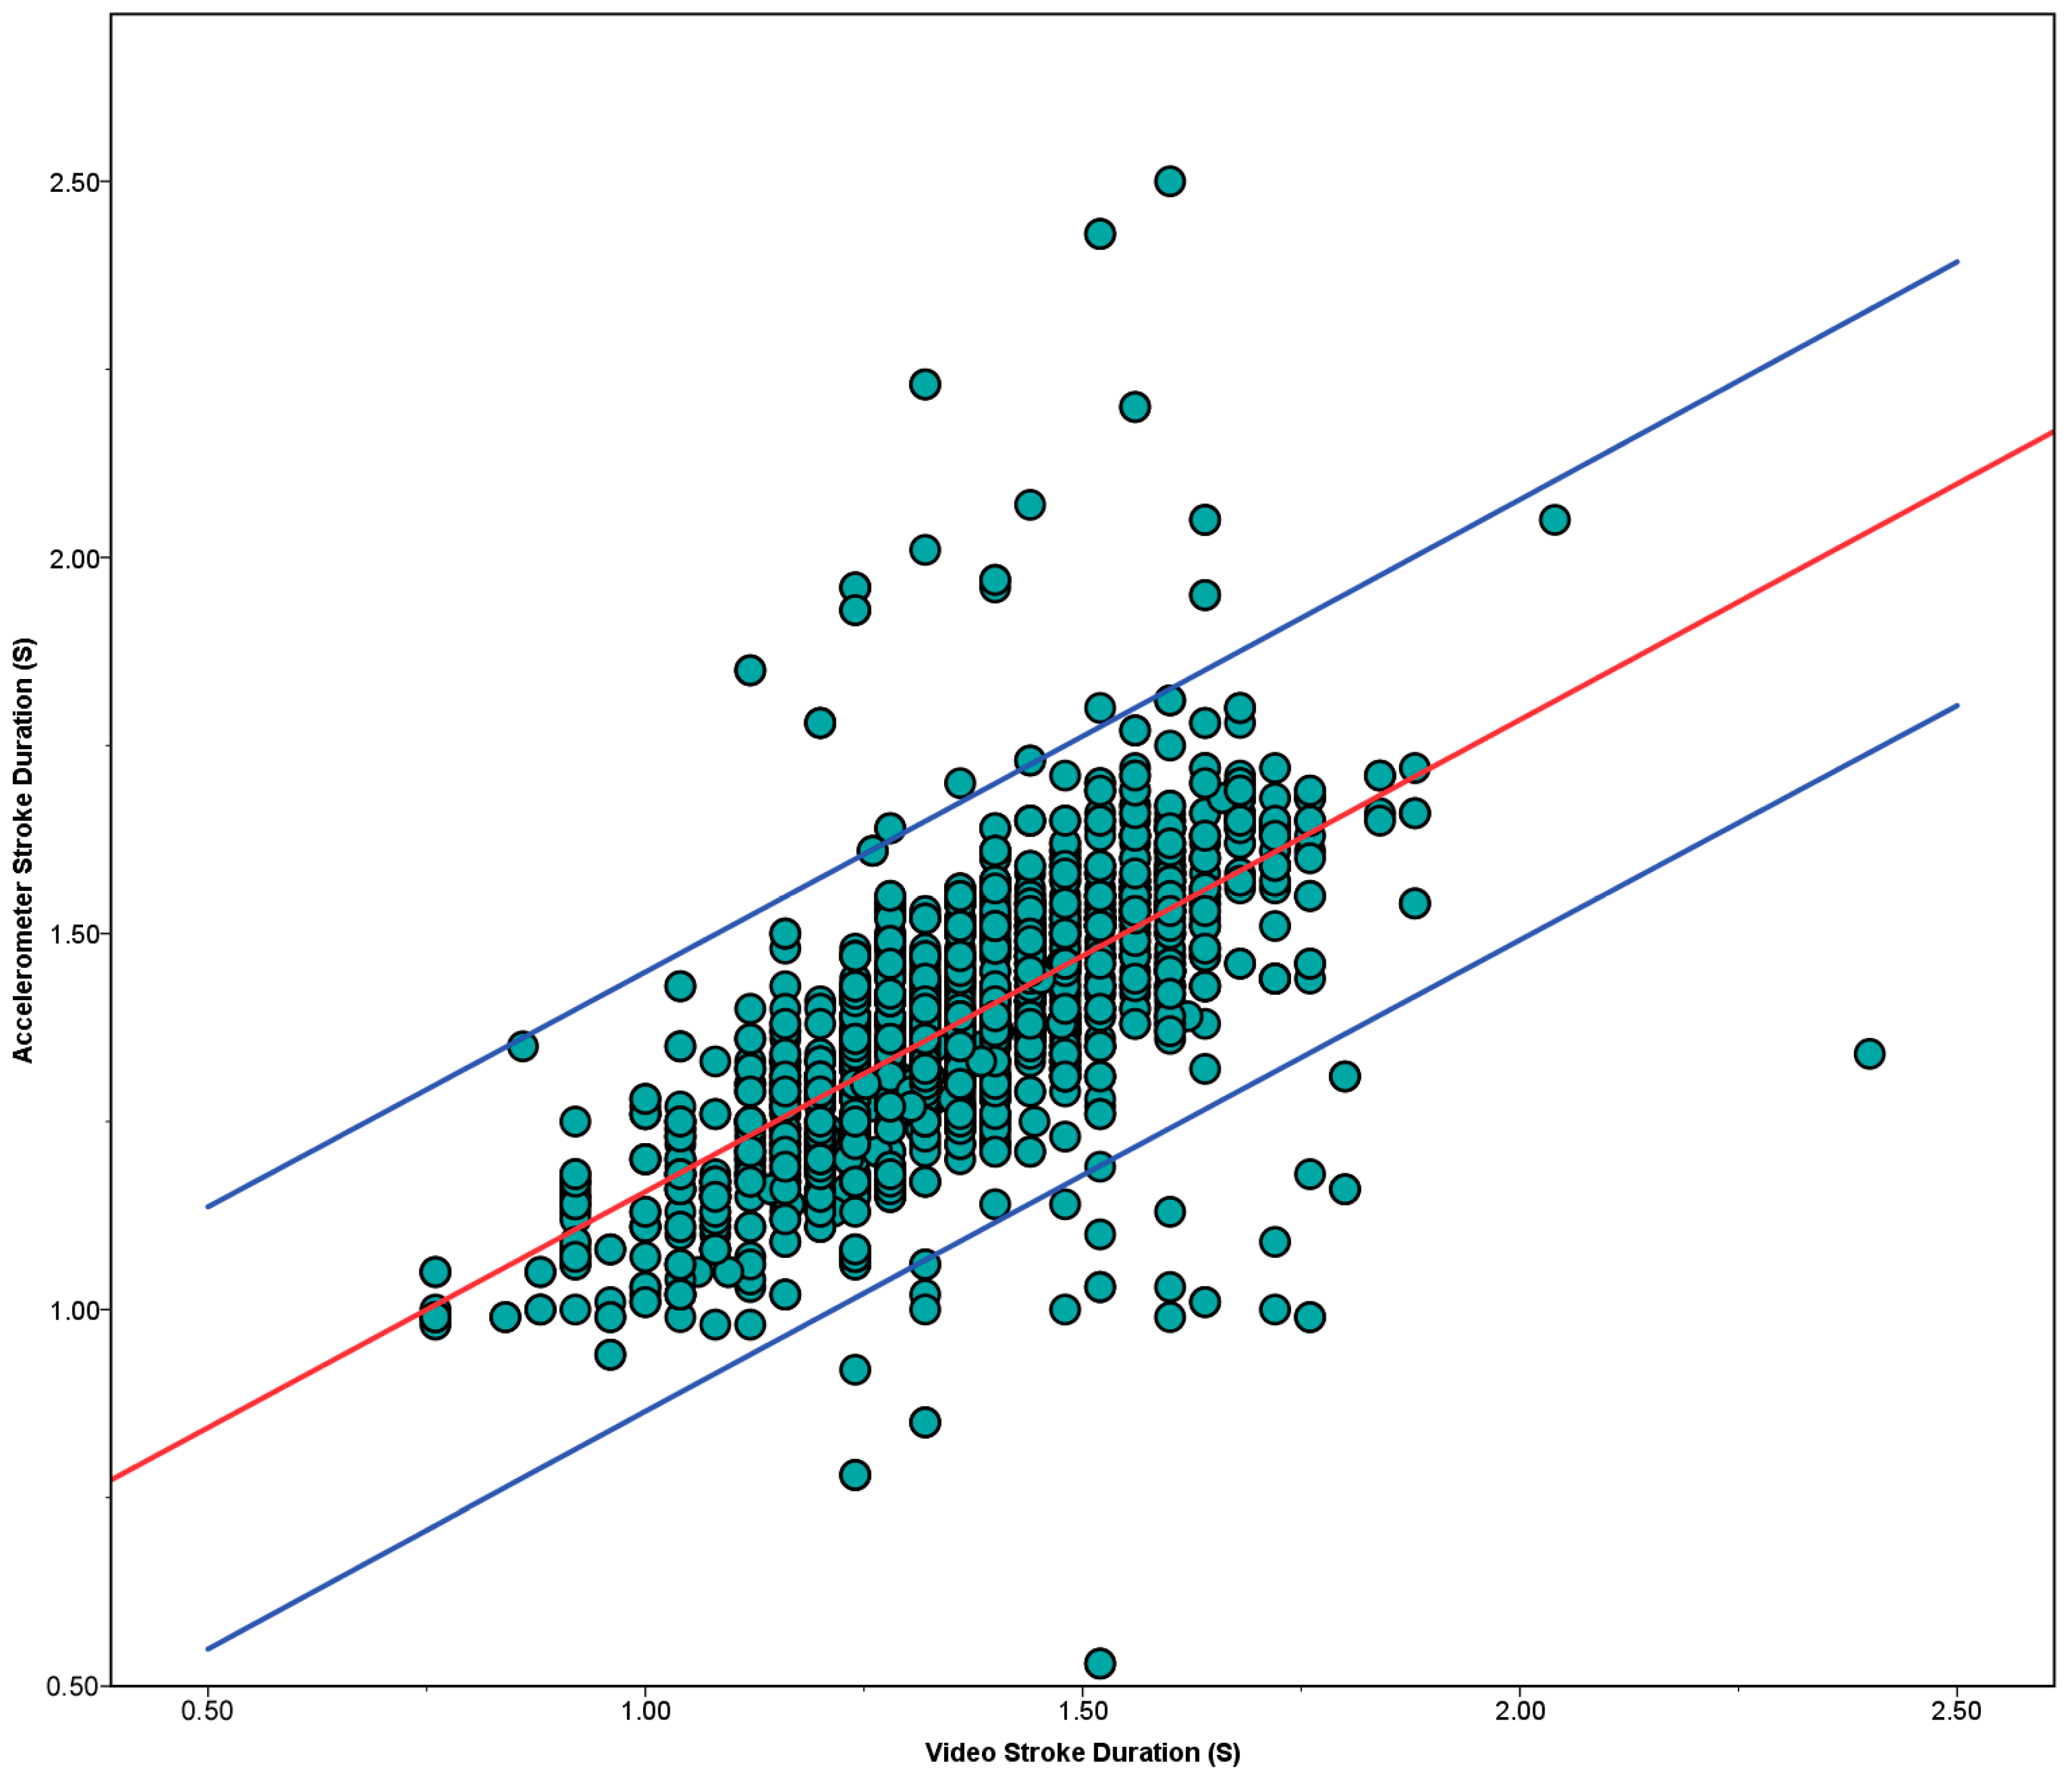
3.3. Validation of Stroke Rate and Stroke Duration

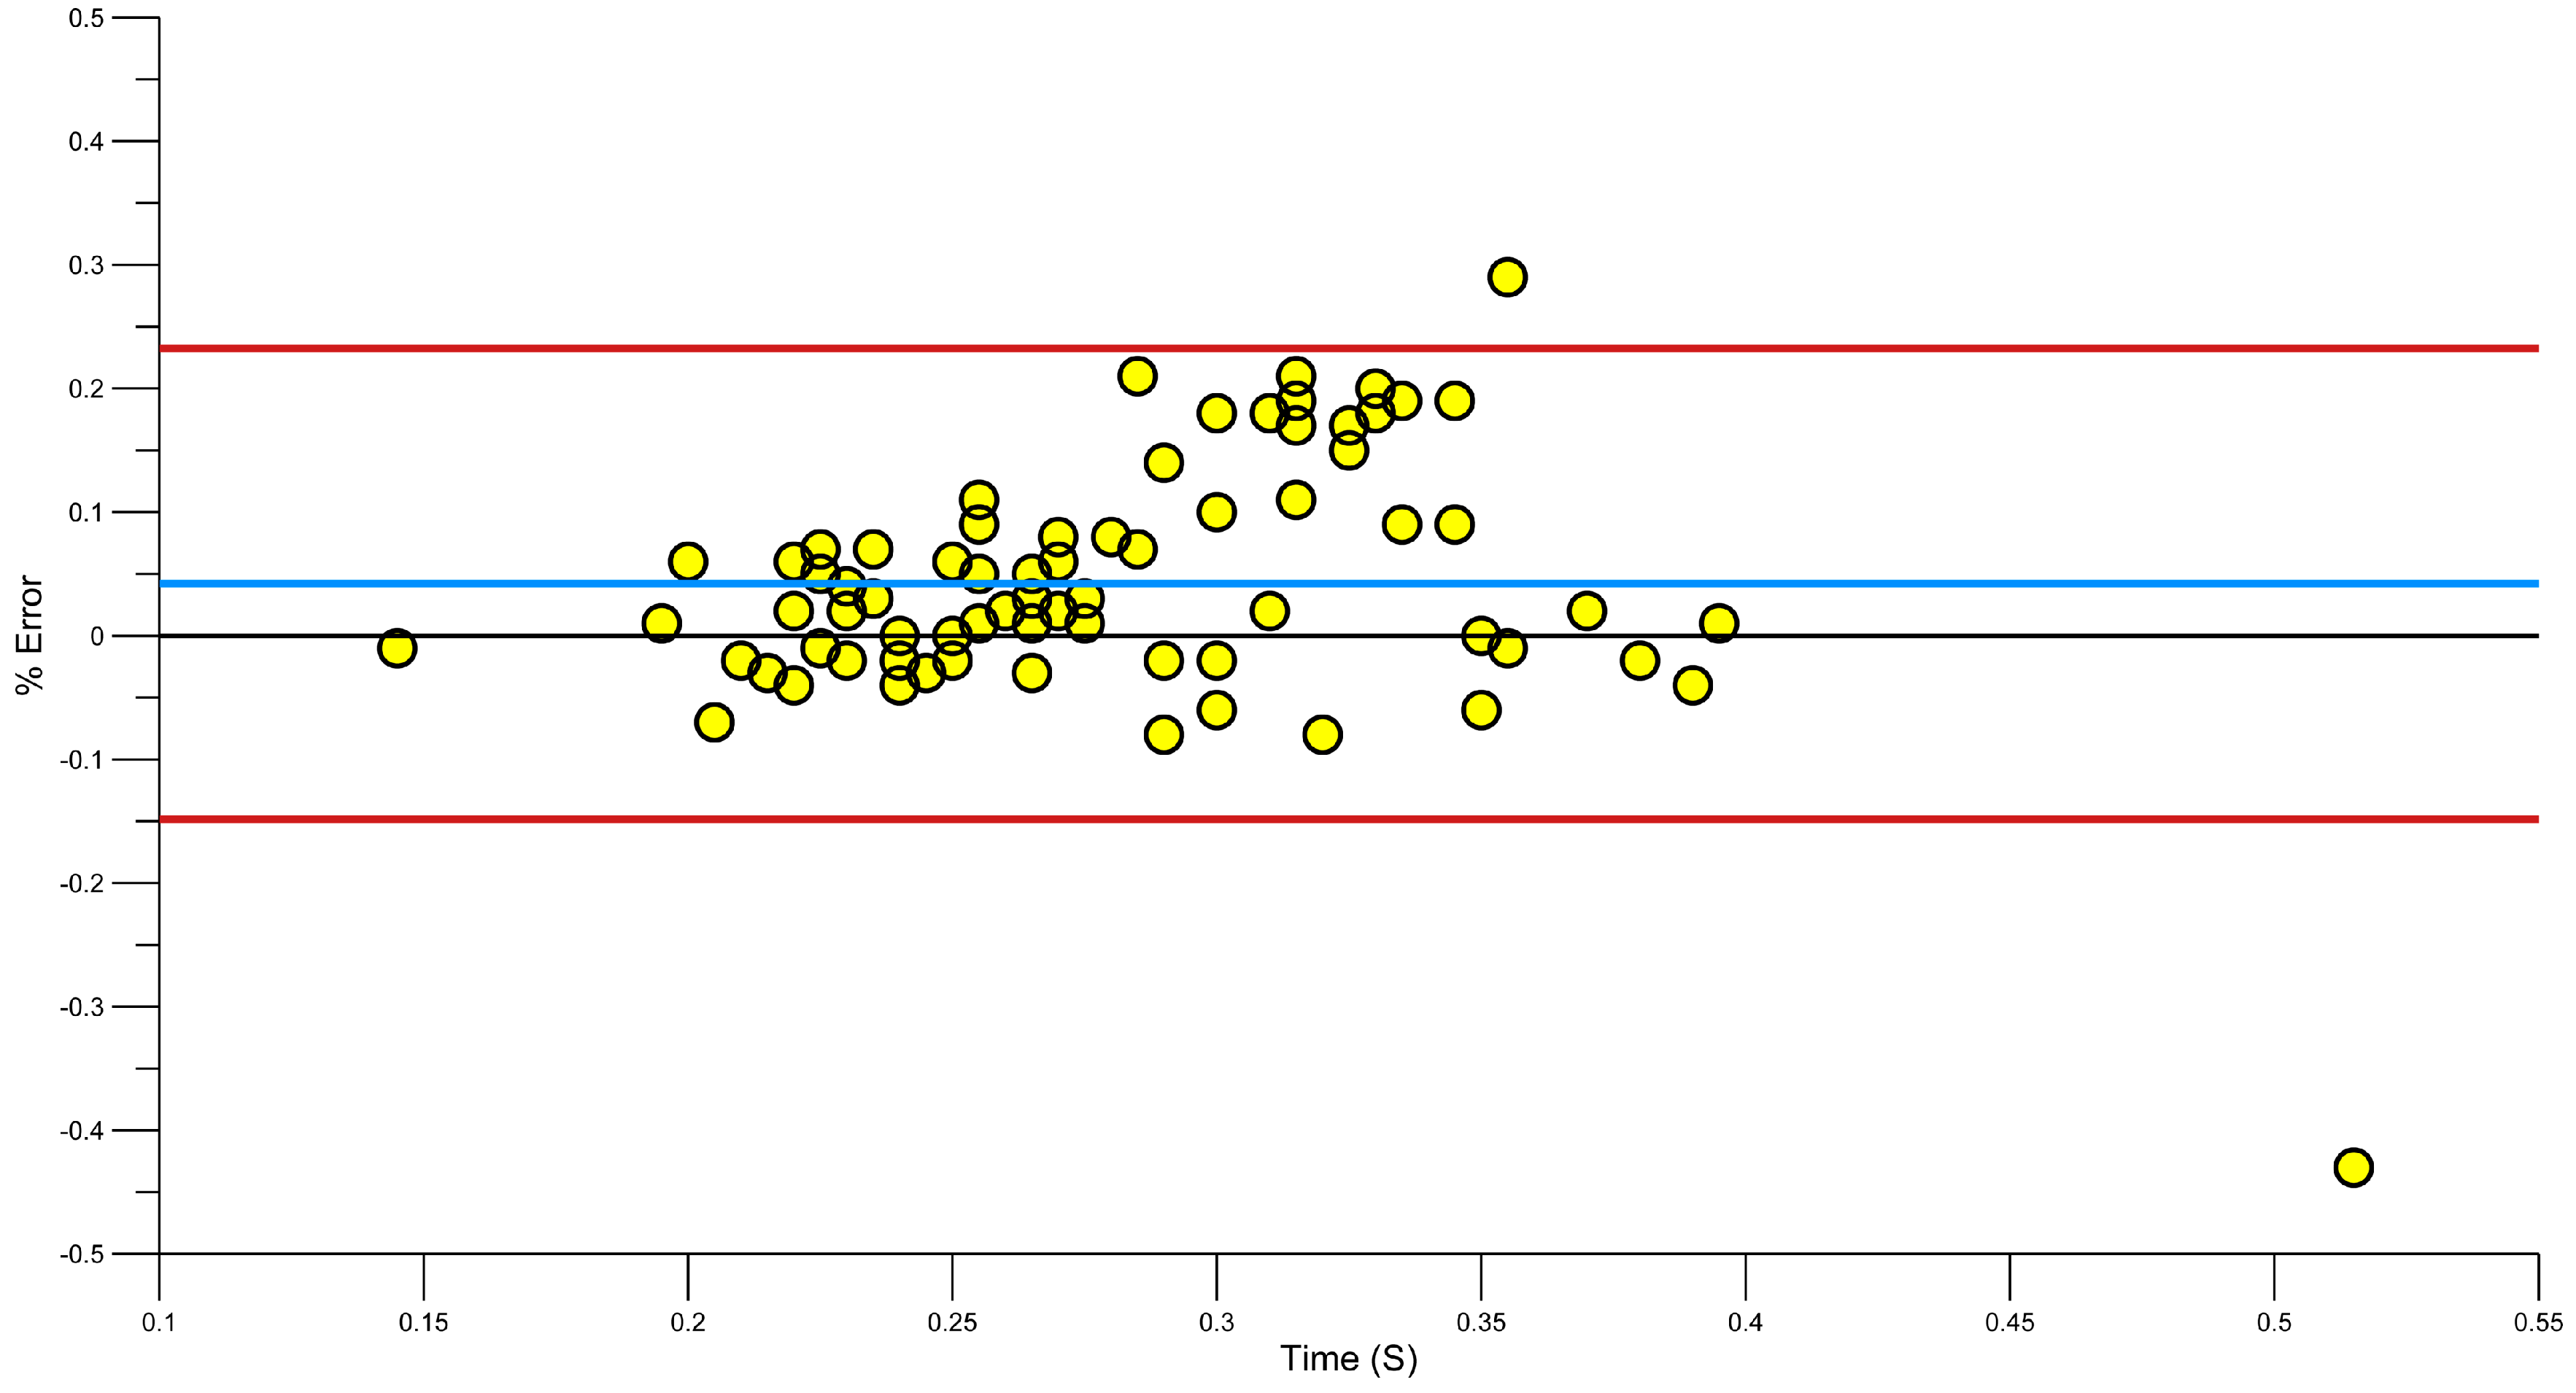
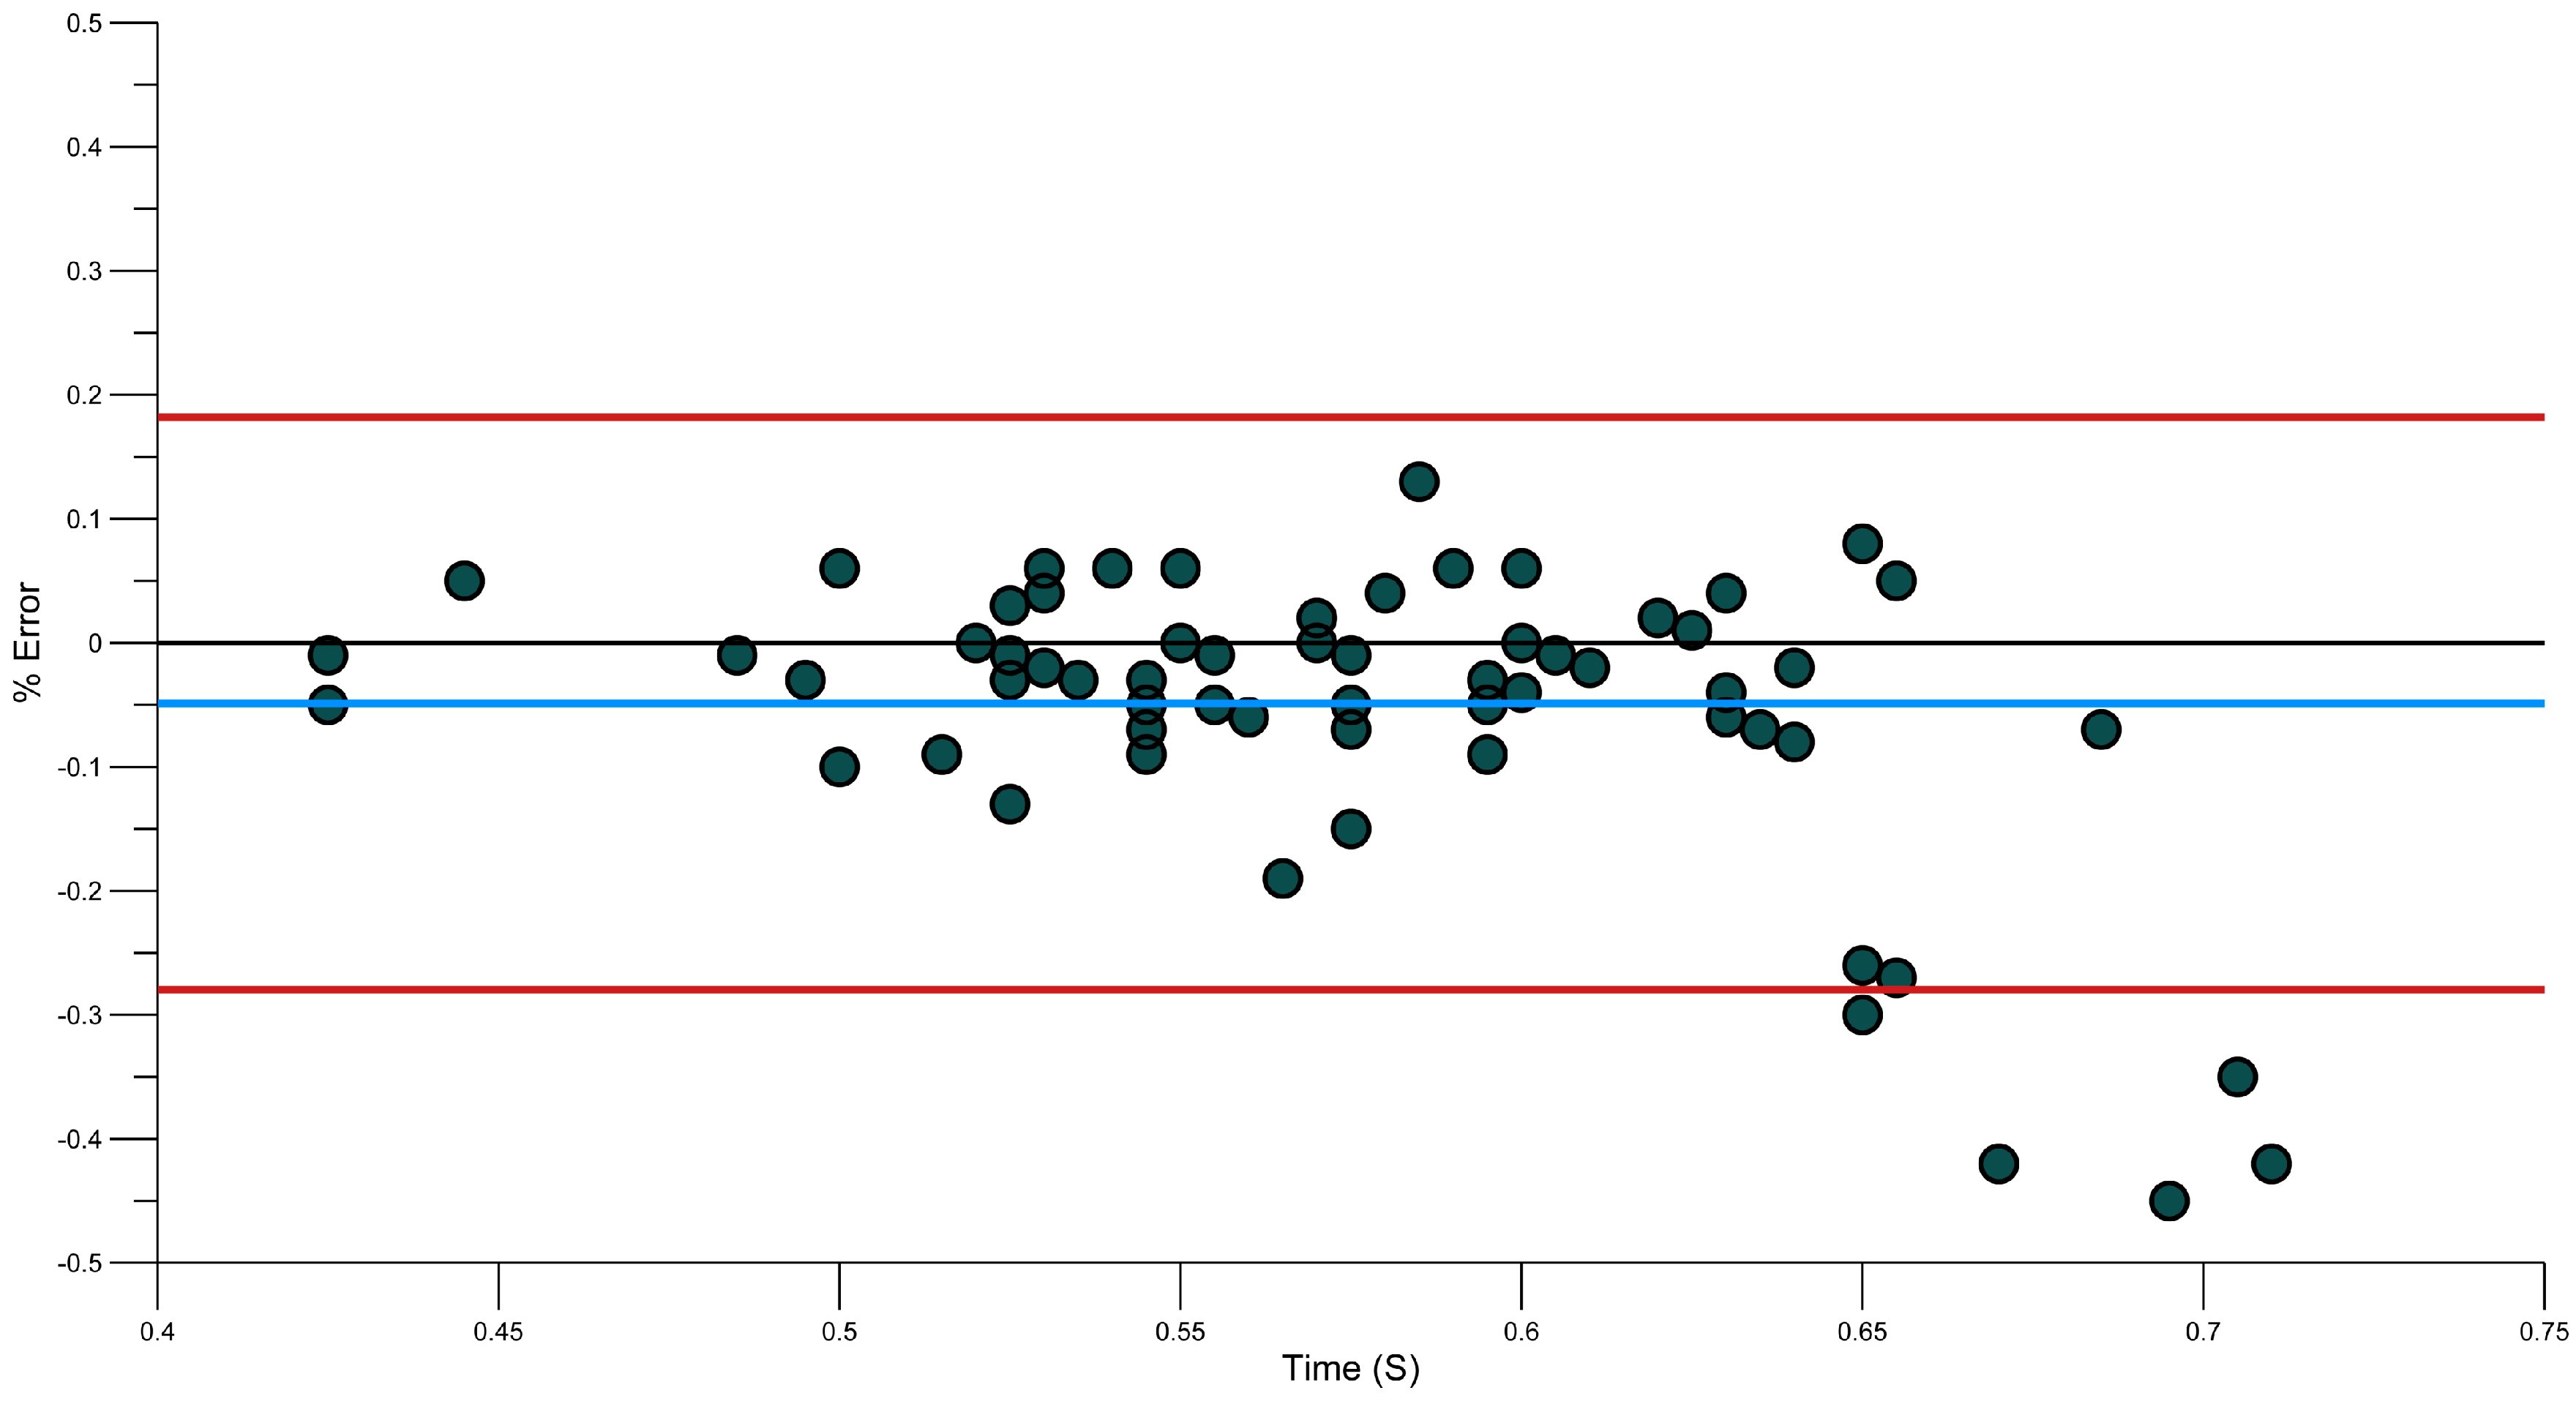
3.4. Reliability of Phase Durations Detection
| Mean Error (±SD) | Mean Absolute Error (±SD) | 95th Percentile for Absolute Error | Root Mean Squared Error | SEM | Systematic Bias | Random Error | |
|---|---|---|---|---|---|---|---|
| Entry (n = 78) | 0.00 (±0.08) | 0.06 (±0.06) | 0.15 | 0.08 | 0.06 | 0.00 | 0.16 |
| Pull (n = 78) | 0.04 (±0.10) | 0.07 (±0.08) | 0.20 | 0.10 | 0.07 | −0.04 | 0.19 |
| Push (n = 78) | 0.03 (±0.07) | 0.06 (±0.05) | 0.15 | 0.08 | 0.05 | 0.03 | 0.15 |
| Recovery (n = 71) | 0.05 (±0.12) | 0.08 (±0.1) | 0.33 | 0.13 | 0.08 | 0.05 | 0.23 |
3.5. Strengths
3.6. Limitations
3.7. Weakness
3.8. Practical Applications for the Athlete and Coach
“...the demands of the swimming coach and athlete, objective data on the swim performance is required”.
4. Conclusions
Acknowledgments
Conflicts of Interest
References
- Glazier, P.S.; Wheat, J.S.; Pease, D.L.; Bartlett, R.M. Dynamic systems theory and the functional role of movement variability. In Movement System Variability; Davids, K., Bennett, S., Newell, K., Eds.; Human Kinetics: Champaign, IL, USA, 2006; pp. 49–72. [Google Scholar]
- Pérez, P.; Llana, S.; Brizuela, G.; Encarnación, A. Effects of three feedback conditions on aerobic swim speeds. J. Sports Sci. Med. 2009, 8, 30–36. [Google Scholar] [PubMed]
- Williams, A.M.; Ford, P.R. Promoting a skills-based agenda in olympic sports: The role of skill-acquisition specialists. J. Sports Sci. 2009, 27, 1381–1392. [Google Scholar] [CrossRef] [PubMed]
- Franks, I.M.; Miller, G. Training coaches to observe and remember. J. Sports Sci. 1991, 9, 285–297. [Google Scholar] [CrossRef] [PubMed]
- Laird, P.; Waters, L. Eyewitness recollection of sport coaches. Int. J. Perform. Anal. Sport 2008, 8, 76–84. [Google Scholar]
- Hughes, M. Performance analysis—A 2004 perspective. Int. J. Perform. Anal. Sport 2004, 4, 103–109. [Google Scholar]
- Psycharakis, S.G.; Sanders, R.H. Body roll in swimming: A review. J. Sports Sci. 2010, 28, 229–236. [Google Scholar] [CrossRef] [PubMed]
- Hay, J.G. The Biomechanics of Sports Techniques, 4th ed.; Prentice-Hall: IA, USA, 1993. [Google Scholar]
- Osborough, C.D.; Payton, C.J.; Daly, D.J. Influence of swimming speed on inter-arm coordination in competitive unilateral arm amputee front crawl swimmers. Hum. Mov. Sci. 2010, 29, 921–931. [Google Scholar] [CrossRef] [PubMed]
- Ohgi, Y.; Ichikawa, H.; Miyaji, C. Characteristics of the Forearm Acceleration in Swimming. In Proceedings of the Symposium on Biomechanics and Medicine in Swimming VIII, Jyväskylä, Finland, 28 June–2 July 1998; Kesikinen, K.L., Komi, P.V., Hollander, A.P., Eds.; pp. 77–82.
- Ohgi, Y.; Yasumura, M.; Ichikawa, H.; Miyaji, C. Analysis of stroke technique using acceleration sensor ic in freestyle swimming. In The Engineering of Sport: Research, Development and Innovation; Subic, A.J., Haake, S.J., Eds.; Blackwell Science: Oxford, UK, 2000. [Google Scholar]
- Ohgi, Y.; Ichikawa, H. Microcomputer-based data logging device for accelerometry in swimming. Eng. Sport 2002, 4, 638–644. [Google Scholar]
- Ichikawa, H.; Ohgi, Y.; Miyaji, C.; Nomura, T. Estimation of arm motion in front crawl swimming using acclerometer. In Biomechanics and Medicine in Swimming IX, University of Saint-Etienne, France; Chatard, J., Ed.; University of Saint-Etienne: Saint-Etienne, France, 2003. [Google Scholar]
- Ichikawa, H.; Ohgi, Y.; Miyaji, C.; Nomura, T. Application of a mathematical model of arm motion in front crawl swimming to kinematical analysis using an accelerometer. Eng. Sport 2002, 4, 644–650. [Google Scholar]
- Davey, N.; Anderson, M.; James, D.A. Validation trial of an accelerometer-based sensor platform for swimming. Sports Technol. 2008, 1, 202–207. [Google Scholar] [CrossRef]
- Daukantas, S.; Marozas, V.; Lukosevicius, A. Inertial sensor for objective evaluation of swimmer performance. In Proceedings of the 11th International Biennial Baltic Electronics Conference (BEC 2008), Tallinn, Estonia, 6–8 October 2008; pp. 321–324.
- Fulton, S.K.; Pyne, D.B.; Burkett, B. Validity and reliability of kick count and rate in freestyle using inertial sensor technology. J. Sports Sci. 2009, 27, 1051–1058. [Google Scholar] [CrossRef] [PubMed]
- Bächlin, M.; Förster, K.; Tröster, G. Swimmaster: A wearable assistant for swimmer. In Proceedings of the 11th International Conference on Ubiquitous Computing, Orlando, FL, USA, 30 September–3 October 2009; pp. 215–224.
- Bächlin, M.; Tröster, G. Pervasive computing in swimming: A model describing acceleration data of body worn sensors in crawl swimming. In Proceedings of the 2009 Joint Conferences on Pervasive Computing (JCPC), Taipei, Taiwan, 3–5 December 2009; pp. 293–298.
- Bächlin, M.; Tröster, G. Swimming performance and technique evaluation with wearable acceleration sensors. Pervasive Mob. Comput. 2012, 8, 68–81. [Google Scholar] [CrossRef]
- Pansiot, J.; Lo, B.; Yang, G.-Z. Swimming stroke kinematic analysis with bsn. In Proceedings of the IEEE 2010 International Conference on Body Sensor Networks (BSN), Singapore, 7–9 June 2010; pp. 153–158.
- Nakashima, M.; Ohgi, Y.; Akiyama, E.; Kazami, N. Development of a swimming motion display system for athlete swimmers’ training using a wristwatch-style acceleration and gyroscopic sensor device. Procedia Eng. 2010, 2, 3035–3040. [Google Scholar] [CrossRef]
- Le Sage, T.; Bindel, A.; Conway, P.P.; Justham, L.; Slawson, S.; West, A. Embedded programming and real-time signal processing of swimming strokes. Sports Eng. 2011, 14, 1–14. [Google Scholar] [CrossRef]
- Stamm, A.; Thiel, D.V.; Burkett, B.; James, D.A. Towards determining absolute velocity of freestyle swimming using 3-axis accelerometers. Procedia Eng. 2011, 13, 120–125. [Google Scholar] [CrossRef]
- Stamm, A.; James, D.A.; Hagem, R.M.; Thiel, D.V. Investigating arm symmetry in swimming using inertial sensors. In Proceedings of the 2012 IEEE Sensors, Taipei, Tawain, 28–31 October 2012; pp. 1–4.
- Dadashi, F.; Crettenand, F.; Millet, G.P.; Seifert, L.; Komar, J.; Aminian, K. Automatic front-crawl temporal phase detection using adaptive filtering of inertial signals. J. Sports Sci. 2013, 31, 1251–1260. [Google Scholar] [CrossRef] [PubMed]
- Dadashi, F.; Crettenand, F.; Millet, G.P.; Aminian, K. Front-crawl instantaneous velocity estimation using a wearable inertial measurement unit. Sensors 2012, 12, 12927–12939. [Google Scholar] [CrossRef] [PubMed]
- Callaway, A.; Cobb, J.; Jones, I. A comparison of video and accelerometer based approaches applied to performance monitoring in swimming. Int. J. Sports Sci. Coach. 2009, 4, 139–153. [Google Scholar] [CrossRef]
- Perales, F.J. Human motion analysis & synthesis using computer vision and graphics techniques. State of art and applications. In Proceedings of the World Multiconference on Systemics, Cybernetics And Informatics (SCI2001), Orlando, FL, USA, 22–25 July 2001.
- Bonato, P. Advances in wearable technology and applications in physical medicine and rehabilitation. J. NeuroEng. Rehabil. 2005, 2. [Google Scholar] [CrossRef] [Green Version]
- Harding, J.W.; James, D.A. Performance assessment innovations for elite snowboarding. Procedia Eng. 2010, 2, 2919–2924. [Google Scholar] [CrossRef]
- Baca, A.; Dabnichki, P.; Heller, M.; Kornfeind, P. Ubiquitous computing in sports: A review and analysis. J. Sports Sci. 2009, 27, 1335–1346. [Google Scholar] [CrossRef] [PubMed]
- Mason, B. Biomechanics and Elite Competitive Swimming; International Society of Biomecahnics in Sport: Beijing, China, 2005. [Google Scholar]
- Bishop, D. An applied research model for the sport sciences. Sports Med. 2008, 38, 253–263. [Google Scholar] [CrossRef] [PubMed]
- Chollet, D.; Chalies, J.; Chatard, C. A new index of coordination for the crawl: Description and usefulness. Int. J. Sports 2000, 21, 54–59. [Google Scholar] [CrossRef]
- Ohgi, Y. Microcomputer-based acceleration sensor device for sports biomechanics—Stroke evaluation by using swimmer’s wrist acceleration. In Proceedings of the 2002 IEEE Sensors, Orlando, FL, USA, 12–14 June 2002; pp. 699–704.
- Ohgi, Y.; Ichikawa, H. Fatigue evaluation by using microcomputer-based acceleration data logger for swimming research. In Biomechanics and Medicine in Swimming IX, University of Saint-Etienne, France; Chatard, J., Ed.; University of Saint-Etienne: Saint-Etienne, France, 2003; p. 463. [Google Scholar]
- Lee, J.B.; Burkett, B.J.; Thiel, D.V.; James, D.A. Inertial sensor, 3d and 2d assessment of stroke phases in freestyle swimming. Procedia Eng. 2011, 13, 148–153. [Google Scholar] [CrossRef]
- Burkett, B.; Mellifont, R. Sport science and coaching in paralympic swimming. Int. J. Coach. Sci. 2008. [Google Scholar] [CrossRef]
- Alberty, M.; Sidney, M.; Pelayo, P.; Toussaint, H.M. Stroking characteristics during time to exhaustion tests. Med. Sci. Sports Exerc. 2009, 41, 637–644. [Google Scholar] [CrossRef] [PubMed]
- Berger, M.A.; Hollander, A.P.; de Groot, G. Determining propulsive force in front crawl swimming: A comparison of two methods. J. Sports Sci. 1999, 17, 97–105. [Google Scholar] [CrossRef] [PubMed]
- Burkett, B.; Mellifont, R.; Mason, B. The influence of swimming start components for selected olympic and paralympic swimmers. J. Appl. Biomech. 2010, 26, 134–141. [Google Scholar] [PubMed]
- Cappaert, J.M.; Heest, J.L.V. Angular momentum and swimming economy in the freestyle. In Proceedings of the Symposium on Biomechanics and Medicine in Swimming VIII, Jyväskylä, Finland, 28 June–2 July 1998; Kesikinen, K.L., Komi, P.V., Hollander, A.P., Eds.; pp. 59–63.
- Deschodt, V.J.; Rouard, A.H.; Monteil, K.M. Relationships between the three coorinates of the upper limb joints with swimming velocity. In Biomechanics and Medicine in Swimming VII; Troup, J.P., Hollander, A.P., Trappe, S.W., Cappaert, J.M., Trappe, T.A., Eds.; E & FN Spon: London, UK, 1996; pp. 52–58. [Google Scholar]
- Deschodt, V.J.; Rouard, A.H.; Monteil, K.M. Relative displacements of the wrist, elbow and shoulder. In Biomechanics and Medicine in Swimming VII; Troup, J.P., Hollander, A.P., Trappe, S.W., Cappaert, J.M., Trappe, T.A., Eds.; E & FN Spon: London, UK, 1996; pp. 105–111. [Google Scholar]
- Haffner, M.; Cappaert, J.M. Underwater analysis of the freestyle stroke from three different points in the stroke cycle. In Proceedings of the Symposium on Biomechanics and Medicine in Swimming VIII, Jyväskylä, Finalnd, 26 November–4 December 1999; Keskinen, K., Komi, P., Hollander, A.P., Eds.; University of Jyväskylä: Jyväskylä, Finalnd, 1999; pp. 153–157. [Google Scholar]
- Holmér, I. Analysis of acceleration as a measure of swimming proficiency. In Swimming III; Terauds, J., Bedingfield, E.W., Eds.; University Park Press: Baltimore, USA, 1978; pp. 118–124. [Google Scholar]
- Liu, Q.; Hay, J.G.; Andrews, J.G. Body roll and handpath in freestyle swimming: An experimental study. J. Appl. Biomech. 1993, 9, 238–253. [Google Scholar]
- Sanders, R.H. Some aspects of buttery technique of new zealand pan pacific squad swimmers. In Biomechanics and Medicine in Swimming VII; Troup, J.P., Hollander, A.P., Trappe, S.W., Cappaert, J.M., Trappe, T.A., Eds.; E & FN Spon: London, UK, 1996. [Google Scholar]
- Satkunskiene, D.; Schega, L.; Kunze, K.; Birzinyte, K.; Daly, D. Coordination in arm movements during crawl stroke in elite swimmers with a loco-motor disability. Hum. Mov. Sci. 2005, 24, 54–65. [Google Scholar] [CrossRef] [PubMed]
- Seifert, L.; Toussaint, H.M.; Alberty, M.; Schnitzler, C.; Chollet, D. Arm coordination, power, and swim efficiency in national and regional front crawl swimmers. Hum. Mov. Sci. 2010, 29, 426–439. [Google Scholar] [CrossRef] [PubMed]
- Toussaint, H.M.; van den Berg, C.; Beek, W.J. Pumped-up propulsion during front crawl swimming. Med. Sci. Sports Exerc. 2002, 34, 314–319. [Google Scholar] [CrossRef] [PubMed]
- Callaway, A.J.; Cobb, J.E. Linear acceleration measurement utilizing inter-instrument synchronization: A comparison between accelerometers and motion-based tracking approaches. Meas. Phys. Educ. Exerc. Sci. 2012, 16, 151–163. [Google Scholar] [CrossRef]
- Slawson, S.E.; Justham, L.M.; West, A.; Conway, P.P.; Caine, M.P.; Harrison, R. Accelerometer profile recognition of swimming strokes (p. 17). Eng. Sport 7 2008, 1, 81–87. [Google Scholar]
- Norton, K.; Olds, T. Anthropometrica; UNSW Press: New South Wales, Australia, 2002. [Google Scholar]
- O’Donoghue, P. Statistics for Sport and Exercise Studies: An Introduction; Routledge: Abingdon, UK, 2013. [Google Scholar]
- Cohen, J. A power primer. Psychol.Bull. 1992, 112, 155. [Google Scholar] [CrossRef] [PubMed]
- Hughes, M.; Cooper, S.M.; Nevill, A. Analysis procedures for non-parametric data from performance analysis. Int. J. Perform. Anal. Sport 2002, 2, 6–20. [Google Scholar]
- O’Donoghue, P. Research Methods for Sports Performance Analysis; Routledge: Abingdon, Oxon, UK, 2010. [Google Scholar]
- Sato, K.; Smith, S.L.; Sands, W.A. Validation of an accelerometer for measuring sport performance. J. Strength Cond. Res. 2009, 23, 341–347. [Google Scholar] [CrossRef] [PubMed]
- Hopkins, W. Bias in bland-altman but not regression validity analyses. Sportscience 2004, 8, 42–46. [Google Scholar]
- Costill, D.L.; Kovaleski, J.; Porter, D.; Kirwan, J.; Fielding, R.; King, D. Energy expenditure during front crawl swimming: Predicting success in middle-distance events. Int. J. Sports Med. 1985, 6, 266–270. [Google Scholar] [CrossRef] [PubMed]
- Chollet, D.; Pelayo, P.; Delaplace, C.; Tourny, C.; Sidney, M. Stroking characteristic variations in the 100-m freestyle for male swimmers of differing skill. Percept. Motor Skills 1997, 85, 167–177. [Google Scholar] [CrossRef] [PubMed]
- Craig, A.B.; Skehan, P.L.; Pawelczyk, J.A.; Boomer, W.L. Velocity, stroke rate, and distance per stroke during elite swimming competition. Med Sci Sports Exerc 1985, 17, 625–634. [Google Scholar] [CrossRef] [PubMed]
- Hawley, J.A.; Williams, M.; Vickovic, M.; Handcock, P. Muscle power predicts freestyle swimming performance. Brit. J. Sport Med. 1992, 26, 151–155. [Google Scholar] [CrossRef]
- Schnitzler, C.; Seifert, L.; Chollet, D. Variability of coordination parameters at 400-m front crawl swimming pace. J. Sports Sci. Med. 2008, 8, 203–210. [Google Scholar]
- Thayer, A.; Hay, J. Motivating start and turn improvement. Swim. Tech. 1984, 20, 17–20. [Google Scholar]
- Yeadon, M.R.; King, M.A. A method for synchronising digitised video data. J. Biomech. 1999, 32, 983–986. [Google Scholar] [CrossRef] [PubMed] [Green Version]
- Davids, K.; Glazier, P.; Araújo, D.; Bartlett, R. Movement systems as dynamical systems: The functional role of variability and its implications for sports medicine. Sports Med. 2003, 33, 245–260. [Google Scholar] [CrossRef] [PubMed]
- Wulf, G.; Chiviacowsky, S.; Schiller, E.; Ávila, L.T.G. Frequent external focus feedback enhances motor learning. Mov. Sci. Sport Psychol. 2010, 1, 190. [Google Scholar]
- Lauber, B.; Keller, M. Improving motor performance: Selected aspects of augmented feedback in exercise and health. Eur. J. Sport Sci. 2012, 14, 36–43. [Google Scholar] [CrossRef] [PubMed]
- Rowlands, D.D.; James, D.A.; Lee, J.B. Visualization of wearable sensor data during swimming for performance analysis. Sports Technology 2014, 6, 1–7. [Google Scholar]
© 2015 by the authors; licensee MDPI, Basel, Switzerland. This article is an open access article distributed under the terms and conditions of the Creative Commons Attribution license (http://creativecommons.org/licenses/by/4.0/).
Share and Cite
Callaway, A.J. Measuring Kinematic Variables in Front Crawl Swimming Using Accelerometers: A Validation Study. Sensors 2015, 15, 11363-11386. https://doi.org/10.3390/s150511363
Callaway AJ. Measuring Kinematic Variables in Front Crawl Swimming Using Accelerometers: A Validation Study. Sensors. 2015; 15(5):11363-11386. https://doi.org/10.3390/s150511363
Chicago/Turabian StyleCallaway, Andrew J. 2015. "Measuring Kinematic Variables in Front Crawl Swimming Using Accelerometers: A Validation Study" Sensors 15, no. 5: 11363-11386. https://doi.org/10.3390/s150511363