
Tracking Diurnal Variation in Photosynthetic Down-Regulation Using Low Cost Spectroscopic Instrumentation

Abstract
:1. Introduction
2. Methods
2.1. Study Area
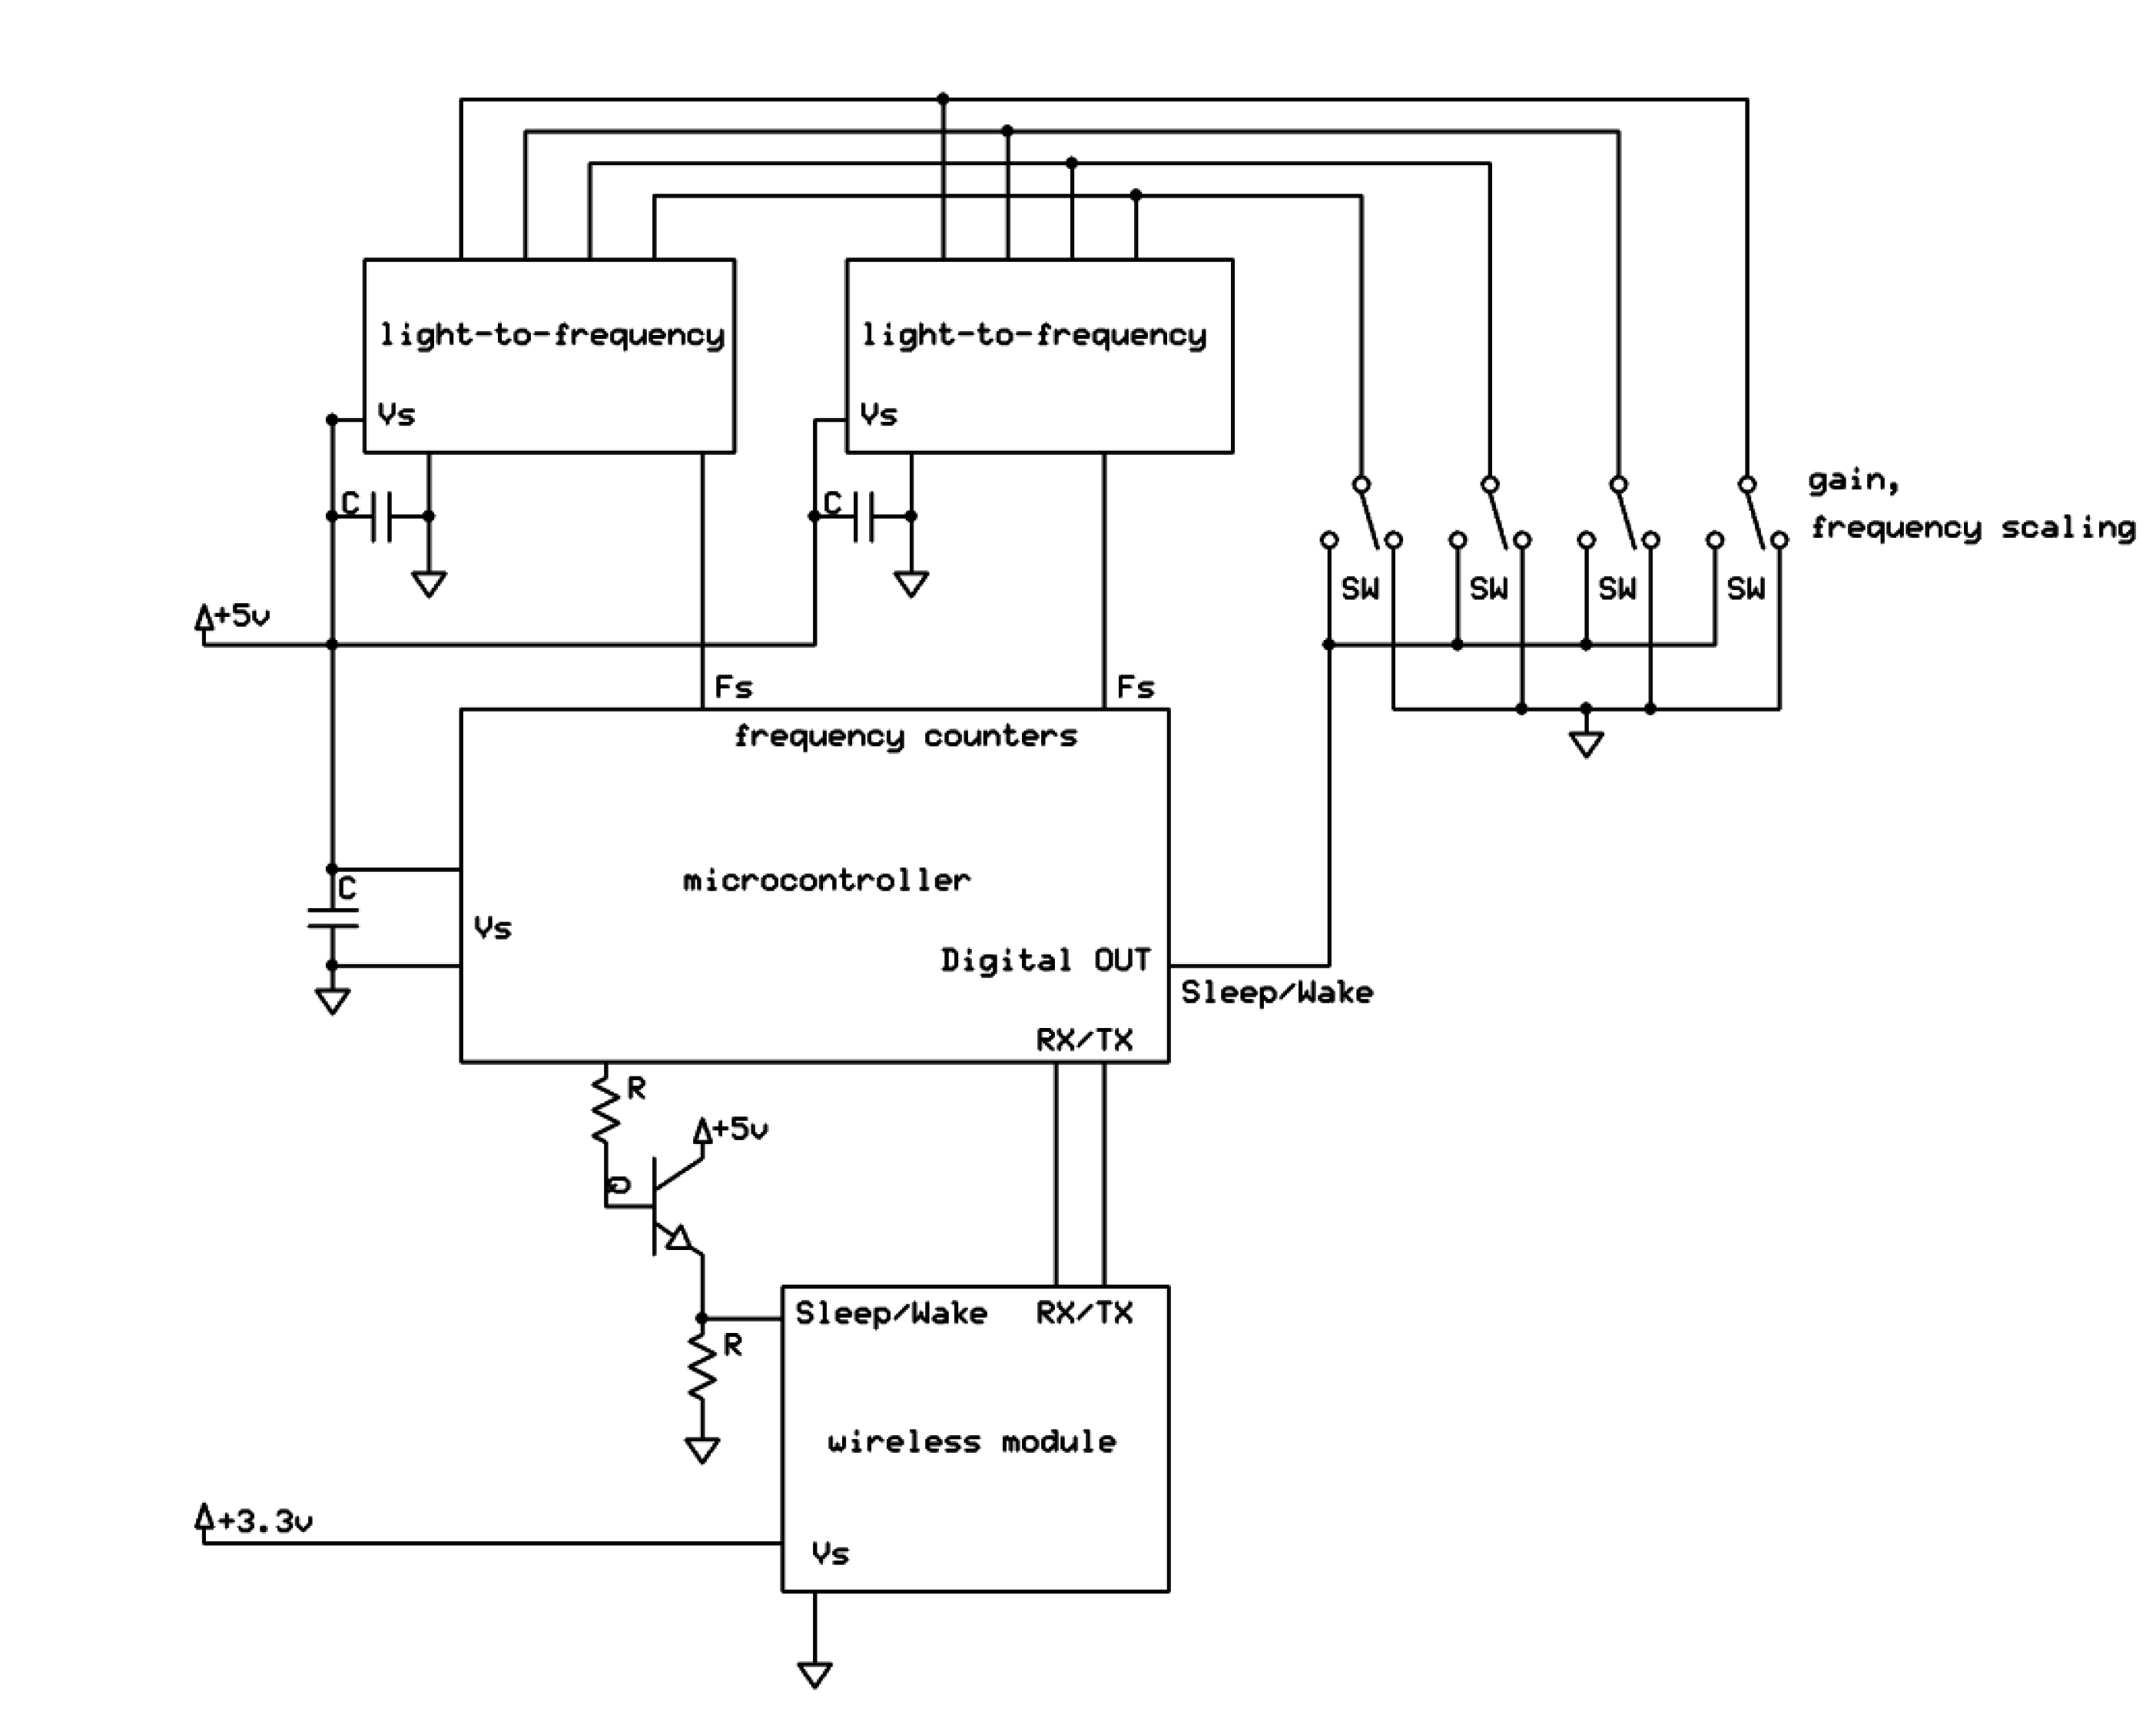
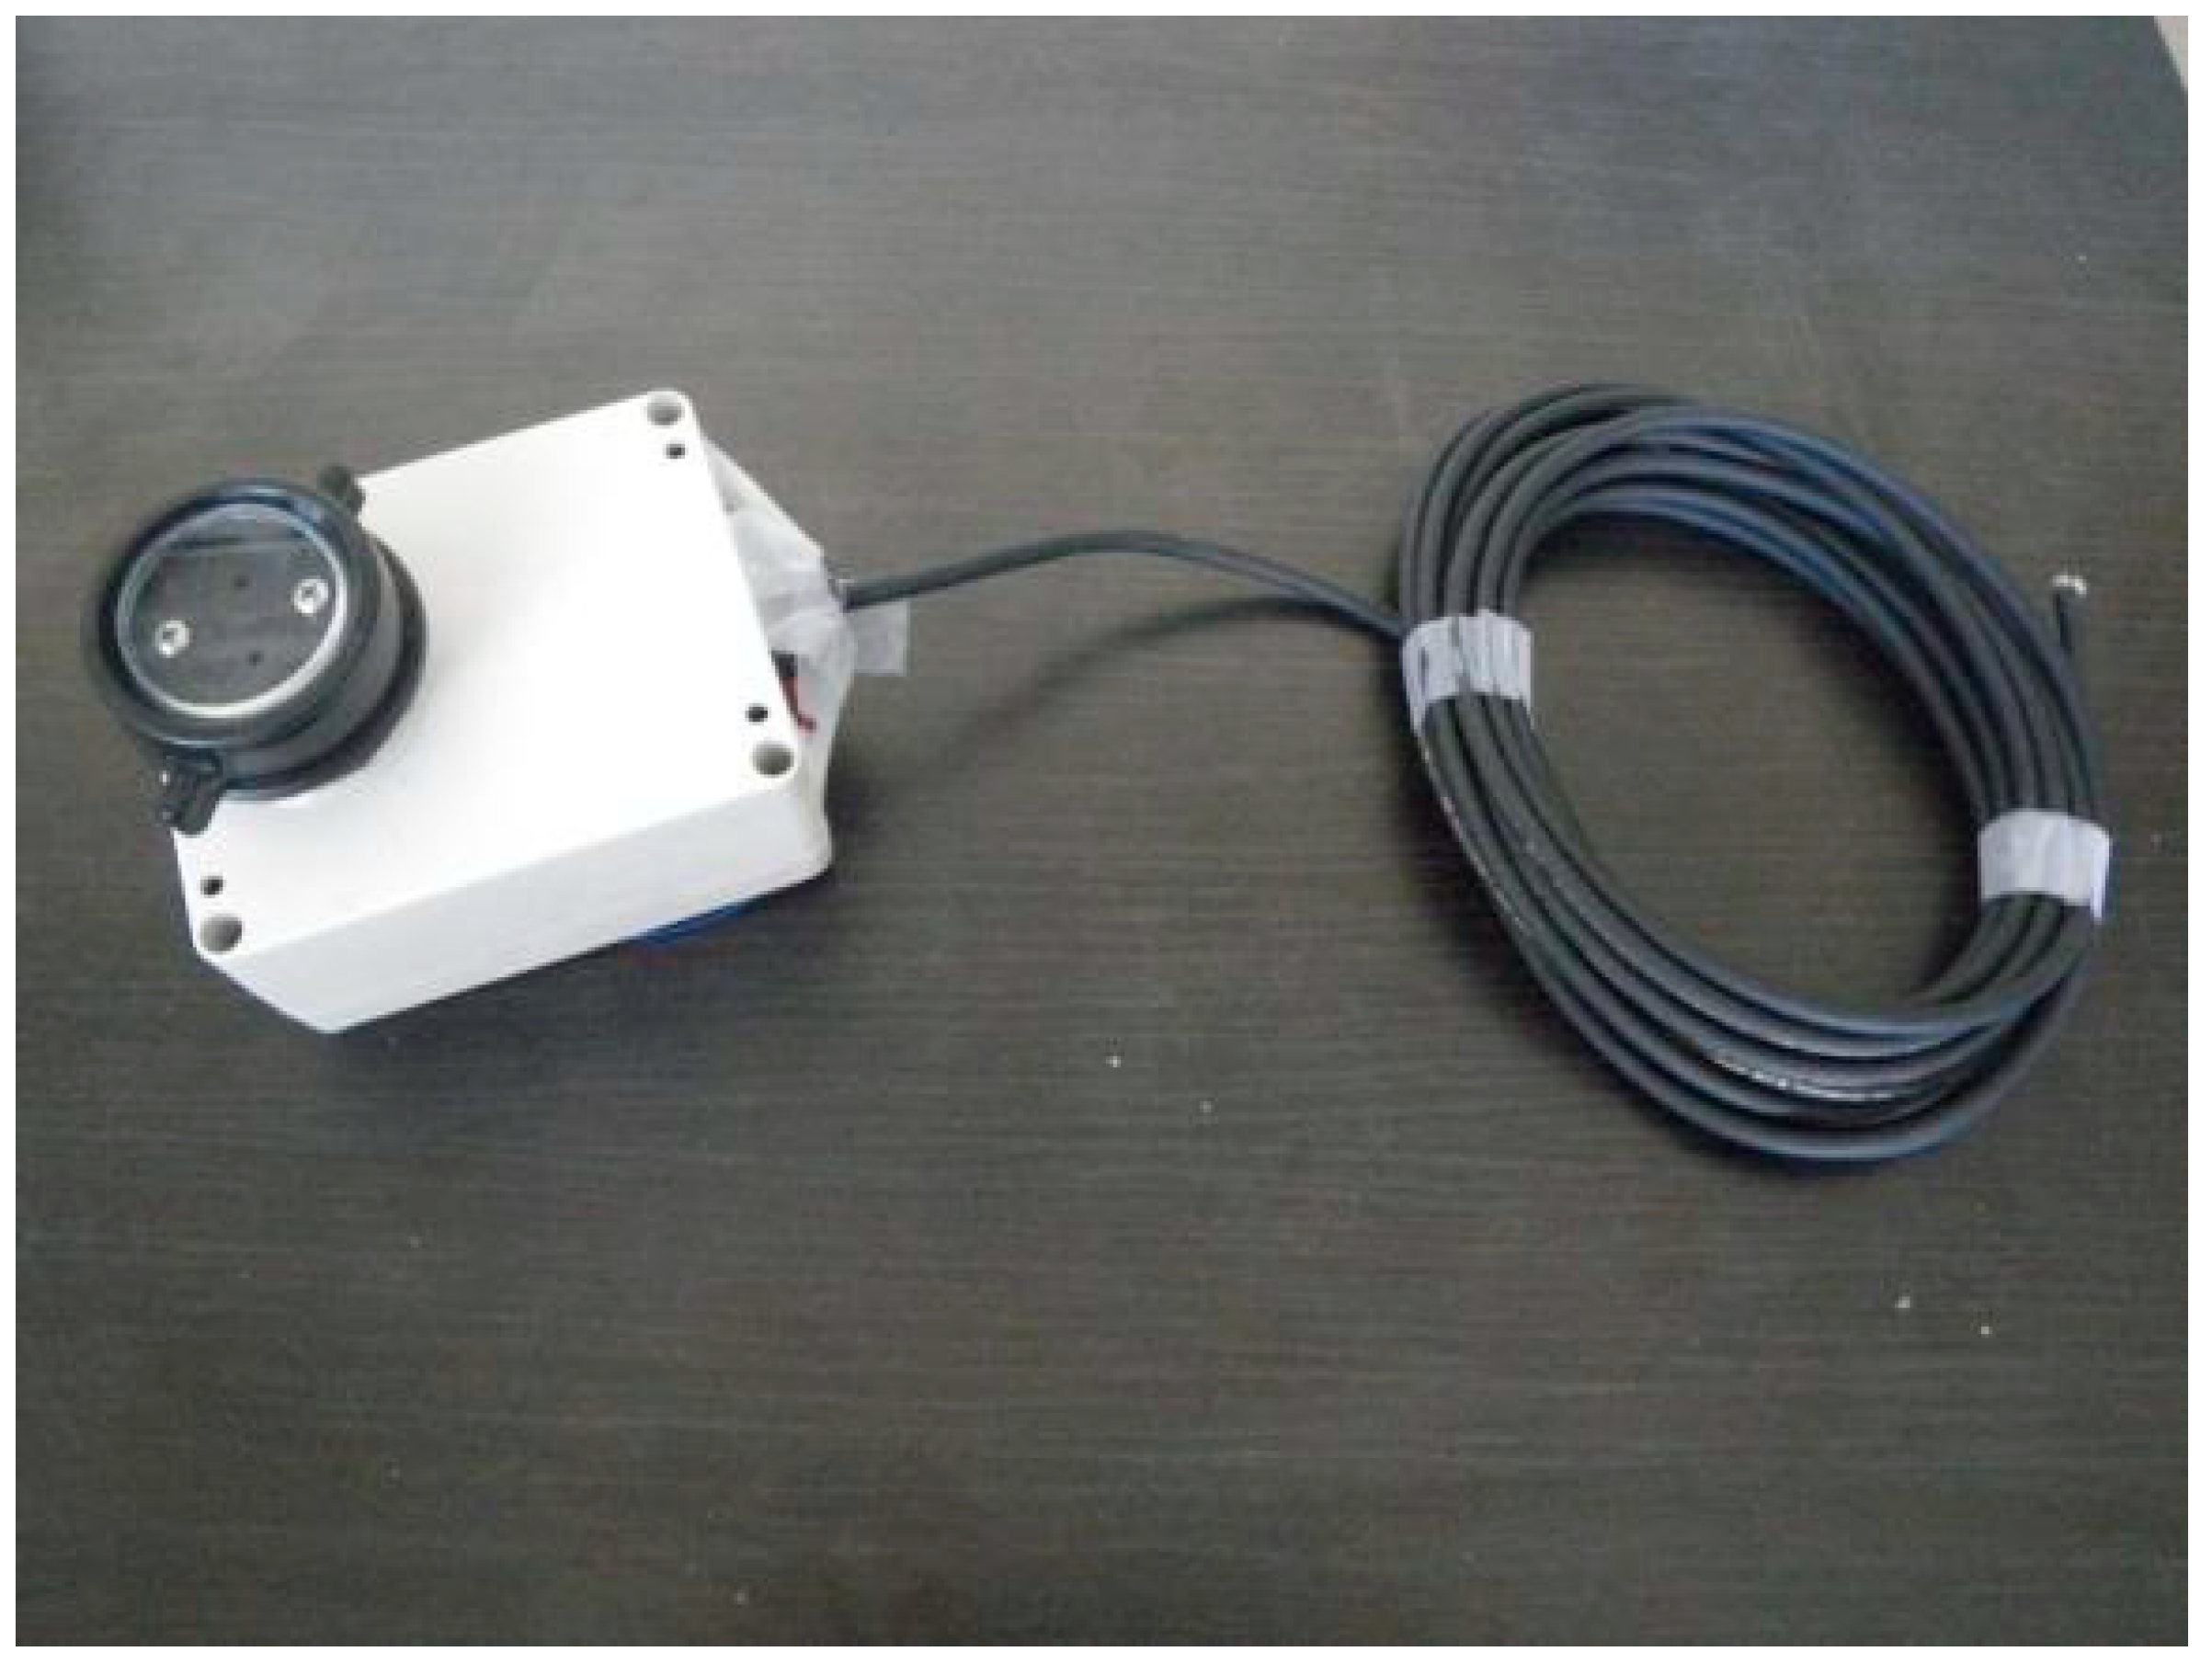
2.2. Sensor Design


2.3. Data
3. Processing
4. Results and Discussion
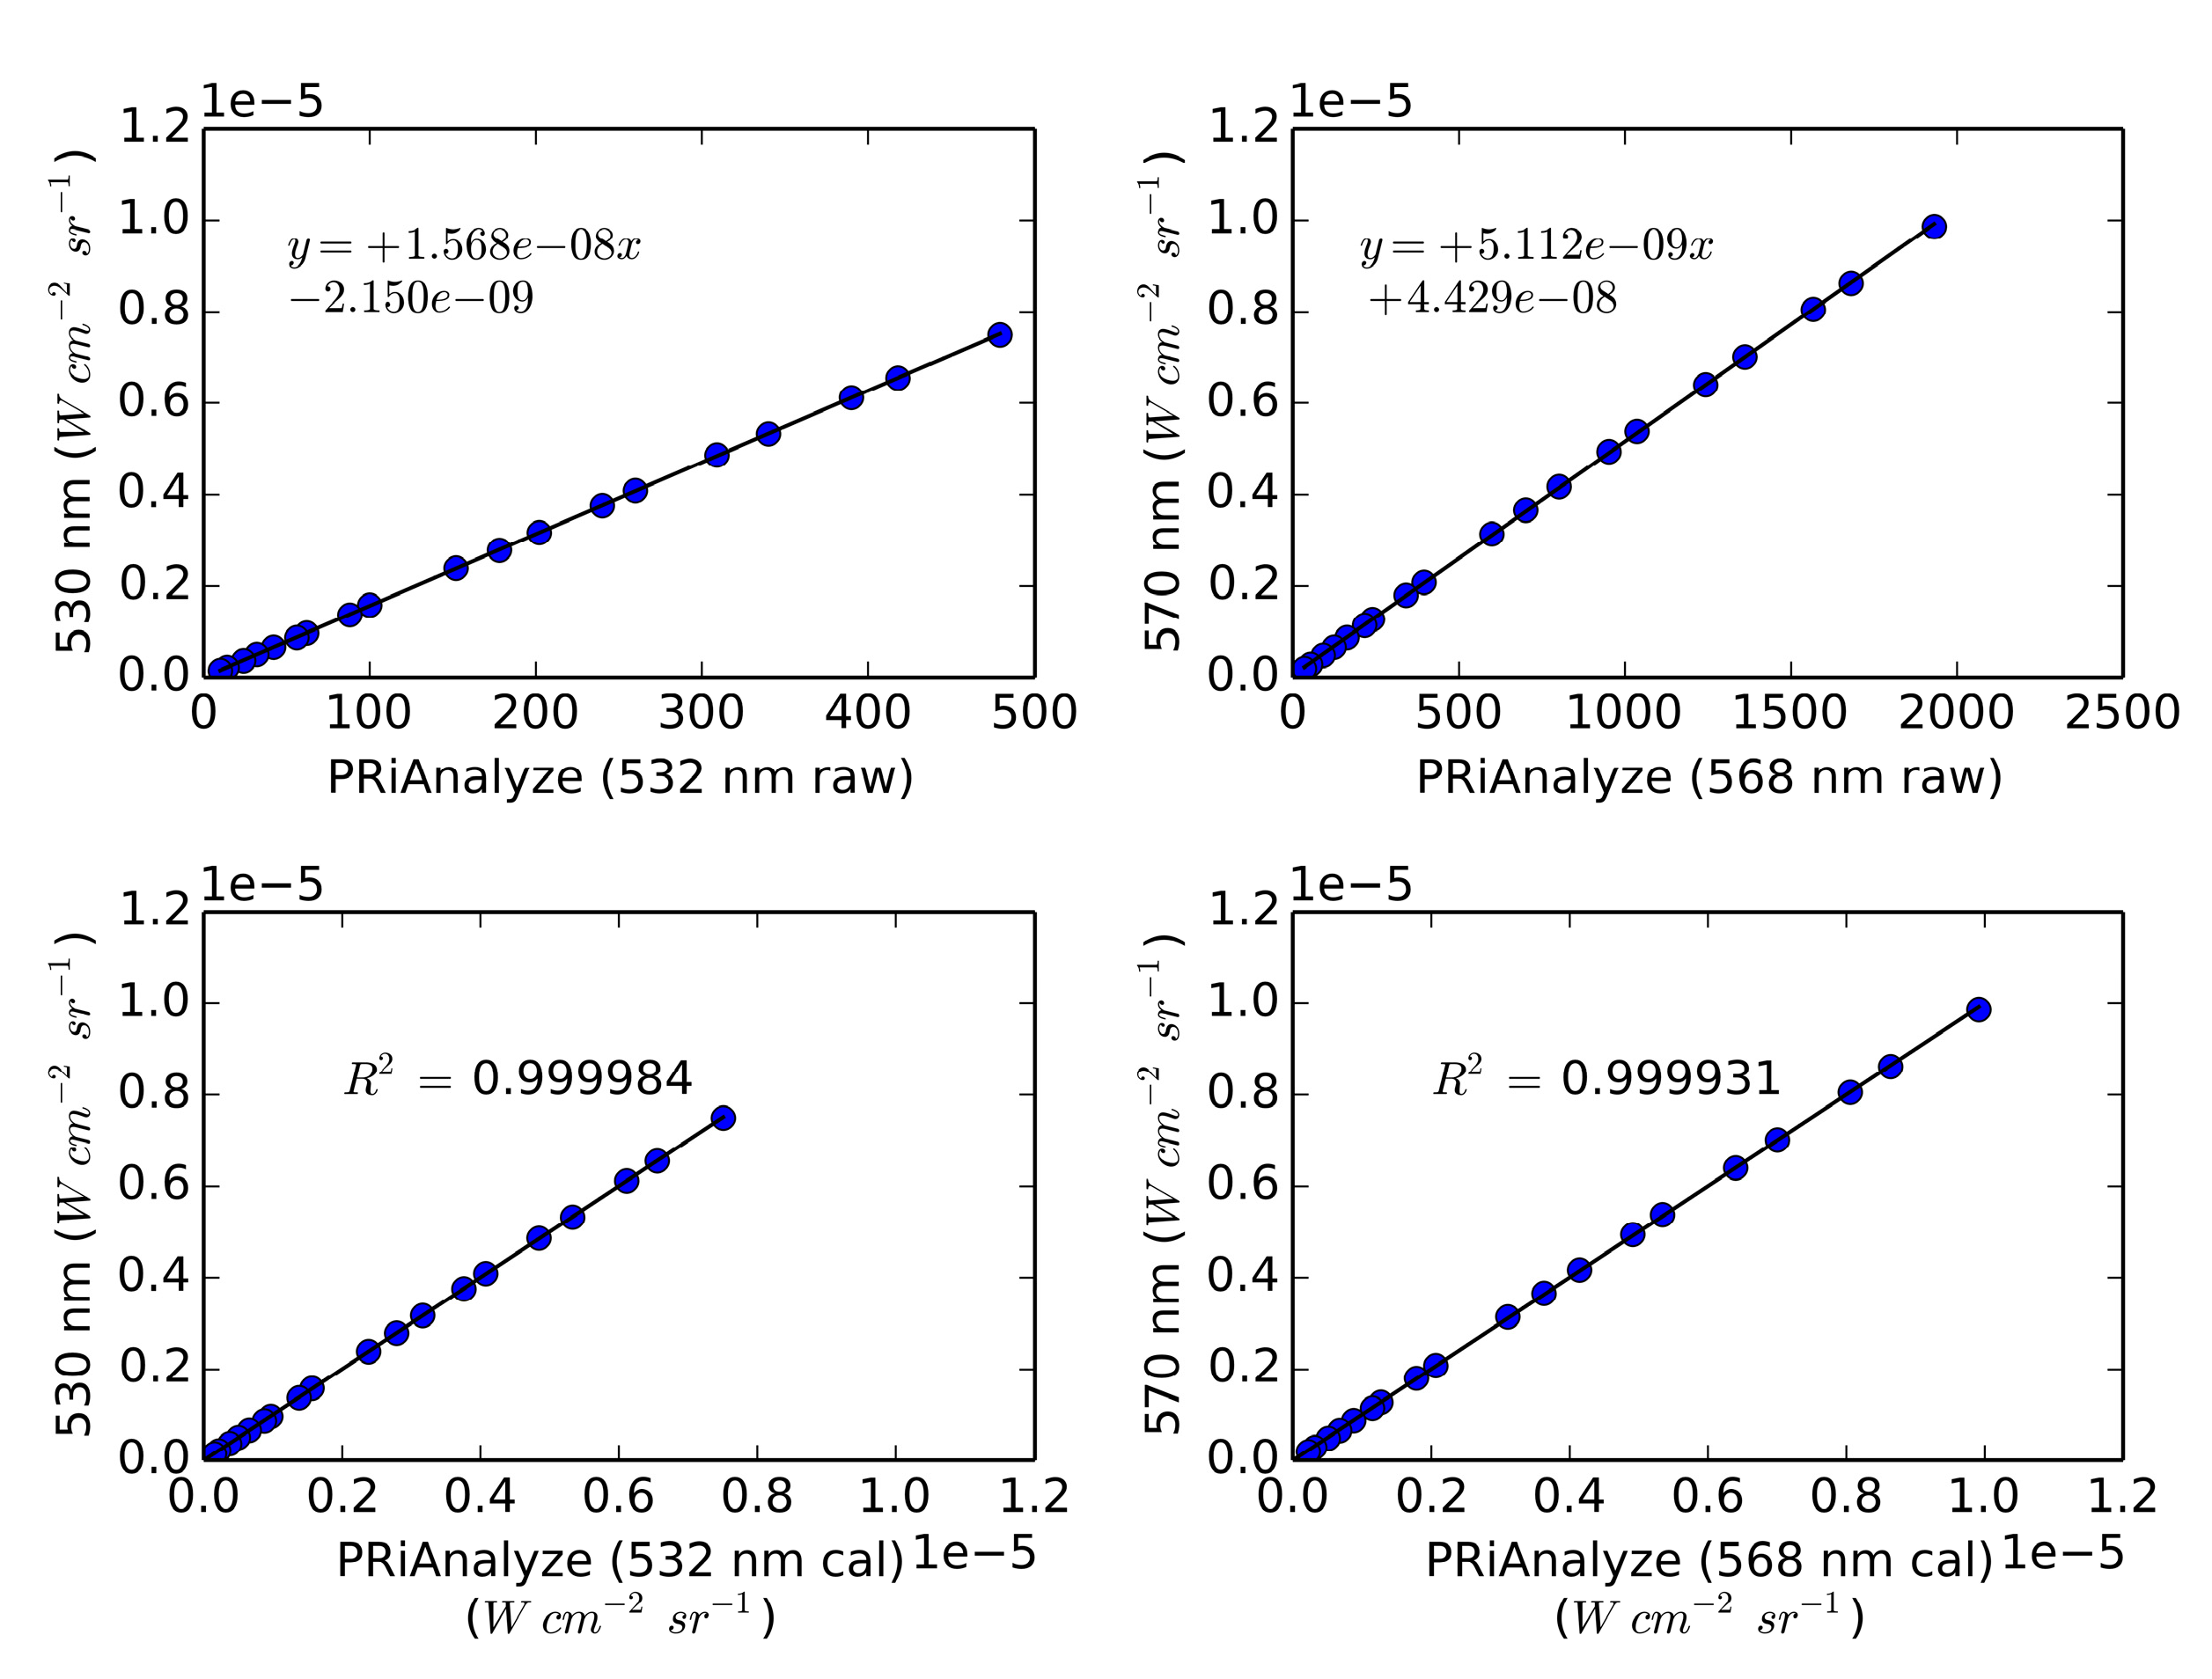
4.1. Calibration

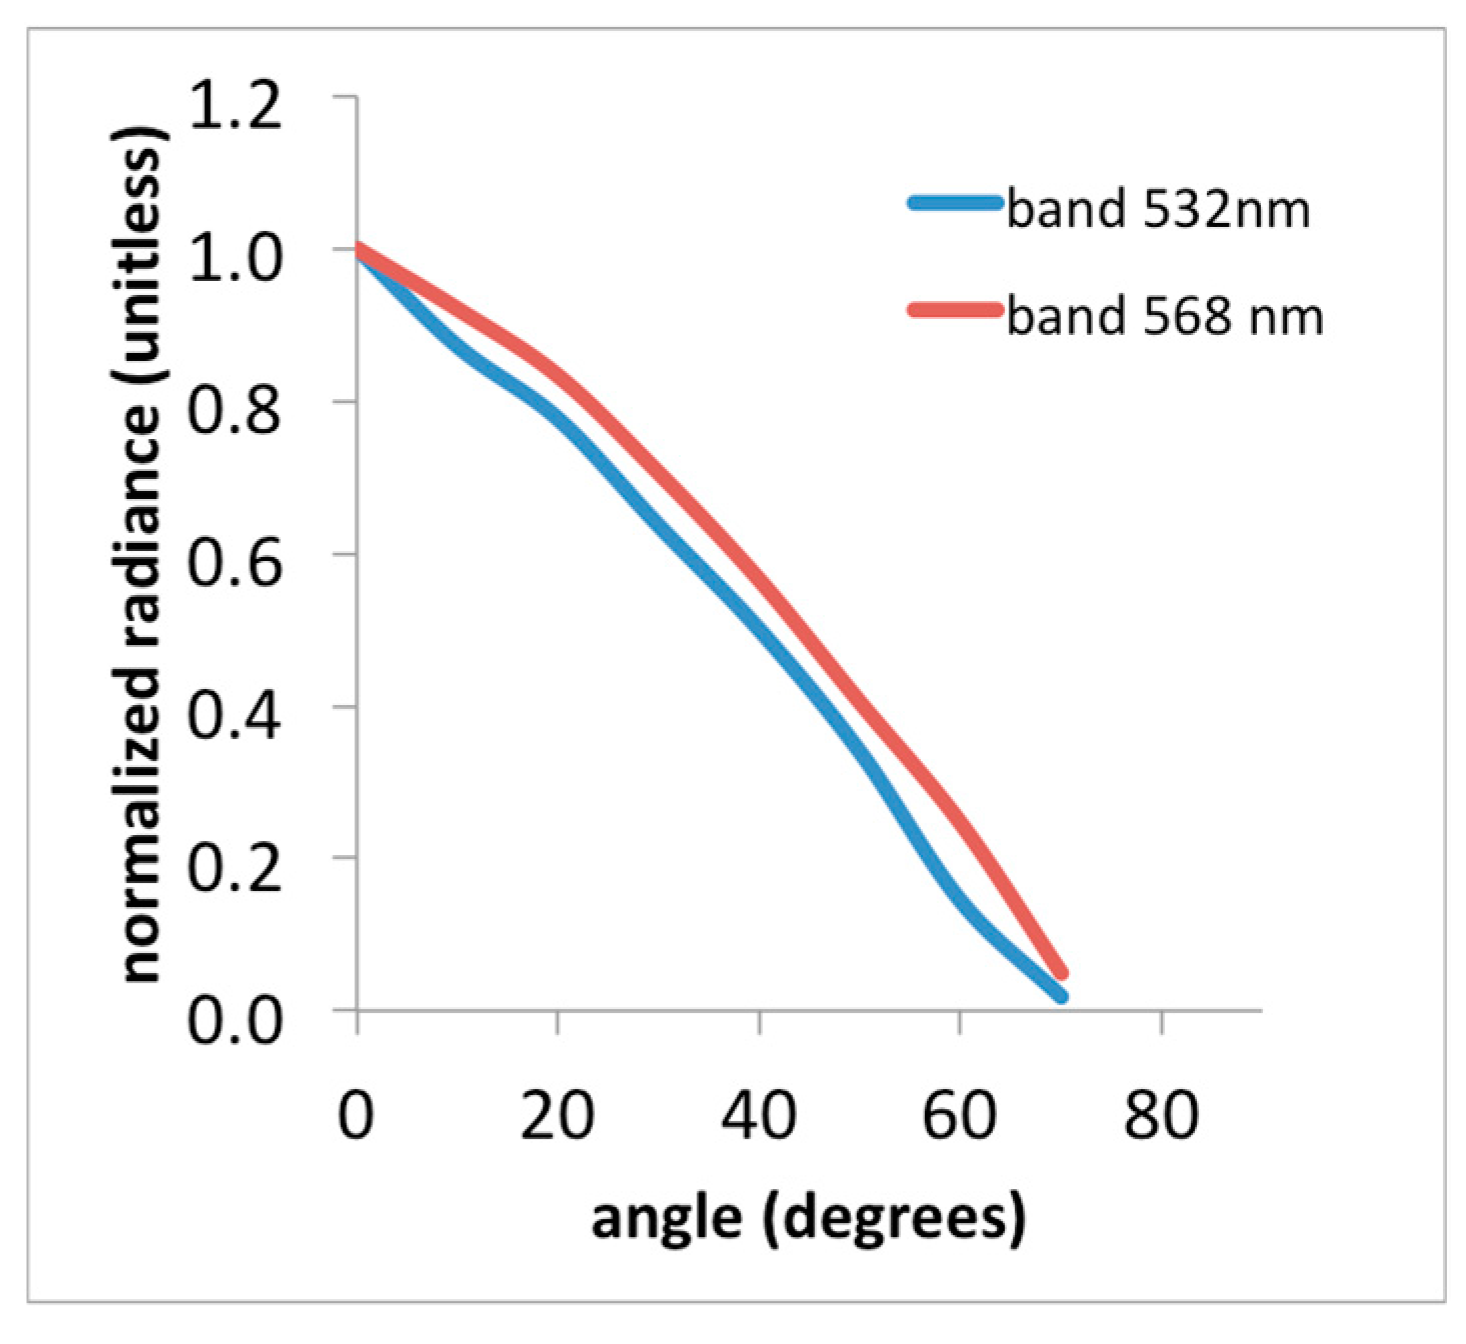
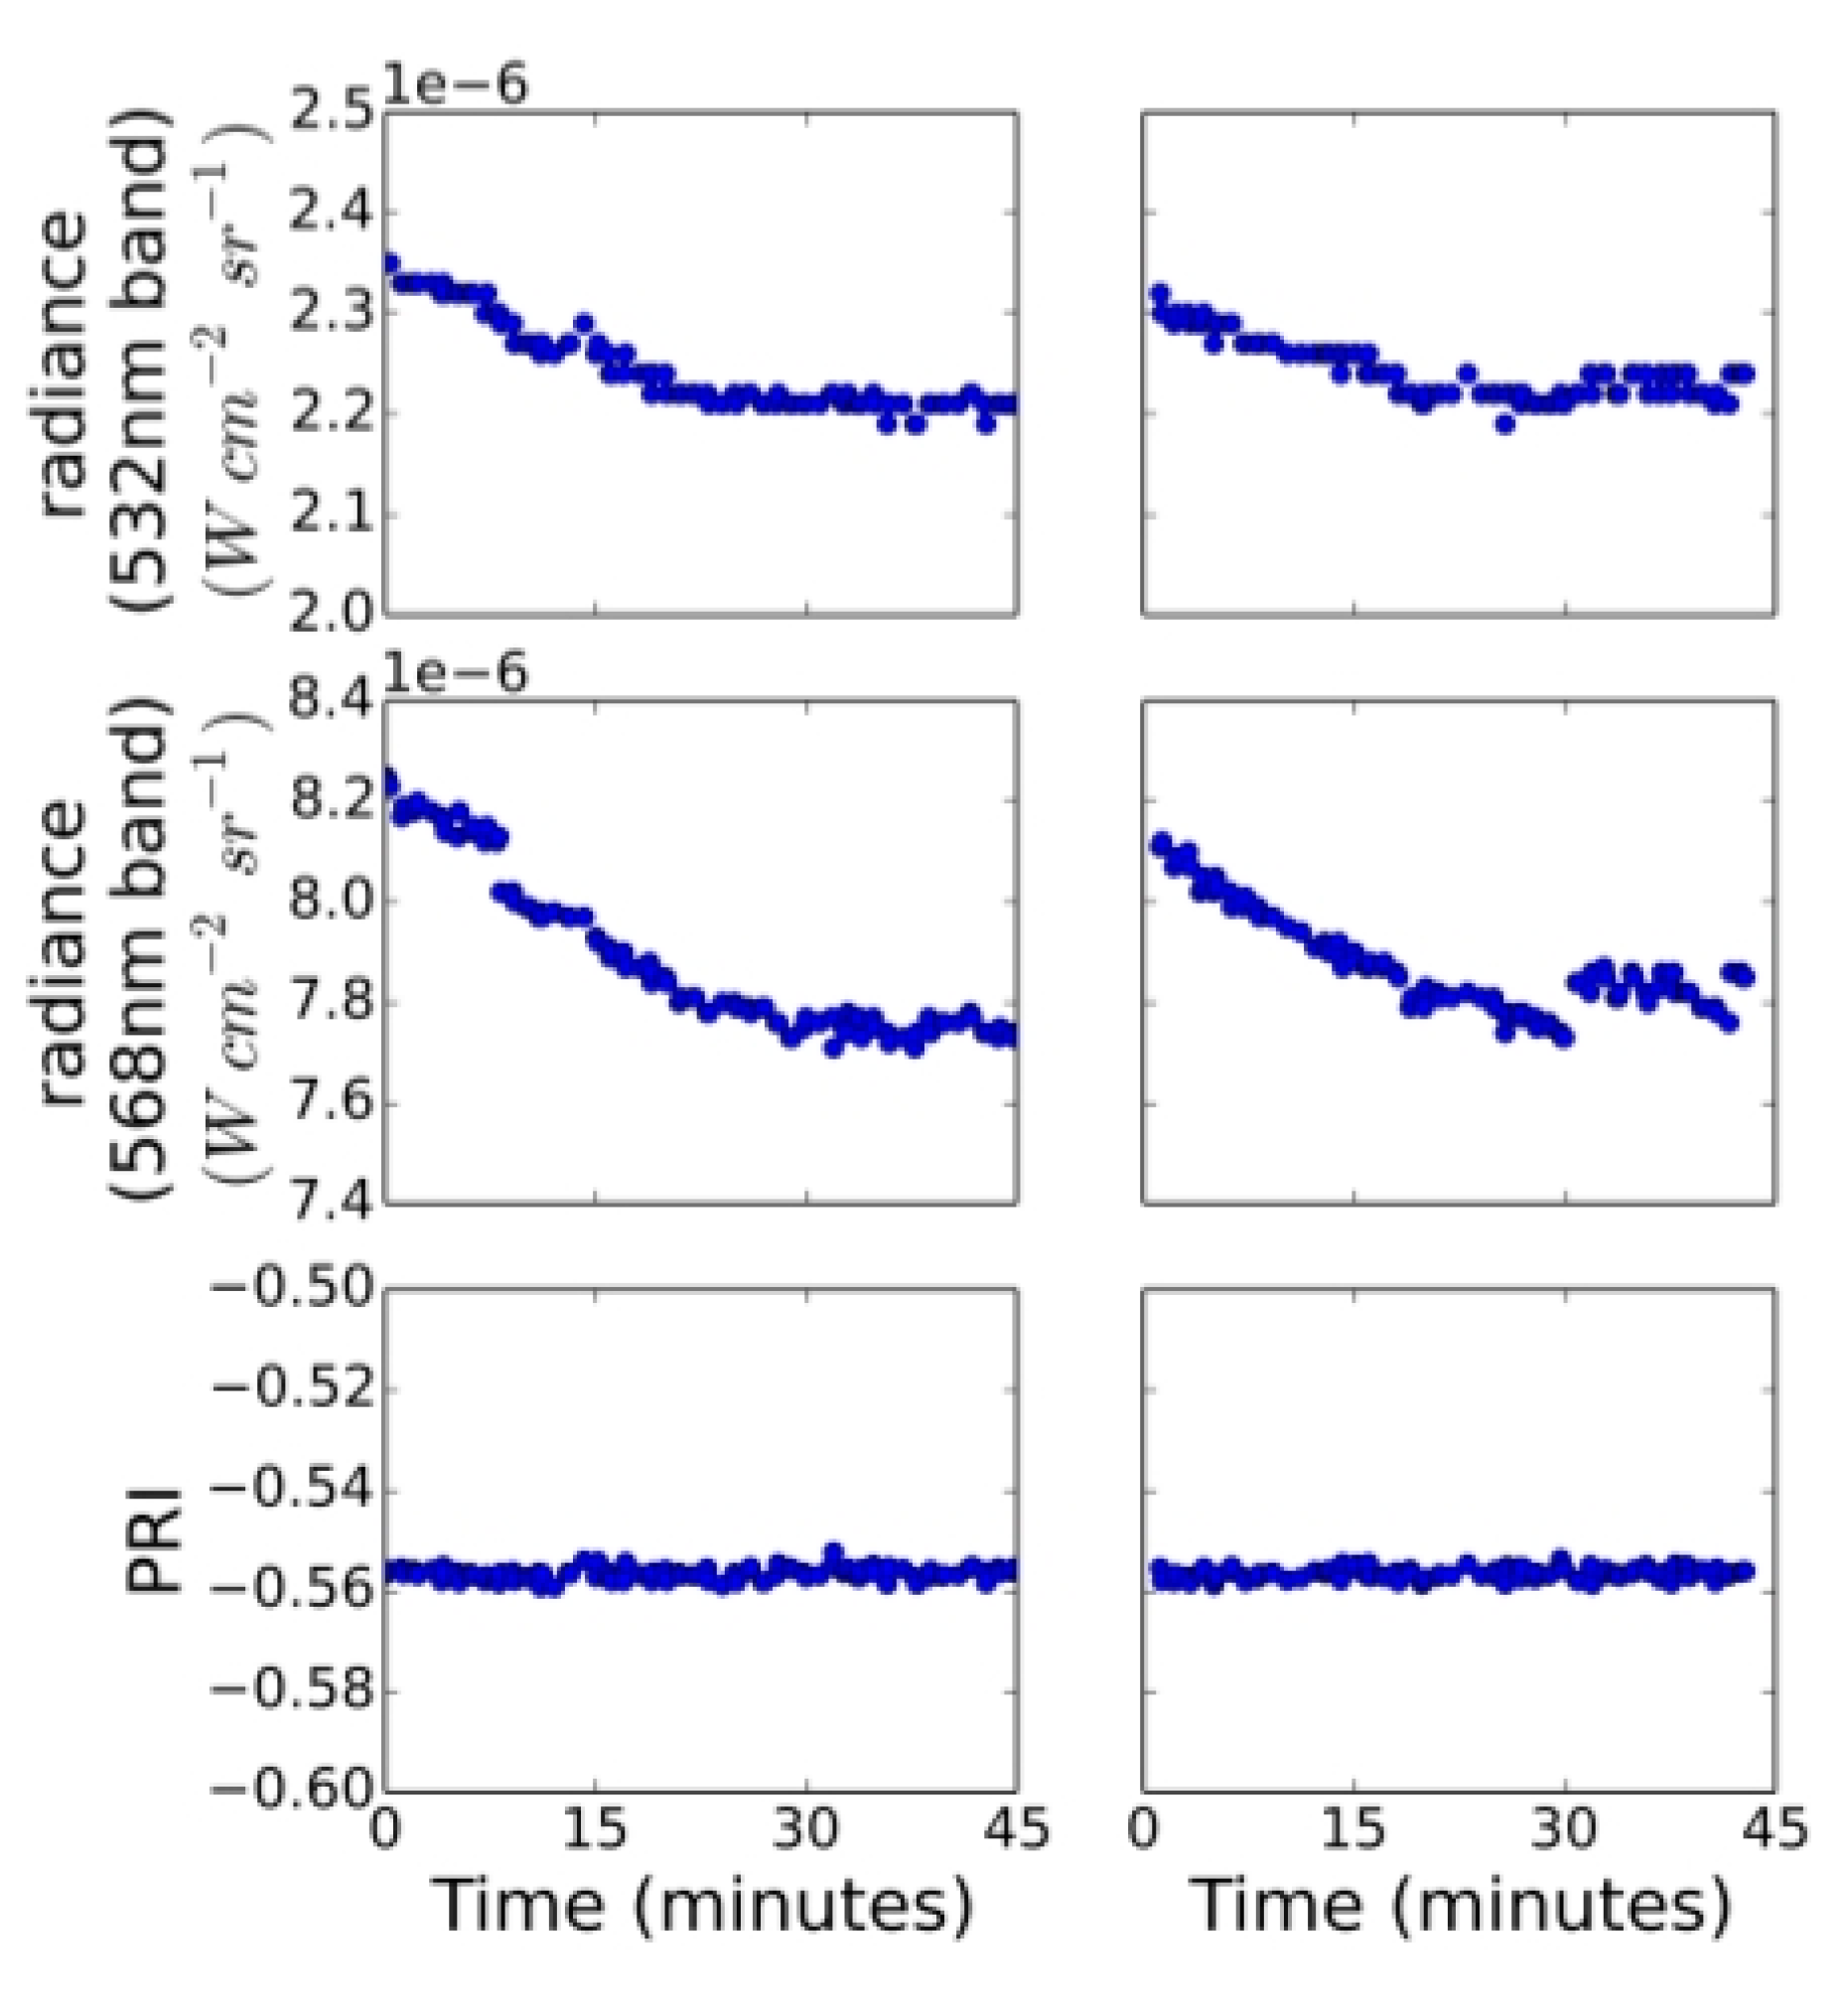
4.2. Laboratory Data

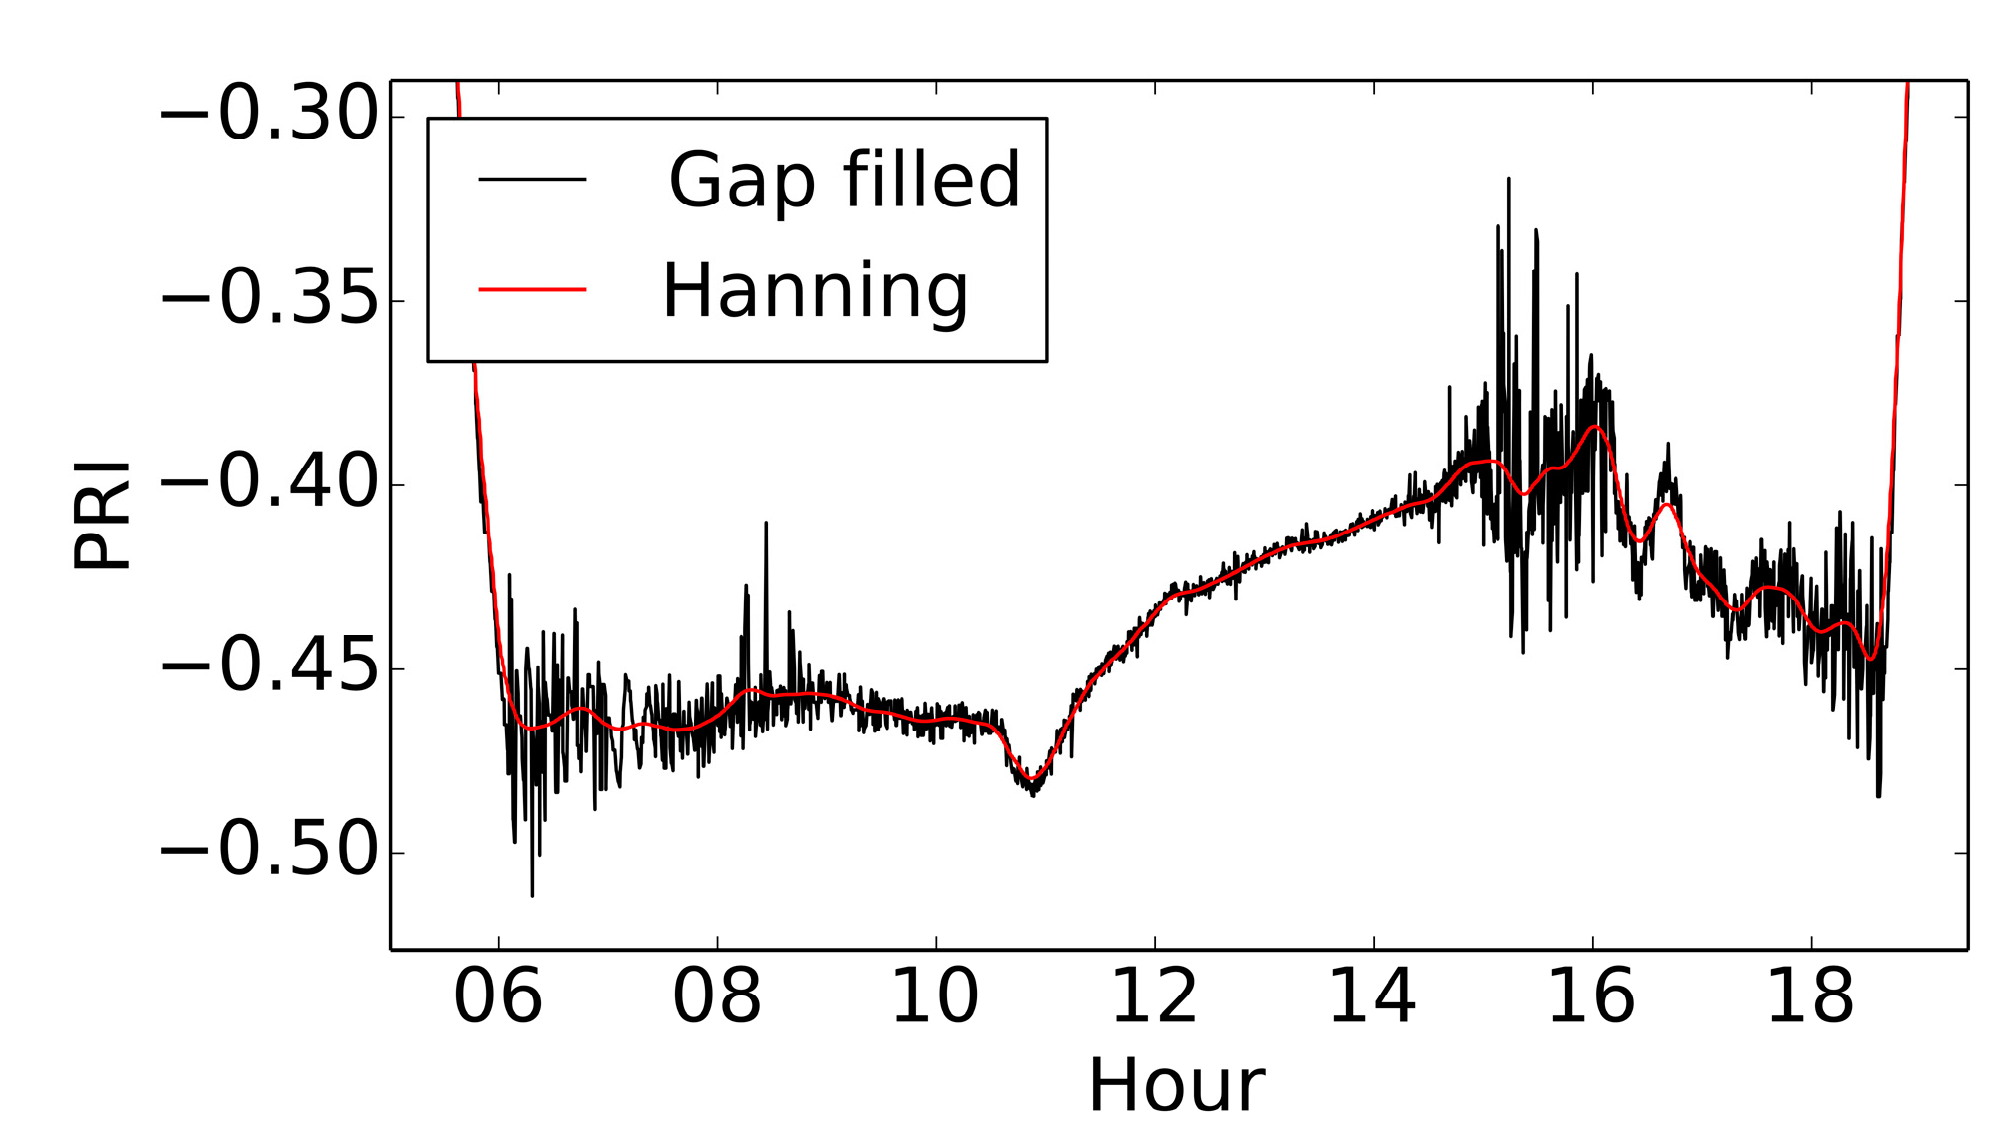
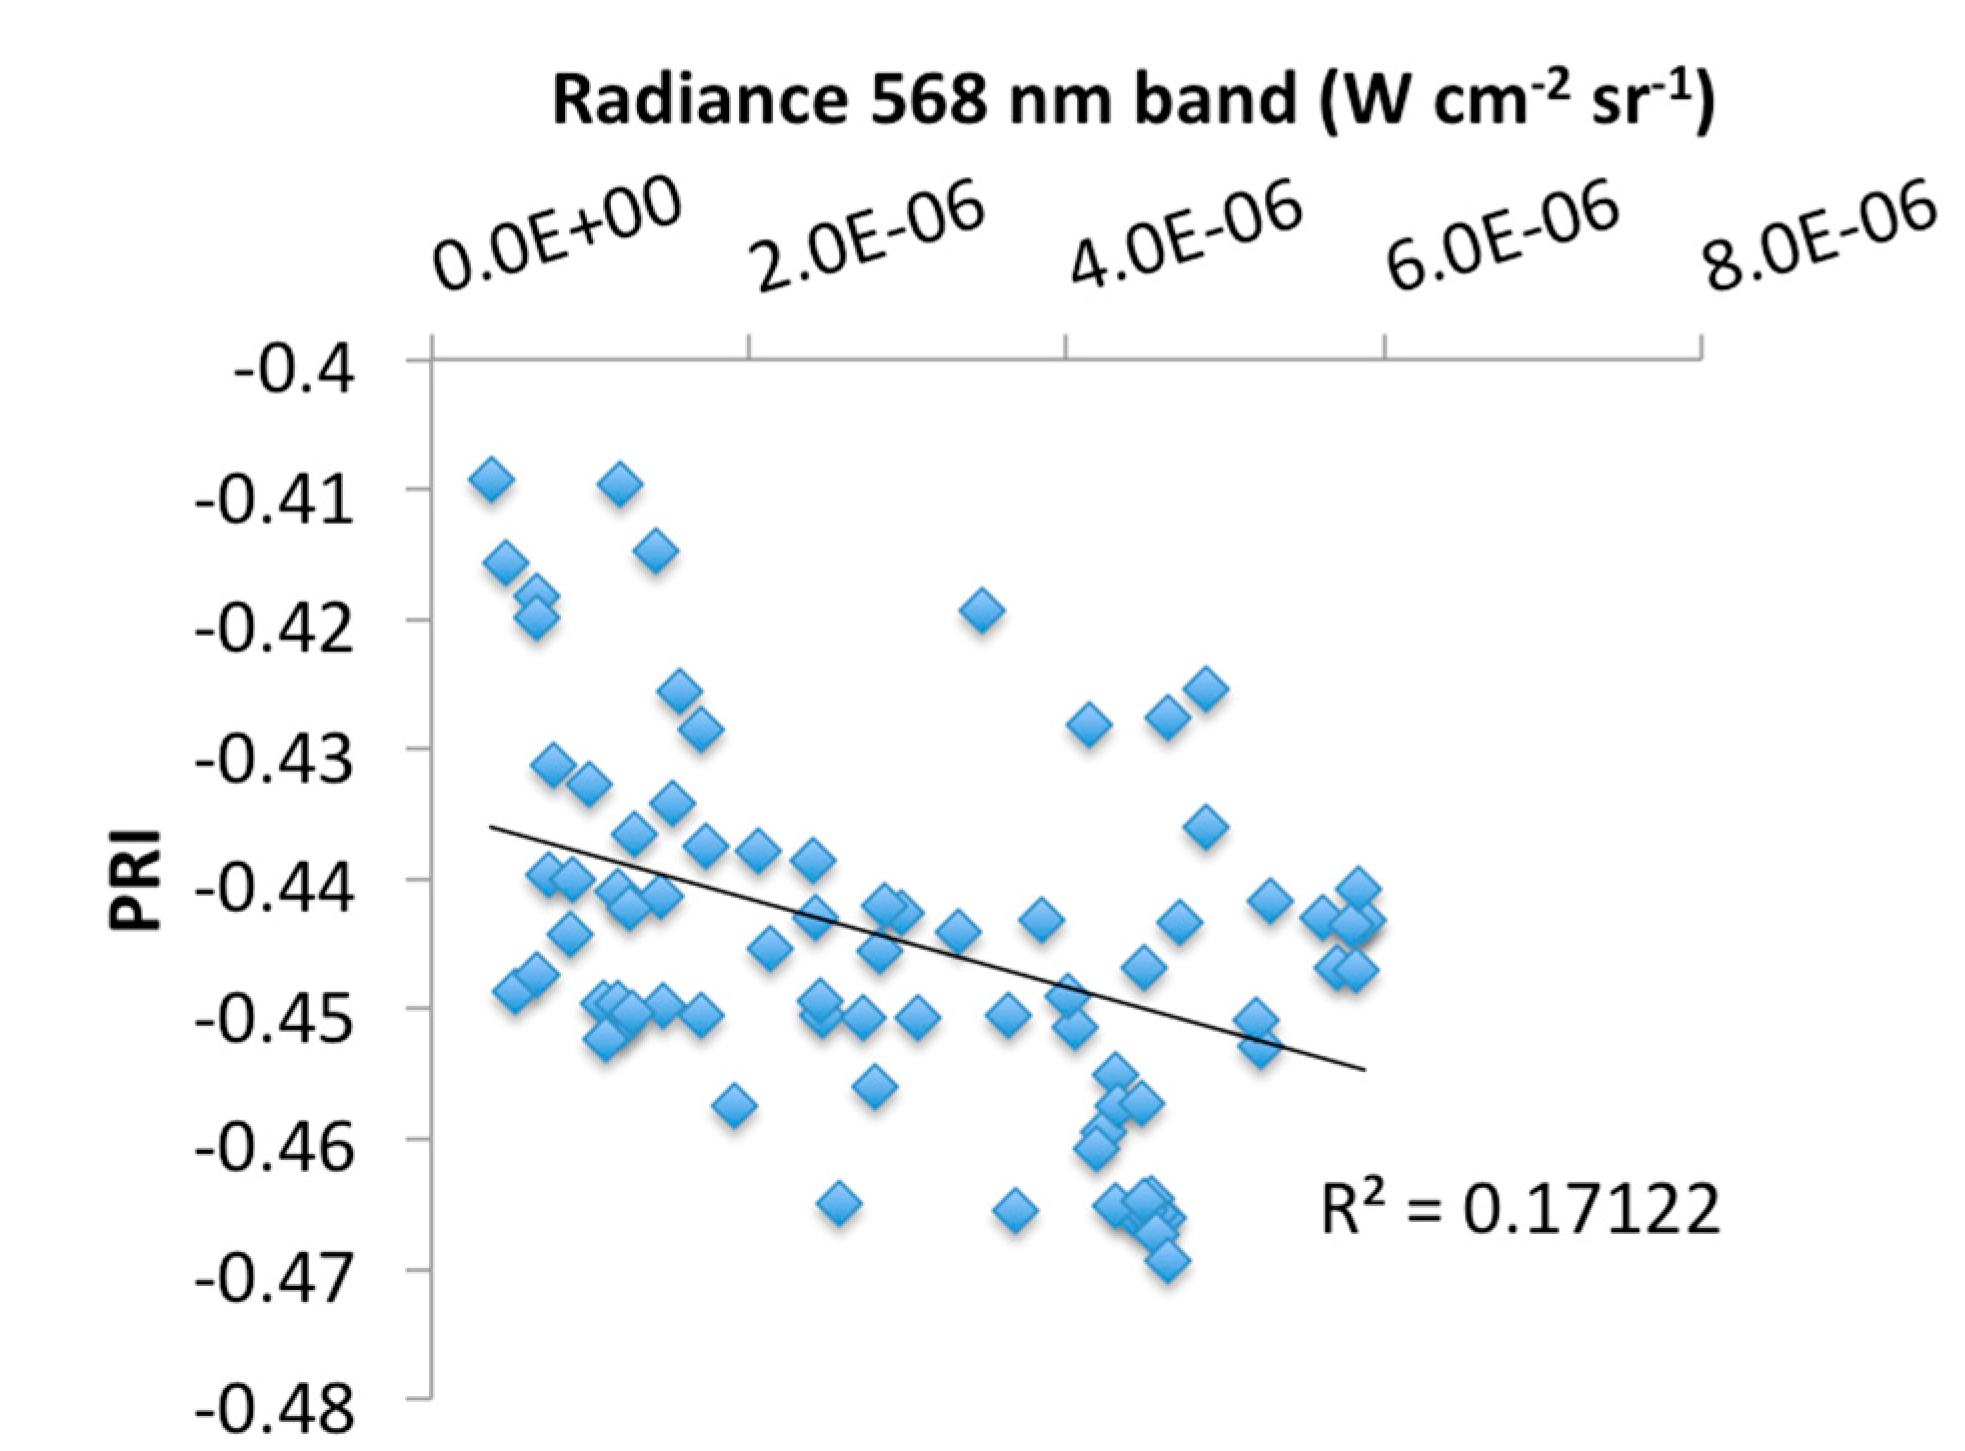
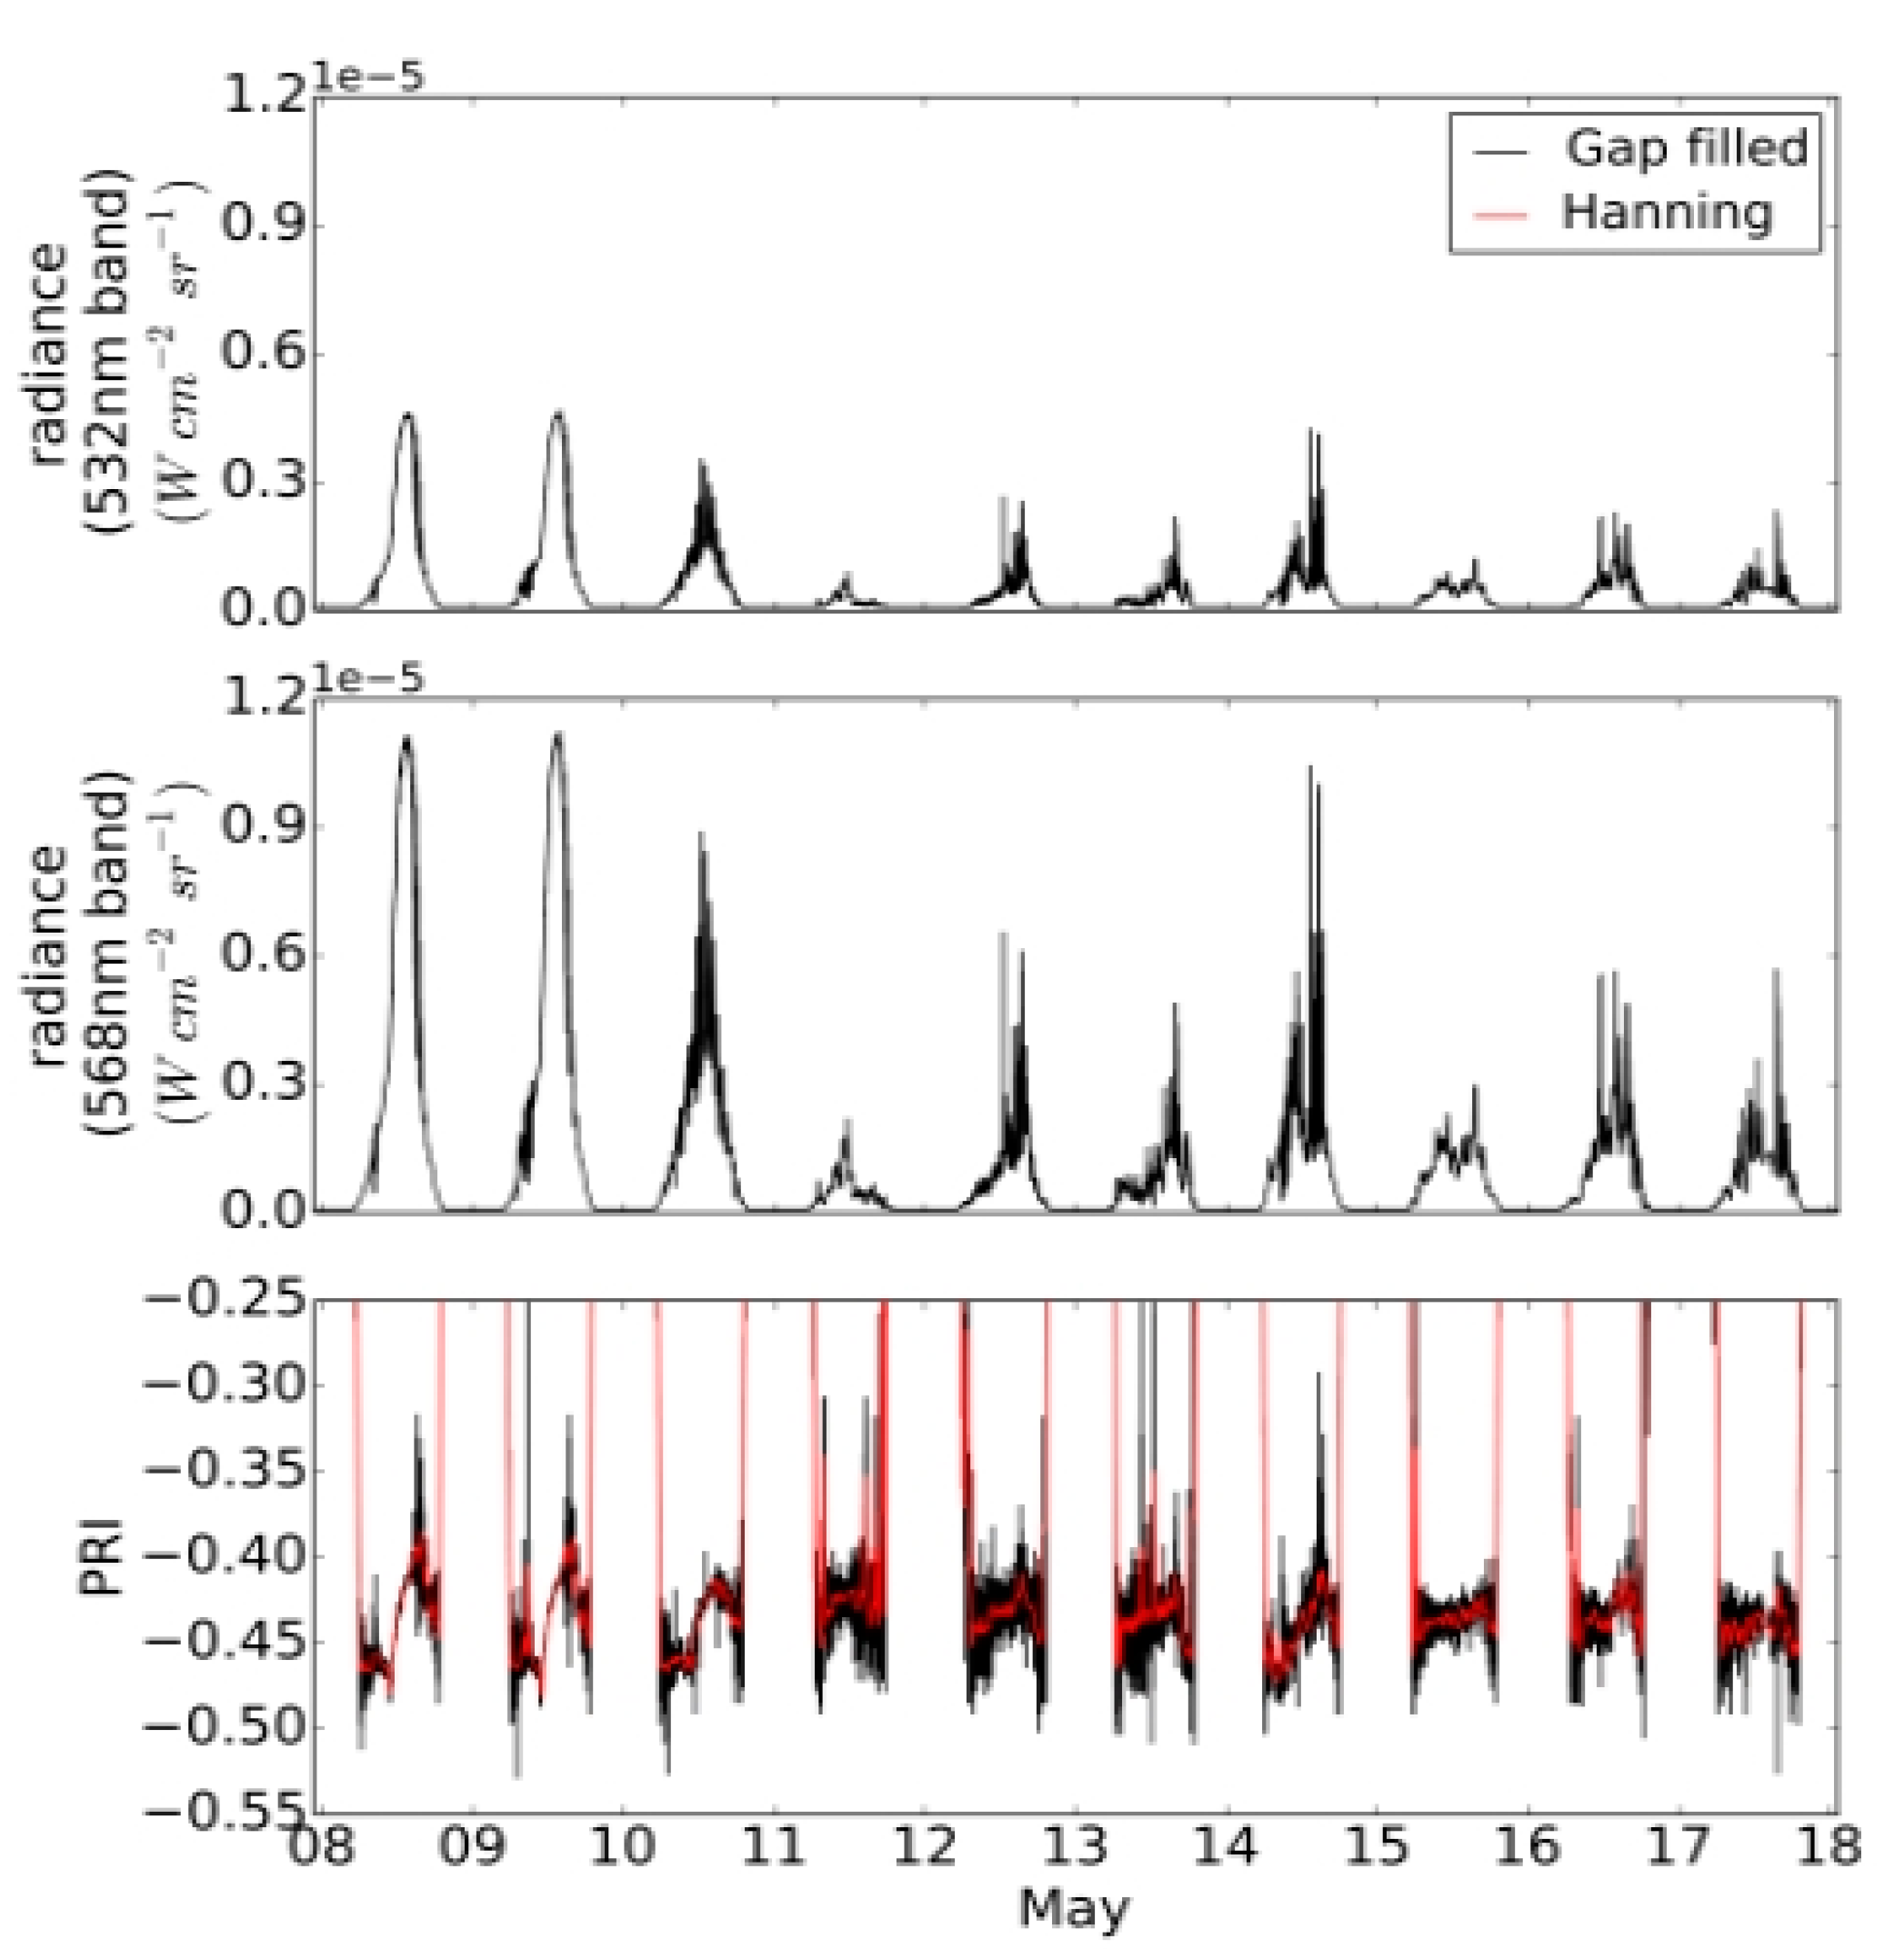
4.3. Field Data

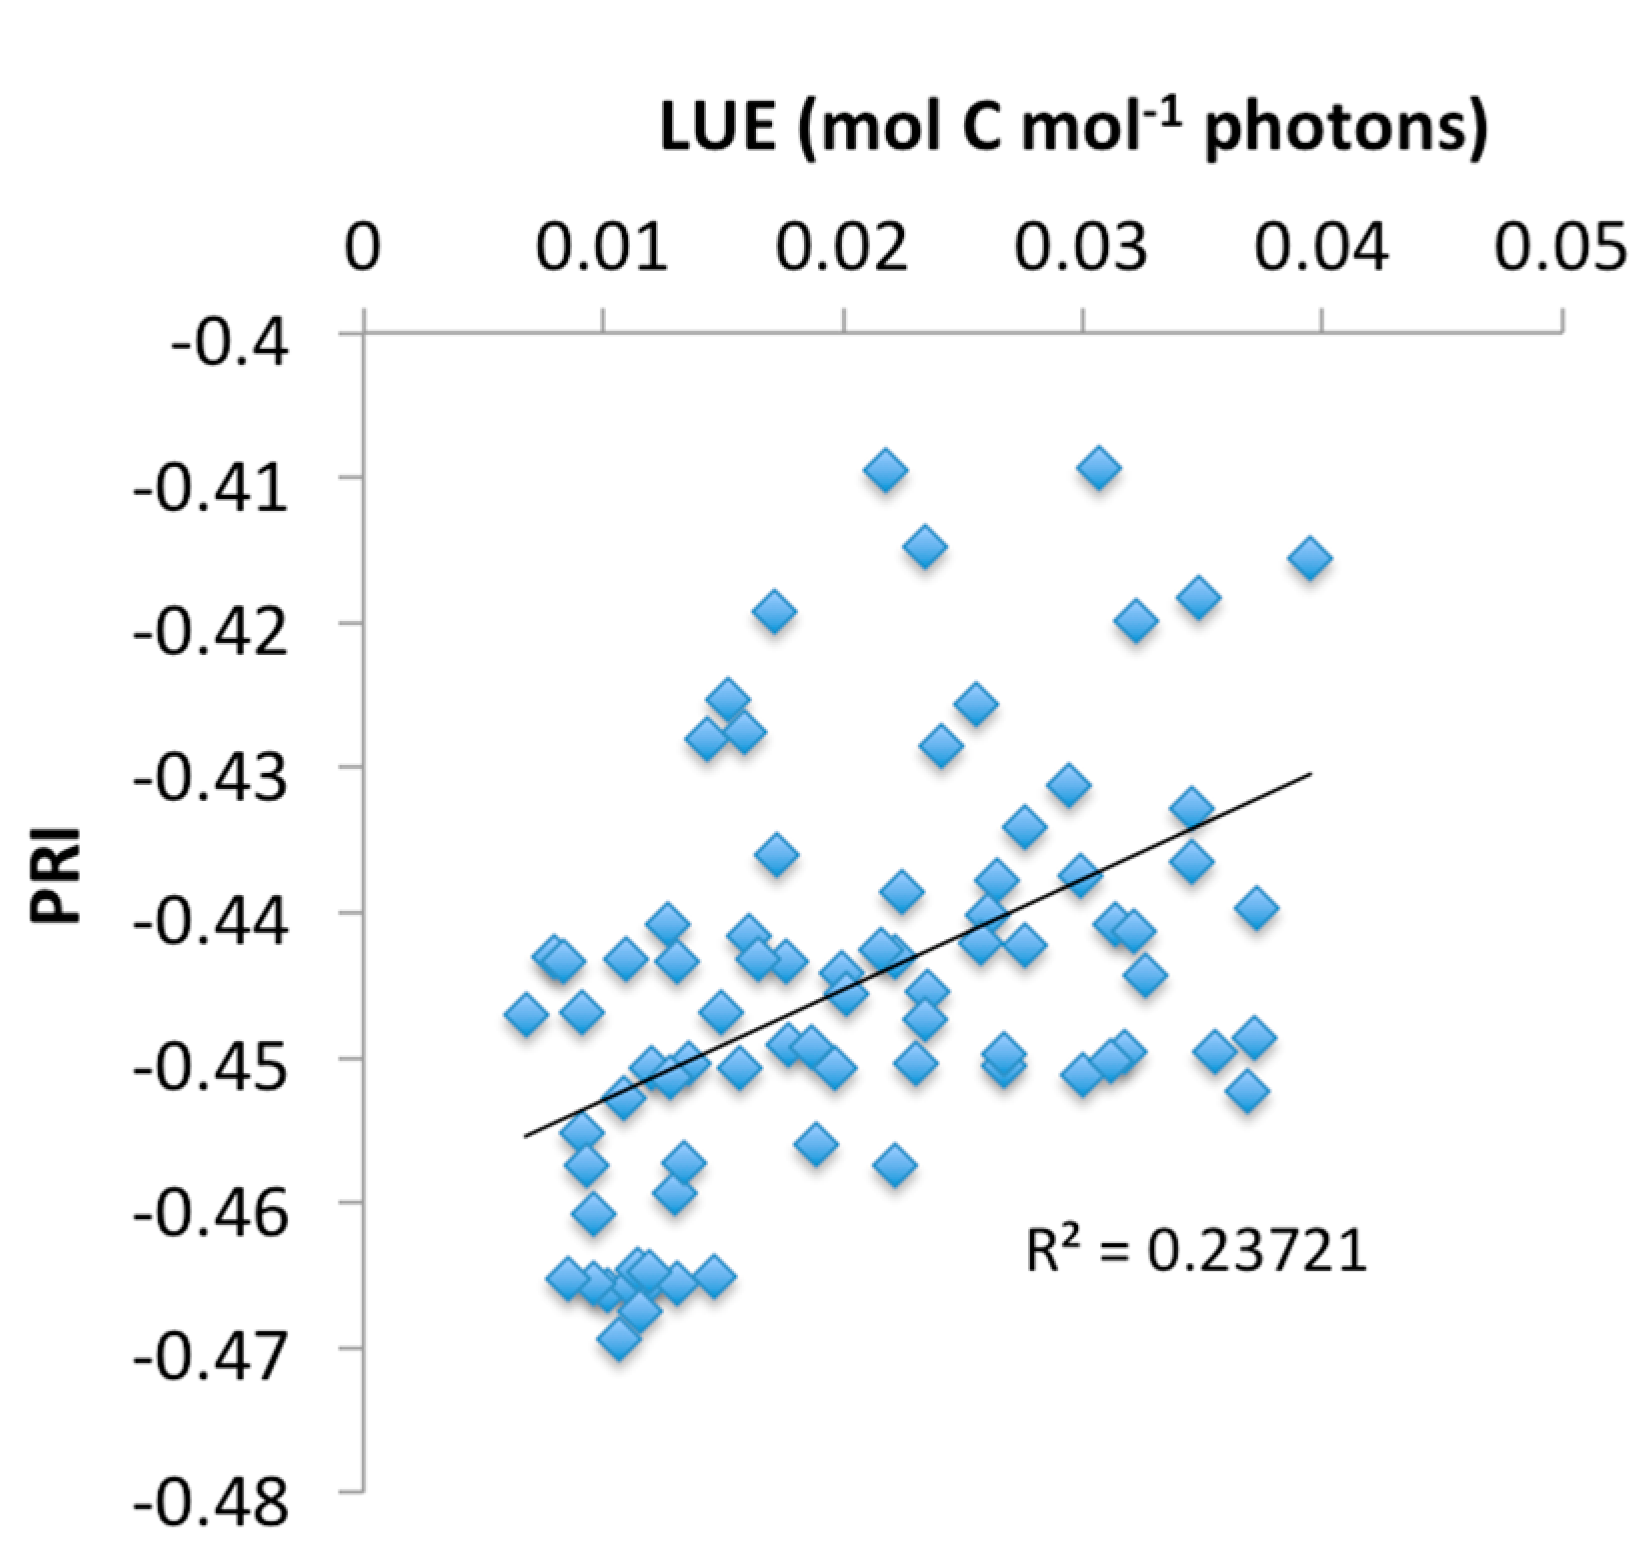
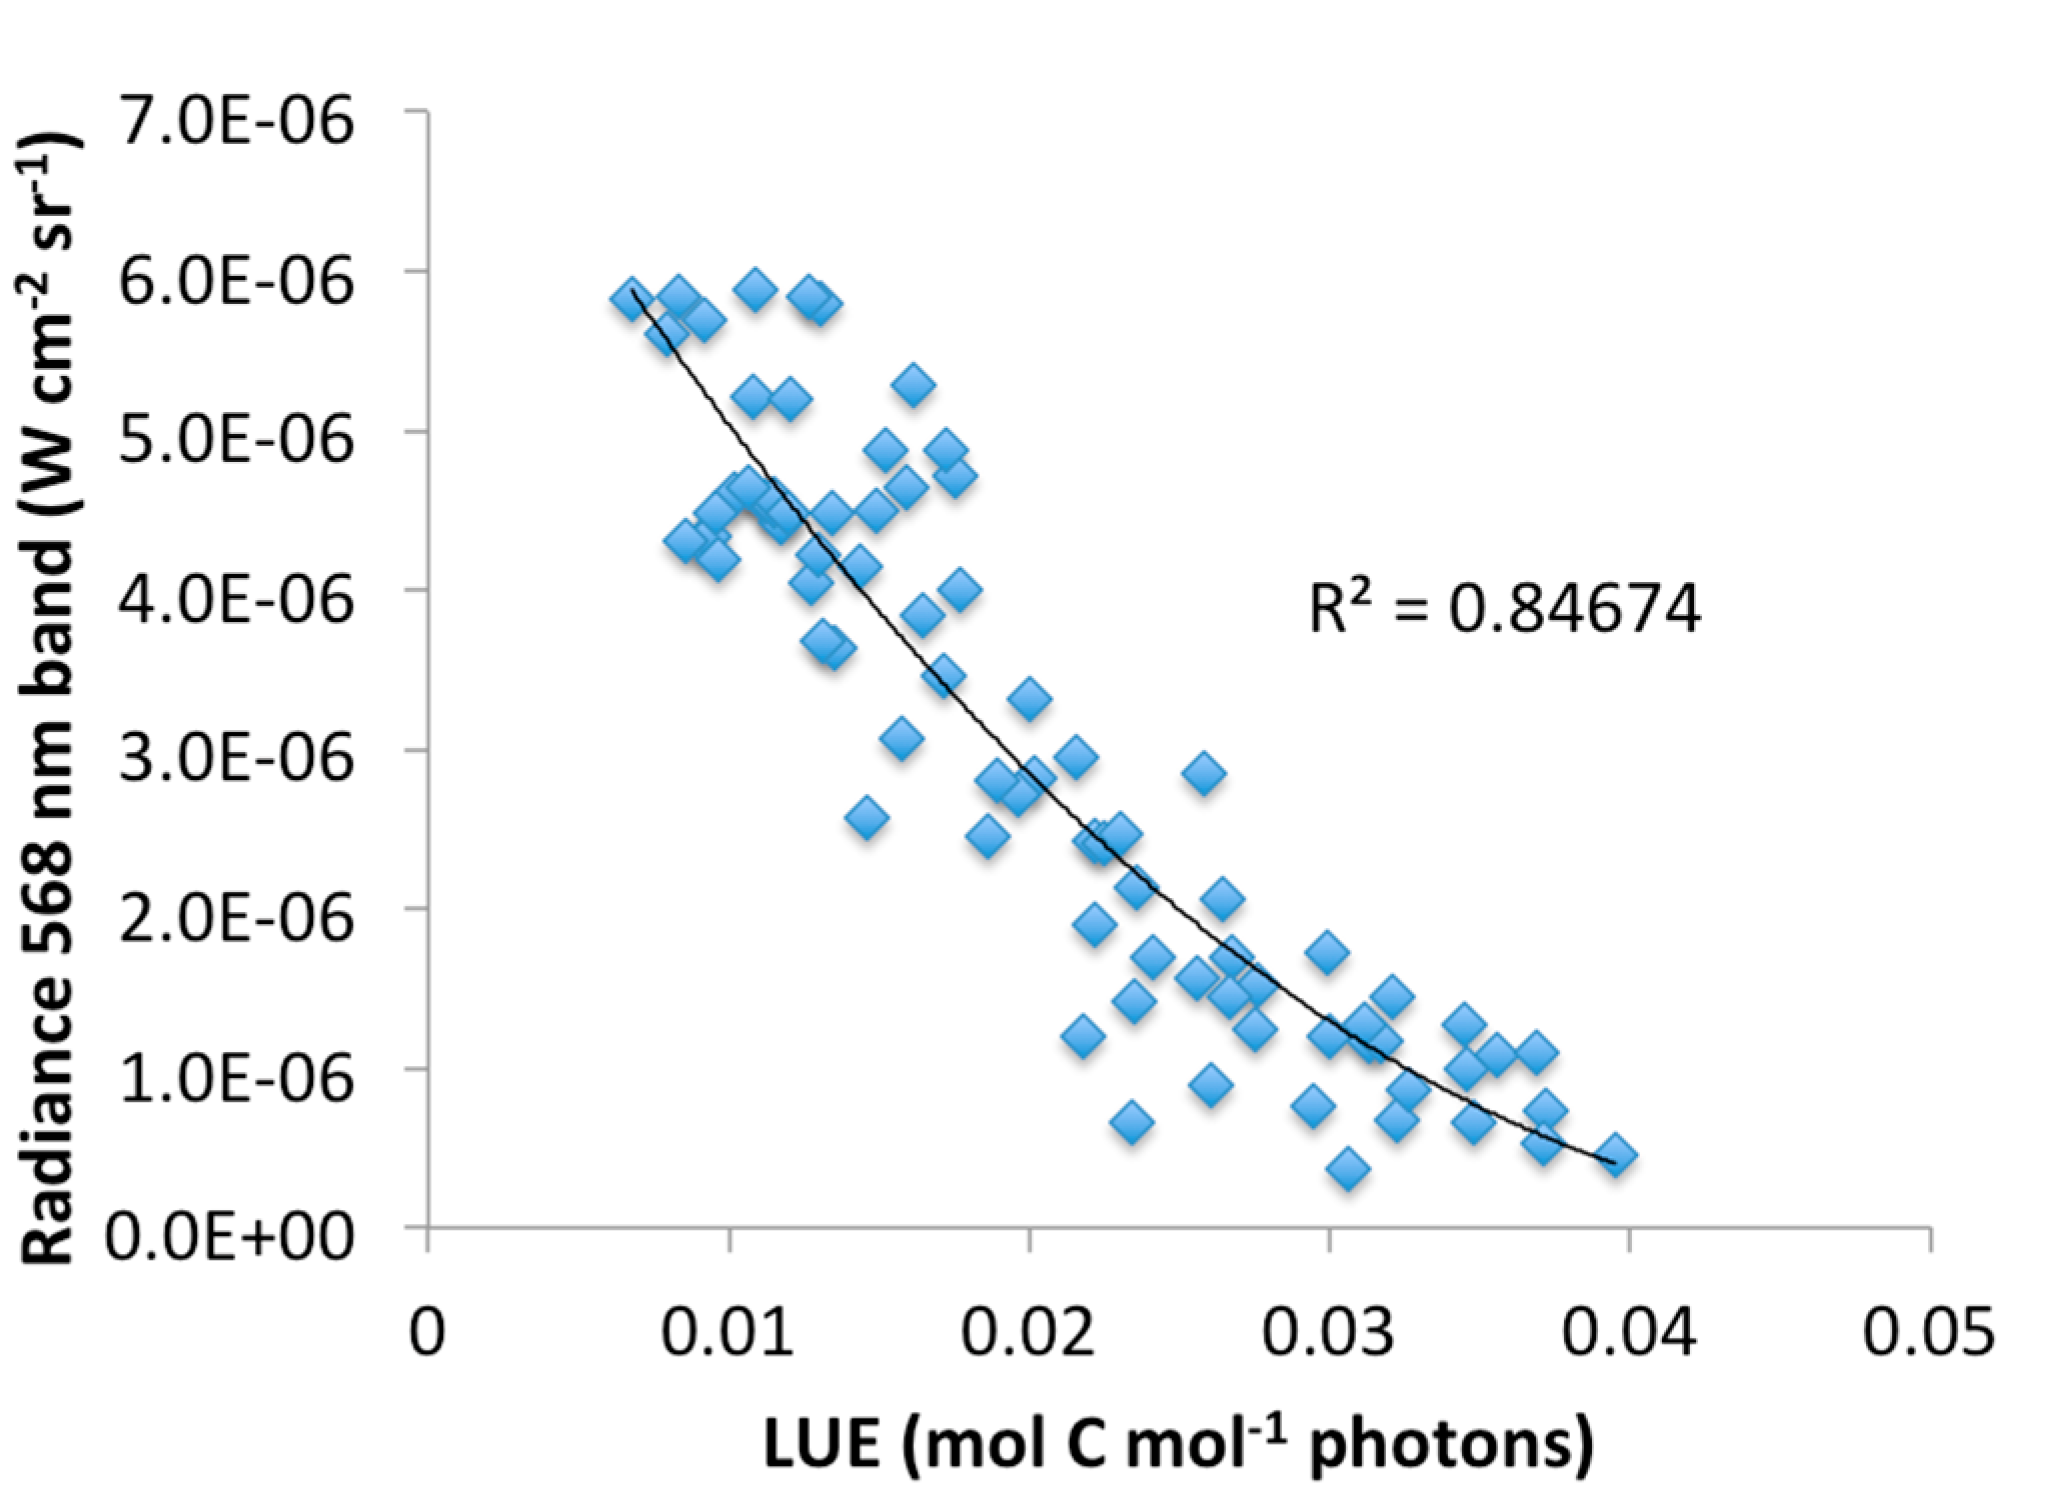
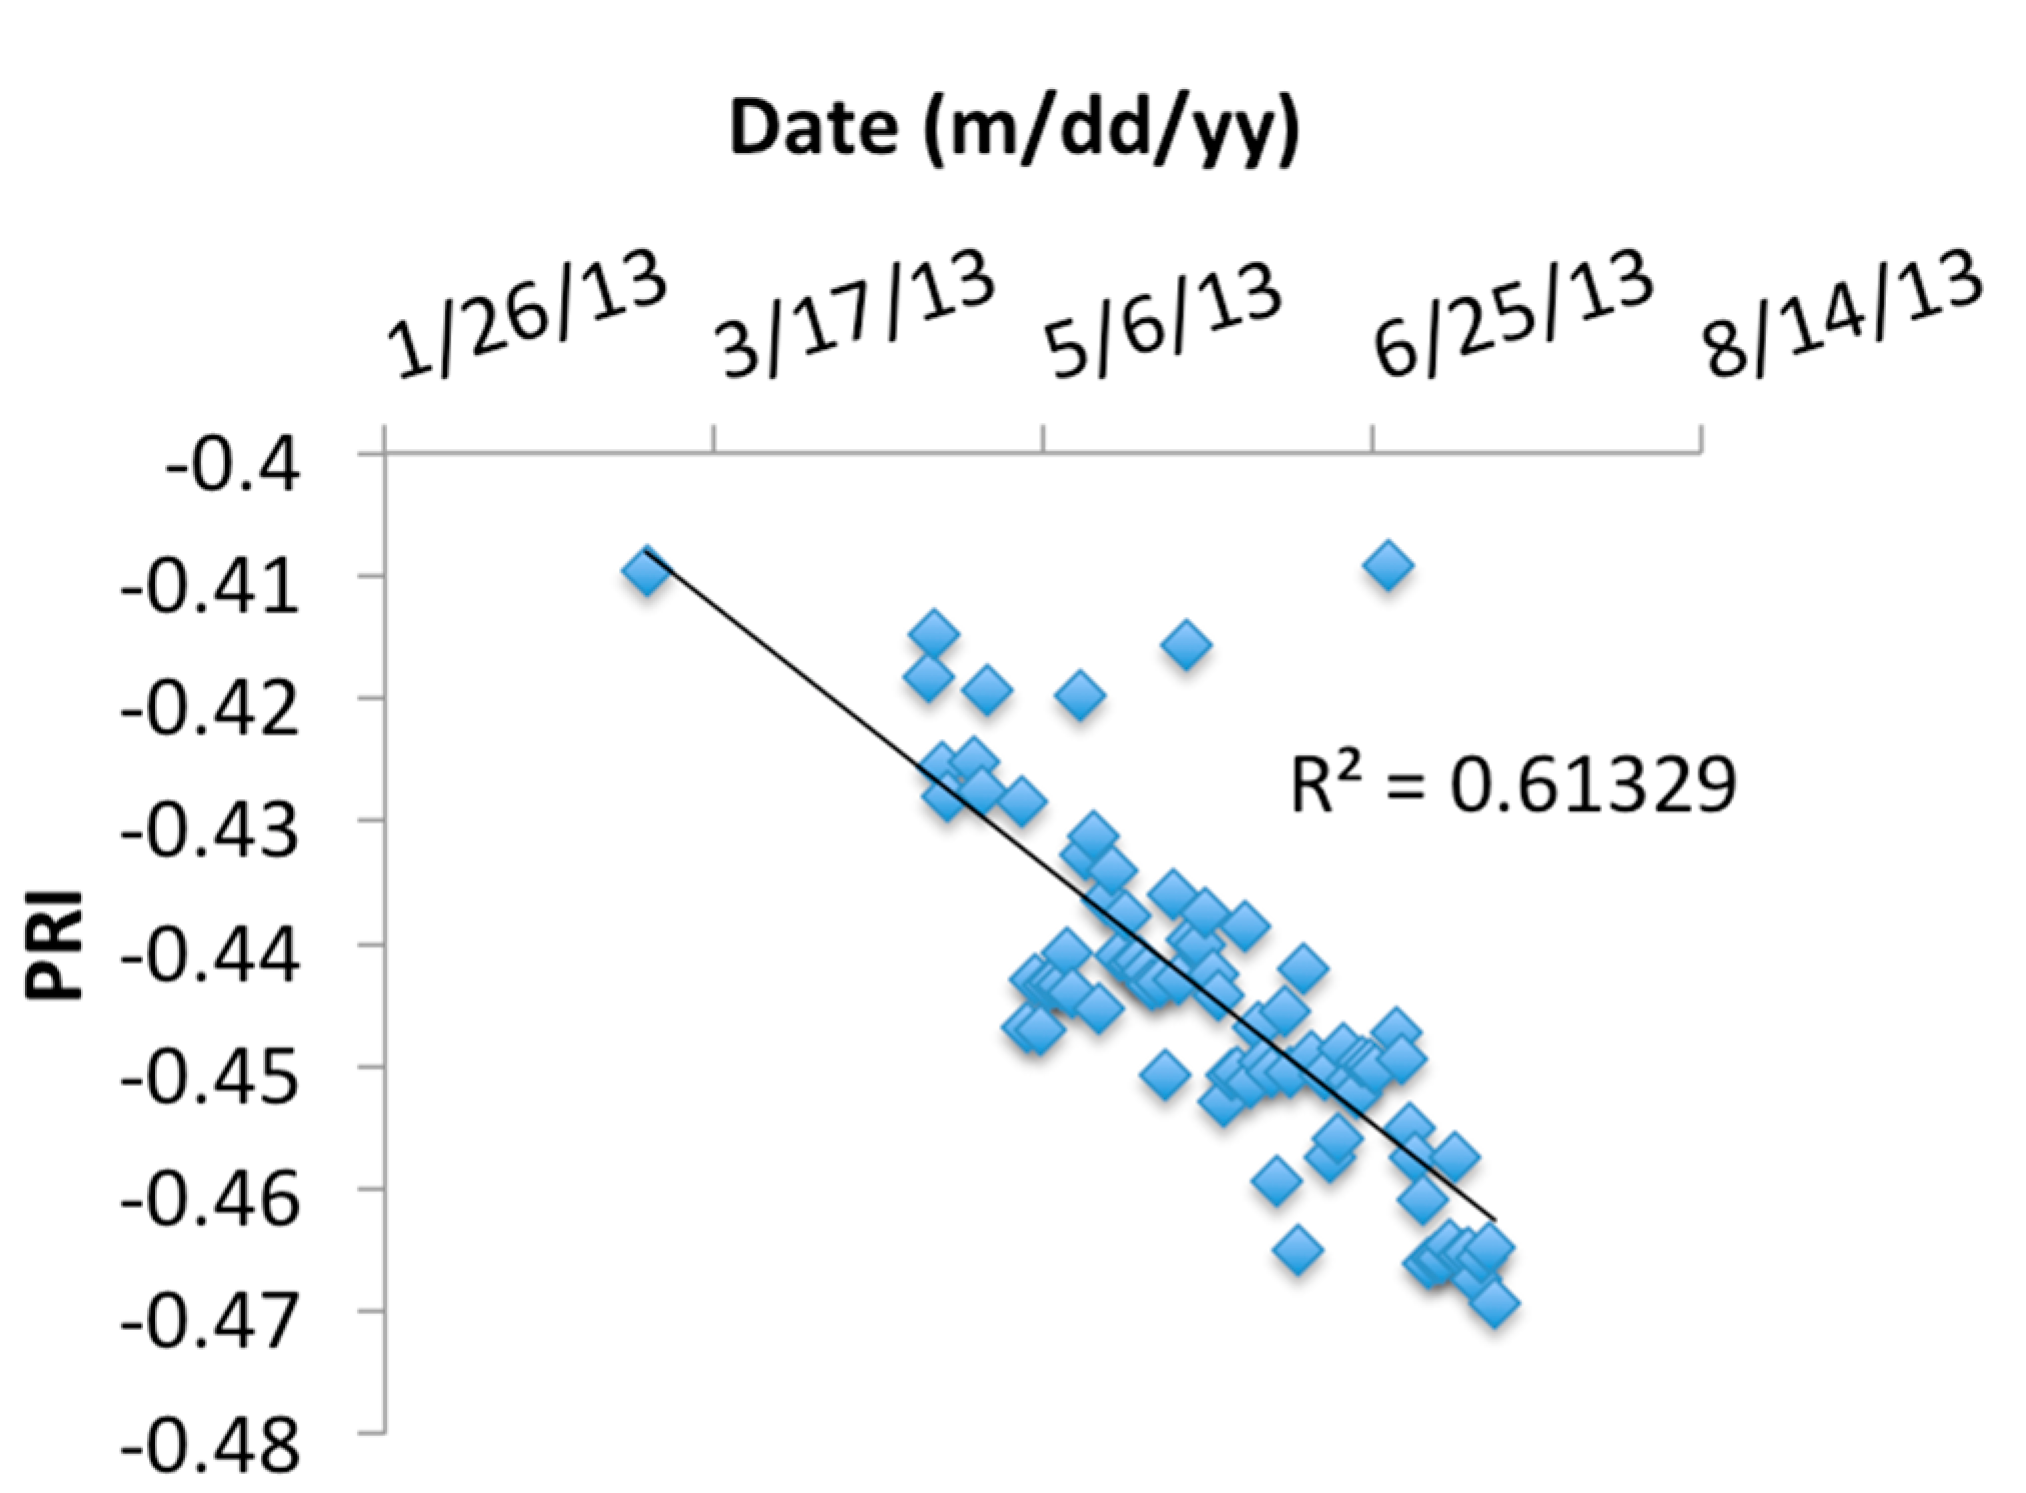
4.4. Daily EC-Derived LUE vs. Narrow-Waveband-Derived PRI

5. Conclusions
Acknowledgments
Author Contributions
Conflicts of Interest
References
- Whittaker, R.H.; Likens, G.E. Primary production: The biosphere and man. Hum. Ecol. 1973, 1, 357–369. [Google Scholar] [CrossRef]
- Janzen, H.H. Carbon cycling in earth systems—A soil science perspective. Agric. Ecosyst. Environ. 2004, 104, 399–417. [Google Scholar] [CrossRef]
- Lal, R. Carbon sequestration. Philos. Trans. R. Soc. B Biol. Sci. 2008, 363, 815–830. [Google Scholar] [CrossRef]
- Fan, S.; Gloor, M.; Mahlman, J.; Pacala, S.; Sarmiento, J.; Takahashi, T.; Tans, P. A large terrestrial carbon sink in North America implied by atmospheric and oceanic carbon dioxide data and models. Science 1998, 282, 442–446. [Google Scholar] [CrossRef] [PubMed]
- Monteith, J.L. Solar radiation and productivity in tropical ecosystems. J. Appl. Ecol. 1972, 9, 747–766. [Google Scholar] [CrossRef]
- Monteith, J.L. Climate and the efficiency of crop production in Britain. Philos. Trans. R. Soc. B Biol. Sci. 1977, 281, 277–294. [Google Scholar] [CrossRef]
- Heinsch, F.A.; Reeves, M.; Votava, P.; Kang, S.; Milesi, C.; Glassy, J.; Jolly, W.M.; Loehman, R.; Bowker, C.F.; Kimball, J.S.; et al. User’s Guide GPP and NPP (MOD17A2/A3) Products NASA MODIS Land Algorithm. Available online: http://www.ntsg.umt.edu/sites/ntsg.umt.edu/files/modis/MOD17UsersGuide.pdf (accessed on 30 April 2015).
- Gamon, J.A.; Bond, B. Effects of irradiance and photosynthetic downregulation on the photochemical reflectance index in Douglas-fir and ponderosa pine. Remote Sens. Environ. 2013, 135, 141–149. [Google Scholar] [CrossRef]
- Baldocchi, D.; Falge, E.; Gu, L.; Olson, R.; Hollinger, D.; Running, S.; Anthoni, P.; Bernhofer, C.; Davis, K.; Evans, R.; et al. FLUXNET: A new tool to study the temporal and spatial variability of ecosystem-scale carbon dioxide, water vapor, and energy flux densities. Bull. Am. Meteorol. Soc. 2001, 82, 2415–2434. [Google Scholar] [CrossRef]
- Gamon, A.; Penuelas, J.; Field, C.B. A narrow-waveband spectral index that tracks diurnal changes in photosynthetic efficiency. Remote Sens. Lett. 1992, 41, 35–44. [Google Scholar]
- Demmig-Adams, B.; Adams, W.W. Photoprotection in an ecological context: The remarkable complexity of thermal energy dissipation. New Phytol. 2006, 172, 11–21. [Google Scholar] [CrossRef] [PubMed]
- Hilker, T.; Hall, F.G.; Tucker, C.J.; Coops, N.C.; Black, T.A.; Nichol, C.J.; Sellers, P.J.; Barr, A.; Hollinger, D.Y.; Munger, J.W. Data assimilation of photosynthetic light-use efficiency using multi-angular satellite data: II Model implementation and validation. Remote Sens. Environ. 2012, 121, 287–300. [Google Scholar] [CrossRef]
- Garbulsky, M.F.; Penuelas, J.; Gamon, J.; Inoue, Y.; Filella, I. The photochemical reflectance index (PRI) and the remote sensing of leaf, canopy and ecosystem radiation use efficiencies. Remote Sens. Environ. 2011, 115, 281–297. [Google Scholar] [CrossRef]
- Garrity, S.R.; Vierling, L.A.; Bickford, K. A simple filtered photodiode instrument for continuous measurement of narrowband NDVI and PRI over vegetated canopies. Agric. For. Meteorol. 2010, 150, 489–496. [Google Scholar] [CrossRef]
- Harris, A.; Gamon, J.A.; Pastorello, G.Z.; Wong, C.Y.S. Retrieval of the photochemical reflectance index for assessing xanthophyll cycle activity: A comparison of near-surface optical sensors. Biogeosciences 2014, 11, 6277–6292. [Google Scholar] [CrossRef]
- Jassal, R.S.; Black, T.A.; Nesic, Z. Biophysical controls of soil CO2 efflux in two coastal Douglas-fir stands at different temporal scales. Agric. For. Meteorol. 2012, 153, 134–143. [Google Scholar] [CrossRef]
- Meidinger and Pojar. Ecosystems of British Columbia; British Columbia Ministry of Forests, Research Branch: Victoria, BC, Canada, 1991.
- Yurish, S.Y. Intelligent opto sensors’ interfacing based on universal frequency-to-digital converter. Sens. Transducers 2005, 56, 326–334. [Google Scholar]
- Garghan, S.K.; Nordin, R.; Ismail, M. Energy-efficient ZigBee-based wireless sensor network for track bicycle performance monitoring. Sensors 2014, 14, 15573–15592. [Google Scholar] [CrossRef] [PubMed]
- Faludi, R. Building Wireless Sensor Networks; O’Reilly Media: Sebastopol, CA, USA, 2011. [Google Scholar]
- Chazdon, R.L.; Pearcy, R.W. Photosynthetic responses to light variation in rainforest species. Oecologia 1991, 69, 524–531. [Google Scholar] [CrossRef]
- Krishnan, P.; Black, A.T.; Jassal, R.S.; Chen, B.; Nesic, Z. Interannual variability of the carbon balance of three different-aged Douglas-fir stands in the Pacific Northwest. J. Geophys. Res. 2009, 114, G04011. [Google Scholar]
- Morgenstern, K.; Black, T.A.; Humphreys, E.R.; Griffis, T.J.; Drewitt, G.B.; Cai, T.C.; Spittlehouse, D.L.; Livingston, N.J. Sensitivity and uncertainty of the carbon balance of a Pacific Northwest Douglas-fir forest during an El Nino/La Nina cycle. Agric. For. Meteorol. 2004, 123, 201–219. [Google Scholar] [CrossRef]
- Barr, A.G.; Black, T.A.; Hogg, E.H.; Kljun, N.; Morgenstern, K.; Nesic, Z. Inter-annual variability in the leaf area index of a boreal aspen-hazelnut forest in relation to net ecosystem production. Agric. For. Meteorol. 2004, 126, 237–255. [Google Scholar] [CrossRef]
- Hilker, T.; Coops, N.C.; Hall, F.G.; Black, T.A.; Wulder, M.A.; Nesic, Z.; Krishnan, P. Separating physiologically and directionally induced changes in PRI using BRDF models. Remote Sens. Environ. 2008, 112, 2777–2788. [Google Scholar] [CrossRef]
- Barton, C.V.M.; North, P.R.J. Remote sensing of canopy light use efficiency using the photochemical reflectance index. Model and sensitivity analysis. Remote Sens. Environ. 2001, 78, 264–273. [Google Scholar] [CrossRef]
- Gitelson, A.A.; Gamon, J.A. The need for a common basis for defining light-use efficiency: Implications for productivity estimation. Remote Sens. Environ. 2015, 156, 196–201. [Google Scholar] [CrossRef]
- Nakaji, T.; Kosugi, Y.; Takanashi, S.; Niiyama, K.; Noguchi, S.; Tani, M.; Oguma, H.; Nik, A.R.; Kassim, A.R. Estimation of light-use efficiency through a combinational use of the photochemical reflectance index and vapor pressure deficit in an evergreen tropical rainforest at Pasoh, Peninsular Malaysia. Remote Sens. Environ. 2014, 150, 82–92. [Google Scholar] [CrossRef]
- Kasahara, M.; Kagawa, T.; Oikawa, K.; Suetsugu, N.; Miyao, M.; Wada, M. Chloroplast avoidance movement reduces photodamage in plants. Nature 2013, 420, 829–832. [Google Scholar] [CrossRef]
- Gitelson, A.A.; Vina, A.; Verma, S.B.; Rundquist, D.C.; Arkebauer, T.J.; Keydan, G.; Leavitt, B.; Ciganda, V.; Burba, G.G.; Suyker, A.E. Relationship between gross primary production and chlorophyll content in crops: Implications for the synoptic monitoring of vegetation productivity. J. Geophys. Res. 2006, 111, D08S11. [Google Scholar]
© 2015 by the authors; licensee MDPI, Basel, Switzerland. This article is an open access article distributed under the terms and conditions of the Creative Commons Attribution license (http://creativecommons.org/licenses/by/4.0/).
Share and Cite
Van Leeuwen, M.; Kremens, R.L.; Van Aardt, J. Tracking Diurnal Variation in Photosynthetic Down-Regulation Using Low Cost Spectroscopic Instrumentation. Sensors 2015, 15, 10616-10630. https://doi.org/10.3390/s150510616
Van Leeuwen M, Kremens RL, Van Aardt J. Tracking Diurnal Variation in Photosynthetic Down-Regulation Using Low Cost Spectroscopic Instrumentation. Sensors. 2015; 15(5):10616-10630. https://doi.org/10.3390/s150510616
Chicago/Turabian StyleVan Leeuwen, Martin, Robert L. Kremens, and Jan Van Aardt. 2015. "Tracking Diurnal Variation in Photosynthetic Down-Regulation Using Low Cost Spectroscopic Instrumentation" Sensors 15, no. 5: 10616-10630. https://doi.org/10.3390/s150510616