
Maximum Stress Estimation Model for Multi-Span Waler Beams with Deflections at the Supports Using Average Strains

Abstract
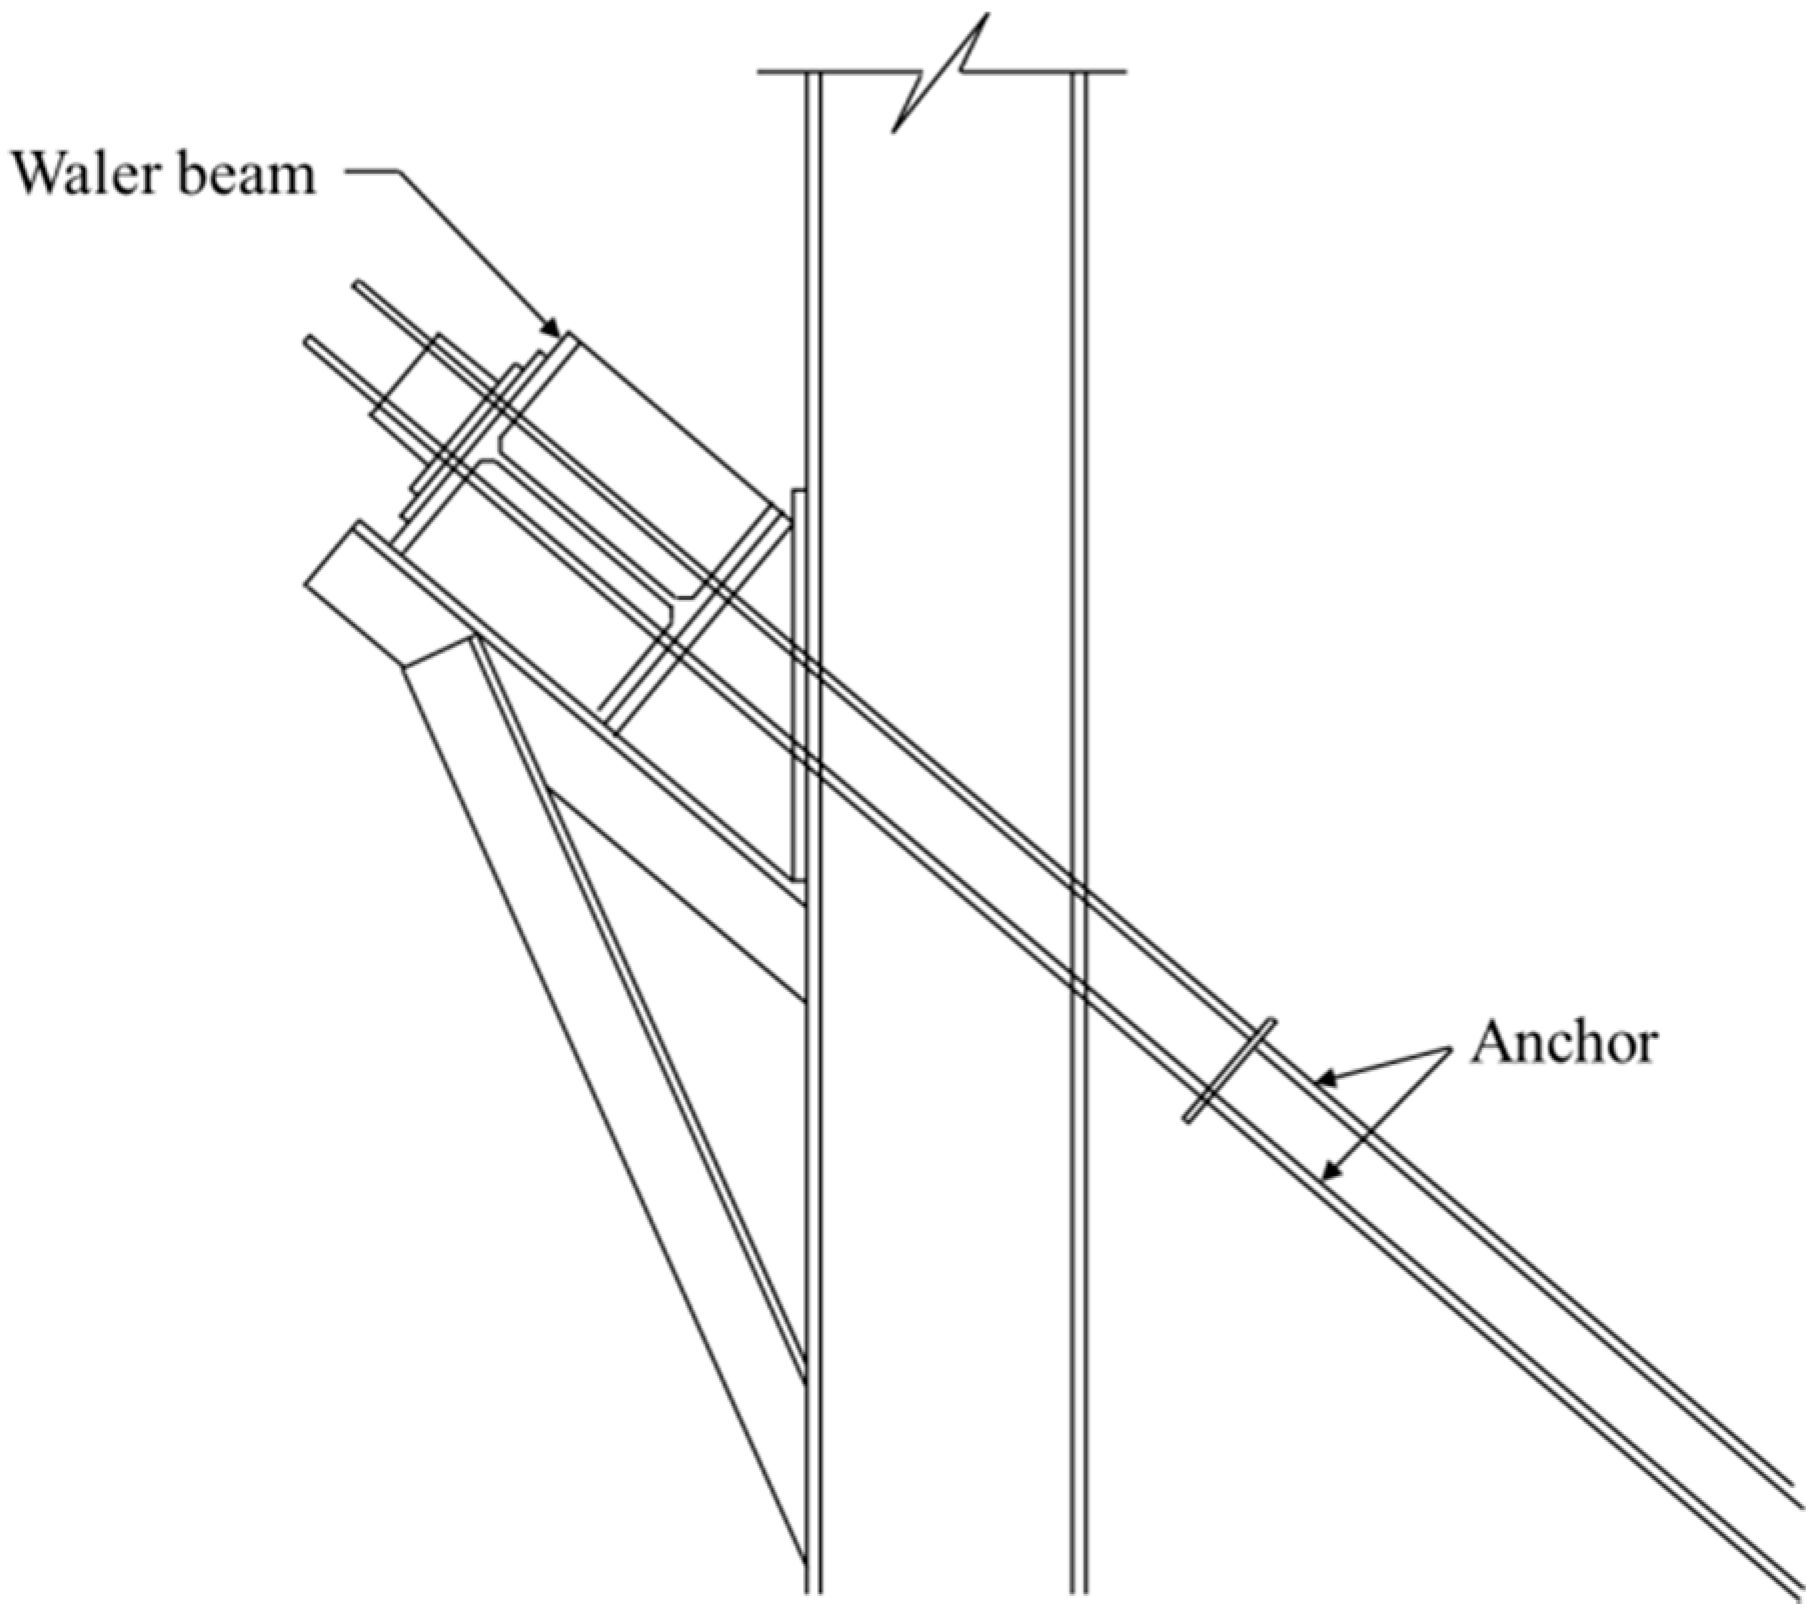
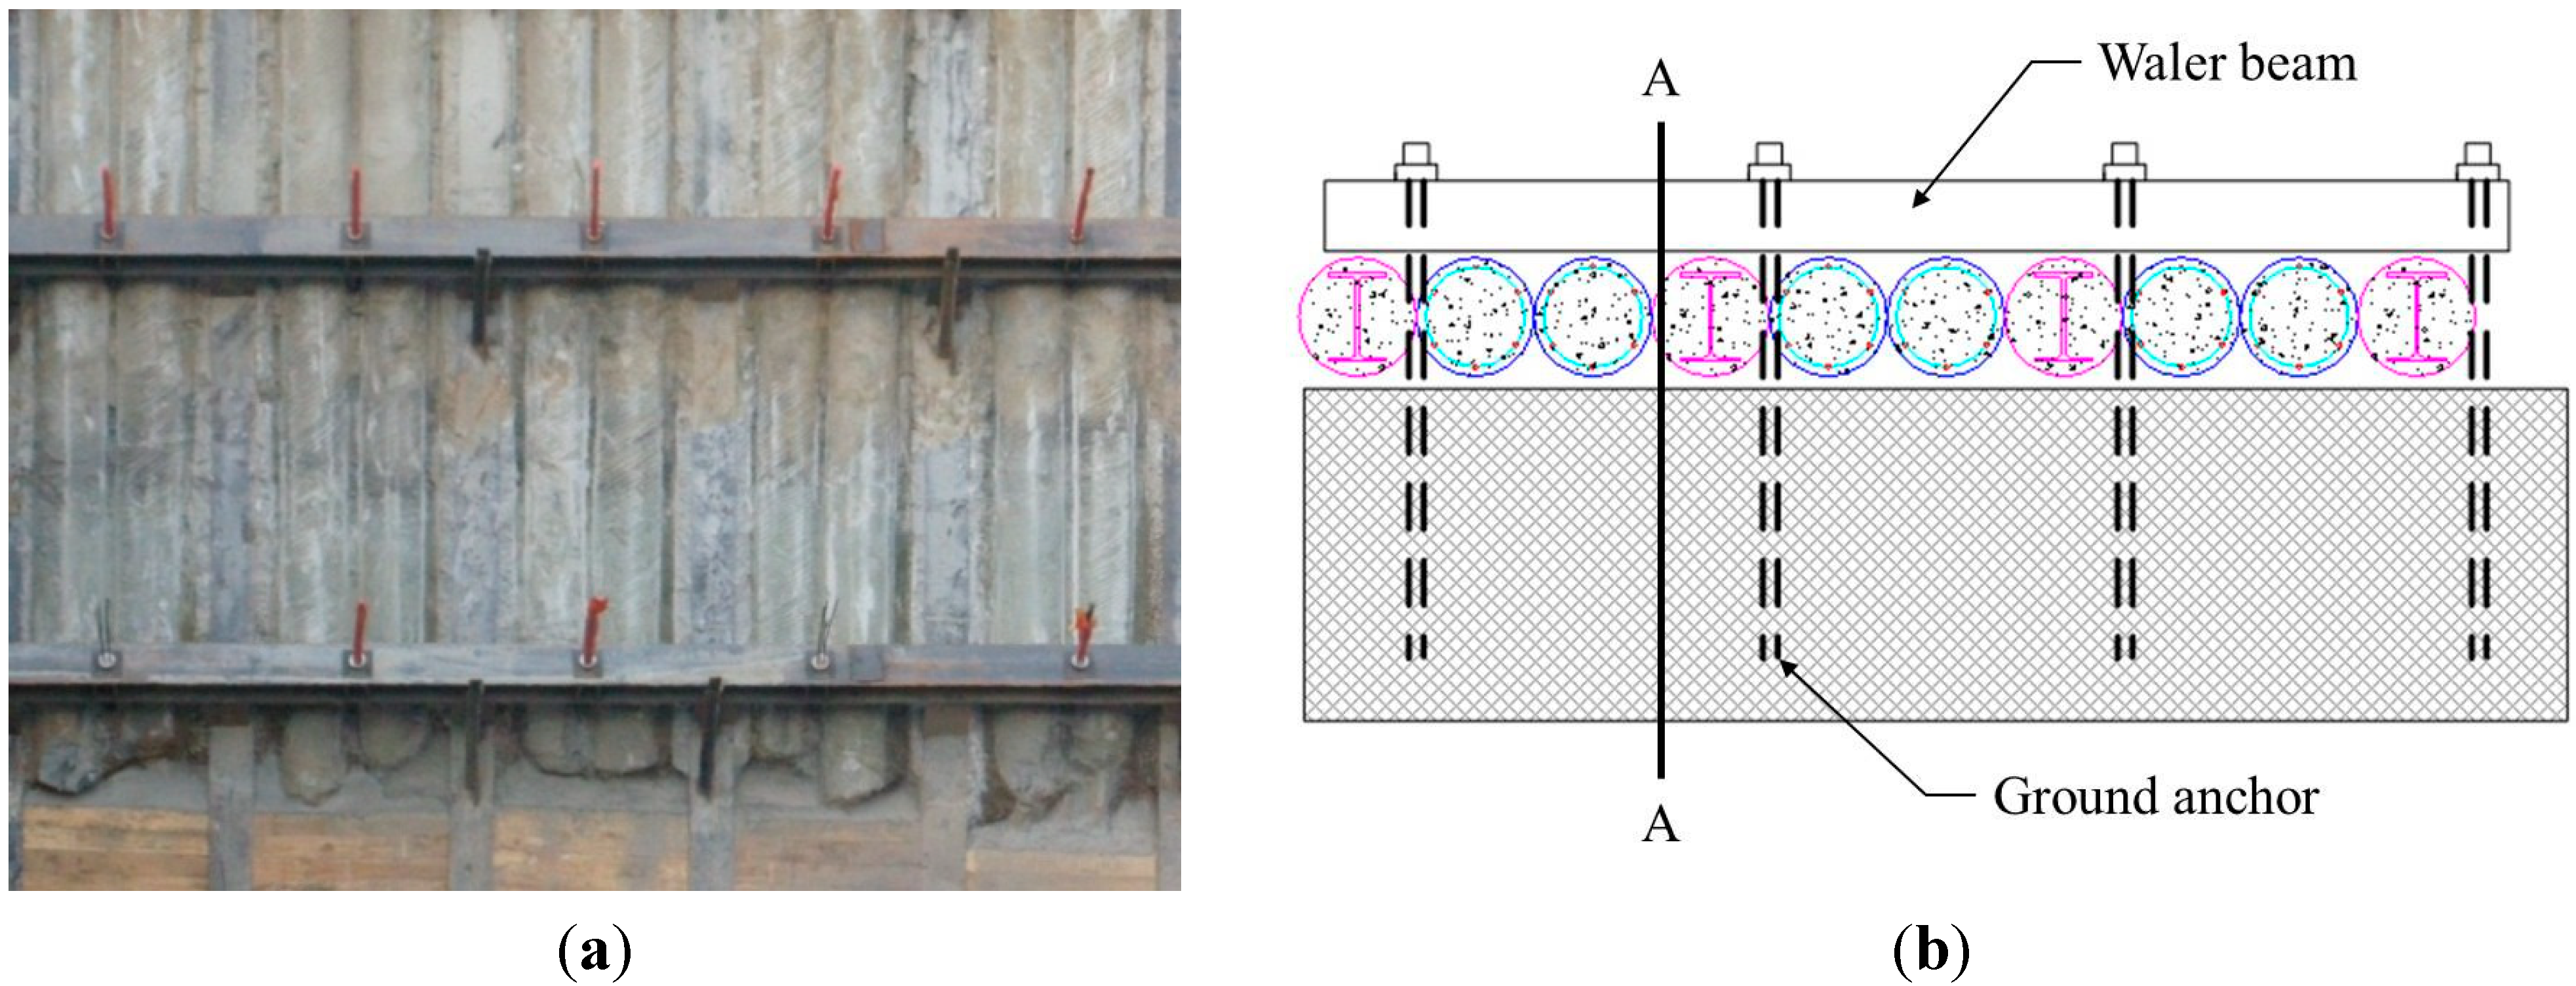
:1. Introduction

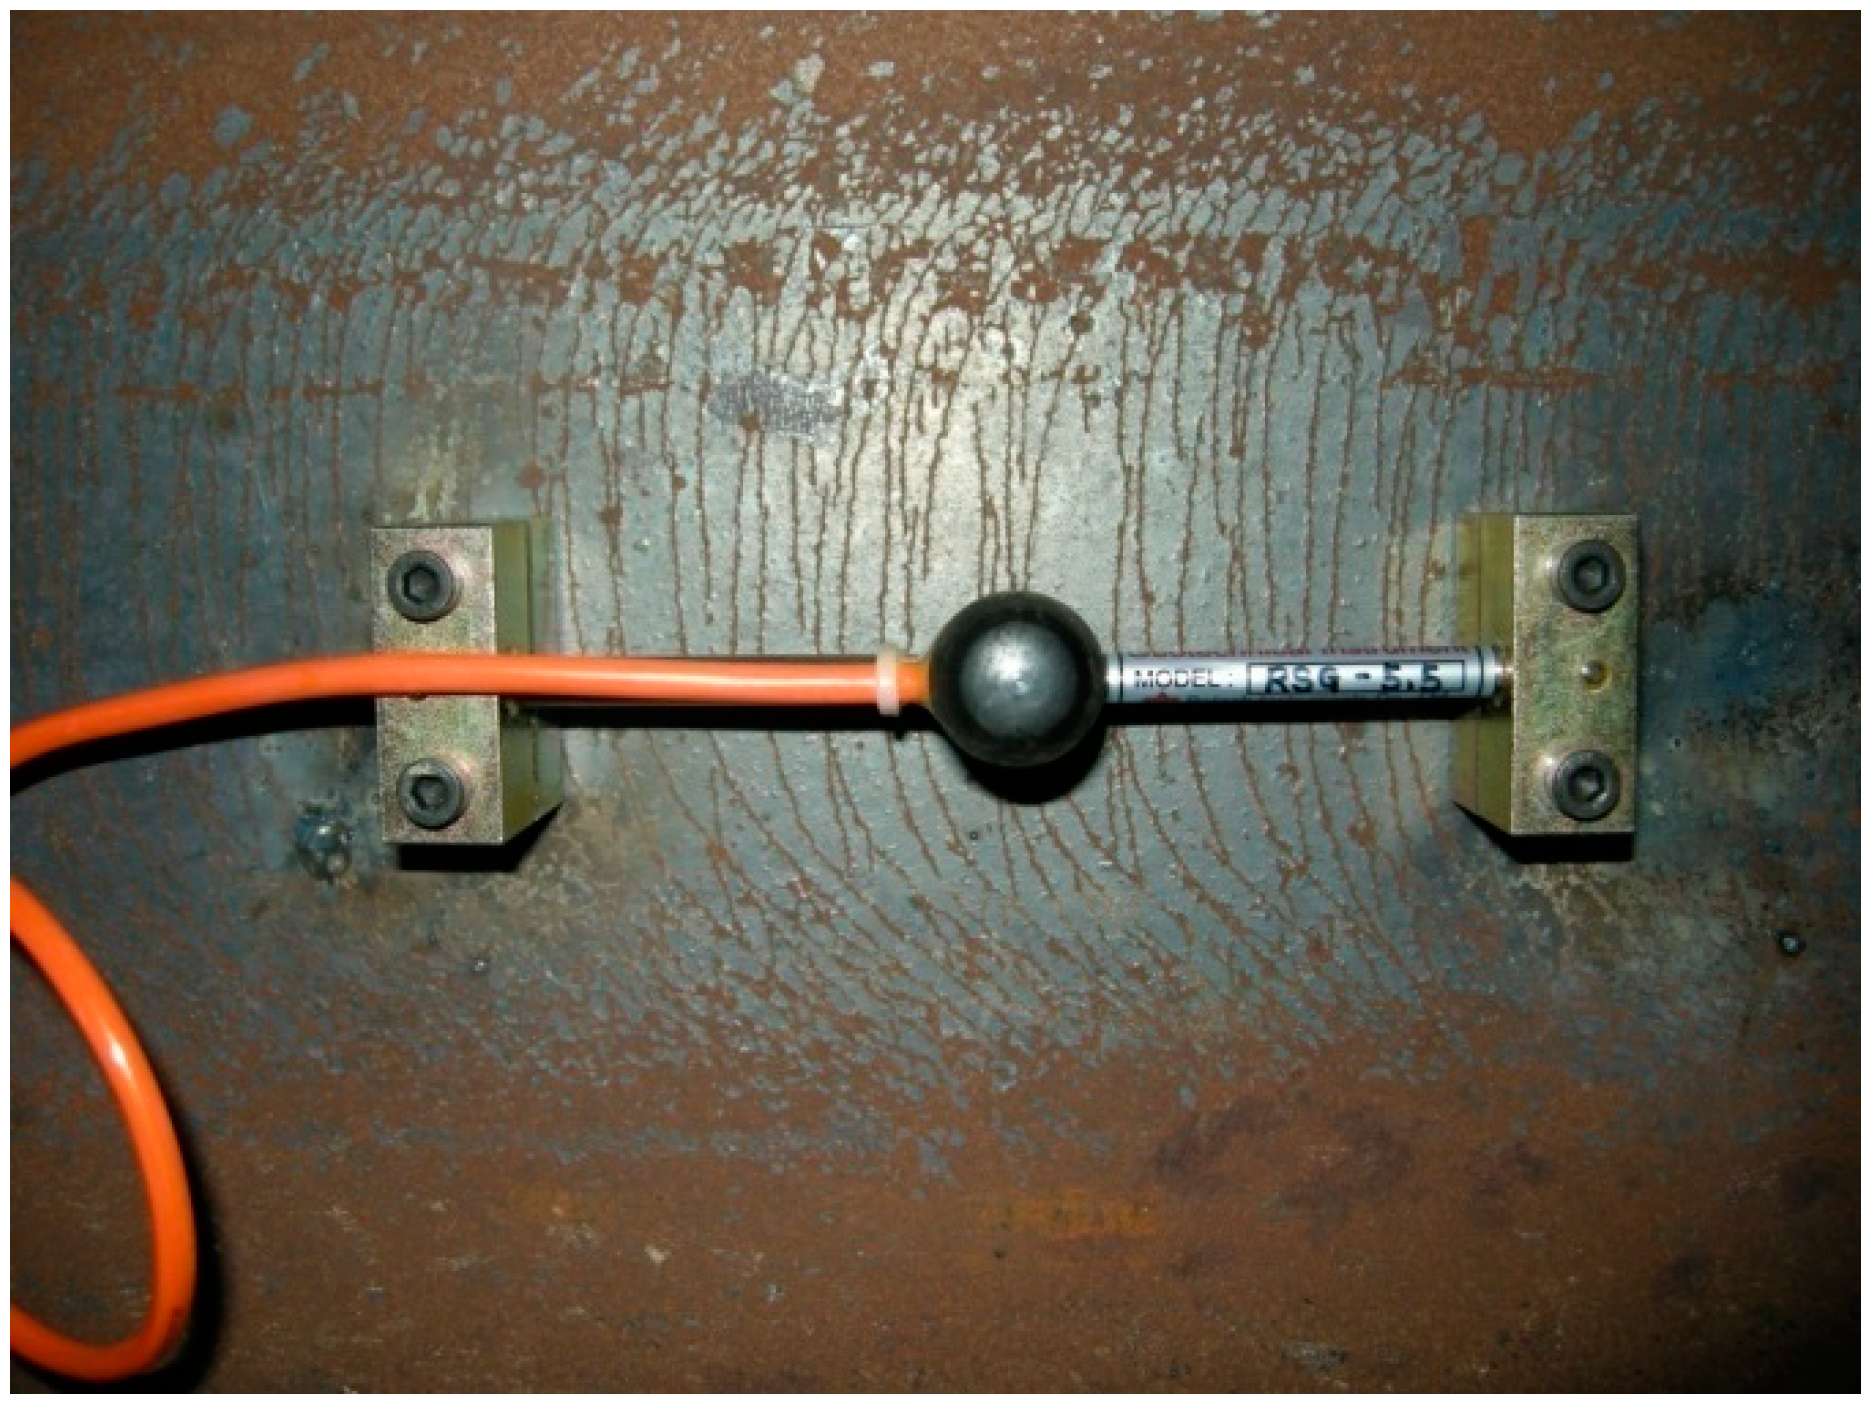
2. Average Strain of Waler Beams Measured by VWSGs

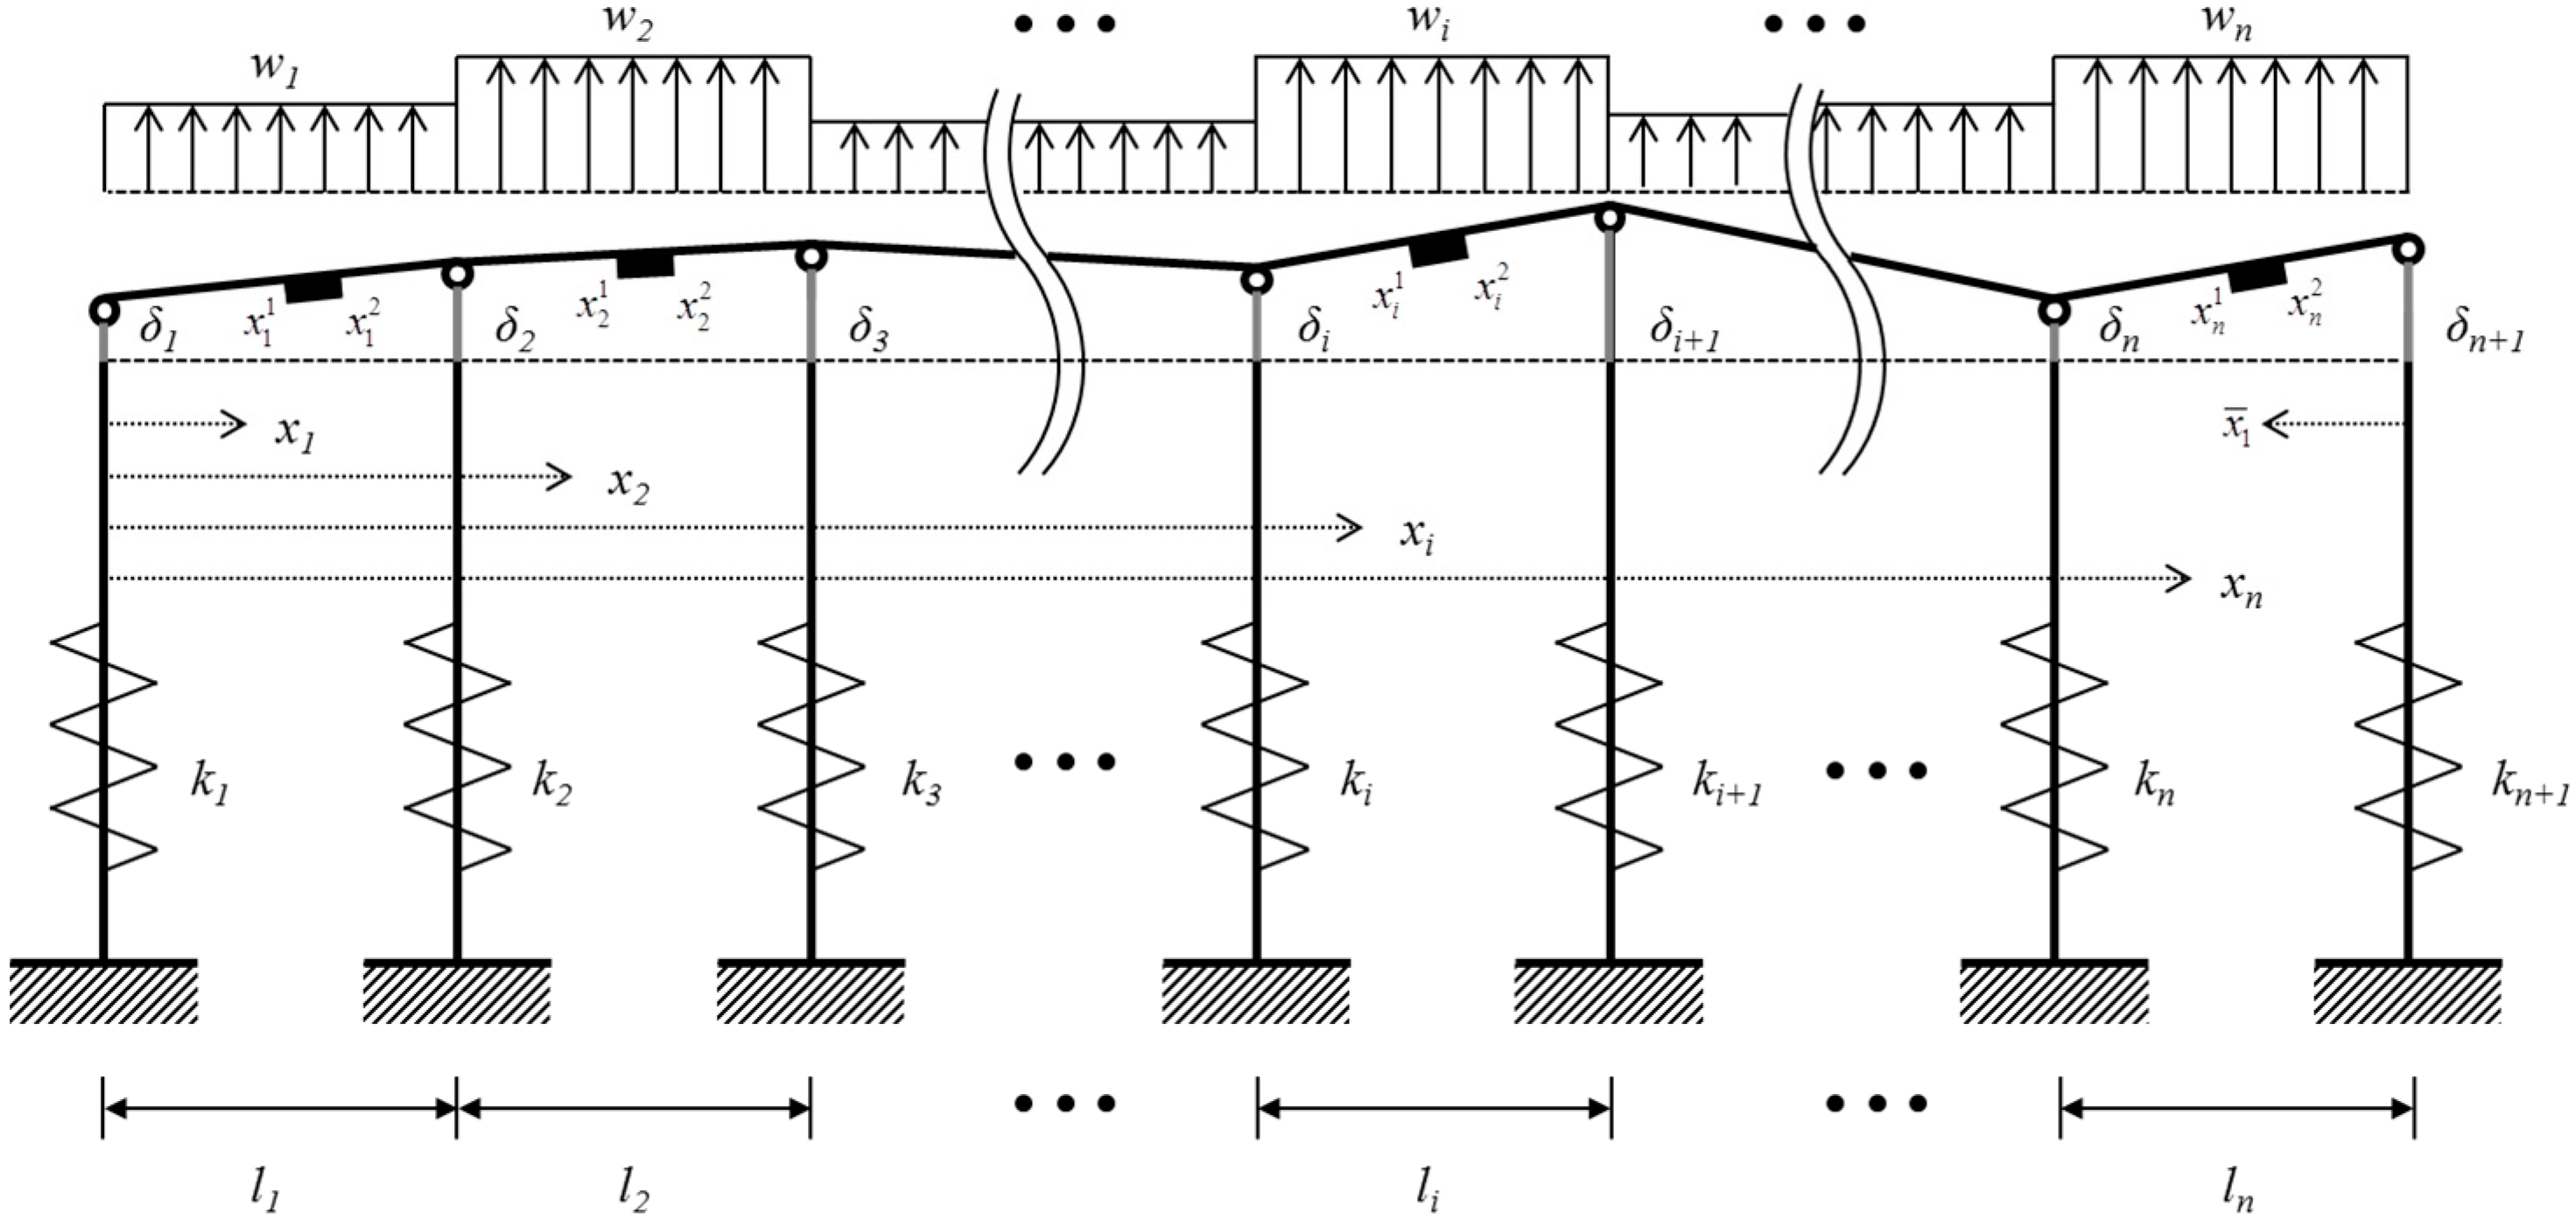
3. Estimation Model for Maximum Stress
4. Test of the Model on Multi-Span Beams
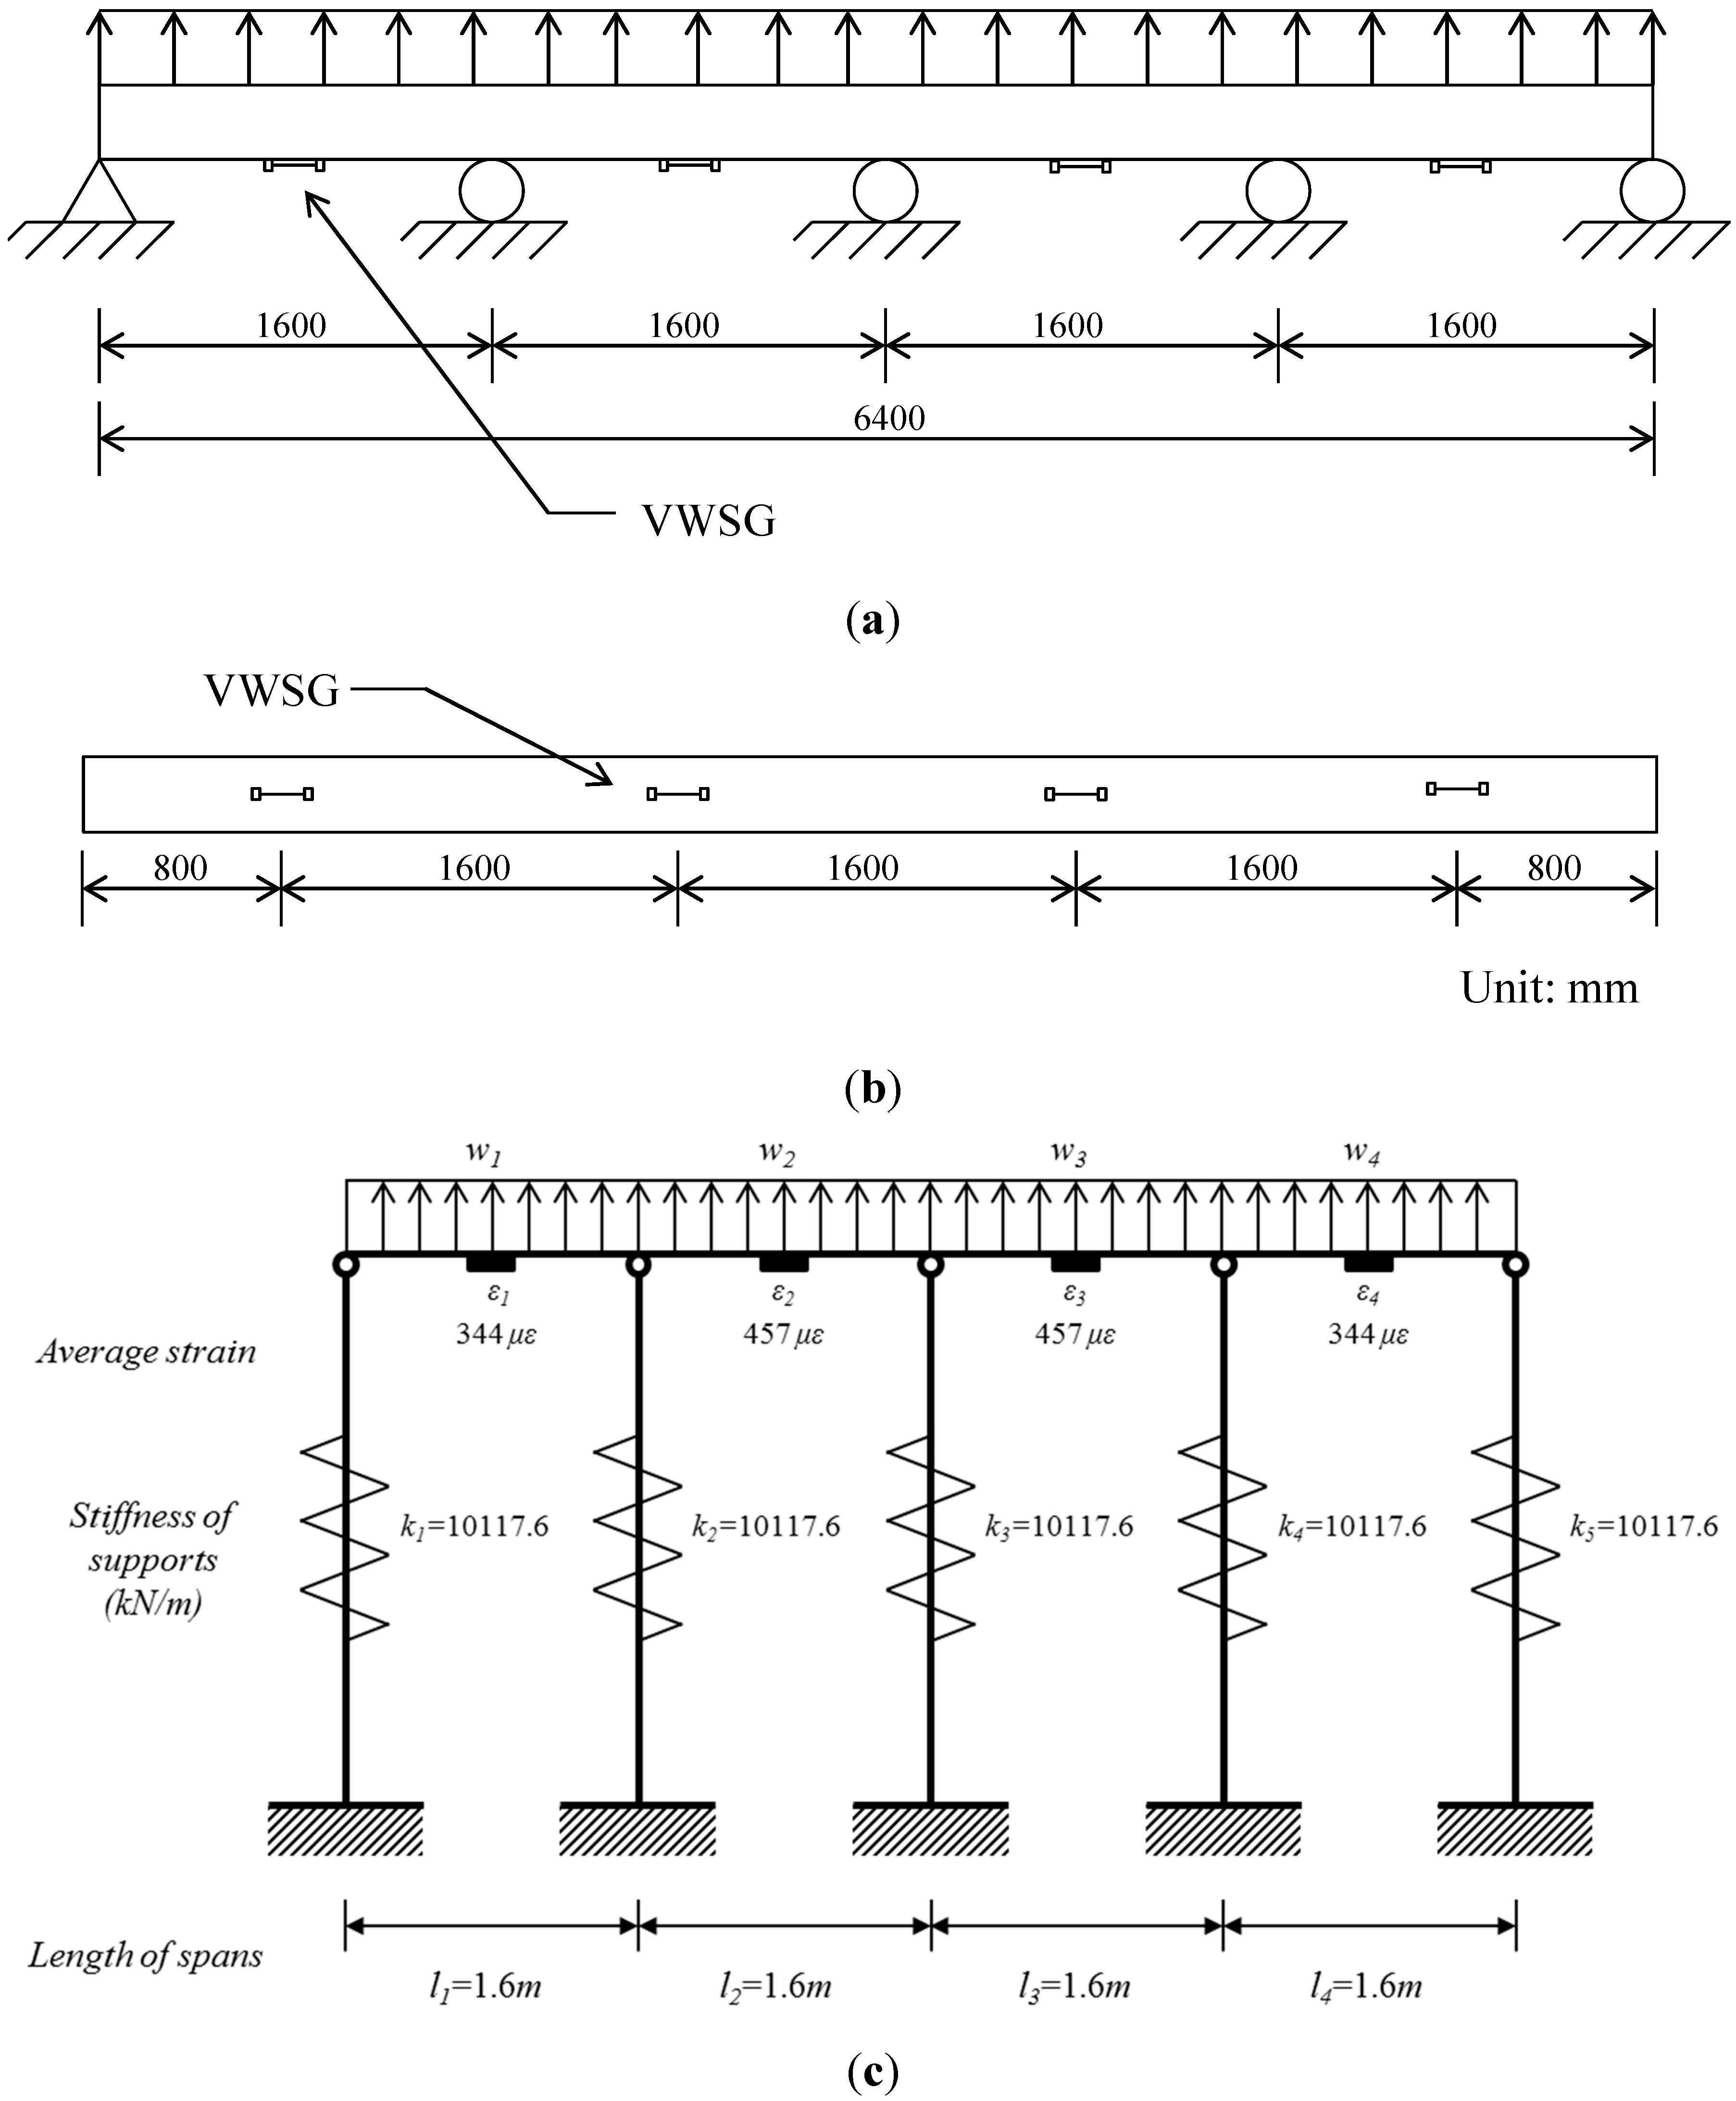
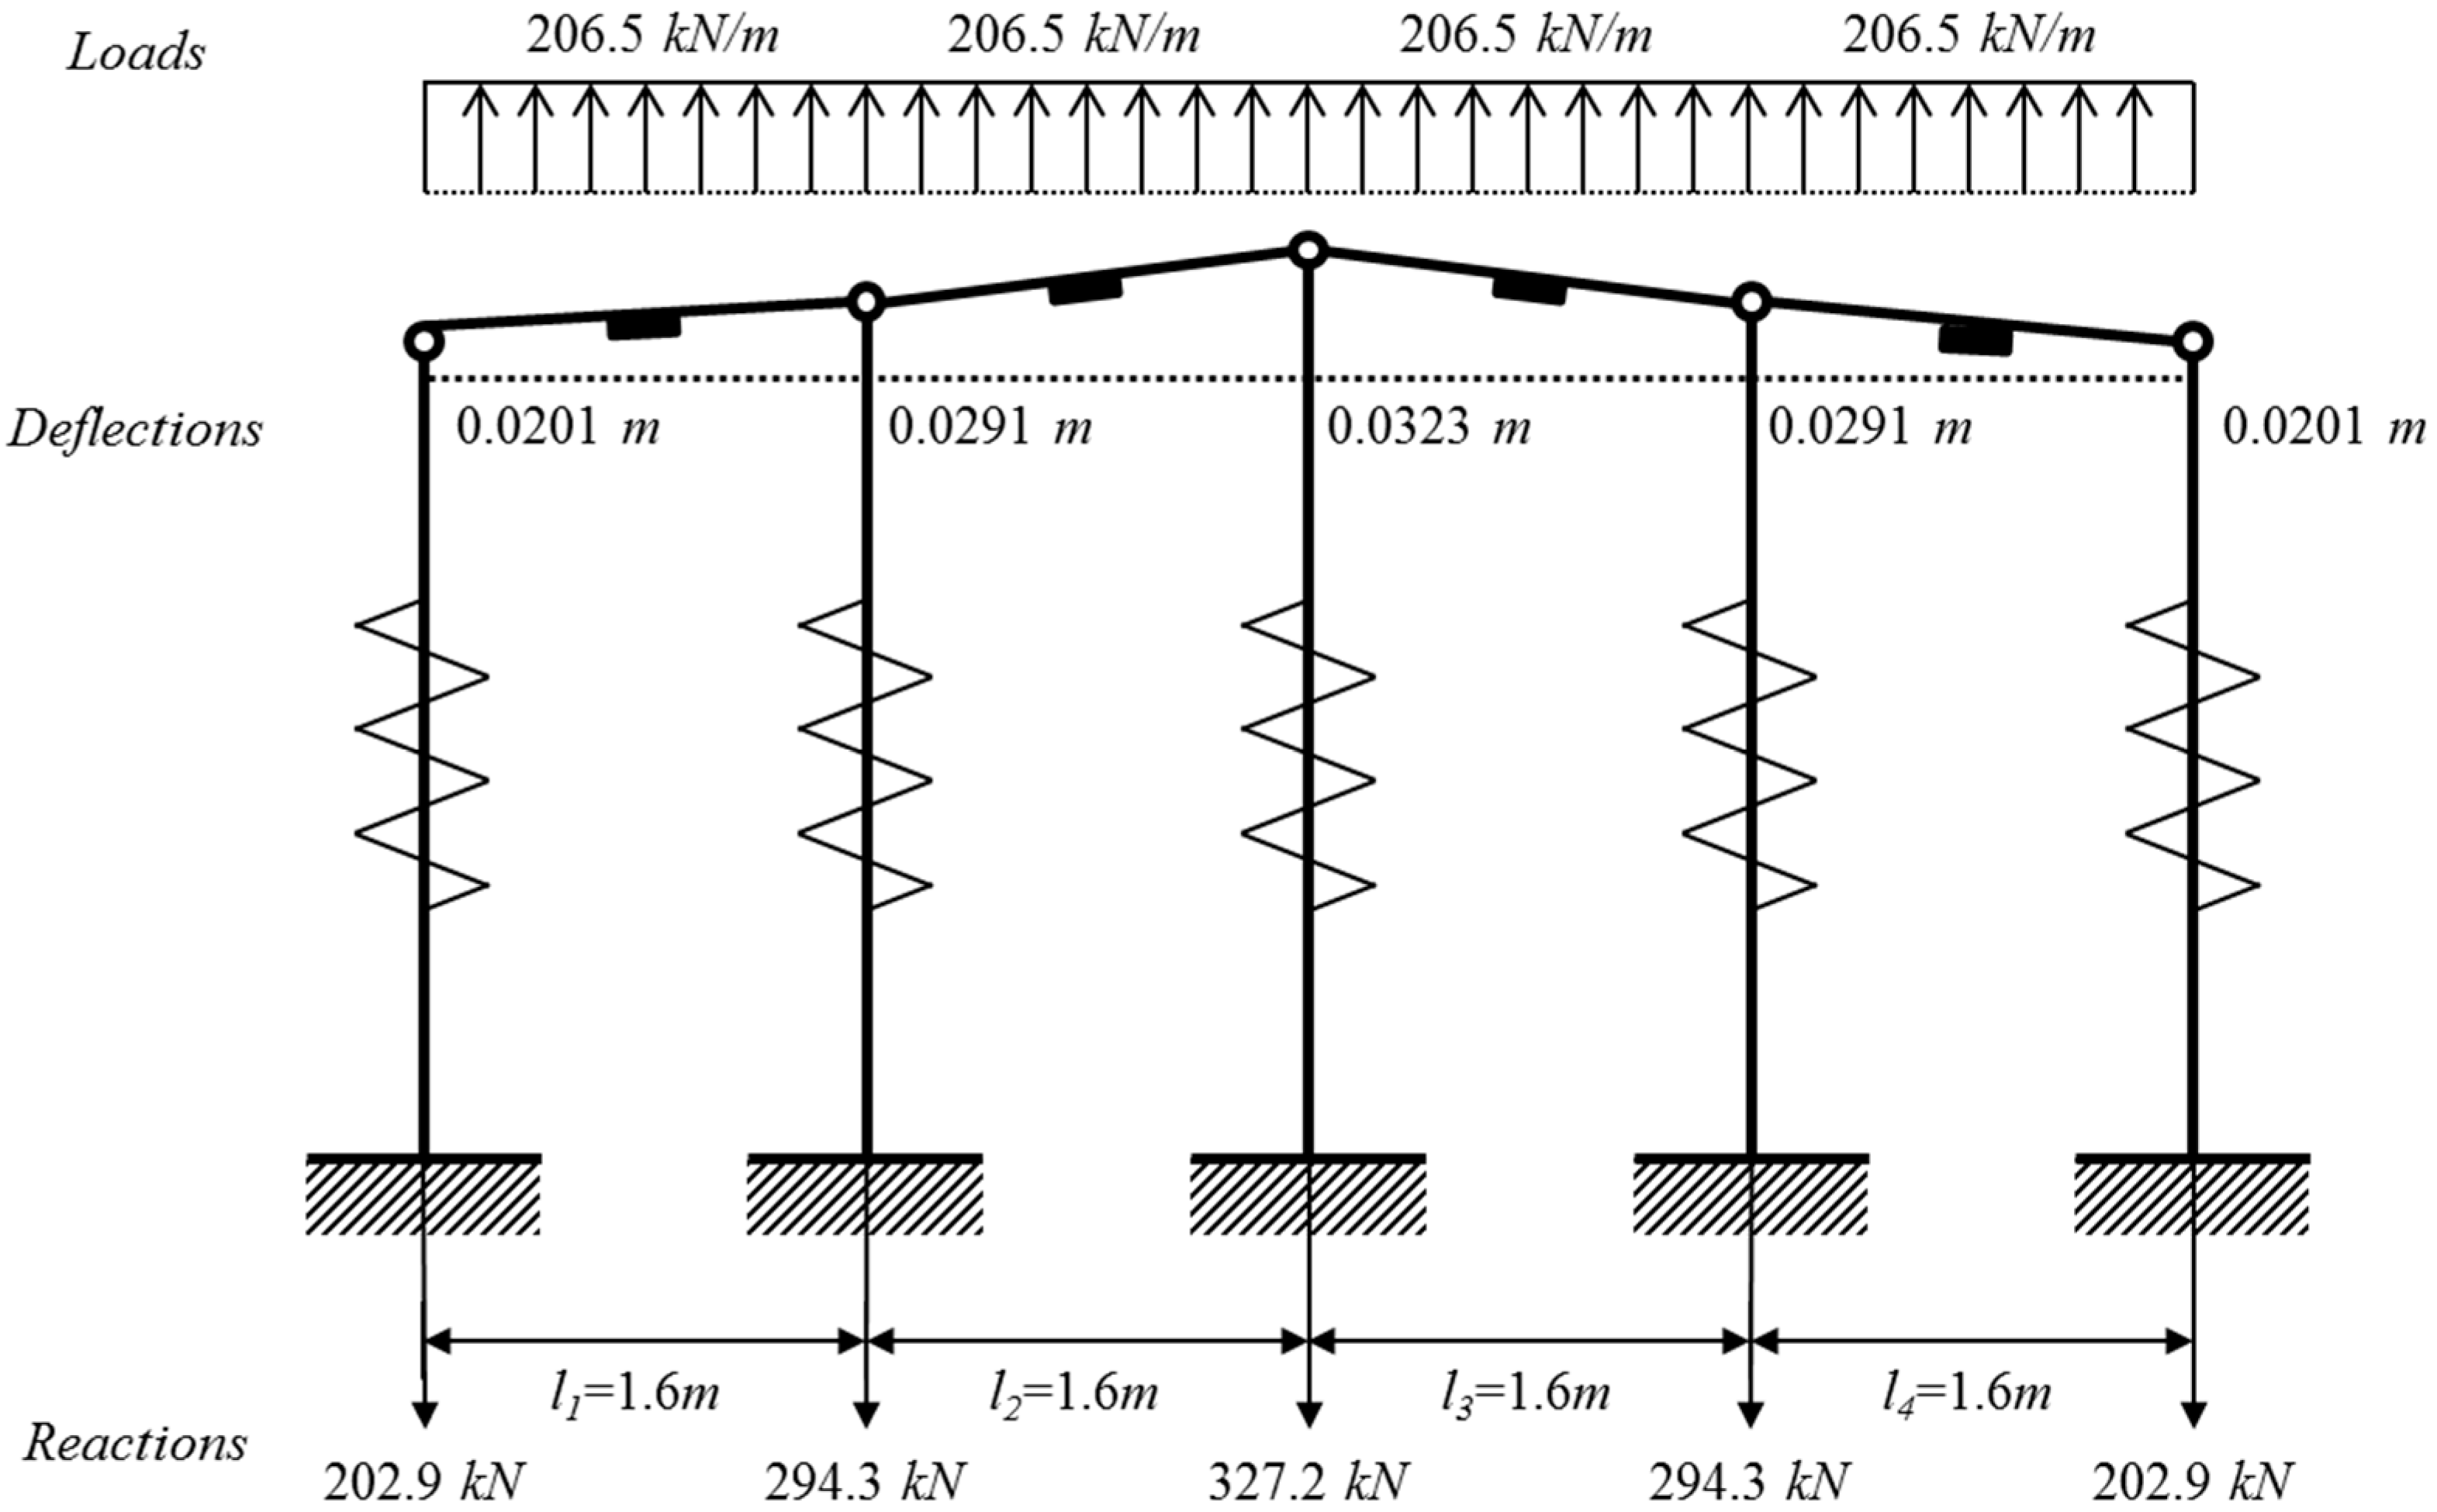
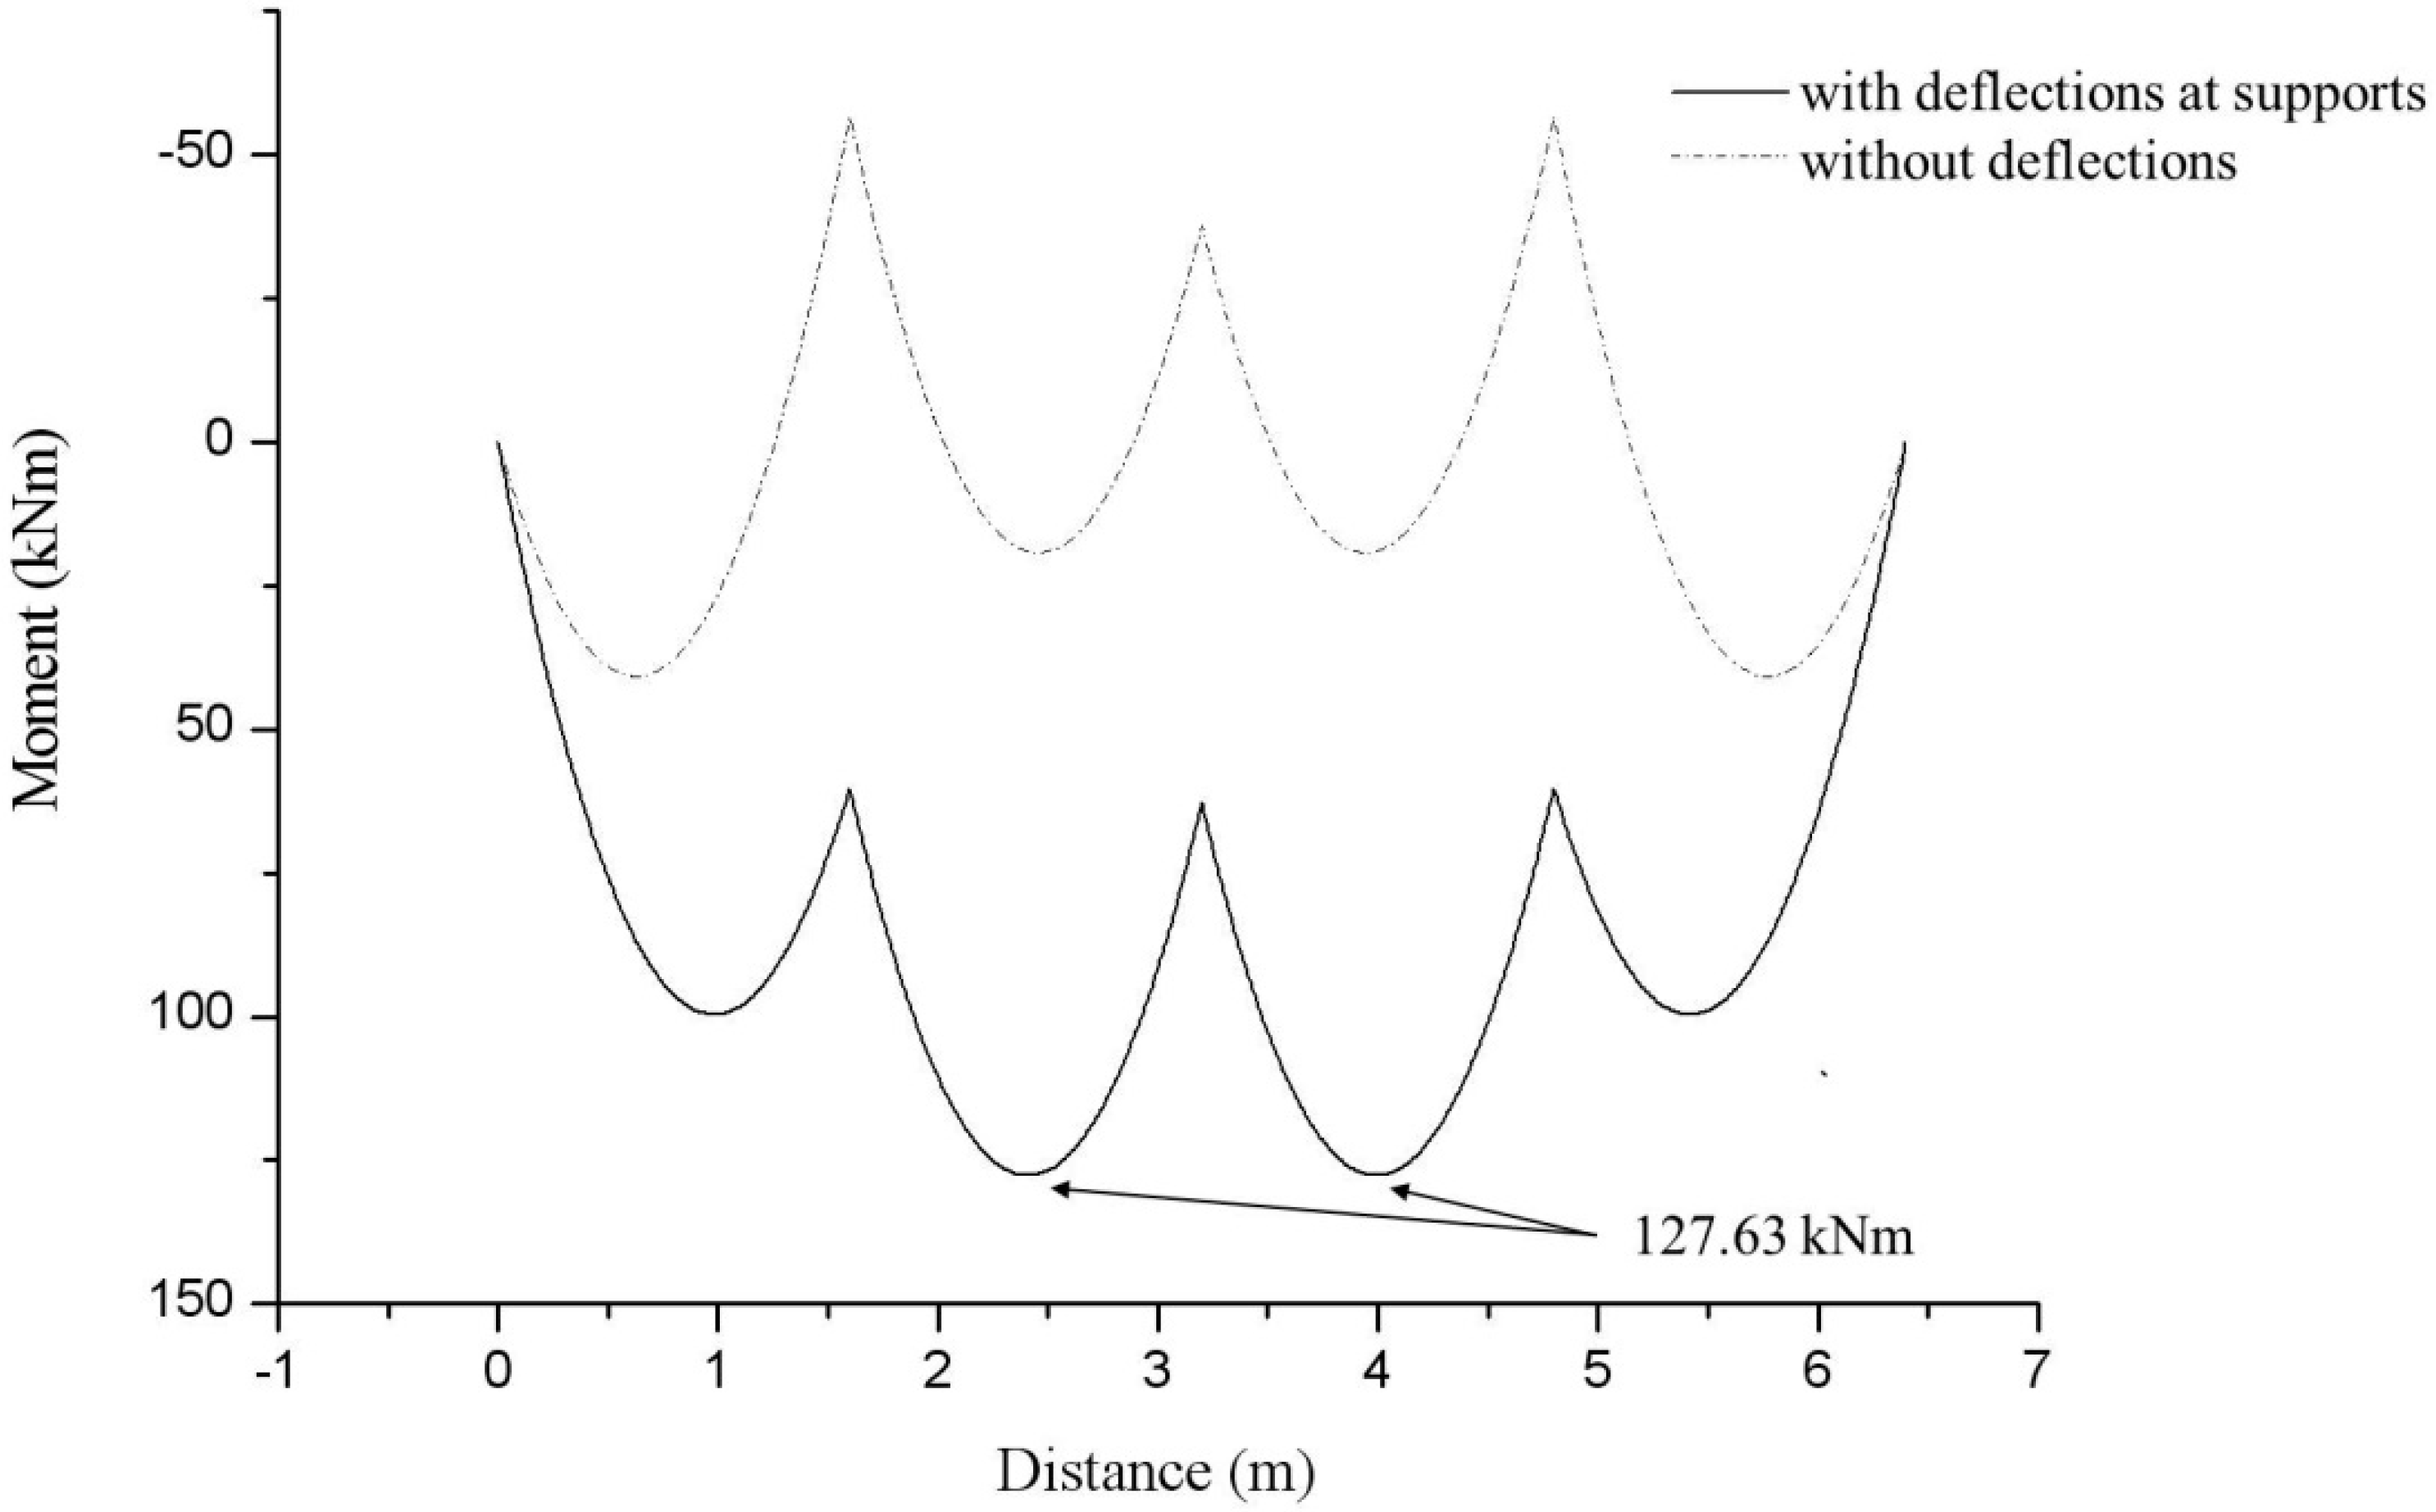
4.1. Four-Span Beam


| Deflection (m) | Reaction (kN) | Distributed load (kN/m) |
|---|---|---|
| = 0.0201 | R1 = 202.9 | w1 = 206.5 |
| = 0.0291 | R2 = 294.3 | w2 = 206.5 |
| = 0.0323 | R3 = 327.2 | w3 = 206.5 |
| = 0.0291 | R4 = 294.3 | w4 = 206.5 |
| = 0.0201 | R5 = 202.9 |
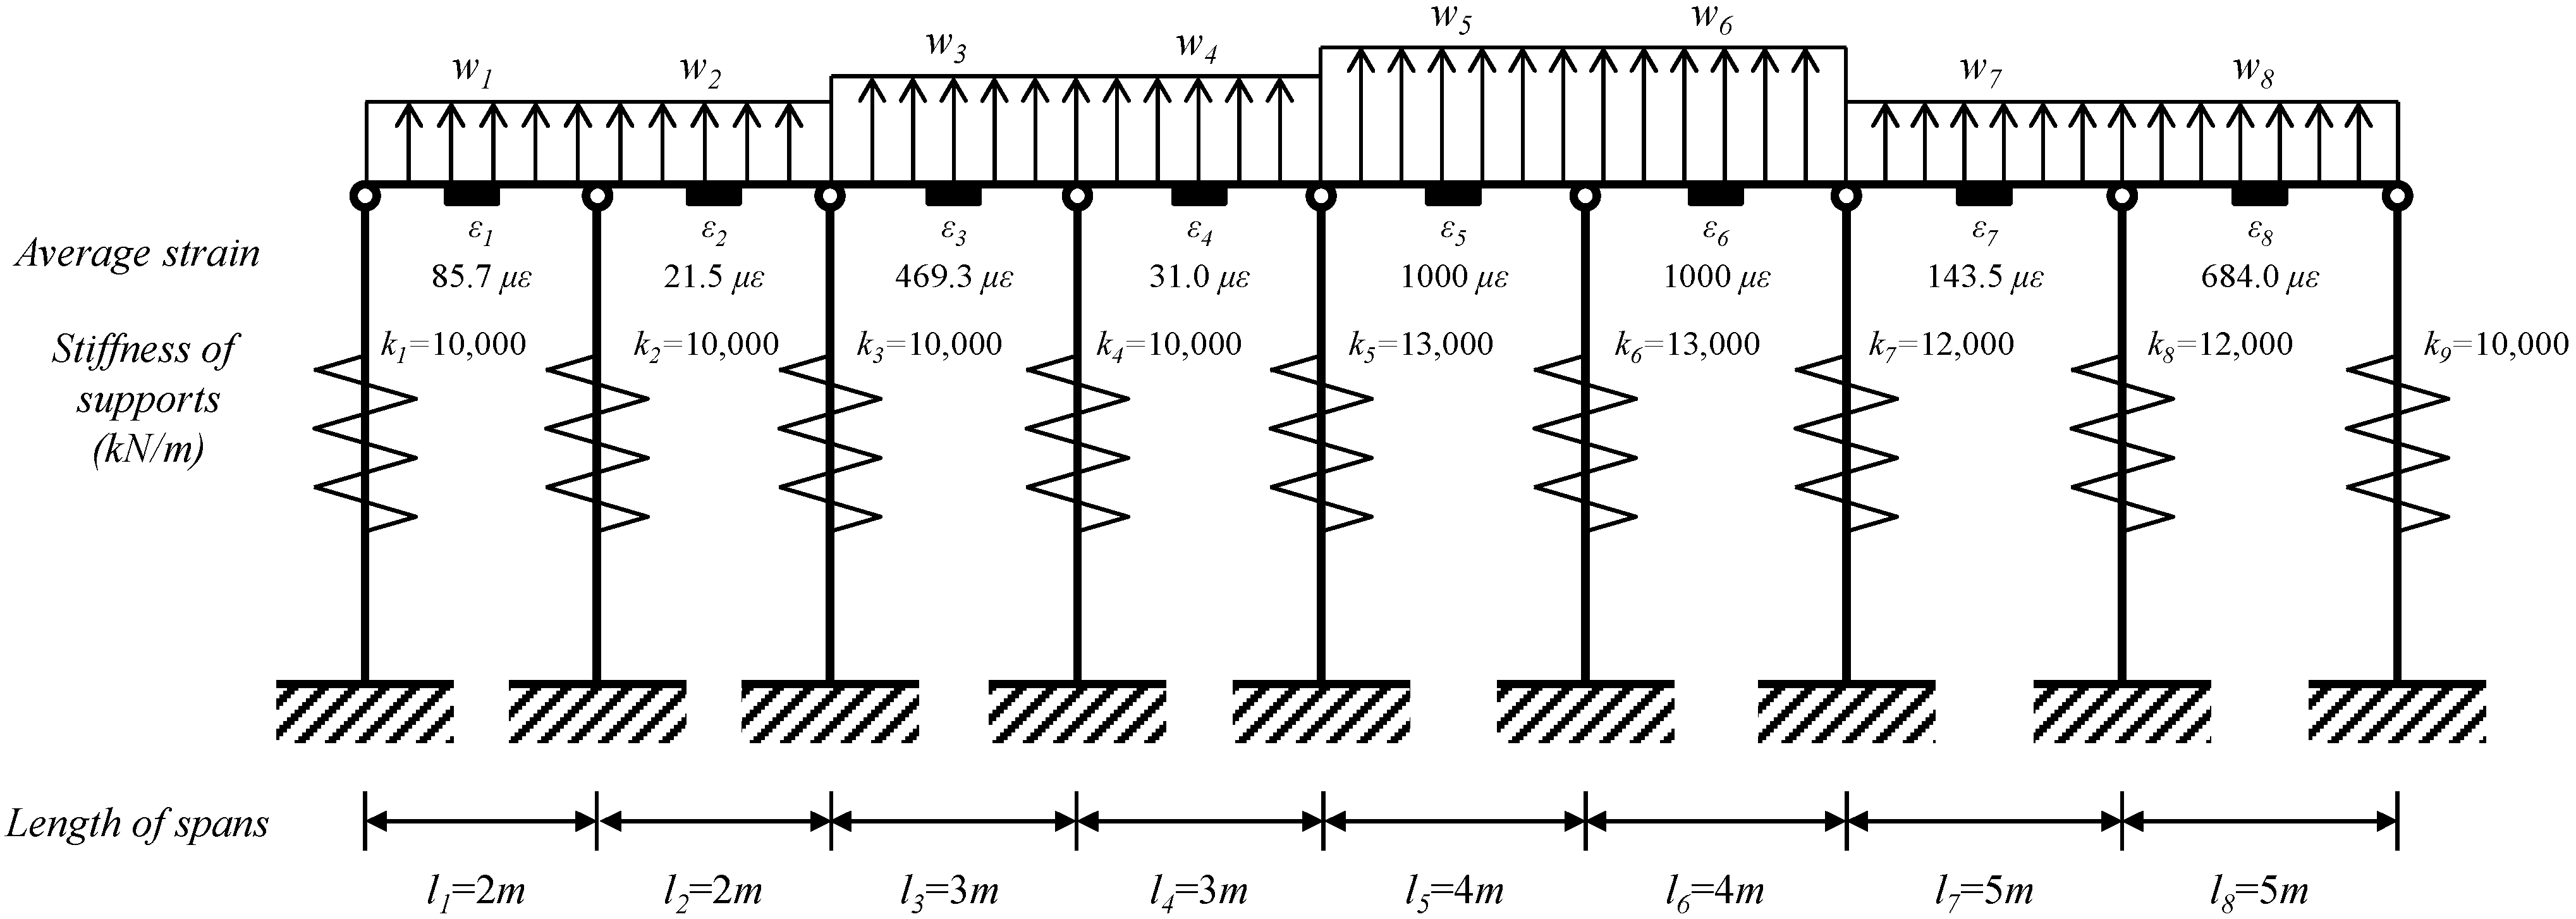
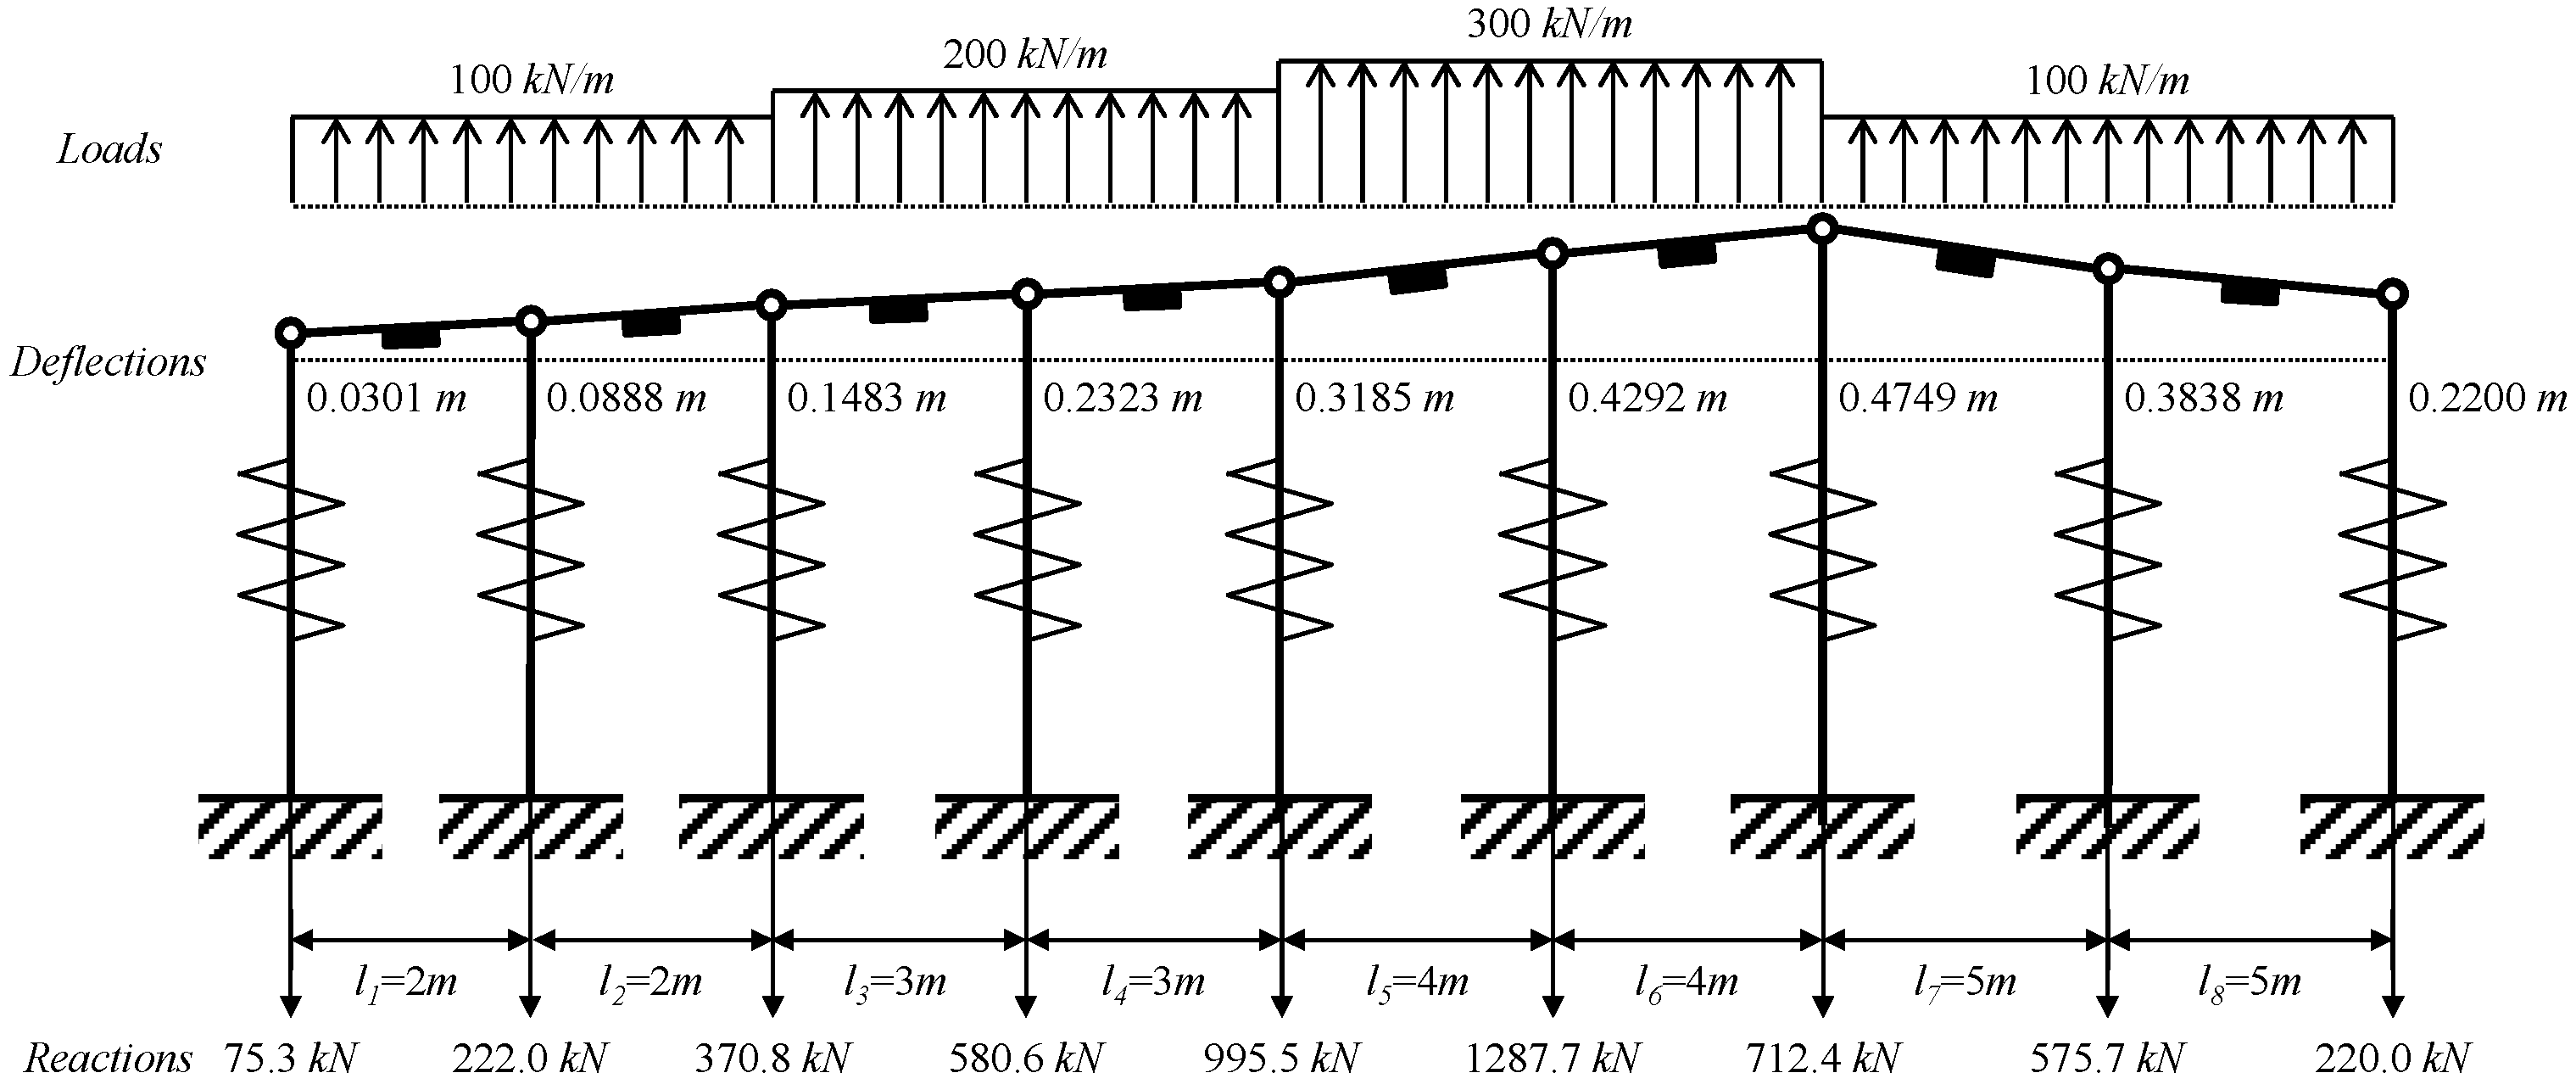
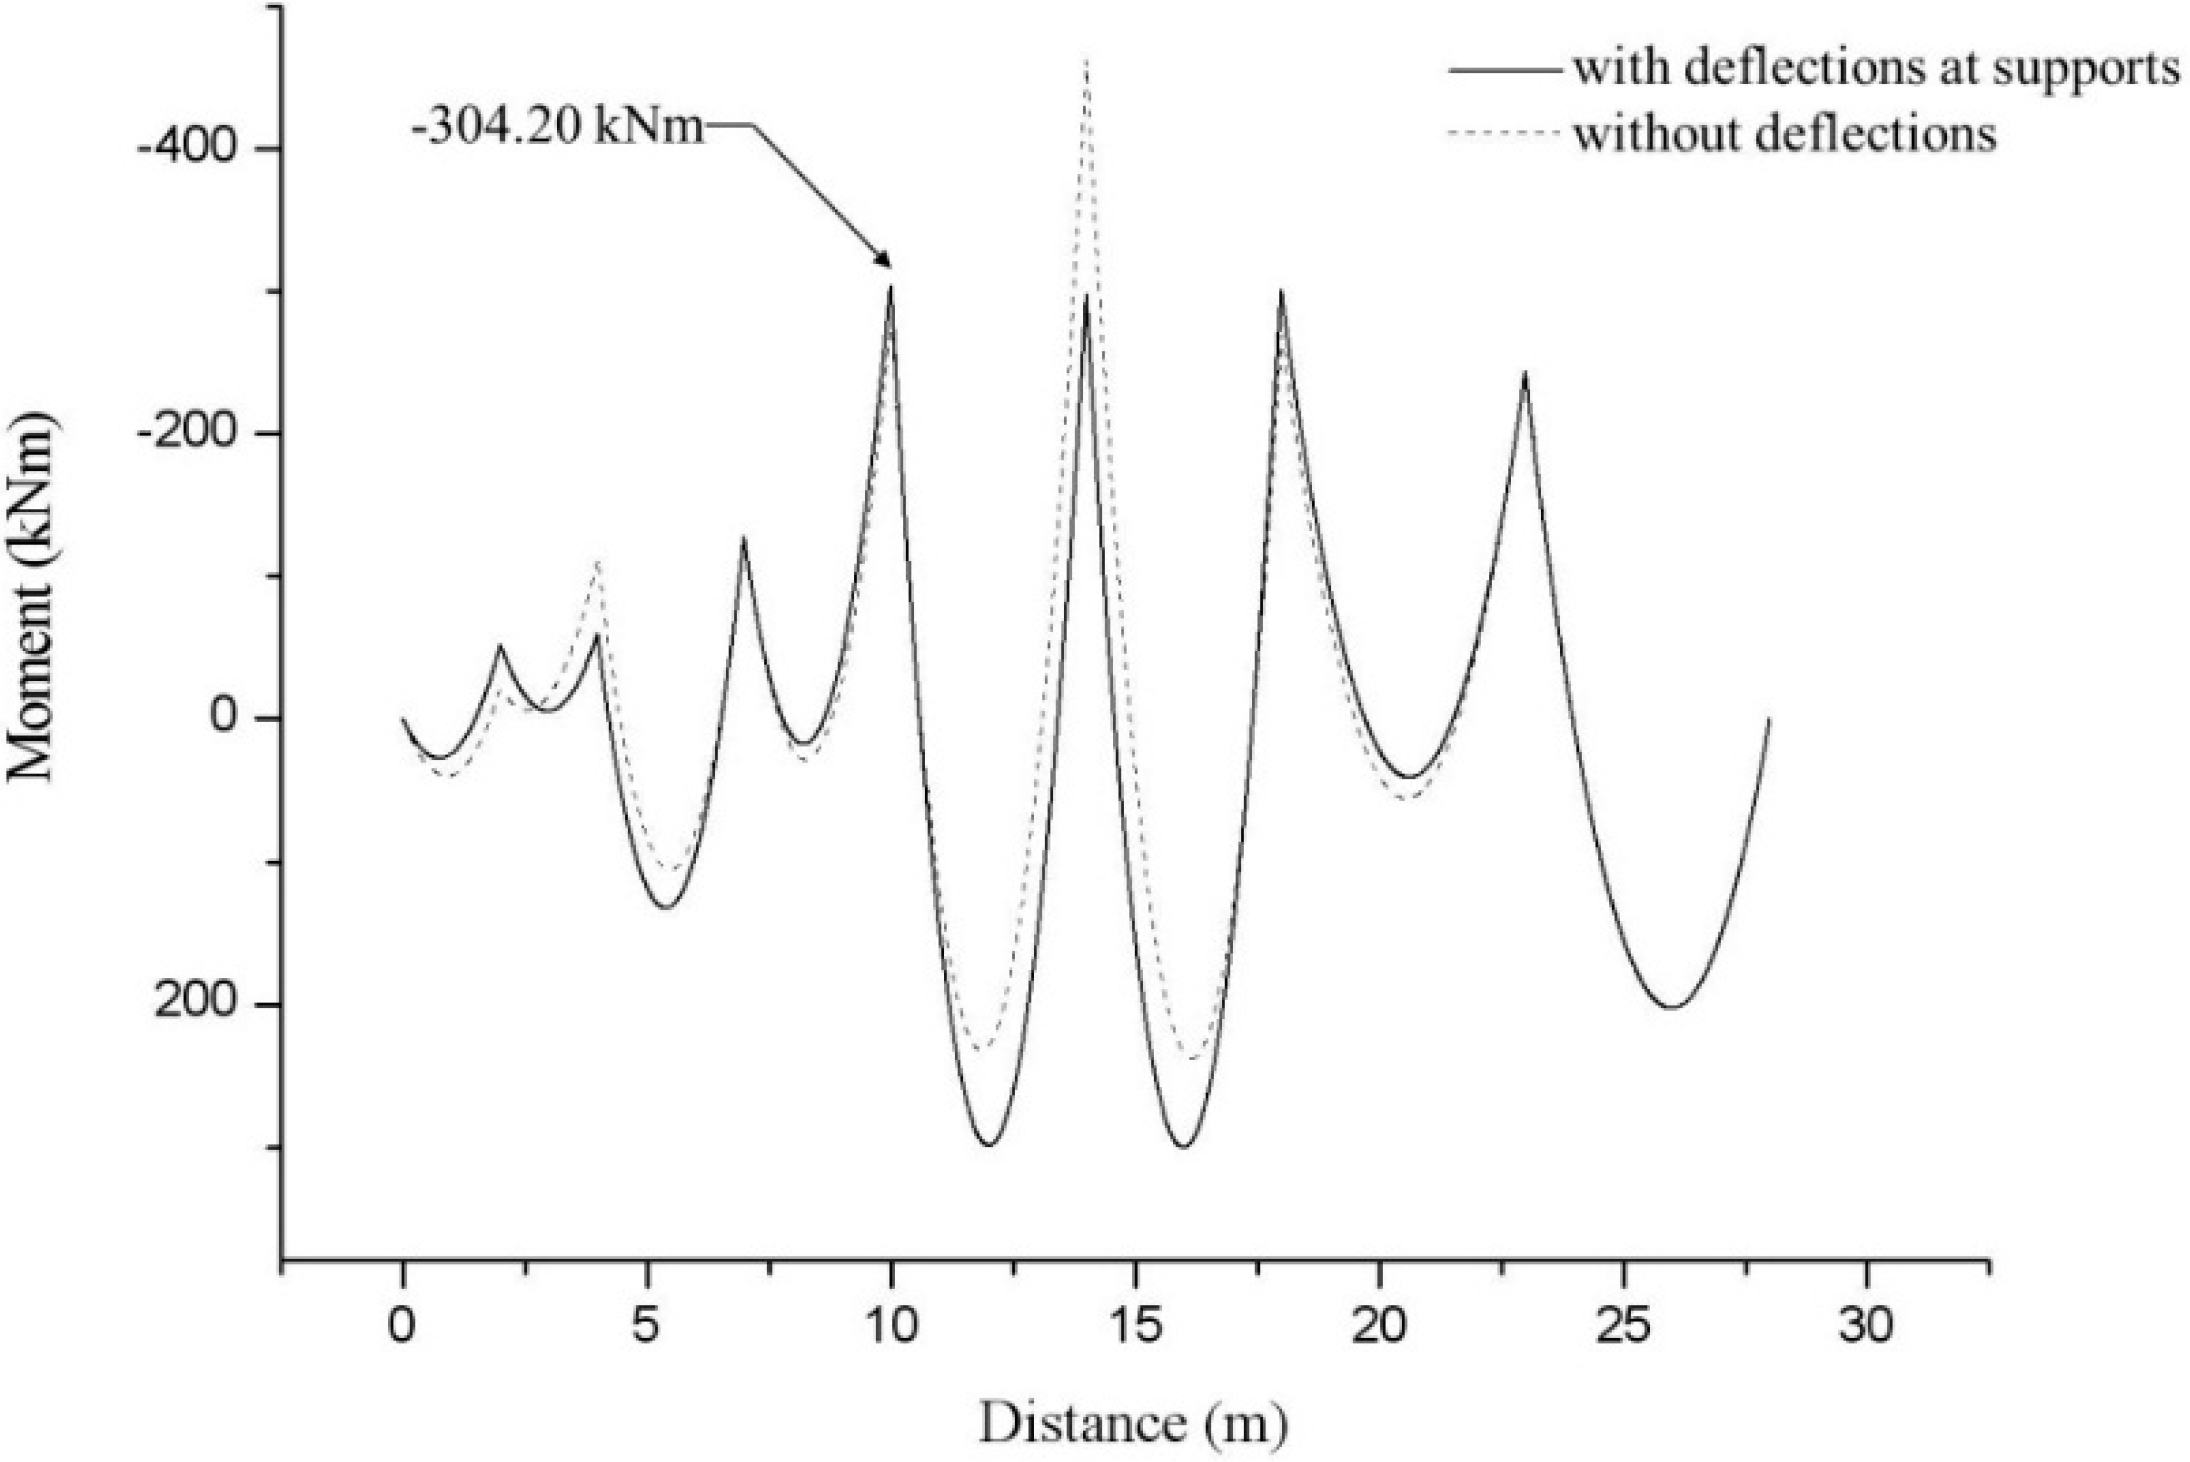
4.2. Eight-Span Beam

| Span Length (m) | Stiffness of Anchor (kN/m) | Average Strain () |
|---|---|---|
| = 2.0 | = 10,000.0 | = 85.7 |
| =2.0 | = 10,000.0 | = 21.5 |
| = 3.0 | = 10,000.0 | = 469.3 |
| = 3.0 | = 10,000.0 | = 31.0 |
| = 4.0 | = 13,000.0 | = 1,000.0 |
| = 4.0 | = 13,000.0 | = 1,000.0 |
| = 5.0 | = 12,000.0 | = 143.5 |
| = 5.0 | = 12,000.0 | = 684.0 |
| = 10,000.0 |
| Deflection (cm) | Reaction (kN) | Distributed Load (kN/m) |
|---|---|---|
| = 3.01 | R1 = 75.3 | w1 = 100 |
| = 8.88 | R2 = 222.0 | w2 = 100 |
| = 14.83 | R3 = 378.8 | w3 = 200 |
| = 23.23 | R4 = 586.6 | w4 = 200 |
| = 31.85 | R5 = 995.5 | w5 = 300 |
| = 42.92 | R6 =1287.7 | w6 = 300 |
| = 47.49 | R7 = 712.4 | w7 = 100 |
| = 38.38 | R8 = 575.7 | w8 = 100 |
| = 22.00 | R9 = 220.0 |


5. Conclusions
Acknowledgments
Author Contributions
Appendix
A. Three Moment Equation
B. Matrices in Section 3
Conflicts of Interest
References
- Jiang, X.; Adeli, H. Pseudospectra, music, and dynamic wavelet neural network for damage detection of highrise buildings. Int. J. Numer. Meth. Eng. 2007, 71, 606–629. [Google Scholar] [CrossRef]
- Li, H.; Huang, Y.; Ou, J.; Bao, Y. Fractal dimension-based damage detection method for beams with a uniform cross-section. Comput.-Aided Civ. Inf. 2011, 26, 190–206. [Google Scholar] [CrossRef]
- Rezaei, D.; Taheri, F. Damage identification in beams using empirical mode decomposition. Struct. Health Monit. 2011, 10, 261–274. [Google Scholar] [CrossRef]
- Park, H.S.; Lee, H.M.; Adeli, H.; Lee, I. A new approach for health monitoring of structures: Terrestrial laser scanning. Comput.-Aided Civ. Inf. 2007, 22, 19–30. [Google Scholar] [CrossRef]
- Mitchell, R.; Kim, Y.; El-Korchi, T. System identification of smart structures using a wavelet neuro-fuzzy model. Smart Mater. Struct. 2012, 21, 115009. [Google Scholar] [CrossRef]
- Choi, S.W.; Lee, J.; Oh, B.H.; Park, H.S. Measurement Model for the Maximum Strain in Beam Structures Using Multiplexed Fiber Bragg Grating Sensors. Int. J. Distrib. Sens. N 2013. 894780. [Google Scholar]
- Hong, K.; Lee, J.; Choi, S.W.; Kim, Y.; Park, H.S. A Strain-Based Load Identification Model for Beams in Building Structures. Sensors 2013, 13, 9909–9920. [Google Scholar] [CrossRef] [PubMed]
- Ng, C.-T. Bayesian model updating approach for experimental identification of damage in beams using guided waves. Struct. Health Monit. 2014, 13, 359–373. [Google Scholar] [CrossRef]
- Hampshire, T.A.; Adeli, H. Monitoring the behavior of steel structures using distributed optical fiber sensors. J. Constr. Steel Res. 2000, 53, 267–281. [Google Scholar] [CrossRef]
- Park, H.S.; Jung, H.S.; Kwon, Y.H.; Seo, J.H. Mathematical models for assessment of the safety of steel beams based on average strains from long gage optic sensors. Sens. Actuators A Phys. 2006, 125, 109–113. [Google Scholar] [CrossRef]
- Sari, M.; Bucher, A.E. Natural frequencies and critical loads of beams and columns with damaged boundaries using Chebyshev polynomials. Int. J. Eng. Sci. 2010, 48, 862–873. [Google Scholar] [CrossRef]
- Wu, N.; Wang, Q. Experimental studies on damage detection of beam structures with wavelet transform. Int. J. Eng. Sci. 2011, 48, 835–847. [Google Scholar]
- Khorram, A.; Bakhtiari-Nejad, F.; Rezaeian, M. Comparison studies between two wavelet based crack detection methods of a beam subjected to a moving load. Int. J. Eng. Sci. 2012, 51, 204–215. [Google Scholar] [CrossRef]
- Park, H.S.; Jung, S.M.; Lee, H.M.; Kwon, Y.H.; Seo, J.H. Analytical models for assessment of the safety of multi-span steel beams based on average strains from long gage optic sensors. Sens. Actuators A Phys. 2007, 137, 6–12. [Google Scholar] [CrossRef]
- Casas, J.R.; Cruz, J.S. Fiber optic sensors for bridge monitoring. J. Bridge Eng. ASCE 2003, 8, 362–373. [Google Scholar] [CrossRef]
- Lee, H.M.; Kim, J.M.; Sho, K.; Park, H.S. A wireless vibrating wire sensor node for continuous structural health monitoring. Smart Mater. Struct. 2010, 19, 055004. [Google Scholar] [CrossRef]
- Lee, H.M.; Choi, S.W.; Jung, D.; Park, H.S. Analytical Model for Estimation of Maximum Normal Stress in Steel Beam-Columns Based on Wireless Measurement of Average Strains from Vibrating Wire Strain Gages. Comput.-Aided Civ. Inf. 2013, 28, 707–717. [Google Scholar] [CrossRef]
- Lee, H.M.; Park, H.S. Measurement of Maximum Strain of Steel Beam Structures Based on Average Strains from Vibrating Wire Strain Gages. Exp. Tech. 2013, 37, 23–29. [Google Scholar] [CrossRef]
- Geotechnical Design Procedure for Flexible Wall Systems. Available online: https://www.dot.ny.gov/divisions/engineering/technical-services/technical-services-repository/GDP-11b.pdf (accessed on 28 January 2015).
- Retaining Walls. Available online: http://www.dot.ca.gov/hq/esc/techpubs/manual/bridgemanuals/bridge-design-specifications/page/section5.pdf (accessed on 28 January 2015).
- Gere, J.M.; Timoshenko, S.P. Mechanics of Material, 2nd ed.; PWS Engineering: Boston, MA, USA, 1984; pp. 212–220. [Google Scholar]
- Park, H.S.; Lee, H.Y.; Choi, S.W.; Kim, Y.S. A Practical Monitoring System for the Structural Safety of Mega-Trusses Using Wireless Vibrating Wire Strain Gauges. Sensors 2013, 13, 17346–17361. [Google Scholar] [CrossRef]
- Geokon. Available online: http://www.geokon.com/strain-gages/ (accessed on 28 January 2015).
- RST. Available online: http://www.rstinstruments.com/Vibrating%20Wire%20Strain%20Gauges.html (accessed on 28 January 2015).
© 2015 by the authors; licensee MDPI, Basel, Switzerland. This article is an open access article distributed under the terms and conditions of the Creative Commons Attribution license (http://creativecommons.org/licenses/by/4.0/).
Share and Cite
Park, S.W.; Oh, B.K.; Park, H.S. Maximum Stress Estimation Model for Multi-Span Waler Beams with Deflections at the Supports Using Average Strains. Sensors 2015, 15, 7728-7741. https://doi.org/10.3390/s150407728
Park SW, Oh BK, Park HS. Maximum Stress Estimation Model for Multi-Span Waler Beams with Deflections at the Supports Using Average Strains. Sensors. 2015; 15(4):7728-7741. https://doi.org/10.3390/s150407728
Chicago/Turabian StylePark, Sung Woo, Byung Kwan Oh, and Hyo Seon Park. 2015. "Maximum Stress Estimation Model for Multi-Span Waler Beams with Deflections at the Supports Using Average Strains" Sensors 15, no. 4: 7728-7741. https://doi.org/10.3390/s150407728