
A Review of Intelligent Driving Style Analysis Systems and Related Artificial Intelligence Algorithms


Abstract
:1. Introduction
2. Driver and Road Safety Concerns in Developing Countries

3. Driving Styles
3.1. Normal / Safe Driving Style
3.2. Aggressive Driving Style
3.3. Inattentive Driving Style
3.3.1. Driver Fatigue
3.3.2. Driver Distraction
3.4. Drunk Driving Style
4. Applications Assessing Driver Behaviour
4.1. Driver Assistance
4.2. Drowsiness Detection
4.3. Driver Distraction Detection
4.3.1. Early-Warning Applications
4.3.2. Driver Performance Assessment
4.3.3. Riding Comfort Improvement

4.4. Eco Driving
4.5. Road and Vehicle Condition Monitoring

4.6. Fleet Management
4.7. Accident Detection
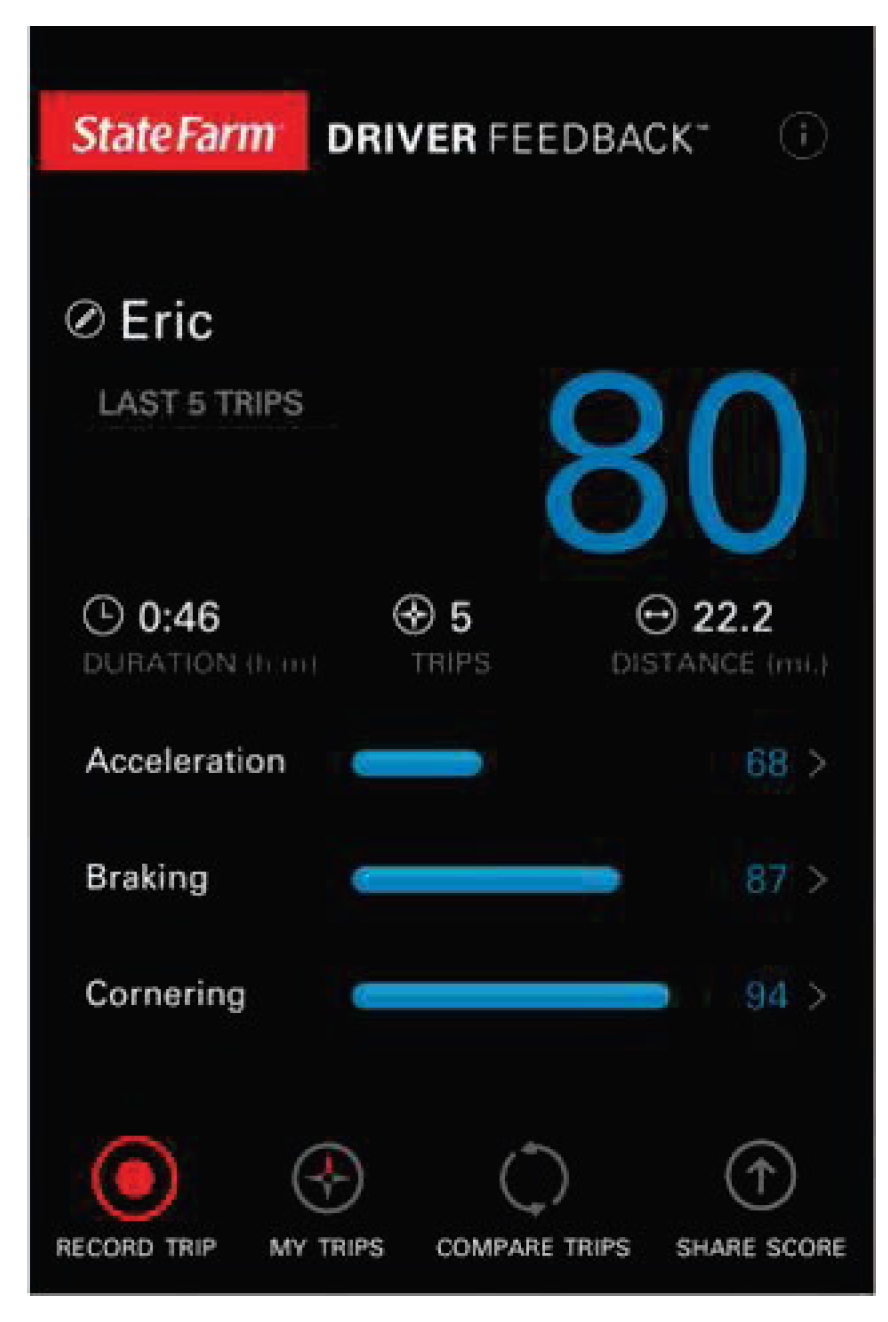
4.8. Insurance Applications

4.9. Hijacking Detection
4.10. Intelligent Vehicles Systems and Autonomous Vehicles

5. Underlying Algorithms
5.1. Artificial Neural Networks
5.2. Fast Fourier Transform
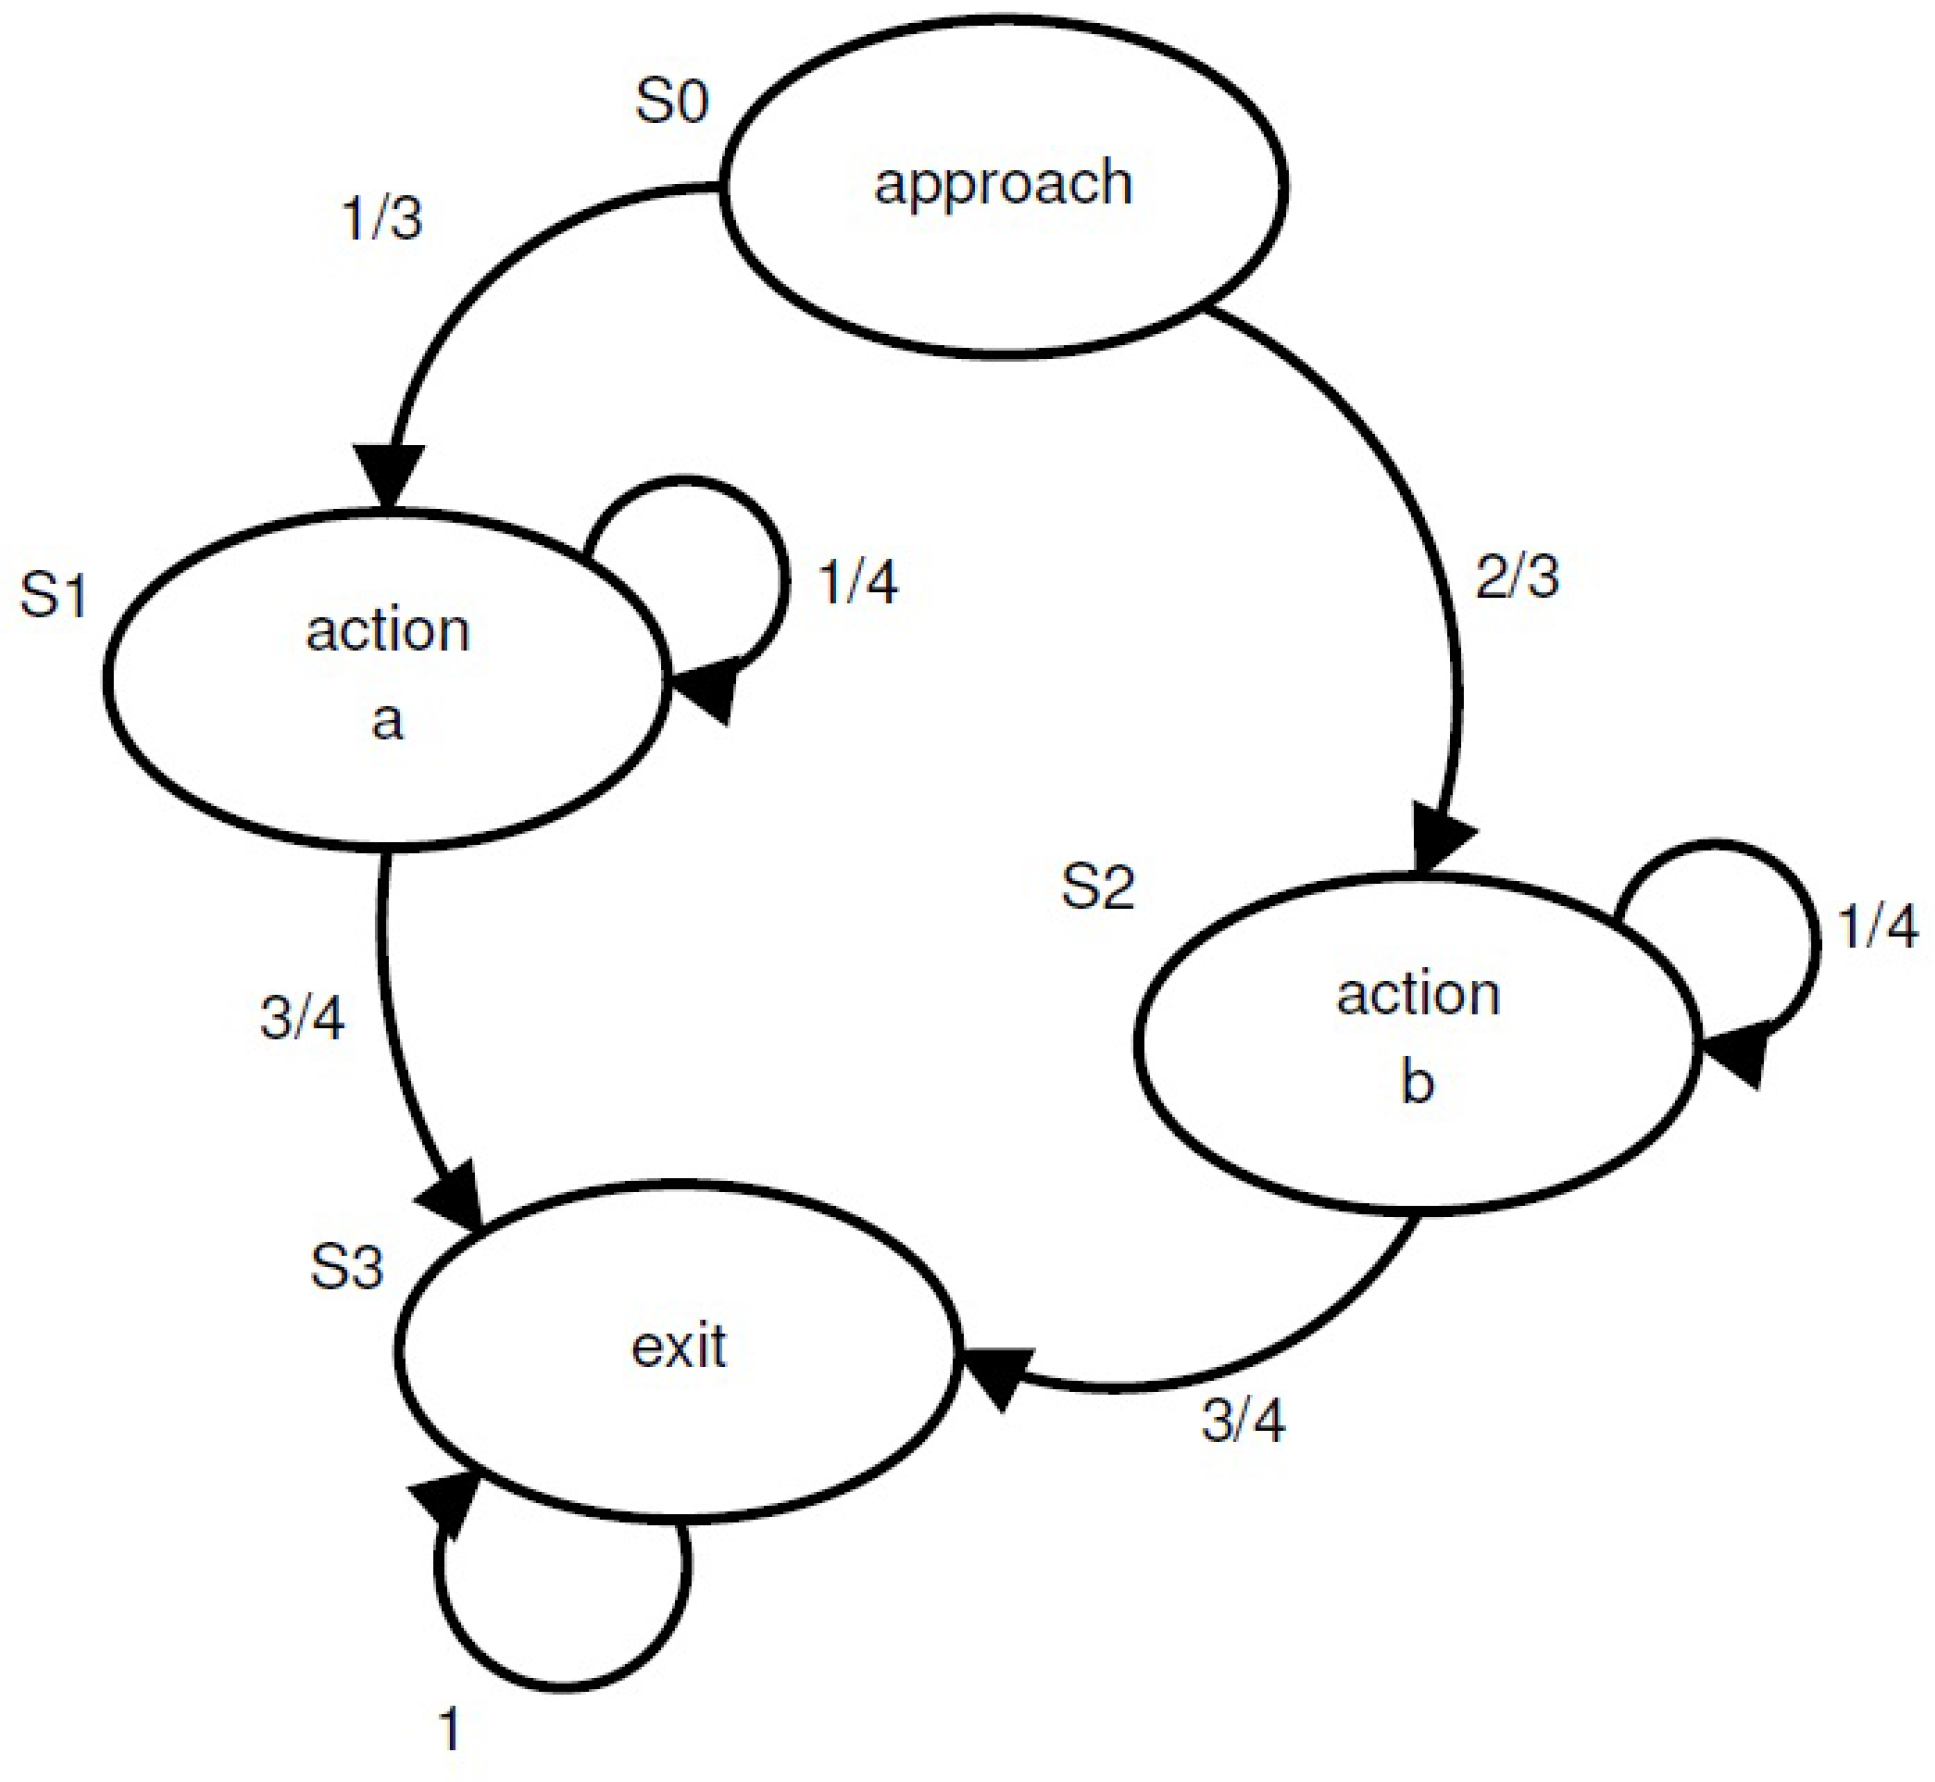
5.3. State Machines
5.3.1. Finite State Machines

5.3.2. Hybrid State Machines
5.4. Graphical Methods
5.4.1. Hidden Markov Models
5.4.2. Bayesian Networks
5.5. k-Nearest Neighbour Classifiers
5.6. Decision Trees
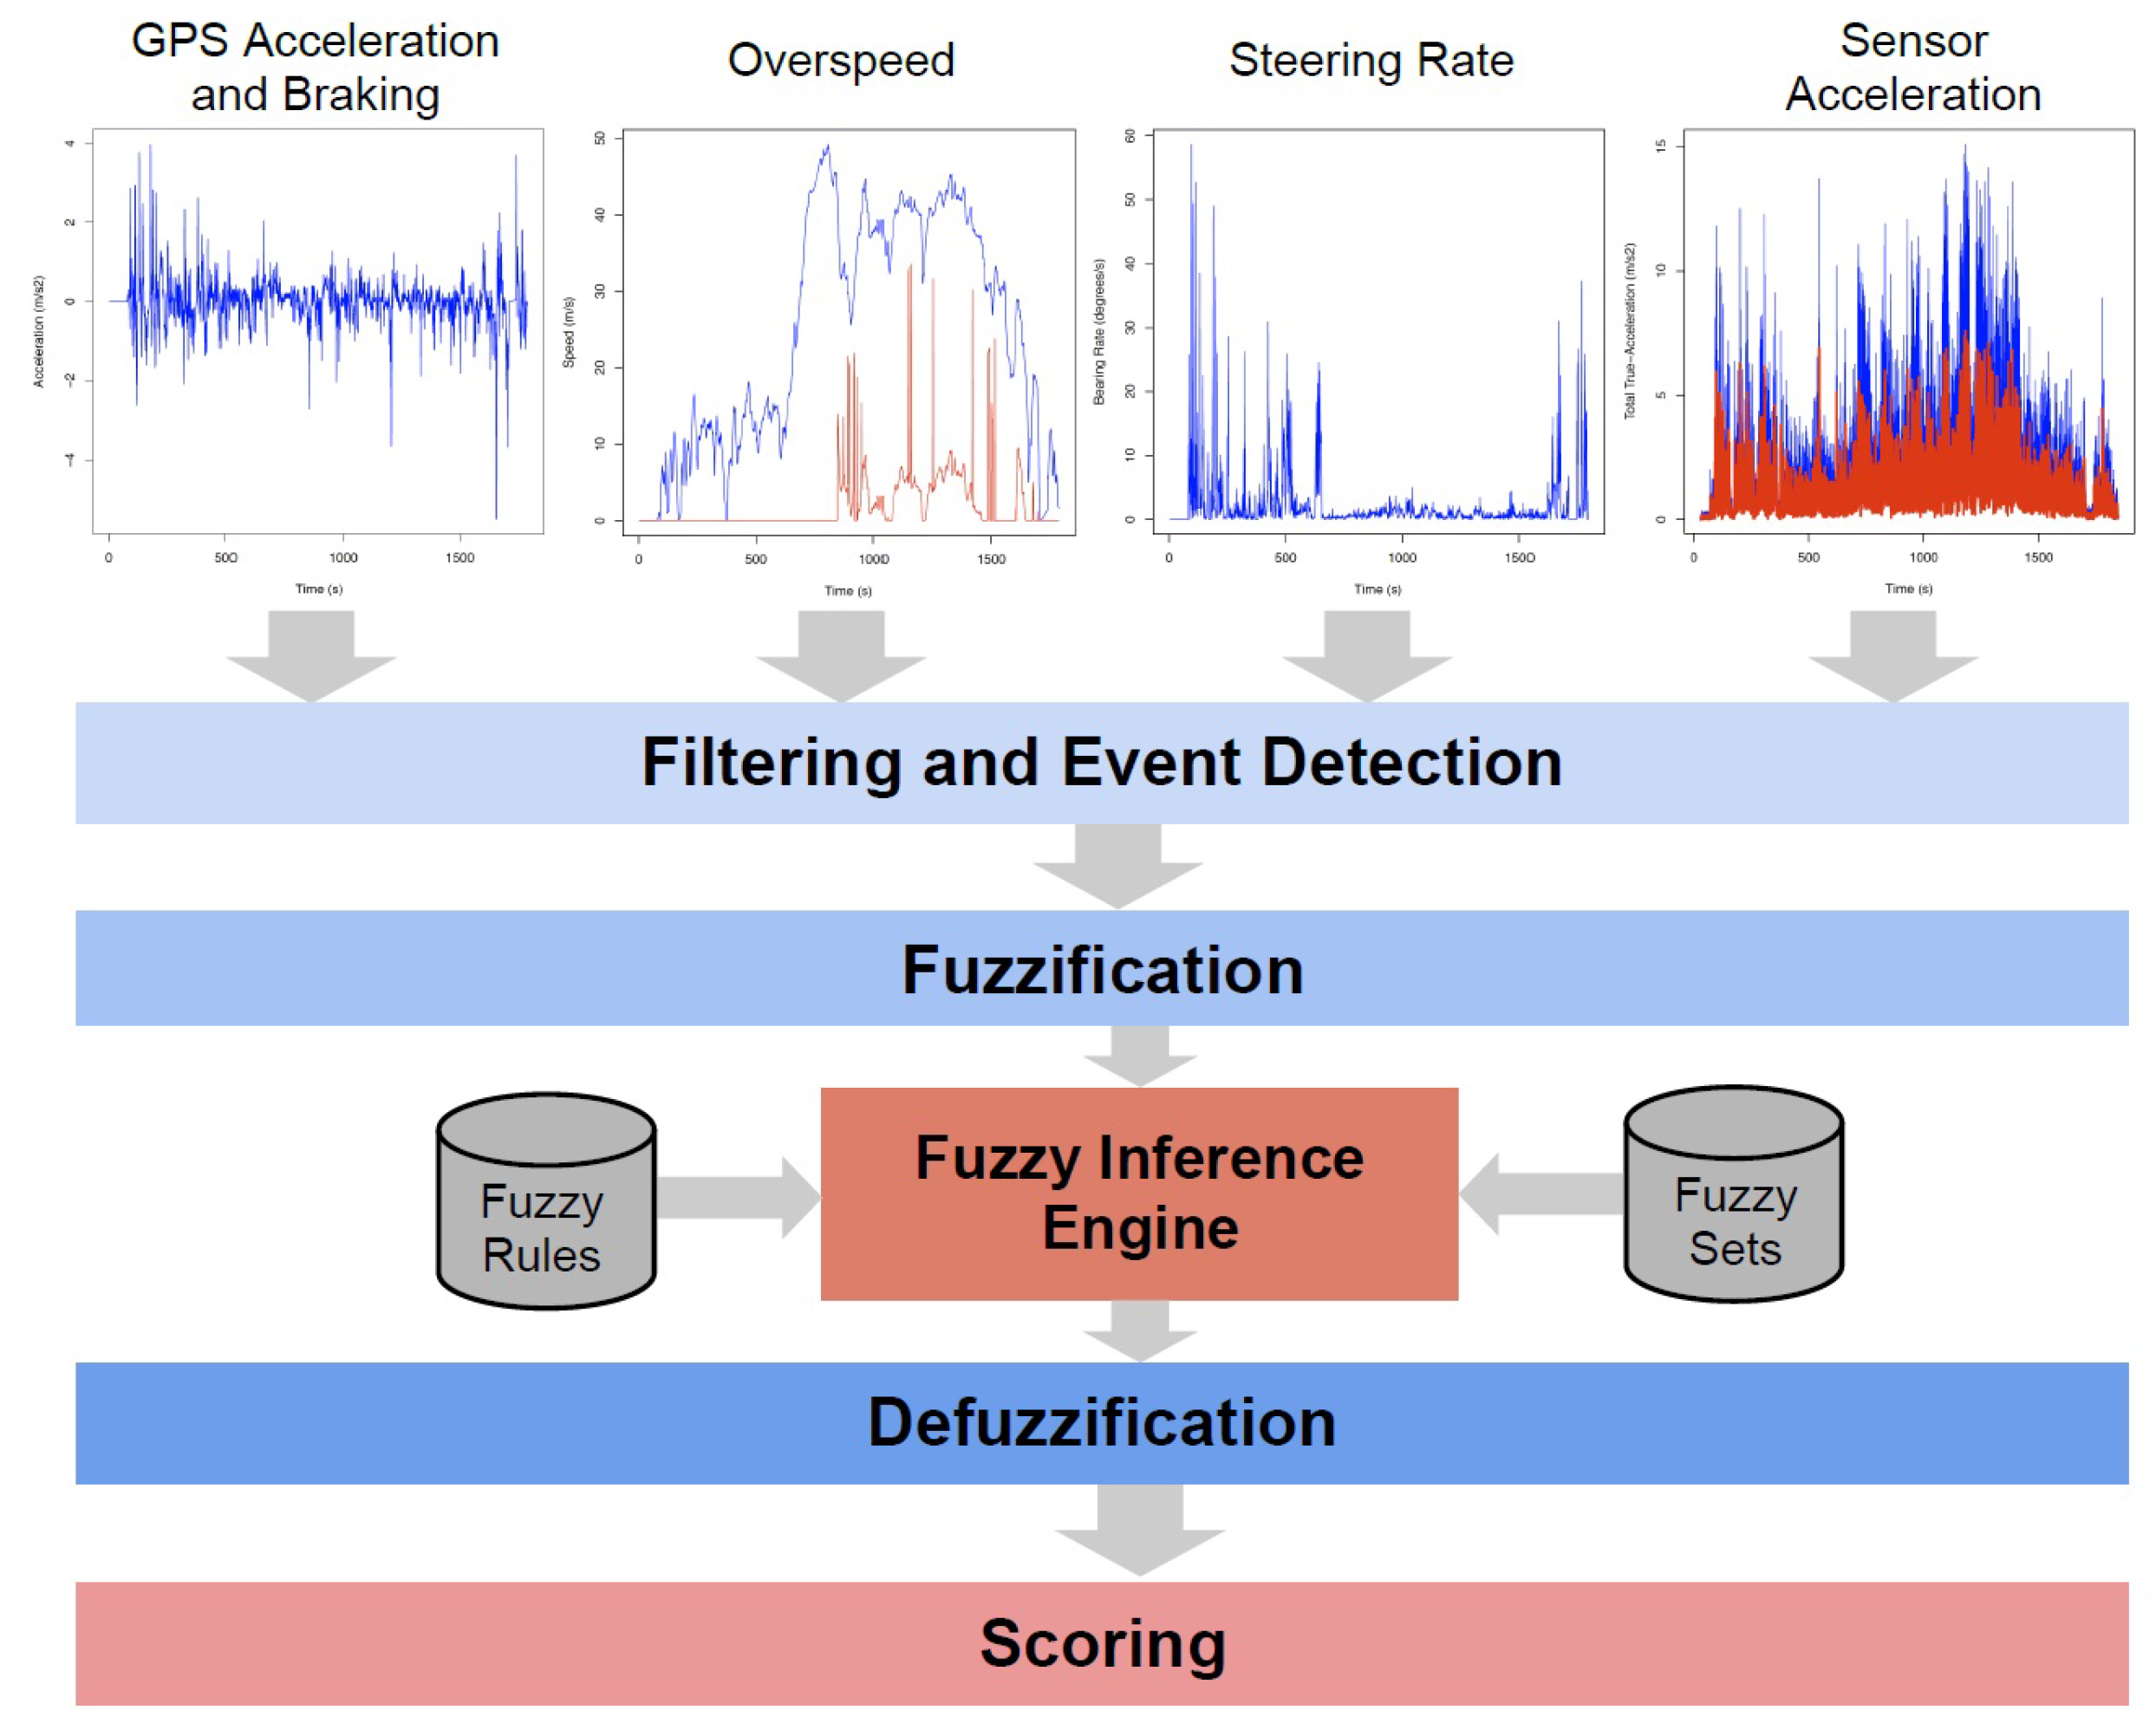
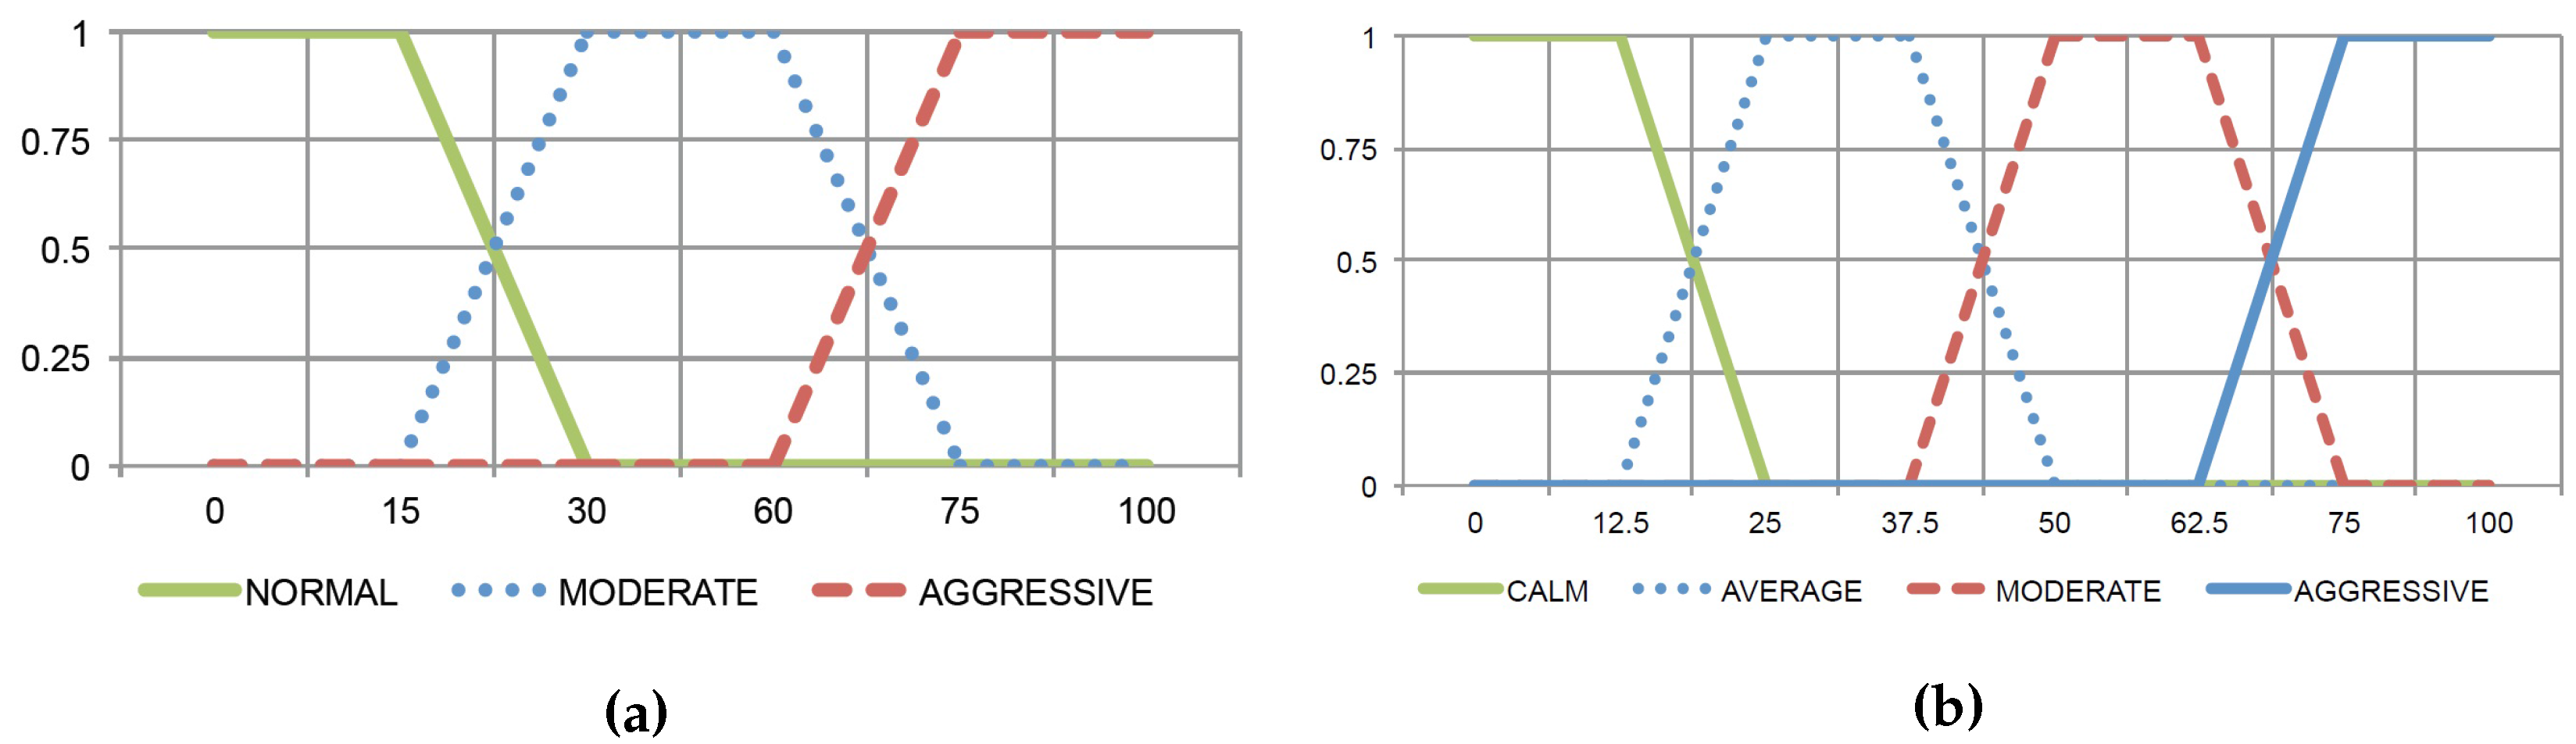
5.7. Fuzzy Logic


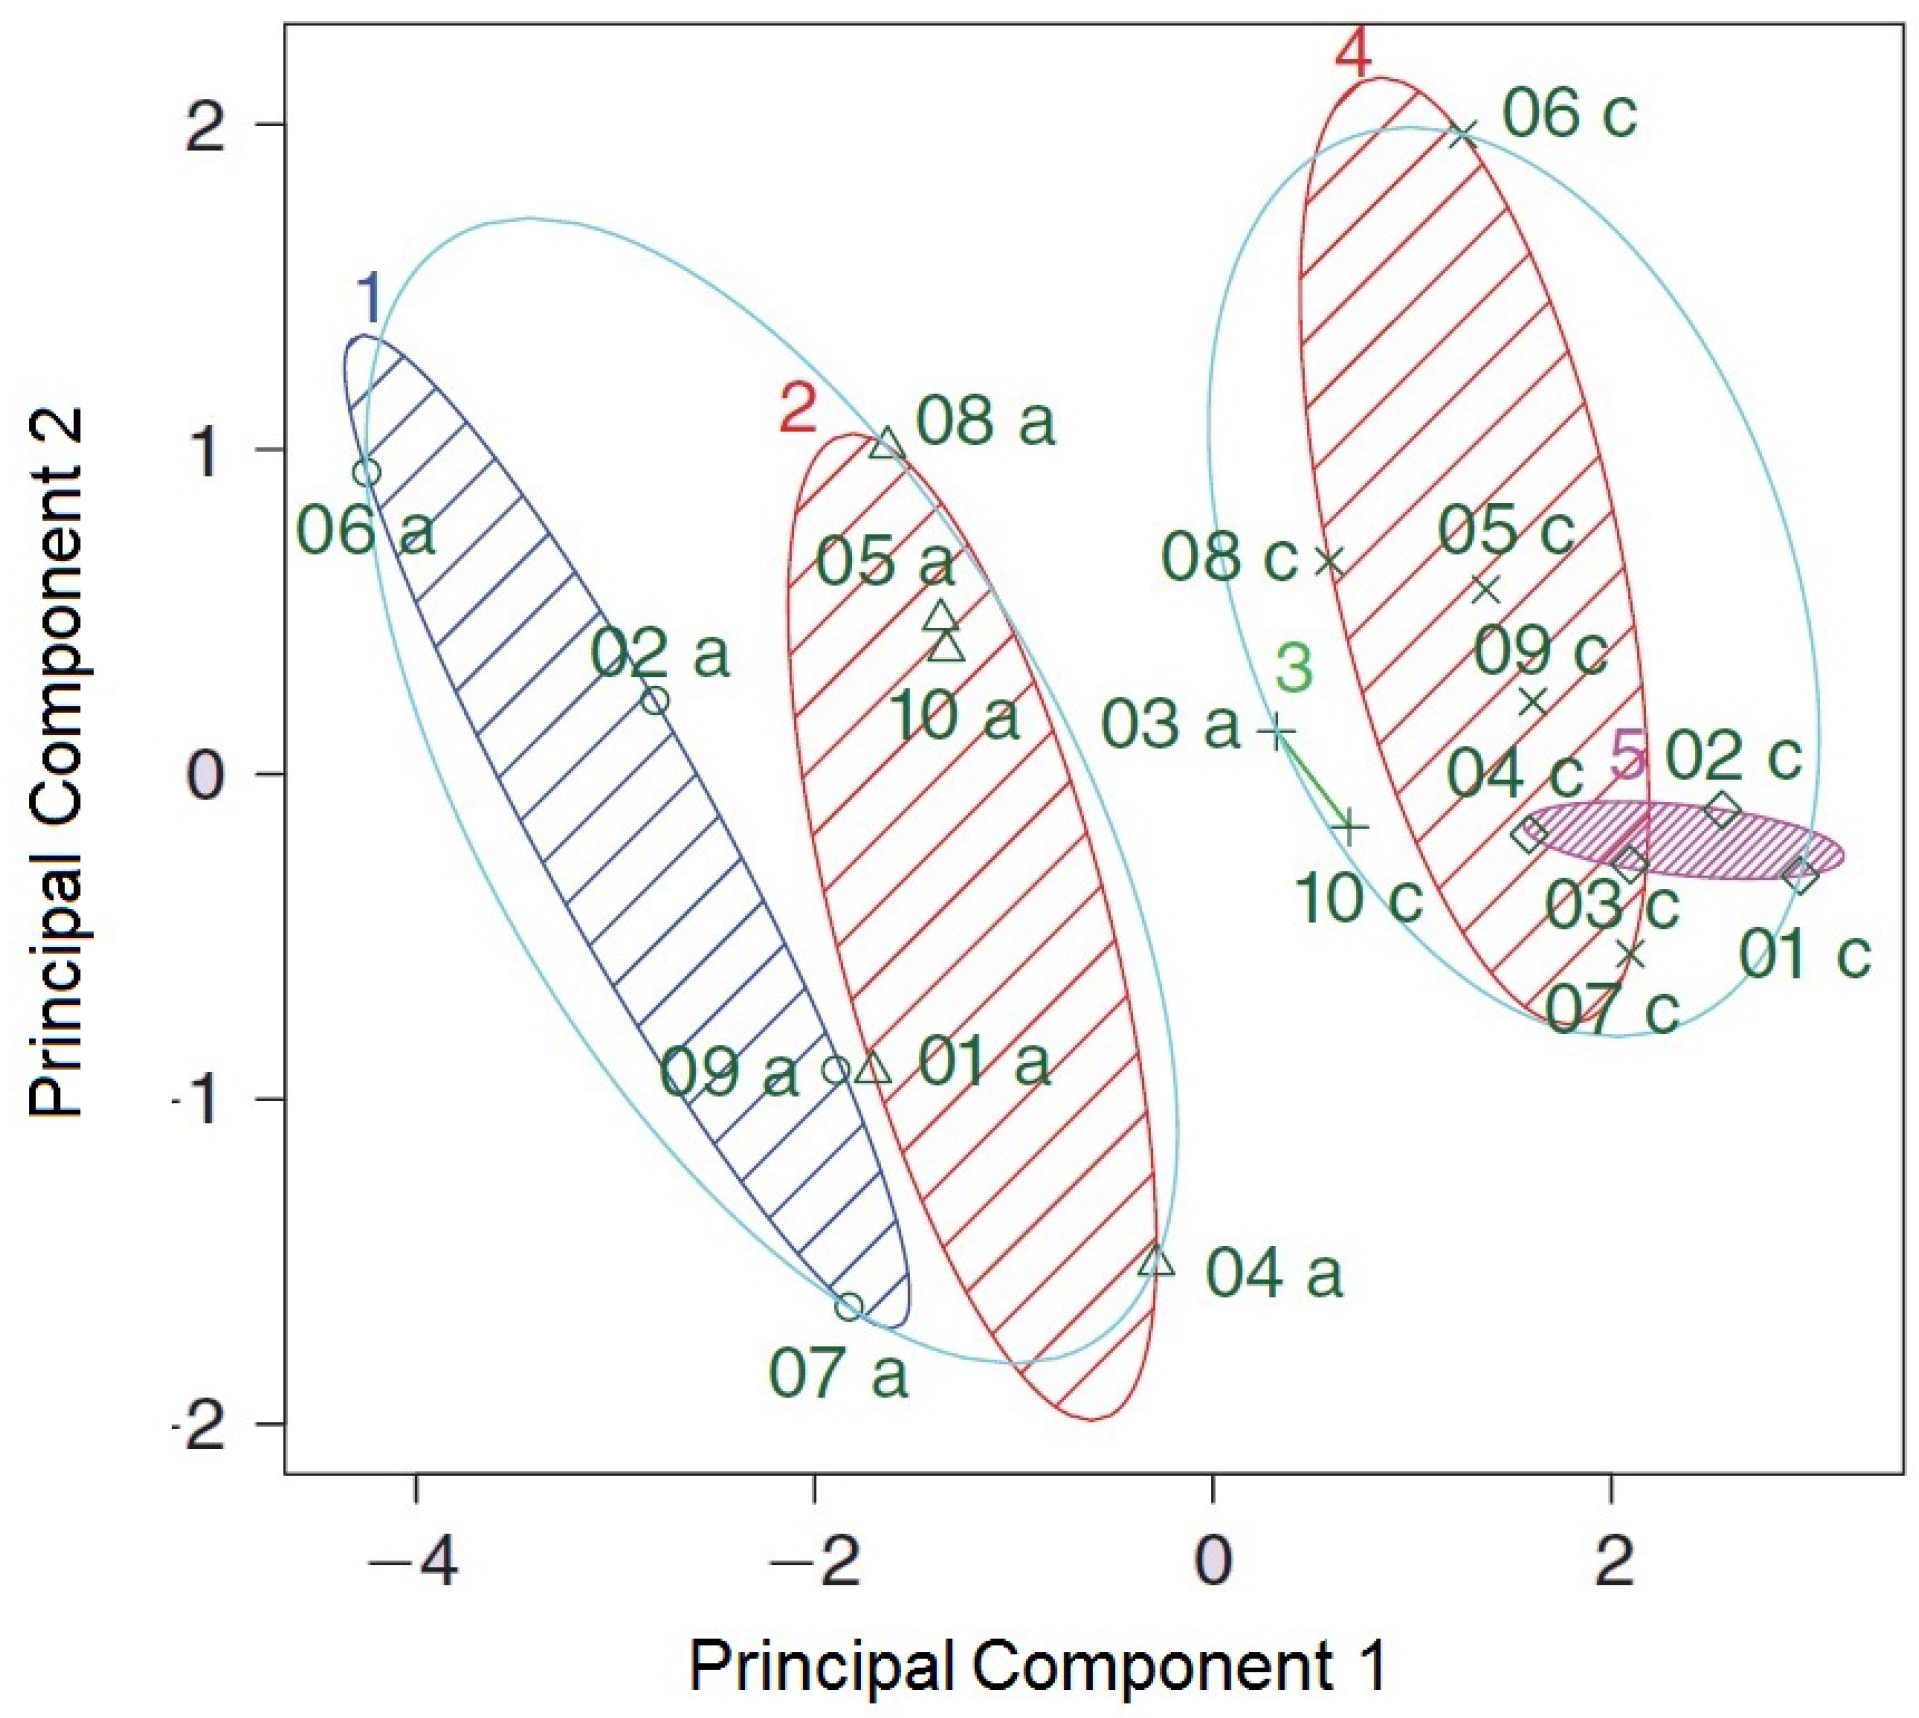
5.8. Clustering

5.8.1. Gaussian Mixture Models
5.8.2. k-Means Clustering
5.9. Dynamic Time Warping
5.10. Kalman Filtering
5.11. Support Vector Machines
5.11.1. Radial Basis Function
5.12. Genetic Algorithms and Reinforcement Learning
6. Conclusions
Author Contributions
Conflicts of Interest
References
- World Health Organization. Global Status Report on Road Safety 2013: Supporting a Decade of Action. Available online: http://www.who.int/violence_injury_prevention/road_safety_status/2013/en/ (accessed on 30 May 2015).
- Mosoti, R.G. Effect of motor vehicle congestion on the economic performance of Kenya: A case of Nairobi city county. Strateg. J. Bus. Chang. Manag. 2015, 2, 485–502. [Google Scholar]
- Bezerra, B.S.; Kaiser, I.M.; Battistelle, R.A.G. Road safety-implications for sustainable development in Latin America. Lat. Am. J. Manag. Sustain. Dev. 2015, 2, 1–18. [Google Scholar] [CrossRef]
- Trivedi, M.; Gandhi, T.; McCall, J. Looking-in and looking-out of a vehicle: Computer-vision-based enhanced vehicle safety. IEEE Trans. Intell. Transp. Syst. 2007, 8, 108–120. [Google Scholar] [CrossRef]
- Reason, J.; Manstead, A.; Stradling, S.; Baxter, J.; Campbell, K. Errors and violations on the roads: A real distinction? Ergonomics 1990, 33, 1315–1332. [Google Scholar] [CrossRef] [PubMed]
- Rowe, R.; Roman, G.D.; McKenna, F.P.; Barker, E.; Poulter, D. Measuring errors and violations on the road: A bifactor modeling approach to the driver behavior questionnaire. Accid. Anal. Prev. 2015, 74, 118–125. [Google Scholar] [CrossRef] [PubMed]
- De Winter, J.; Dodou, D. The driver behaviour questionnaire as a predictor of accidents: A meta-analysis. J. Saf. Res. 2010, 41, 463–470. [Google Scholar] [CrossRef] [PubMed]
- Vaiana, R.; Iuele, T.; Astarita, V.; Caruso, M.V.; Tassitani, A.; Zaffino, C.; Giofrè, V.P. Driving Behavior and Traffic Safety: An Acceleration-Based Safety Evaluation Procedure for Smartphones. Mod. Appl. Sci. 2014, 8, 88–96. [Google Scholar] [CrossRef]
- Hong, J.H.; Margines, B.; Dey, A.K. A smartphone-based sensing platform to model aggressive driving behaviors. In Proceedings of the 32nd Annual ACM Conference on Human Factors in Computing Systems, New York, NY, USA, 26 April–1 May 2014; pp. 4047–4056.
- Mitrovic, D. Reliable method for driving events recognition. IEEE Trans. Intell. Transp. Syst. 2005, 6, 198–205. [Google Scholar] [CrossRef]
- French, D.J.; West, R.J.; Elander, J.; Wilding, J.M. Decision-making style, driving style, and self-reported involvement in road traffic accidents. Ergonomics 1993, 36, 627–644. [Google Scholar] [CrossRef] [PubMed]
- Van Ly, M.; Martin, S.; Trivedi, M.M. Driver classification and driving style recognition using inertial sensors. In Proceedings of the 2013 IEEE Intelligent Vehicles Symposium, Gold Coast, Australia, 23–26 June 2013; pp. 1040–1045.
- Aljaafreh, A.; Alshabatat, N.; Najim Al-Din, M. Driving style recognition using fuzzy logic. In Proceedings of the 2012 IEEE International Conference on Vehicular Electronics and Safety (ICVES), Istanbul, Turkey, 24–27 July 2012; pp. 460–463.
- Al-Sultan, S.; Al-Bayatti, A.; Zedan, H. Context-aware driver behavior detection system in intelligent transportation systems. IEEE Trans. Veh. Technol. 2013, 62, 4264–4275. [Google Scholar] [CrossRef]
- Ker, K.; Roberts, I.; Collier, T.; Beyer, F.; Bunn, F.; Frost, C. Strong evidence that advanced and remedial driver education does not reduce road traffic crashes or injuries. Health 2003. [Google Scholar] [CrossRef]
- Mohamad, I.; Ali, M.; Ismail, M. Abnormal driving detection using real time Global Positioning System data. In Proceedings of the 2011 IEEE International Conference on Space Science and Communication (IconSpace), Penang, Malaysia, 12–13 July 2011; pp. 1–6.
- Choudhary, A.K.; Ingole, P.K. Smart phone based approach to monitor driving behavior and sharing of statistic. In Proceedings of the 2014 4th International Conference on Communication Systems and Network Technologies (CSNT), Bhopal, India, 7–9 April 2014; pp. 279–282.
- International Traffic Safety Data and Analysis Group. Road Safety Annual Report. Available online: http://www.internationaltransportforum.org/jtrc/safety/safety.html (accessed on 28 May 2015).
- Wills, A.R.; Watson, B.; Biggs, H.C. Comparing safety climate factors as predictors of work-related driving behavior. J. Saf. Res. 2006, 37, 375–383. [Google Scholar] [CrossRef] [PubMed] [Green Version]
- Dorr, D.; Grabengiesser, D.; Gauterin, F. Online driving style recognition using fuzzy logic. In Proceedings of the 2014 IEEE 17th International Conference on Intelligent Transportation Systems (ITSC), Qindao, China, 8–11 October 2014; pp. 1021–1026.
- Johnson, D.A.; Trivedi, M.M. Driving style recognition using a smartphone as a sensor platform. In Proceedings of the 2011 14th International IEEE Conference on Intelligent Transportation Systems (ITSC), Washington, WA, USA, 5–7 October 2011; pp. 1609–1615.
- Zhao, H.; Zhou, H.; Chen, C.; Chen, J. Join driving: A smart phone-based driving behavior evaluation system. In Proceedings of the 2013 IEEE Global Communications Conference, Atlanta, GA, USA, 9–13 December 2013; pp. 48–53.
- Houston, J.M.; Harris, P.B.; Norman, M. The aggressive driving behavior scale: Developing a self-report measure of unsafe driving practices. N. Am. J. Psychol. 2003, 5, 269–278. [Google Scholar]
- Harris, P.B.; Houston, J.M.; Vazquez, J.A.; Smither, J.A.; Harms, A.; Dahlke, J.A.; Sachau, D.A. The Prosocial and aggressive driving inventory (PADI): A self-report measure of safe and unsafe driving behaviors. Accid. Anal. Prev. 2014, 72, 1–8. [Google Scholar] [CrossRef] [PubMed]
- Neale, V.L.; Dingus, T.A.; Klauer, S.G.; Sudweeks, J.; Goodman, M. An Overview of the 100-car Naturalistic Study and Findings. In Proceedings of the 19th International Technical Conference on the Enhanced Safety of Vehicles (ESV), Washington, WA, USA, 6–9 June 2005.
- Bagdadi, O. Assessing safety critical braking events in naturalistic driving studies. Transp. Res. Part F Traffic Psychol. Behav. 2013, 16, 117–126. [Google Scholar] [CrossRef]
- Bergasa, L.M.; Almería, D.; Almazán, J.; Yebes, J.J.; Arroyo, R. Drivesafe: An app for alerting inattentive drivers and scoring driving behaviors. In Proceedings of the 2014 IEEE Intelligent Vehicles Symposium Proceedings, Dearborn, MI, USA, 8–11 June 2014; pp. 240–245.
- Tango, F.; Botta, M. Real-time detection system of driver distraction using machine learning. IEEE Trans. Intell. Transp. Syst. 2013, 14, 894–905. [Google Scholar] [CrossRef]
- Dong, Y.; Hu, Z.; Uchimura, K.; Murayama, N. Driver inattention monitoring system for intelligent vehicles: A review. IEEE Trans. Intell. Transp. Syst. 2011, 12, 596–614. [Google Scholar] [CrossRef]
- Croo, H.D.; Bandmann, M.; Mackay, G.M.; Rumar, K.; Vollenhoven, P. The Role of Driver Fatigue in Commercial Road Transport Crashes; European Transport Safety Council: Brussels, Belgium, 2001. [Google Scholar]
- HaiLin, W.; Hanhui, L.; Zhumei, S. Fatigue driving detection system design based on driving behavior. In Proceedings of the 2010 International Conference on Optoelectronics and Image Processing, Haiko, China, 11–12 November 2010; pp. 549–552.
- Daza, I.; Hernandez, N.; Bergasa, L.; Parra, I.; Yebes, J.; Gavilan, M.; Quintero, R.; Llorca, D.; Sotelo, M. Drowsiness monitoring based on driver and driving data fusion. In Proceedings of the 2011 14th International IEEE Conference on Intelligent Transportation Systems, Washington, WA, USA, 5–7 October 2011; pp. 1199–1204.
- Abdel-Aty, M.A.; Abdelwahab, H.T. Exploring the relationship between alcohol and the driver characteristics in motor vehicle accidents. Accid. Anal. Prev. 2000, 32, 473–482. [Google Scholar] [CrossRef]
- Dai, J.; Teng, J.; Bai, X.; Shen, Z.; Xuan, D. Mobile phone based drunk driving detection. In Proceedings of the 2010 4th International Conference on Pervasive Computing Technologies for Healthcare, Munich, Germany, 22–25 March 2010; pp. 1–8.
- Evans, L. Traffic Safety and the Driver; Van Nostrand Reinhold: New York, NY, USA, 1991. [Google Scholar]
- Wijayagunawardhane, N.R.B.; Jinasena, S.D.; Sandaruwan, C.B.; Dharmapriya, W.A.N.S.; Samarasinghe, R. SmartV: Intelligent vigilance monitoring based on sensor fusion and driving dynamics. In Proceedings of the 2013 8th IEEE International Conference on Industrial and Information Systems (ICIIS), Peradeniya, Sri Lanka, 17–20 December 2013; pp. 507–512.
- Wei, L.; Mukhopadhyay, S.; Jidin, R.; Chen, C.P. Multi-source information fusion for drowsy driving detection based on wireless sensor networks. In Proceedings of the 2013 7th International Conference on Sensing Technology, Wellington, New Zealand, 3–5 December 2013; pp. 850–857.
- Fazeen, M.; Gozick, B.; Dantu, R.; Bhukhiya, M.; González, M.C. Safe driving using mobile phones. IEEE Trans. Intell. Transp. Syst. 2012, 13, 1462–1468. [Google Scholar] [CrossRef]
- Kurt, A.; Yester, J.L.; Mochizuki, Y.; Ozguner, U. Hybrid-state driver/vehicle modelling, estimation and prediction. In Proceedings of the 2010 13th International IEEE Conference on Intelligent Transportation Systems, Funchal, Portugal, 19–22 September 2010; pp. 806–811.
- Armand, A.; Filliat, D.; Ibanez-Guzmán, J. Modelling stop intersection approaches using gaussian processes. In Proceedings of the 2013 16th International Conference on Intelligent Transportation Systems (ITSC), The Hague, The Netherlands, 6–9 October 2013; pp. 1650–1655.
- Takeda, K.; Hansen, J.H.; Boyraz, P.; Malta, L.; Miyajima, C.; Abut, H. International large-scale vehicle corpora for research on driver behavior on the road. IEEE Trans. Intell. Transp. Syst. 2011, 12, 1609–1623. [Google Scholar] [CrossRef]
- Chakravarty, T.; Ghose, A.; Bhaumik, C.; Chowdhury, A. MobiDriveScore—A system for mobile sensor based driving analysis: A risk assessment model for improving one’s driving. In Proceedings of the 2013 7th International Conference on Sensing Technology, Wellington, New Zealand, 3–5 December 2013; pp. 338–344.
- Castignani, G.; Derrmann, T.; Frank, R.; Engel, T. Driver Behavior Profiling Using Smartphones: A Low-Cost Platform for Driver Monitoring. IEEE Intell. Transp. Syst. Mag. 2015, 7, 91–102. [Google Scholar] [CrossRef]
- Astarita, V.; Guido, G.; Mongelli, D.W.E.; Giofre, V.P. Ecosmart and TutorDrive: Tools for fuel consumption reduction. In Proceedings of the 2014 IEEE International Conference on Service Operations and Logistics, and Informatics, Qingdao, China, 8–10 October 2014; pp. 183–187.
- Ericsson, E. Independent driving pattern factors and their influence on fuel-use and exhaust emission factors. Transp. Res. Part D: Transp. Environ. 2001, 6, 325–345. [Google Scholar] [CrossRef]
- Li, K.; Lu, M.; Lu, F.; Lv, Q.; Shang, L.; Maksimovic, D. Personalized Driving Behavior Monitoring and Analysis for Emerging Hybrid Vehicles. In Pervasive Computing; Springer Berlin Heidelberg: Berlin, Germany, 2012; Volume 7319, pp. 1–19. [Google Scholar]
- Perttunen, M.; Mazhelis, O.; Cong, F.; Kauppila, M.; Leppänen, T.; Kantola, J.; Collin, J.; Pirttikangas, S.; Haverinen, J.; Ristaniemi, T.; et al. Distributed Road Surface Condition Monitoring Using Mobile Phones. In Ubiquitous Intelligence and Computing—8th International Conference, UIC 2011, Banff, Canada, September 2–4, 2011. Proceedings; Springer Berlin Heidelberg: Berlin, Germany, 2011; Volume 6905, pp. 64–78. [Google Scholar]
- Bhoraskar, R.; Vankadhara, N.; Raman, B.; Kulkarni, P. Wolverine: Traffic and road condition estimation using smartphone sensors. In Proceedings of the 2012 4th International Conference on Communication Systems and Networks, Bangalore, India, 3–7 January 2012; pp. 1–6.
- Thong, S.T.S.; Han, C.T.; Rahman, T.A. Intelligent fleet management system with concurrent GPS & GSM real-time positioning technology. In Proceedings of the 7th International Conference on ITS Telecommunications, Sophia Antipolis, France, 6–8 June 2007; pp. 1–6.
- Chakravarty, T.; Chowdhury, A.; Ghose, A.; Bhaumik, C.; Balamuralidhar, P. Statistical analysis of road-vehicle-driver interaction as an enabler to designing behavioural models. J. Phys. 2014, 490. [Google Scholar] [CrossRef]
- Kalsoom, R.; Halim, Z. Clustering the driving features based on data streams. In Proceedings of the 2013 16th International Multi Topic Conference, Lahore, Pakistan, 19–20 December 2013; pp. 89–94.
- Lee, C.; Saccomanno, F.; Hellinga, B. Analysis of crash precursors on instrumented freeways. Transp. Res. Rec. J. Transp. Res. Board 2002, 1784, 1–8. [Google Scholar] [CrossRef]
- Zaldivar, J.; Calafate, C.T.; Cano, J.C.; Manzoni, P. Providing accident detection in vehicular networks through OBD-II devices and Android-based smartphones. In Proceedings of the 2011 IEEE 36th Conference on Local Computer Networks, Bonn, Germany, 4–7 October 2011; pp. 813–819.
- Toledo, T.; Musicant, O.; Lotan, T. In-vehicle data recorders for monitoring and feedback on drivers’ behavior. Transp. Res. Part C Emerg. Technol. 2008, 16, 320–331. [Google Scholar] [CrossRef]
- Paefgen, J.; Kehr, F.; Zhai, Y.; Michahelles, F. Driving behavior analysis with smartphones: Insights from a controlled field study. In Proceedings of the 11th International Conference on Mobile and Ubiquitous Multimedia, Ulm, Germany, 4–6 December 2012; pp. 36:1–36:8.
- Castignani, G.; Frank, R.; Engel, T. An Evaluation Study of Driver Profiling Fuzzy Algorithms using Smartphones. In Proceedings of the 2nd International Workshop on Vehicular Communications and Applications (VCA 2013), Goettingen, Germany, 7–10 Octomber 2013; p. 6.
- Ohn-Bar, E.; Tawari, A.; Martin, S.; Trivedi, M.M. Predicting driver maneuvers by learning holistic features. In Proceedings of the 2014 IEEE Intelligent Vehicles Symposium Proceedings, Dearborn, MI, USA, 8–11 June 2014; pp. 719–724.
- Almazán, J.; Bergasa, L.M.; Yebes, J.J.; Barea, R.; Arroyo, R. Full auto-calibration of a smartphone on board a vehicle using IMU and GPS embedded sensors. In Proceedings of the 2013 IEEE Intelligent Vehicles Symposium (IV), Gold Coast, Australia, 23–26 June 2013; pp. 1374–1380.
- Healey, J.; Picard, R. Detecting stress during real-world driving tasks using physiological sensors. IEEE Trans. Intell. Transp. Syst. 2005, 6, 156–166. [Google Scholar] [CrossRef]
- Gadepally, V.; Kurt, A.; Krishnamurthy, A.; Ozguner, U. Driver/vehicle state estimation and detection. In Proceedings of the 2011 14th International IEEE Conference on Intelligent Transportation Systems, Washington, WA, USA, 5–7 October 2011; pp. 582–587.
- Chong, L.; Abbas, M.M.; Flintsch, A.M.; Higgs, B. A rule-based neural network approach to model driver naturalistic behavior in traffic. Transp. Res. Part C Emerg. Technol. 2013, 32, 207–223. [Google Scholar] [CrossRef]
- Wang, J.; Zhang, L.; Zhang, D.; Li, K. An adaptive longitudinal driving assistance system based on driver characteristics. IEEE Trans. Intell. Transp. Syst. 2013, 14, 1–12. [Google Scholar] [CrossRef]
- Takeda, K.; Erdogan, H.; Hansen, J.; Abut, H. In-Vehicle Corpus and Signal Processing for Driver Behavior; Springer Science & Business Media: New York, NY, USA, 2009. [Google Scholar]
- Angkititrakul, P.; Petracca, M.; Sathyanarayana, A.; Hansen, J.H. UTDrive: Driver behavior and speech interactive systems for in-vehicle environments. In Proceedings of the 2007 IEEE Intelligent Vehicles Symposium, Istanbul, Turkey, 13–15 June 2007; pp. 566–569.
- Demcenko, A.; Tamosiunaite, M.; Vidugiriene, A.; Saudargiene, A. Vehicle’s steering signal predictions using neural networks. In Proceedings of the 2008 IEEE Intelligent Vehicles Symposium, Eindhoven, The Netherlands, 4–6 June 2008; pp. 1181–1186.
- Hulnhagen, T.; Dengler, I.; Tamke, A.; Dang, T.; Breuel, G. Maneuver recognition using probabilistic finite-state machines and fuzzy logic. In Proceedings of the 2010 IEEE Intelligent Vehicles Symposium (IV), San Diego, CA, USA, 21–24 June 2010; pp. 65–70.
- Kurt, A.; Özgüner, Ü. A probabilistic model of a set of driving decisions. In Proceedings of the 2011 14th International IEEE Conference on Intelligent Transportation Systems, Washington, WA, USA, 5–7 October 2011; pp. 570–575.
- Gadepally, V.; Krishnamurthy, A.; Ozguner, U. A Framework for Estimating Driver Decisions Near Intersections. IEEE Trans. Intell. Transp. Syst. 2014, 15, 637–646. [Google Scholar] [CrossRef]
- Boyraz, P.; Acar, M.; Kerr, D. Signal modelling and hidden markov models for driving manoeuvre recognition and driver fault diagnosis in an urban road scenario. In Proceedings of the 2007 IEEE Intelligent Vehicles Symposium, Istanbul, Turkey, 13–15 June 2007; pp. 987–992.
- Oliver, N.; Pentland, A.P. Graphical models for driver behavior recognition in a smartcar. In Proceedings of the IEEE Intelligent Vehicles Symposium IV 2000, Dearborn, MI, USA, 3–5 October 2000; pp. 7–12.
- Sathyanarayana, A.; Boyraz, P.; Hansen, J.H. Driver behavior analysis and route recognition by hidden Markov models. In Proceedings of the IEEE International Conference on Vehicular Electronics and Safety, 2008, Columbus, OH, USA, 22–24 September 2008; pp. 276–281.
- Eren, H.; Makinist, S.; Akin, E.; Yilmaz, A. Estimating driving behavior by a smartphone. In Proceedings of the 2012 IEEE Intelligent Vehicles Symposium (IV), Alcala de Henares, Spain, 3–7 June 2012; pp. 234–239.
- Pentland, A.; Liu, A. Modeling and prediction of human behavior. Neural Comput. 1999, 11, 229–242. [Google Scholar] [CrossRef] [PubMed]
- Sathyanarayana, A.; Sadjadi, S.O.; Hansen, J.H. Leveraging sensor information from portable devices towards automatic driving maneuver recognition. In Proceedings of the 2012 15th International IEEE Conference on Intelligent Transportation Systems, Anchorage, AK, USA, 16–19 September 2012; pp. 660–665.
- Li, K.; Jin, L.; Jiang, Y.; Xian, H.; Gao, L. Effects of driver behavior style differences and individual differences on driver sleepiness detection. Adv. Mech. Eng. 2015, 7. [Google Scholar] [CrossRef]
- Okuda, H.; Ikami, N.; Suzuki, T.; Tazaki, Y.; Takeda, K. Modeling and analysis of driving behavior based on a probability-weighted ARX model. IEEE Trans. Intell. Transp. Syst. 2013, 14, 98–112. [Google Scholar] [CrossRef]
- Zhang, J.; Chau, K.W. Multilayer Ensemble Pruning via Novel Multi-sub-swarm Particle Swarm Optimization. J. UCS 2009, 15, 840–858. [Google Scholar]
- Taormina, R.; Chau, K.W. ANN-based interval forecasting of streamflow discharges using the LUBE method and MOFIPS. Eng. Appl. Artif. Intell. 2015, 45, 429–440. [Google Scholar] [CrossRef]
- Chau, K.; Wu, C. A hybrid model coupled with singular spectrum analysis for daily rainfall prediction. J. Hydroinform. 2010, 12, 458–473. [Google Scholar] [CrossRef]
- Wu, C.; Chau, K.; Li, Y. Methods to improve neural network performance in daily flows prediction. J. Hydrol. 2009, 372, 80–93. [Google Scholar] [CrossRef]
- Mitrovic, D. Driving event recognition by hidden Markov models. In Proceedings of the 4th International Conference on Telecommunications in Modern Satellite, Cable and Broadcasting Services, Niš, Serbia, 13–15 October 1999; pp. 110–113.
- Zhang, S.; Chau, K.W. Dimension Reduction using Semi-supervised Locally Linear Embedding for Plant Leaf Classification. In Proceedings of the 5th International Conference on Intelligent Computing, Ulsan, Korea, 16–19 September 2009; pp. 948–955.
- Zadeh, L.A. Fuzzy sets. Inf. Control 1965, 8, 338–353. [Google Scholar] [CrossRef]
- Castignani, G.; Derrmann, T.; Frank, R.; Engel, T. Driver behavior profiling using smartphones. In Proceedings of the 2013 16th International IEEE Conference on Intelligent Transportation Systems-(ITSC), The Hague, The Netherlands, 6–9 October 2013; pp. 552–557.
© 2015 by the authors; licensee MDPI, Basel, Switzerland. This article is an open access article distributed under the terms and conditions of the Creative Commons by Attribution (CC-BY) license (http://creativecommons.org/licenses/by/4.0/).
Share and Cite
Meiring, G.A.M.; Myburgh, H.C. A Review of Intelligent Driving Style Analysis Systems and Related Artificial Intelligence Algorithms. Sensors 2015, 15, 30653-30682. https://doi.org/10.3390/s151229822
Meiring GAM, Myburgh HC. A Review of Intelligent Driving Style Analysis Systems and Related Artificial Intelligence Algorithms. Sensors. 2015; 15(12):30653-30682. https://doi.org/10.3390/s151229822
Chicago/Turabian StyleMeiring, Gys Albertus Marthinus, and Hermanus Carel Myburgh. 2015. "A Review of Intelligent Driving Style Analysis Systems and Related Artificial Intelligence Algorithms" Sensors 15, no. 12: 30653-30682. https://doi.org/10.3390/s151229822