
Robust Hand Motion Tracking through Data Fusion of 5DT Data Glove and Nimble VR Kinect Camera Measurements

Abstract
:1. Introduction
1.1. HCI in Laparoscopic Training
1.2. Nimble VR
2. Kalman Filter Procedures and Parameter Settings
Determining the Kalman Filter paRameters
3. Methods
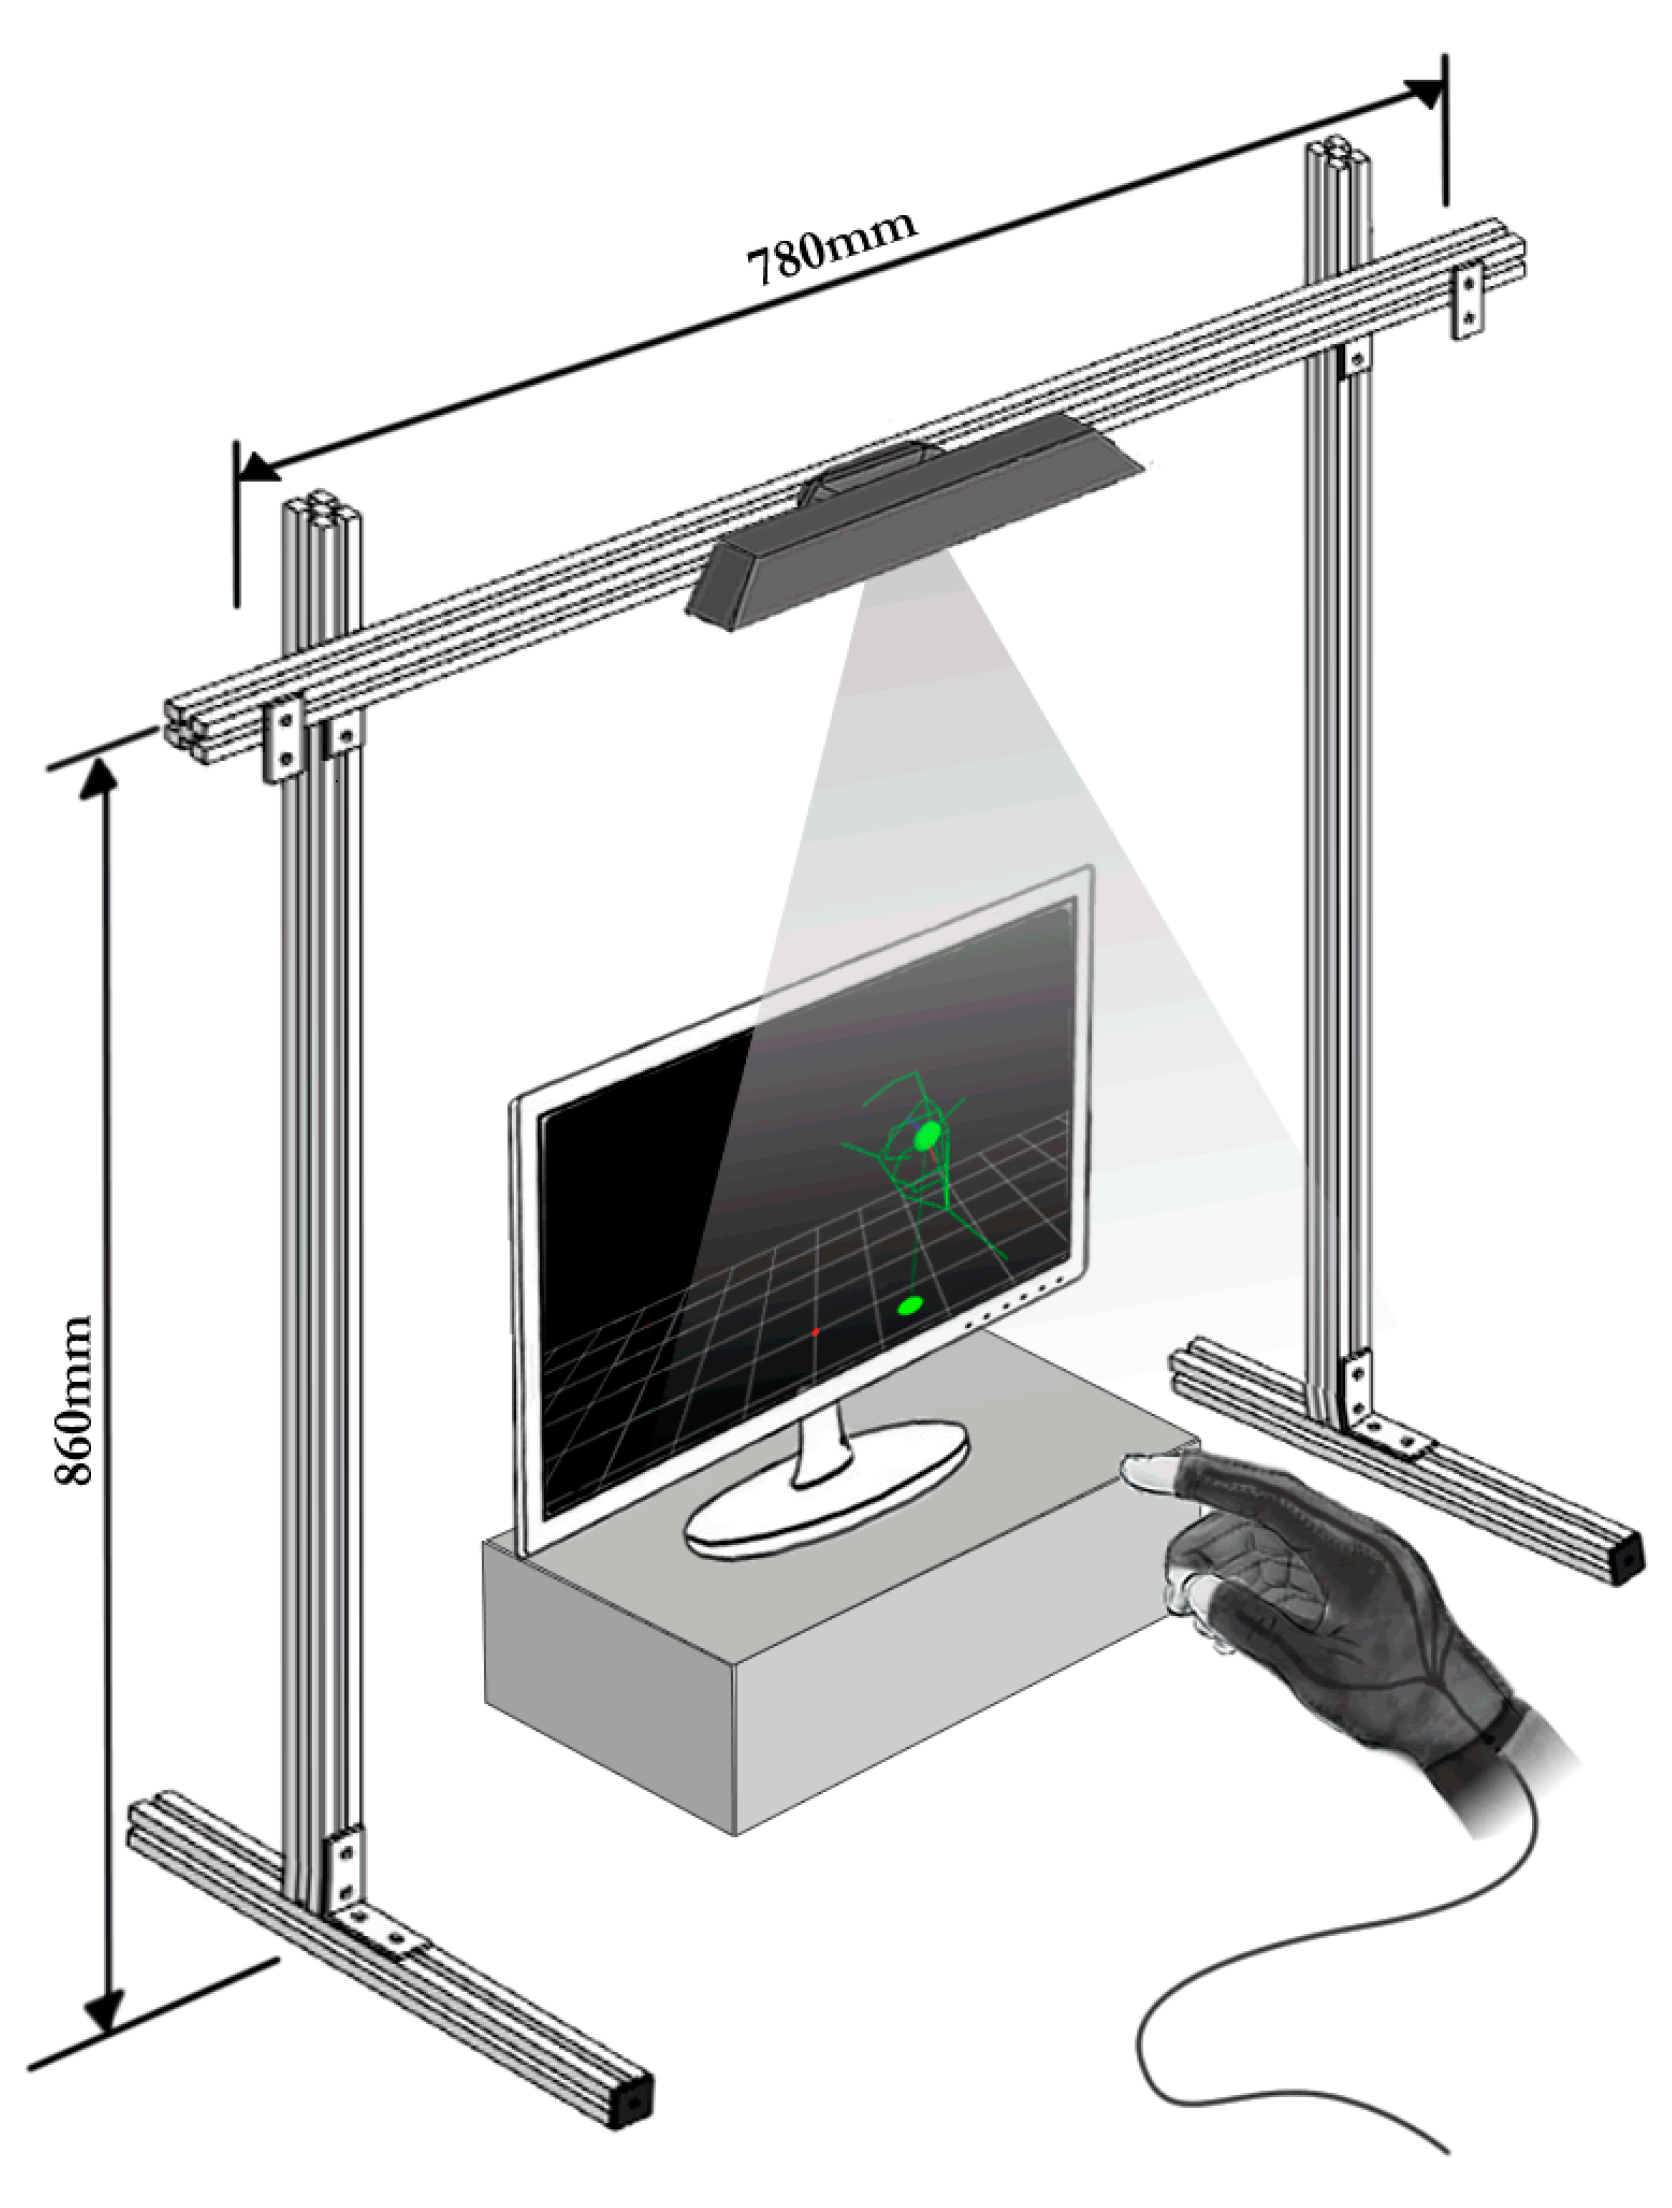
3.1. Test Setup
3.2. Wooden Hand Model Measurements to Validate the Kalman Filter Operation
3.3. Human Hand Measurements to Validate the Kalman Filter Operation
3.4. Dependent Measures
4. Results
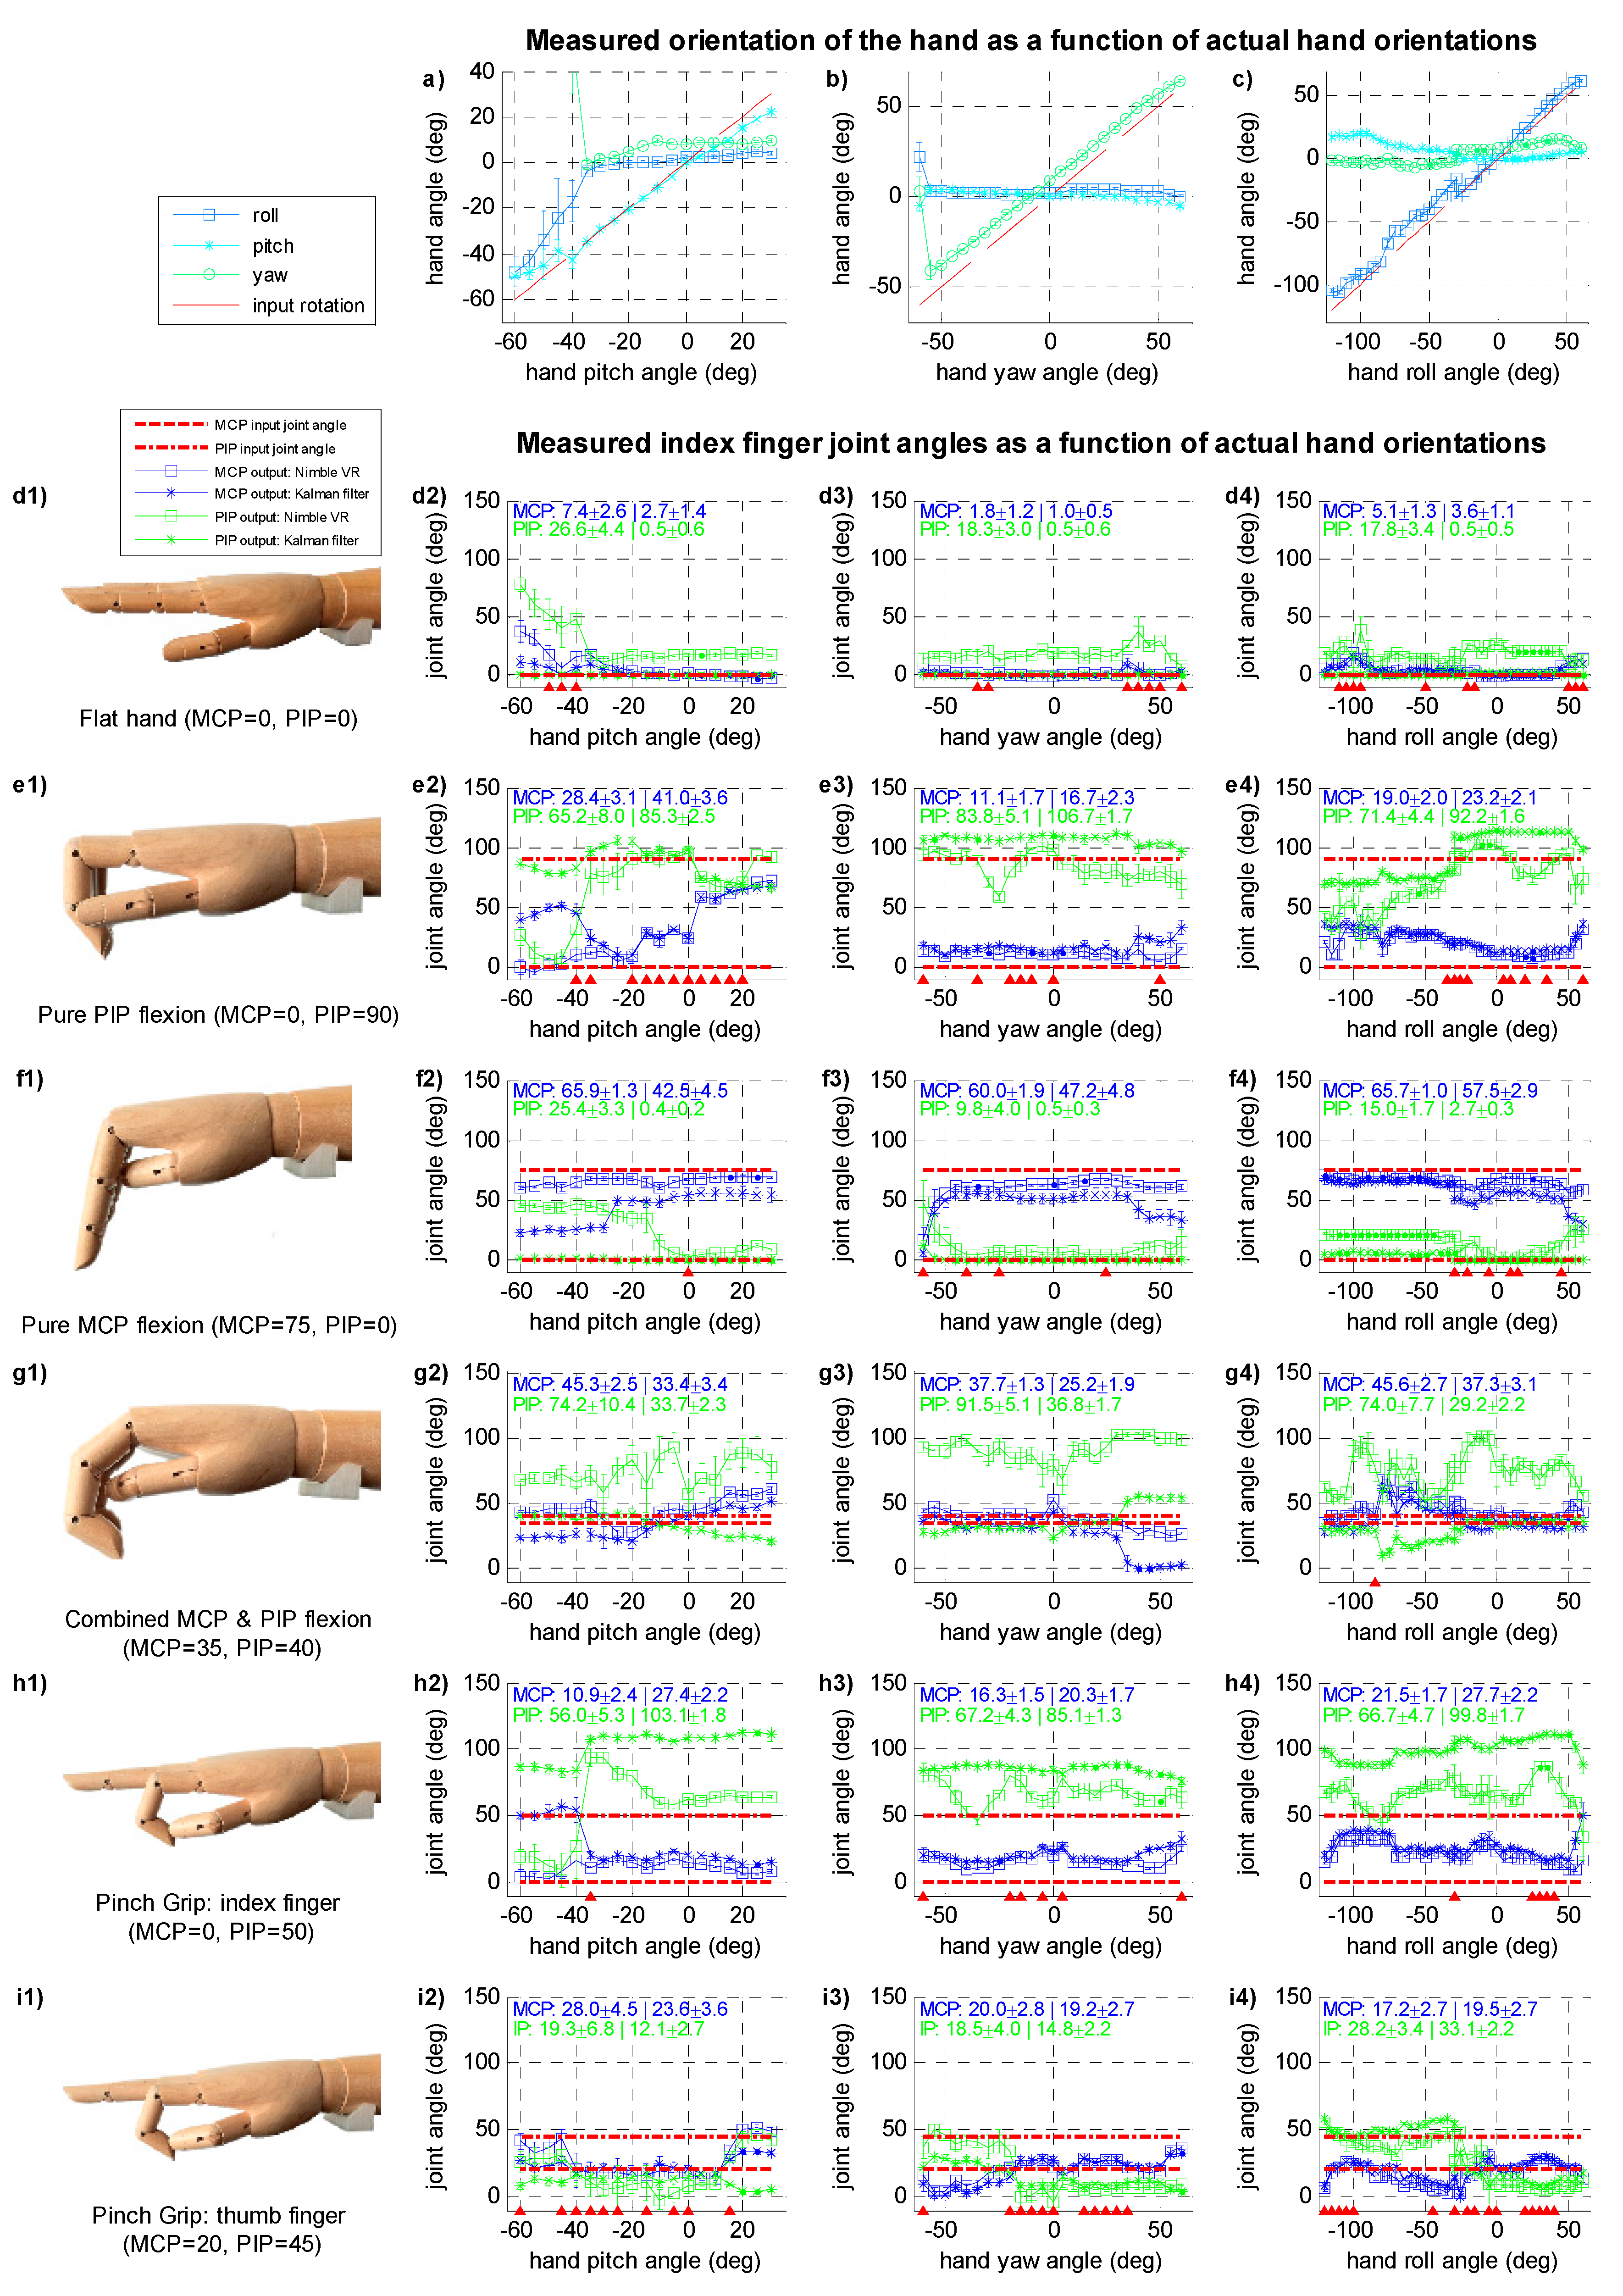
4.1. Wooden Hand Model Orientation Measurements
4.2. Wooden Hand Model Finger Joint Measurements—Index and Thumb Fingers

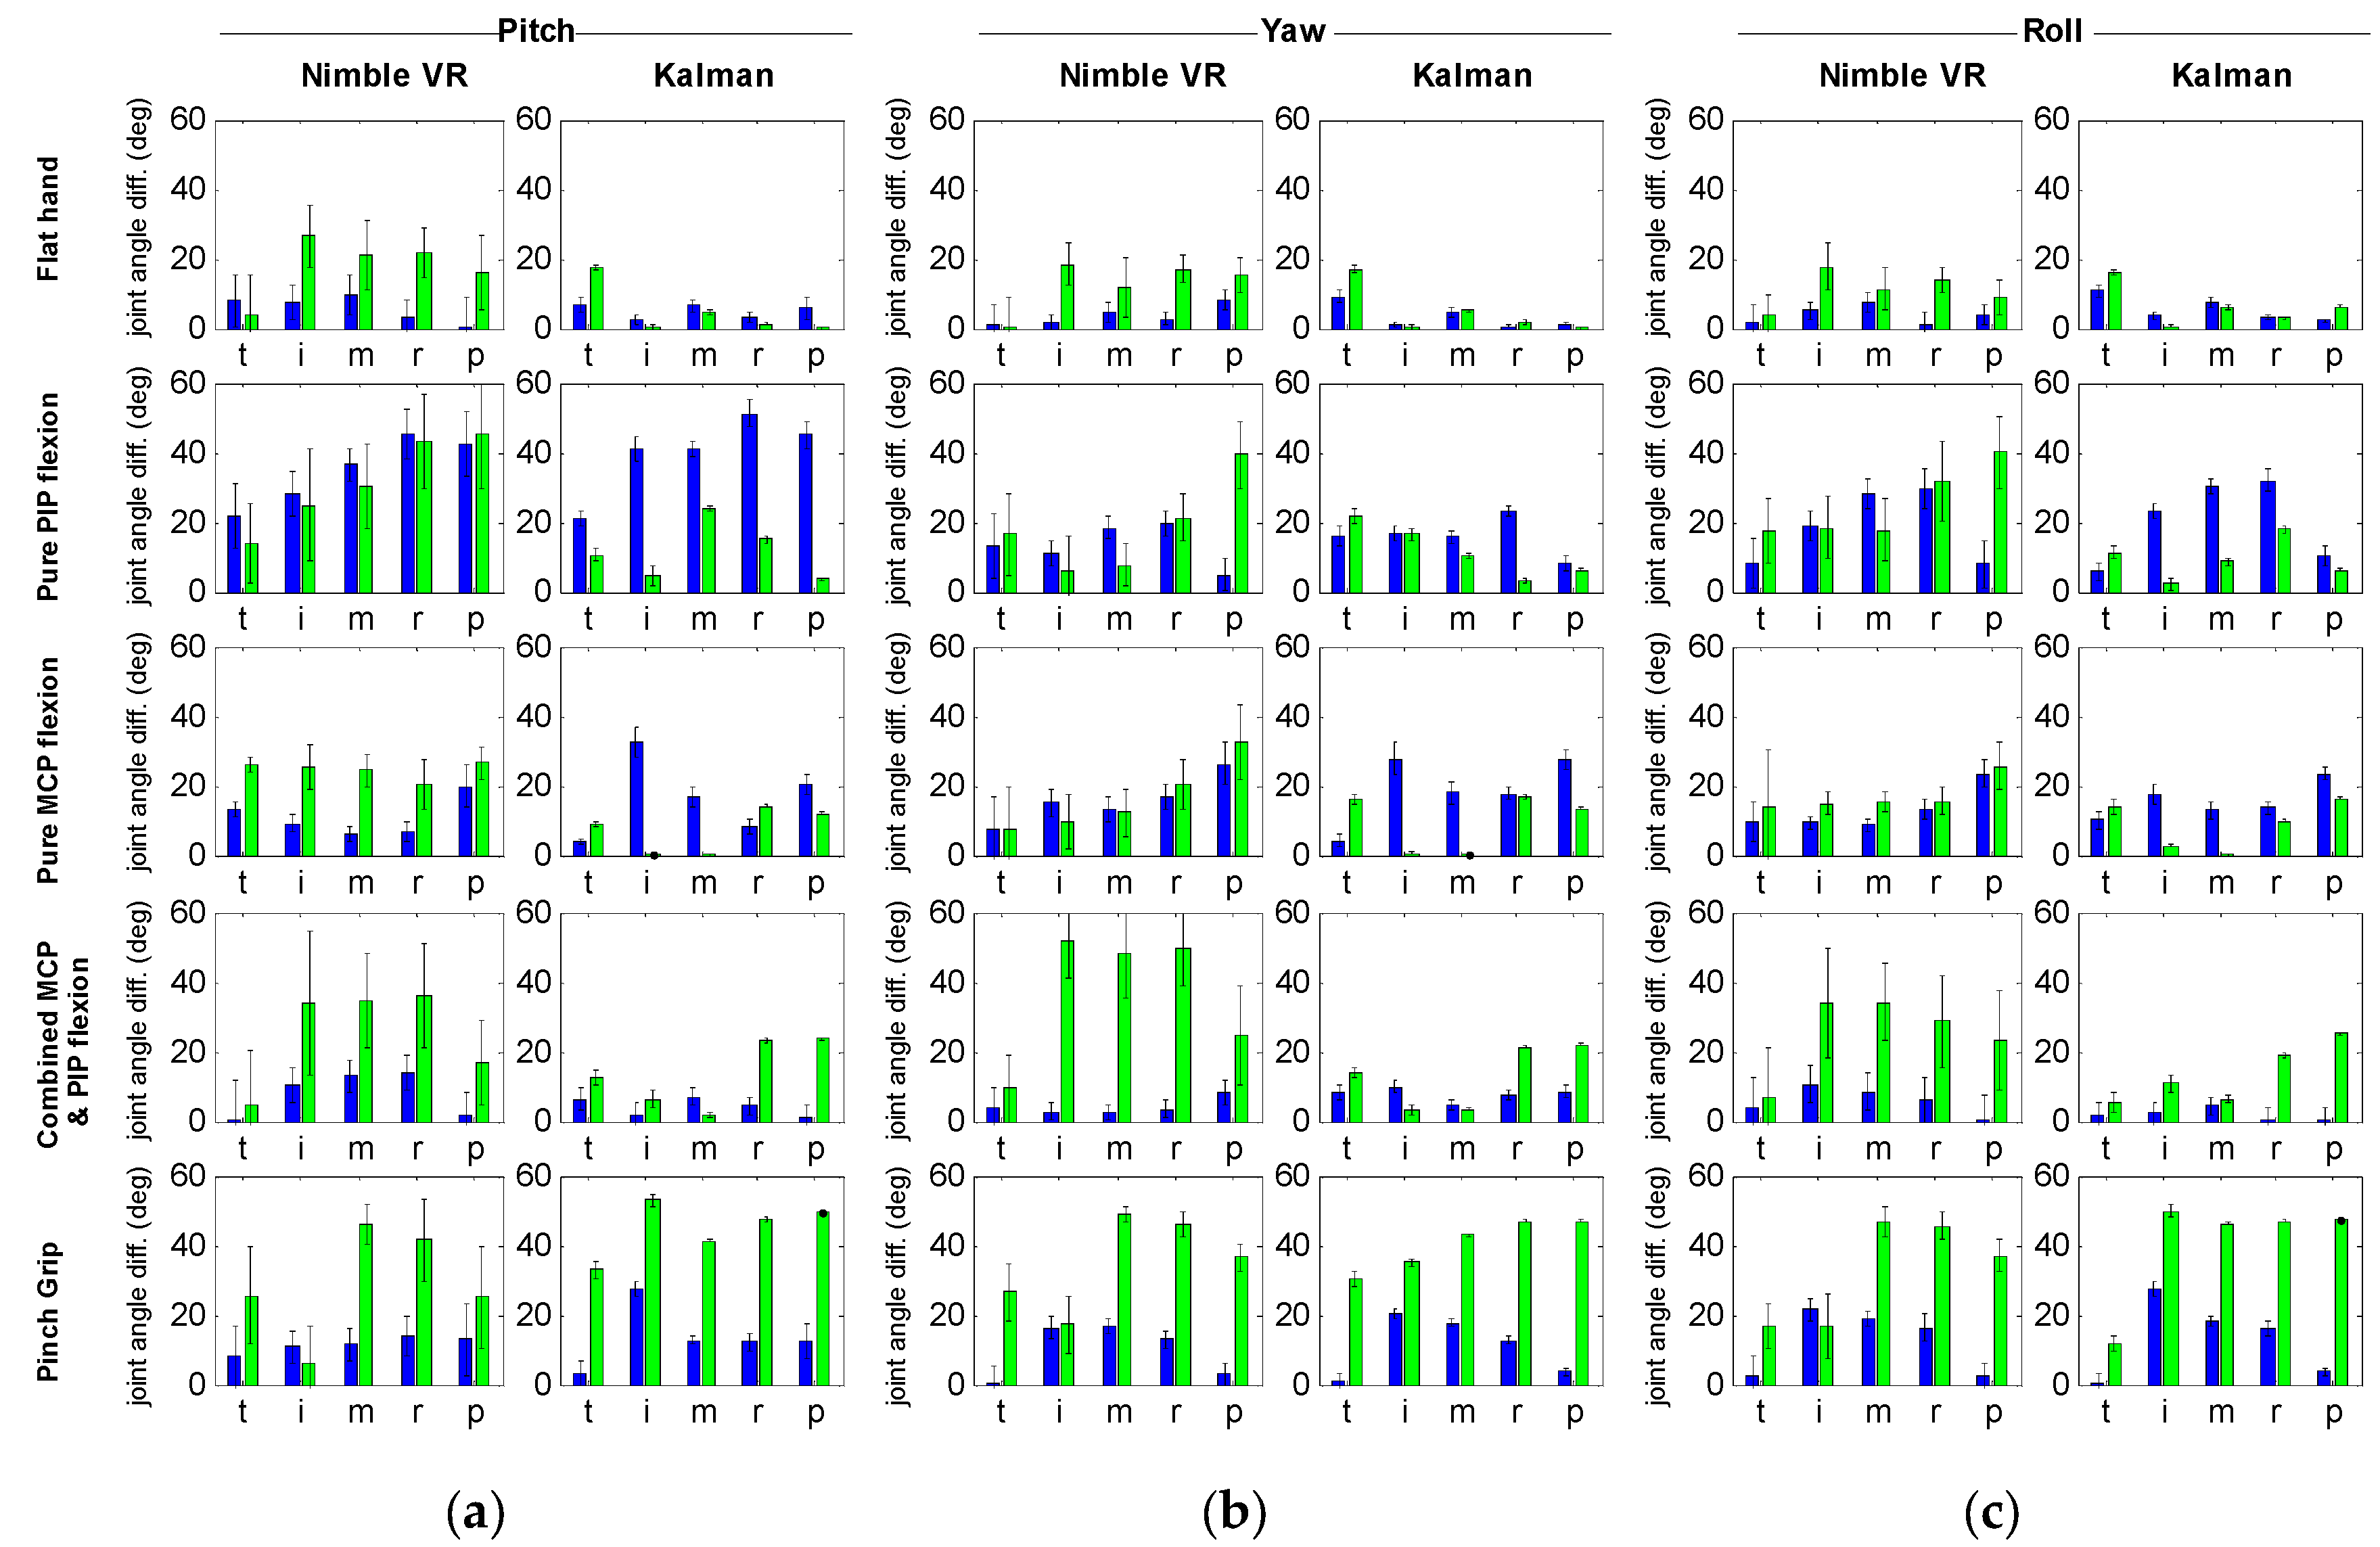
4.3. Wooden Hand Model Finger Joint Measurements—All Fingers

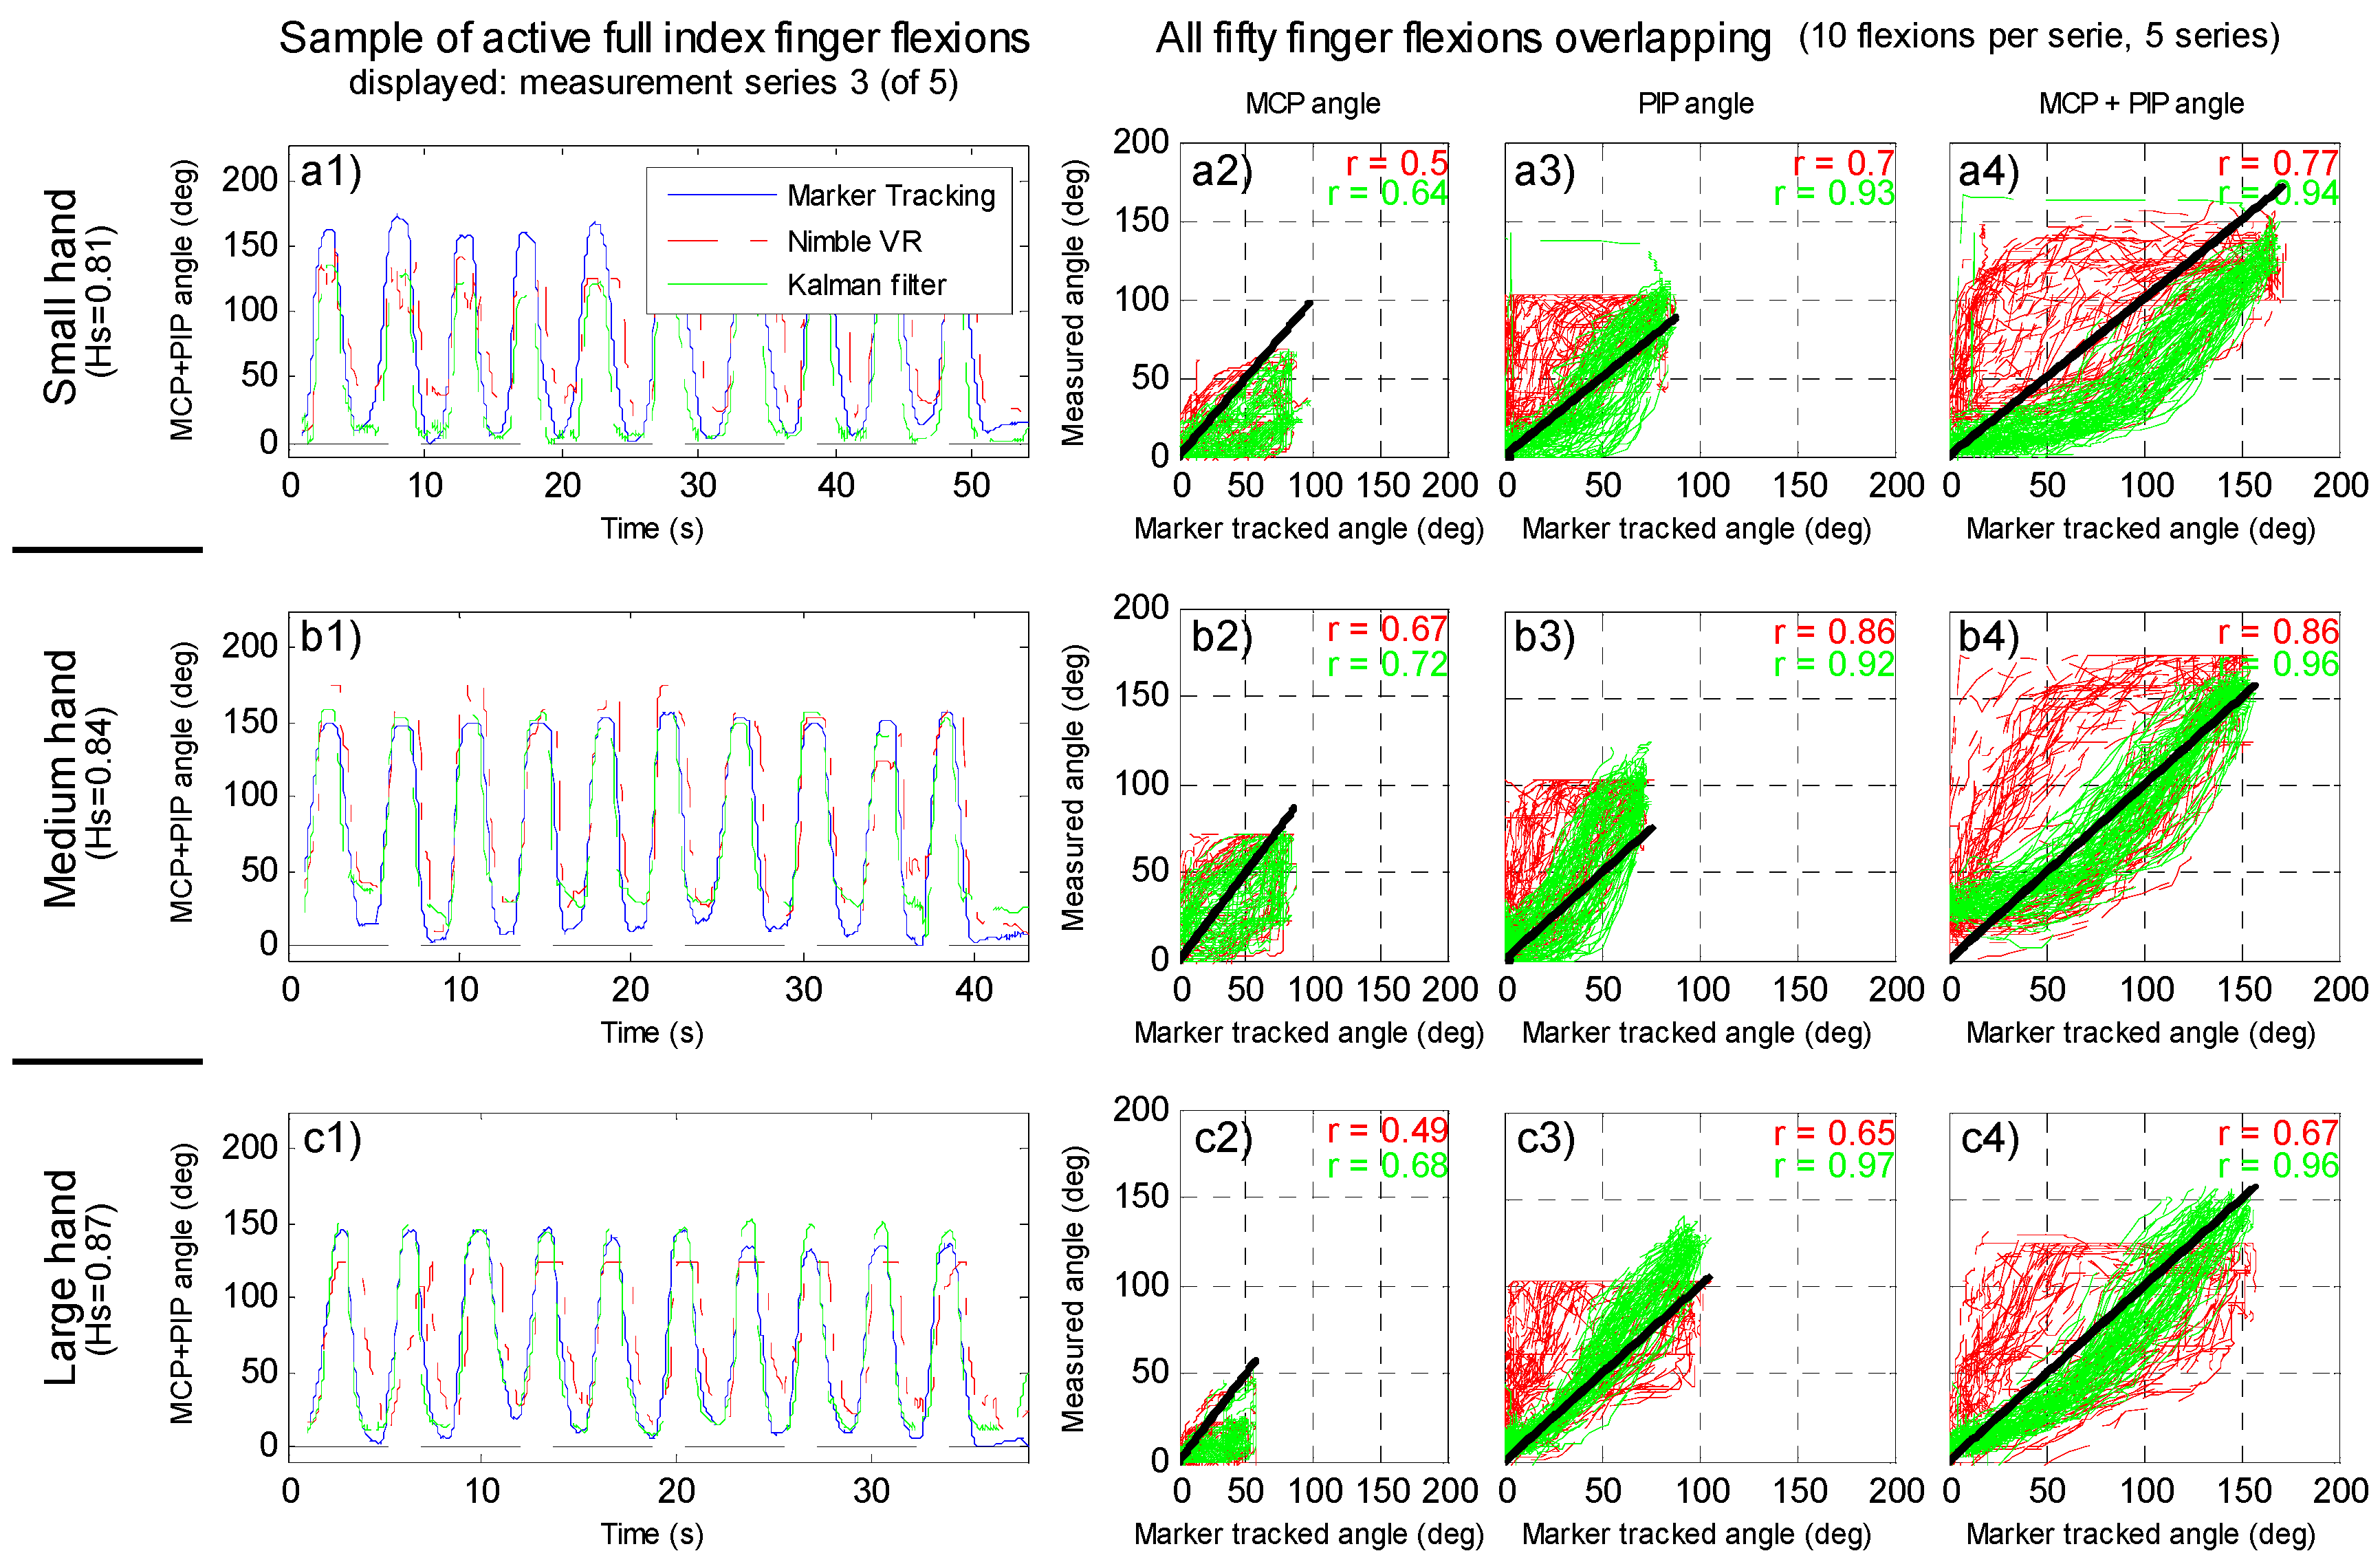
4.4. Human Hand Active Finger Flexion Measurements


5. Discussion
5.1. Setup Limitations
5.2. Active Finger Flexion Measurements
5.3. Data Fusion Improvements
5.4. Application in Medical Field
6. Conclusions
Acknowledgments
Author Contributions
Conflicts of Interest
Appendix A
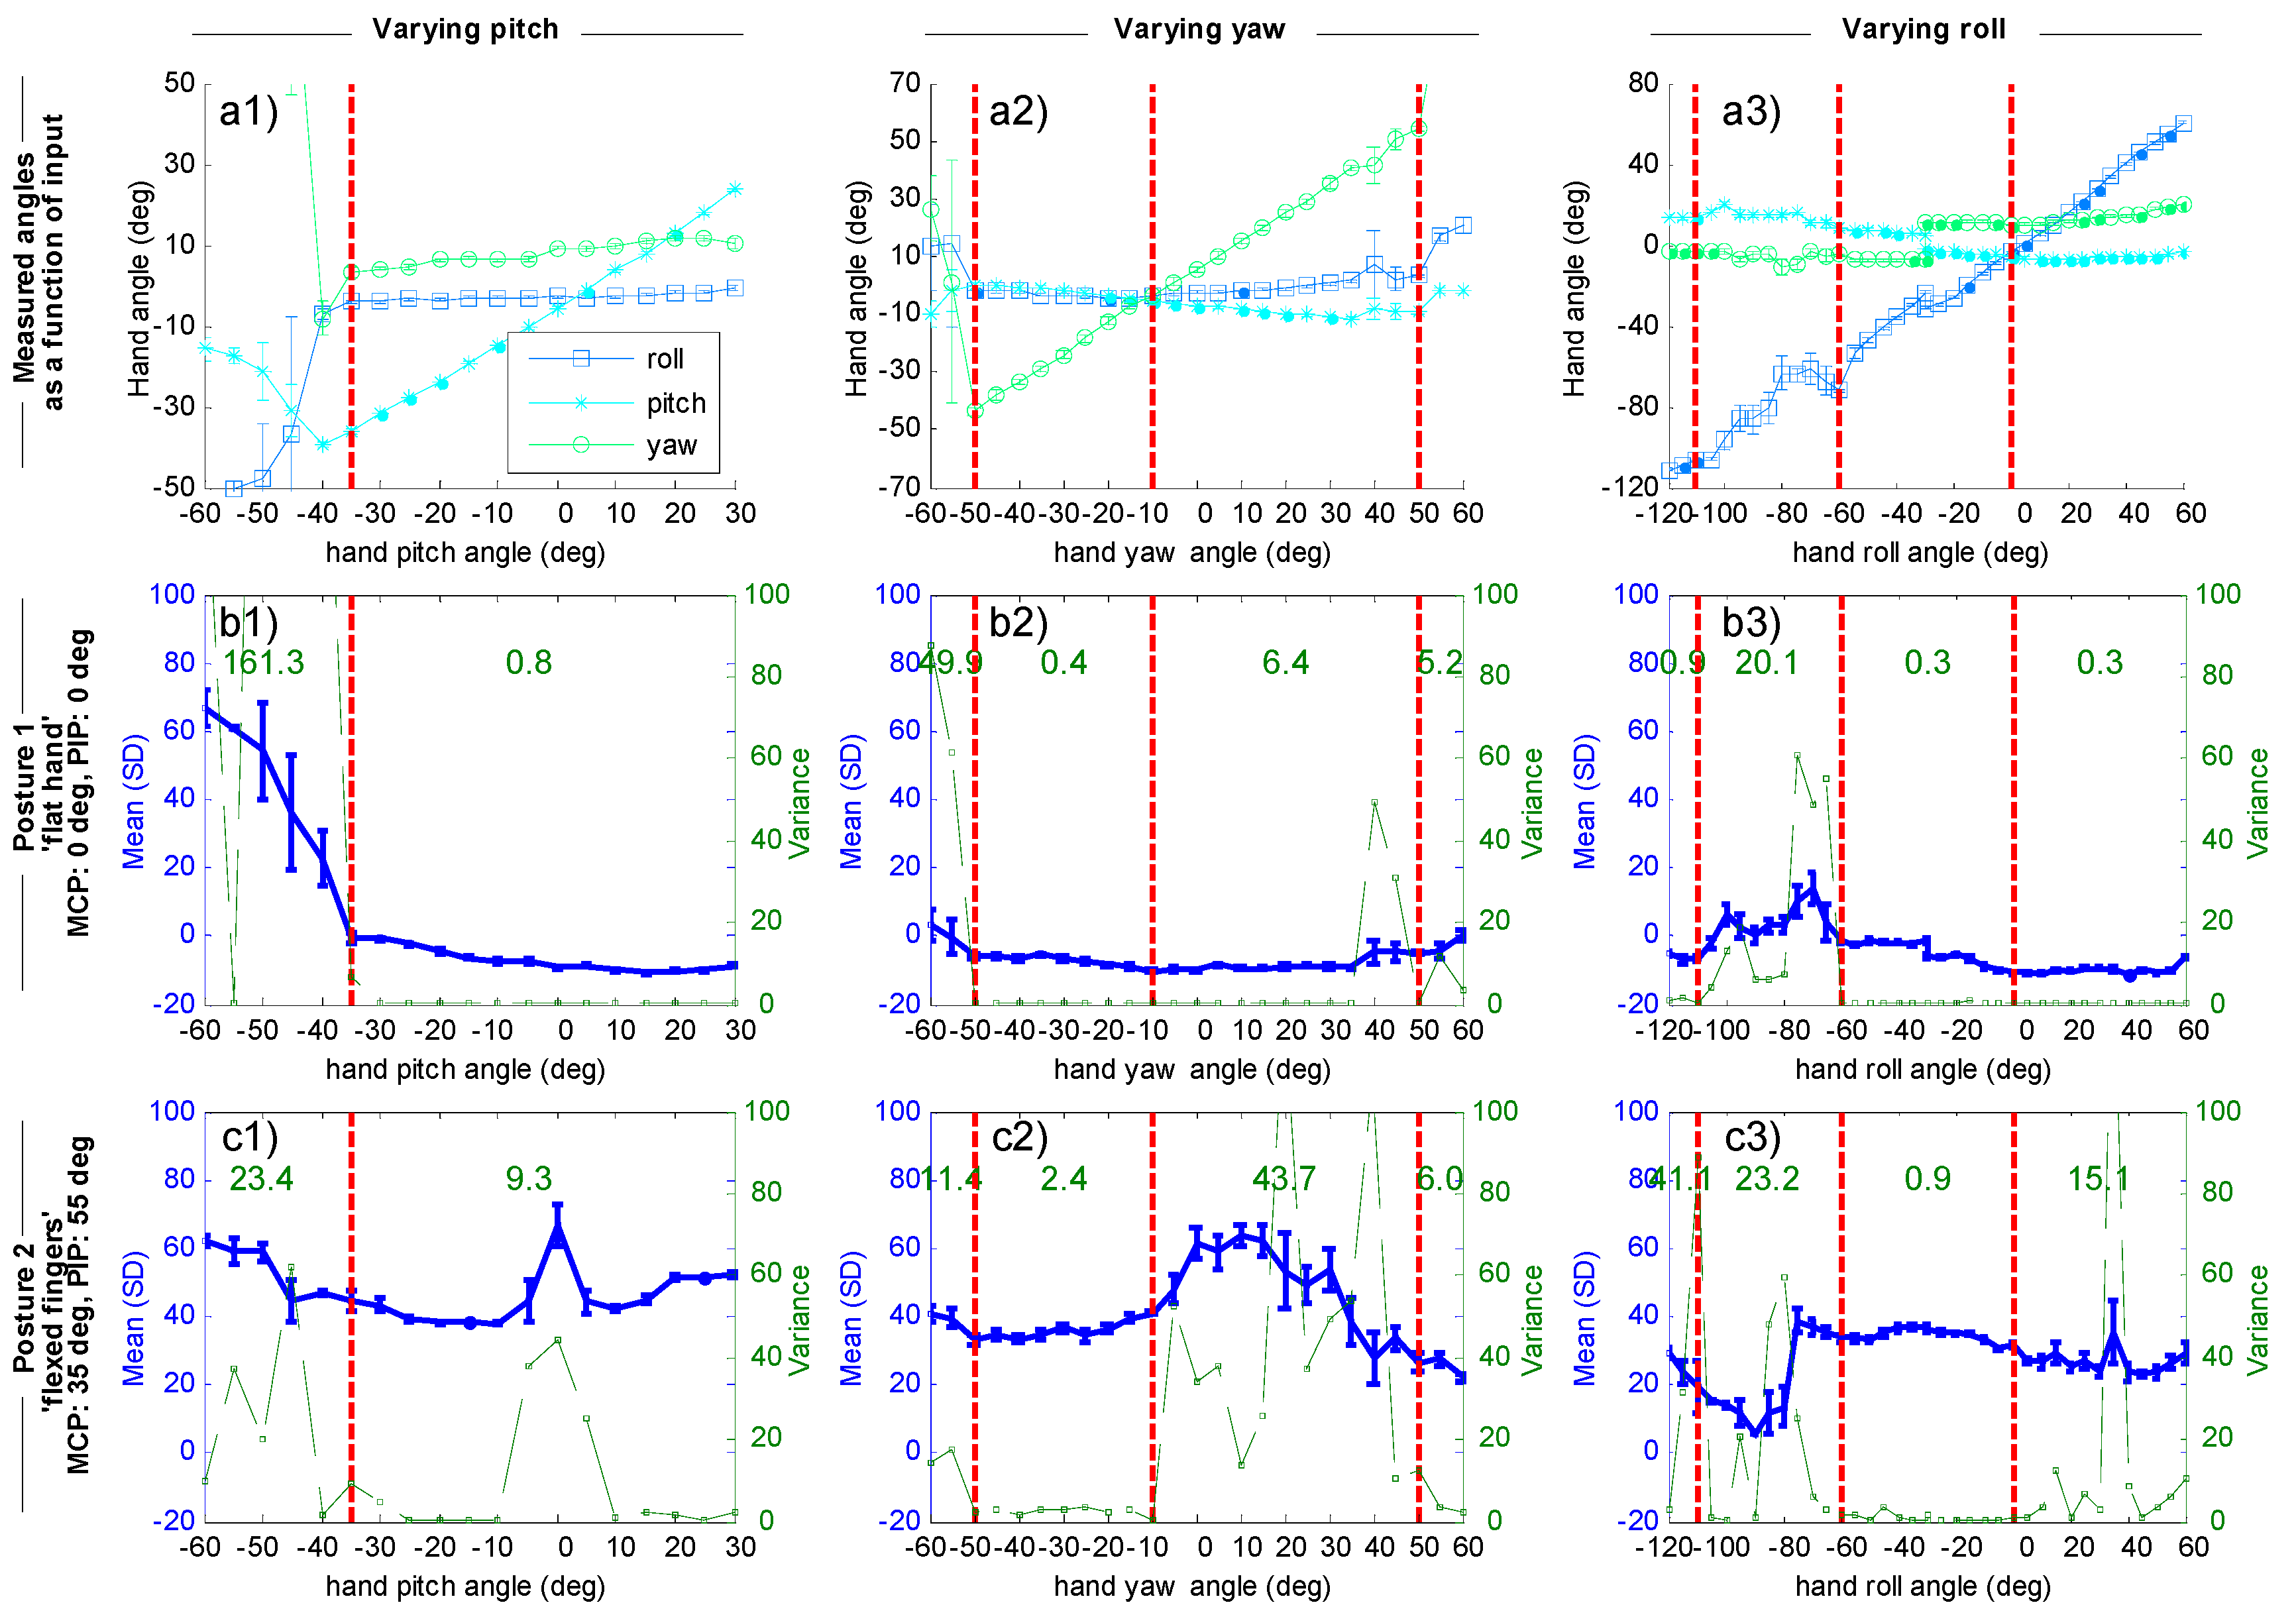
Orientation Dependent Variance Quantification
Methods
Results

Appendix B
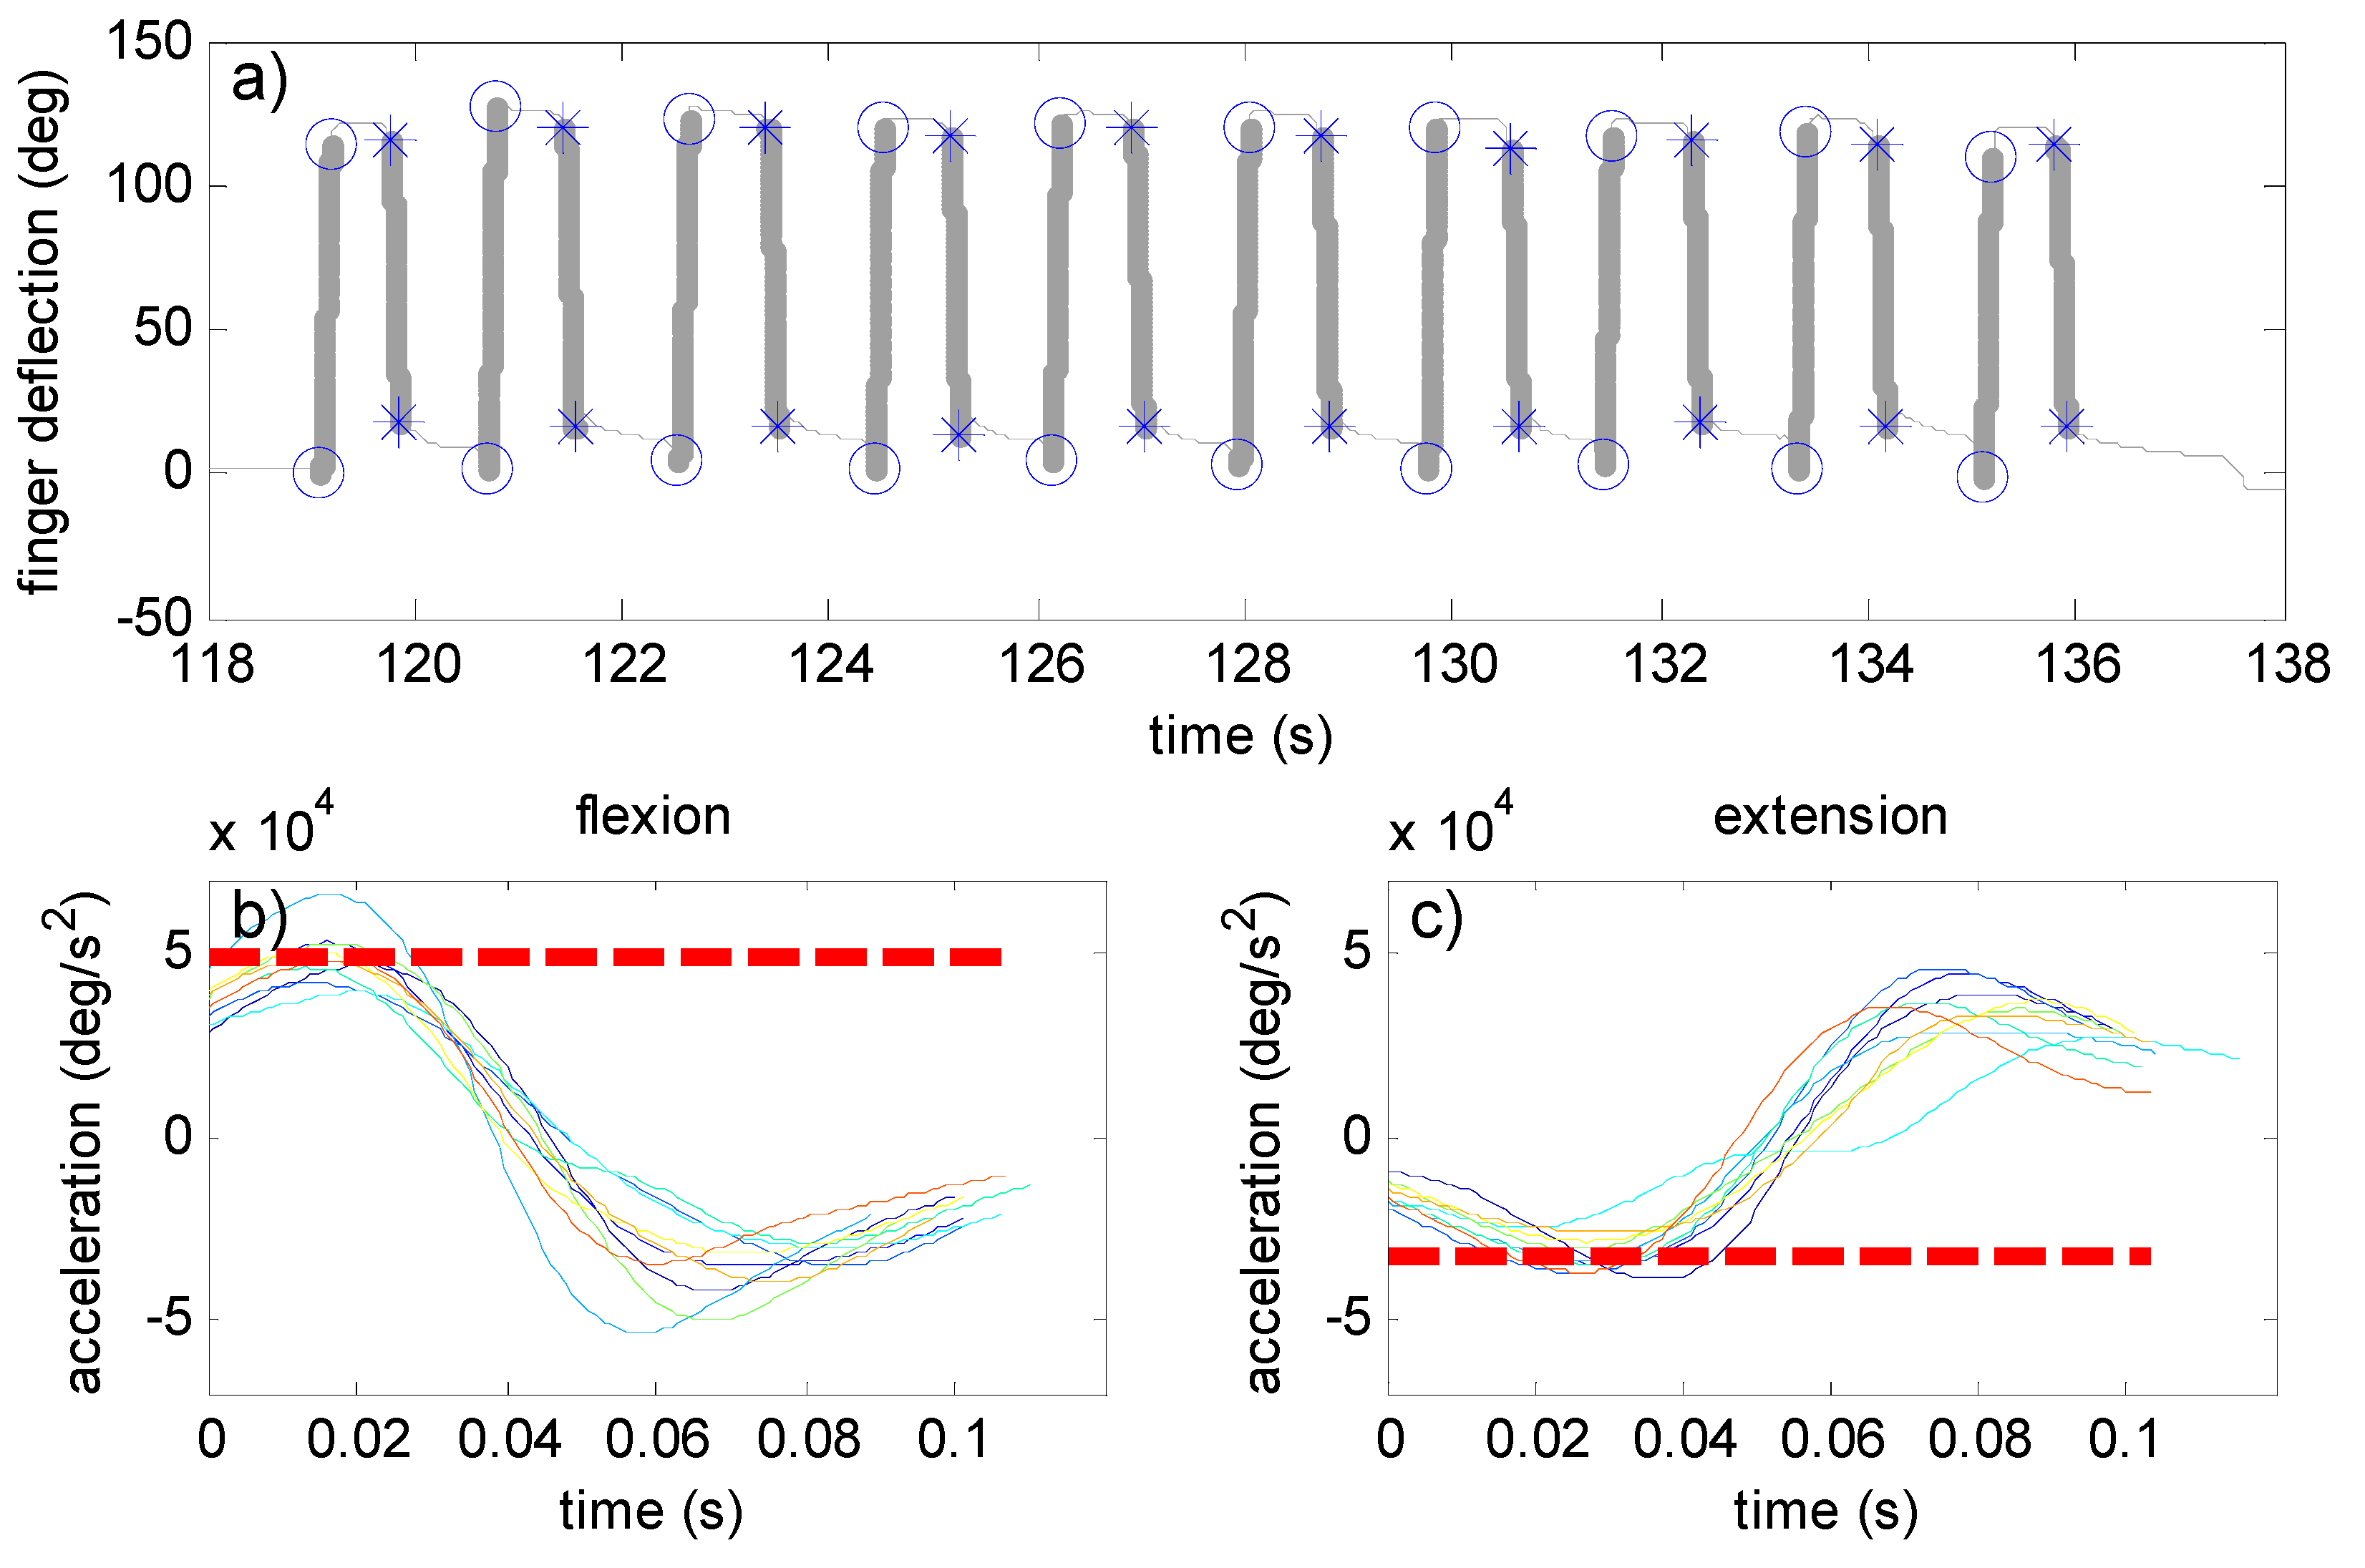
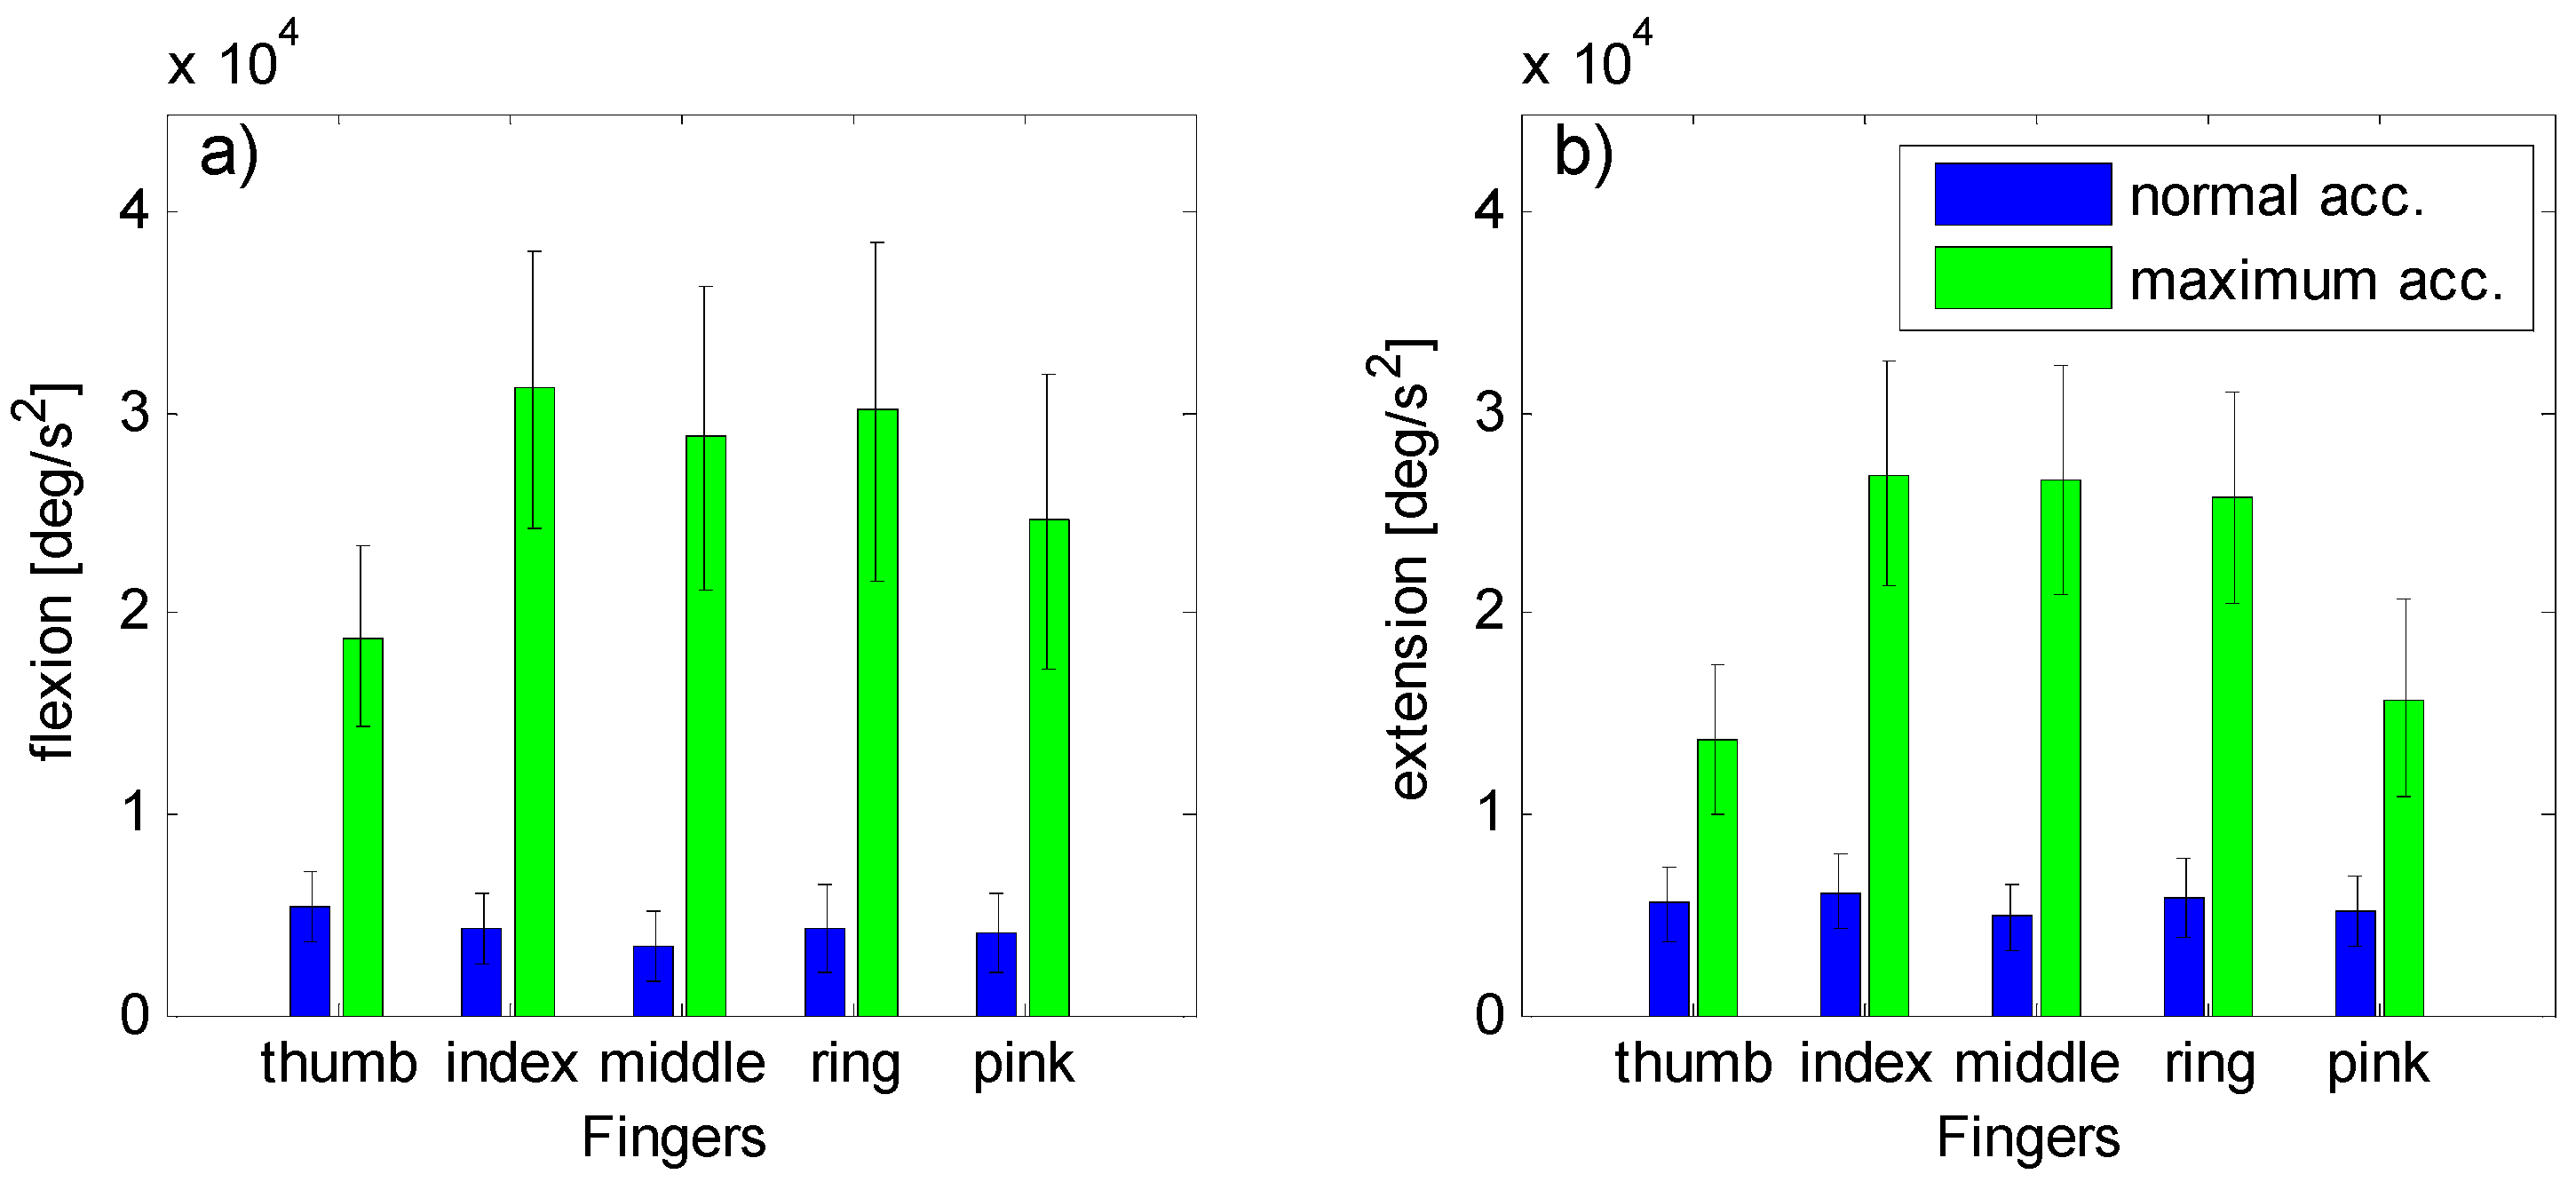
Fingers Maximum Acceleration Determination
Methods
Results

Appendix C
Determination of Data Glove weights

References
- Rautaray, S.; Agrawal, A. Vision based hand gesture recognition for human computer interaction: A survey. Artif. Intell. Rev. 2015, 43, 1–54. [Google Scholar] [CrossRef]
- Suarez, J.; Murphy, R.R. Hand gesture recognition with depth images: A review. In Proceedings of the RO-MAN, 2012 IEEE, Paris, France, 9–13 September 2012; pp. 411–417.
- Erol, A.; Bebis, G.; Nicolescu, M.; Boyle, R.D.; Twombly, X. Vision-based hand pose estimation: A review. Comput. Vis. Image Underst. 2007, 108, 52–73. [Google Scholar] [CrossRef]
- Palacios, J.; Sagüés, C.; Montijano, E.; Llorente, S. Human-computer interaction based on hand gestures using RGB-D sensors. Sensors 2013, 13, 11842. [Google Scholar] [CrossRef] [PubMed]
- Sturman, D.J. Whole-Hand Input; Massachusetts Institute of Technology: Boston, MA, USA, 1991. [Google Scholar]
- Pintzos, G.; Rentzos, L.; Papakostas, N.; Chryssolouris, G. A novel approach for the combined use of ar goggles and mobile devices as communication tools on the shopfloor. Procedia CIRP 2014, 25, 132–137. [Google Scholar] [CrossRef]
- Kalra, P.; Magnenat-Thalmann, N.; Moccozet, L.; Sannier, G.; Aubel, A.; Thalmann, D. Real-time animation of realistic virtual humans. Comput. Graph. Appl. IEEE 1998, 18, 42–56. [Google Scholar] [CrossRef]
- Menache, A. Understanding Motion Capture for Computer Animation and Video Games; Morgan Kaufmann: San Diego, CA, USA, 2000. [Google Scholar]
- Ohn-Bar, E.; Trivedi, M.M. Hand gesture recognition in real time for automotive interfaces: A multimodal vision-based approach and evaluations. IEEE Trans. Intell. Transp. Syst. 2014, 15, 2368–2377. [Google Scholar] [CrossRef]
- Grätzel, C.; Fong, T.; Grange, S.; Baur, C. A non-contact mouse for surgeon-computer interaction. Technol. Health Care 2004, 12, 245–257. [Google Scholar] [PubMed]
- Rosa, G.M.; Elizondo, M.L. Use of a gesture user interface as a touchless image navigation system in dental surgery: Case series report. Imaging Sci. Dent. 2014, 44, 155–160. [Google Scholar] [CrossRef] [PubMed]
- Adhikarla, V.; Sodnik, J.; Szolgay, P.; Jakus, G. Exploring direct 3d interaction for full horizontal parallax light field displays using leap motion controller. Sensors 2015, 15, 8642. [Google Scholar] [CrossRef] [PubMed]
- Bachmann, D.; Weichert, F.; Rinkenauer, G. Evaluation of the leap motion controller as a new contact-free pointing device. Sensors 2014, 15, 214–233. [Google Scholar] [CrossRef] [PubMed]
- Guna, J.; Jakus, G.; Pogačnik, M.; Tomažič, S.; Sodnik, J. An analysis of the precision and reliability of the leap motion sensor and its suitability for static and dynamic tracking. Sensors 2014, 14, 3702–3720. [Google Scholar] [CrossRef] [PubMed]
- Dipietro, L.; Sabatini, A.M.; Dario, P. A survey of glove-based systems and their applications. IEEE Trans. Syst. Man Cybern. Part C Appl. Rev. 2008, 38, 461–482. [Google Scholar] [CrossRef]
- Pavlovic, V.I.; Sharma, R.; Huang, T.S. Visual interpretation of hand gestures for human-computer interaction: A review. IEEE Trans. Pattern Anal. Mach. Intell. 1997, 19, 677–695. [Google Scholar] [CrossRef]
- Wu, Y.; Huang, T. Vision-Based Gesture Recognition: A Review; Springer Heidelberg: Berlin, Germany, 1999; pp. 103–115. [Google Scholar]
- Preil, M. Optimum dose for EUV: Technical vs. Economic drivers. Future Fab Int. 2012, 41. [Google Scholar]
- Kurzweil, R. The Singularity is Near: When Humans Transcend Biology; Penguin: New York, NY, USA, 2005. [Google Scholar]
- Zhao, W.; Chai, J.; Xu, Y.-Q. Combining Marker-Based Mocap and RGB-D Camera for Acquiring High-Fidelity Hand Motion Data. In Proceedings of the ACM SIGGRAPH/Eurographics Symposium on Computer Animation, Eurographics Association, Lausanne, Switzerland, 29–31 July 2012; pp. 33–42.
- Rogalla, O.; Ehrenmann, M.; Dillmann, R. A sensor fusion approach for PbD. In Proceedings of the 1998 IEEE/RSJ International Conference on Intelligent Robots and Systems, Victoria, BC, Canada, 13–17 October 1998; pp. 1040–1045.
- Ehrenmann, M.; Zollner, R.; Knoop, S.; Dillmann, R. Sensor Fusion Approaches for Observation of User Actions in Programming by Demonstration. In Proceedings of the International Conference on Multisensor Fusion and Integration for Intelligent Systems, Baden-Baden, Germany, 20–22 August 2001; pp. 227–232.
- Hebert, P.; Hudson, N.; Ma, J.; Burdick, J. Fusion of Stereo Vision, Force-Torque, and Joint Sensors for Estimation of in-Hand Object Location. In Proceedings of the 2011 IEEE International Conference on Robotics and Automation (ICRA), Shanghai, China, 9–13 May 2011; pp. 5935–5941.
- Zhou, S.; Fei, F.; Zhang, G.; Liu, Y.; Li, W. Hand-writing motion tracking with vision-inertial sensor fusion: Calibration and error correction. Sensors 2014, 14, 15641–15657. [Google Scholar] [CrossRef] [PubMed]
- Fan, W.; Chen, X.; Wang, W.-H.; Zhang, X.; Yang, J.-H.; Lantz, V.; Wang, K.-Q. A Method of Hand Gesture Recognition Based on Multiple Sensors. In Proceedings of the 4th International Conference on Bioinformatics and Biomedical Engineering (iCBBE), Chengdu, China, 18–20 June 2010; pp. 1–4.
- Zou, W.; Yuan, K.; Liu, J.; Luo, B. A Method for Hand Tracking and Motion Recognizing in Chinese Sign Language. In Proceedings of the 2001 International Conferences on Info-Tech and Info-Net, Beijing, China, 29 October 2001; pp. 543–549.
- Brashear, H.; Starner, T.; Lukowicz, P.; Junker, H. Using Multiple Sensors for Mobile Sign Language Recognition. In Proceedings of the 7th IEEE International Symposium on Wearable Computers (ISWC 2003), White Plains, NY, USA, 21–23 October 2003.
- Khaleghi, B.; Khamis, A.; Karray, F.O.; Razavi, S.N. Multisensor data fusion: A review of the state-of-the-art. Inf. Fusion 2013, 14, 28–44. [Google Scholar] [CrossRef]
- Kunkler, K. The role of medical simulation: An overview. Int. J. Med. Robot. Comput. Assist. Surg. 2006, 2, 203–210. [Google Scholar] [CrossRef] [PubMed]
- Diesen, D.L.; Erhunmwunsee, L.; Bennett, K.M.; Ben-David, K.; Yurcisin, B.; Ceppa, E.P.; Omotosho, P.A.; Perez, A.; Pryor, A. Effectiveness of laparoscopic computer simulator versus usage of box trainer for endoscopic surgery training of novices. J. Surg. Educ. 2011, 68, 282–289. [Google Scholar] [CrossRef] [PubMed]
- Newmark, J.; Dandolu, V.; Milner, R.; Grewal, H.; Harbison, S.; Hernandez, E. Correlating virtual reality and box trainer tasks in the assessment of laparoscopic surgical skills. Am. J. Obst. Gynecol. 2007, 197, 546.e541–546.e544. [Google Scholar] [CrossRef] [PubMed]
- Munz, Y.; Kumar, B.D.; Moorthy, K.; Bann, S.; Darzi, A. Laparoscopic virtual reality and box trainers: Is one superior to the other? Surg. Endosc. Interv. Tech. 2004, 18, 485–494. [Google Scholar]
- Hull, L.; Kassab, E.; Arora, S.; Kneebone, R. Increasing the realism of a laparoscopic box trainer: A simple, inexpensive method. J. Laparoendosc. Ad. Surg. Tech. 2010, 20, 559–562. [Google Scholar] [CrossRef] [PubMed]
- Bent, J.; Chan, K. Human Factors in Aviation -h10 Flight Training and Simulation as Safety Generators; Academic Press: Burlington, MA, USA, 2010. [Google Scholar]
- Crothers, I.; Gallagher, A.; McClure, N.; James, D.; McGuigan, J. Experienced laparoscopic surgeons are automated to the "fulcrum effect": An ergonomic demonstration. Endoscopy 1999, 31, 365–369. [Google Scholar] [CrossRef] [PubMed]
- Gallagher, A.; McClure, N.; McGuigan, J.; Ritchie, K.; Sheehy, N. An ergonomic analysis of the fulcrum effect in the acquisition of endoscopic skills. Endoscopy 1998, 30, 617–620. [Google Scholar] [CrossRef] [PubMed]
- Eyal, R.; Tendick, F. Spatial ability and learning the use of an angled laparoscope in a virtual. Med. Meets Virtual Real. Outer Space Inner Space Virtual Space 2001, 81, 146. [Google Scholar]
- Oculus VR. LLC. Step into the Rift. Available online: www.oculus.com (accessed on 7 December 2015).
- Sony Computer Entertainment America LLC. Project Morpheus. Available online: https://www.playstation.com/en-us/explore/project-morpheus/ (accessed on 7 December 2015).
- HTC Corporation. Htc Vive. Available online: http://www.htcvr.com (accessed on 7 December 2015).
- SAMSUNG ELECTRONICS CO. LTD. Samsung Gear vr. Available online: http://www.samsung.com/global/microsite/gearvr/gearvr_features.html (accessed on 7 December 2015).
- Ahlberg, G.; Enochsson, L.; Gallagher, A.G.; Hedman, L.; Hogman, C.; McClusky, D.A., III; Ramel, S.; Smith, C.D.; Arvidsson, D. Proficiency-based virtual reality training significantly reduces the error rate for residents during their first 10 laparoscopic cholecystectomies. Am. J. Surg. 2007, 193, 797–804. [Google Scholar] [CrossRef] [PubMed]
- Gallagher, A.G.; Ritter, E.M.; Champion, H.; Higgins, G.; Fried, M.P.; Moses, G.; Smith, C.D.; Satava, R.M. Virtual reality simulation for the operating room: Proficiency-based training as a paradigm shift in surgical skills training. Ann. Surg. 2005, 241, 364–372. [Google Scholar] [CrossRef] [PubMed]
- Seymour, N.E.; Gallagher, A.G.; Roman, S.A.; O’Brien, M.K.; Bansal, V.K.; Andersen, D.K.; Satava, R.M. Virtual reality training improves operating room performance: Results of a randomized, double-blinded study. Ann. Surg. 2002, 236, 458–464. [Google Scholar] [CrossRef] [PubMed]
- Munz, Y.; Almoudaris, A.M.; Moorthy, K.; Dosis, A.; Liddle, A.D.; Darzi, A.W. Curriculum-based solo virtual reality training for laparoscopic intracorporeal knot tying: Objective assessment of the transfer of skill from virtual reality to reality. Am. J. Surg. 2007, 193, 774–783. [Google Scholar] [CrossRef] [PubMed]
- Wang, R.; Paris, S.; Popović, J. 6d Hands: Markerless Hand-Tracking for Computer Aided Design. In Proceedings of the 24th Annual ACM Symposium on User Interface Software and Technology, Santa Barbara, CA, USA, 16–19 October 2011; pp. 549–558.
- El-laithy, R.A.; Jidong, H.; Yeh, M. Study on the Use of Microsoft Kinect for Robotics Applications. In Proceedings of the 2012 IEEE/ION Position Location and Navigation Symposium (PLANS), Myrtle Beach, SC, USA, 23–26 April 2012; pp. 1280–1288.
- Yonjae, K.; Kim, P.C.W.; Selle, R.; Shademan, A.; Krieger, A. Experimental Evaluation of Contact-Less hand Tracking Systems for Tele-Operation of Surgical Tasks. In Proceedings of the 2014 IEEE International Conference on Robotics and Automation (ICRA), Hong Kong, China, 31 May–7 June 2014; pp. 3502–3509.
- Arkenbout, E.A.; Winter, J.C.F.D.; Breedveld, P. Using kinect with 3gear systems software to determine hand and finger movement: An assessment for minimally invasive surgery applications. Des. Med. Devices Eur. 2014. [Google Scholar] [CrossRef]
- Weichert, F.; Bachmann, D.; Rudak, B.; Fisseler, D. Analysis of the accuracy and robustness of the leap motion controller. Sensors 2013, 13, 6380–6393. [Google Scholar] [CrossRef] [PubMed]
- Kim, Y.; Leonard, S.; Shademan, A.; Krieger, A.; Kim, P.W. Kinect technology for hand tracking control of surgical robots: Technical and surgical skill comparison to current robotic masters. Surg. Endosc. 2014, 28, 1993–2000. [Google Scholar] [CrossRef] [PubMed]
- Technologies, F.D. Data gloves. Available online: http://www.5dt.com/?page_id=34 (accessed on 14 January 2015).
- Bishop, G.; Welch, G. An introduction to the kalman filter. Proc. SIGGRAPH Course 2001, 8, 1–47. [Google Scholar]
- Harvey, A.C. Forecasting, Structural Time Series Models And The Kalman Filter; Cambridge University Press: Cambridge, UK, 1990. [Google Scholar]
- Haykin, S. Kalman Filtering and Neural Networks; John Wiley & Sons: New York, NY, USA, 2004. [Google Scholar]
- Nimble VR. Nimble vr sdk v0.9.36. Available online: http://nimblevr.com/download.html (accessed on 14 January 2015).
- Fukunaga, K.; Hostetler, L. The estimation of the gradient of a density function, with applications in pattern recognition. IEEE Trans. Inf. Theory 1975, 21, 32–40. [Google Scholar] [CrossRef]
- Dianat, I.; Haslegrave, C.M.; Stedmon, A.W. Methodology for evaluating gloves in relation to the effects on hand performance capabilities: A literature review. Ergonomics 2012, 55, 1429–1451. [Google Scholar] [CrossRef] [PubMed]
- Simone, L.K.; Elovic, E.; Kalambur, U.; Kamper, D. A Low Cost Method to Measure Finger Flexion in Individuals with Reduced Hand and Finger Range of Motion. In Proceedings of the IEMBS 04. 26th Annual International Conference of the IEEE Engineering in Medicine and Biology Society, San Francisco, CA, USA, 1–5 September 2004; pp. 4791–4794.
- Kim, D.; Hilliges, O.; Izadi, S.; Butler, A.D.; Chen, J.; Oikonomidis, I.; Olivier, P. Digits: Freehand 3D Interactions Anywhere Using a Wrist-Worn Gloveless Sensor. In Proceedings of the 25th annual ACM symposium on User interface software and technology, Cambridge, MA, USA, 7–10 October 2012; pp. 167–176.
- Nymoen, K.; Haugen, M.R.; Jensenius, A.R. Mumyo–Evaluating and Exploring the MYO Armband for Musical Interaction. In Proceedings of the International Conference on New Interfaces For Musical Expression, Baton Rouge, LA, USA, 31 May–3 June 2015; pp. 1–4.
- Thalmic Labs Inc. Myo-Touch-Free Control. Available online: www.thalmic.com (accessed on 7 December 2015).
- Lynch, J.; Aughwane, P.; Hammond, T.M. Video games and surgical ability: A literature review. J. Surg. Educ. 2010, 67, 184–189. [Google Scholar] [CrossRef] [PubMed]
- Levison, W.H.; Lancraft, R.; Junker, A. Effects of Simulator Delays on Performance and Learning in a Roll-Axis Tracking Task. In Proceedings of the 15th Annual Conference on Manual Control, Wright State University, Dayton, Dayton, OH, USA, 20–22 March 1979; pp. 168–186.
- Bowersox, J.C.; Cordts, P.R.; LaPorta, A.J. Use of an intuitive telemanipulator system for remote trauma surgery: An experimental study. J. Am. Coll. Surg. 1998, 186, 615–621. [Google Scholar] [CrossRef]
- Fabrlzio, M.D.; Lee, B.R.; Chan, D.Y.; Stoianovici, D.; Jarrett, T.W.; Yang, C.; Kavoussi, L.R. Effect of time delay on surgical performance during telesurgical manipulation. J. Endourol. 2000, 14, 133–138. [Google Scholar] [CrossRef]
- Ottensmeyer, M.P.; Hu, J.; Thompson, J.M.; Ren, J.; Sheridan, T.B. Investigations into performance of minimally invasive telesurgery with feedback time delays. Presence Teleoper. Virtual Environ. 2000, 9, 369–382. [Google Scholar] [CrossRef]
- Arsenault, R.; Ware, C. Eye-Hand Co-Ordination with Force Feedback. In Proceedings of the SIGCHI conference on Human Factors in Computing Systems, The Hague, The Netherlands, 1–6 April 2000; pp. 408–414.
- Reiley, C.E.; Akinbiyi, T.; Burschka, D.; Chang, D.C.; Okamura, A.M.; Yuh, D.D. Effects of visual force feedback on robot-assisted surgical task performance. J. Thorac. Cardiovasc. Surg. 2008, 135, 196–202. [Google Scholar] [CrossRef] [PubMed]
- Lécuyer, A. Simulating haptic feedback using vision: A survey of research and applications of pseudo-haptic feedback. Presence Teleoperators Virtual Environ. 2009, 18, 39–53. [Google Scholar] [CrossRef]
- Buchmann, V.; Violich, S.; Billinghurst, M.; Cockburn, A. Fingartips: Gesture Based Direct Manipulation in Augmented Reality. In Proceedings of the 2nd international conference on Computer graphics and interactive techniques in Australasia and South East Asia, Singapore, 15–18 June 2004; pp. 212–221.
- Judkins, T.N.; DiMartino, A.; Doné, K.; Hallbeck, M.S.; Oleynikov, D. Effect of handle design and target location on wrist posture during aiming with a laparoscopic tool. Proc. Human Factors Ergon. Soc. Ann. Meet. 2004, 48, 1464–1468. [Google Scholar] [CrossRef]
- Saunders, J.; Knill, D. Humans use continuous visual feedback from the hand to control fast reaching movements. Exp. Brain Res. 2003, 152, 341–352. [Google Scholar] [CrossRef] [PubMed]
© 2015 by the authors; licensee MDPI, Basel, Switzerland. This article is an open access article distributed under the terms and conditions of the Creative Commons by Attribution (CC-BY) license (http://creativecommons.org/licenses/by/4.0/).
Share and Cite
Arkenbout, E.A.; De Winter, J.C.F.; Breedveld, P. Robust Hand Motion Tracking through Data Fusion of 5DT Data Glove and Nimble VR Kinect Camera Measurements. Sensors 2015, 15, 31644-31671. https://doi.org/10.3390/s151229868
Arkenbout EA, De Winter JCF, Breedveld P. Robust Hand Motion Tracking through Data Fusion of 5DT Data Glove and Nimble VR Kinect Camera Measurements. Sensors. 2015; 15(12):31644-31671. https://doi.org/10.3390/s151229868
Chicago/Turabian StyleArkenbout, Ewout A., Joost C. F. De Winter, and Paul Breedveld. 2015. "Robust Hand Motion Tracking through Data Fusion of 5DT Data Glove and Nimble VR Kinect Camera Measurements" Sensors 15, no. 12: 31644-31671. https://doi.org/10.3390/s151229868