
Bimodal Biometric Verification Using the Fusion of Palmprint and Infrared Palm-Dorsum Vein Images

 ,
,
Abstract
:1. Introduction

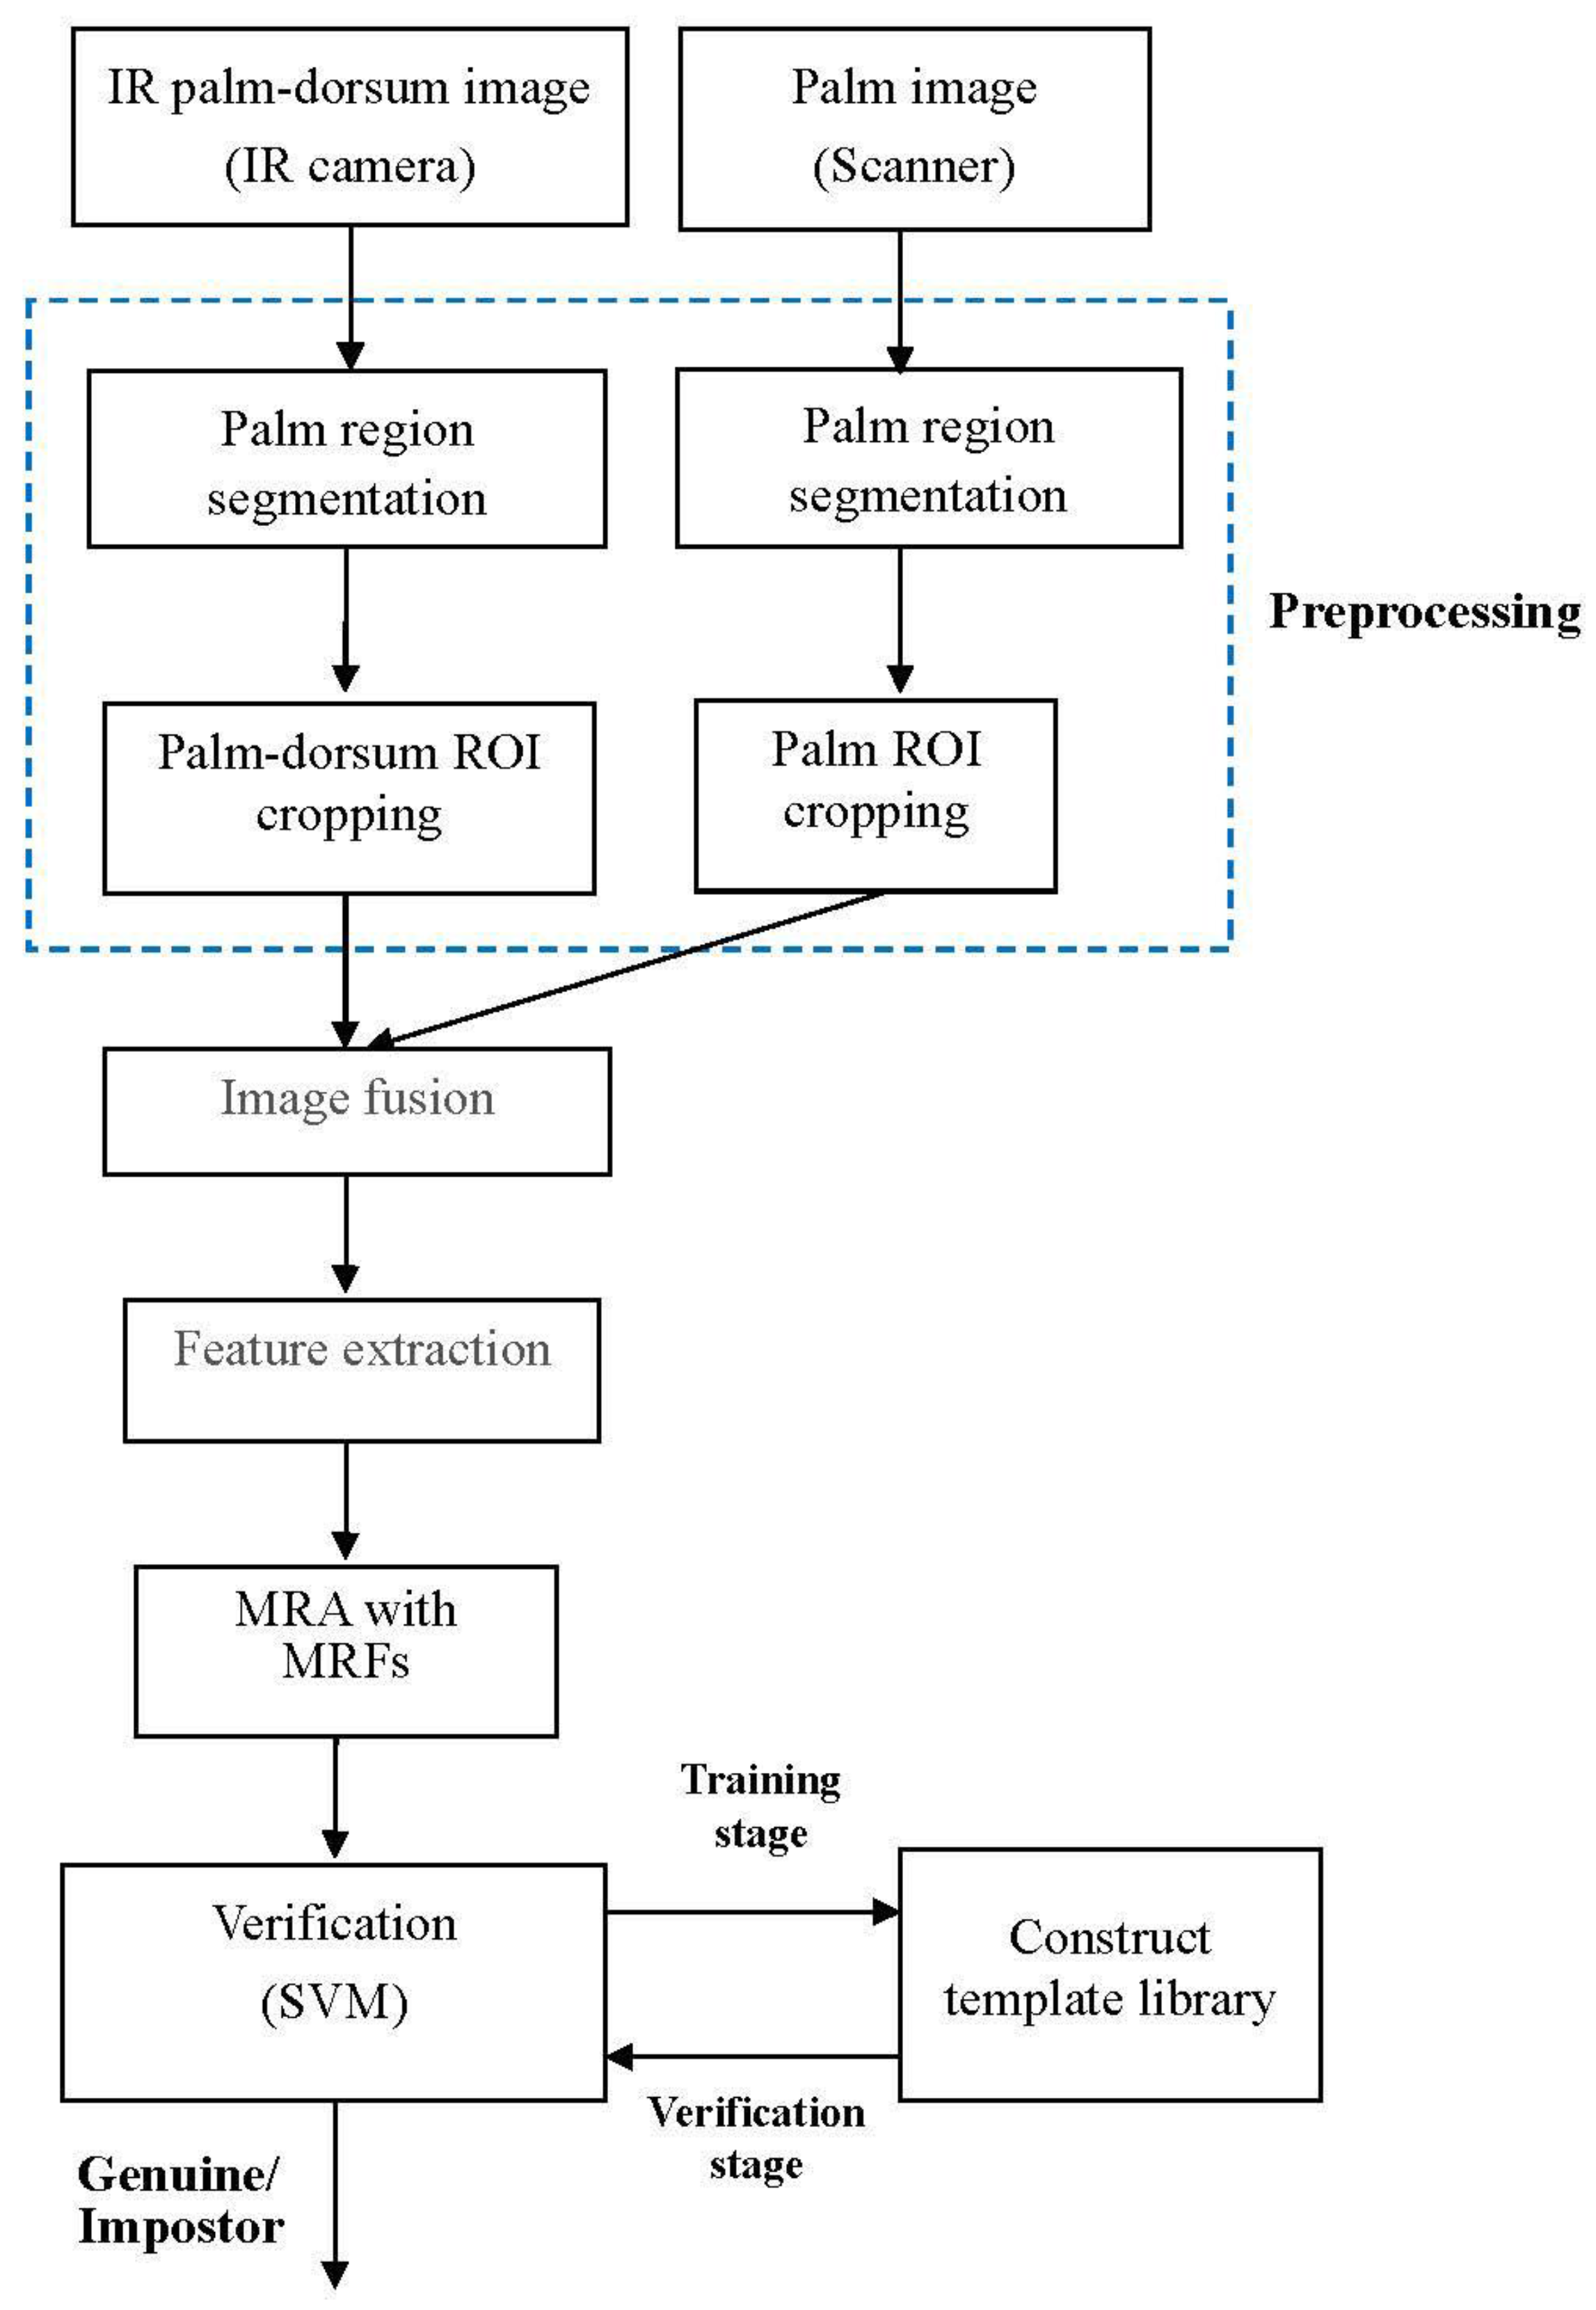
2. Preprocessing
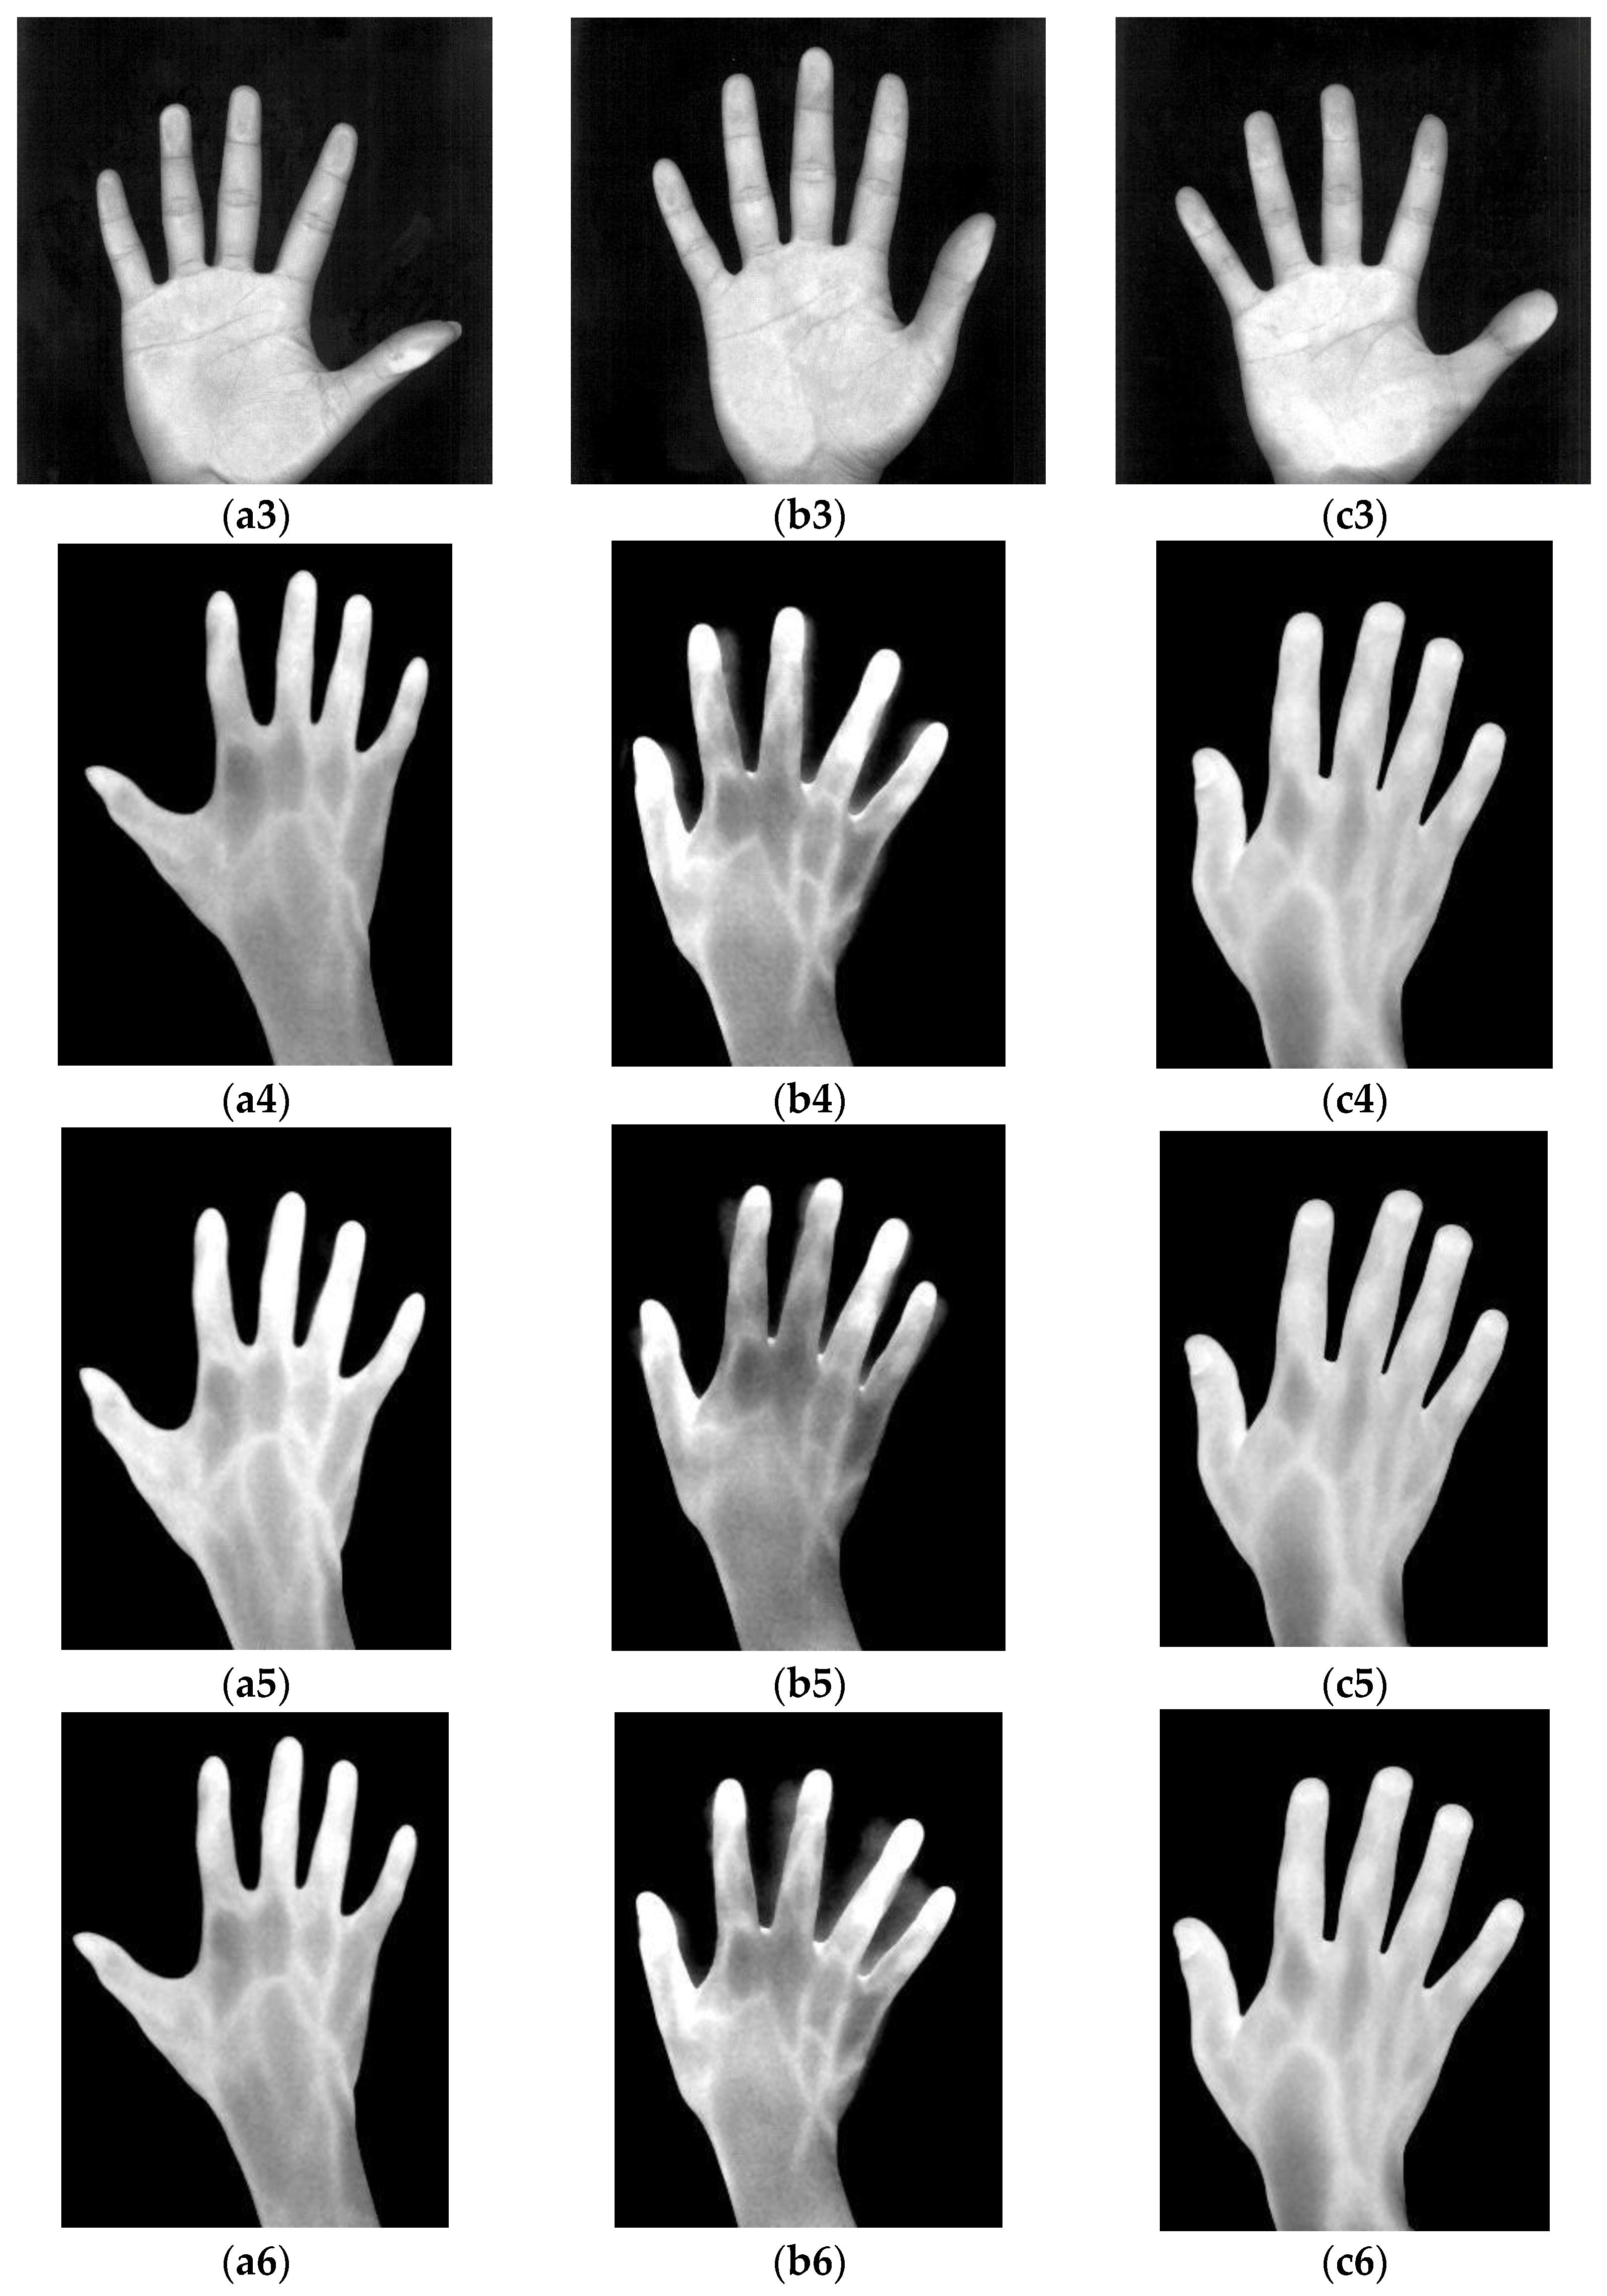
2.1. Palm Region Segmentation
2.2. Locating Finger Webs and ROI Cropping
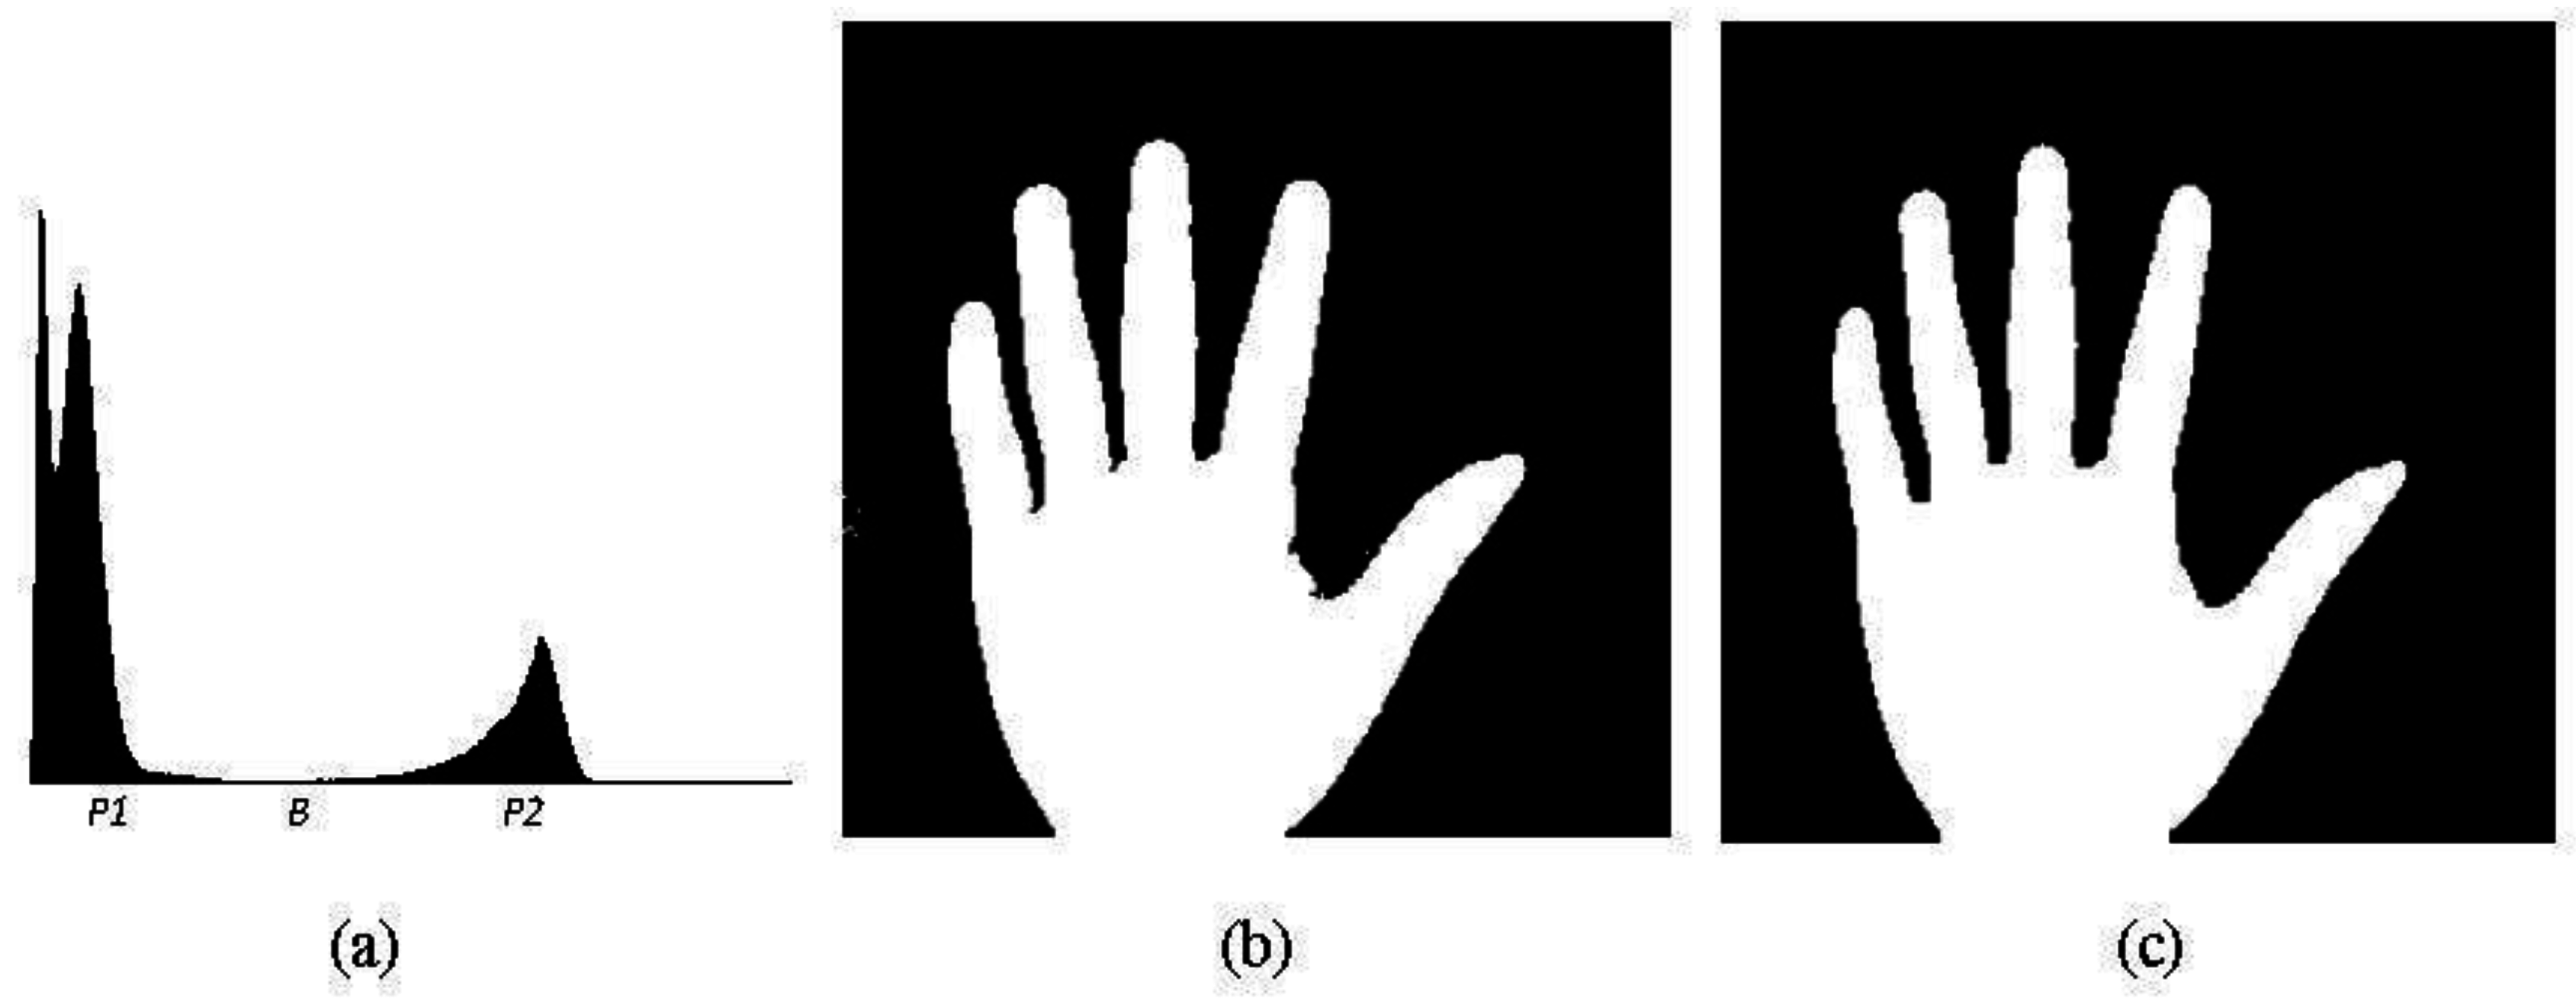
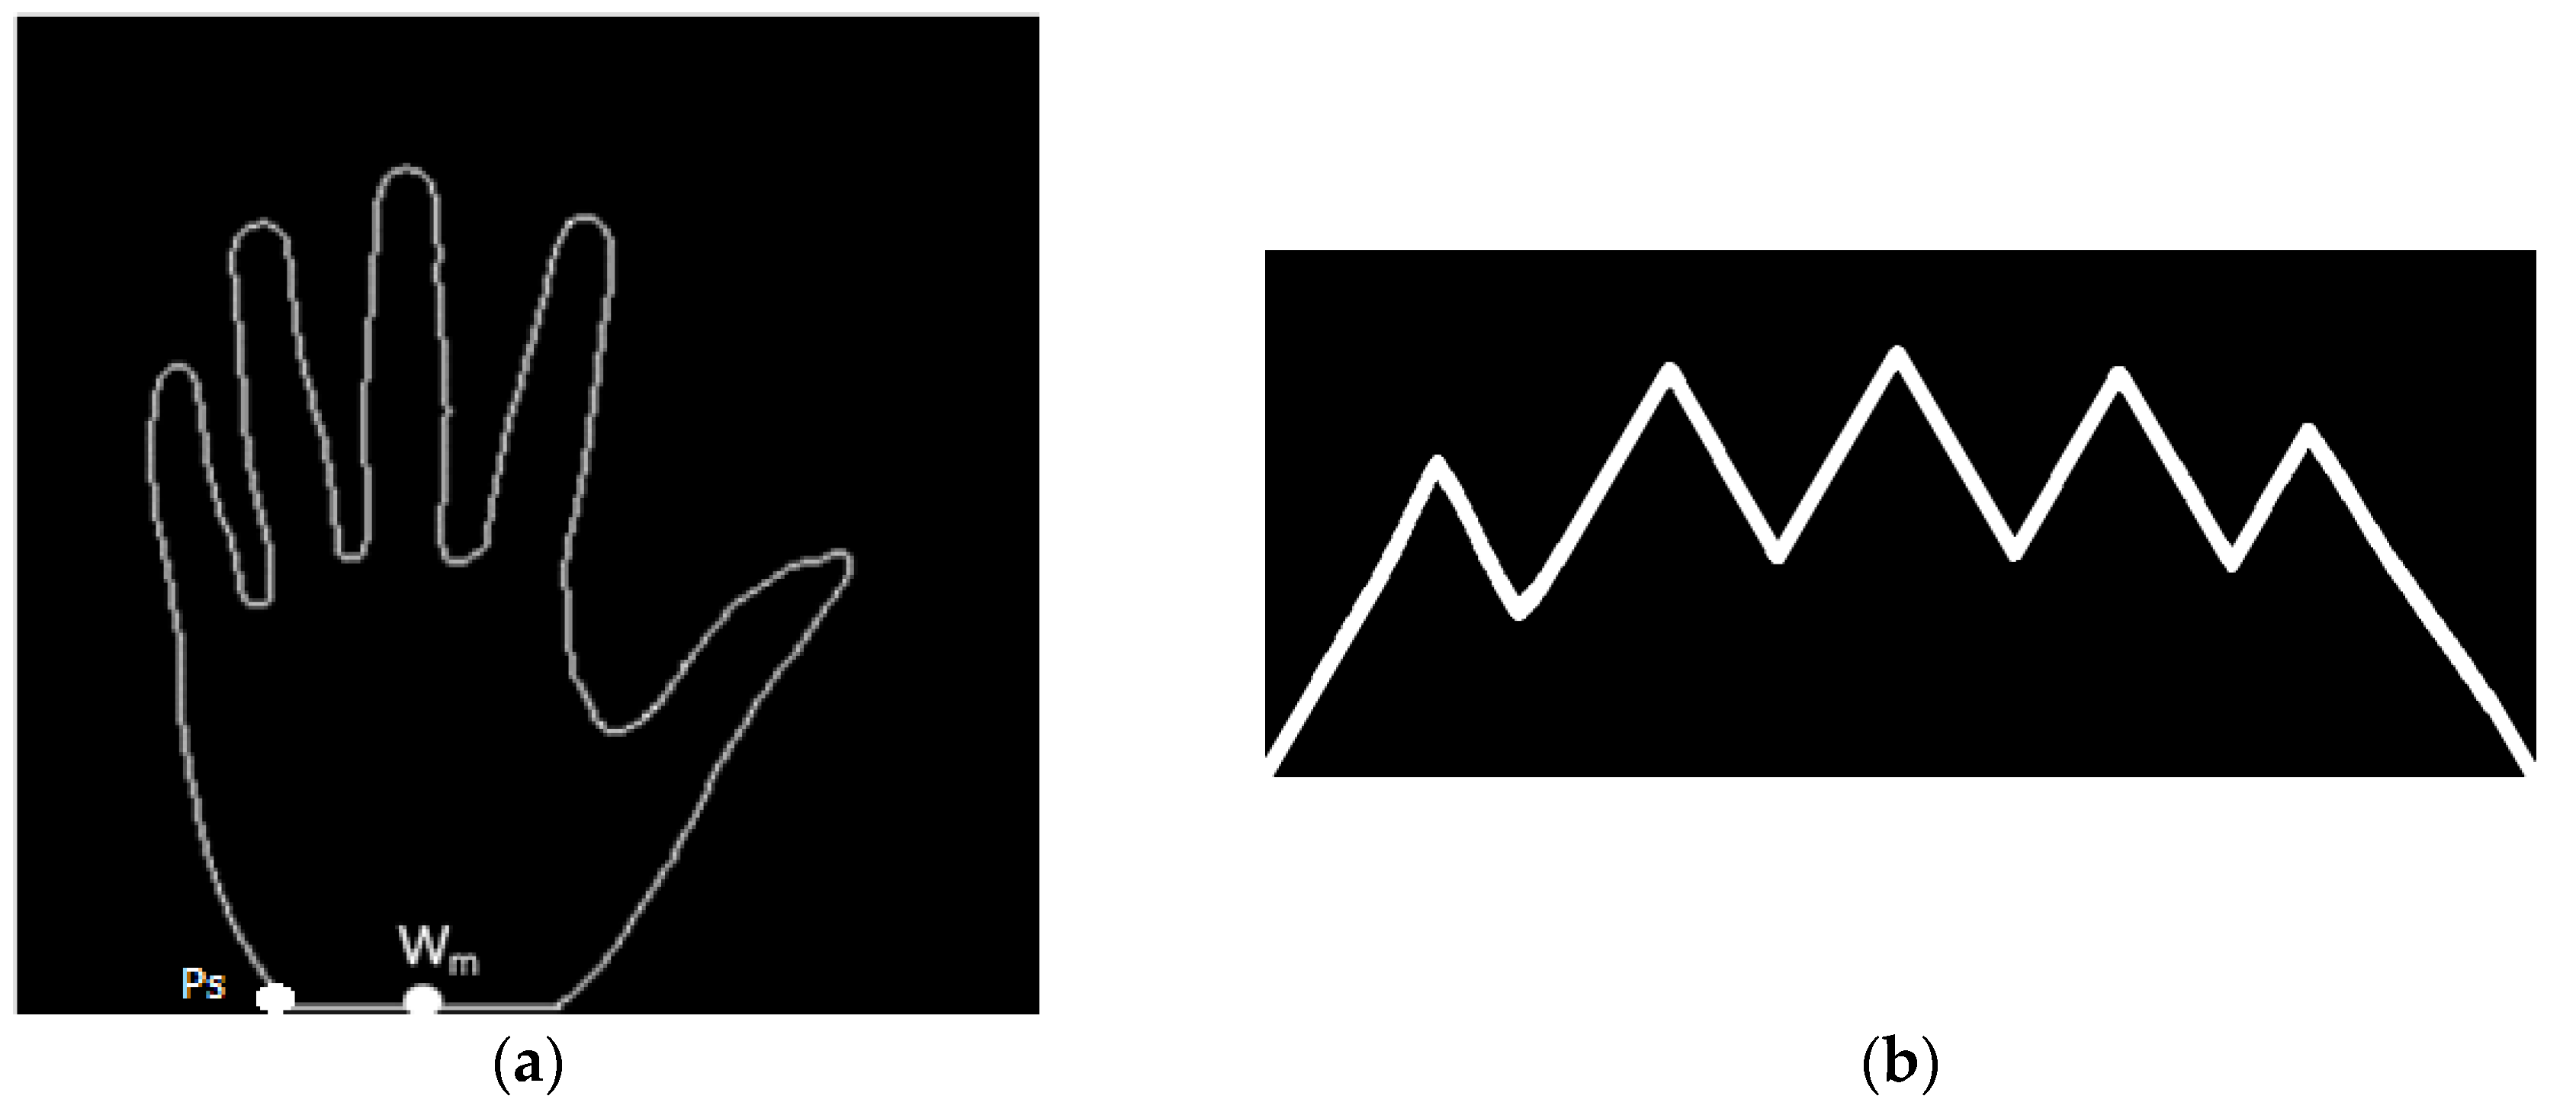
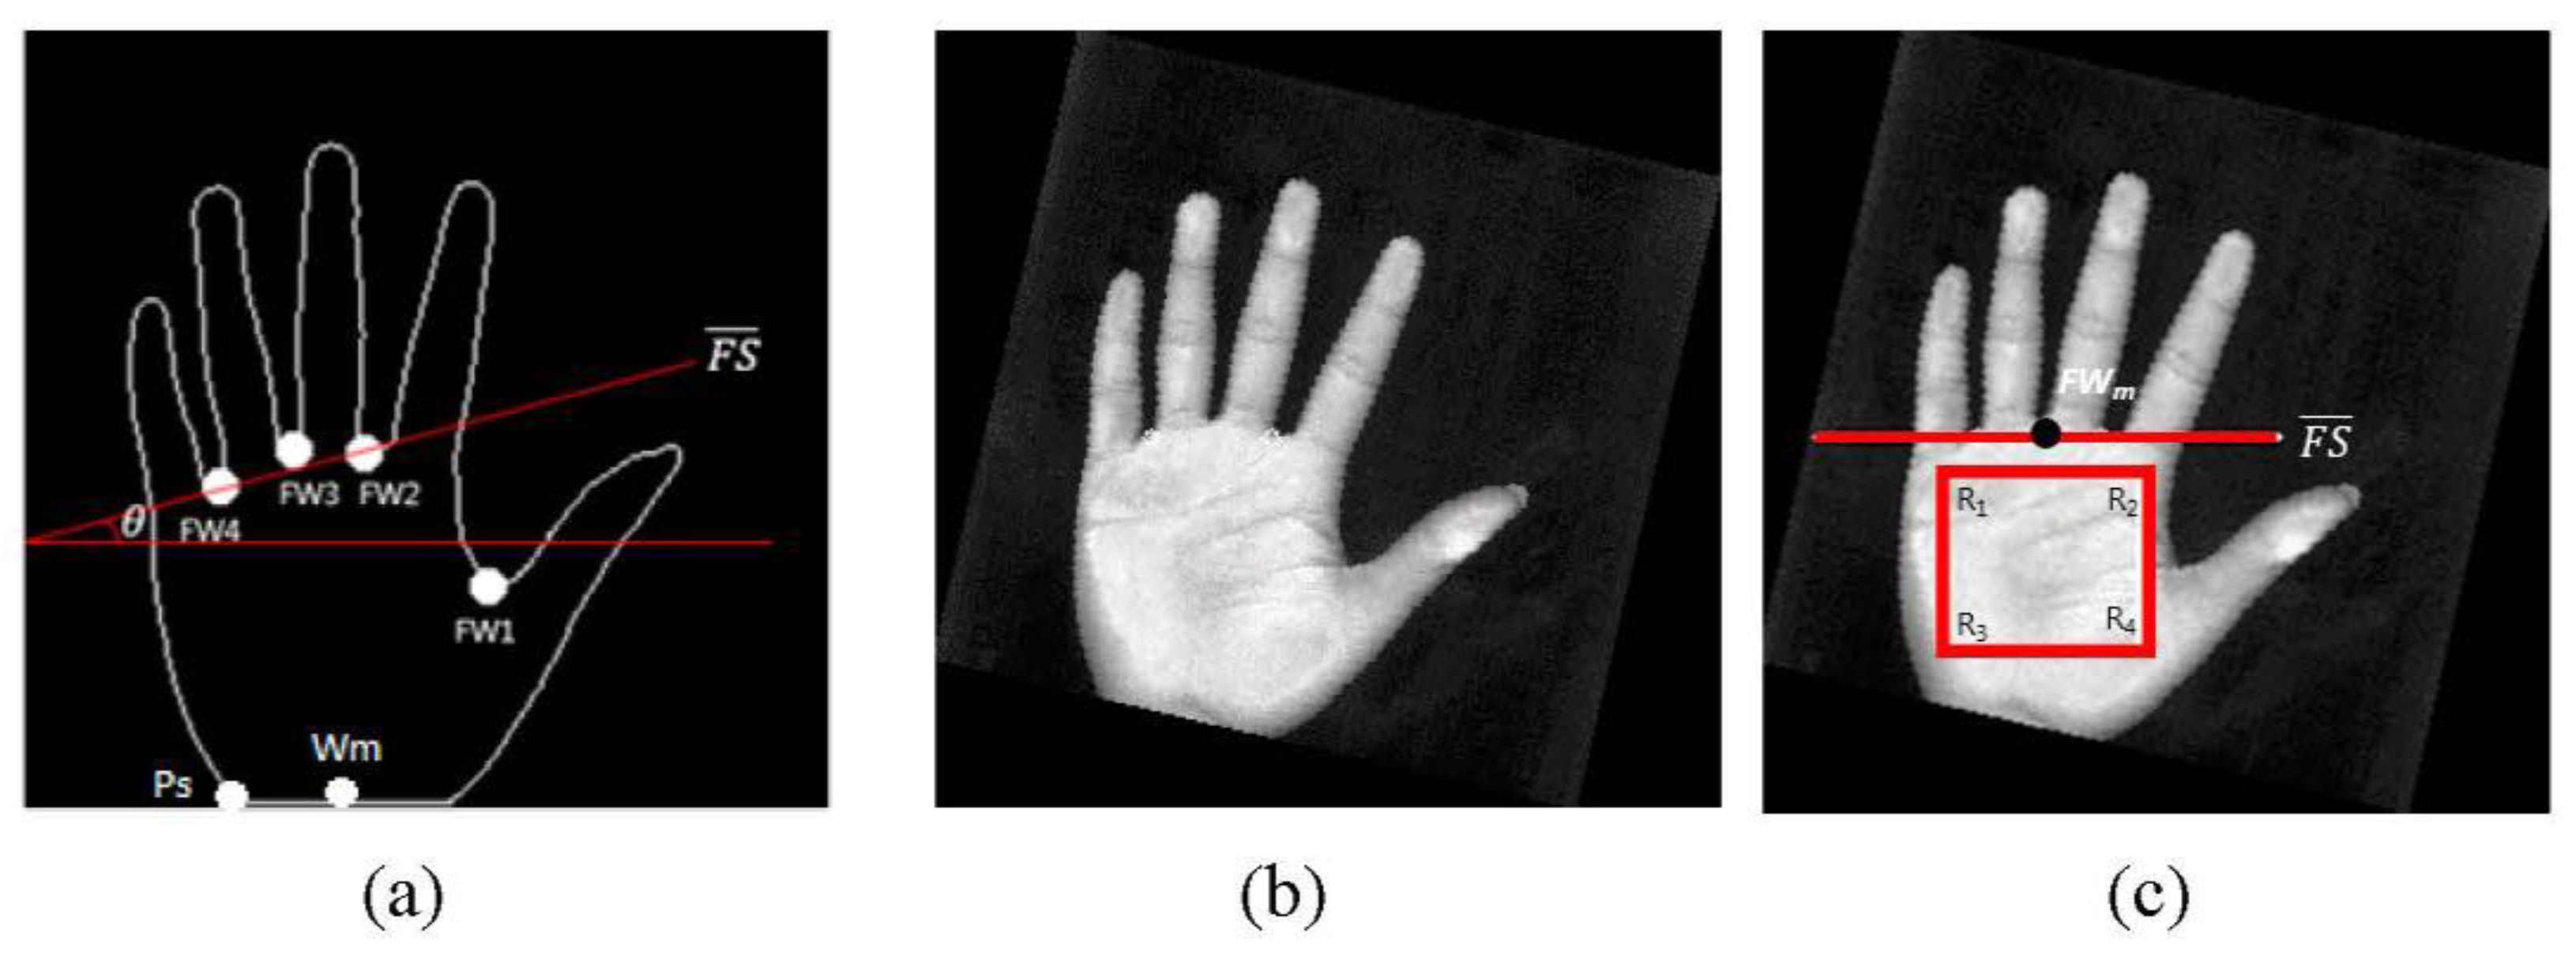
- The inner-border tracing algorithm [23] is applied to determine the palm contours, and the resulting image is shown in Figure 4a. The process starts from the bottom-left point Ps tracing counterclockwise along the border of the palm shape until rejoining point PS. The set of contour pixels are named P1, P2…PN.
- The middle point of the intersection line formed by the wrist and the bottom line of the palm image is defined as Wm.
- By using Equation (3), the Euclidean distance between each contour pixel and the wrist middle point Wm is calculated. These distances are adopted to construct a distance distribution profile whose shape is similar to the geometric shape of a palm. Figure 4b shows the distance distribution profile. The distance profile has five local maximums corresponding to fingertip locations, and four local minimums corresponding to finger-web locations. After experimenting with many palm images, this study finds that the four minimum locations are the same as the finger-web locations regardless of the palm position and rotation angle in each image. With this characteristic, the four finger webs, FW1, FW2, FW3, and FW4, can be accurately located by referencing the four local minimums in the distance distribution profile.
- Contour- and curvature-based outstretched hand detection is employed to locate finger webs. The locations of the four finger webs, FW1, FW2, FW3, and FW4, are shown in Figure 5a.
- Since the rotation angle of the palm region is different in each image, the rotation angle must be removed. Line is formed using finger webs FW2 and FW4 as shown in Figure 5a. The angle θ between and a horizontal line is calculated using Equation (4). The resulting image rotated with angle θ is shown in Figure 5b. Figure 5c shows rotated to be horizontal.
- A square ROI is defined by selecting the second- and fourth-finger webs, FW2 and FW4. FWm is the middle point of FW2 and FW4. The square region is determined by the corners R1, R2, R3, and R4. The top side is parallel to and the distance between them is a quarter length of the line . is calculated as (3/2) × . The corner R1 is then redefined as the original coordinate (0, 0) of the ROI. The located ROI is shown in Figure 5c. The ROI image, which is the square region enclosed by corners R1, R2, R3, and R4, is cropped from the palm or palm-dorsum image.

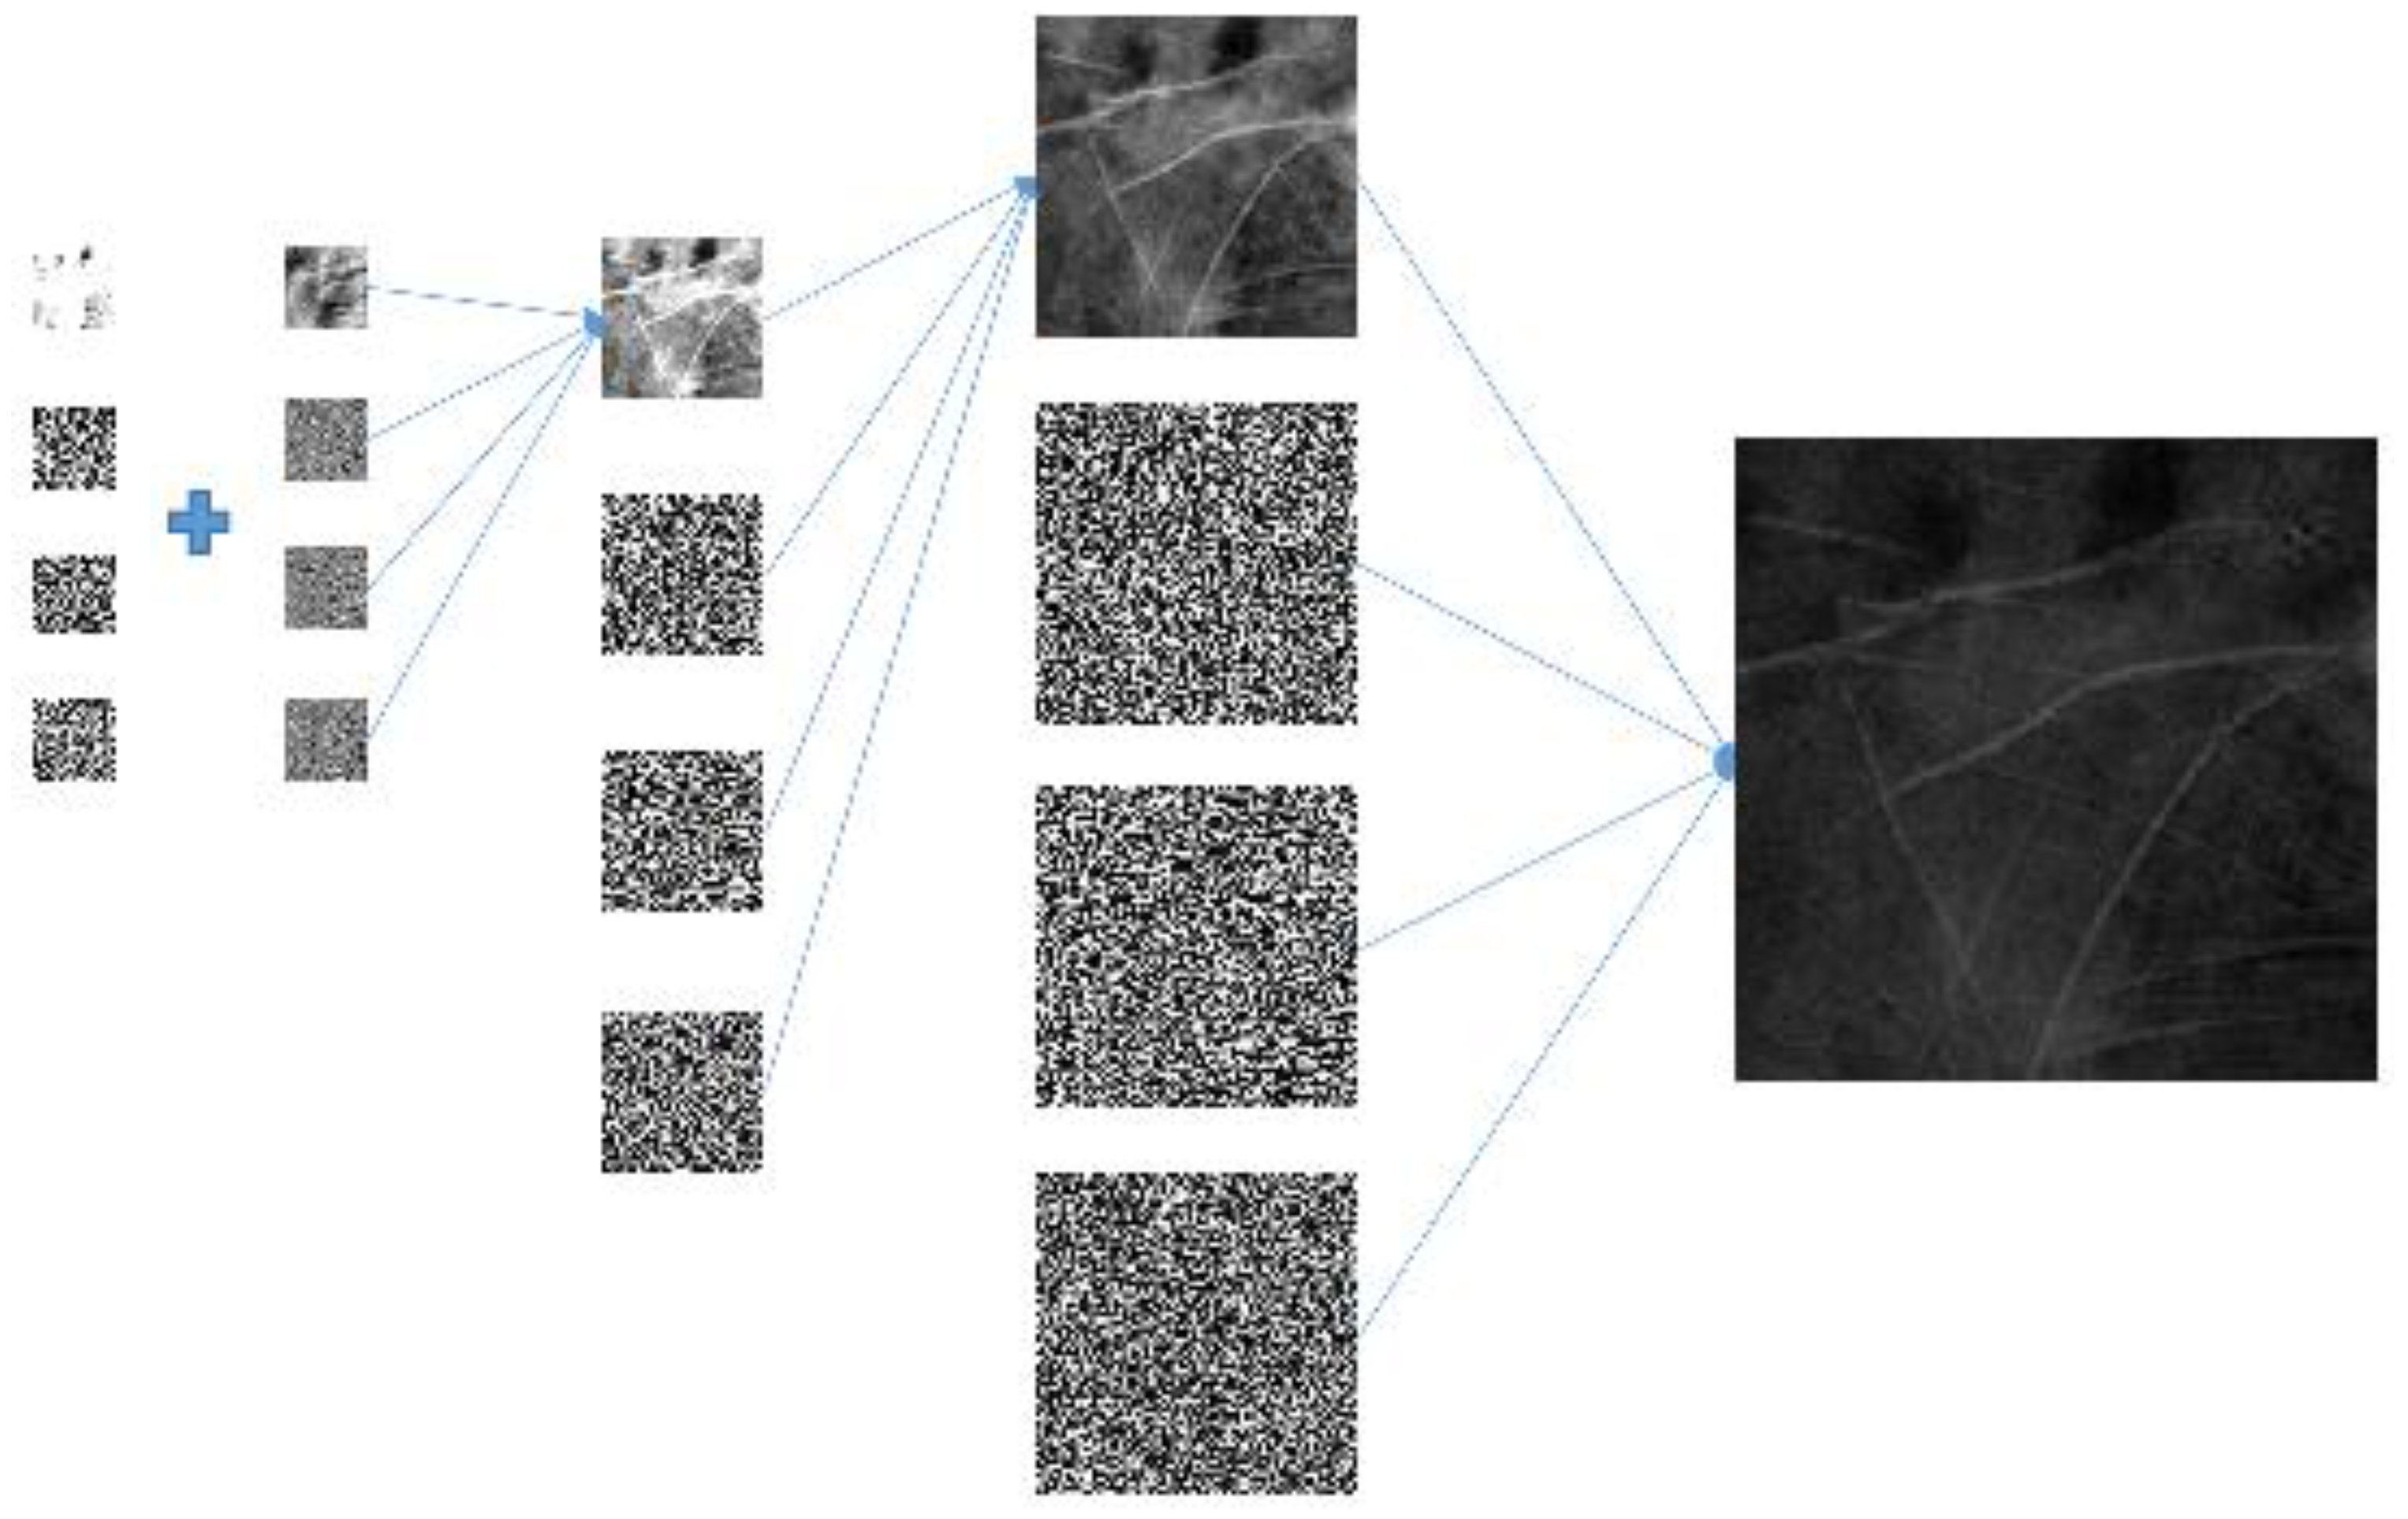
3. Image Fusion Based on DWT and IDWT
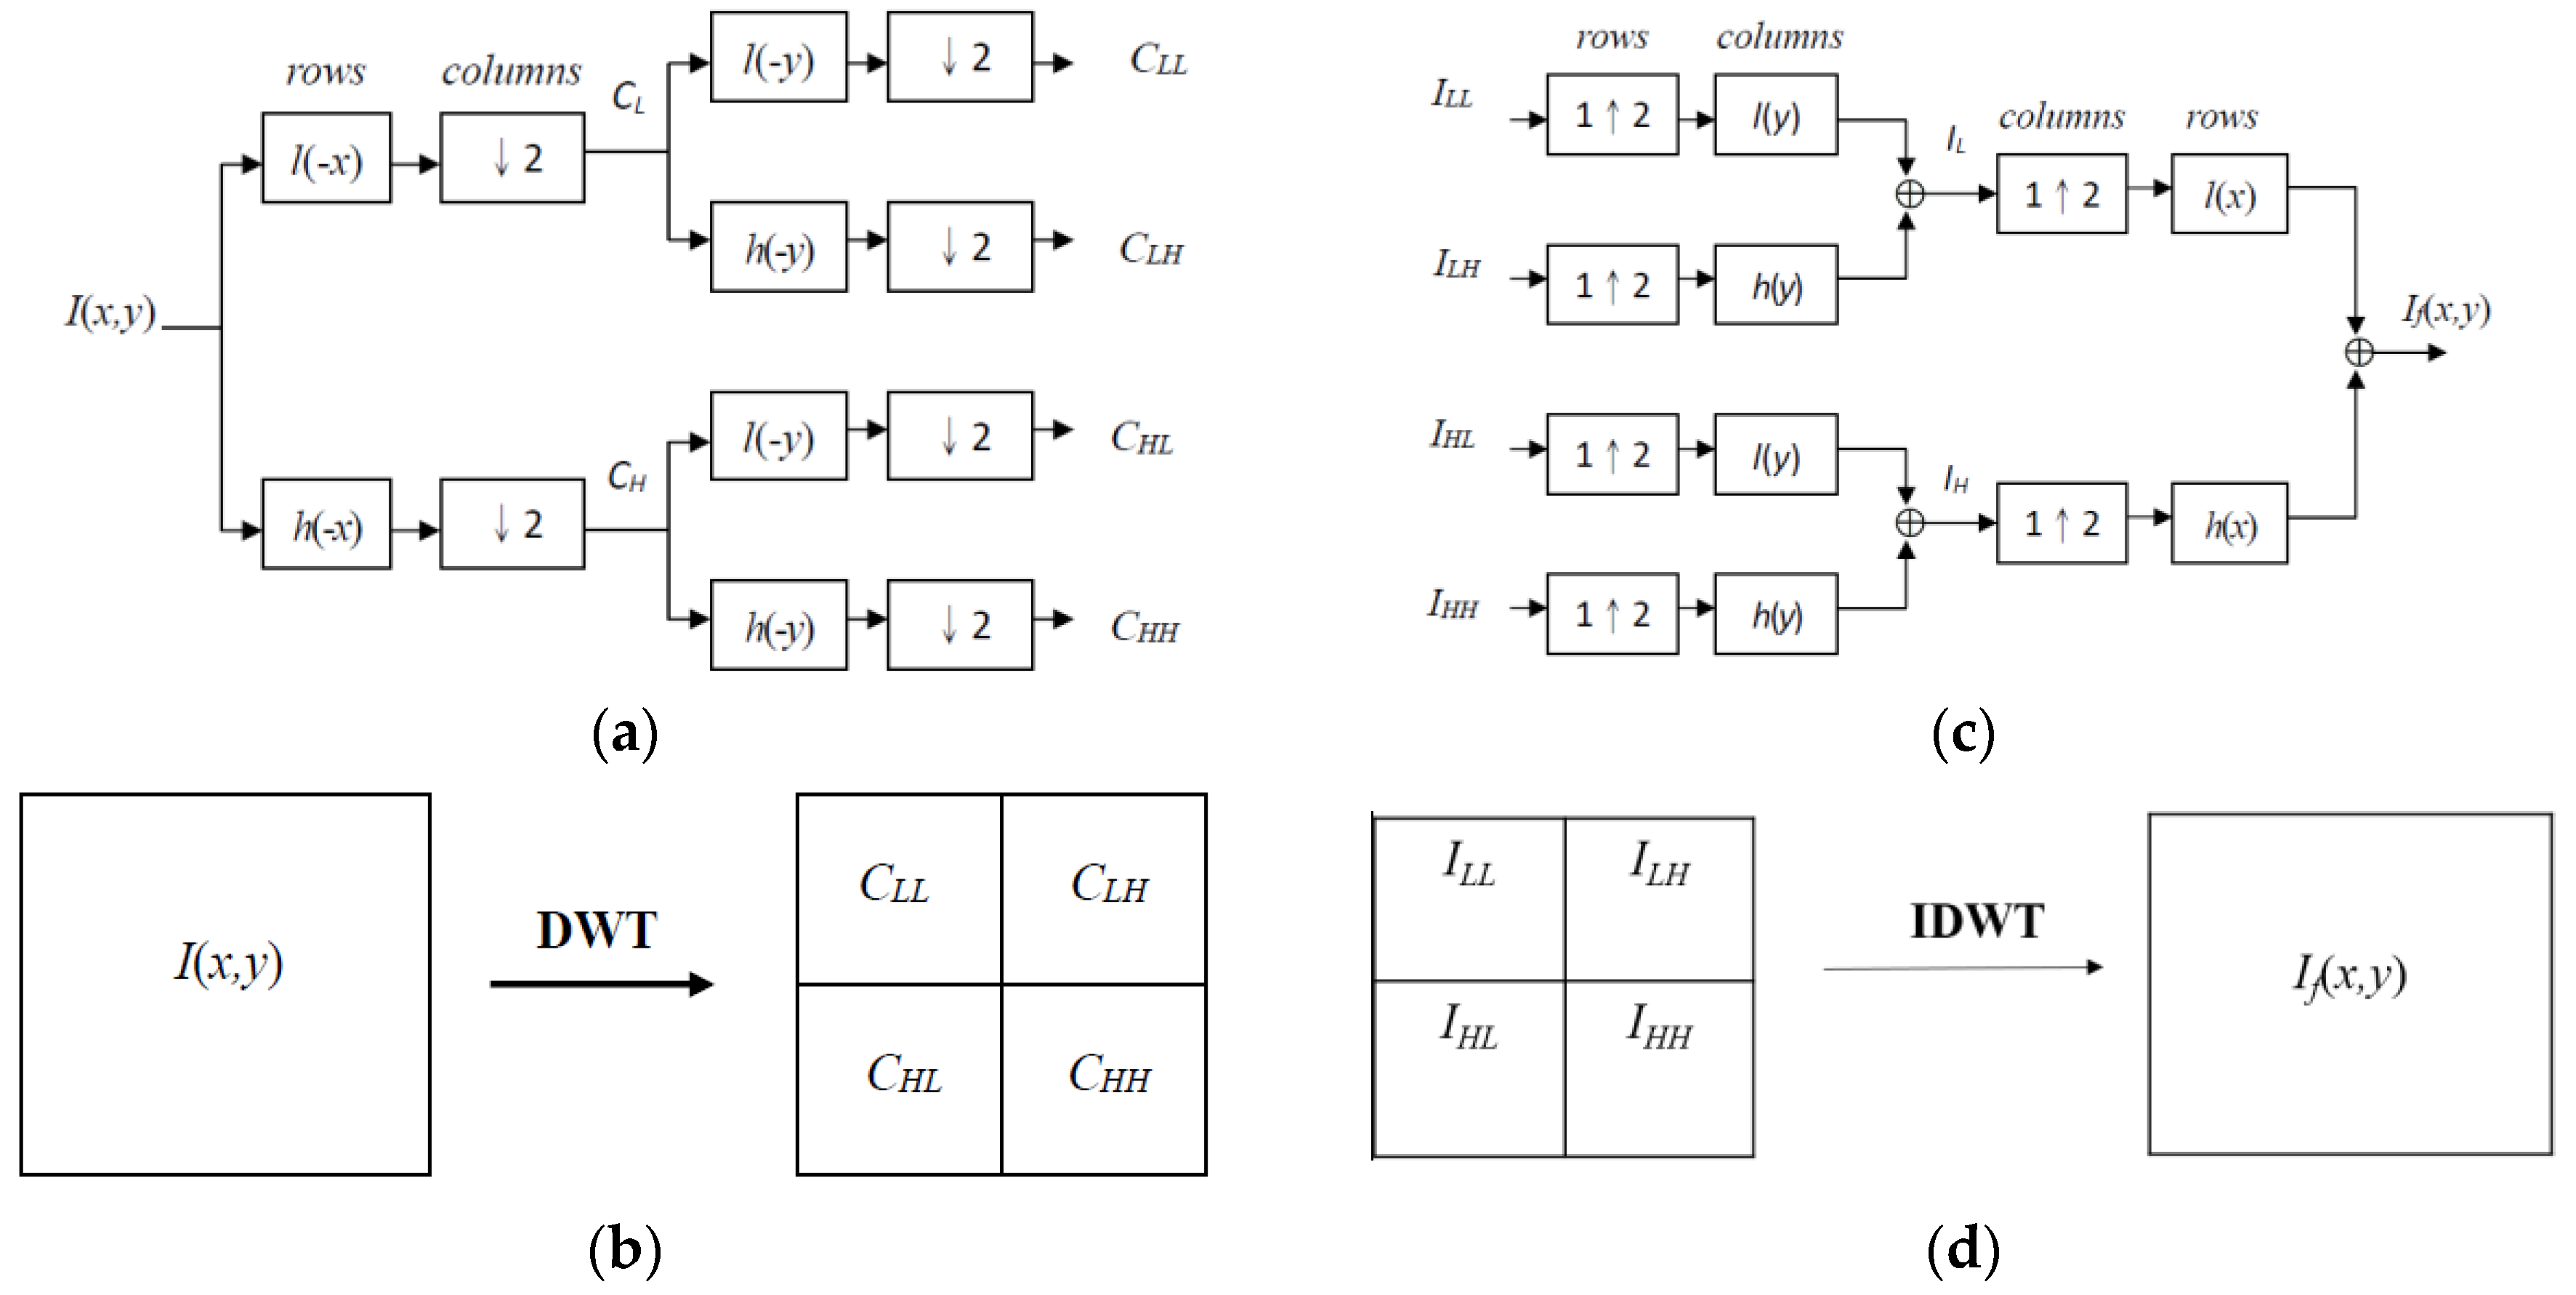
Wavelet-Based Image Fusion of Palmprints and Vein Patterns
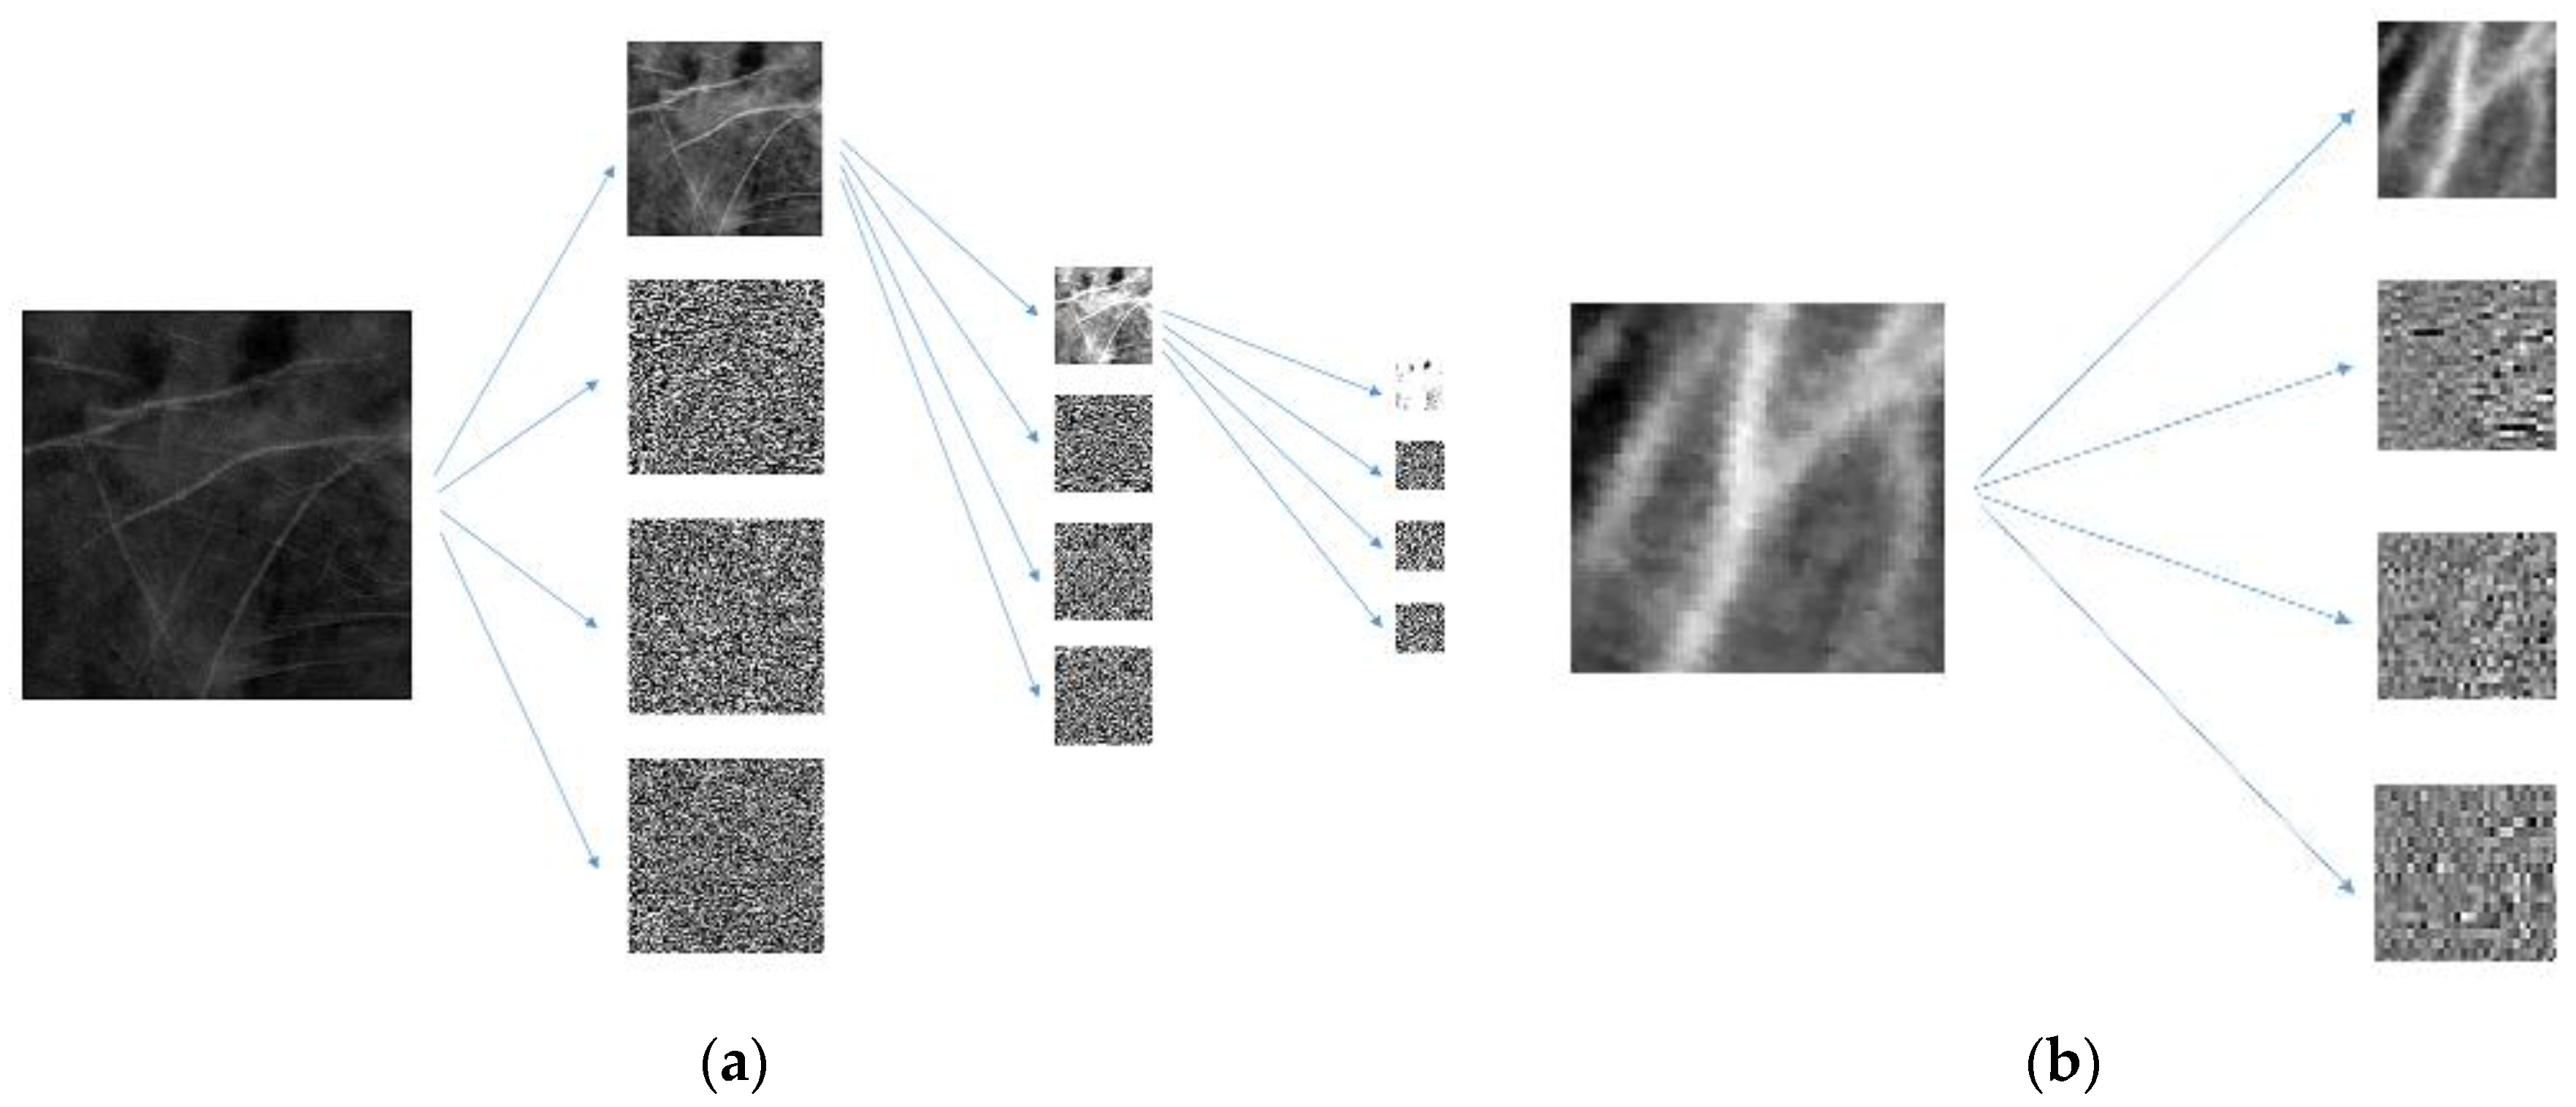
4. Feature Extraction
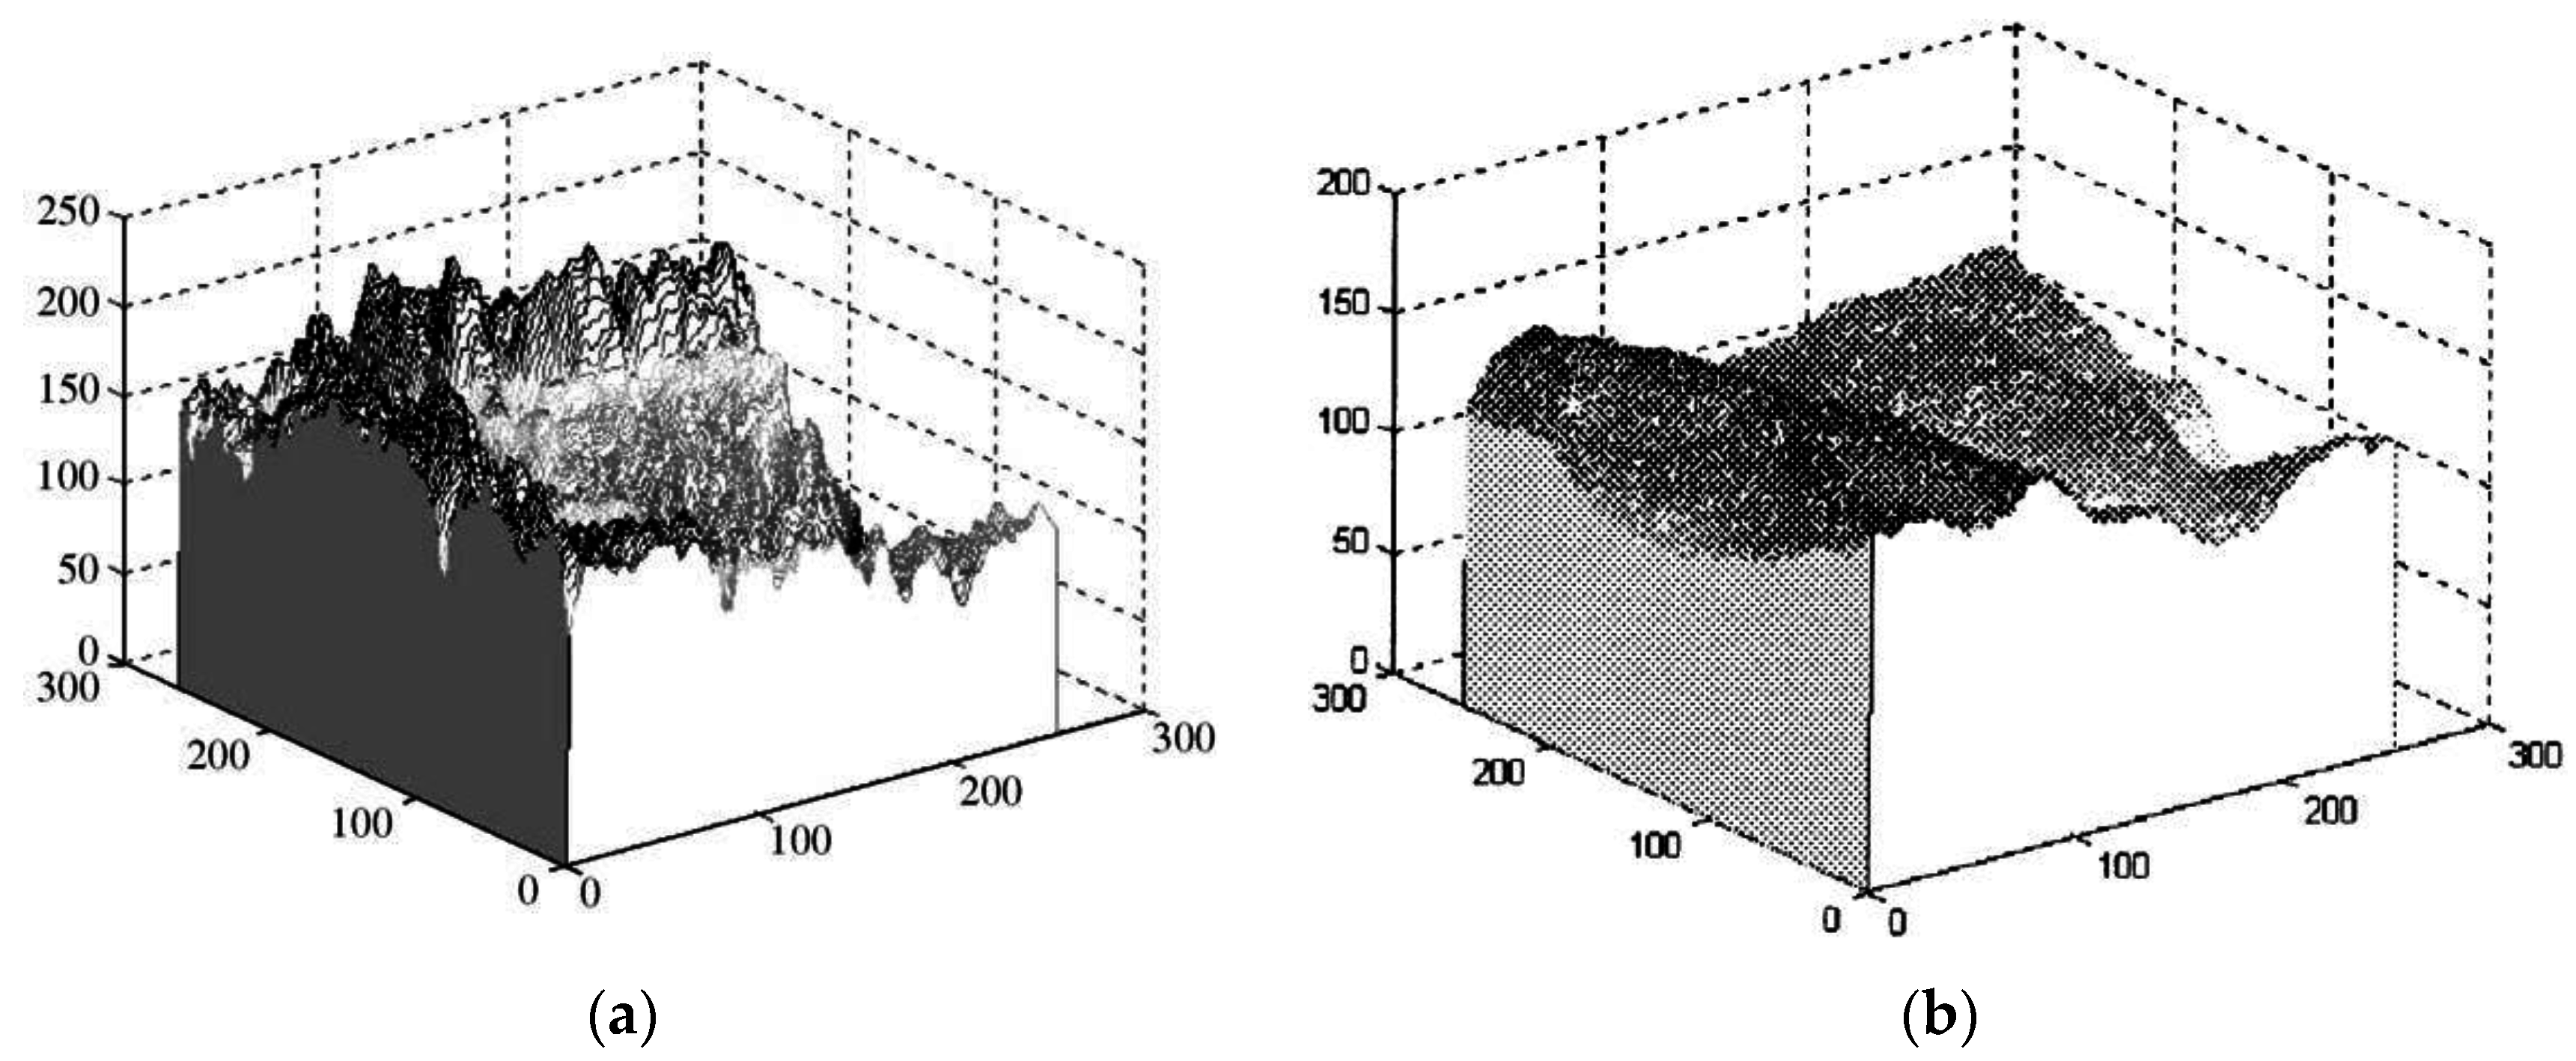
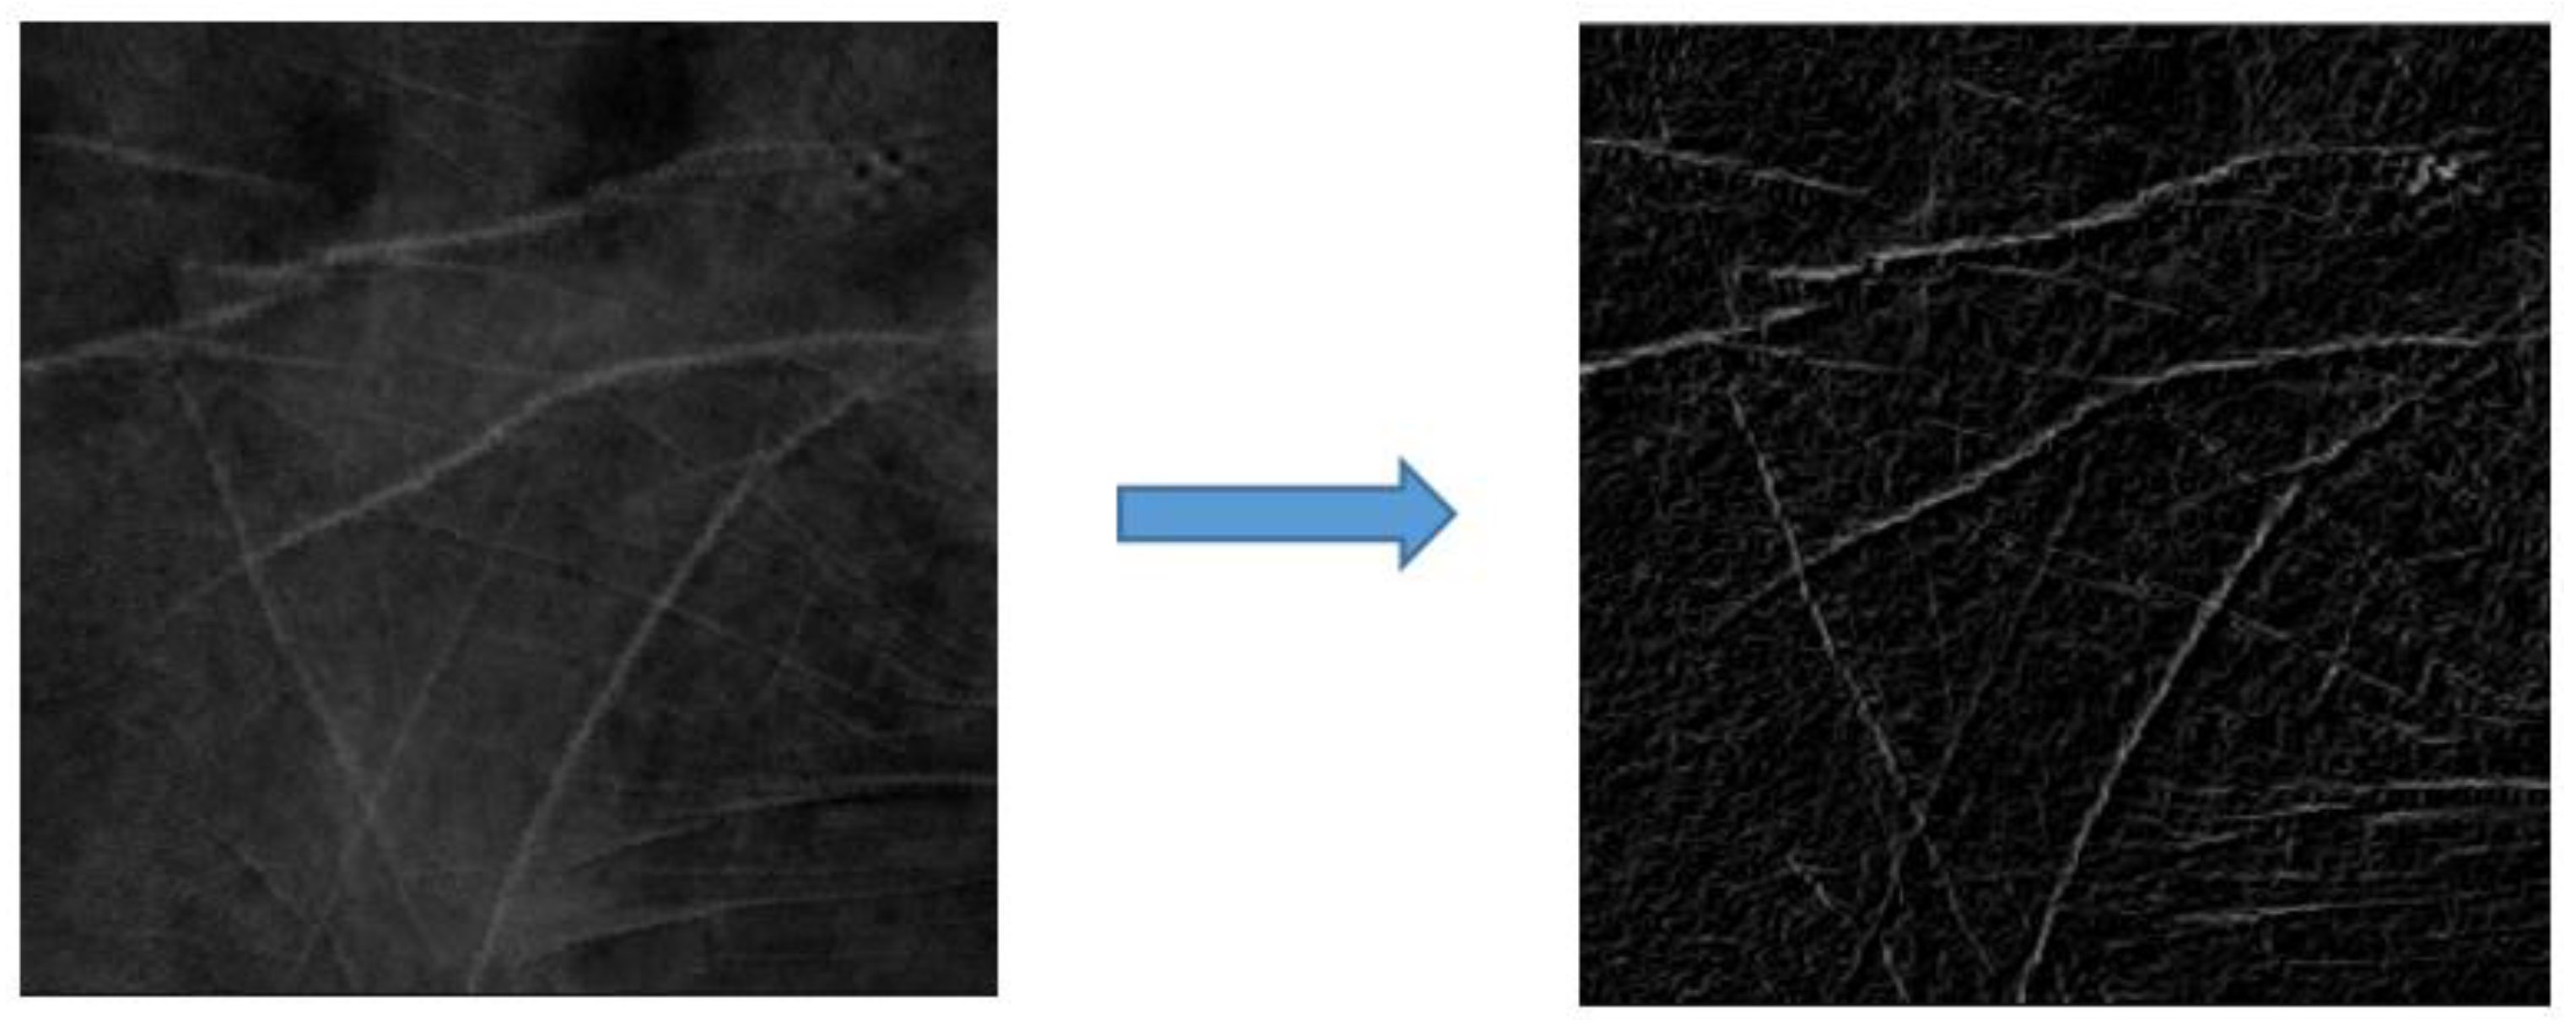
4.1. Enhancement of Line Features

4.2. LLF Extraction
- Step 1.
- Randomly initialize the threshold Th(1) (between the range of 0 to 255) to segment the image into the object and the background.
- Step 2.
- Apply Equations (8) and (9) to iteratively compute μB(i) and μo(i) as the means of the background and object gray levels at the i-th iteration, respectively. The threshold Th(i) used to segment images into the background and object is determined in Step 3 of the previous iteration by using Equation (10).
- Step 3.
- Set Th(i + 1) = (μB(i) + μo(i))/2
- Step 4.
- If Th(i + 1) = Th(i), then terminate; otherwise return to Step 2.
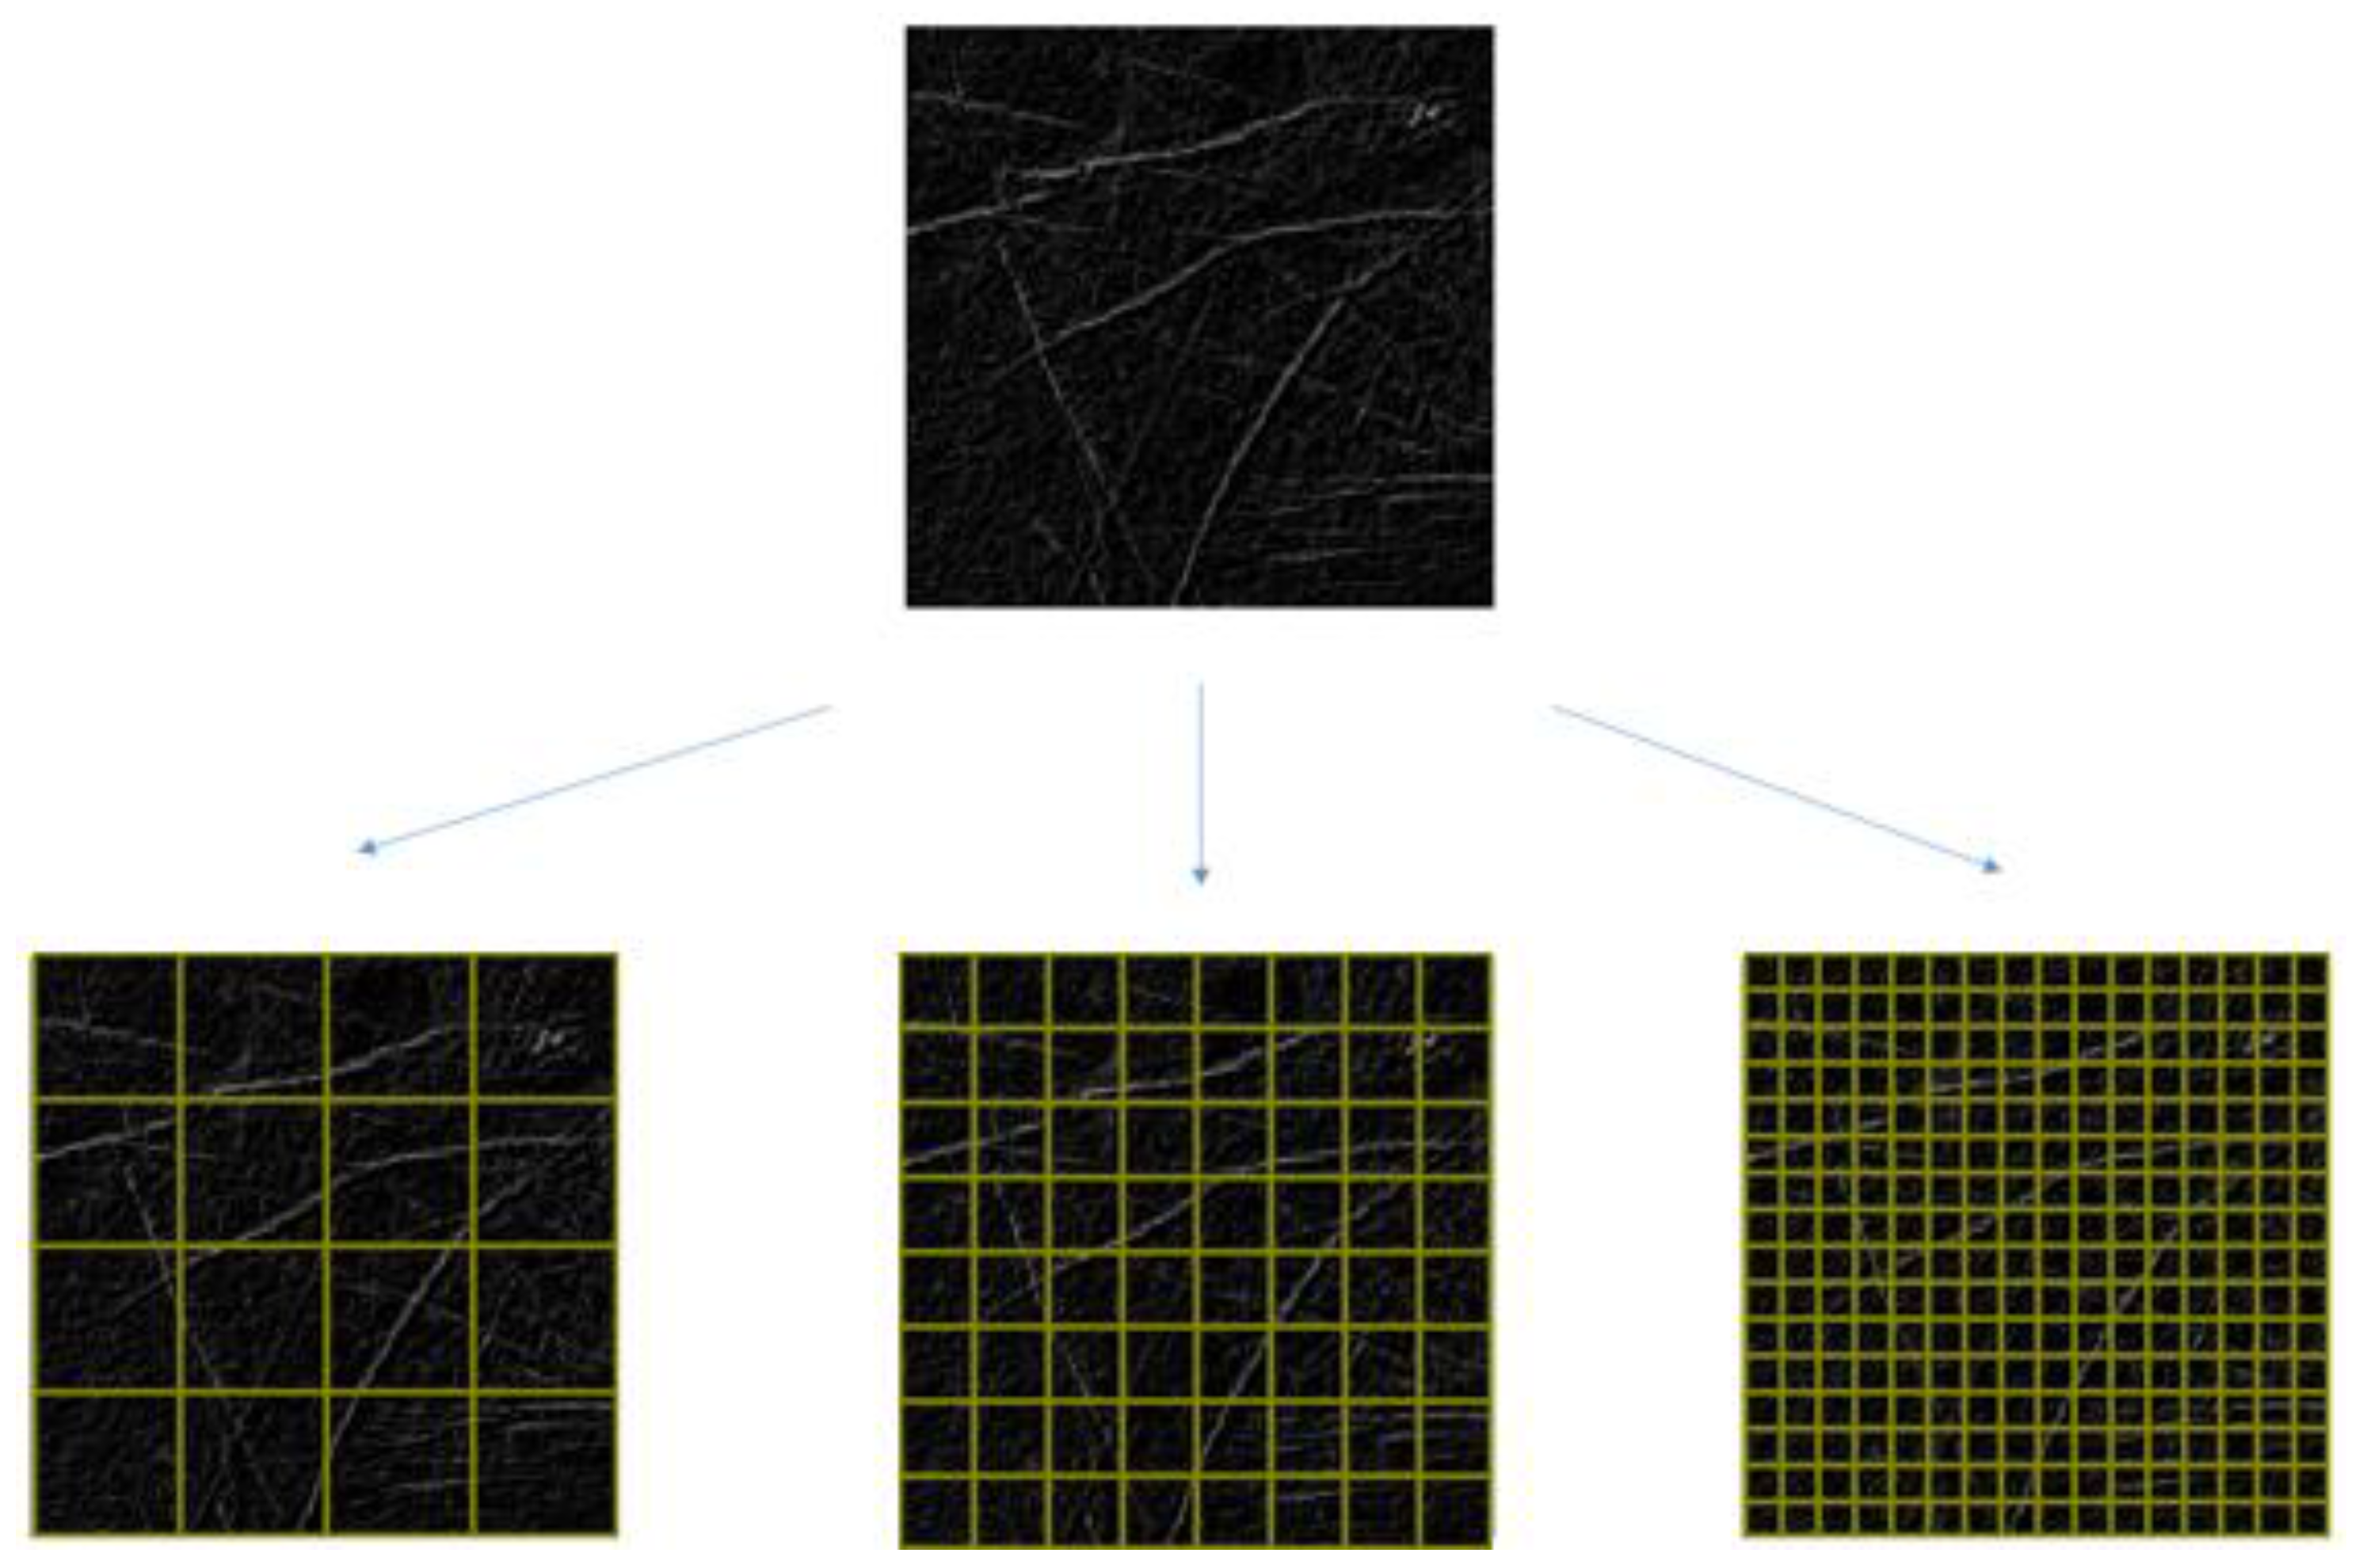
4.3. Multiresolution Analysis with a Multiresolution Filter
5. Verification
Support Vector Machine
6. Results
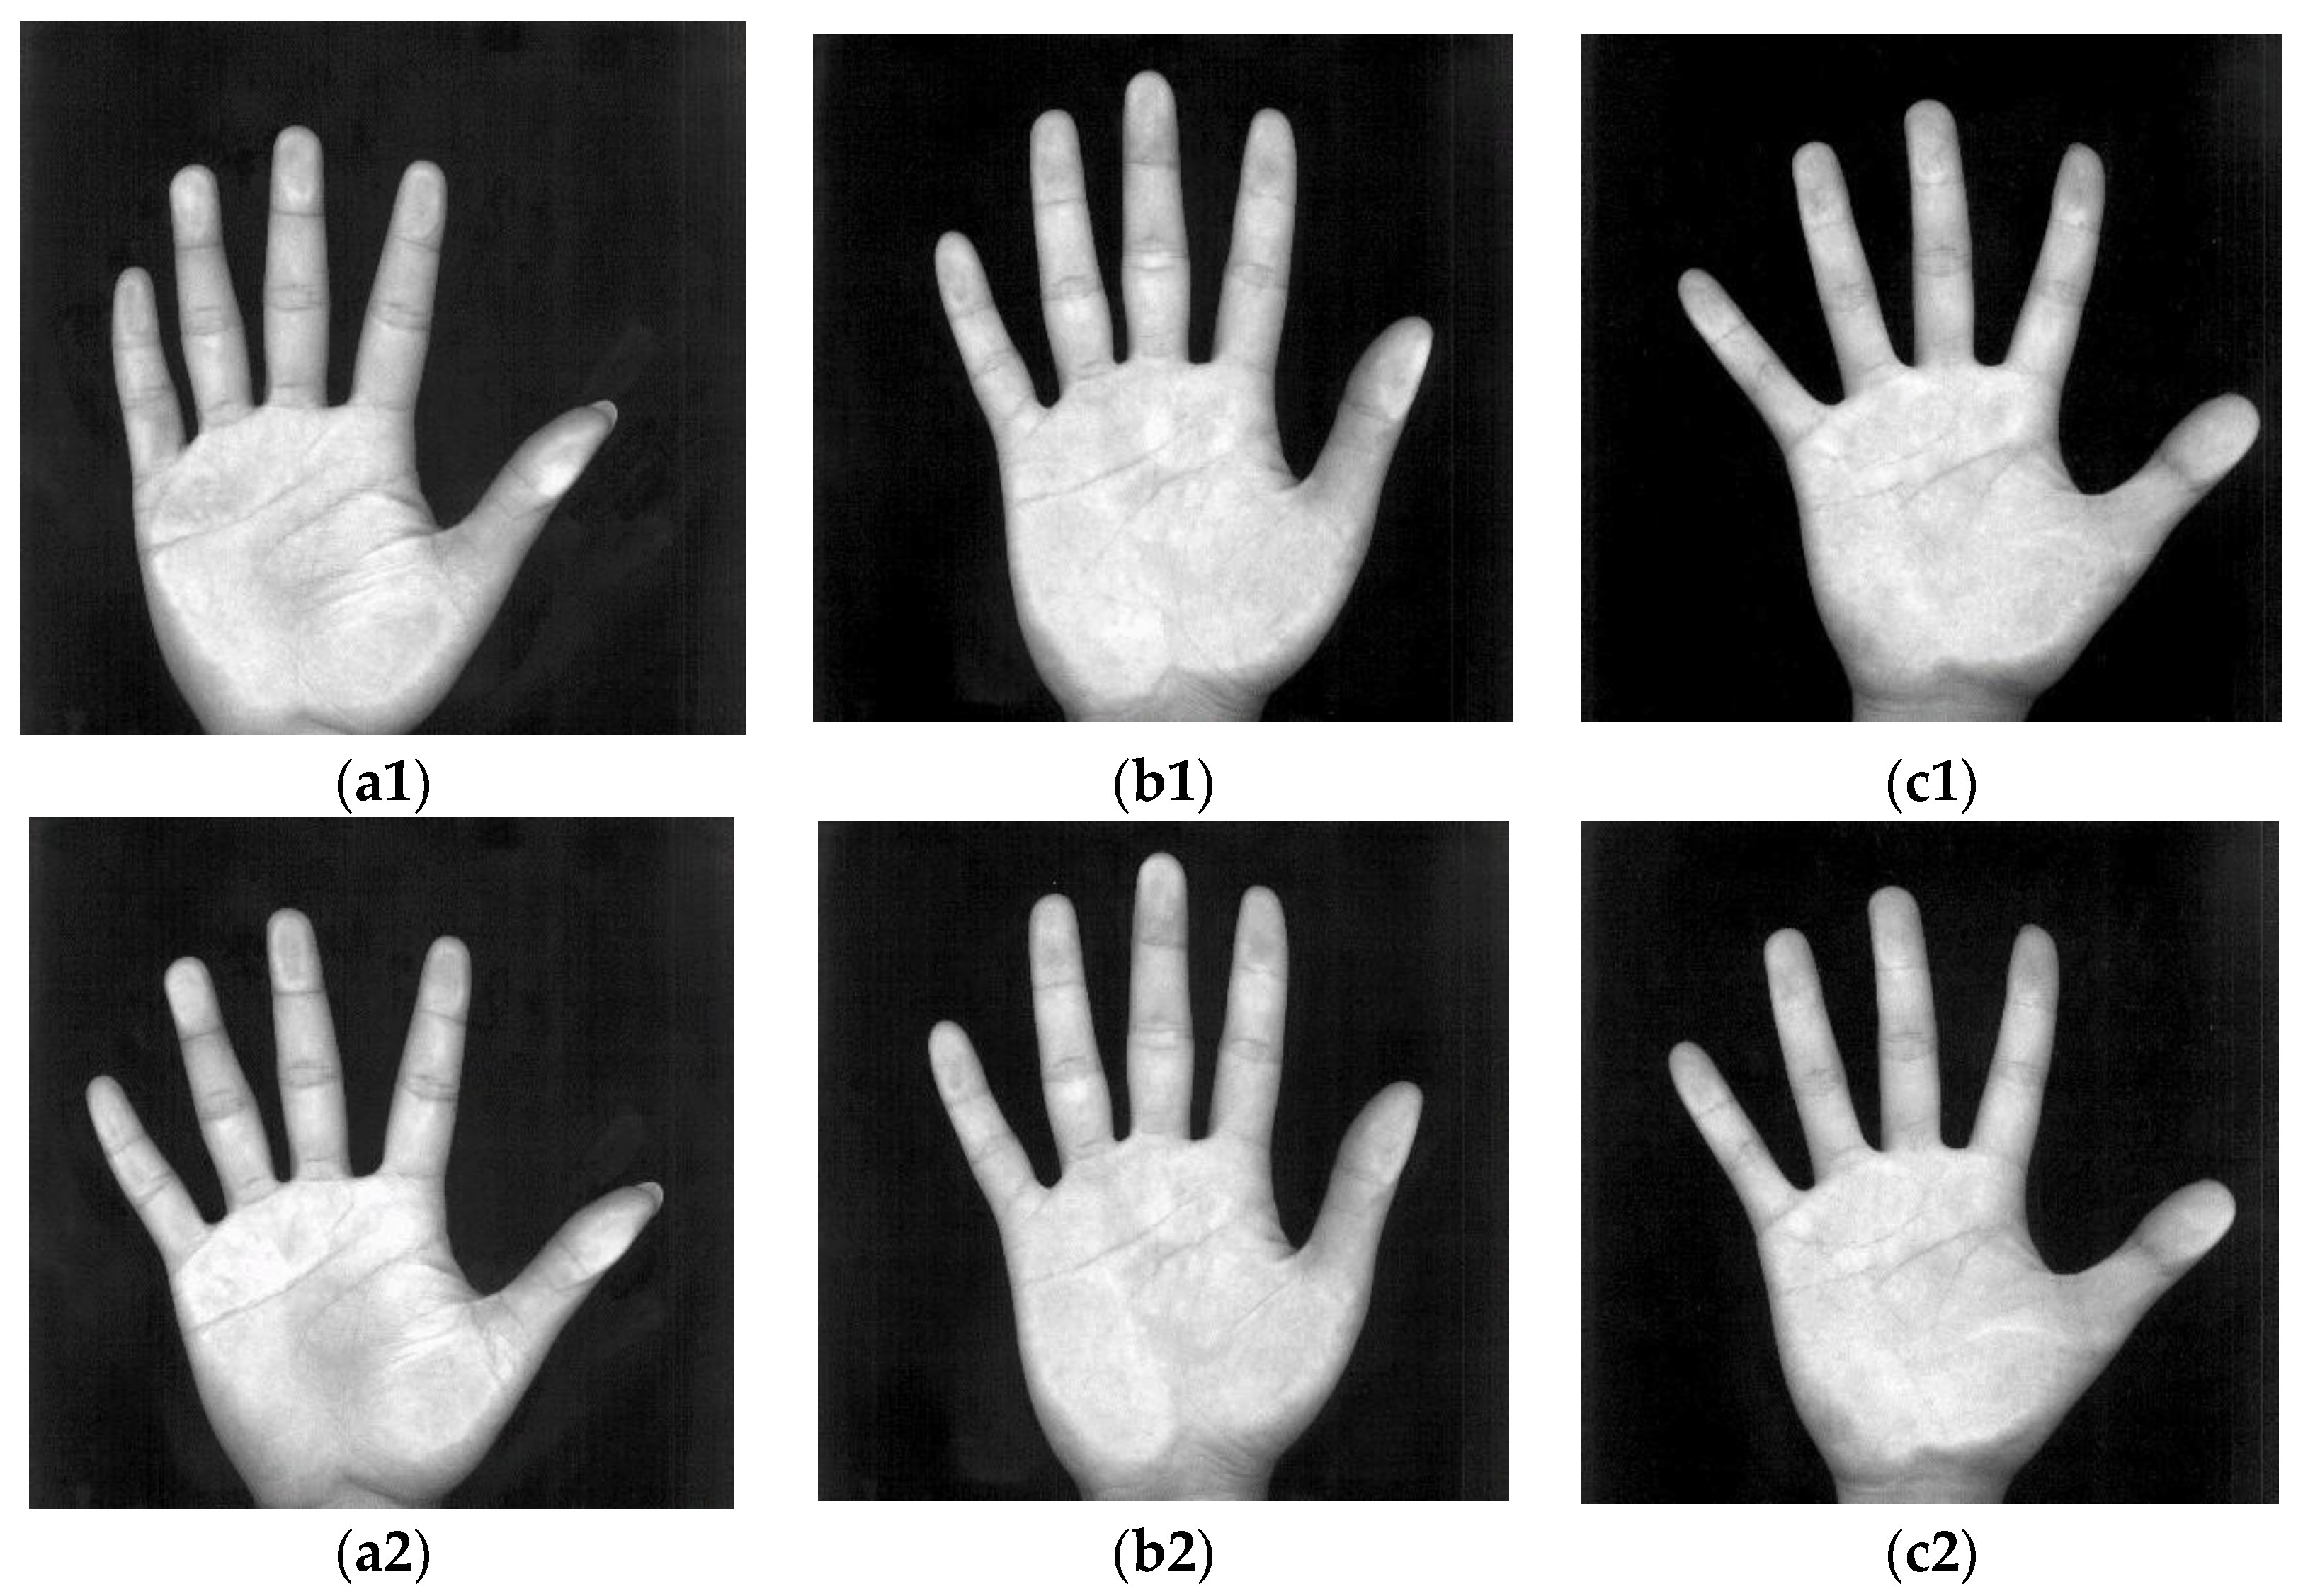
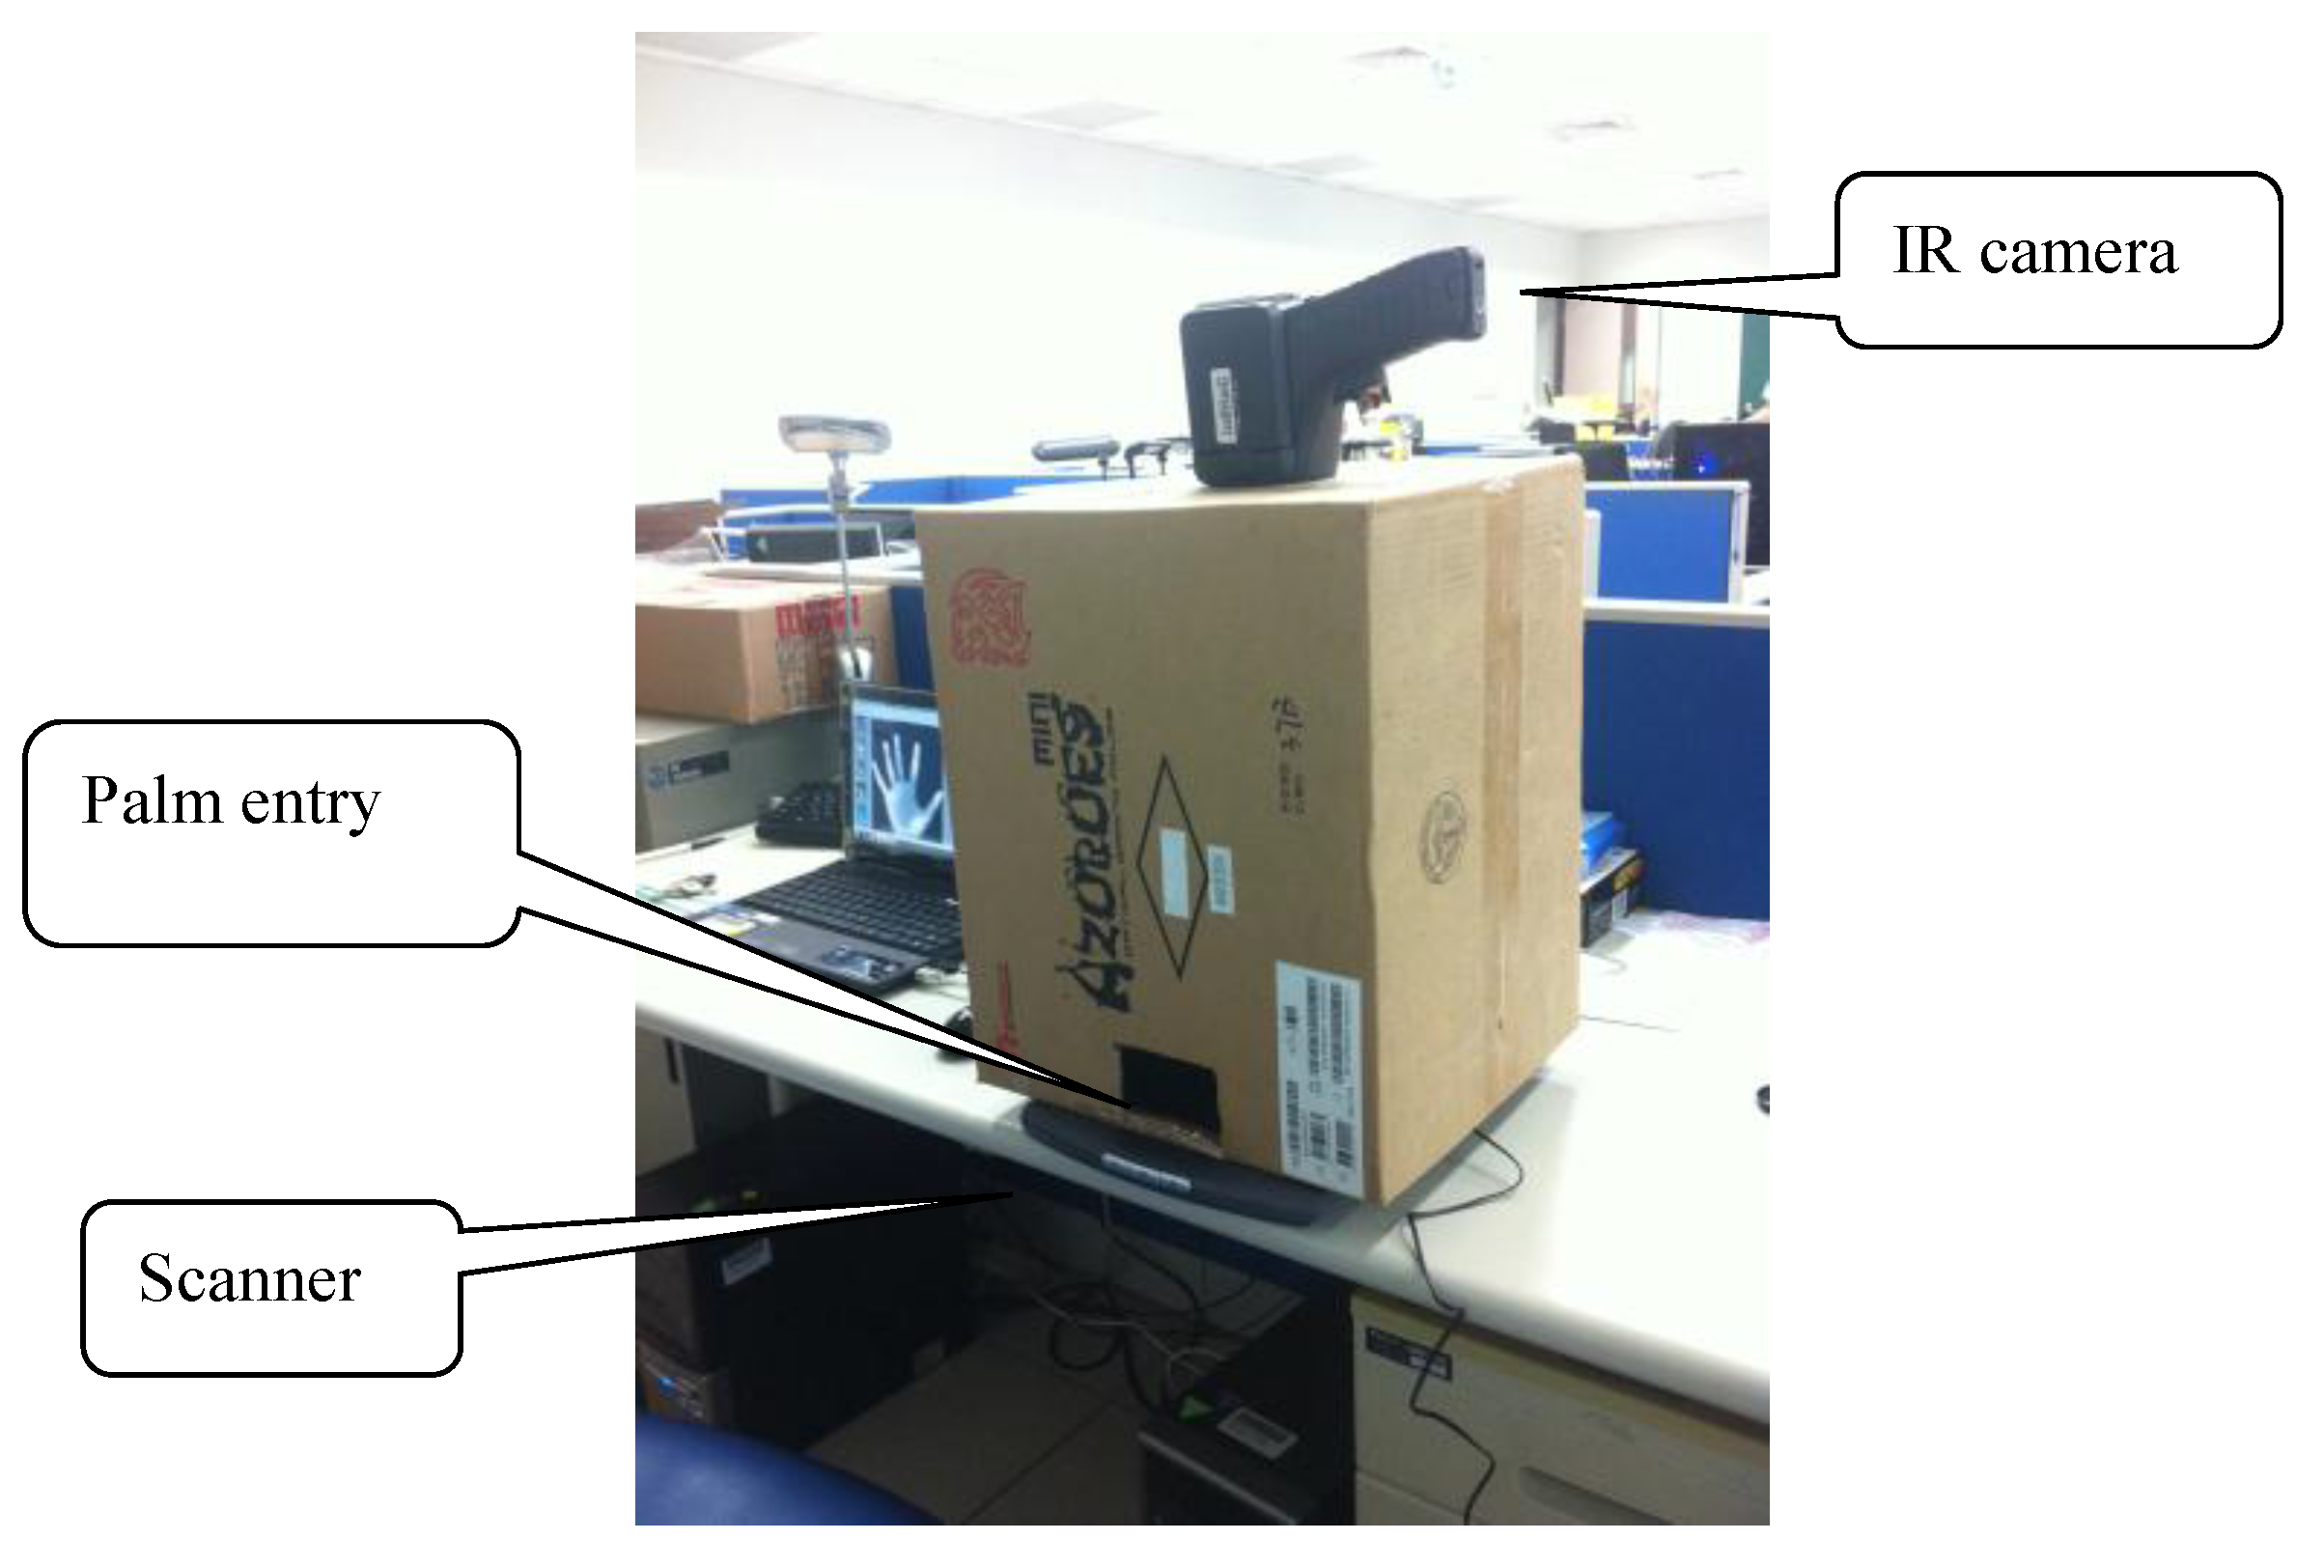
6.1. Data Collection
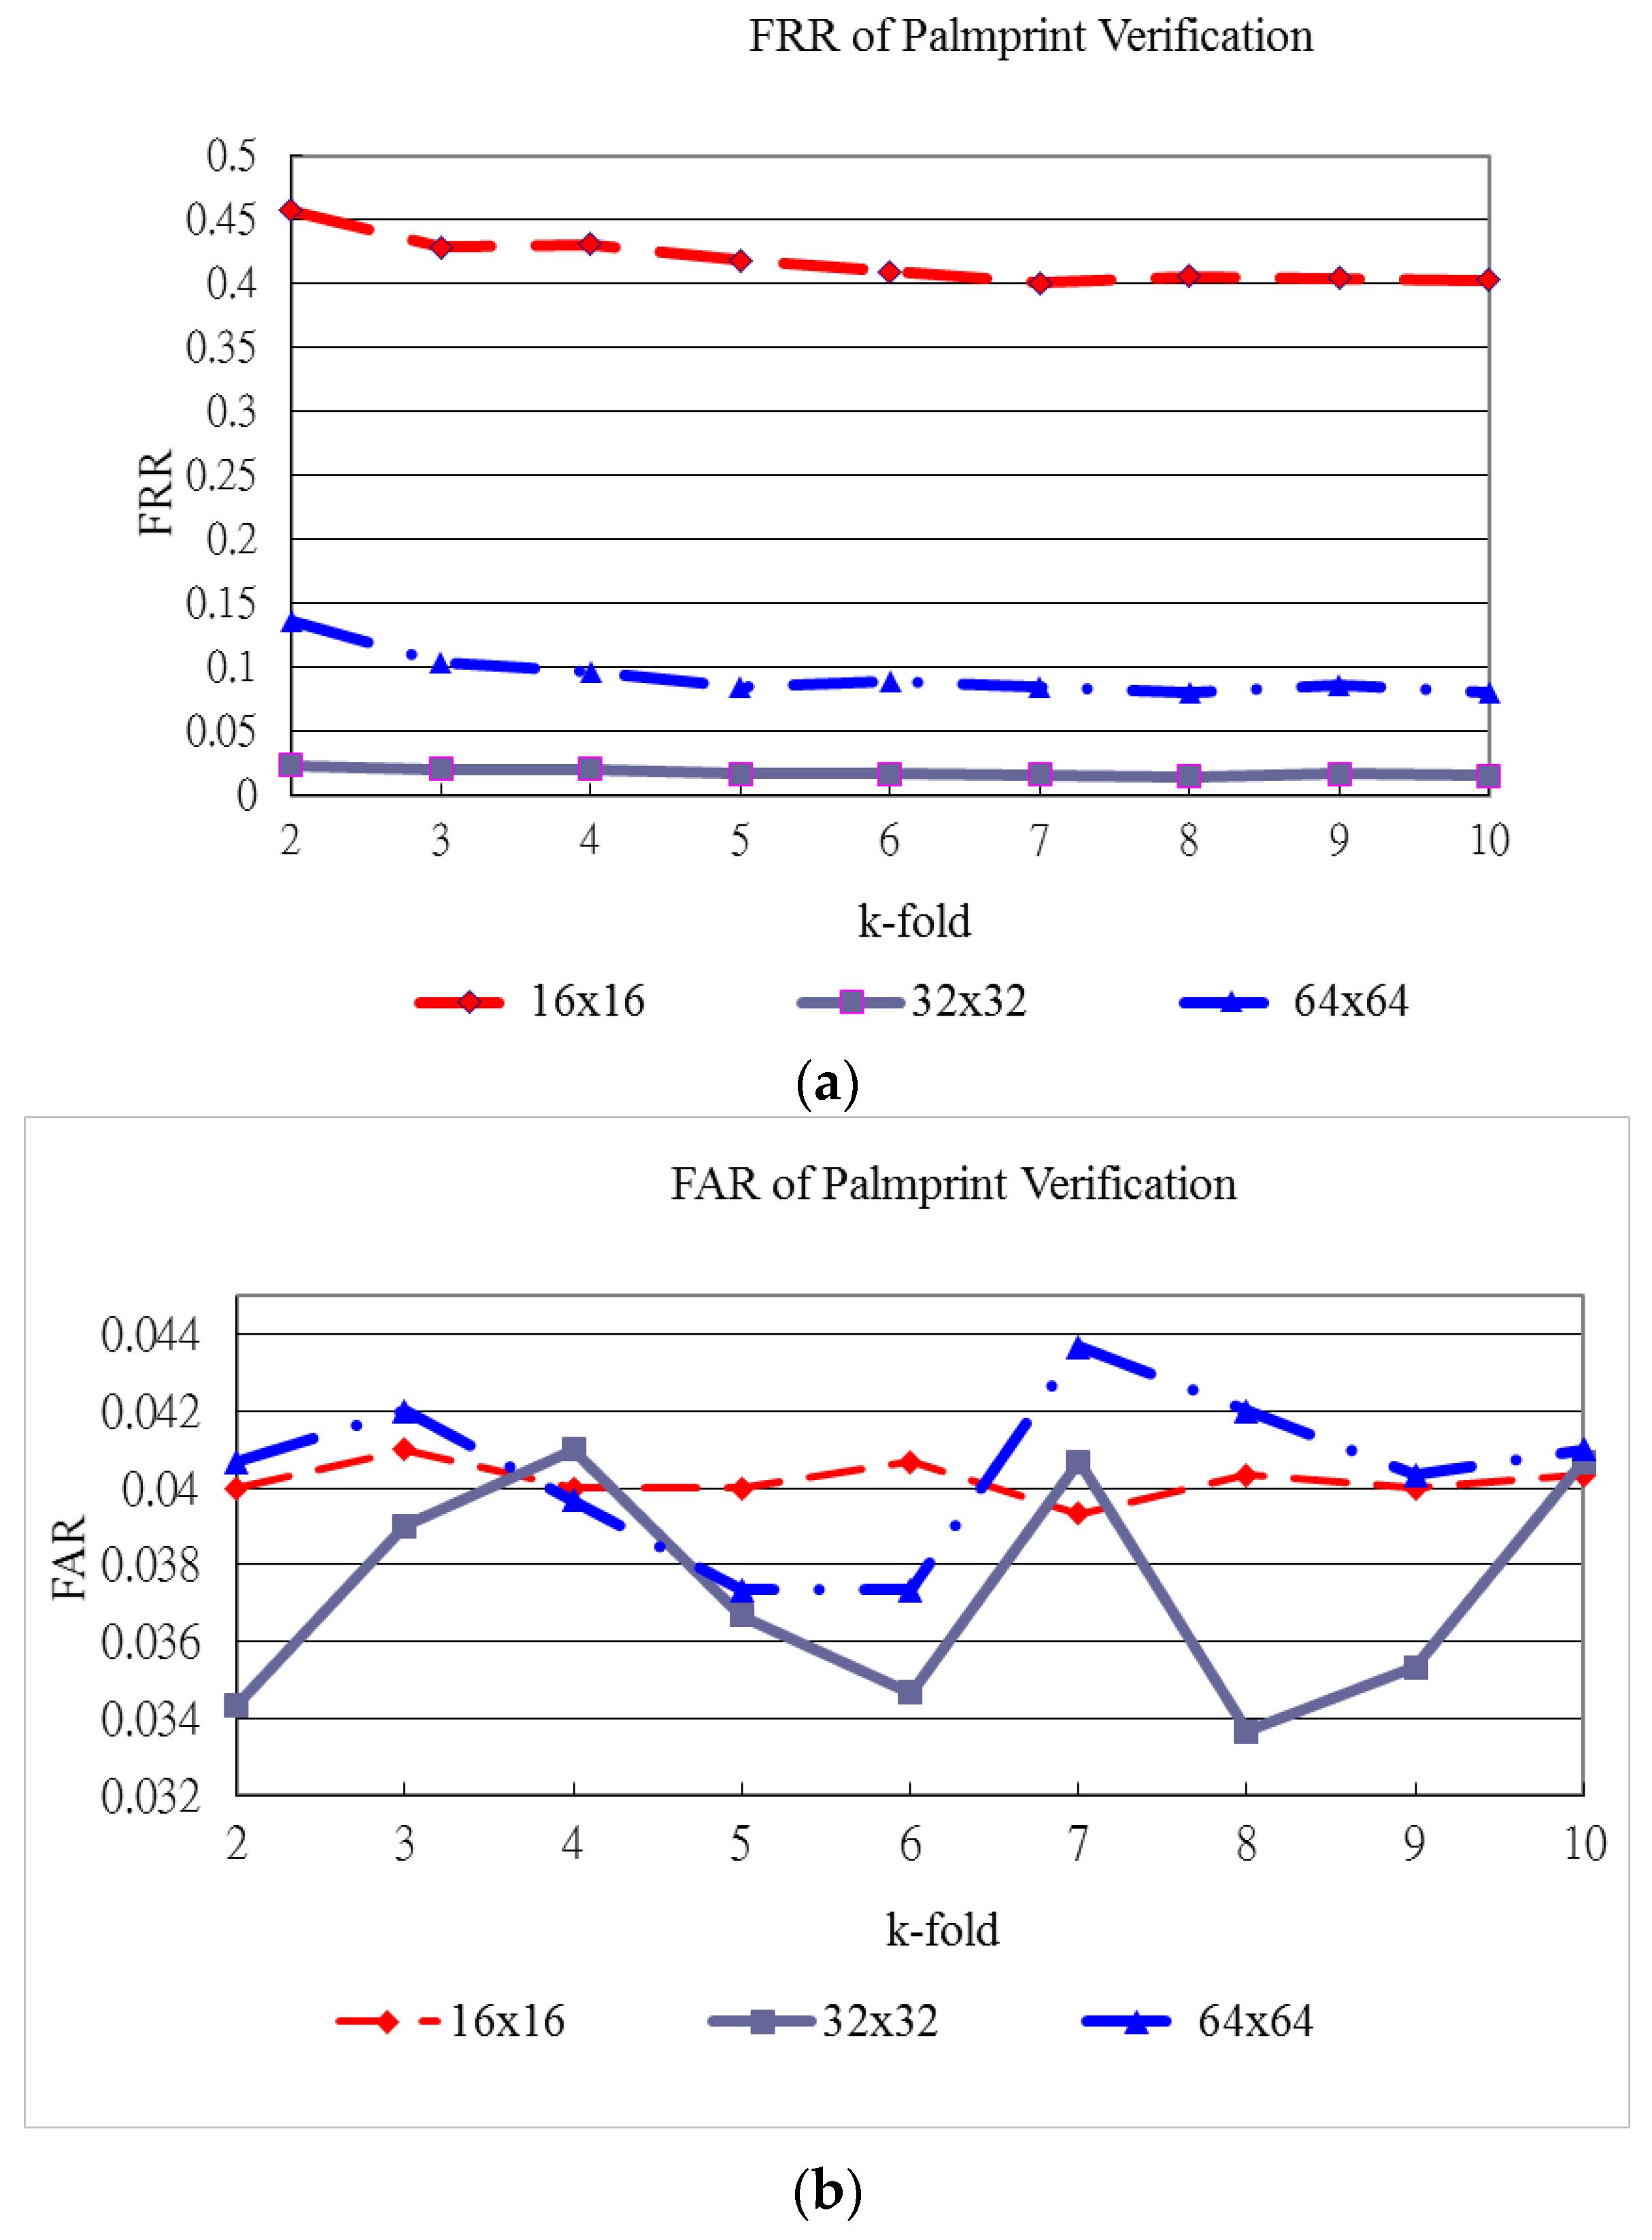
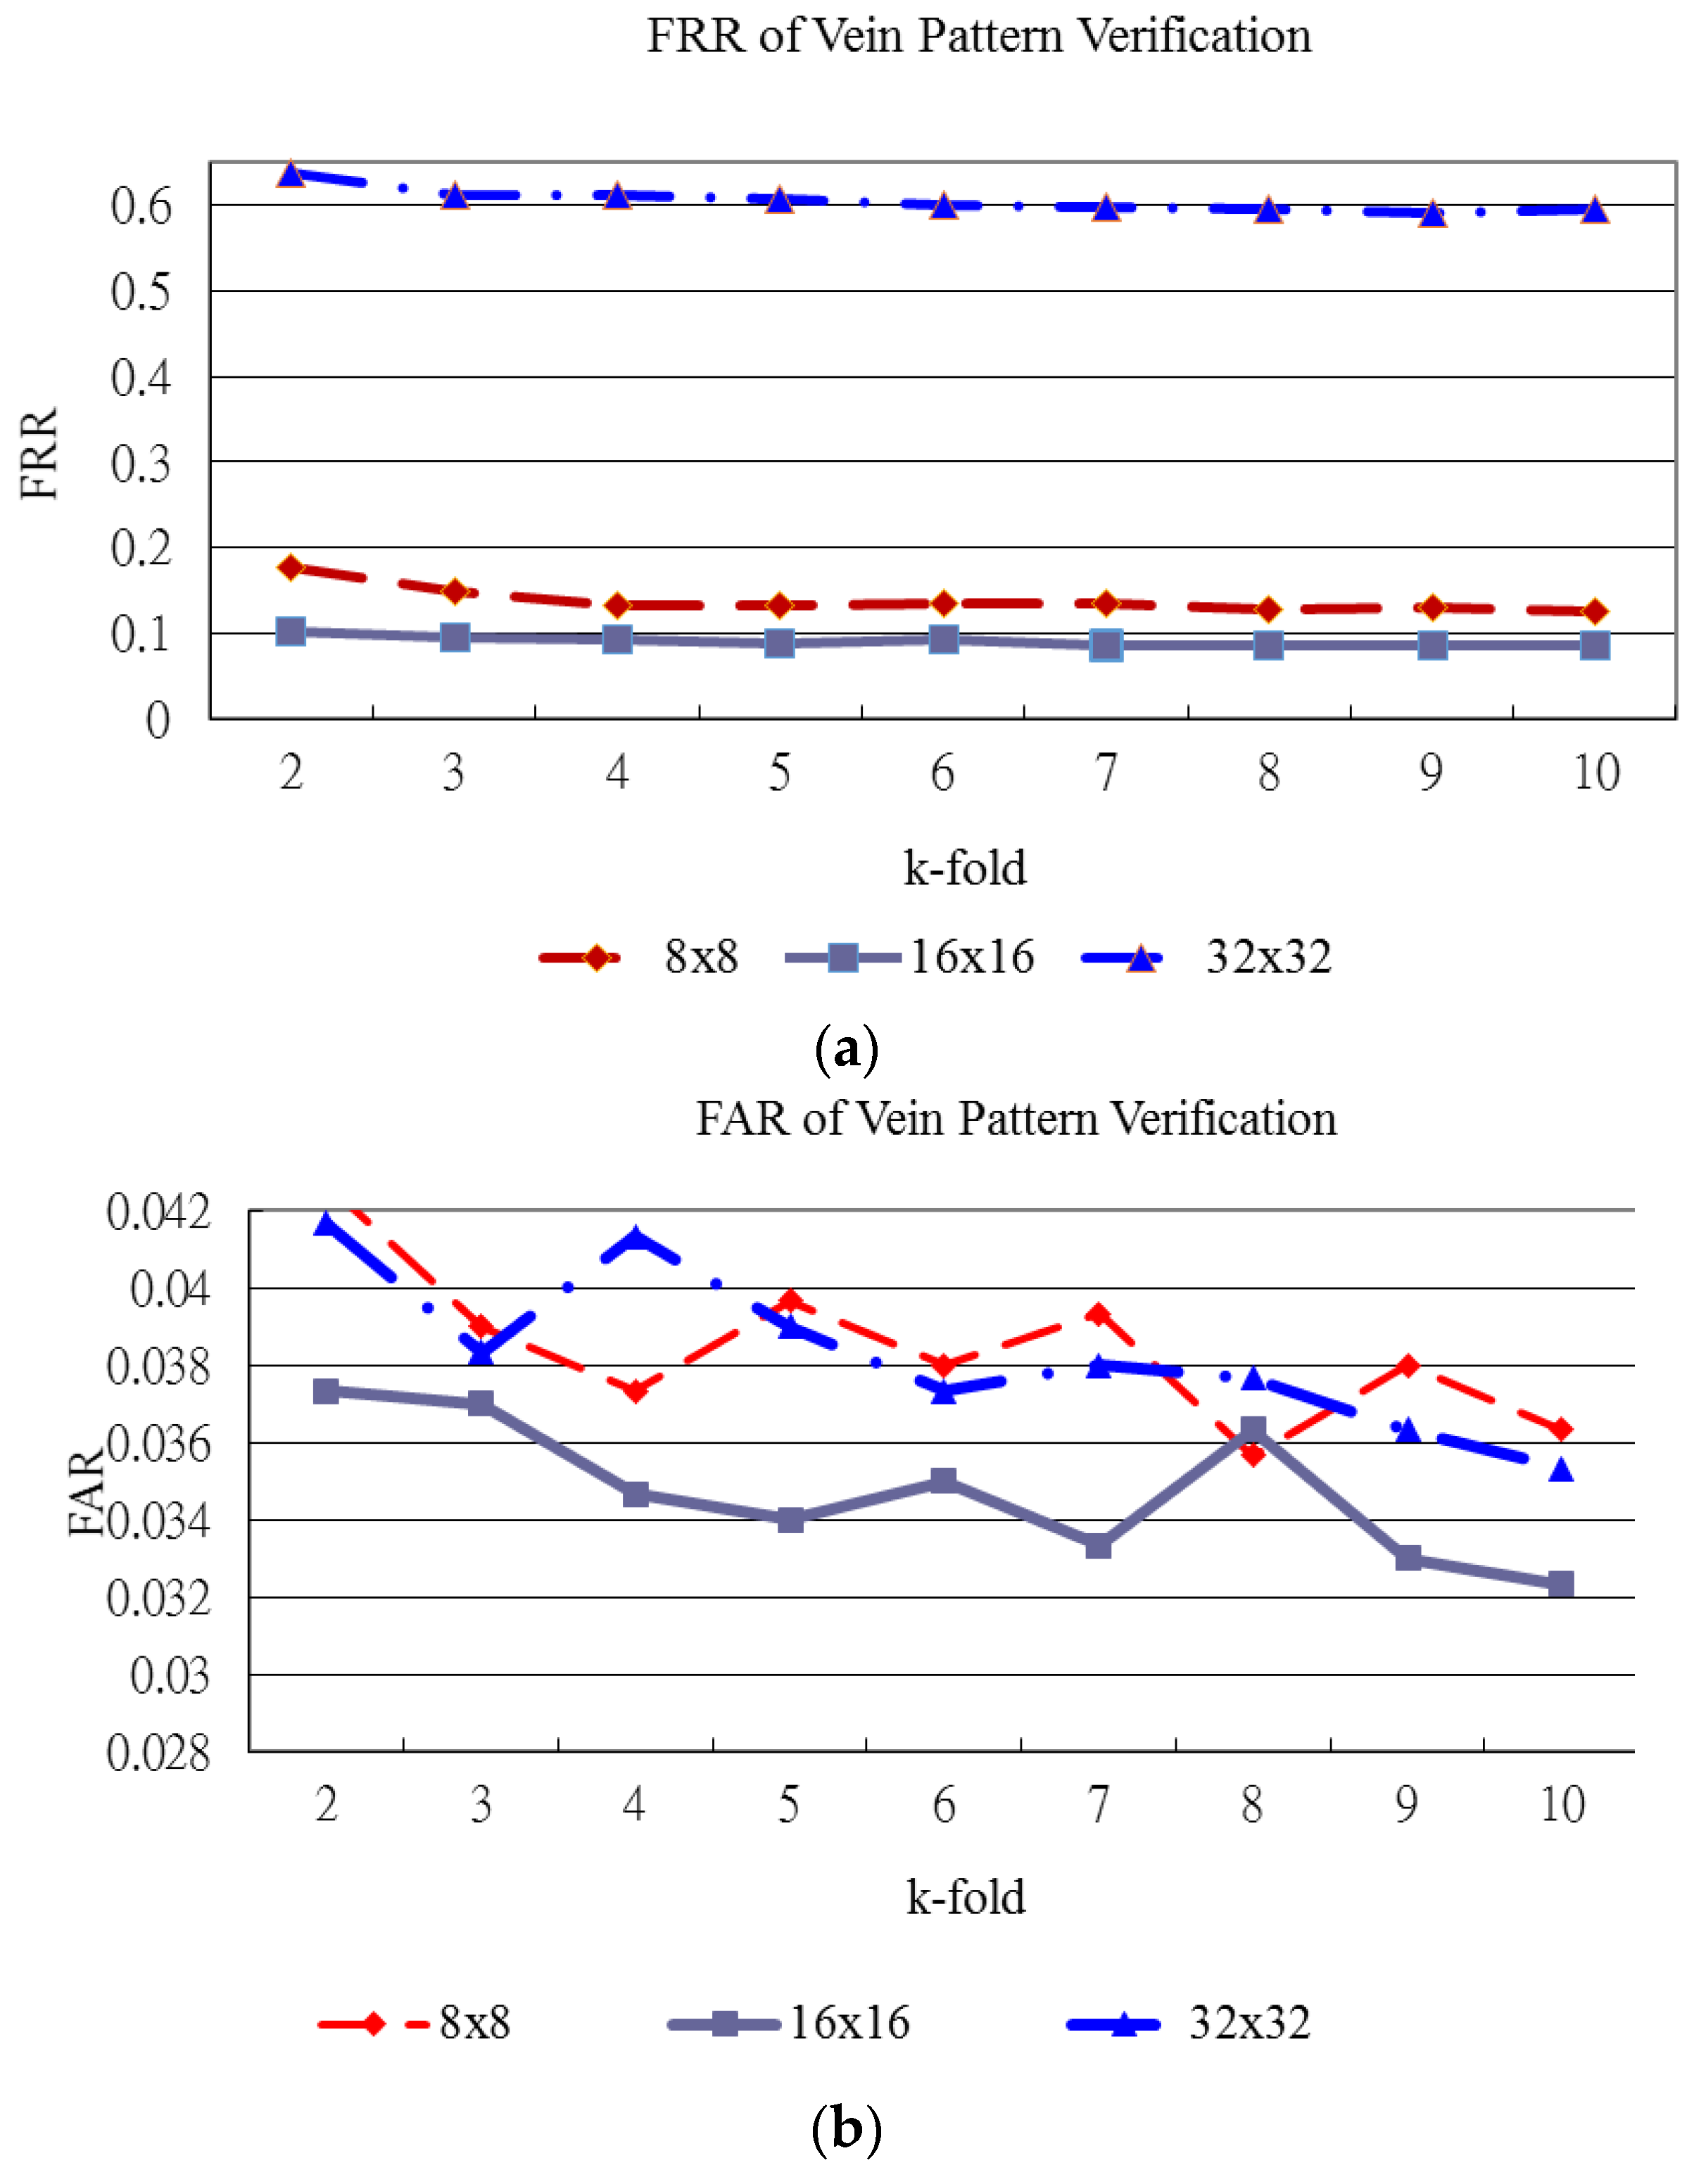
6.2. Experimental Results
| Document feeding mode | Flatbed |
| Light Source | LED |
| Optical Resolution (dpi) | Up to 2400 dpi |
| Grayscale mode | 8bits output |
| Color mode | 24bits output |
| Interface | USB 2.0 |
| Output Format: | JPEG image format |
| Infrared Detector: Uncooled Focal Plane Array (microbolometer) |
| Noise equivalent temperature difference (NETD) : 0.08 °C (at 30 °C, 60 frames/s.) |
| Accuracy: ±2 °C or ±2% of Reading, whichever is greater |
| Measuring Range: −40 °C to 500 °C |
| Spectral Range: 8 to 14 μm |
| Thermal Image resolution: 320(H) × 240(V) pixels |
| Field of View: 32°(H) × 24°(V) (standard lens F.L. = 14 mm) |
| Spatial Resolution (IFOV): 1.78 mrad |
| A/D Resolution: 8 bits |
| Operating Temperature/Humidity: −15 °C to 50 °C, <90% RH |
| Output Format: JPEG image format |


| Reference Paper | Database | Best Results | |||
|---|---|---|---|---|---|
| Number of Palm Images | Number of Palms | Accuracy Classification Rate (%) | FRR (%) | FAR (%) | |
| [2] (Dataset I) | 1300 | 100 | 0.49 | 0.50 | |
| [2] (Dataset II) | 5018 | 386 | 0.57 | 0.57 | |
| [4] | 100 | 95.00 | |||
| [5] | 3056 | 191 | 1.00 | 0.03 | |
| [10] | 9000 | 300 | 99.04 | ||
| [12] | 4800 | 160 | 99.25 | 0.75 | 0.69 |
| [13] | 1500 | 50 | 98.00 | 2.00 | 2.00 |
| [17] | 960 | 30 | 2.30 | 2.30 | |
| [19]* | 1440 | 120 | 0.32 | 0.10 | |
| [29] | 200 | 20 | 97.00 | ||
| [30] | 200 | 100 | 91.00 | ||
| [31] | 7200 | 200 | 1.64 | 1.64 | |
| [32] | 100 | 99 | 1.00 | 0.29 | |
| Proposed method | 6000 | 100 | 98.8 | 1.20 | 1.56 |
| Proposed Method | Reference [19] | |||
|---|---|---|---|---|
| Used image | Palmprint image | Palm-dorsum vein image | Palmprint image | Palm vein image |
| Image captured from | Palm | Palm-drosum | Palm | Palm |
| Capturing device | Scanner | Infrared camera | camera | Near infrared camera |
| Capturing scenarios | Peg-free | Peg-free | Use docking device | Use docking device |
| Sensor material | CMOS | Microbolometer | CMOS | CMOS |
| Sensor type | Linear | Focal Plane Array | Focal Plane Array | Focal Plane Array |
| Sensor spectral response | 380–750 nm | 8–14 μm | 380–750 nm | 750–1000 nm |
| Imaging mechanism | Detect reflected visible spectrum | Detect radiated IR spectrum | Detect reflected visible spectrum | Detect reflected NIR spectrum |
| Image size | 845 × 829 | 320 × 240 | 768 × 576 | 768 × 576 |
7. Conclusions
Acknowledgments
Author Contributuions
Conflicts of Interest
References
- Jain, A.K.; Bolle, R.; Pankanti, S. Biometrics Personal Identification in Network Society, 1st ed.; Springer Science & Business Media, Inc.: New York, NY, USA, 2006; pp. 87–102. [Google Scholar]
- Huang, D.S.; Jia, W.; Zhang, D. Palmprint verification based on principal lines. Pattern Recognit. 2008, 41, 1316–1328. [Google Scholar]
- Han, C.C.; Chang, P.C.; Hsu, C.C. Personal identification using hand geometry and palm-print. In Proceedings of the Fourth Asian Conference on Computer Vision, Taipei, Taiwan, 8–11 January 2000; pp. 747–752.
- Zhang, D.; Shu, W. Two novel characteristics in palm print verification: Datum point invariance and line feature matching. Pattern Recognit. 1999, 32, 691–702. [Google Scholar]
- Lu, G.; Zhang, D.; Wang, K. Palmprint recognition using eigenpalms features. Pattern Recognit. Lett. 2003, 24, 1463–1467. [Google Scholar] [CrossRef]
- Kong, A.; Zhang, D. Competitive coding scheme for palmprint verification. In Proceedings of the 17th International Conference on Pattern Recognition, Cambridge, UK, 23–26 August 2004; pp. 520–523.
- Sun, Z.; Tan, T.; Wang, Y.; Li, S.Z. Ordinal palmprint represention for personal identification. In Proceedings of the IEEE Computer Society Conference on Computer Vision and Pattern Recognition, San Diego, CA, USA, 20–25 June 2005; pp. 279–284.
- Kong, W.K.; Zhang, D. Palmprint texture analysis based on low-resolution images for personal authentication. In Proceedings of the 16th International Conference on Pattern Recognition, Quebec City, QC, Canada, 11–15 August 2002; pp. 807–810.
- Zhang, Y.; Sun, D.; Qiu, Z. Hand-based single sample biometric recognition. Neural Comput. Appl. 2012, 21, 1835–1844. [Google Scholar] [CrossRef]
- Lin, C.L.; Cheng, H.Y.; Fan, K.C.; Lu, C.W.; Juan, C.J.; Kuo, C.W. Bi-feature verification for palmprint images captured in peg-less scenarios. Int. J. Pattern Recognit. Artif. Intell. 2013, 27. [Google Scholar] [CrossRef]
- Lu, C.W.; Lin, C.L.; Fan, K.C.; Cheng, H.Y.; Juan, C.J. Palmprint Verification for Images Captured in Peg-Less Scenarios. Appl. Mech. Mater. 2013, 284–287. [Google Scholar] [CrossRef]
- Lin, C.L.; Chuang, T.C.; Fan, K.C. Palmprint Verification Using Hierarchical Decomposition. Pattern Recognit. 2005, 38, 2639–2652. [Google Scholar] [CrossRef]
- Han, C.C.; Cheng, H.L.; Lin, C.L.; Fan, K.C. Personal Authentication Using Palmprint Features. Pattern Recognit. 2003, 36, 371–381. [Google Scholar] [CrossRef]
- MacGregor, P.; Welford, R. Veincheck: Imaging for security and personnel identification. Adv. Imaging 1991, 6, 52–56. [Google Scholar]
- Im, S.K.; Park, H.M.; Kim, S.W.; Chung, C.K.; Choi, H.S. Improved vein pattern extracting algorithm and its implementation. In Proceedings of the International Conference on Consumer Electronics, Los Angles, CA, USA, 13–15 June 2000; pp. 2–3.
- Mirmohamadsadeghi, L.; Drygajlo, A. Palm Vein Recognition with Local Binary Patterns and Local Derivative Patterns. In Proceedings of the International Joint Conference on Biometrics, Washington, DC, USA, 11–13 October 2011; pp. 1–6.
- Lin, C.L.; Fan, K.C. Biometric Verification Using Thermal Images of Palm-Dorsa Vein-Patterns. IEEE Trans. Circuits Syst. Video Technol. 2004, 14, 199–213. [Google Scholar] [CrossRef]
- Shahin, M.; Badawi, A.; Kamel, M. Biometric Authentication Using Fast Correlation of Near Infrared Hand Vein Patterns. Int. J. Biol. Med. Sci. 2007, 2, 141–148. [Google Scholar]
- Wang, J.G.; Yau, W.Y.; Suwandy, A.; Sung, E. Person recognition by fusing palmprint and palm vein images based on “Laplacianpalm” representation. Pattern Recognit. 2008, 41, 1514–1527. [Google Scholar] [CrossRef]
- Liu, Z.; Yin, Y.; Wang, H.; Song, S.; Li, Q. Finger vein recognition with manifold learning. J. Netw. Comput. Appl. 2010, 33, 275–282. [Google Scholar] [CrossRef]
- Wang, J.G.; Yau, W.Y.; Suwandy, A.; Sung, E. Fusion of palmprintand palm vein images for person recognition based on “Laplacianpalm” feature. In Proceedings of the IEEE Conference on Computer Vision and Pattern Recognition, Minneapolis, MN, USA, 17–22 June 2007; pp. 1–8.
- Kisku, D.R.; Rattani, A.; Gupta, P.; Sing, J.K. Biometric sensor image fusion for identity verification: A case study with wavelet-based fusion rules graph matching. In Proceedings of the IEEE Conference on Technologies for Homeland Security, Boston, MA, USA, 11–12 May 2009; pp. 433–439.
- Sonka, M.; Hlavac, V.; Boyle, R. Image Processing, Analysis, and Machine Vision, 2nd ed.; PWS Publishing: New York, NY, USA, 1999; pp. 128–130. [Google Scholar]
- Goutsias, J.; Vincent, L.; Bloomberg, D.S. Mathematical Morphology and its Applications to Image and Signal Processing, 3rd ed.; Kluwer Academic Publishers: New York, NY, USA, 2013; pp. 301–310. [Google Scholar]
- Stathaki, T. Image Fusion—Algorithms and Applications, 1st ed.; Academic Press: Burlington, MA, USA, 2008; pp. 402–407. [Google Scholar]
- Pajares, G.; de la Cruz, J.M. A wavelet-based image fusion tutorial. Pattern Recognit. 2004, 37, 1855–1872. [Google Scholar] [CrossRef]
- Vapnik, V.N. The Nature of Statistical Learning Theory, 1st ed.; Springer-Verlag New York, Inc.: New York, NY, USA, 1995; pp. 146–170. [Google Scholar]
- Chang, C.C.; Lin, C.J. LIBSVM: A Library for Support Vector Machines. Available online: http://www.csie.ntu.edu.tw/~cjlin/libsvm/index.html (accessed on 5 Nobember 2105).
- Sanchez-Reillo, R.; Sanchez-Avila, C.; Gonzalez-Macros, A. Biometric identification through hand geometry measurements. IEEE Trans. Pattern Anal. Mach. Intell. 2000, 22, 1168–1171. [Google Scholar] [CrossRef]
- You, J.; Li, W.; Zhang, D. Hierarchical palmprint identification via multiple feature extraction. Pattern Recognit. 2002, 35, 847–859. [Google Scholar] [CrossRef]
- Raghavendra, R.; Busch, C. Novel image fusion scheme based on dependency measure for robust multispectral palmprint recognition. Pattern Recognit. 2014, 47, 2205–2221. [Google Scholar] [CrossRef]
- Vaidya, D.; Pawar, S.; Joshi, M.A.; Sapkal, A.M.; Kar, S. Feature-Level Fusion of Palm Print and Palm Vein for Person Authentication Based on Entropy Technique. Int. J. Electron. Commun. Technol. 2014, 7109, 53–57. [Google Scholar]
- Wu, X.; Wang, K.; Zhang, D. A Cryptosystem Based on Palmprint Feature. In Proceedings of the 19th International Conference on Pattern Recognition, Tampa, FL, USA, 8–11 December 2008; pp. 1–4.
- Yang, W.; Hu, J.; Wang, S. A finger-vein based cancellable bio-cryptosystem. In Network and System Security; Springer-Verlag GmbH: Berlin, Germany, 2013; pp. 784–790. [Google Scholar]
© 2015 by the authors; licensee MDPI, Basel, Switzerland. This article is an open access article distributed under the terms and conditions of the Creative Commons by Attribution (CC-BY) license (http://creativecommons.org/licenses/by/4.0/).
Share and Cite
Lin, C.-L.; Wang, S.-H.; Cheng, H.-Y.; Fan, K.-C.; Hsu, W.-L.; Lai, C.-R. Bimodal Biometric Verification Using the Fusion of Palmprint and Infrared Palm-Dorsum Vein Images. Sensors 2015, 15, 31339-31361. https://doi.org/10.3390/s151229856
Lin C-L, Wang S-H, Cheng H-Y, Fan K-C, Hsu W-L, Lai C-R. Bimodal Biometric Verification Using the Fusion of Palmprint and Infrared Palm-Dorsum Vein Images. Sensors. 2015; 15(12):31339-31361. https://doi.org/10.3390/s151229856
Chicago/Turabian StyleLin, Chih-Lung, Shih-Hung Wang, Hsu-Yung Cheng, Kuo-Chin Fan, Wei-Lieh Hsu, and Chin-Rong Lai. 2015. "Bimodal Biometric Verification Using the Fusion of Palmprint and Infrared Palm-Dorsum Vein Images" Sensors 15, no. 12: 31339-31361. https://doi.org/10.3390/s151229856