
Identification of Chinese Herbs Using a Sequencing-Free Nanostructured Electrochemical DNA Biosensor

Abstract
:
1. Introduction
2. Materials and Methods
2.1. Apparatus and Reagents
2.2. Fabrication of the Graphene and Gold Nanoparticles Modified Glassy Carbon Electrode
2.3. Probe Immobilization and Hybridization
2.4. Accumulation of MB and Electrochemical Measurements
2.5. Preparation of DNA Samples and Asymmetric Polymerase Chain Reaction (PCR) Amplification
3. Results and Discussion
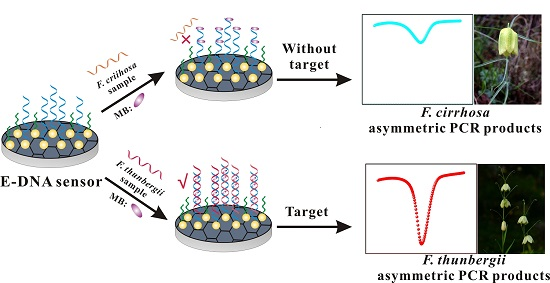
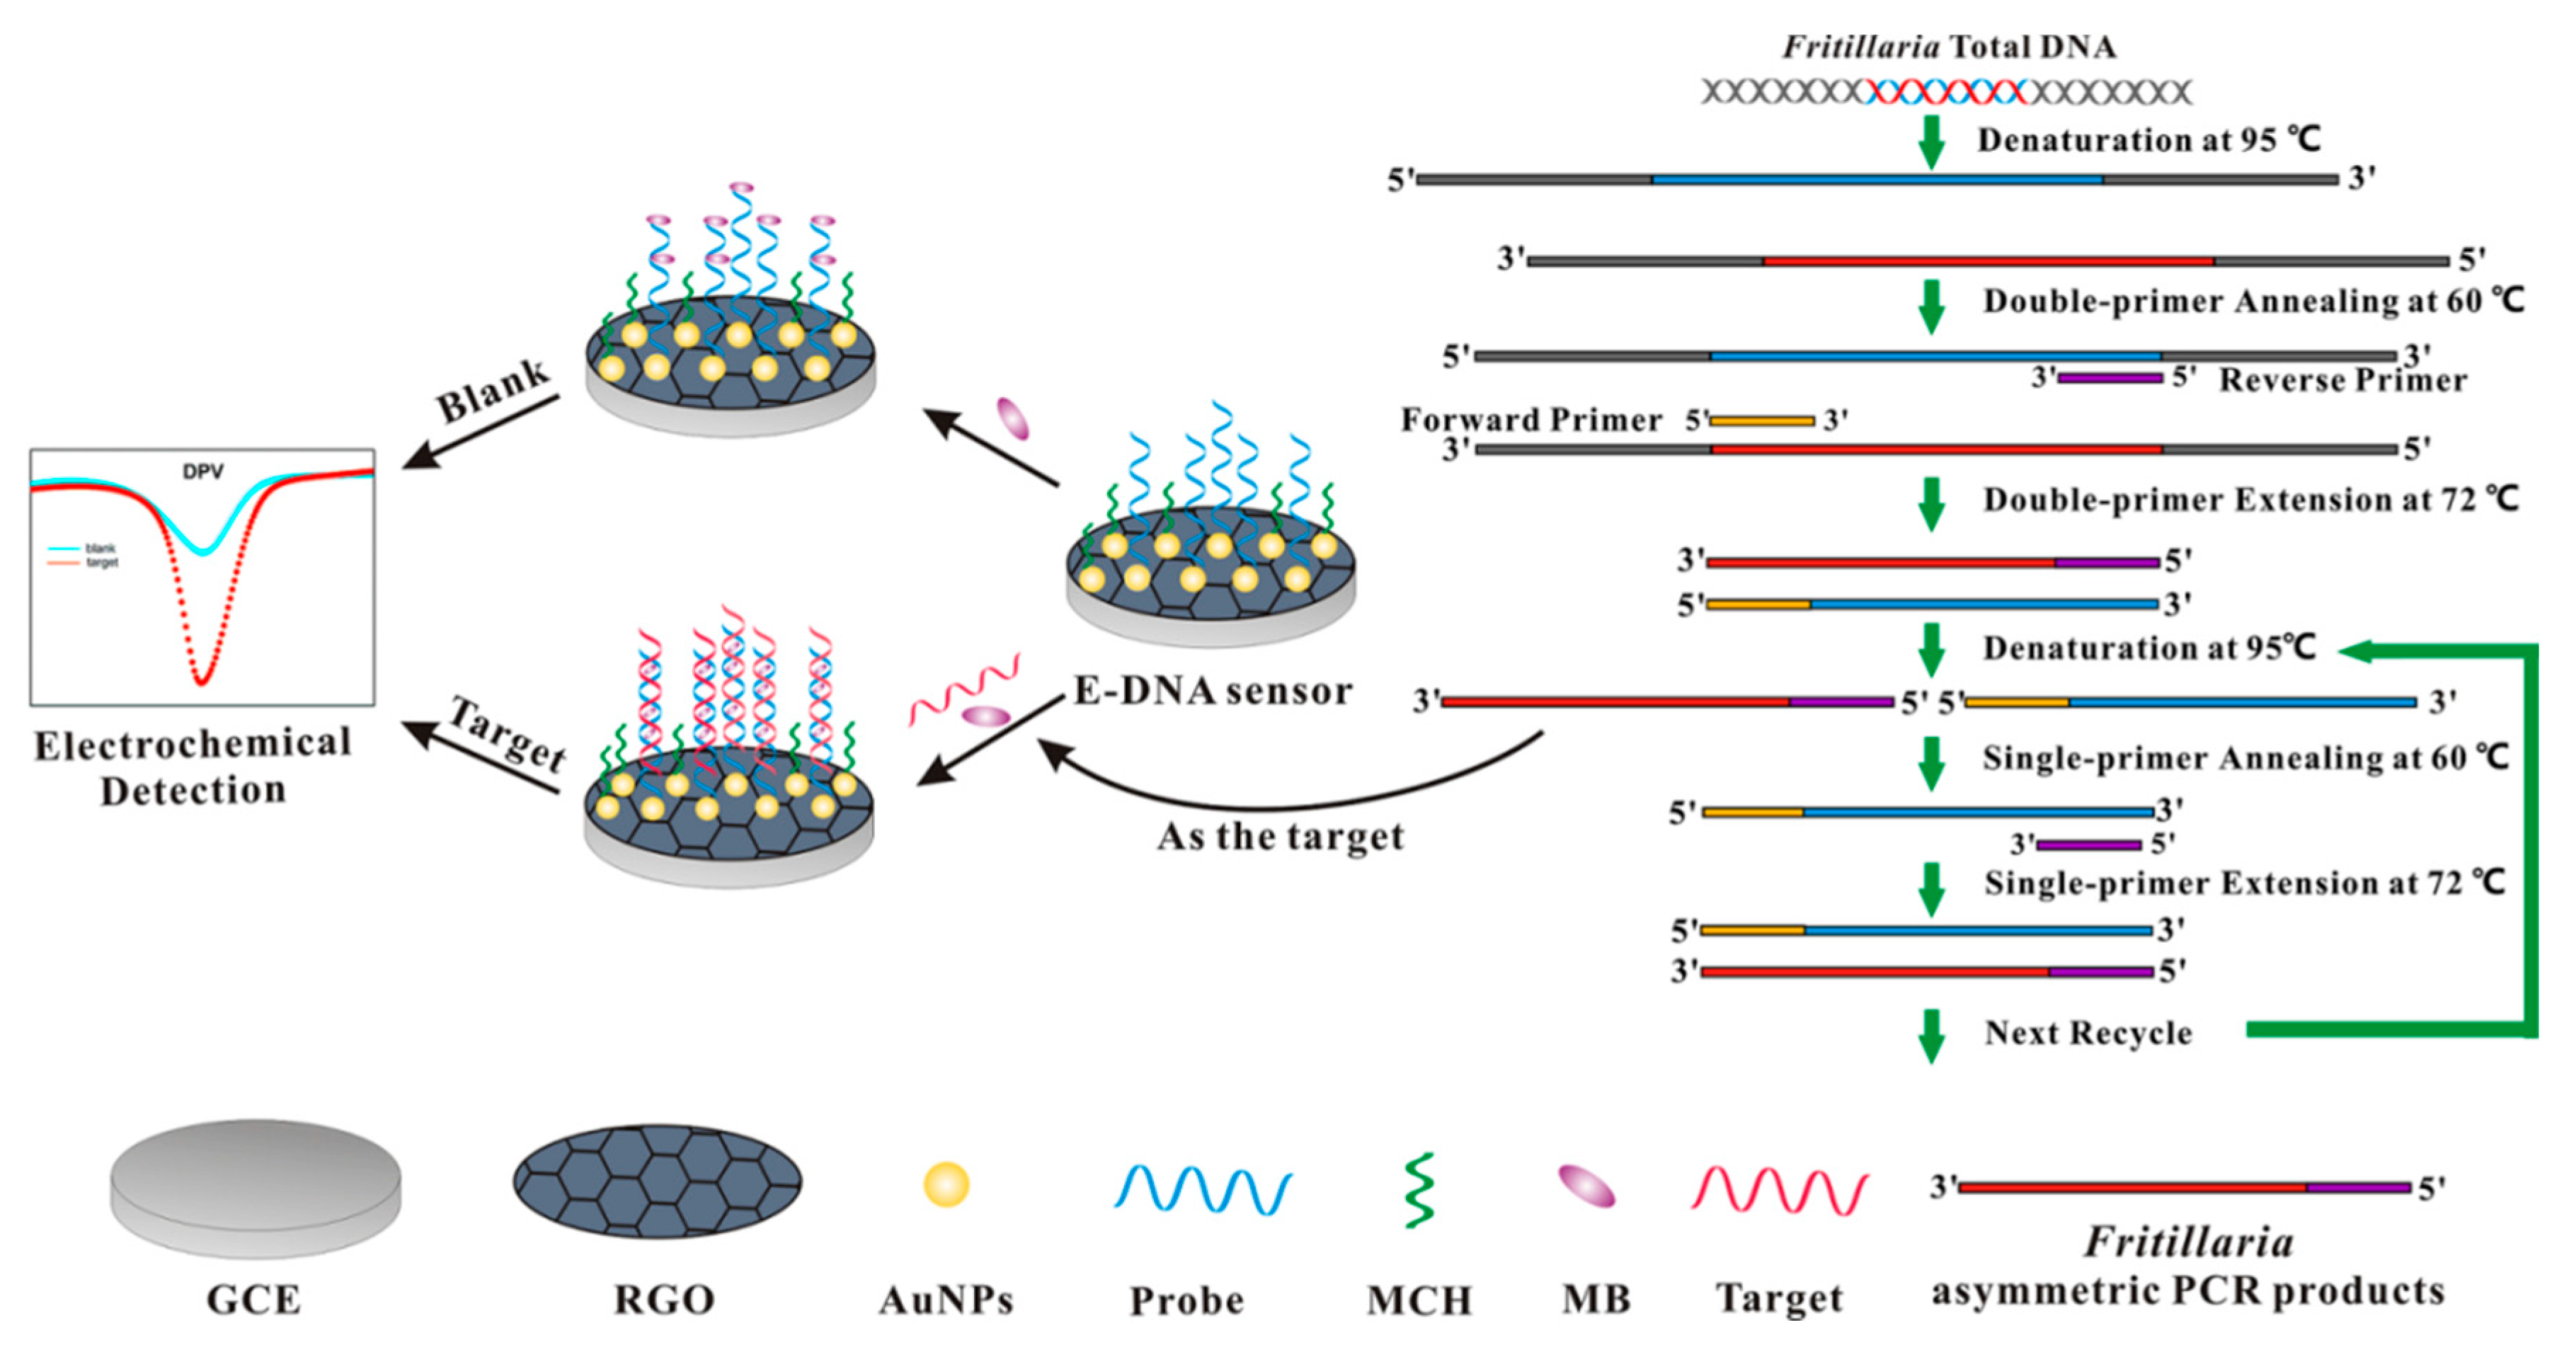
3.1. Tailored Electrochemical Sensor for Sequence-Specific Detection of Fritillaria DNA

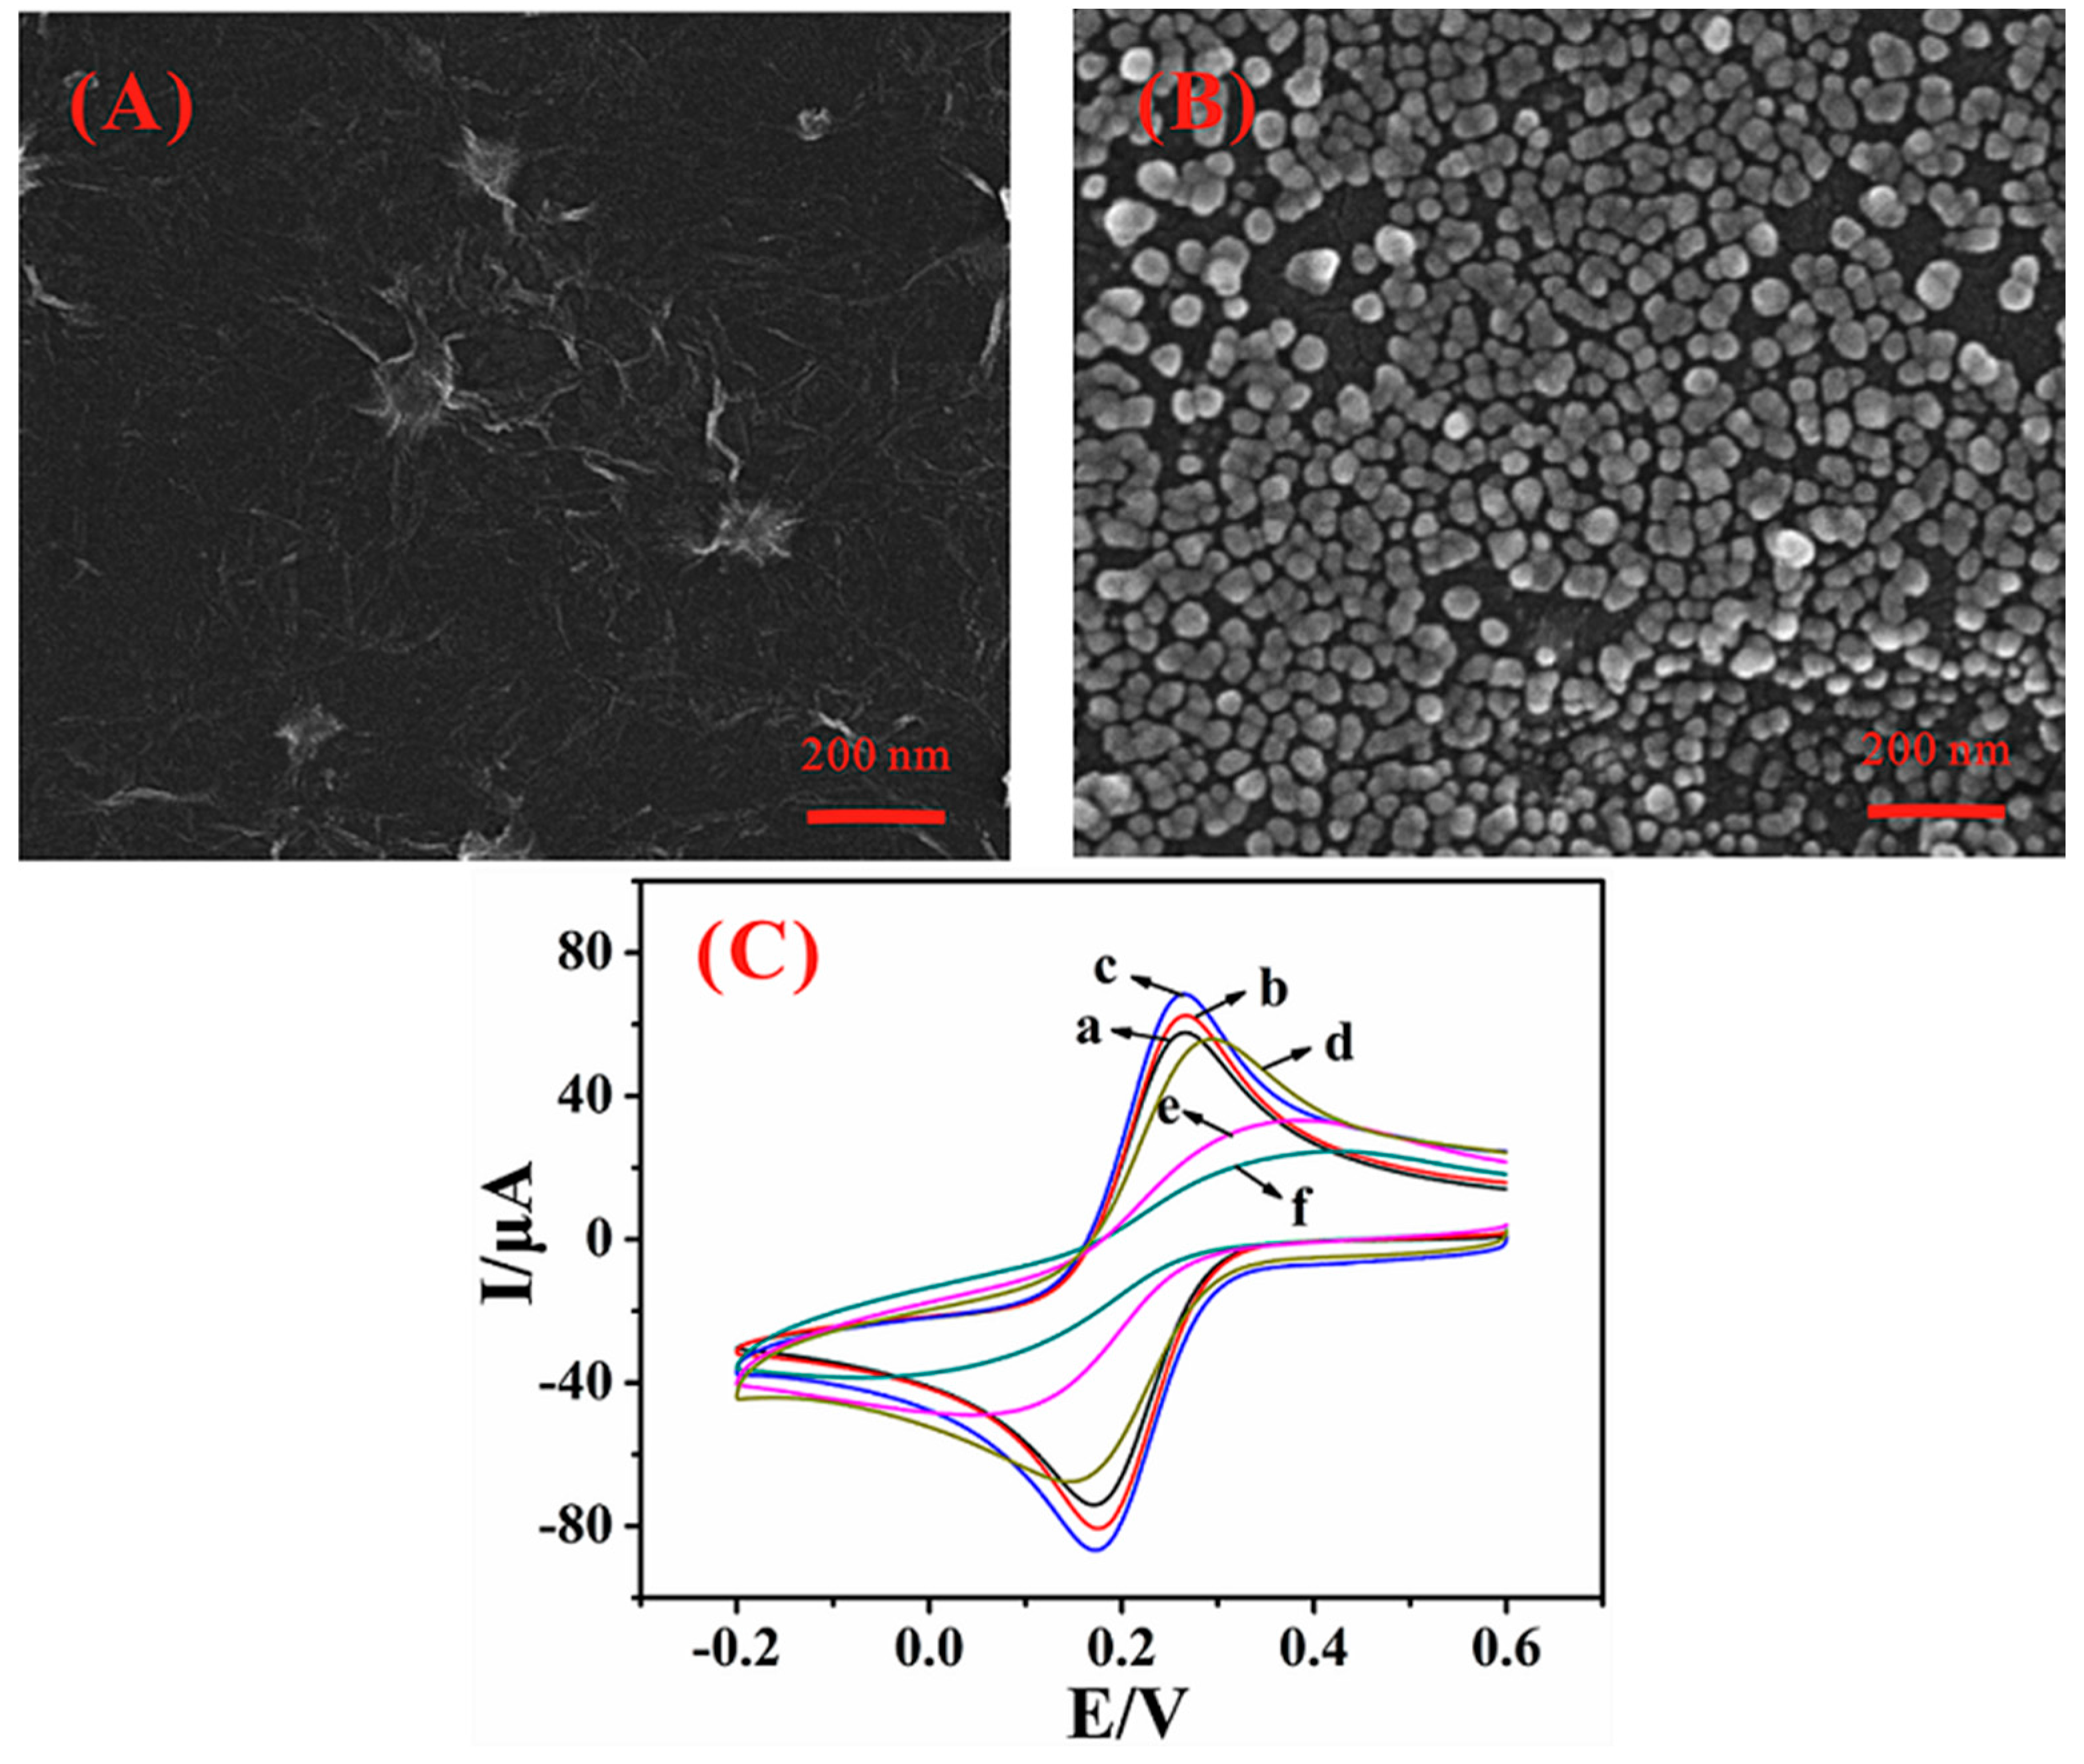
3.2. Engineering Synergisitc Biosensing Interface
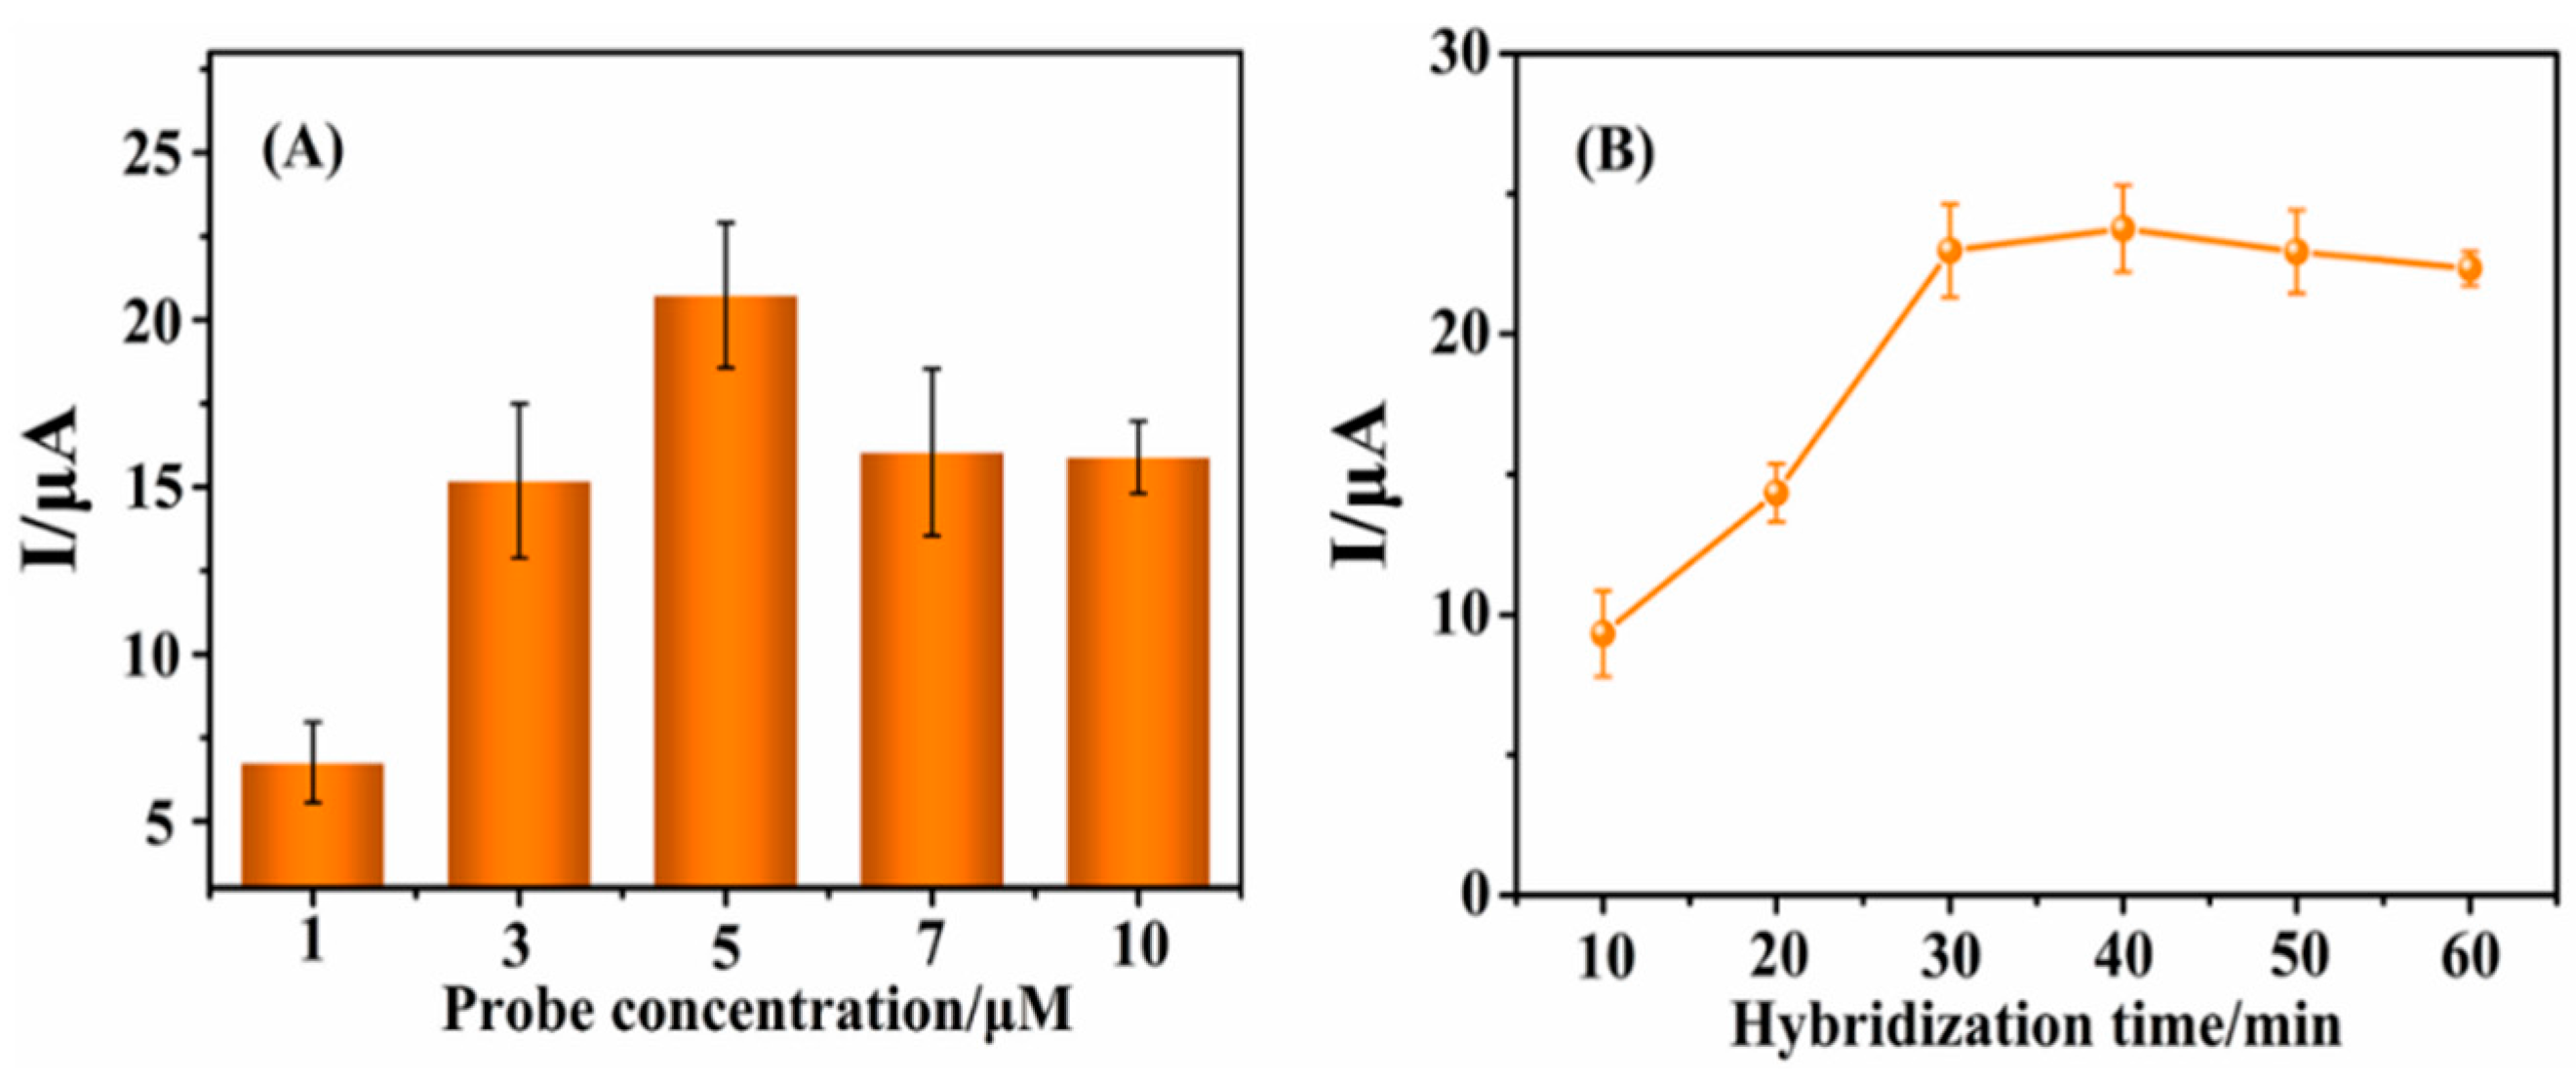
3.3. Optimization of Experimental Conditions


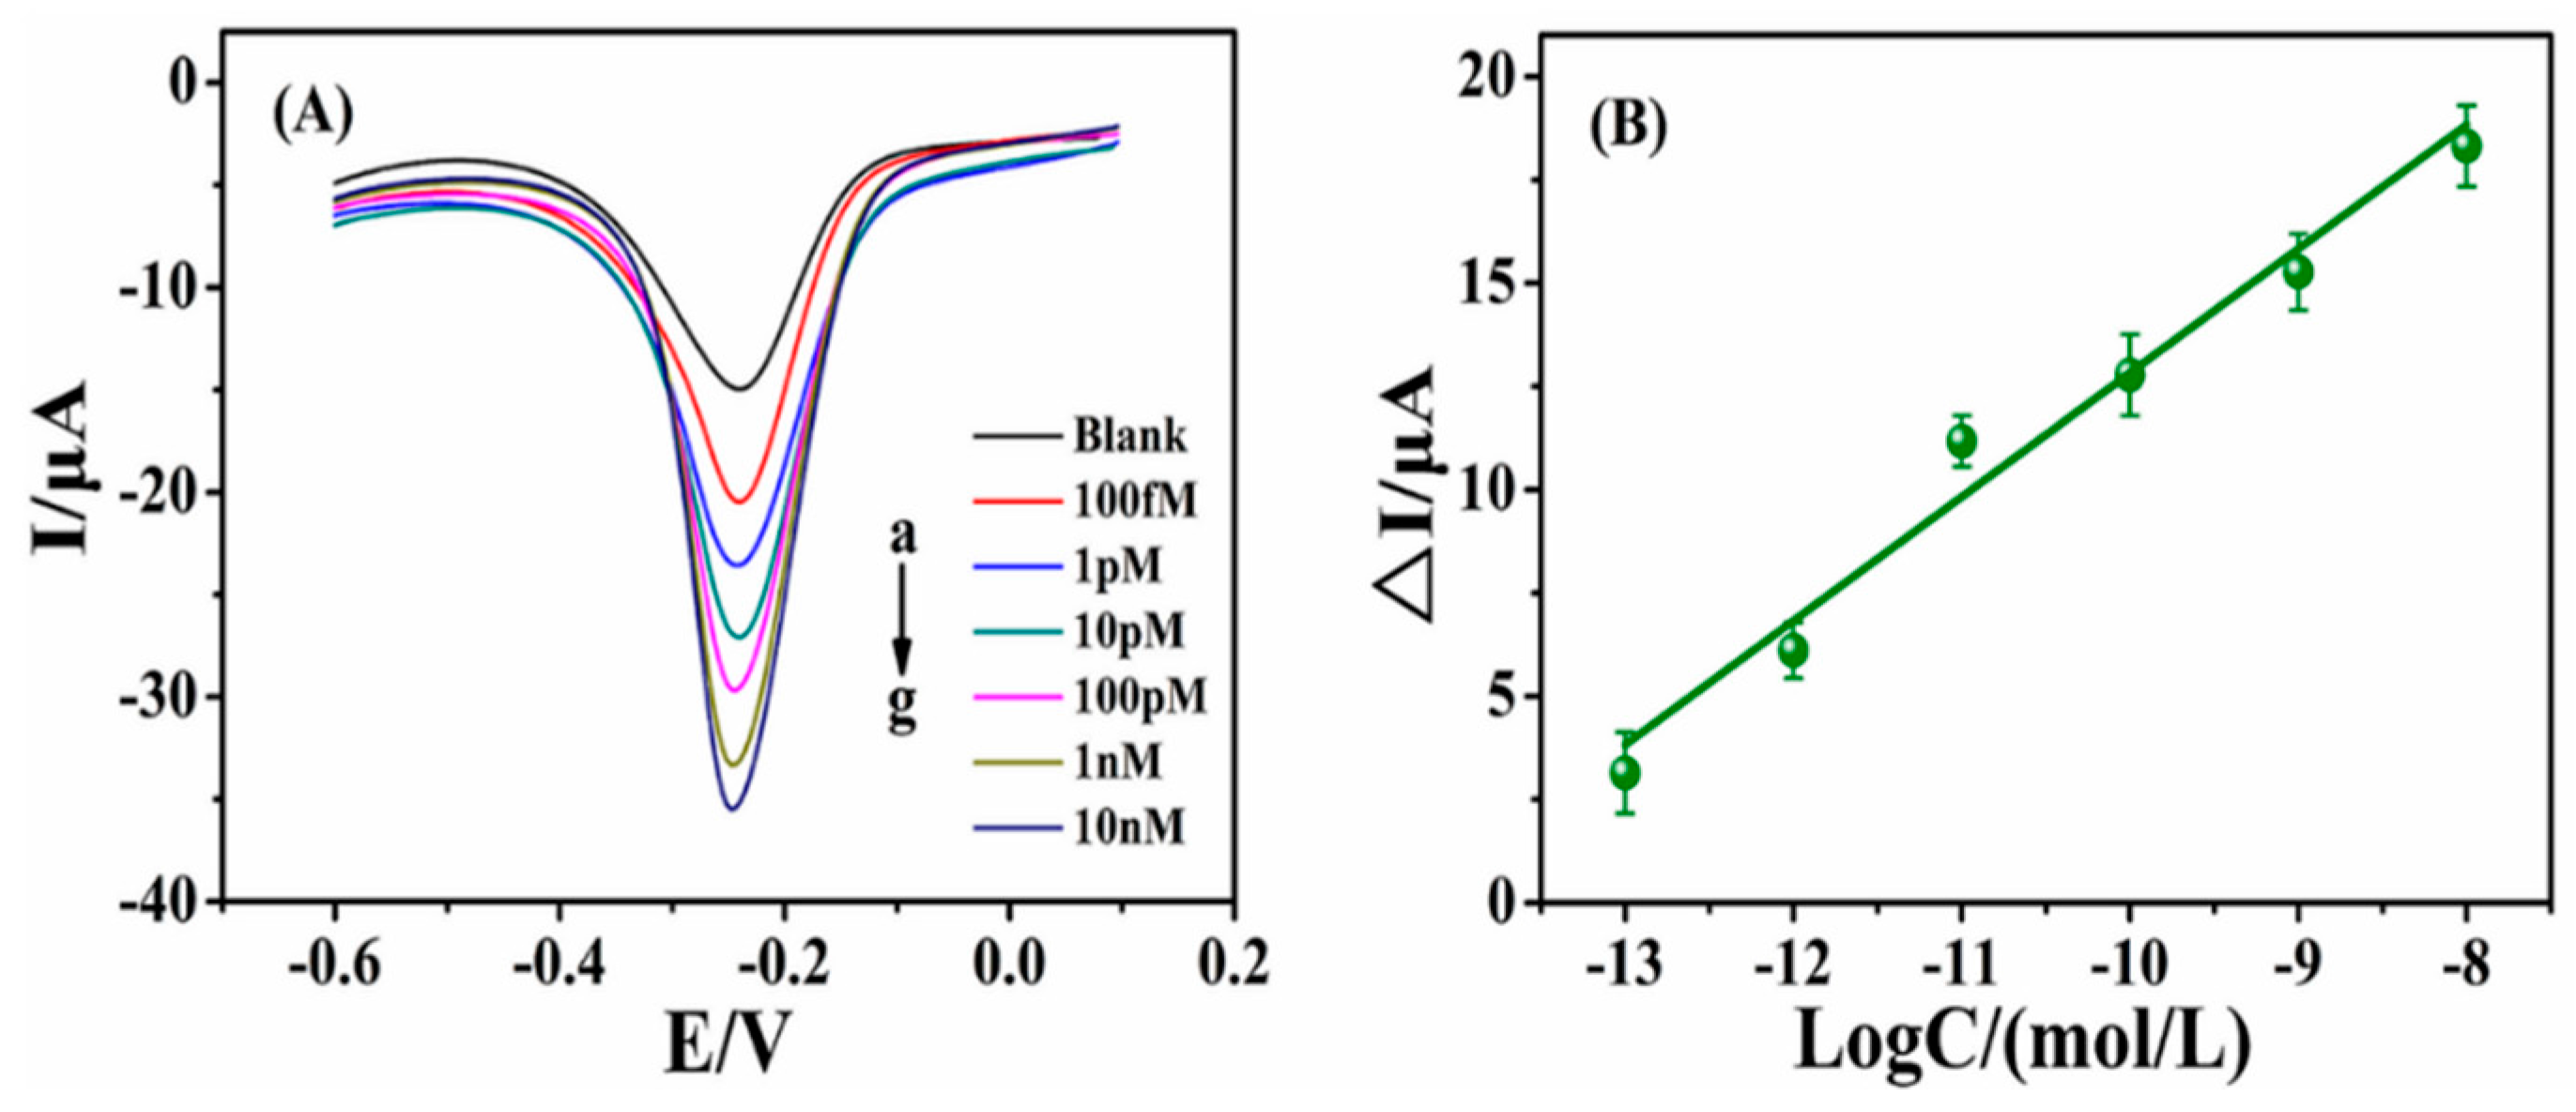
3.4. Sensitivity

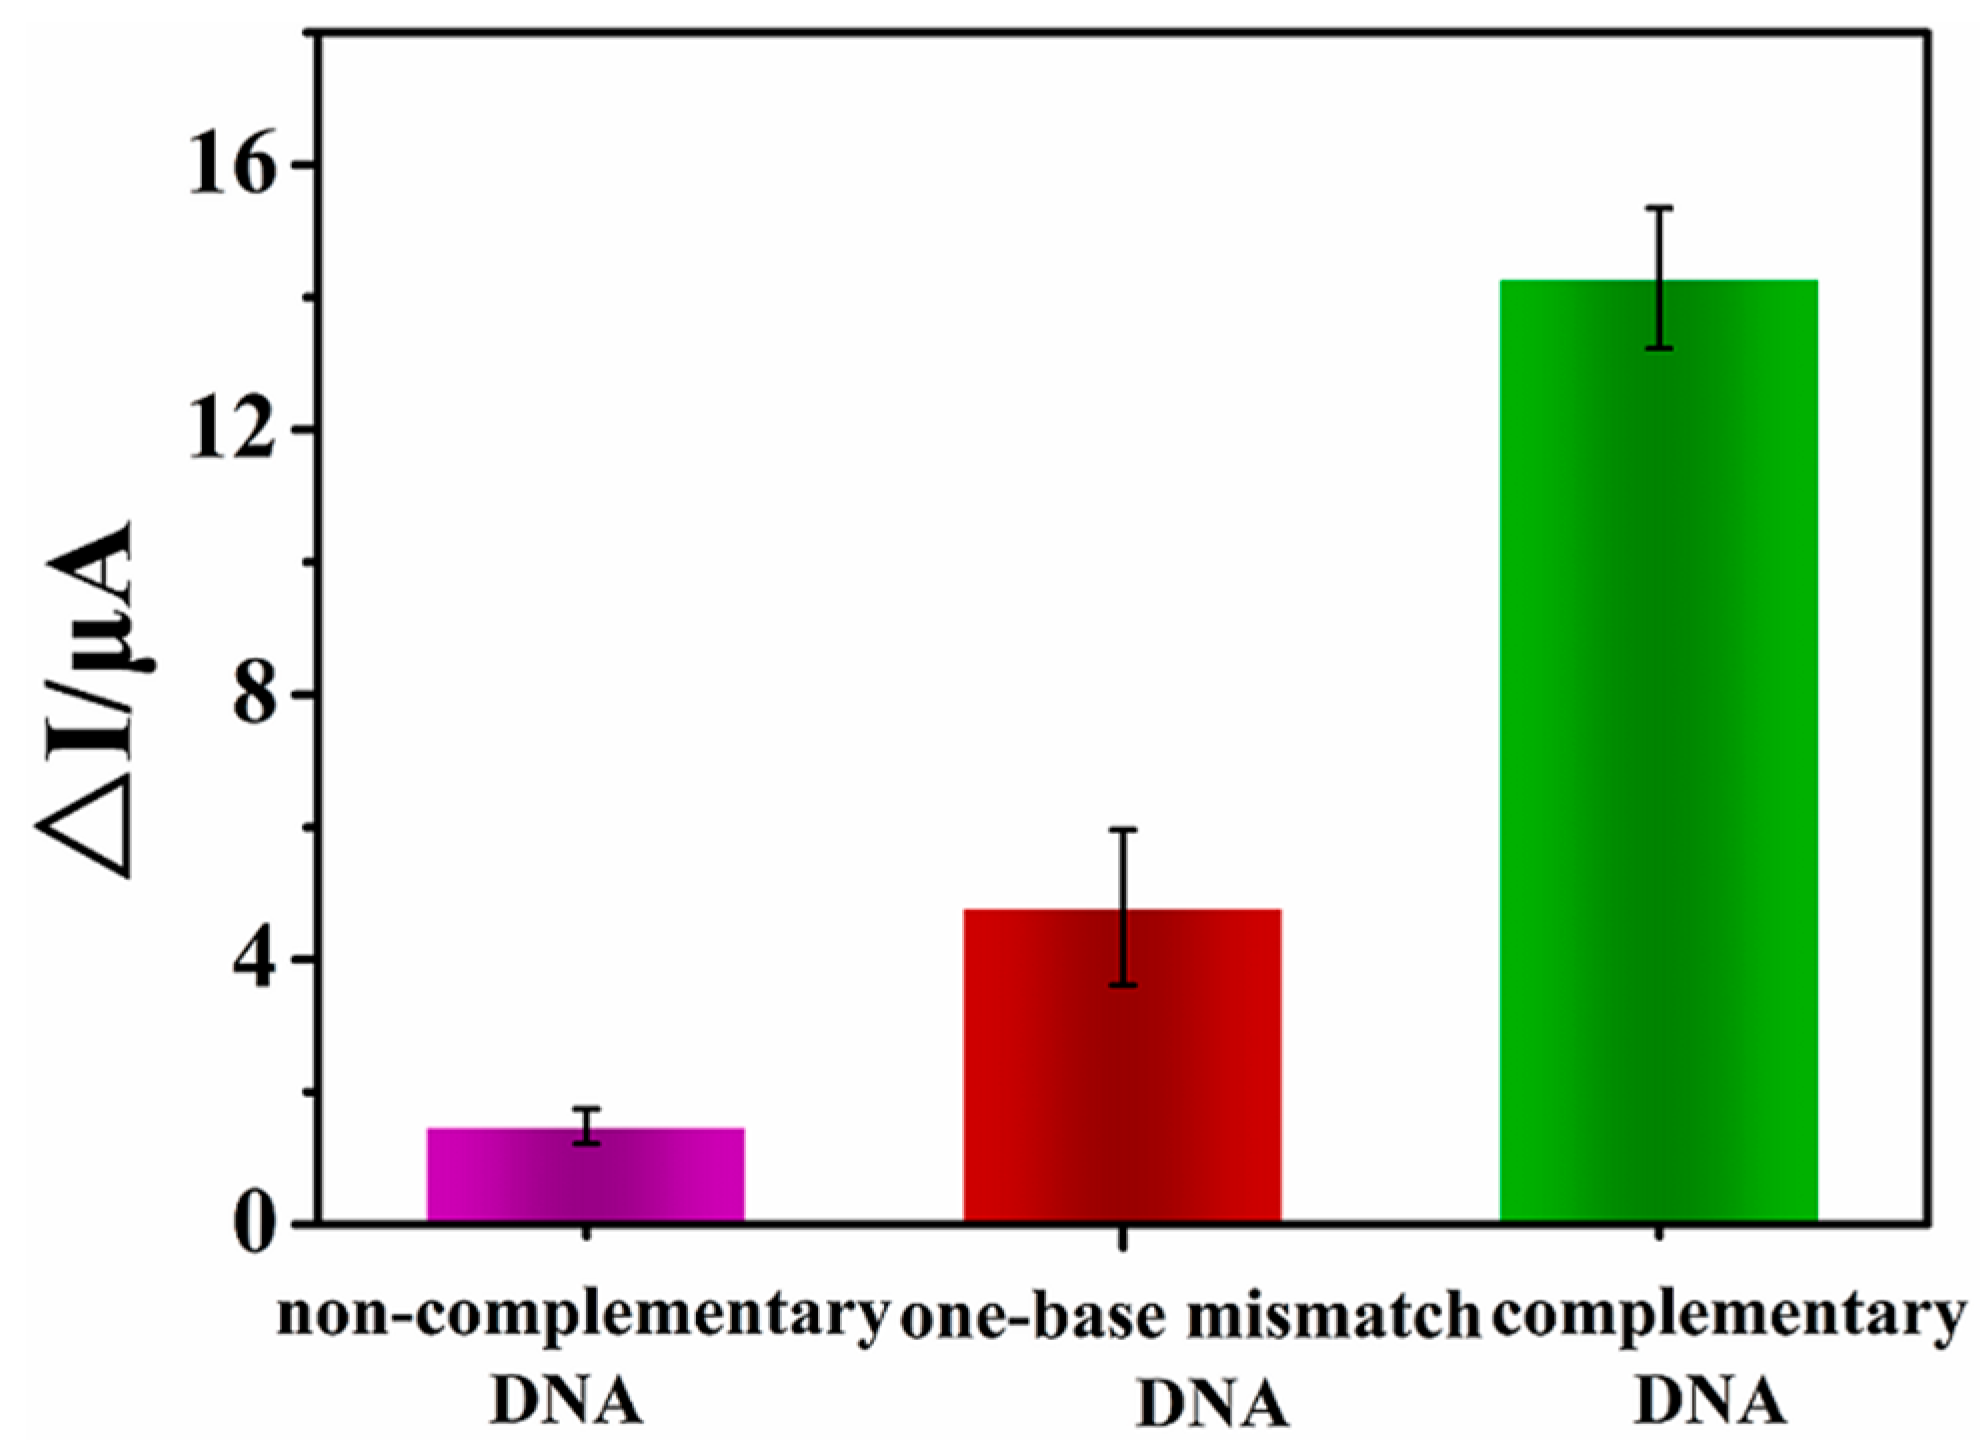
3.5. Selectivity

3.6. Reproducibility and Stability
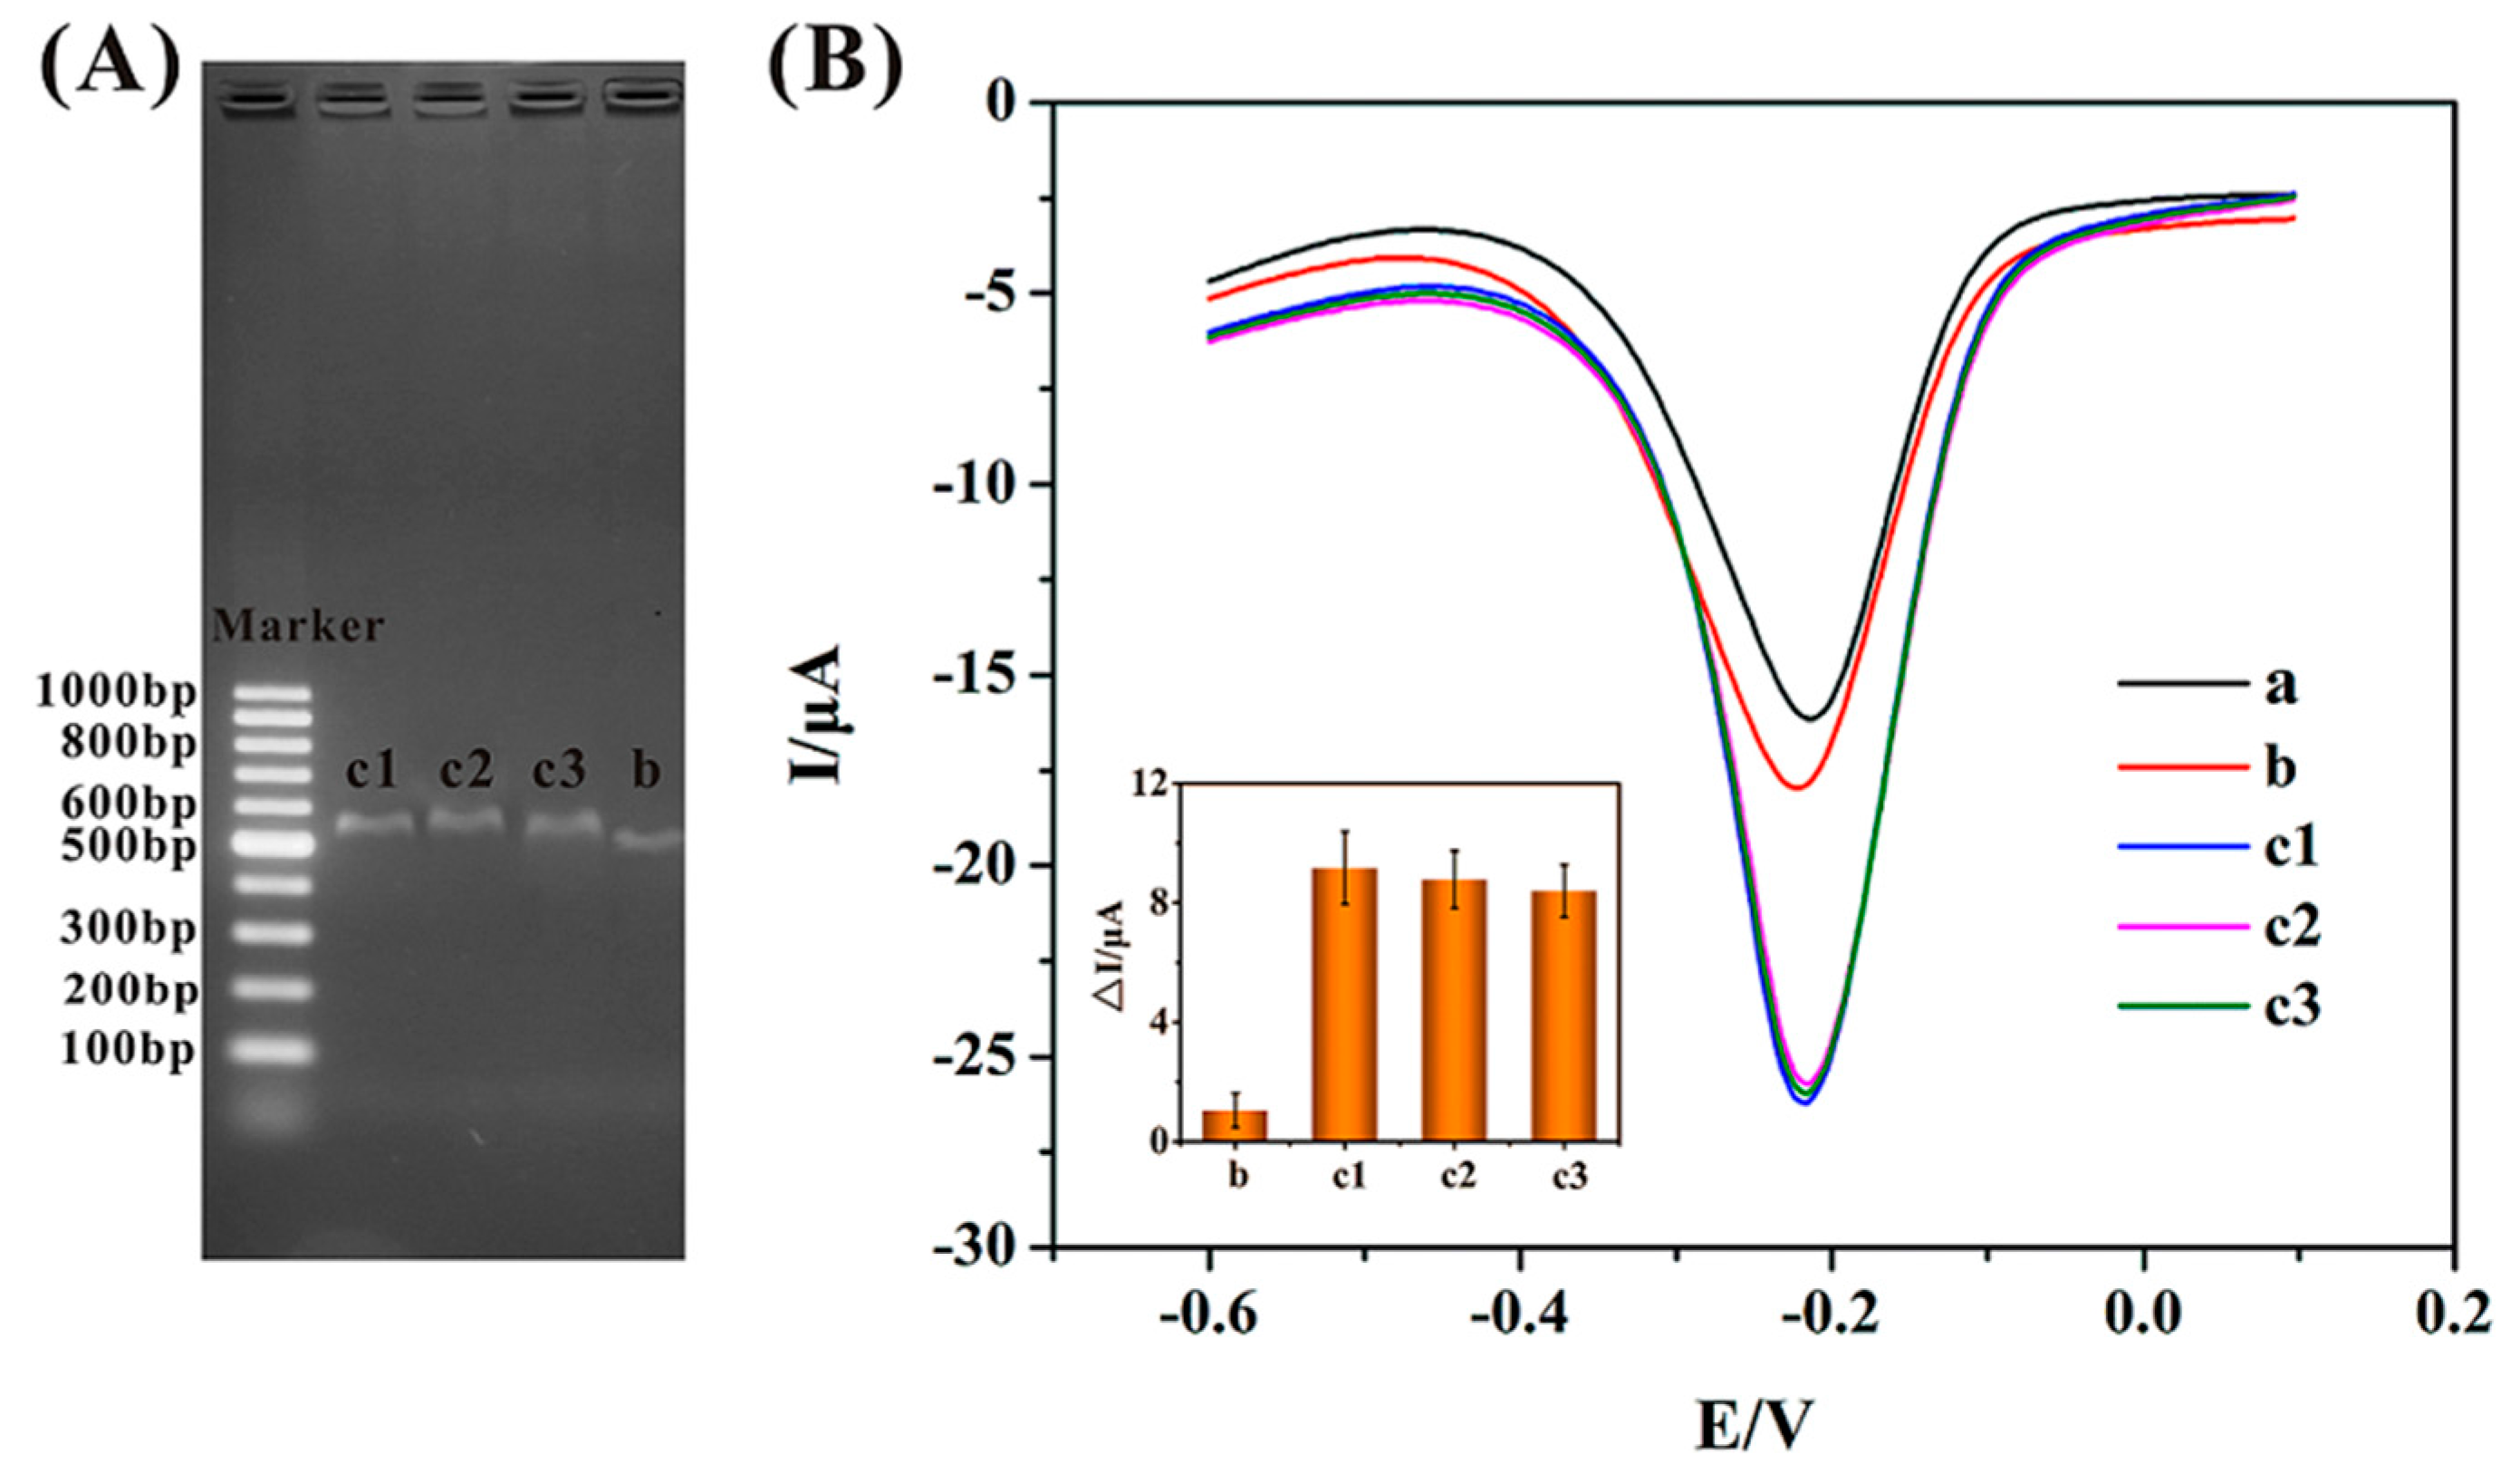
3.7. Direct Identification of F. thunbergii and F. cirrhosa Using E-DNA Sensor

4. Conclusions
Supplementary Files
Supplementary File 1Acknowledgments
Author Contributions
Conflicts of Interest
References
- Chinese Pharmacopoeia Commission. Chinese Pharmacopoeia, 1st ed.; China Medical Science Press: Beijing, China, 2010; p. 274. [Google Scholar]
- Wang, C.Z.; Li, P.; Ding, J.Y.; Jin, G.Q.; Yuan, C.S. Identification of Fritillaria pallidiflora using diagnostic PCR and PCR-RFLP based on nuclear ribosomal DNA internal transcribed spacer sequences. Planta Med. 2005, 71, 384–386. [Google Scholar] [CrossRef] [PubMed]
- Cai, Z.H.; Li, P.; Dong, T.T.; Tsim, K.W. Molecular diversity of 5S-rRNA spacer domain in Fritillaria species revealed by PCR analysis. Planta Med. 1999, 65, 360–364. [Google Scholar] [CrossRef] [PubMed]
- Zhang, G.J.; Chua, J.H.; Chee, R.E.; Agarwal, A.; Wong, S.M. Label-free direct detection of MiRNAs with silicon nanowire biosensors. Biosens. Bioelectron. 2009, 24, 2504–2508. [Google Scholar] [CrossRef] [PubMed]
- Cai, B.; Wang, S.; Huang, L.; Ning, Y.; Zhang, Z.; Zhang, G.J. Ultrasensitive label-free detection of PNA-DNA hybridization by reduced graphene oxide field-effect transistor biosensor. ASC Nano 2014, 8, 2632–2638. [Google Scholar] [CrossRef] [PubMed]
- Zagorodko, O.; Spadavecchia, J.; Serrano, A.Y.; Larroulet, I.; Pesquera, A.; Zurutuza, A.; Boukherroub, R.; Szunerits, S. Highly sensitive detection of DNA hybridization on commercialized graphene-coated surface plasmon resonance interfaces. Anal. Chem. 2014, 86, 11211–11216. [Google Scholar] [CrossRef] [PubMed]
- Guo, S.; Du, D.; Tang, L.; Ning, Y.; Yao, Q.; Zhang, G.J. PNA-assembled graphene oxide for sensitive and selective detection of DNA. Analyst 2013, 138, 3216–3220. [Google Scholar] [CrossRef] [PubMed]
- Wang, S.; Zhang, Y.; Ning, Y.; Zhang, G.J. A WS2 nanosheet-based platform for fluorescent DNA detection via PNA-DNA hybridization. Analyst 2015, 140, 434–439. [Google Scholar] [CrossRef] [PubMed]
- Yang, F.; Yang, X.; Wang, Y.; Qin, Y.; Liu, X.; Yan, X.; Zou, K.; Ning, Y.; Zhang, G.J. Template-independent, in situ grown DNA nanotail enabling label-free femtomolar chronocoulometric detection of nucleic acids. Anal. Chem. 2014, 86, 11905–11912. [Google Scholar] [CrossRef] [PubMed]
- Du, D.; Guo, S.; Tang, L.; Ning, Y.; Yao, Q.; Zhang, G.J. Graphene-modified electrode for DNA detection via PNA–DNA hybridization. Sens. Actuators B Chem. 2013, 186, 563–570. [Google Scholar] [CrossRef]
- Wang, L.; Hua, E.; Liang, M.; Ma, C.; Liu, Z.; Sheng, S.; Liu, M.; Xie, G.; Feng, W. Graphene sheets, polyaniline and AuNPs based DNA sensor for electrochemical determination of BCR/ABL fusion gene with functional hairpin probe. Biosens. Bioelectron. 2014, 51, 201–207. [Google Scholar] [CrossRef] [PubMed]
- Loo, A.H.; Bonanni, A.; Ambrosi, A.; Pumera, M. Molybdenum disulfide (MoS2) nanoflakes as inherently electroactive labels for DNA hybridization detection. Nanoscale 2014, 6, 11971–11975. [Google Scholar] [CrossRef] [PubMed]
- Yang, X.; Gao, M.; Hu, H.; Zhang, H. Electrochemical detection of honokiol and magnolol in traditional Chinese medicines using acetylene black nanoparticle-modified electrode. Phytochem. Anal. 2011, 22, 291–295. [Google Scholar] [CrossRef] [PubMed]
- Cao, Y.; Lou, C.; Fang, Y.; Ye, J. Determination of active ingredients of Rhododendron dauricum L. by capillary electrophoresis with electrochemical detection. J. Chromatogr. A 2002, 943, 153–157. [Google Scholar] [CrossRef]
- Li, F.; Feng, Y.; Dong, P.; Yang, L.; Tang, B. Gold nanoparticles modified electrode via simple electrografting of in situ generated mercaptophenyl diazonium cations for development of DNA electrochemical biosensor. Biosens. Bioelectron. 2011, 26, 1947–1952. [Google Scholar] [CrossRef] [PubMed]
- Zhang, Y.; Jiang, W. Decorating graphene sheets with gold nanoparticles for the detection of sequence-specific DNA. Electrochim. Acta 2012, 71, 239–245. [Google Scholar] [CrossRef]
- Zhou, M.; Zhai, Y.; Dong, S. Electrochemical sensing and biosensing platform based on chemically reduced graphene oxide. Anal. Chem. 2009, 81, 5603–5613. [Google Scholar] [CrossRef] [PubMed]
- Wu, S.; He, Q.; Tan, C.; Wang, Y.; Zhang, H. Graphene-based electrochemical sensors. Small 2013, 9, 1160–1172. [Google Scholar] [CrossRef] [PubMed]
- Saha, K.; Agasti, S.S.; Kim, C.; Li, X.; Rotello, V.M. Gold nanoparticles in chemical and biological sensing. Chem. Rev. 2012, 112, 2739–2779. [Google Scholar] [CrossRef] [PubMed]
- Shan, C.; Yang, H.; Han, D.; Zhang, Q.; Ivaska, A.; Niu, L. Graphene/AuNPs/chitosan nanocomposites film for glucose biosensing. Biosens. Bioelectron. 2010, 25, 1070–1074. [Google Scholar] [CrossRef] [PubMed]
- Zhang, Y.; Huang, L. Label-free electrochemical DNA biosensor based on a glassy carbon electrode modified with gold nanoparticles, polythionine, and grapheme. Microchim. Acta 2012, 176, 463–470. [Google Scholar] [CrossRef]
- Wang, J.; Wang, F.; Dong, S. Methylene blue as an indicator for sensitive electrochemical detection of adenosine based on aptamer switch. J. Electroanal. Chem. 2009, 626, 1–5. [Google Scholar] [CrossRef]
- Erdem, A.; Kerman, K.; Meric, B.; Akarca, U.S.; Ozsoz, M. Novel hybridization indicator methylene blue for the electrochemical detection of short DNA sequences related to the hepatitis B virus. Anal. Chim. Acta 2000, 422, 139–149. [Google Scholar] [CrossRef]
- Spain, E.; Keyes, T.E.; Forster, R.J. DNA sensor based on vapour polymerised pedot films functionalised with gold nanoparticles. Biosens. Bioelectron. 2013, 41, 65–70. [Google Scholar] [CrossRef] [PubMed]
- Hummers, W.S.; Offeman, R.E. Preparation of graphitic Oxide. J. Am. Chem. Soc. 1958, 80, 1339. [Google Scholar] [CrossRef]
- Kovtyukhova, N.I.; Ollivier, P.J.; Martin, B.R.; Mallouk, T.E.; Chizhik, S.A.; Buzaneva, E.V.; Gorchinskiy, A.D. Layer-by-Layer Assembly of Ultrathin Composite Films from Micron-Sized Graphite Oxide Sheets and Polycations. Chem. Mater. 1999, 11, 771–778. [Google Scholar] [CrossRef]
- Chen, L.; Tang, Y.; Wang, K.; Liu, C.; Luo, S. Direct electrodeposition of reduced graphene oxide on glassy carbon electrode and its electrochemical application. Electrochem. Commun. 2011, 13, 133–137. [Google Scholar] [CrossRef]
- Lei, Y.; Du, D.; Tang, L.; Tan, C.; Chen, K.; Zhang, G.J. Determination of rutin by a graphene-modified glassy carbon electrode. Anal. Lett. 2015, 48, 894–906. [Google Scholar] [CrossRef]
- Furukawa, Y.; O’Halloran, T.V. Amyotrophic lateral sclerosis mutations have the greatest destabilizing effect on the apo- and reduced form of SOD1, leading to unfolding and oxidative aggregation. J. Biol. Chem. 2005, 280, 17266–17274. [Google Scholar] [CrossRef] [PubMed]
- Lee, T.M.H.; Hsing, I.M. Sequence-specific electrochemical detection of asymmetric PCR amplicons of traditional Chinese medicinal plant DNA. Anal. Chem. 2002, 74, 5057–5062. [Google Scholar] [CrossRef] [PubMed]
- Dong, X.; Huang, W.; Chen, P. In Situ Synthesis of Reduced Graphene Oxide and Gold Nanocomposites for Nanoelectronics and Biosensing. Nanoscale Res. Lett. 2011, 6. [Google Scholar] [CrossRef]
- Shi, A.; Wang, J.; Han, X.; Fang, X.; Zhang, Y. A sensitive electrochemical DNA biosensor based on gold nanomaterial and graphene amplified signal. Sens. Actuators B Chem. 2014, 200, 206–212. [Google Scholar] [CrossRef]
- Shang, L.; Zhao, F.; Zeng, B. Sensitive voltammetric determination of vanillin with an AuPd nanoparticles-graphene composite modified electrode. Food Chem. 2014, 151, 53–57. [Google Scholar] [CrossRef] [PubMed]
- Wang, J.; Shi, A.; Fang, X.; Han, X.; Zhang, Y. Ultrasensitive electrochemical supersandwich DNA biosensor using a glassy carbon electrode modified with gold particle-decorated sheets of graphene oxide. Microchim. Acta 2014, 181, 935–940. [Google Scholar] [CrossRef]
- Cao, X. Ultra-sensitive electrochemical DNA biosensor based on signal amplification using gold nanoparticles modified with molybdenum disulfide, graphene and horseradish peroxidase. Microchim. Acta 2014, 181, 1133–1141. [Google Scholar] [CrossRef]
- Lin, C.; Wu, Y.; Luo, F.; Chen, D.; Chen, X. A label-free electrochemical DNA sensor using methylene blue as redox indicator based on an exonuclease III-aided target recycling strategy. Biosens. Bioelectron. 2014, 59, 365–369. [Google Scholar] [CrossRef] [PubMed]
- Han, X.; Fang, X.; Shi, A.; Wang, J.; Zhang, Y. An electrochemical DNA biosensor based on gold nanorods decorated graphene oxide sheets for sensing platform. Anal. Biochem. 2013, 443, 117–123. [Google Scholar] [CrossRef] [PubMed]
- Liu, S.; Xing, X.; Yu, J.; Lian, W.; Li, J.; Cui, M.; Huang, J. A novel label-free electrochemical aptasensor based on graphene–polyaniline composite film for dopamine determination. Biosens. Bioelectron. 2012, 36, 186–191. [Google Scholar] [CrossRef] [PubMed]
© 2015 by the authors; licensee MDPI, Basel, Switzerland. This article is an open access article distributed under the terms and conditions of the Creative Commons by Attribution (CC-BY) license (http://creativecommons.org/licenses/by/4.0/).
Share and Cite
Lei, Y.; Yang, F.; Tang, L.; Chen, K.; Zhang, G.-J. Identification of Chinese Herbs Using a Sequencing-Free Nanostructured Electrochemical DNA Biosensor. Sensors 2015, 15, 29882-29892. https://doi.org/10.3390/s151229773
Lei Y, Yang F, Tang L, Chen K, Zhang G-J. Identification of Chinese Herbs Using a Sequencing-Free Nanostructured Electrochemical DNA Biosensor. Sensors. 2015; 15(12):29882-29892. https://doi.org/10.3390/s151229773
Chicago/Turabian StyleLei, Yan, Fan Yang, Lina Tang, Keli Chen, and Guo-Jun Zhang. 2015. "Identification of Chinese Herbs Using a Sequencing-Free Nanostructured Electrochemical DNA Biosensor" Sensors 15, no. 12: 29882-29892. https://doi.org/10.3390/s151229773