Article

Study and Test of a New Bundle-Structure Riser Stress Monitoring Sensor Based on FBG

1
Key Laboratory of Optical Information Technology, School of Science, Northwestern Polytechnical University, 127 West Youyi Road, Xi’an 710072, China
2
The Key Laboratory of Space Applied Physics and Chemistry, School of Science, Northwestern Polytechnical University, 127 West Youyi Road, Xi’an 710072, China
3
Key Lab of Deepwater Engineering CNOOC Research Institute, Room 808, CNOOC Plaza, Taiyanggong South Road 6#, Chaoyang District, Beijing 100028, China
4
School of Marine Science and Technology, Northwestern Polytechnical University, 127 West Youyi Road, Xi’an 710072, China
5
Zhanjiang Western South China Sea Oil Survey and Design Co., Ltd., Nanyou Engineering Building, Nandiao Road, Zhanjiang 524057, China
*
Author to whom correspondence should be addressed.
Sensors 2015, 15(11), 29648-29660; https://doi.org/10.3390/s151129648
Submission received: 27 August 2015 / Revised: 5 November 2015 / Accepted: 9 November 2015 / Published: 24 November 2015
(This article belongs to the Special Issue Sensors for Harsh Environments)

Abstract

:
To meet the requirements of riser safety monitoring in offshore oil fields, a new Fiber Bragg Grating (FBG)-based bundle-structure riser stress monitoring sensor has been developed. In cooperation with many departments, a 49-day marine test in water depths of 1365 m and 1252 m was completed on the “HYSY-981” ocean oil drilling platform. No welding and pasting were used when the sensor was installed on risers. Therefore, the installation is convenient, reliable and harmless to risers. The continuous, reasonable, time-consistent data obtained indicates that the sensor worked normally under water. In all detailed working conditions, the test results show that the sensor can do well in reflecting stresses and bending moments both in and in magnitude. The measured maximum stress is 132.7 MPa, which is below the allowable stress. In drilling and testing conditions, the average riser stress was 86.6 MPa, which is within the range of the China National Offshore Oil Corporation (CNOOC) mechanical simulation results.

1. Introduction

In recent years, the rapid development of the offshore oil industry has contributed greatly to the study of marine equipment. It is a big challenge to keep marine equipment in safe conditions, especially in the deep sea. As an important part of the oil platform, risers are exposed to many kinds of complicated forces in complex working conditions such as drilling and pipe-laying. To avoid damage and failure due to excessive stresses or bending moments in risers, real-time stress monitoring of risers is very important.
Various sensors have been developed to monitor riser safety, but most of them can be classified as electronic sensors [1,2,3,4,5,6,7,8]. In the deep sea environment, sensors need better electrical insulation capability, anti-pressure capability, anticorrosion capability, and less transmission loss. Fiber optic sensors meet these requirements and have been successfully applied in offshore oil fields [9,10,11,12,13]. As early as 2004, Brower et al. monitored subsea pipelines and facilities using fiber optic sensors [14]. In 2006, Morrison et al. developed a fiber Bragg grating (FBG) sensor with a four-point structure to monitor stresses of steel catenary risers [15]. Then, four-point structure FBG sensors were used to monitor vortex-induced vibrations (VIV) in laboratory riser models [16,17]. Morikawa et al. [18] and Weppenaar et al. [19] used FBG sensors on flexible pipelines to monitor fracture failures in 2008 and 2014, respectively. Recently in 2015, Vishwesh et al. researched failure mechanisms of aluminum tubes under high pressure by using FBG sensors [20].
However, in actual working conditions, the positions of riser stress monitoring depend on the water depth and object requirements. Sensors are hard to move if they are installed in traditional ways which involve pasting or welding. Surface-breaking installations are also harmful to riser corrosion resistance. A riser stress monitoring sensor based on polymer-packaged FBGs was developed to meet these requirements [21], but many disadvantages such as chirps and creeps were found in subsequent long-term laboratory tests.
In this paper, after applying an all-metal packaging technology [22], a new bundle-structure sensor for riser stress monitoring was developed to overcome these problems. In cooperation with several departments of the China National Offshore Oil Corporation (CNOOC), a marine test of the sensor was completed on the “hysy-981” ocean oil drilling platform in a sea area of south china sea named Lingshui, which is near the city of Sanya. The water depths of the well heads were 1365 m and 1252 m. The test lasted for 49 days and reasonable data was obtained.

2. Structure and Principle of Sensor

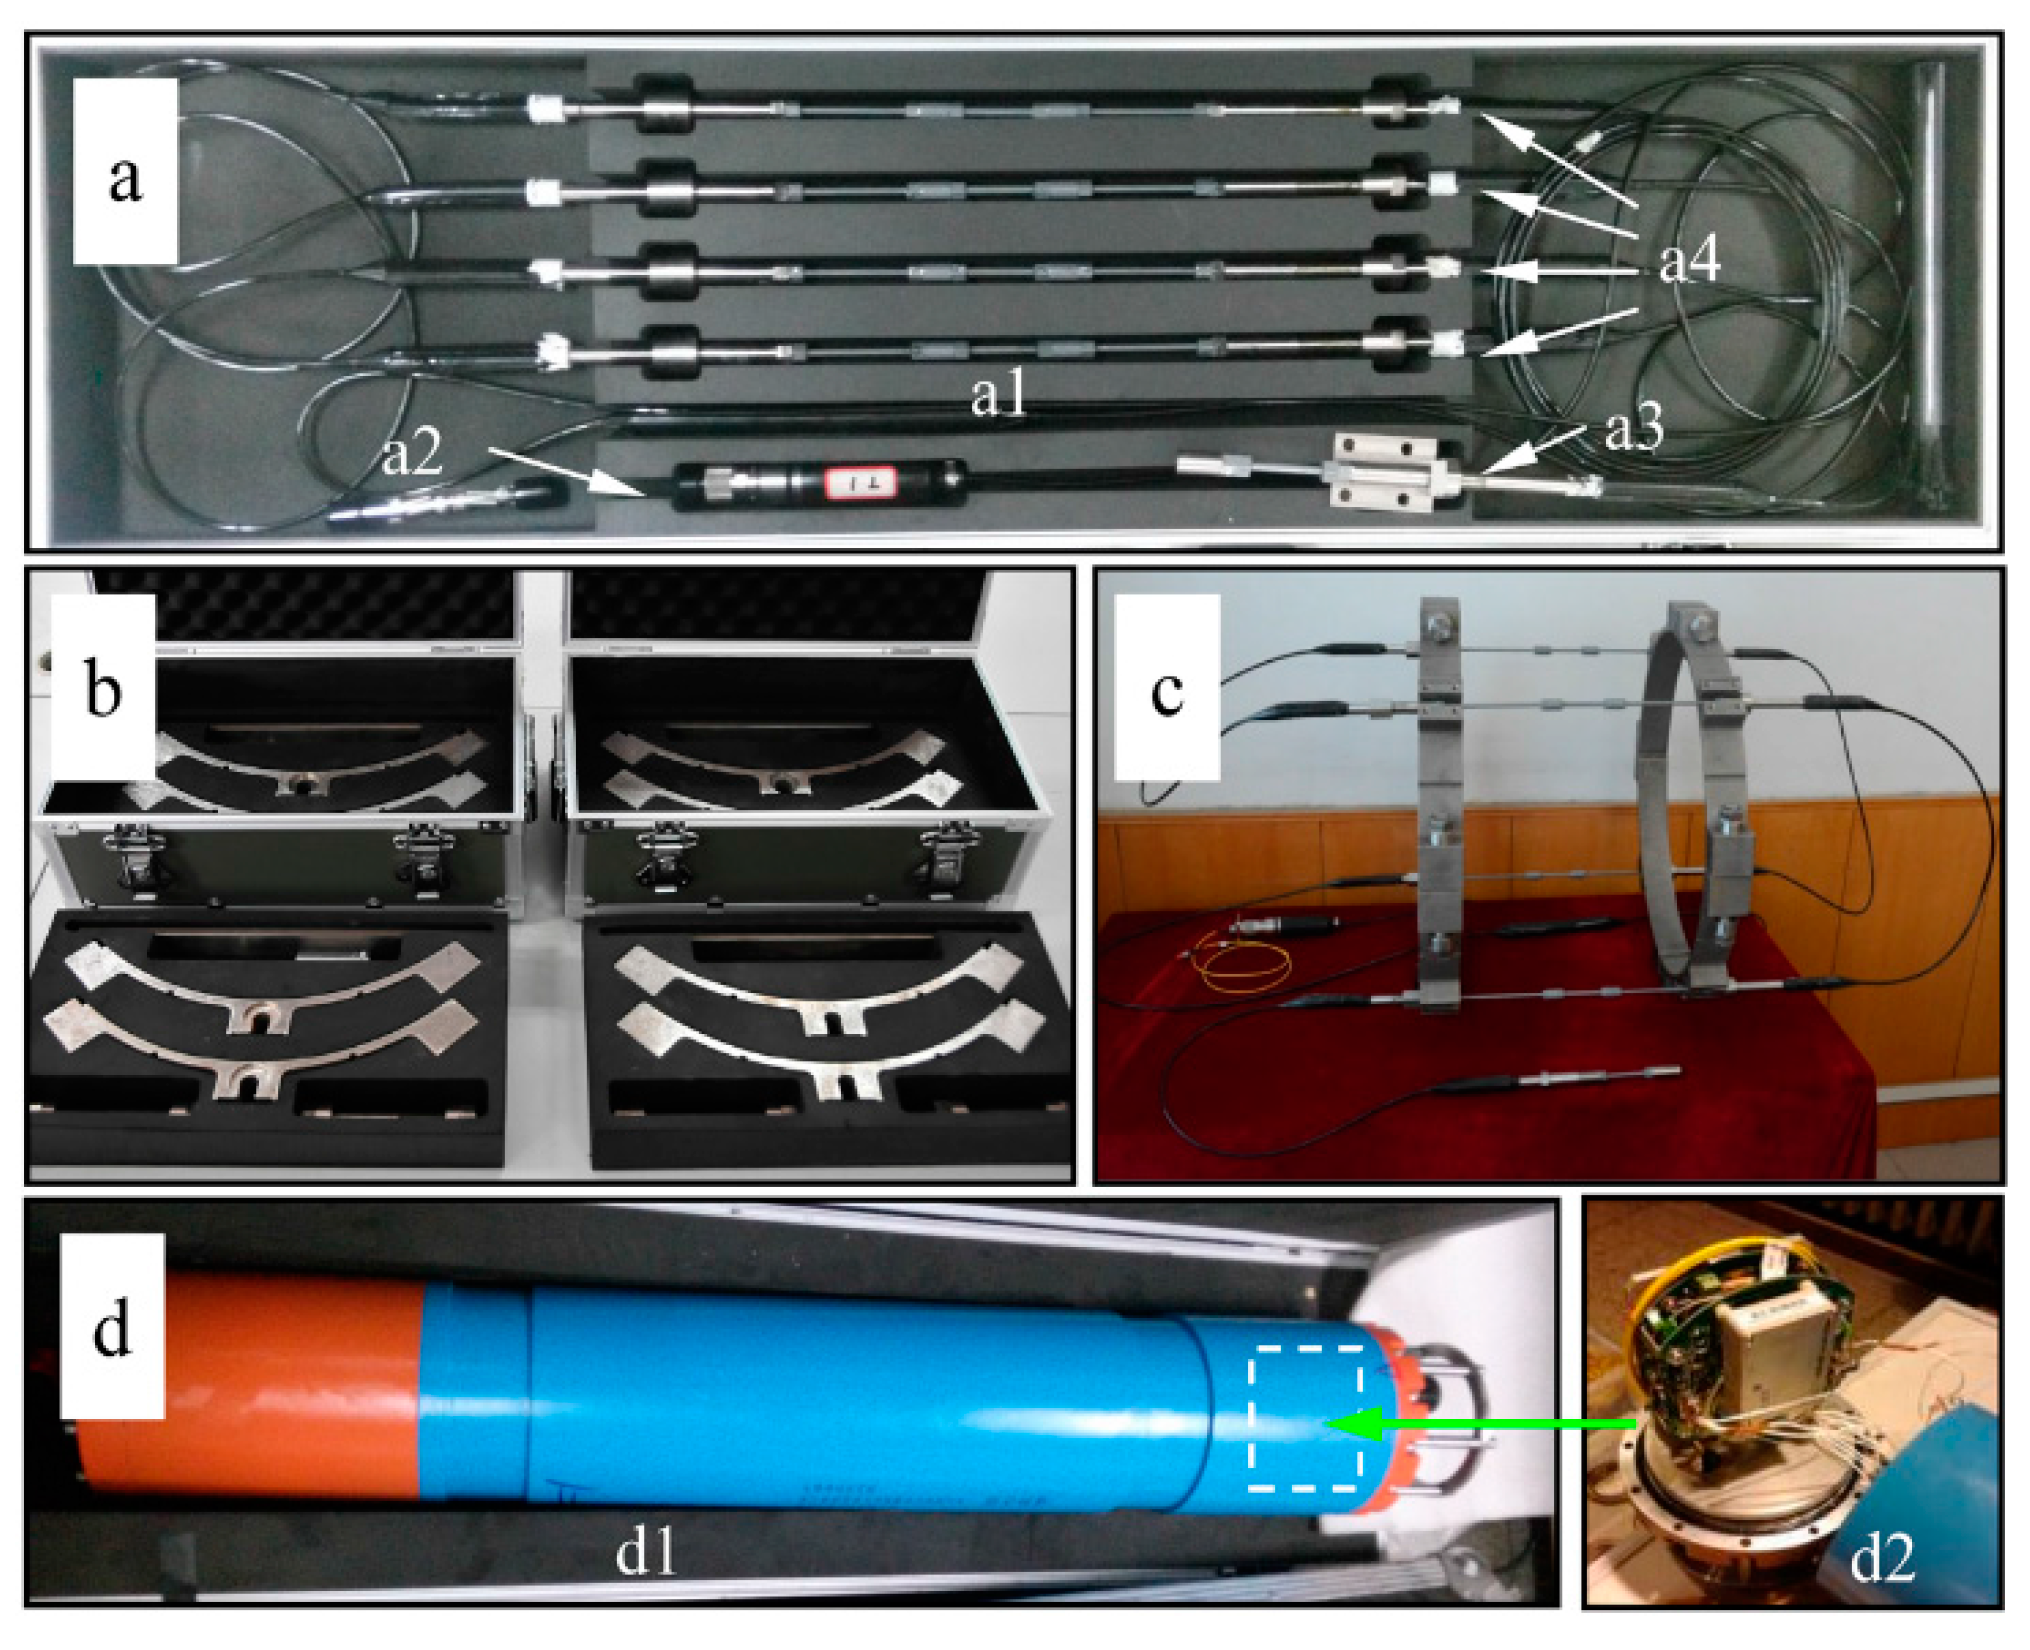
2.1. Structure and Composition

The riser stress monitoring sensor system consists of two ring-shaped ties, an interrogation module and a string of five FBG sensors, as shown in Figure 1. The five FBG sensors shown in Figure 1a are composed of four FBG strain sensors and a FBG environment-compensating sensor. Elastic elements in the middle of FBG sensors are key components to get the wavelength shifts of FBGs caused by stresses in the risers at the installation site. Bare FBGs in elastic elements are protected by all-metal packages that overcome the chirps and creeps that existed in our previously developed sensors [21].
Two ring-shaped ties shown in Figure 1b are disassembled into eight quarter-circle-shaped blocks and eight groups of bolts and nuts. Each block has a counter bore to fix one end of a FBG strain sensor. Figure 1c shows the combination of five FBG sensors and two ring-shaped ties. Four FBG strain sensors are fixed on a bundle structure made by ties and the FBG environment-compensating sensor is single-side fixed. The space between two ties is 440 mm. The longest length of the manufactured elastic elements is 100 mm. Therefore, each FBG strain sensor shown in Figure 1(a4) adds two thinner grey extension tubes to increase the length.
Figure 1. The developed bundle-structure riser stress sensor system. (a) A string of five FBG sensors: elastic elements (a1), an optical fiber connector (a2), a FBG environment-compensating sensor (a3), four FBG strain sensors (a4); (b) two unassembled ring-shaped ties; (c) the assembly of five FBG sensors and two ring-shaped ties; (d) housing (d1) and demodulation module (d2).
Sensors 15 29648 g001
The interrogation module is put in an anti-pressure housing shown in Figure 1d. It interrogates FBG wavelengths reflected by FBG sensors and transmits these signals to the communication module. Then, the communication module in the housing uploads these signals to the oil platform by sonar [23]. Several processing technologies are used to protect the sensor system from the deep sea environment. Anticorrosive paint is utilized to isolate the elastic elements from sea water. Therefore, seawater corrosion and electrochemical corrosion can be effectively avoided. High water-pressure resistant vulcanizate is employed to protect the connections between submarine cables and the FBG sensor ends.

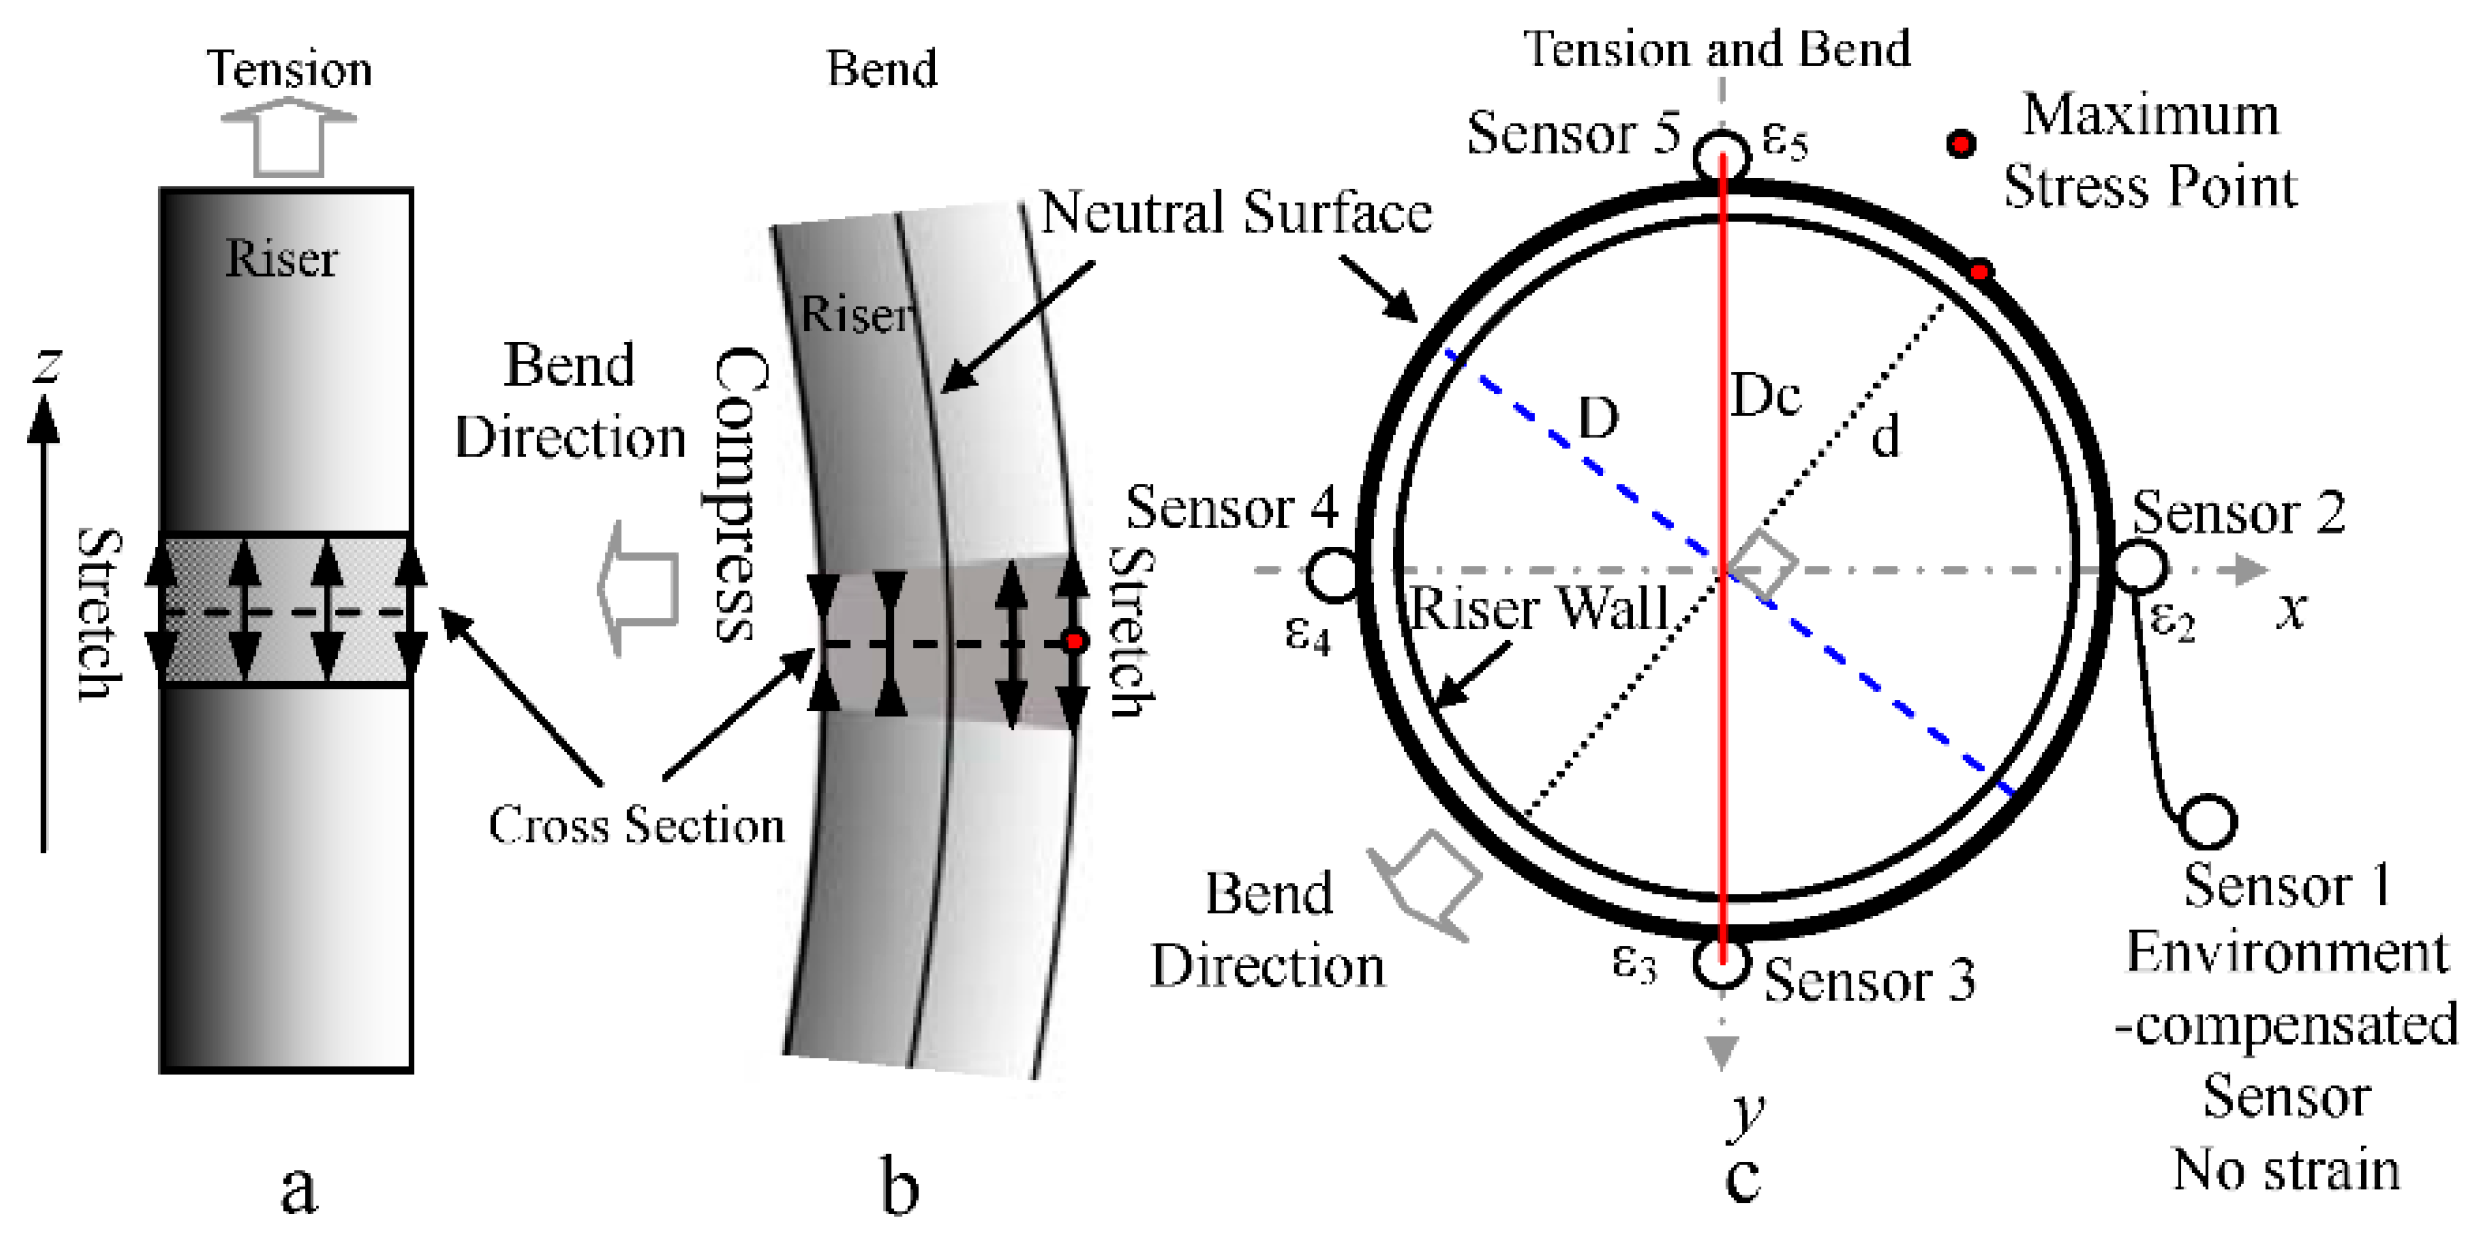
2.2. Sensing Principle

In order to describe what follows conveniently, the meanings of the parameters involved are defined in Table 1.
Table 1. Definition of parameters.
Parameters Parameter MeaningsValues
λ10, λ20, λ30, λ40, λ50Initial wavelengths of FBG sensors--
λ1, λ2, λ3, λ40, λ5Measured wavelengths of FBG sensors--
P, TWater pressure change, Temperature change--
σ, ε, MStress, Strain, Bending moment--
ηSensitivities --
the subscript “p”, “t”, “z”, “w”Sensitivity types related to pressure, temperature, tension and bend, respectively--
the subscript “x”, “yParameter types related to the x axis and the y axis in Figure 2--
the subscript “c” Parameter type related to strain sensors--
IzInertia moment of riser, Iz = π(D4d4)/64--
DInner diameter of riser489 mm
DOuter diameter of riser533 mm
DcEquivalent diameter of the riser stress monitoring sensor576 mm
EElastic modulus of riser metal materials2.05 × 1011 Pa
ηzTension sensitivities of FBG sensors1.09 pm/µε
As shown in Figure 2, when the riser is in tension, riser tension strains in the same cross-section become larger due to stretching and their values are equal, ε2z = ε3z = ε4z = ε5z = εz. The riser stress produced by tension is δz = Eεz.
Figure 2. Schematic diagram of the sensing principle. (a) Riser in tension; (b) Riser under bending; (c) Locations of FBG sensors.
Sensors 15 29648 g002
When the riser is bent, the sensors in the bend direction and on the other side are compressed and stretched, respectively [21]. The riser bend strains are symmetrical around the center point of the riser cross-section. Riser bend strains in the locations of Sensor 2 and Sensor 4 are equal and opposite. It is the same for Sensor 3 and Sensor 5. Therefore, ε2w = − ε4w = εx, ε3w = − ε5w = εy, where the x direction is from riser cross-section center to Sensor 2, and the y direction is from riser cross-section center to Sensor 3. The riser stress produced by a bend in the maximum stress point can be written as:
σ W = E ε x 2 + ε y 2
σ W = M Y / I z
The relationship between bending moment and bend stress is defined by Equation (2), where Y is the distance from the measuring point to the riser neutral surface. At the maximum stress point, Y = D/2. Therefore, the bending moment is given by:
M = 2 E I z ε x 2 + ε y 2 / D
When the riser is both in tension and bent, its maximum stress becomes:
σ max = σ z + σ w
Similarly, the strains of a single FBG strain sensor consist of the tension strain εcz and the bending strain εcw. The relationships between riser strains and sensor strains are expressed as:
ε = ε z + ε w , ε c = ε cz + ε cw , ε z = ε cz , ε w = ε cw D / D c
In deep sea conditions, the measured wavelength of a single FBG strain sensor is determined by the initial wavelength, the pressure and temperature of water, and the tension and bend of riser. The relationship can be shown as:
λ = λ 0 + η p P + η t T + η z ε cz + η w ε cw
By mechanics analysis, the relationship between the bend strain sensitivity ηw and the tension strain sensitivity ηz is ηw = ηzDc/D. Therefore, we obtain:
λ = λ 0 + η p P + η t T + η z ( ε z + ε w D c 2 / D 2 )
η 1p = η 2p = η 3 p = η 4 p = η 5 p = η p , η 1t = η 2t = η 3 t = η 4 t = η 5 t = η t , η 2z = η 3 z = η 4 z = η 5 z = η z
{ λ 1 = λ 10 + η p P + η t T λ 2 = λ 20 + η p P + η t T + η z ( ε z + ε x D c 2 / D 2 ) λ 3 = λ 30 + η p P + η t T + η z ( ε z + ε y D c 2 / D 2 ) λ 4 = λ 40 + η p P + η t T + η z ( ε z ε x D c 2 / D 2 ) λ 5 = λ 50 + η p P + η t T + η z ( ε z ε y D c 2 / D 2 )
As shown in Equation (8), the sensitivities of pressure and temperature of all FBG sensors are equal owing to the use of the same design and the same processing technology. It is the same for the tension sensitivities of the four strain sensors. The dependences of the environmental parameters and the riser strains on the wavelengths of FBG sensors can be described using Equation (9). No strain exists in Sensor 1 because of its single-side fixation. Regarding two environment parts (ηpP, ηtT) as an independent one, there are only four unknown quantities (εx, εy, εz, ηpP + ηtT) in Equation (9). From Equation (9), we get:
{ ε z = [ ( λ 2 λ 20 ) + ( λ 3 λ 30 ) + ( λ 4 λ 40 ) + ( λ 5 λ 50 ) 4 ( λ 1 λ 10 ) ] / 4 η z ε x = [ ( λ 2 λ 20 ) ( λ 4 λ 40 ) ] D 2 / 2 η z D c 2 ε y = [ ( λ 3 λ 30 ) ( λ 5 λ 50 ) ] D 2 / 2 η z D c 2
Finally, the values of bending moment and maximum stress in riser can be obtained easily by substituting Equation (10) into Equations (3) and (4).

3. Test Process

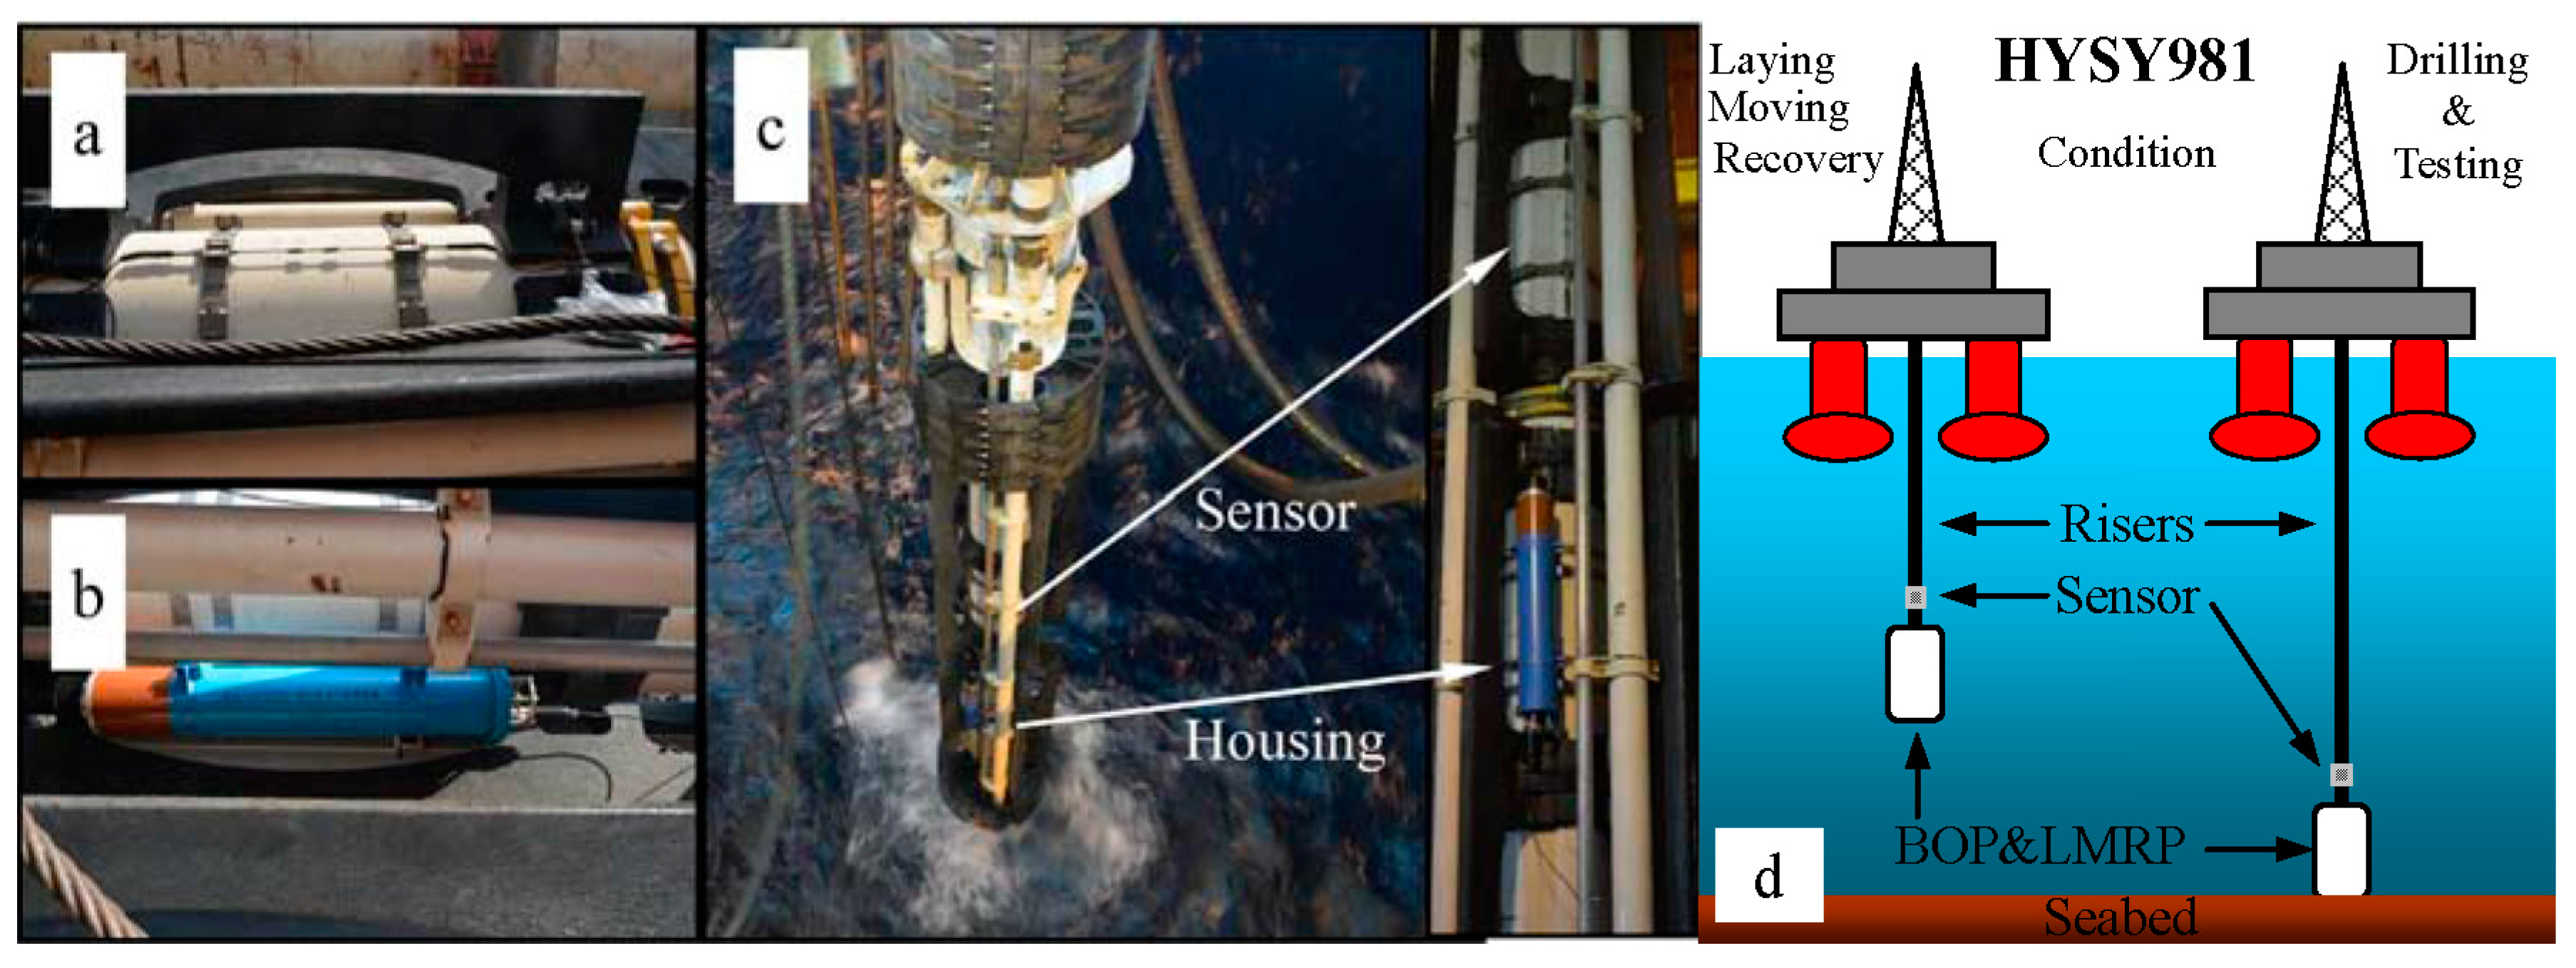
3.1. Sensor Installation

The riser stress monitoring sensor system was tested in the ocean oil drilling platform named “HYSY981”. The installation included six steps: determining the mounting positions, mounting ring-shaped ties, mounting the sensors, detecting signals, connecting the fiber optic connectors and providing power. Then, all parts of the sensor system were assembled in the middle of a riser as shown in Figure 3a,b. Figure 3c shows a close-up of the sensor system before it was lowered into the water. From this moment on, the sensor system began to monitor riser stresses and send five FBG wavelengths per hour.
Figure 3. The sensor system assembled on a riser. (a) Assembled connected sensors and ties; (b) assembled housing; (c) close-up of the sensor system lowered into water; (d) working conditions schematic of the ocean oil drilling platform “HYSY981”.
Sensors 15 29648 g003

3.2. Riser Working Conditions

In the sea area named Lingshui in the South China Sea, two oil wells marked as LS17-2-7 and LS17-2-8 were drilled with water depths of 1365 m and 1252 m, respectively. In the 49-day marine test from 14 October to 1 December in 2014, the risers experienced four basic working conditions presented in Figure 3d. Under laying conditions, risers are connected into a string and laid in the water. In this period, the temperature decreases and the water pressure increases as the sensor system depth in the water increases. Moving conditions means that the oil drilling platform is moved from one well to the other. Recovery conditions means that the risers are disconnected and returned to the platform. In the recovery period, the temperature became higher and the water pressure gradually became lower. In drilling and testing conditions, the bottom of riser is connected to the seabed when an oil well is drilled or tested.

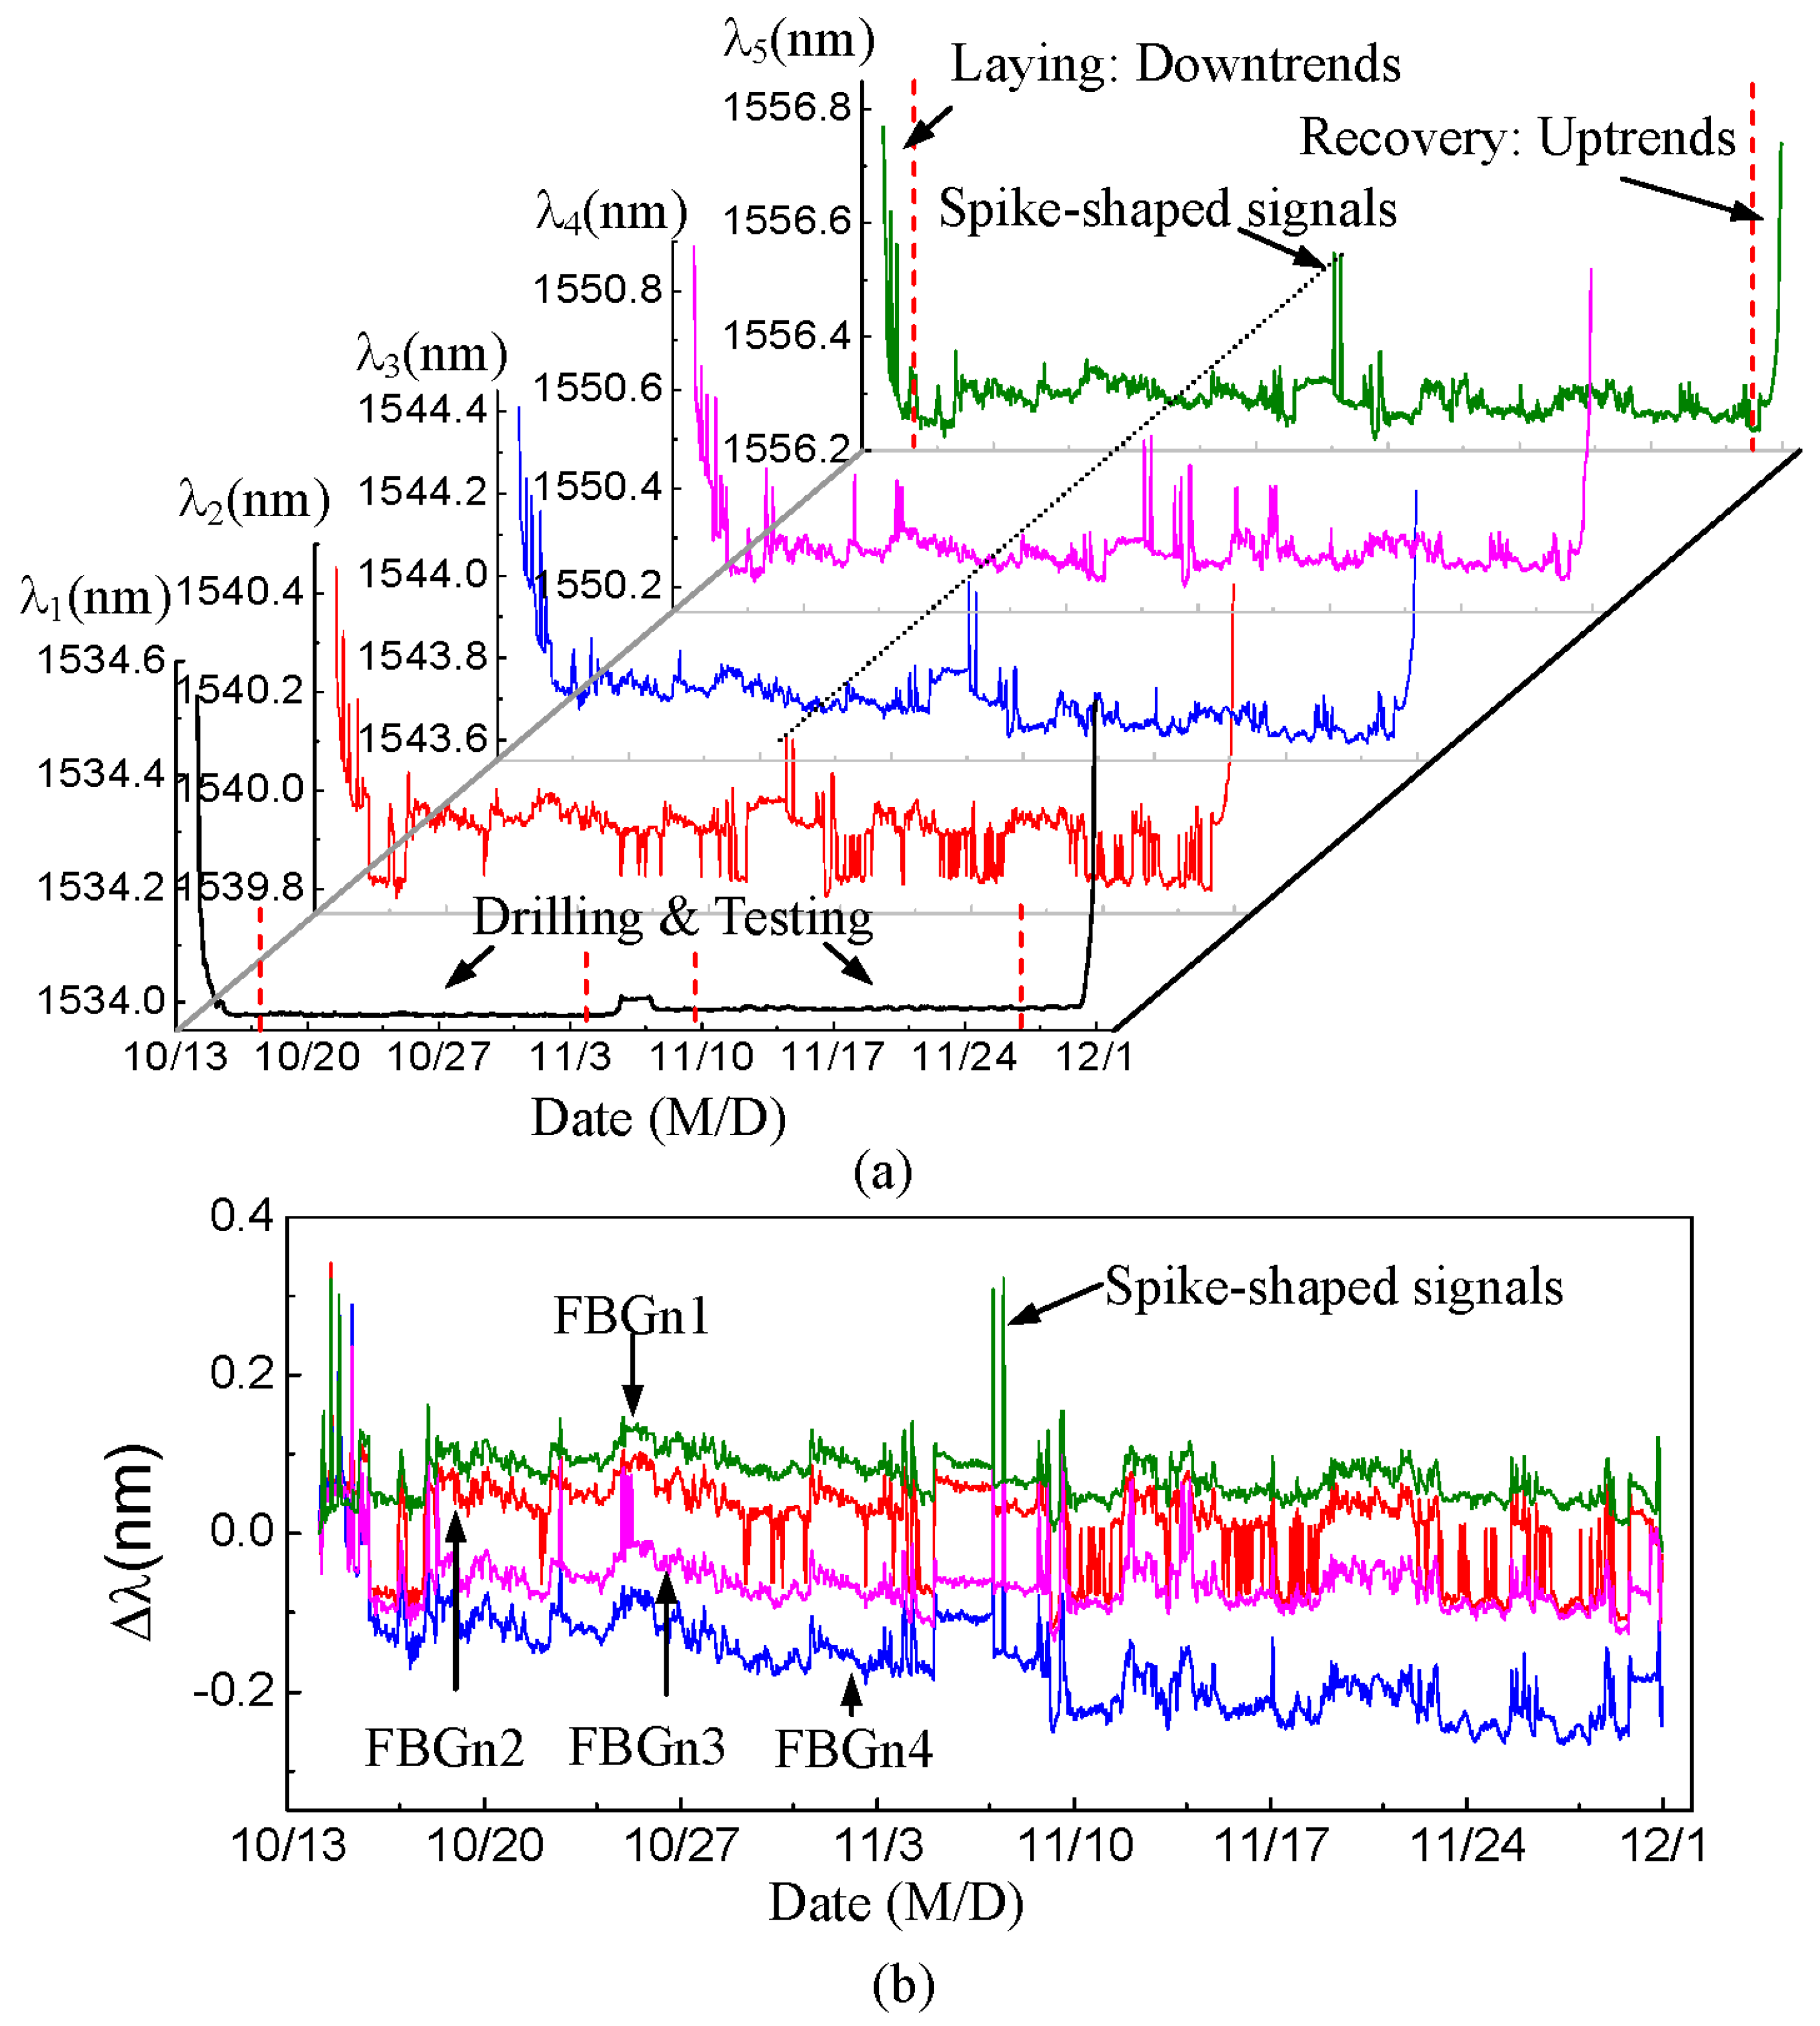
4. Data and Analysis

Figure 4a presents the measured wavelengths of the five FBG sensors in the marine test. The abscissa is the time axis and the ordinate represents the measured wavelength values. The signal continuity of the five wavelength curves shows that the sensor system worked well, without sensor damage or signal failure in actual working conditions under water.
Figure 4. Marine test data of the riser stress monitoring sensor system. (a) Measured wavelengths of five FBG sensors; (b) compensated data of four FBG strain sensors.
Sensors 15 29648 g004
The five wavelength curves have downward trends on October 15 when the risers were in laying conditions, and upward trends on 30 November 2014 when risers were in recovery conditions. The previous experimental investigations in the lab [22] indicated that the wavelength values of FBG sensors are proportional to temperature changes and inversely proportional to water pressure changes. According to the trends of temperature and pressure under seawater in riser working conditions, the downtrends and the uptrends of the curves are consistent with the actual shifts of measured wavelengths. In drilling and testing conditions, the risers were connected to the seabed and the temperature and suffered pressure of sensors under deep water can be thought of as constants owing to the given water depth. Moreover, Sensor 1 was not affected by the riser strains, so the stability in the bottom of Curve λ1 is reasonable.
The sensor data after environmental compensation is shown in Figure 4b, where Δλ = λλ0 is the measured wavelength shift of each FBG sensor, and FBGn1 = Δλ2 − Δλ1, FBGn2 = Δλ3 − Δλ1, FBGn3 = Δλ4 − Δλ1, FBGn4 = Δλ5 − Δλ1. The downtrends and uptrends disappear under laying and recovery conditions because of the practical environmental compensation. In the four compensated curves, some spike-shaped signals appearing at the same time also verify the time consistency of these FBG sensors. The continuity, reasonability and time consistency of the data effectively show that the sensor system had been installed reliably. Vibrations or other environmental conditions had no significant impact on the sensor system in the marine test.

5. Results and Discussion

According to Equations (3) and (4) and the weight (267 tons) of the blowout preventer (BOP) and lower marine riser package (LMRP), the monitored results of stress and bending moment are obtained in Figure 5. Under three basic working conditions, namely laying, moving and recovery, the detailed stress results are shown in Figure 5a(2,3,4), and the detailed bending moment results are shown in Figure 5b(2,3,4), respectively. In each set of basic condition, more detailed conditions are observed.
Figure 5. (a) Stress results; (b) bending moment results.
Sensors 15 29648 g005

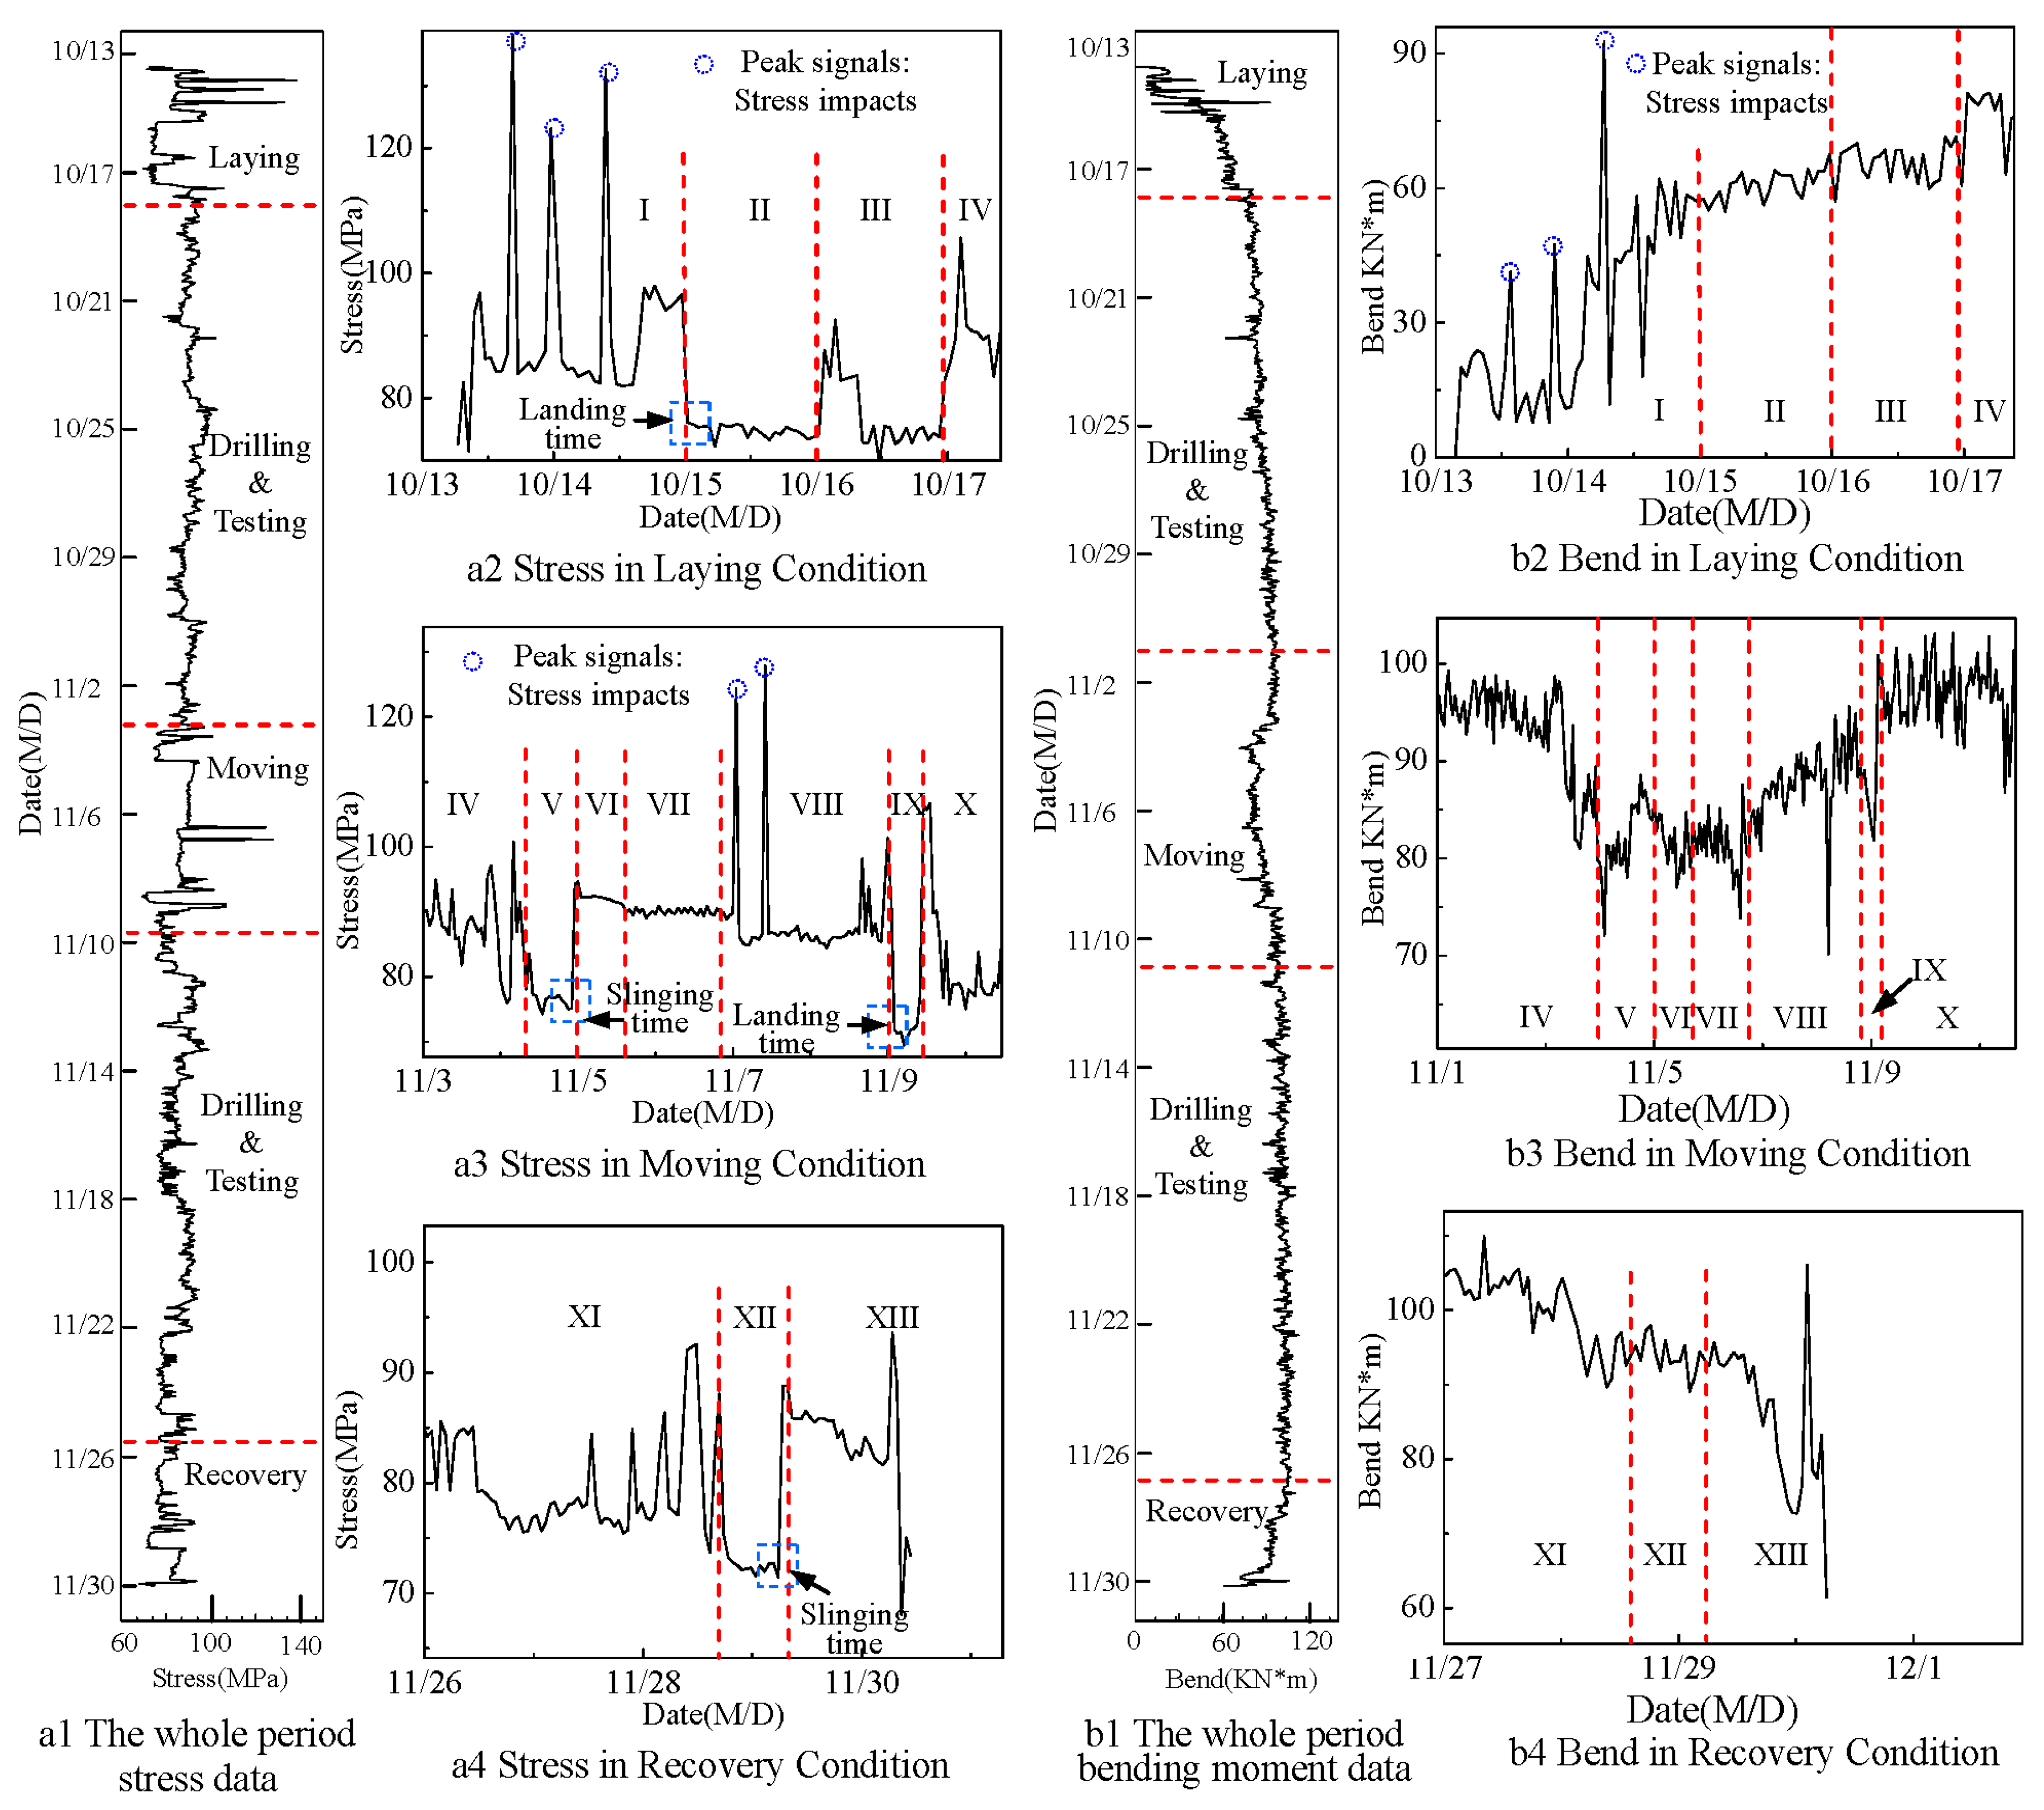
5.1. Stress Analysis

The analysis of stress results are shown in Table 2. In all thirteen detailed periods shown in Figure 5, stress trends can be reasonably explained. This indicates that stress results agree well with the actual work conditions.
Table 2. Stress trends under different detailed conditions.
Working Condition Specific ContentStress TrendsMain Causes of Changes
LayingC1Riser connecting High and unstable; With some stress impacts;Risers were influenced by unstable waves, surges and the gravity of BOP and LMRP; sudden braking of the riser crane produced stress impacts.
C2BOP pressure testLow and stable;There was no BOP and LMRP gravity influence; the platform position was locked right above the well head that straightened the riser string.
C3Drilling preparationHigh and unstable at the beginning; then stable Using or changing of tools in drilling caused unstable stresses; risers became stable in testing.
Drilling & TestingC4Drilling & TestingSometime high and unstable; sometime low and unstable;Same as Condition C3
MovingC5Regain preparationLow and stable;Same as Condition C2
C6Regain risersHigh and unstable;It is the same as Condition C1 except stress impacts.
C7Moving drilling platformLow and unstable;When the platform was moved to the second well, seven risers were disconnected to avoid the collision between BOP and the seabed. The depth of sensor was decreased. Remaining risers was influenced by unstable waves, surges and the gravity of BOP and LMRP, but the depth had no change in moving.
C8Connecting risersHigh and unstable; With some stress impacts;Same as Condition C1
C9BOP pressure testLow and stable;Same as Condition C2
C10Drilling preparationHigh and unstable at the beginning; then stableSame as Condition C3
Drilling & TestingC11Drilling & TestingSometime high and unstable; sometime low and unstable;Same as Condition C3
RecoveryC12Recovery preparationLow and stable;Same as Condition C2
C13Recover risersHigh and unstable;Same as Condition C6
Special Times--Landing timemuch lower in a suddenBOP and LMRP touched the seabed, no gravity influenced risers.
--Slinging timemuch higher in a sudden BOP and LMRP left the seabed, the gravity influenced risers.
In laying conditions, the maximum stress is 132.7 MPa. The yield strength of the riser materials named X80 Steel is 552 MPa and the allowable stress is 220.8 MPa. The maximum stress of the riser measured during the whole monitoring period is below the allowable stress. The initial stress after sensor installation is 78.7 MPa and the final stress before sensor removal is 73.4 MPa. The difference between the values of these two stresses is 5.3 MPa, mainly caused by perpendicularly moving surges forced on the heavy BOP and LMRP.

5.2. Bending Moment Analysis

Seen in Figure 5(b1), the maximum bending moment is less than 106 kNm during the monitoring period. As shown in Figure 5(b3), bending moments decrease under moving conditions when the platform was being moved to the other well. In Figure 5(b4), a large spike-shaped signal appears at the end, indicating that there was a sudden bend impact when the risers were disconnected. The initial bending moment has a big difference from the final one. Considering that BOP and LMRP were influenced by horizontally moving waves, the error is reasonable.

5.3. Results Reliability Analysis

The stress results from CNOOC mechanical simulation at different offsets are provided in Figure 6. The abscissa is the stress axis and the ordinate represents the distance to the seabed. When the offset is below 4% water deep (WD), the stress range is 82~95 MPa. The average stress of all measured stresses in drilling and testing conditions is about 86.6 MPa. This value is consistent with the CNOOC mechanical simulation results.
In summary, the marine test of the stress monitoring sensor system is proved to be successful and its results are reliable, but with the battery power limitations, only one group of FBG wavelengths was uploaded per hour and many other detailed values were lost. Without this limitation, more stress impacts could be found.
Figure 6. CNOOC mechanical simulation stress results.
Sensors 15 29648 g006

6. Conclusions

For the monitoring of the stress and bending movements in drilling risers of offshore drilling platforms, a bundle-structured riser stress sensor based on FBG was developed. Thanks to the cooperation with many departments of the CNOOC, a 49-day marine test at water depths of 1365 m and 1252 m was completed on the “HYSY-981” ocean oil drilling platform. Because no welding and pasting are used when the sensor is installed on risers, the installation is convenient, reliable and harmless to risers. The continuous, reasonable and time-consistent data obtained indicates that the sensor worked normally underwater. The monitored results show that the sensor monitors stresses and bending moments accurately. The measured maximum stress is 132.7 MPa and it is below the allowable stress. In drilling & testing conditions, the average riser stress is 86.6 MPa and this value is within the range of CNOOC mechanical simulation results. It is shown that the developed sensor can meet the requirements for monitoring stress in risers under water.

Acknowledgments

This work was supported by the Important National Science and Technology Specific Projects of China (Grant No. 2011ZX05026-001-06 and Grant No. 2008ZX05026-001-06), Technology Innovation Foundation of Northwestern Polytechnical University (Grant NO. 2012KJ01005) and the Northwestern Polytechnical University Foundation for Fundamental Research (Grant No. JC20110272).

Author Contributions

Jian Xu, Dexing Yang, Chuan Qin, Yajun Jiang and Leixiang Sheng conceived and designed the experiments; Jian Xu, Chuan Qin and Leixiang Sheng performed the experiments; Jian Xu, Xiangyun Jia and Yang Bai analyzed the data; Xiaohong Shen, Haiyan Wang, Xin Deng, Liangbin Xu and Shiquan Jiang contributed reagents/materials/analysis tools; Jian Xu wrote the paper. Dexing Yang and Yajun Jiang reviewed this paper. All authors have read and approved the manuscript.

Conflicts of Interest

The authors declare no conflict of interest.

References

  1. Constantinides, Y.; Chen, J.-H.; Tran, L.; Enuganti, P.; Campbell, M. Comparison of SCR field response with analytical predictions. In Proceedings of the 30th International Conference on Ocean, Offshore and Arctic Engineering, Rotterdam, The Netherlands, 19–24 June 2011; pp. 883–888.
  2. Karayaka, M.; Ruf, W.; Natarajan, S. Steel catenary riser response characterization with on-line monitoring devices. In Proceedings of the 28th International Conference on Ocean, Honolulu, HI, USA, 31 May–5 June 2009; pp. 687–698.
  3. Karayaka, M.; Chen, J.-H.; Blankenshipp, C.; Ruf, W.; Podskarbi, M. SS: Tahiti on-line monitoring system for steel catenary risers and flowlines. In Proceedings of the 2009 Offshore Technology Conference, Houston, TX, USA, 4–7 May 2009.
  4. Zimmermann, C.; Edwards, R.; de la Cruz, D.; Talmont, P.; Maroju, S. Recent experience with a comprehensive riser tower monitoring system. In Proceedings of the D.O.T International Conference, New Orleans, LA, USA, 3–5 February 2009.
  5. Inaudi, D.; Glisic, B. Fiber optic sensing for innovative oil and gas production and transport systems. In Proceedings of the 18th International Conference on Optical Fiber Sensors, Cancun, Mexico, 23–27 October 2006. [CrossRef]
  6. Inaudi, D.; Glisic, B.; Gasparoni, F.; Cenedese, S.; Zecchin, M. Strain sensors for deepwater applications. In Proceedings of the 3rd International Conference on Structural Health Monitoring of Intelligent Infrastructure, Vancouver, BC, Canada, 13–16 November 2007.
  7. Tuck, J.; Lee, P. Inverse transient analysis for classification of wall thickness variations in pipelines. Sensors 2013, 13, 17057–17066. [Google Scholar] [CrossRef]
  8. Almazyad, A.S.; Seddiq, Y.M.; Alotaibi, A.M.; Al-Nasheri, A.Y.; BenSaleh, M.S.; Obeid, A.M.; Qasim, S.M. A proposed scalable design and simulation of wireless sensor network-based long-distance water pipeline leakage monitoring system. Sensors 2014, 14, 3557–3577. [Google Scholar] [CrossRef] [PubMed]
  9. Wan, K.T.; Leung, C.K. Durability tests of a fiber optic corrosion sensor. Sensors 2012, 12, 3656–3668. [Google Scholar] [CrossRef] [PubMed]
  10. Brower, D.; Hedengren, J.D.; Shishivan, R.A.; Brower, A. Advanced deepwater monitoring system. In Proceedings of the 32nd International Conference on Ocean, Nantes, France, 9–14 June 2013. [CrossRef]
  11. Qiu, Y.; Wang, Q.-B.; Zhao, H.-T.; Chen, J.-A.; Wang, Y.-Y. Review on composite structural health monitoring based on fiber bragg grating sensing principle. J. Shanghai Jiaotong Univ. (Sci.) 2013, 18, 129–139. [Google Scholar] [CrossRef]
  12. Baldwin, C.S. Applications for fiber optic sensing in the upstream oil and gas industry. In Proceedings of the Fiber Optic Sensors and Applications XII, Baltimore, MD, USA, 22–23 April 2015.
  13. Shishavan, R.A.; Brower, D.V.; Hedengren, J.D.; Brower, A.D. New advances in post-installed subsea monitoring systems for structural and flow assurance evaluation. In Proceedings of the 33rd International Conference on Ocean, Offshore and Arctic Engineering, San Francisco, CA, USA, 8–13 June 2014. [CrossRef]
  14. Brower, D.V.; Prescott, N. Real time subsea monitoring and control smart field solutions. In Proceedings of the Subsea Rio Conference, Rio, Brazil, 3 June 2004.
  15. Morrison, D.; Dean, J. Apparatuses and Methods for Monitoring Stress in Steel Catenary Risers. U.S. Patent US20060230839 A1, 19 October 2006. [Google Scholar]
  16. Ren, L.; Jia, Z.; Ho, M.S.C.; Yi, T.; Li, H. Application of fiber bragg grating based strain sensor in pipeline vortex-induced vibration measurement. Sci. China Tech. Sci. 2014, 57, 1714–1720. [Google Scholar] [CrossRef]
  17. Wang, J.; Fu, S.; Baarholm, R.; Wu, J.; Larsen, C.M. Fatigue damage of a steel catenary riser from vortex-induced vibration caused by vessel motions. Mar. Struct. 2014, 39, 131–156. [Google Scholar] [CrossRef]
  18. Morikawa, S.R.; Camerini, C.S.; Pipa, D.R.; Santos, J.M.; Pires, G.P.; Braga, A.M.; Llerena, R.W.; Ribeiro, A.S. Monitoring of flexible oil lines using FBG sensors. In Proceedings of the 19th International Conference on Optical Fibre Sensors, Perth, Australia, 14 April 2008. [CrossRef]
  19. Weppenaar, N.; Andersen, B. Investigation of tension armor wire breaks in flexible risers and a method for detection. In Proceedings of the 33rd International Conference on Ocean, San Francisco, CA, USA, 8–13 June 2014. [CrossRef]
  20. Dikshit, V.; Seng, O.L.; Maheshwari, M.; Asundi, A. Failure assessment of aluminum liner based filament-wound hybrid riser subjected to internal hydrostatic pressure. In Proceedings of the International Conference on Experimental Mechanics, Singapore, 15 November 2014. [CrossRef]
  21. Jiang, Y.; Yang, D.; Wang, J.; Xu, J.; Qin, C.; Liao, W.; Zhao, J.; Wang, H.; Jiang, S. Strain monitoring of drilling riser in deepwater based on fiber bragg gratings. In Proceedings of International Conference on Optical Instruments and Technology, Beijing, China, 6 November 2011. [CrossRef]
  22. Xu, J.; Yang, D.; Jiang, Y.; Wang, M.; Zhai, H.; Bai, Y. Packaged FBG sensors for real-time stress monitoring on deep-water riser. In Proceedings of the International Society for Optics and Photonics, Beijing, China, 9 October 2014. [CrossRef]
  23. Li, B.; Wang, H.; Shen, X.; Yan, Y.; Yang, F.; Hua, F. Deep-water riser fatigue monitoring systems based on acoustic telemetry. J. Ocean Univ. China 2014, 13, 951–956. [Google Scholar] [CrossRef]

