
Study on Miniaturized UHF Antennas for Partial Discharge Detection in High-Voltage Electrical Equipment

Abstract
:1. Introduction
2. Design of the UHF Antennas
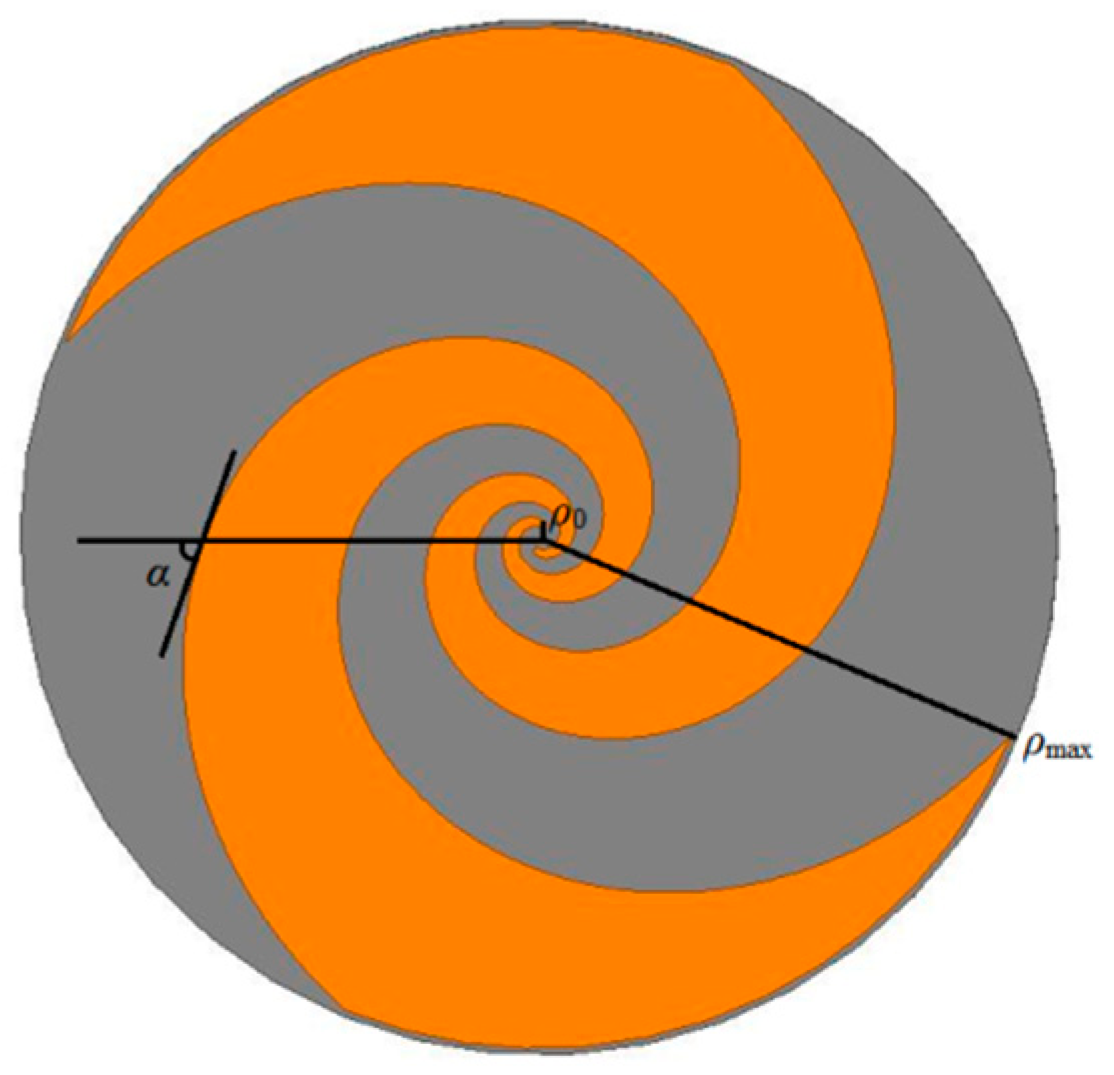
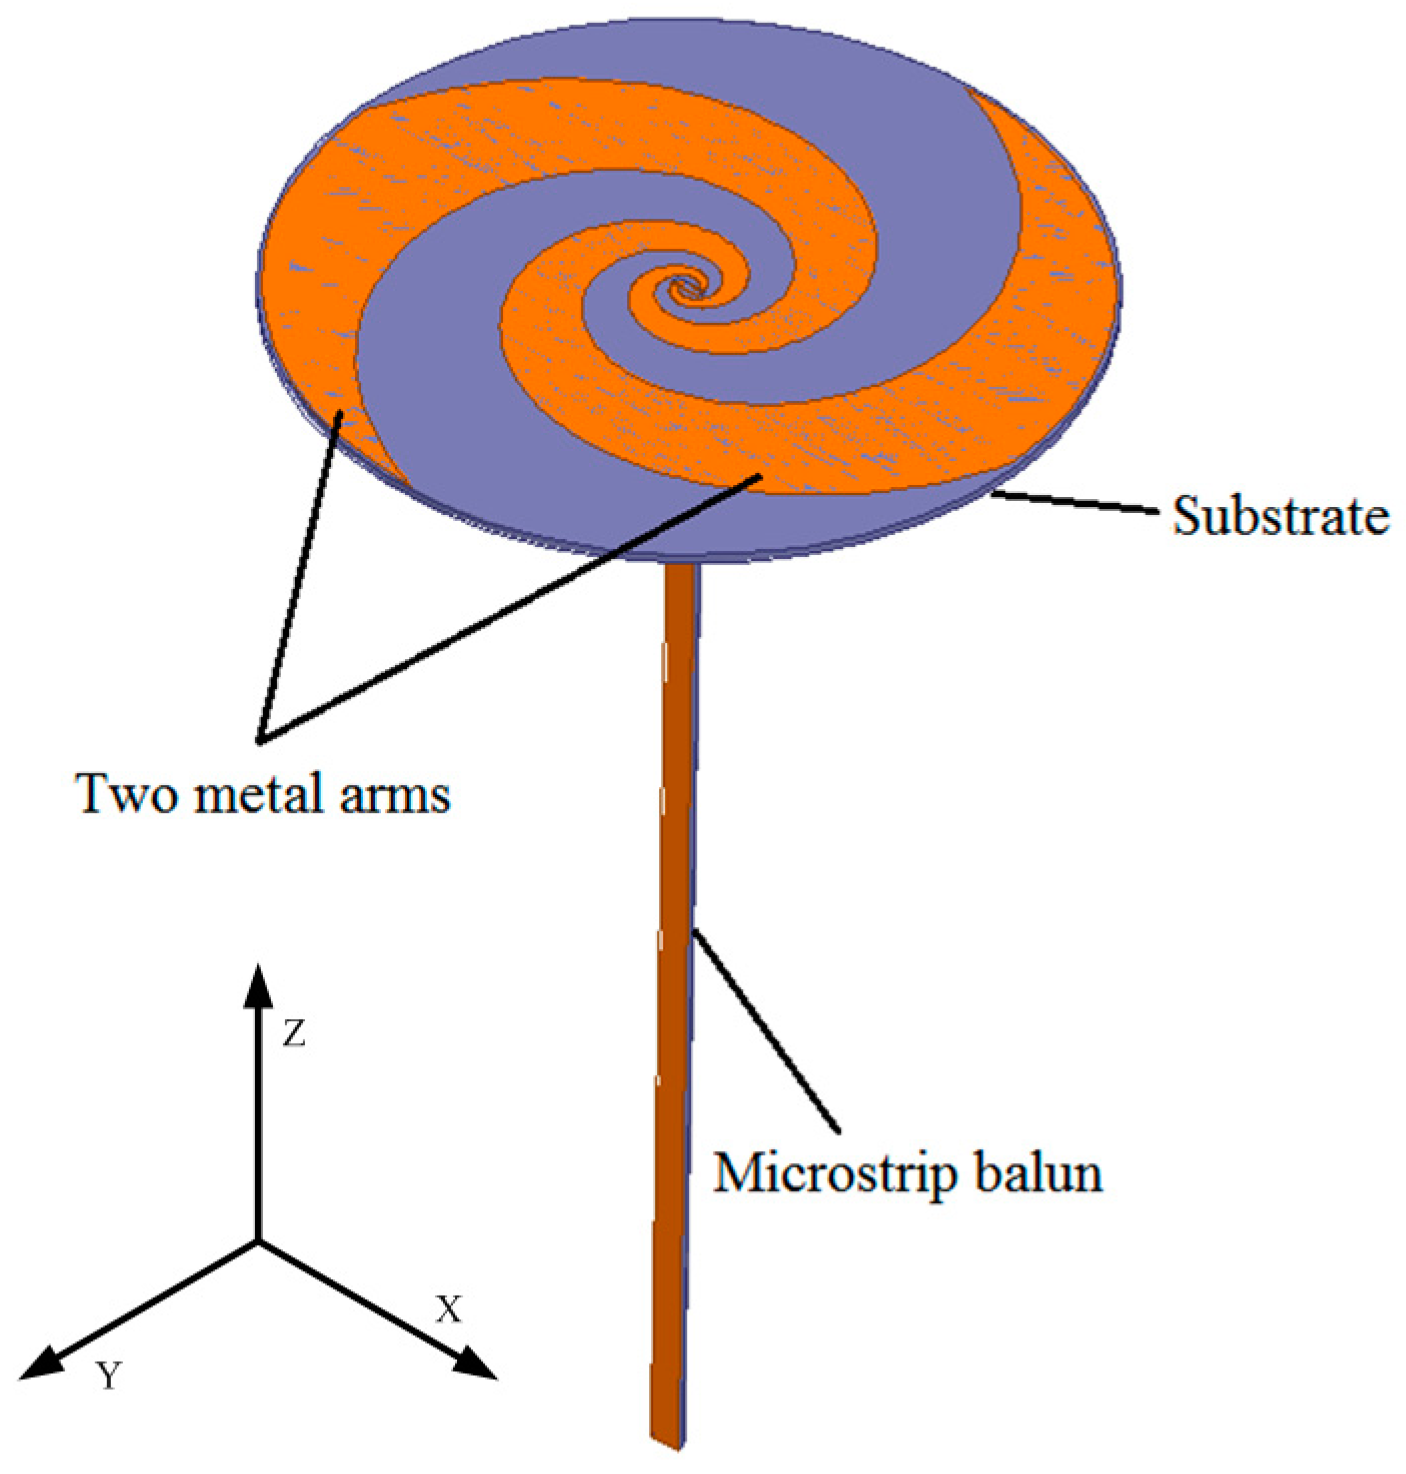
2.1. Design of a Dual-Arm ESA


| Wrap Angle | Rotation Angle | Substrate Thickness | Relative Permittivity |
|---|---|---|---|
| 70° | 3 π | 1.6 mm | 4.4 |


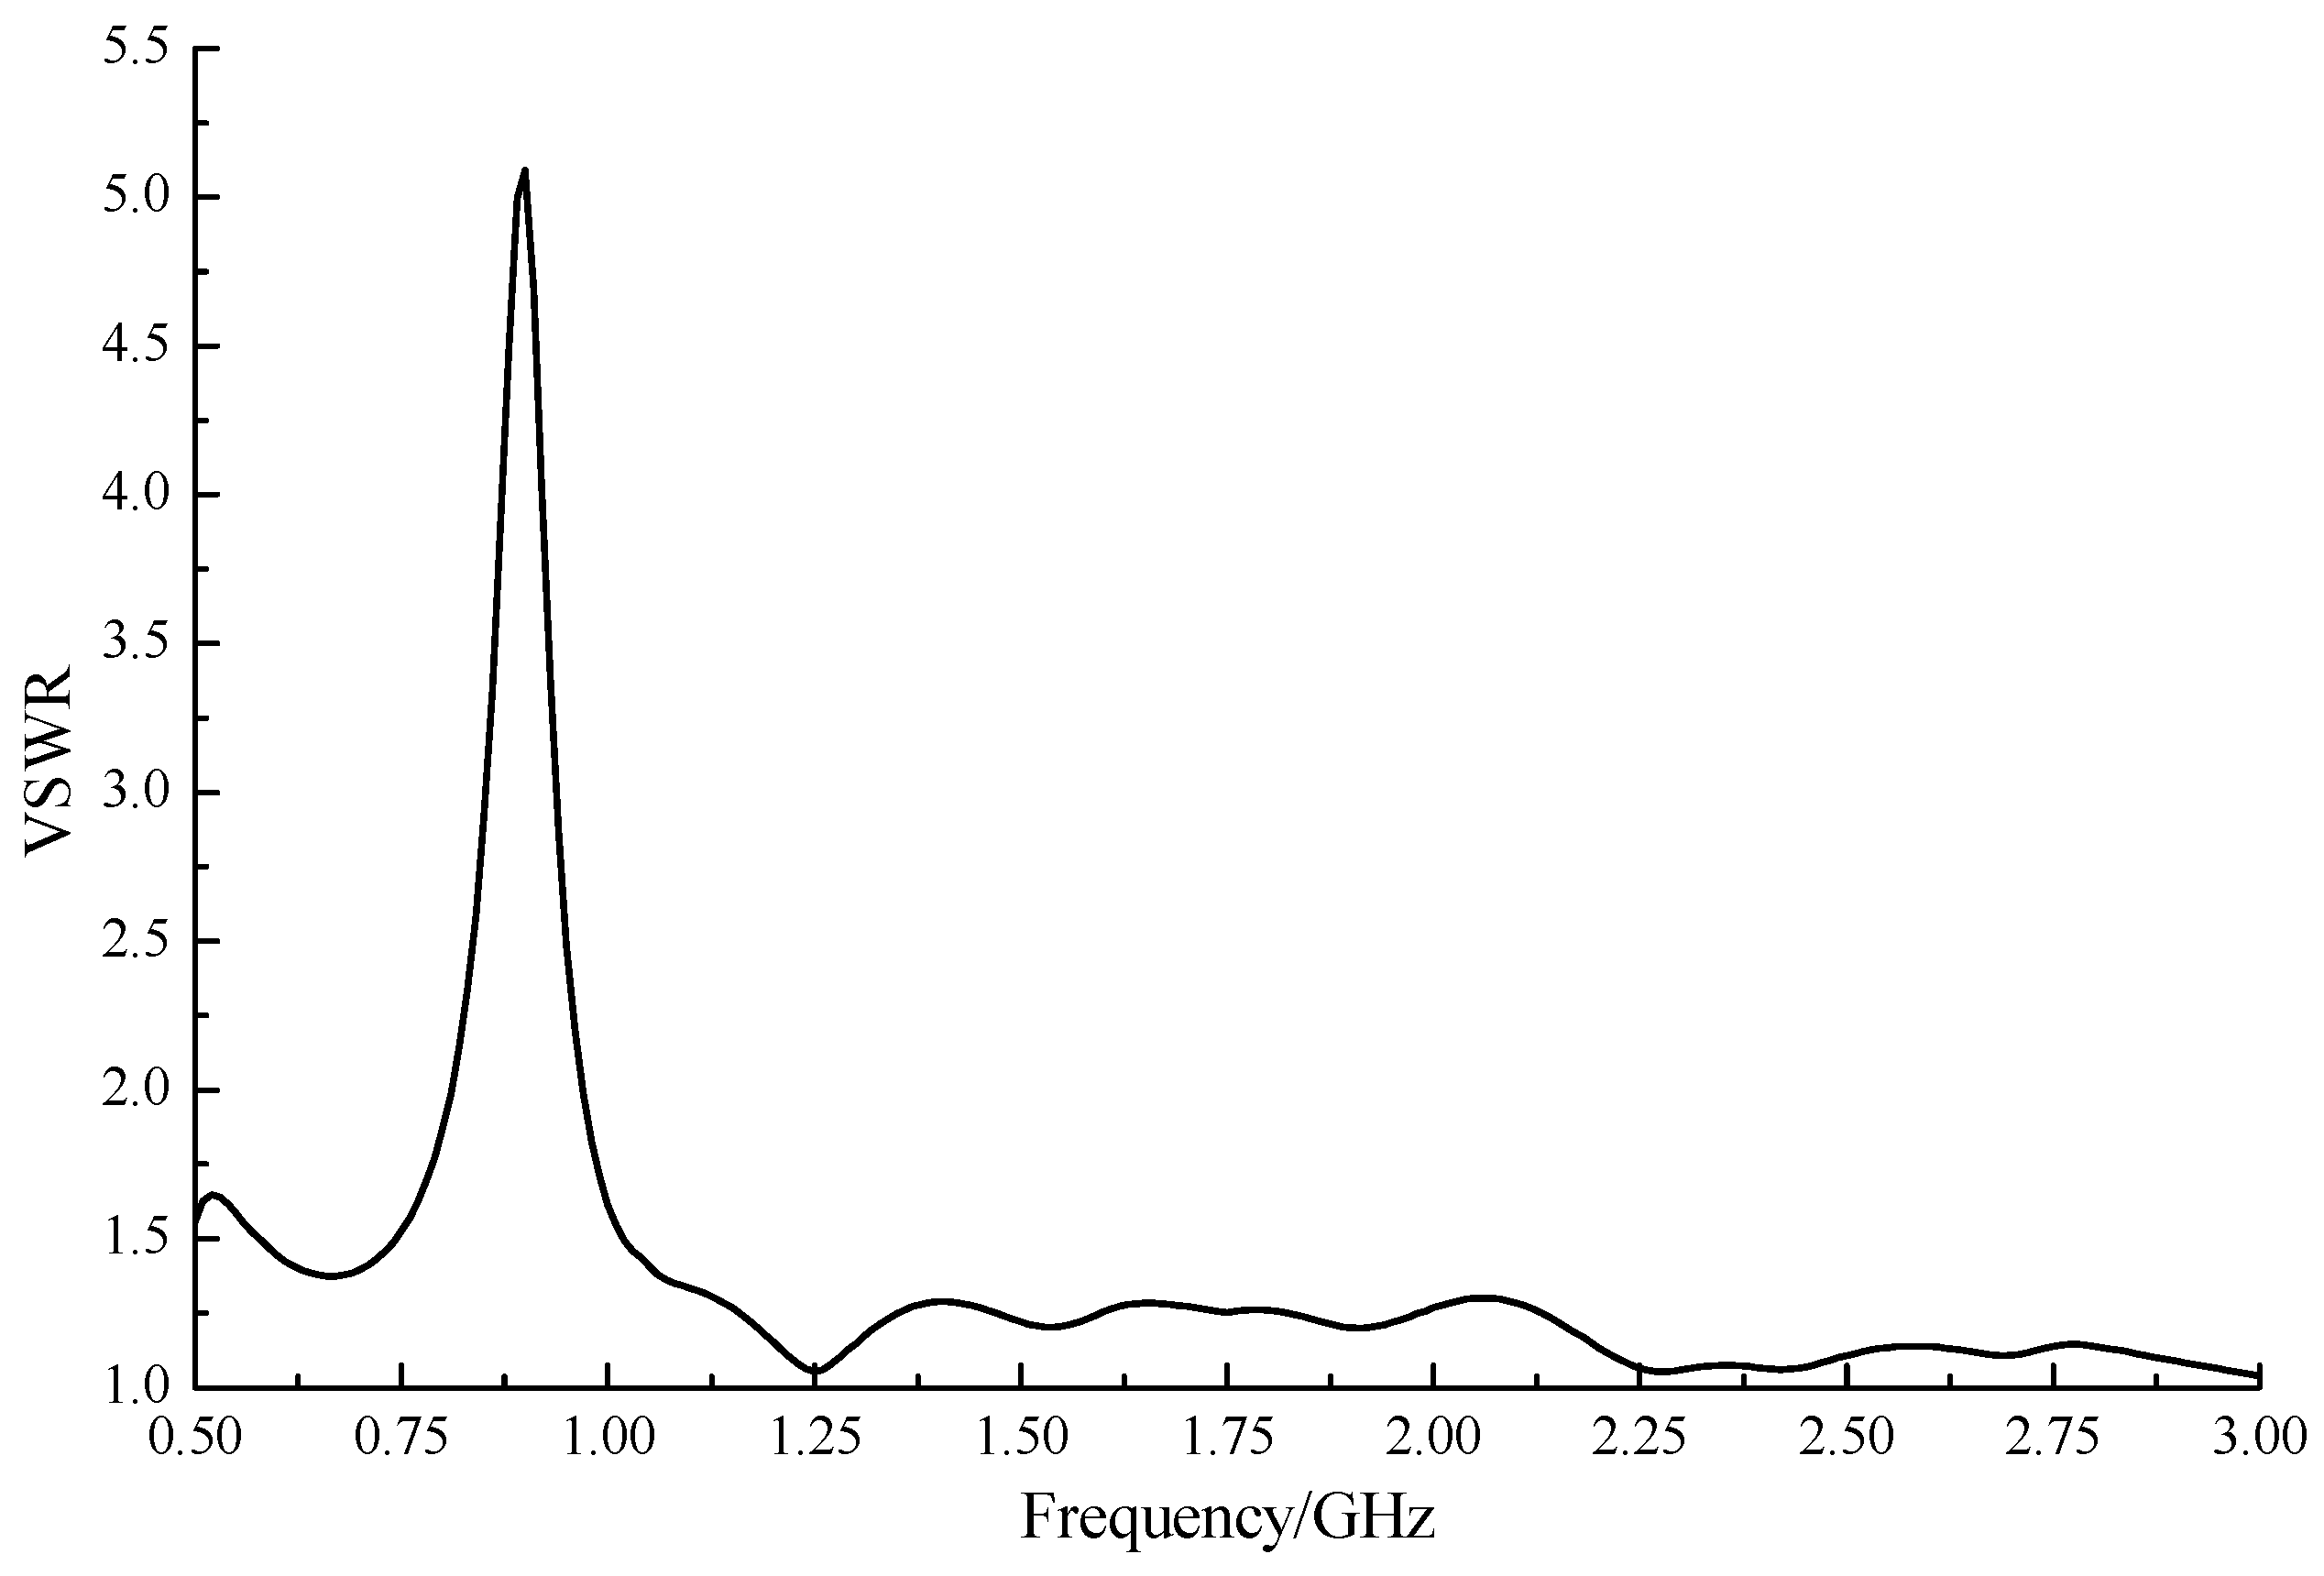
2.2. Design and Optimization of the Balun
2.3. Design of Other Antennas
| Type of Antenna | Geometry in mm | Working Band in MHz | Directivity | Peak Realized Gain/dB |
|---|---|---|---|---|
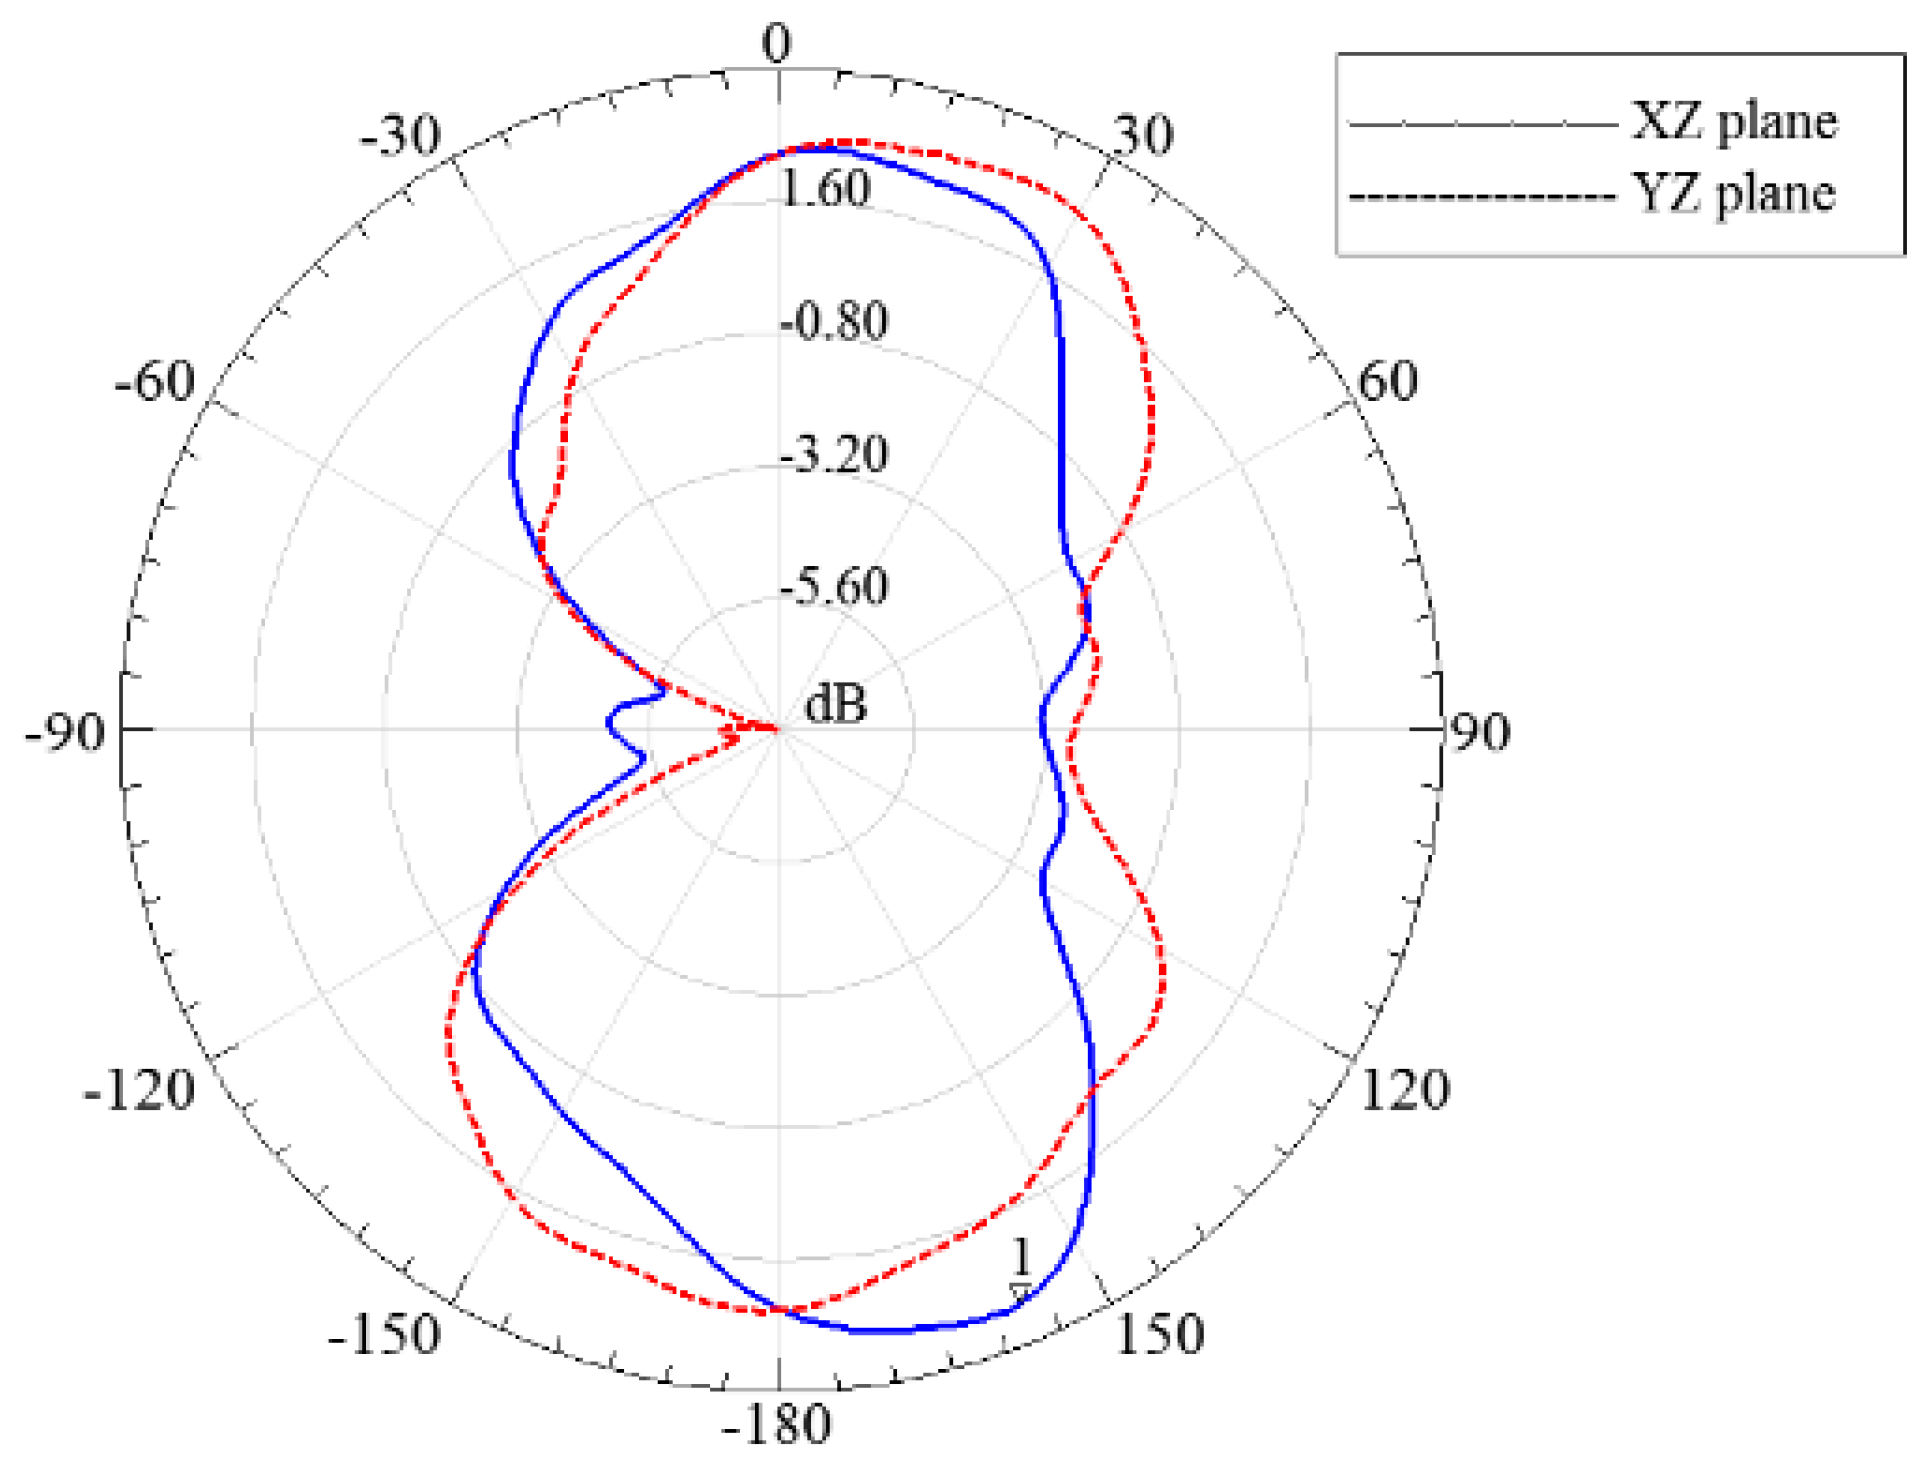
| ESA | 124 × 124 × 1.6 | 500–550 | Poor | 3.24 |
| 850–1050 | ||||
| 1150–3000 | ||||
| MPA | 188 × 138 × 1.6 | 920–1020 | Poor | −1.54 |
| MSA | 100 × 30 × 1.6 | 961–979 | H plane good | −0.17 |
| PDA | 140 × 40 × 1.6 | 908–1029 | H plane omnidirectional | 1.40 |
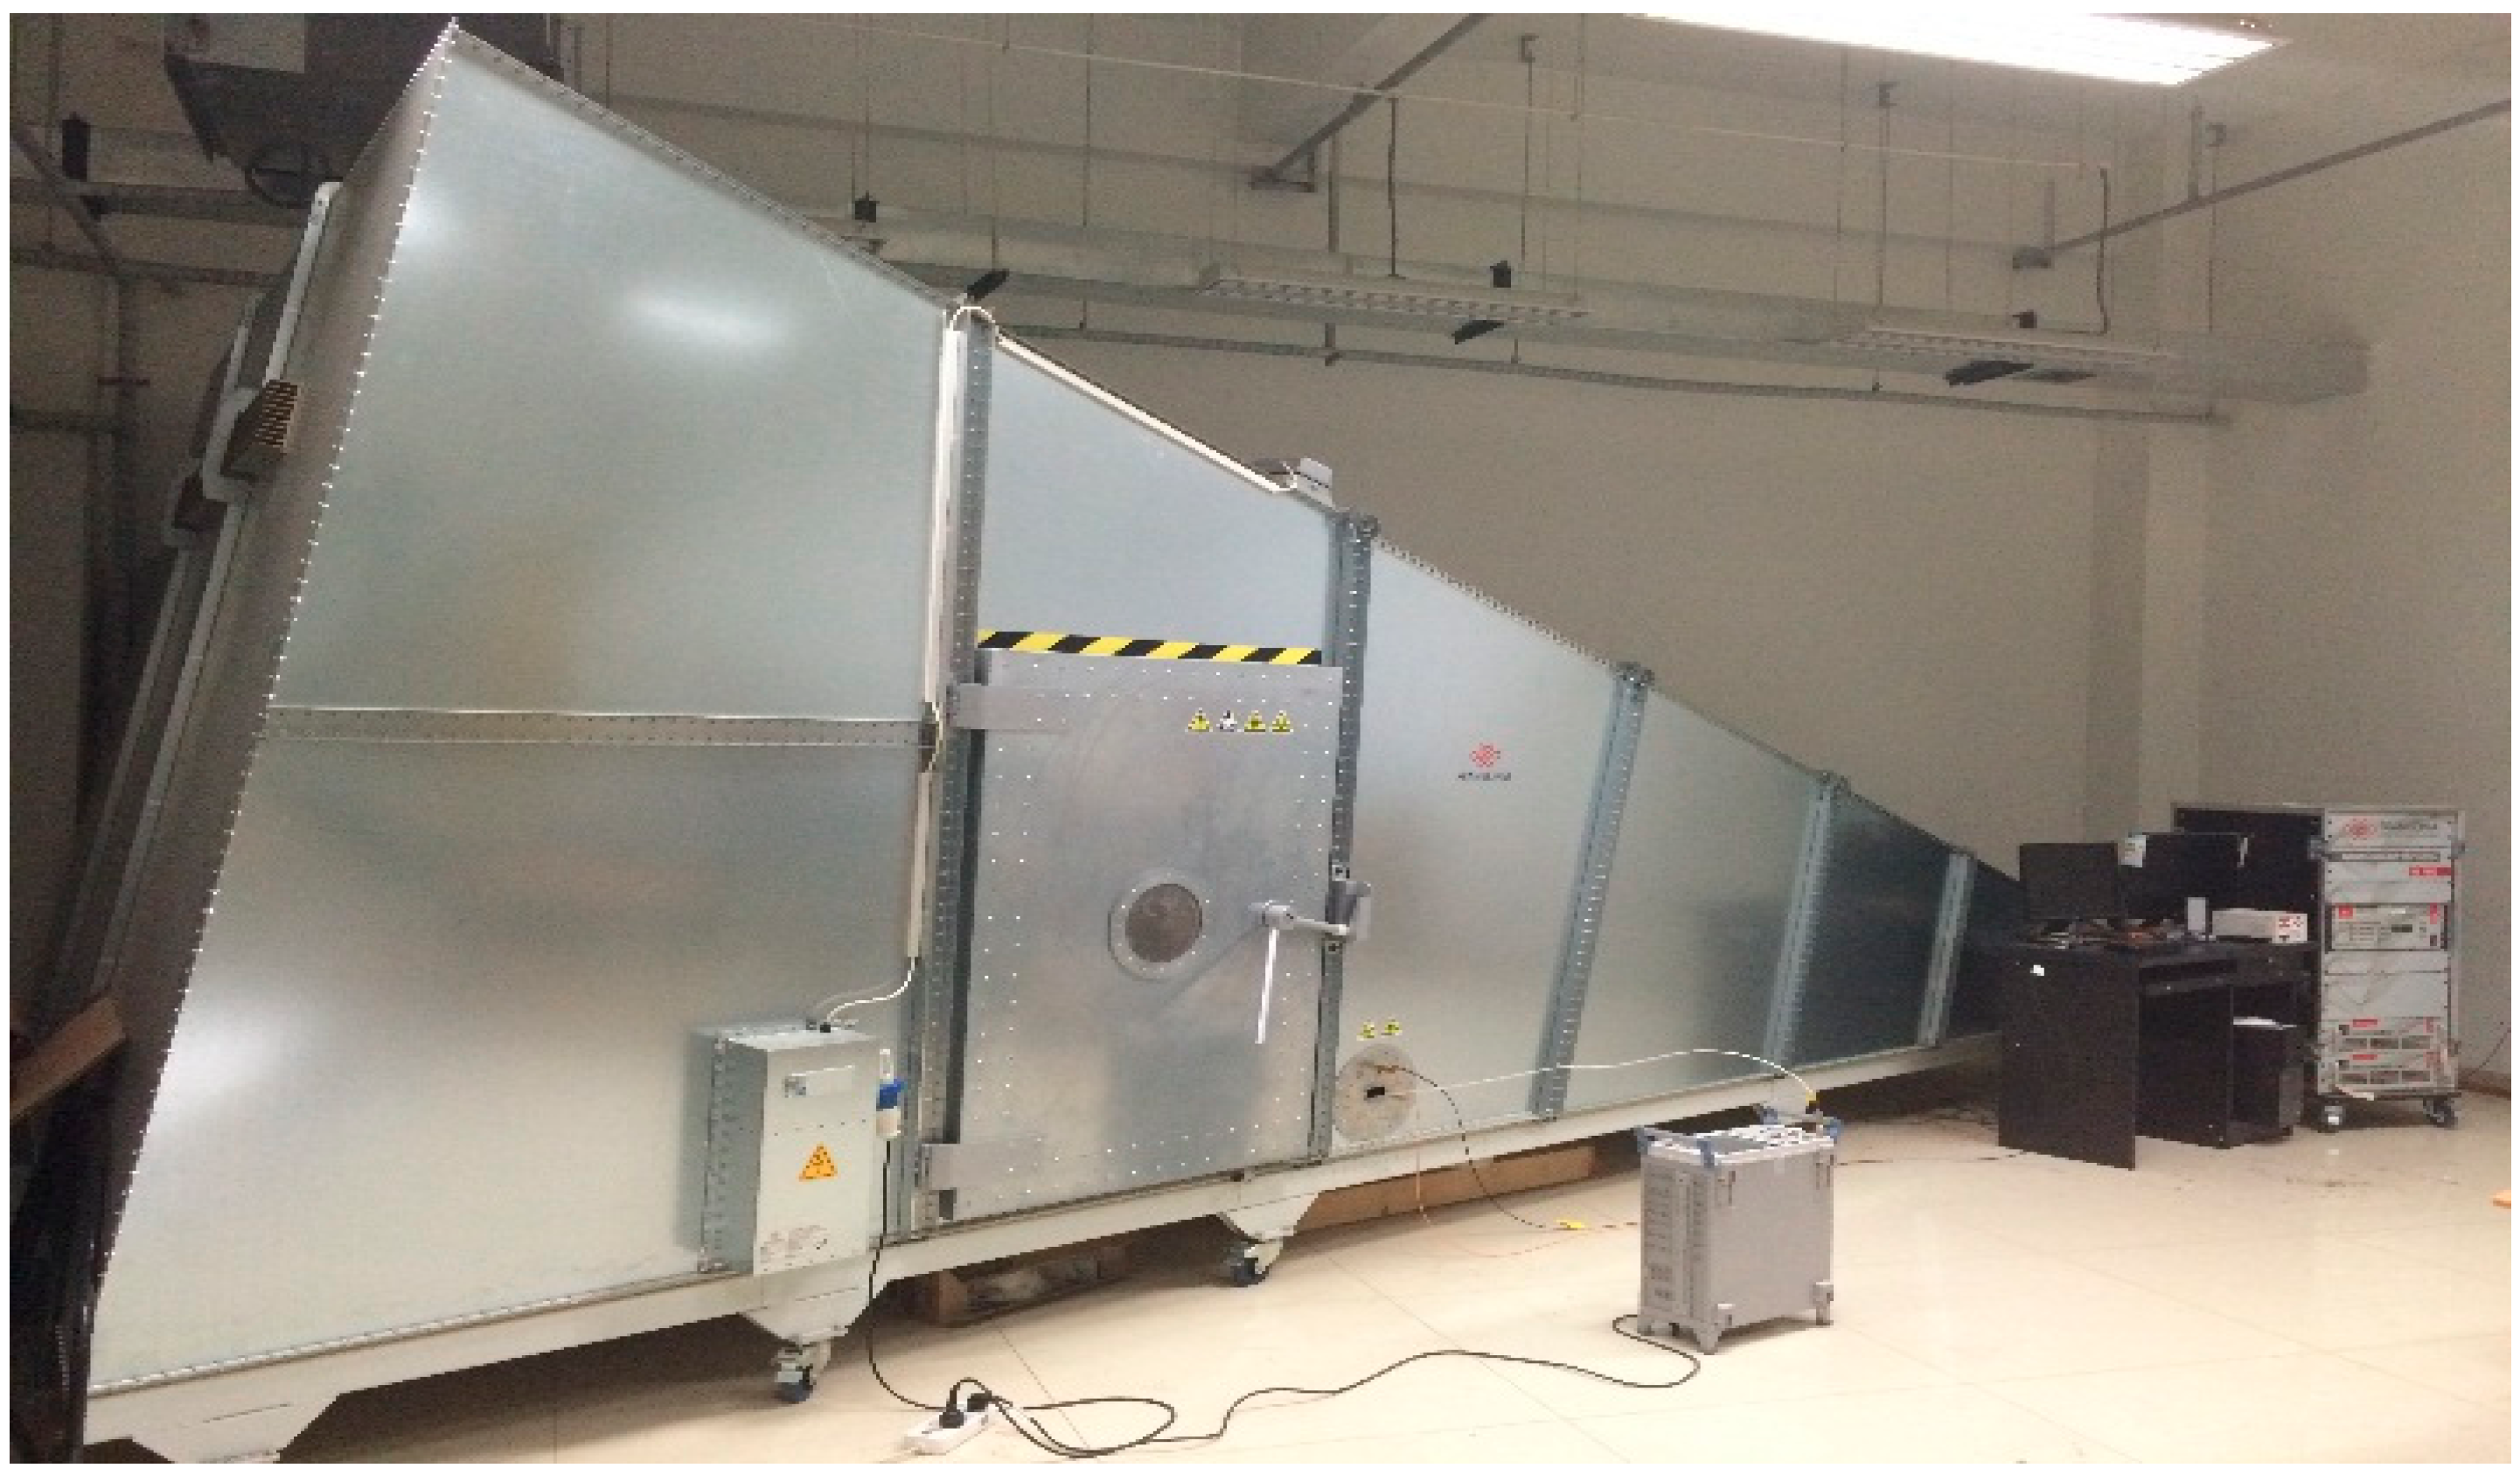
3. Calibration of the Antenna Factor
3.1. Experimental Setup
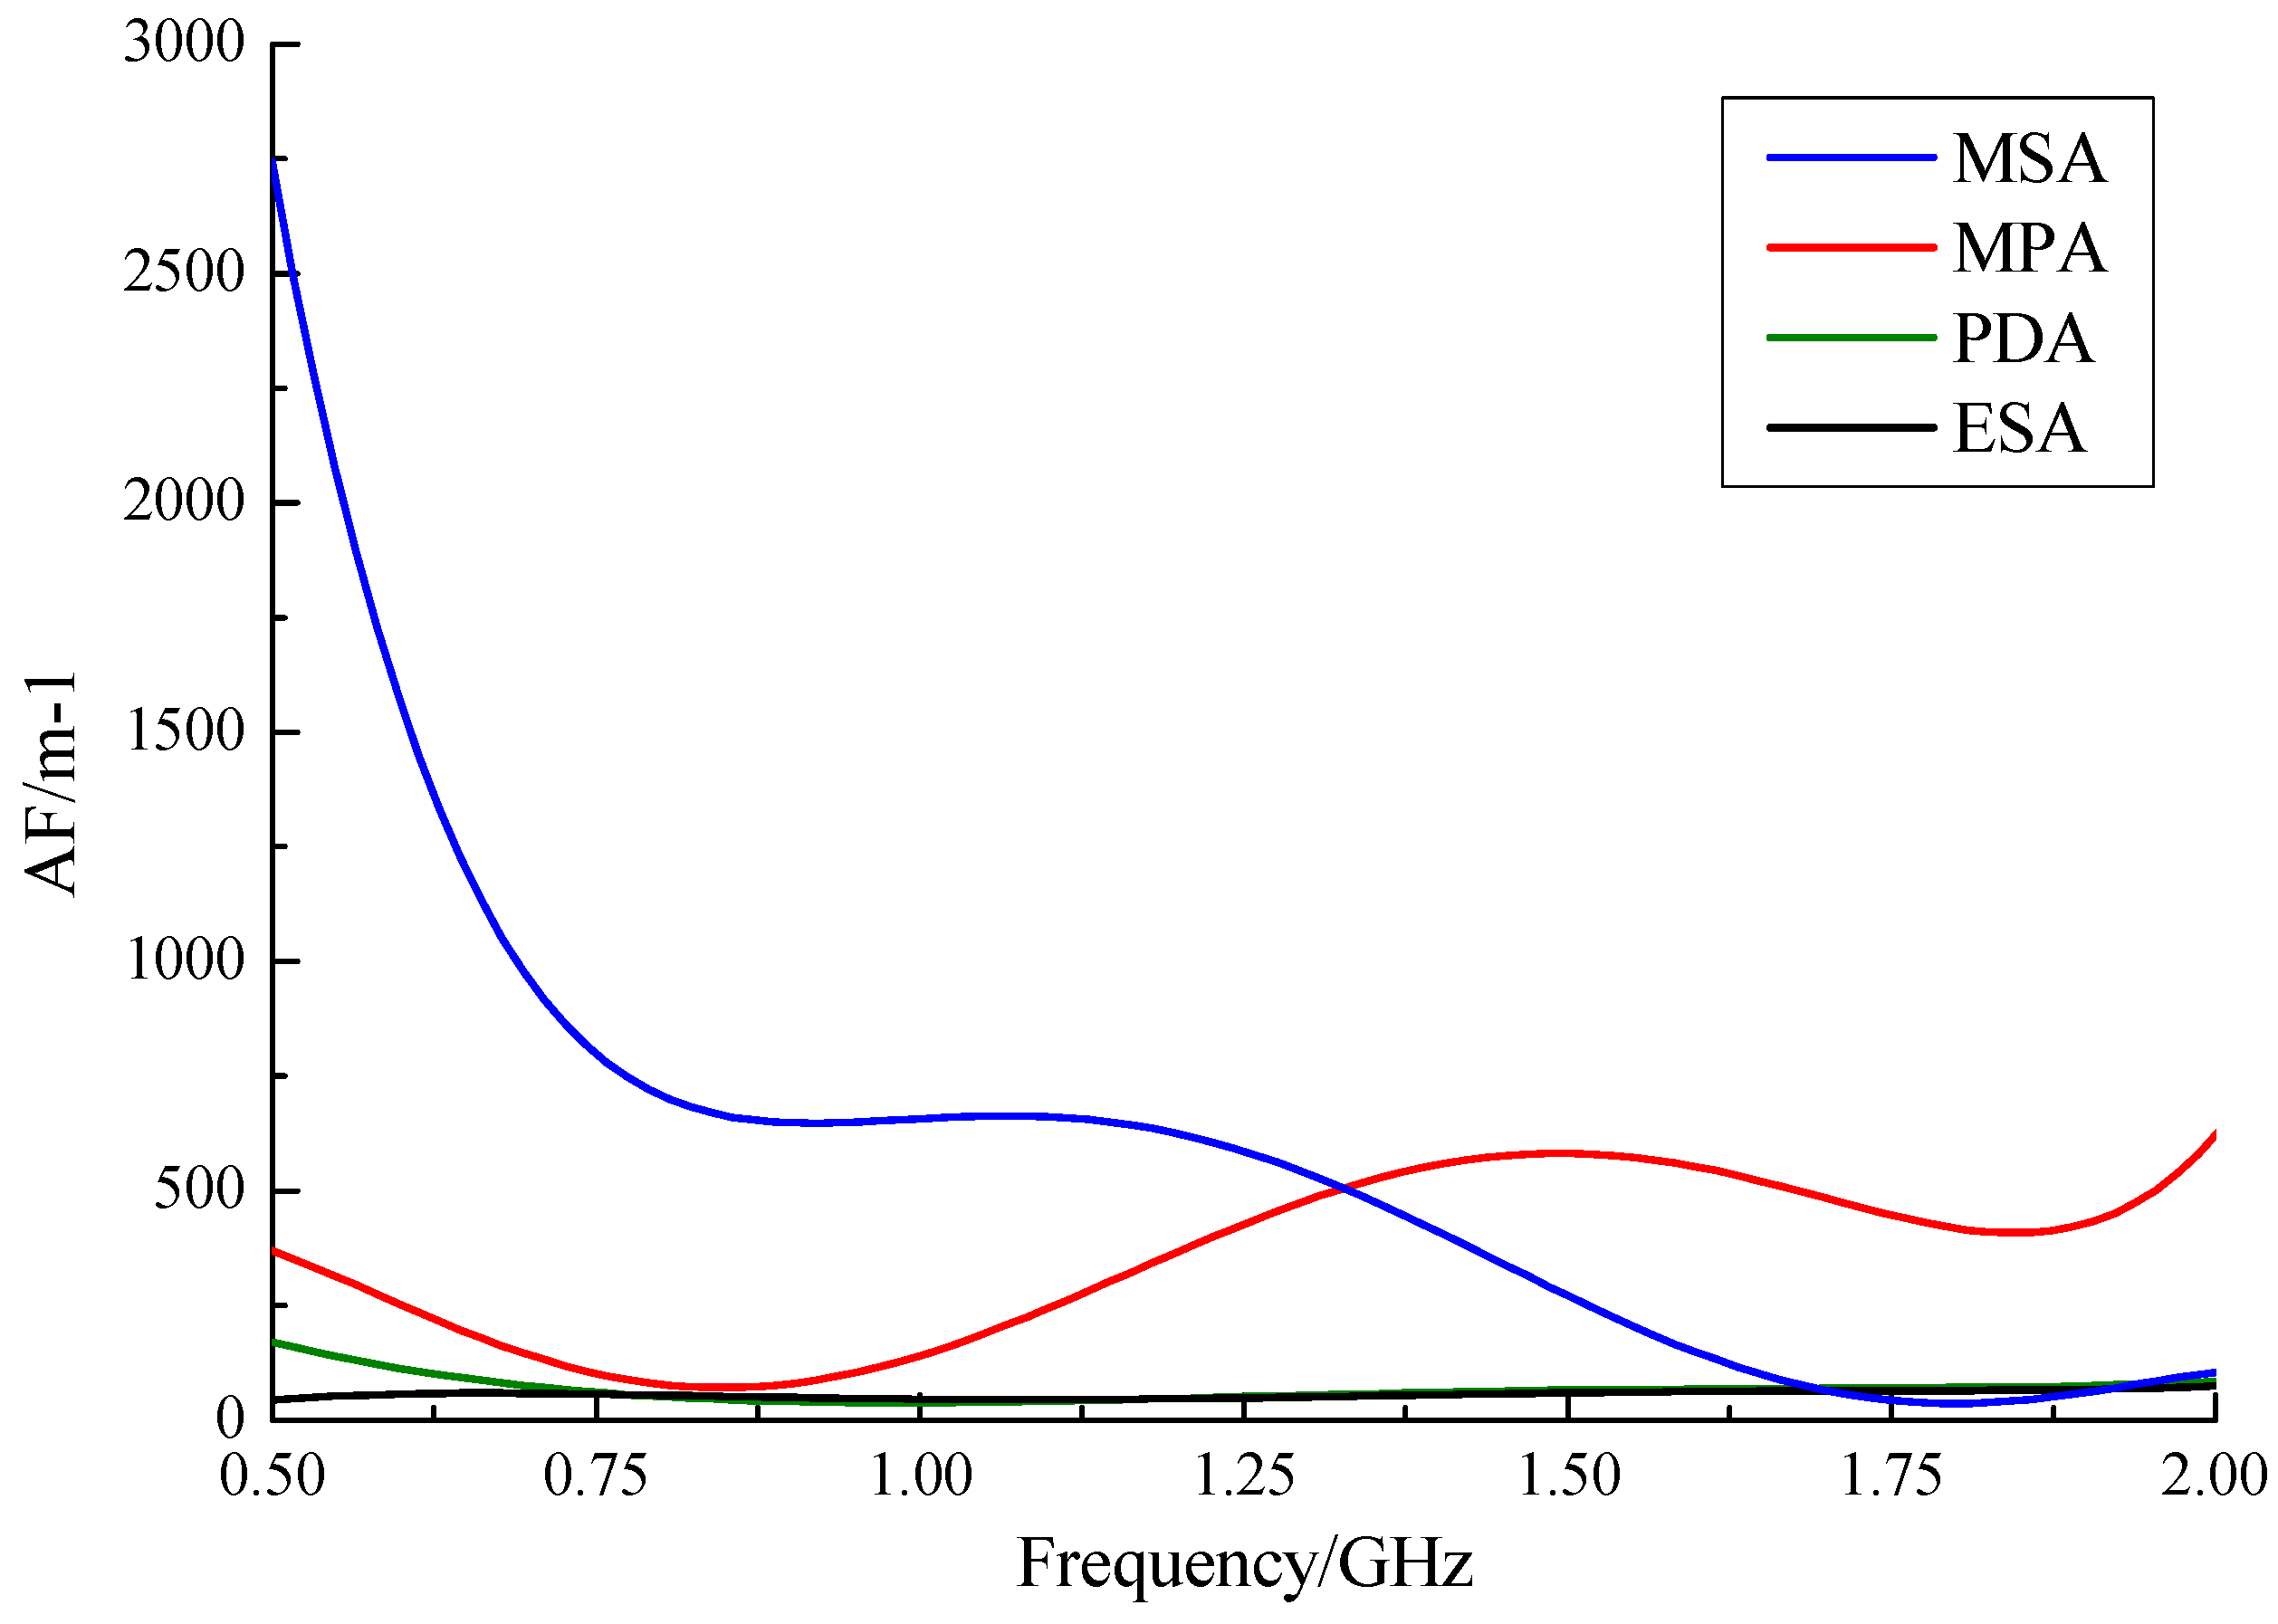
3.2. Experimental Result and Antenna Factor Determination

| Type of Sensor | C | B1 | B2 | B3 | B4 | B5 |
|---|---|---|---|---|---|---|
| MPA | −2781.3 | 21,840 | −53,003 | 55,908 | −26,426 | 4602.6 |
| MSA | 30,694 | −119,108 | 182,850 | −135,273 | 48,086 | −6592.8 |
| PDA | 878.7 | −2298.6 | 2033.5 | −475.5 | 166.9 | 67.0 |
| ESA | −663.7 | 3427.1 | −6121.1 | 5132.7 | −2040.7 | 311.2 |

4. UHF Detection Experiments
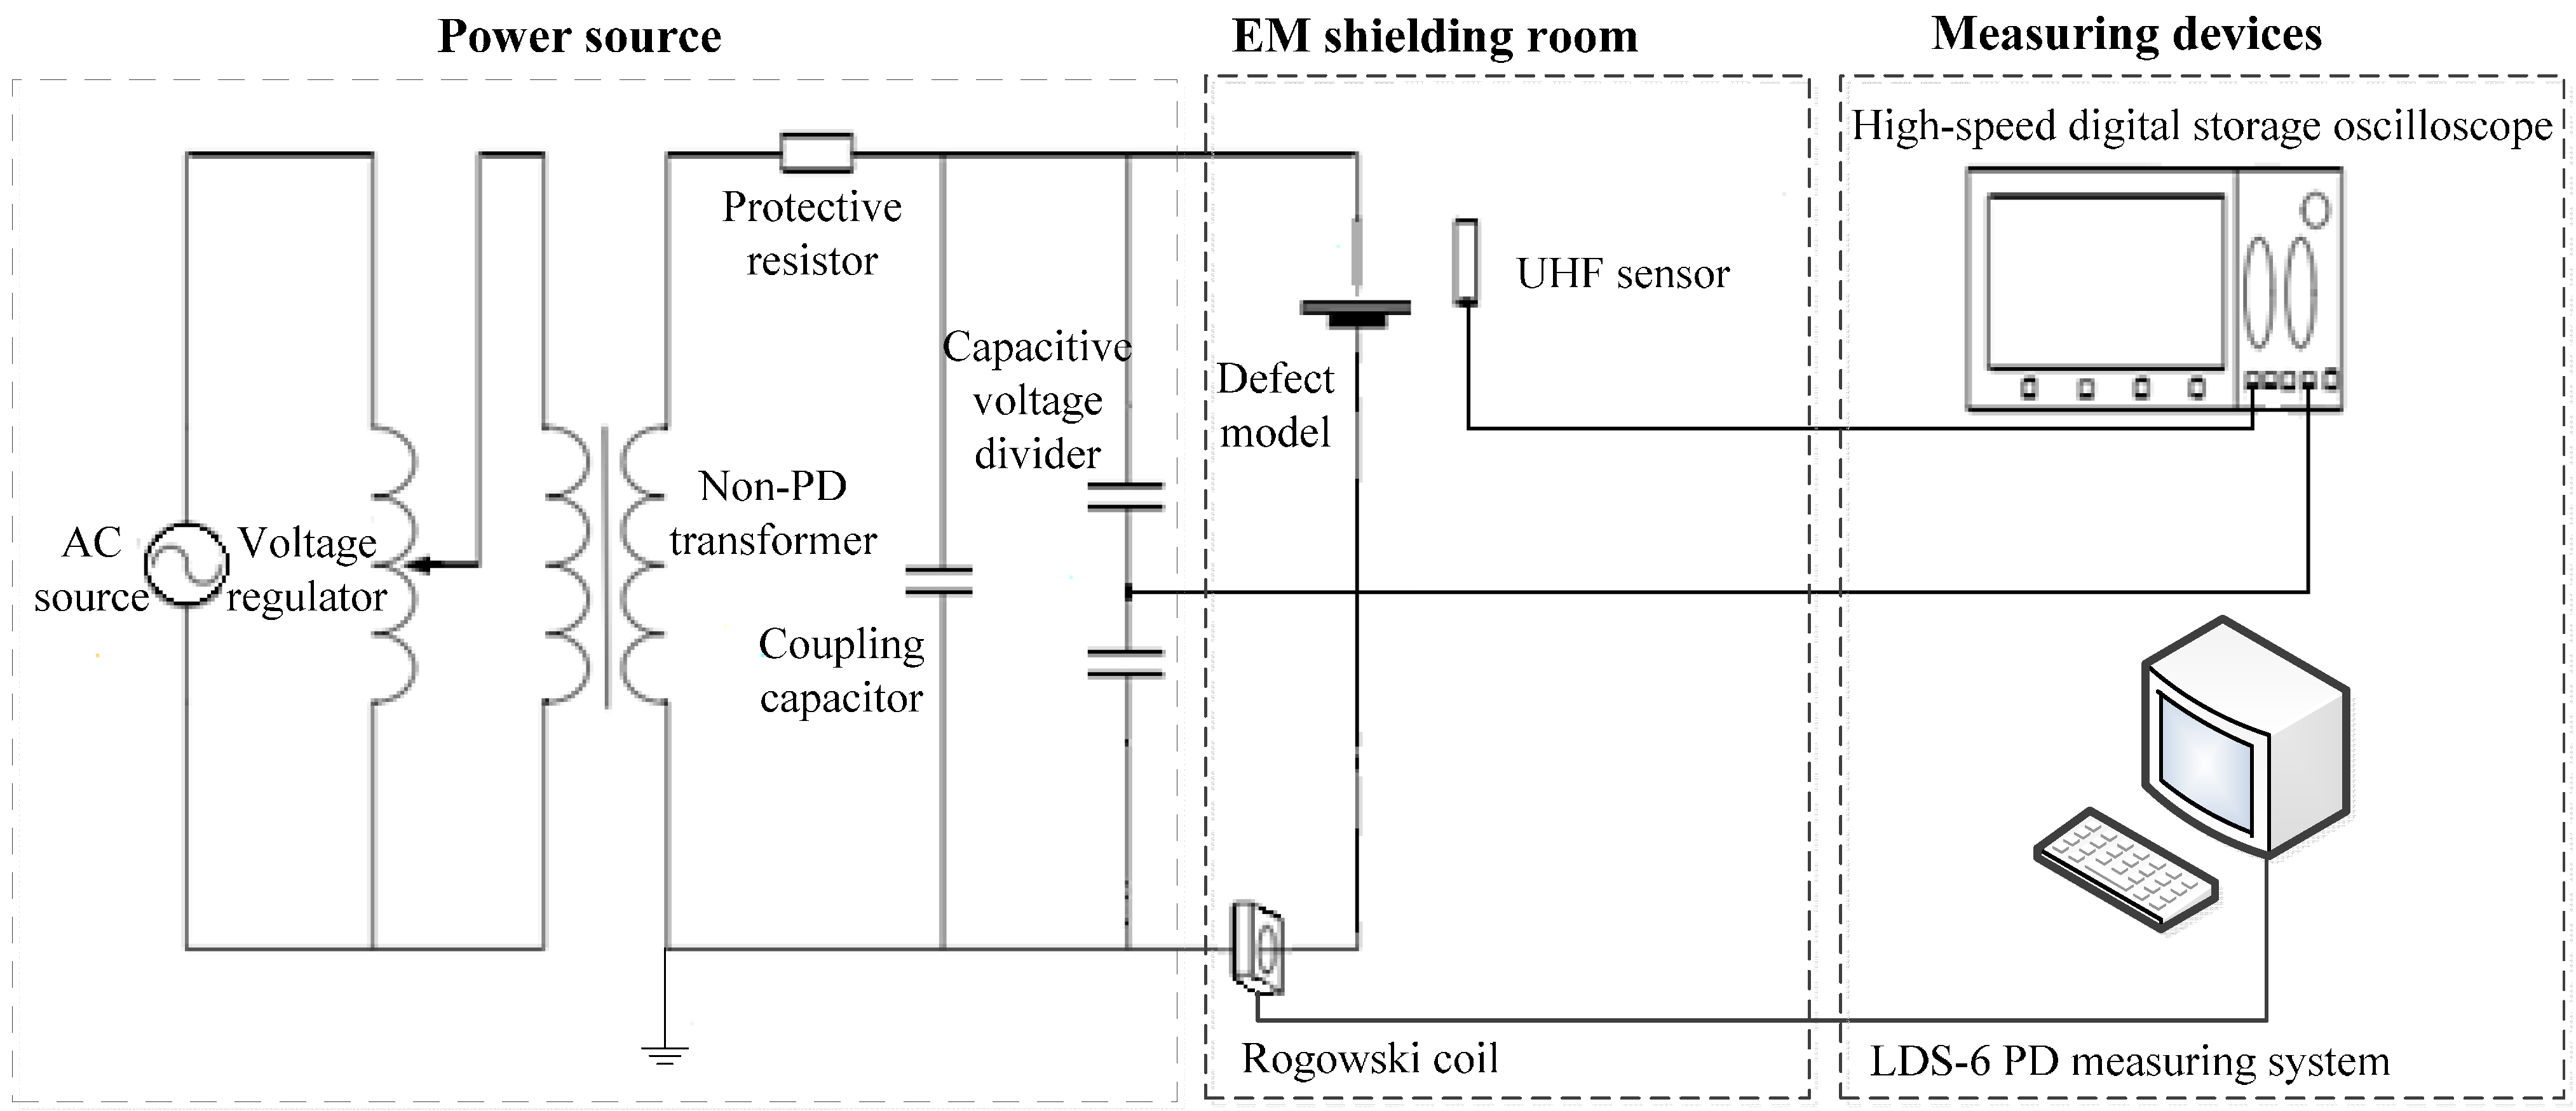
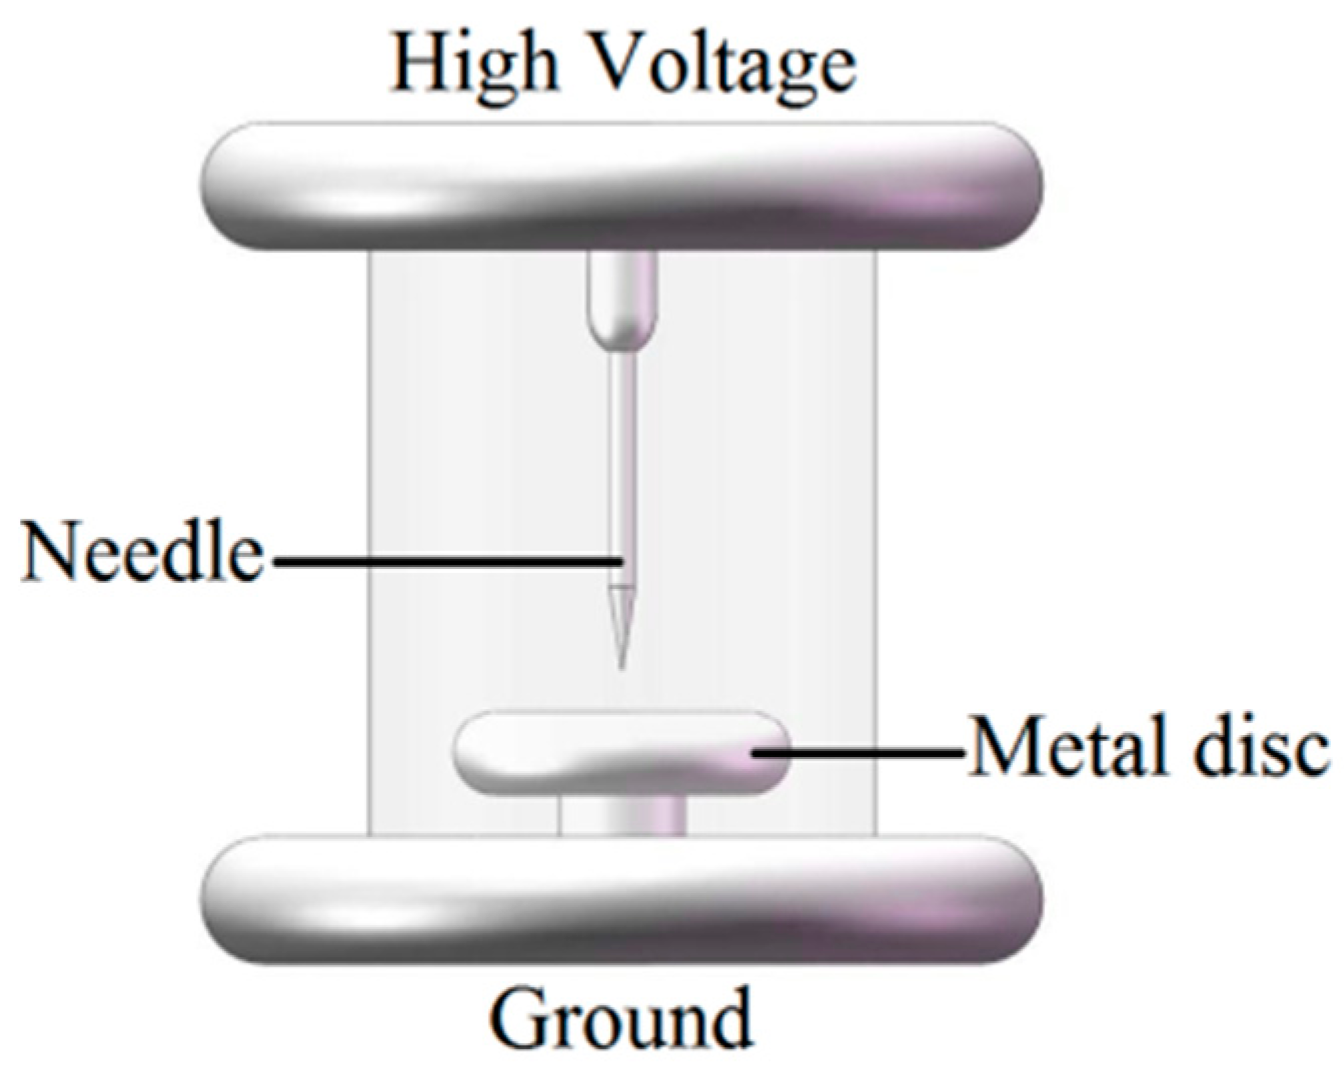
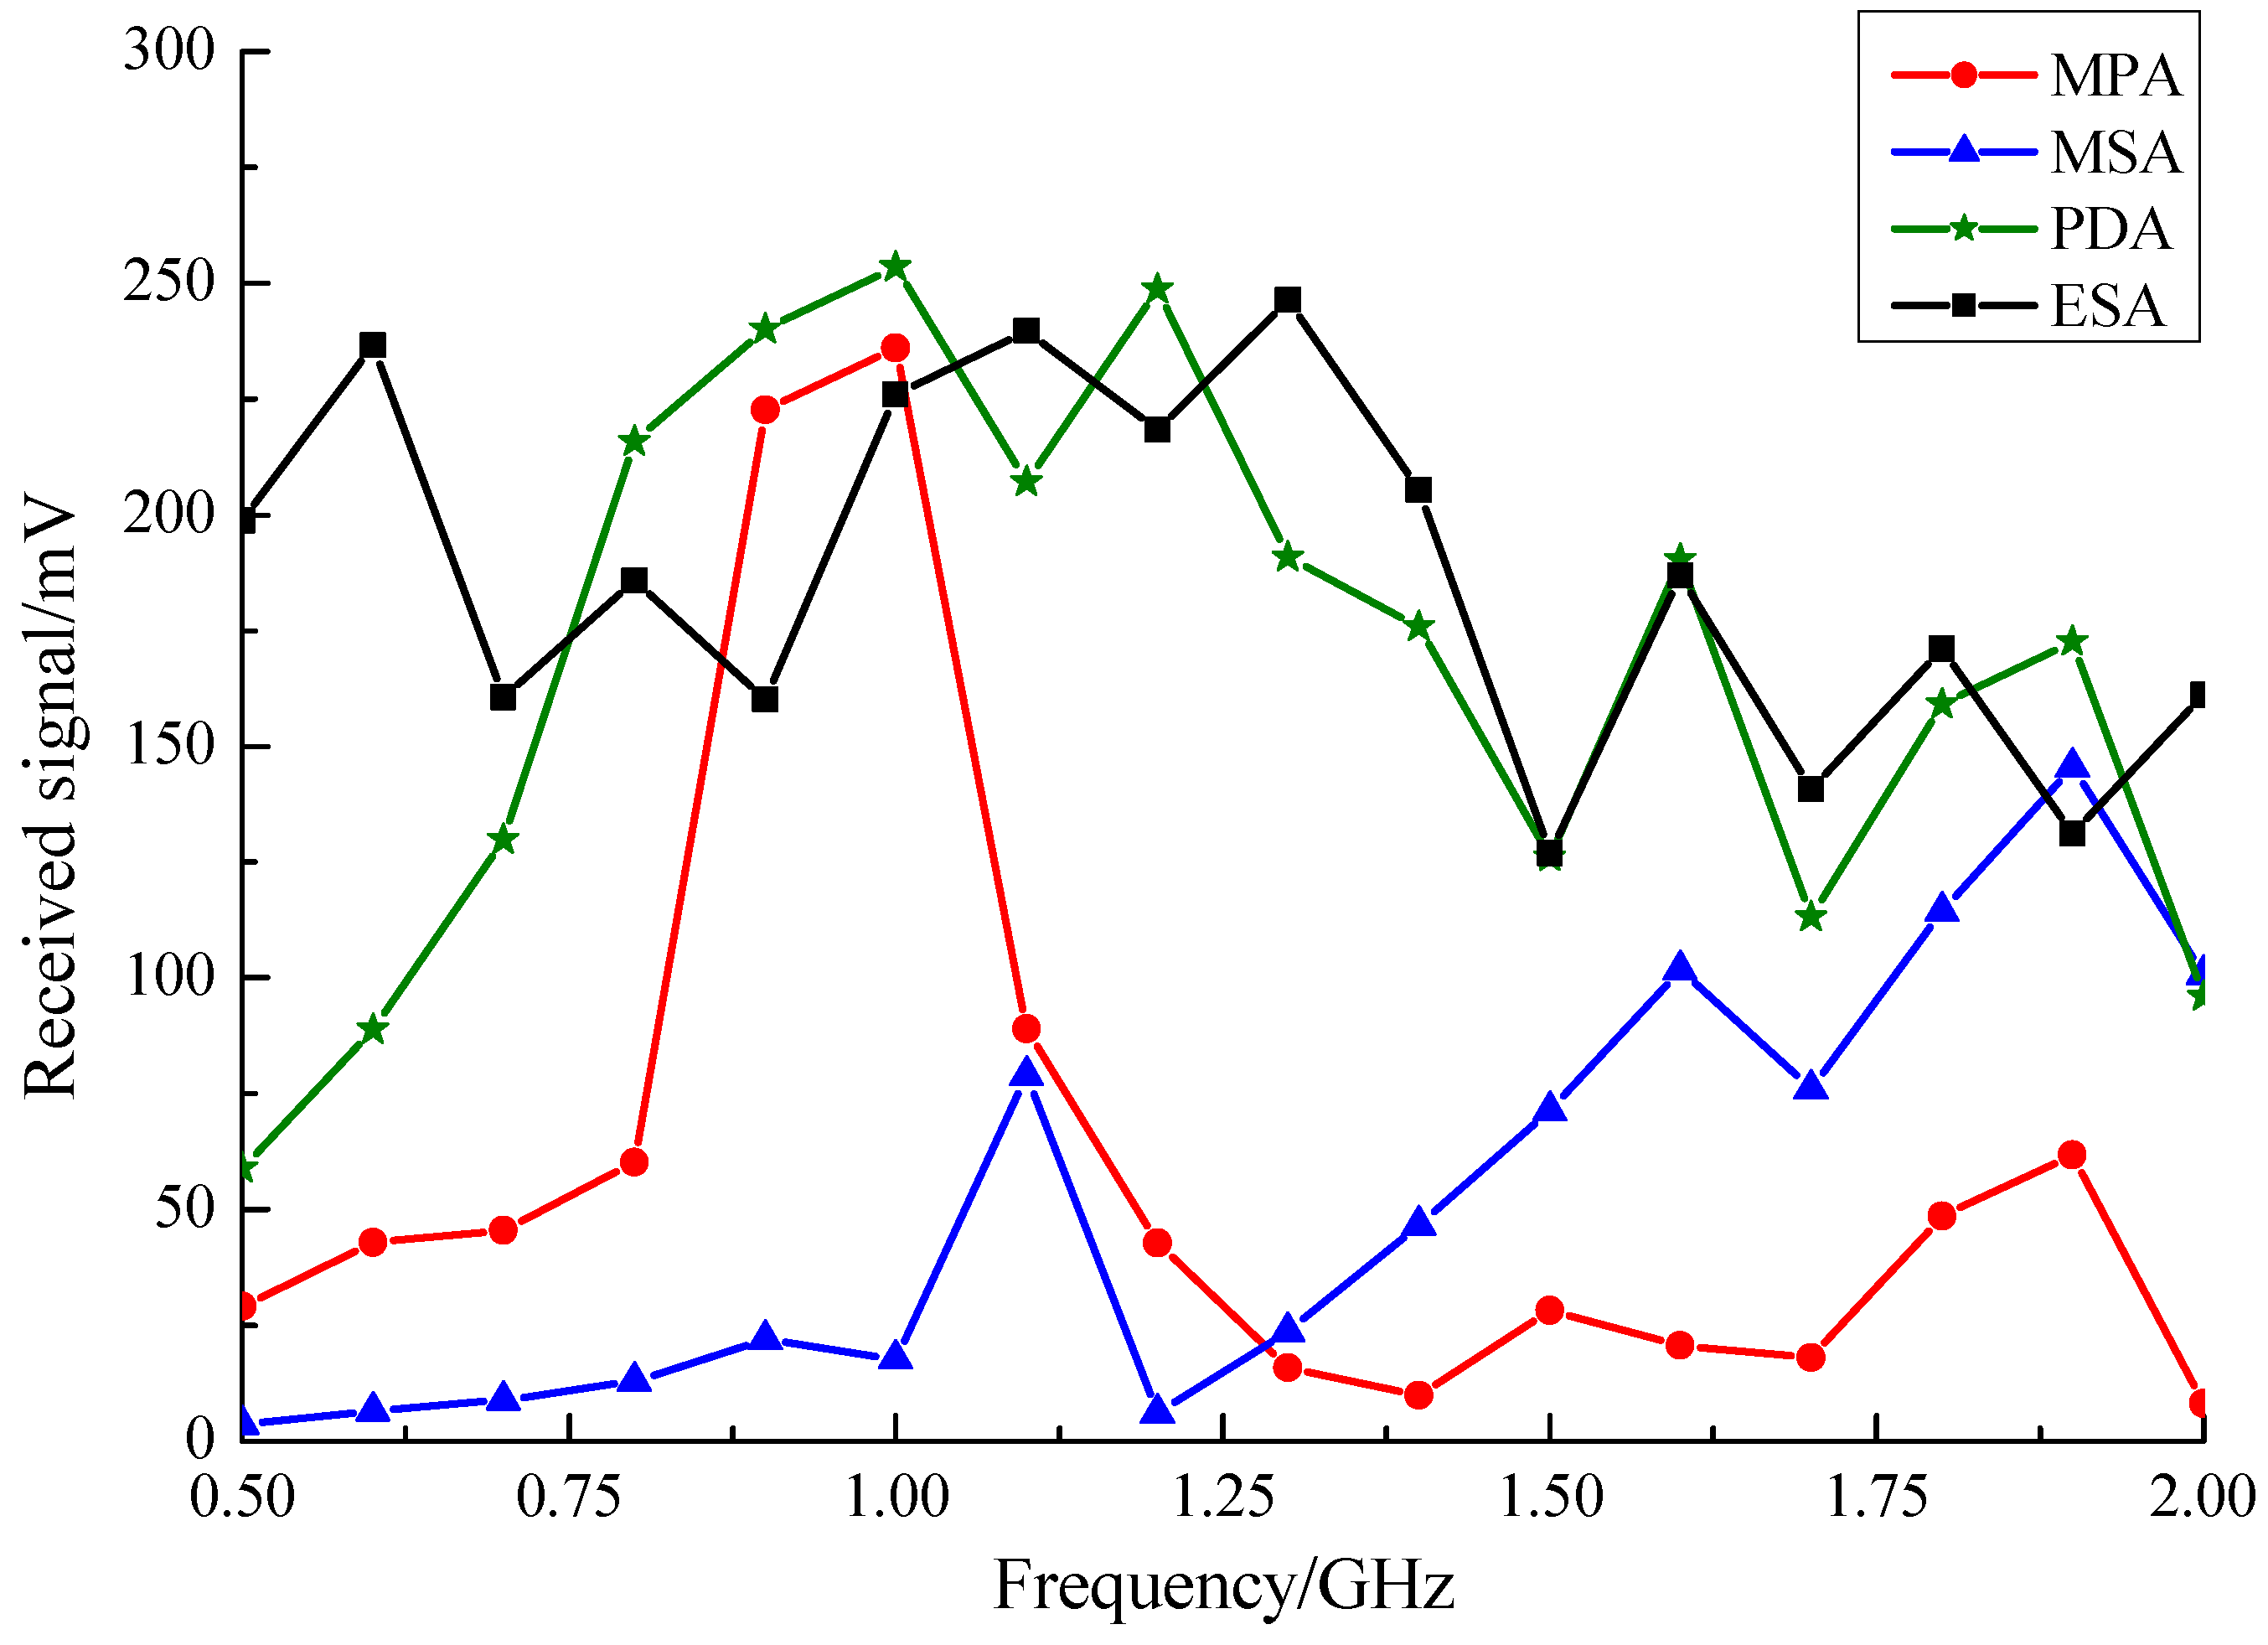
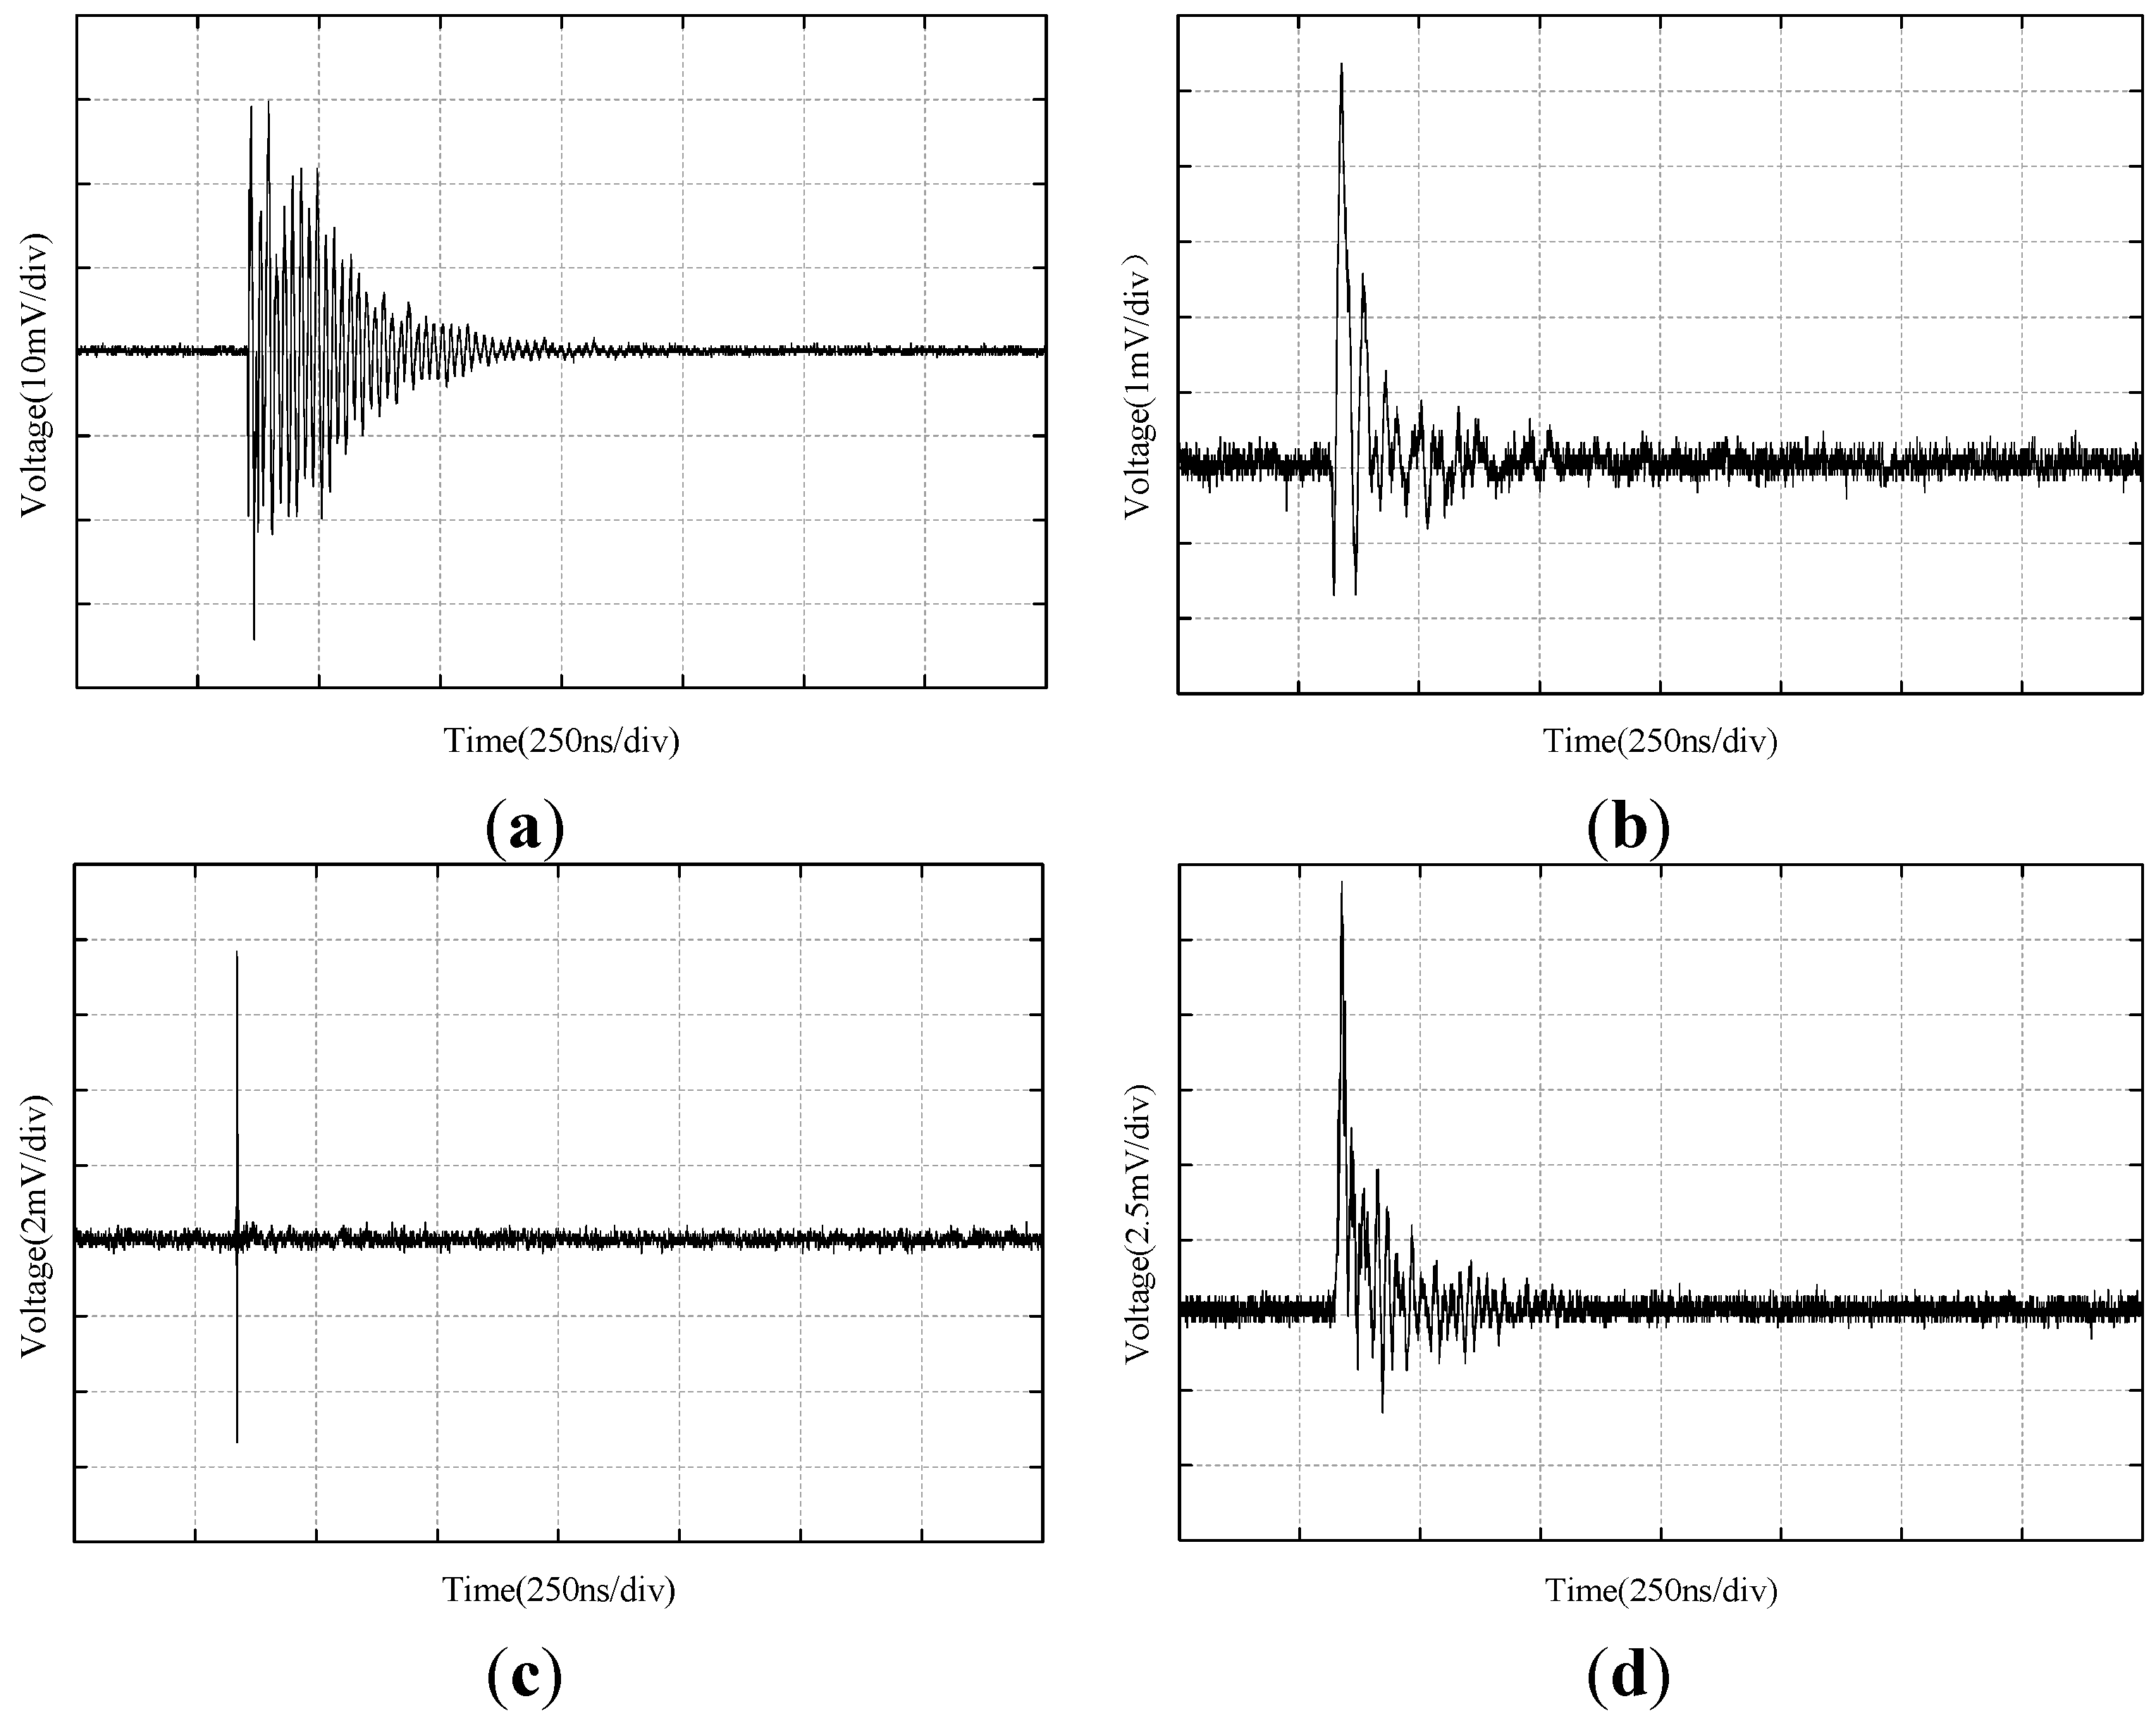
4.1. Comparison Experiment of PD Detection for the Four Sensors

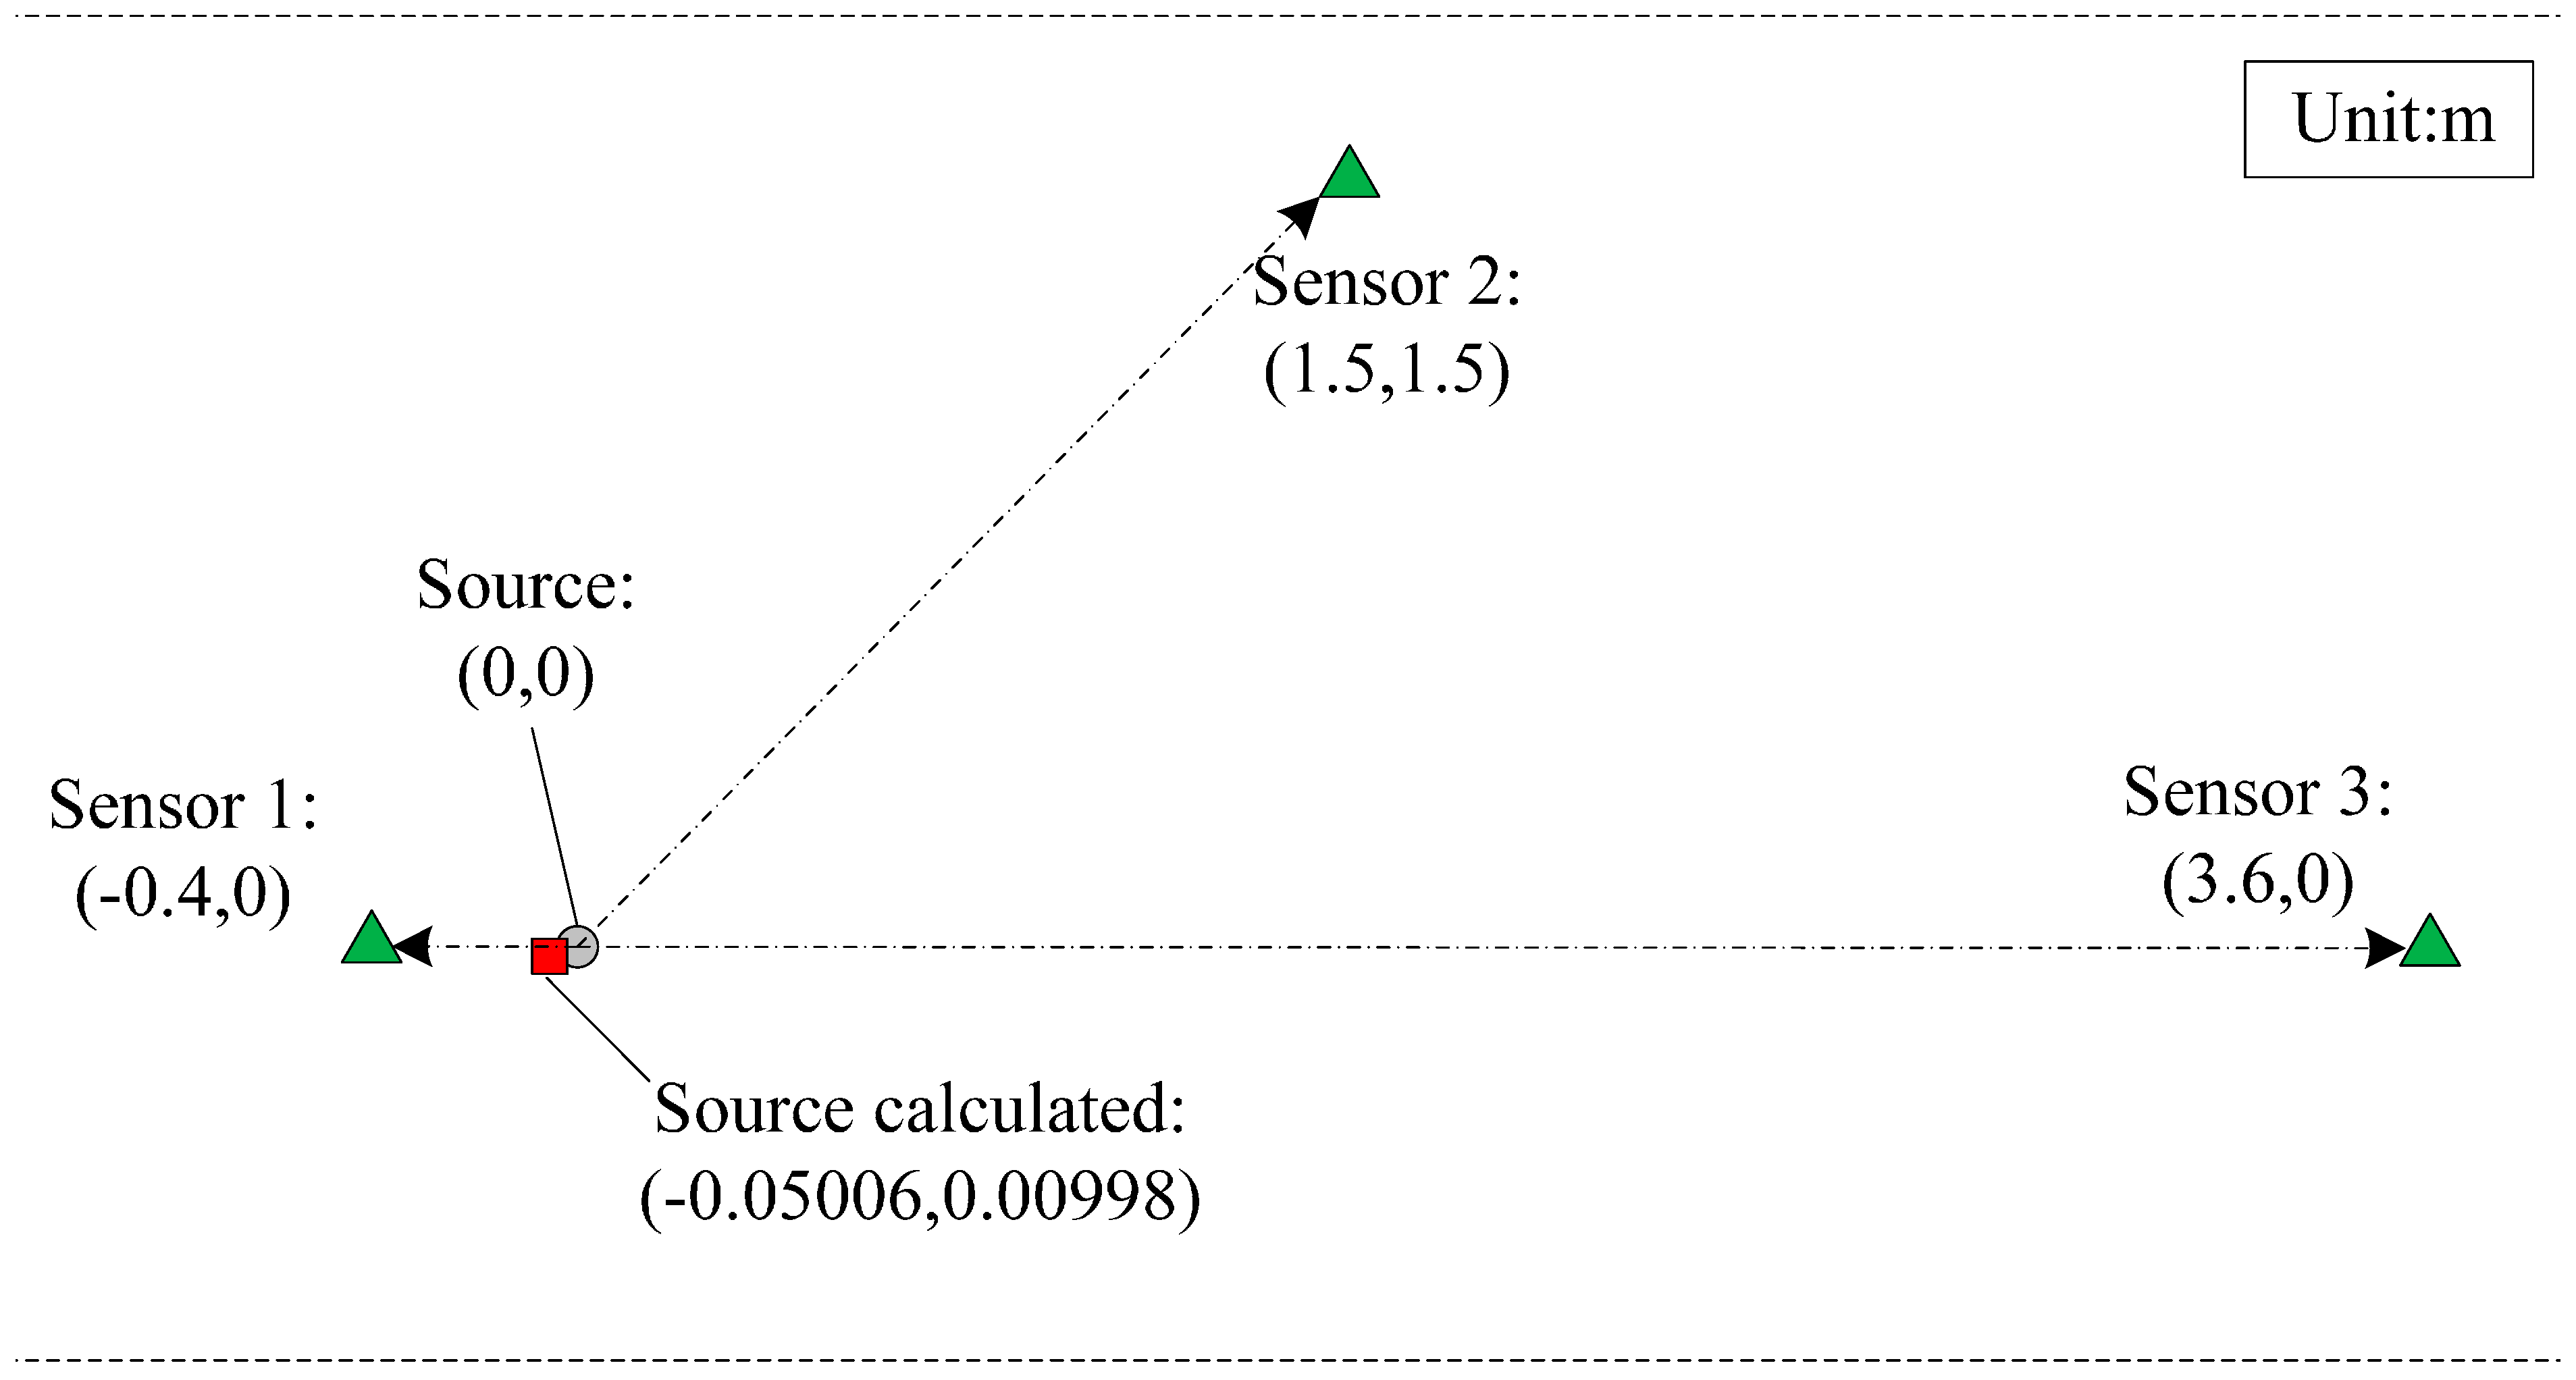
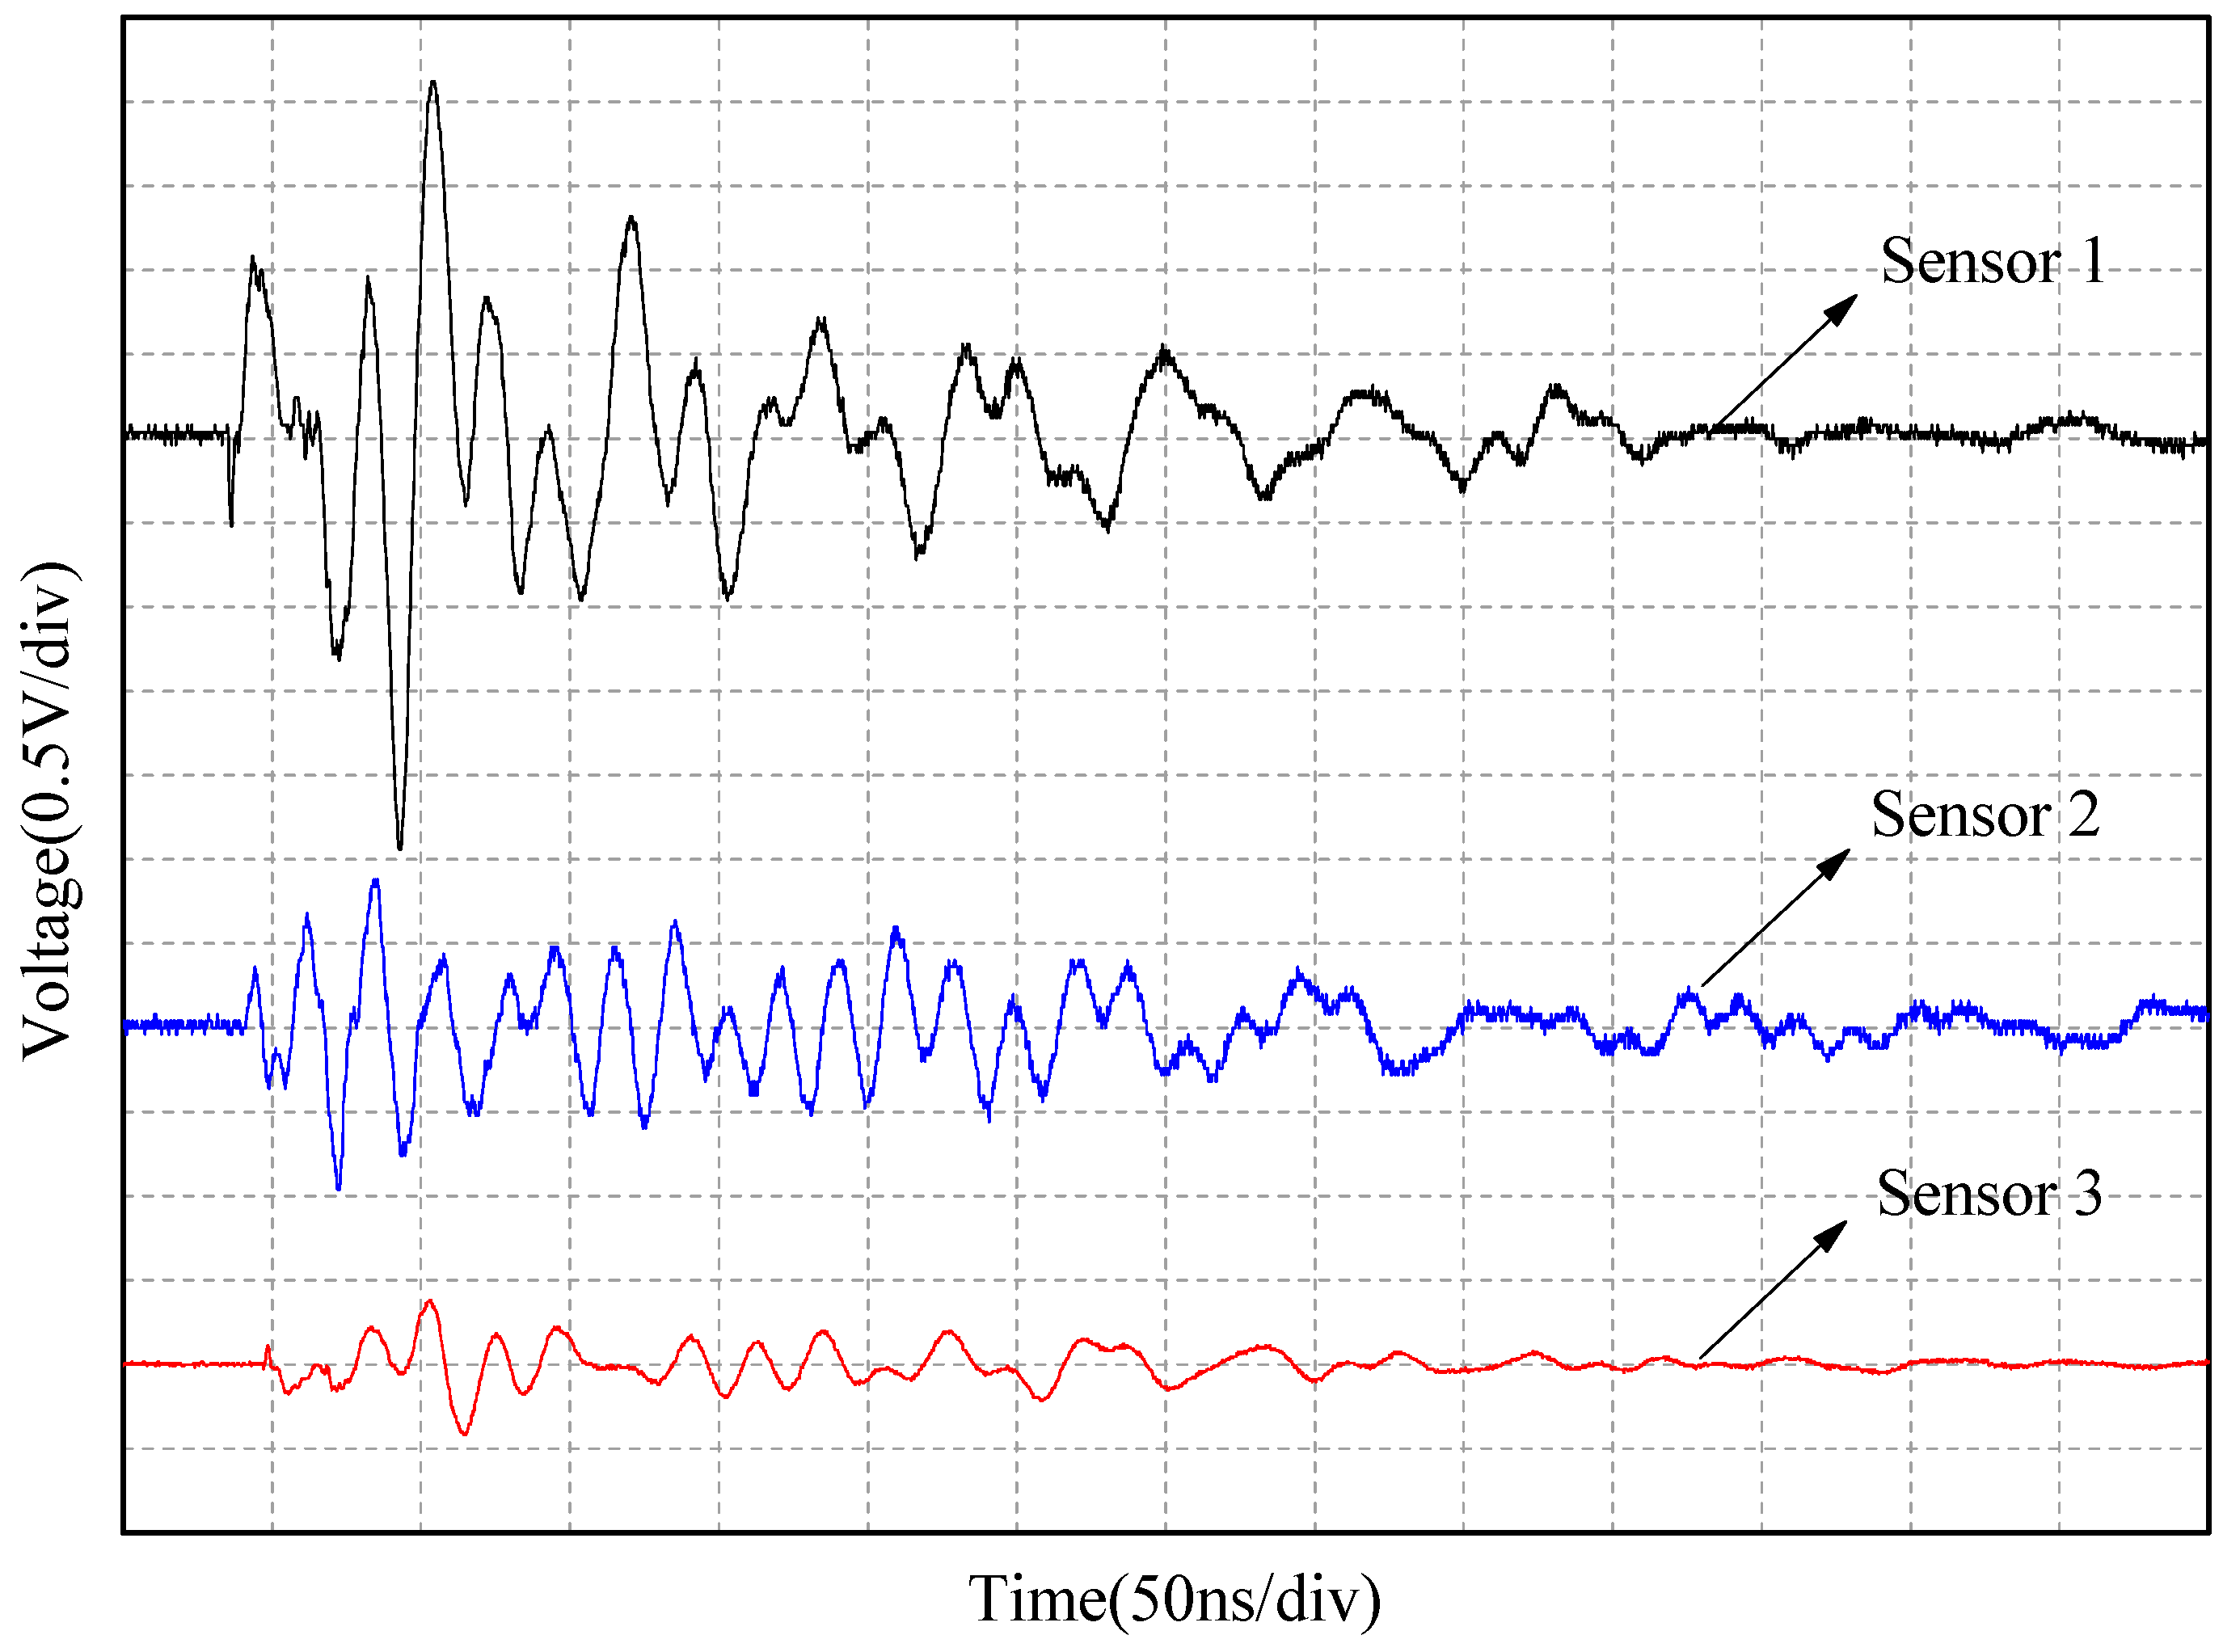
4.2. Time-Delay Experiment

5. Conclusions
- (1)
- The proposed antenna was designed using the basic configuration of an ESA, while its outer radius was reduced to 62 mm to meet the strict installation requirements of an internal sensor. The key parameters were determined through simulation. It was found that an ESA can work in the UHF band range with high realized gain and good impedance matching, although its directivity is not ideal and should be considered.
- (2)
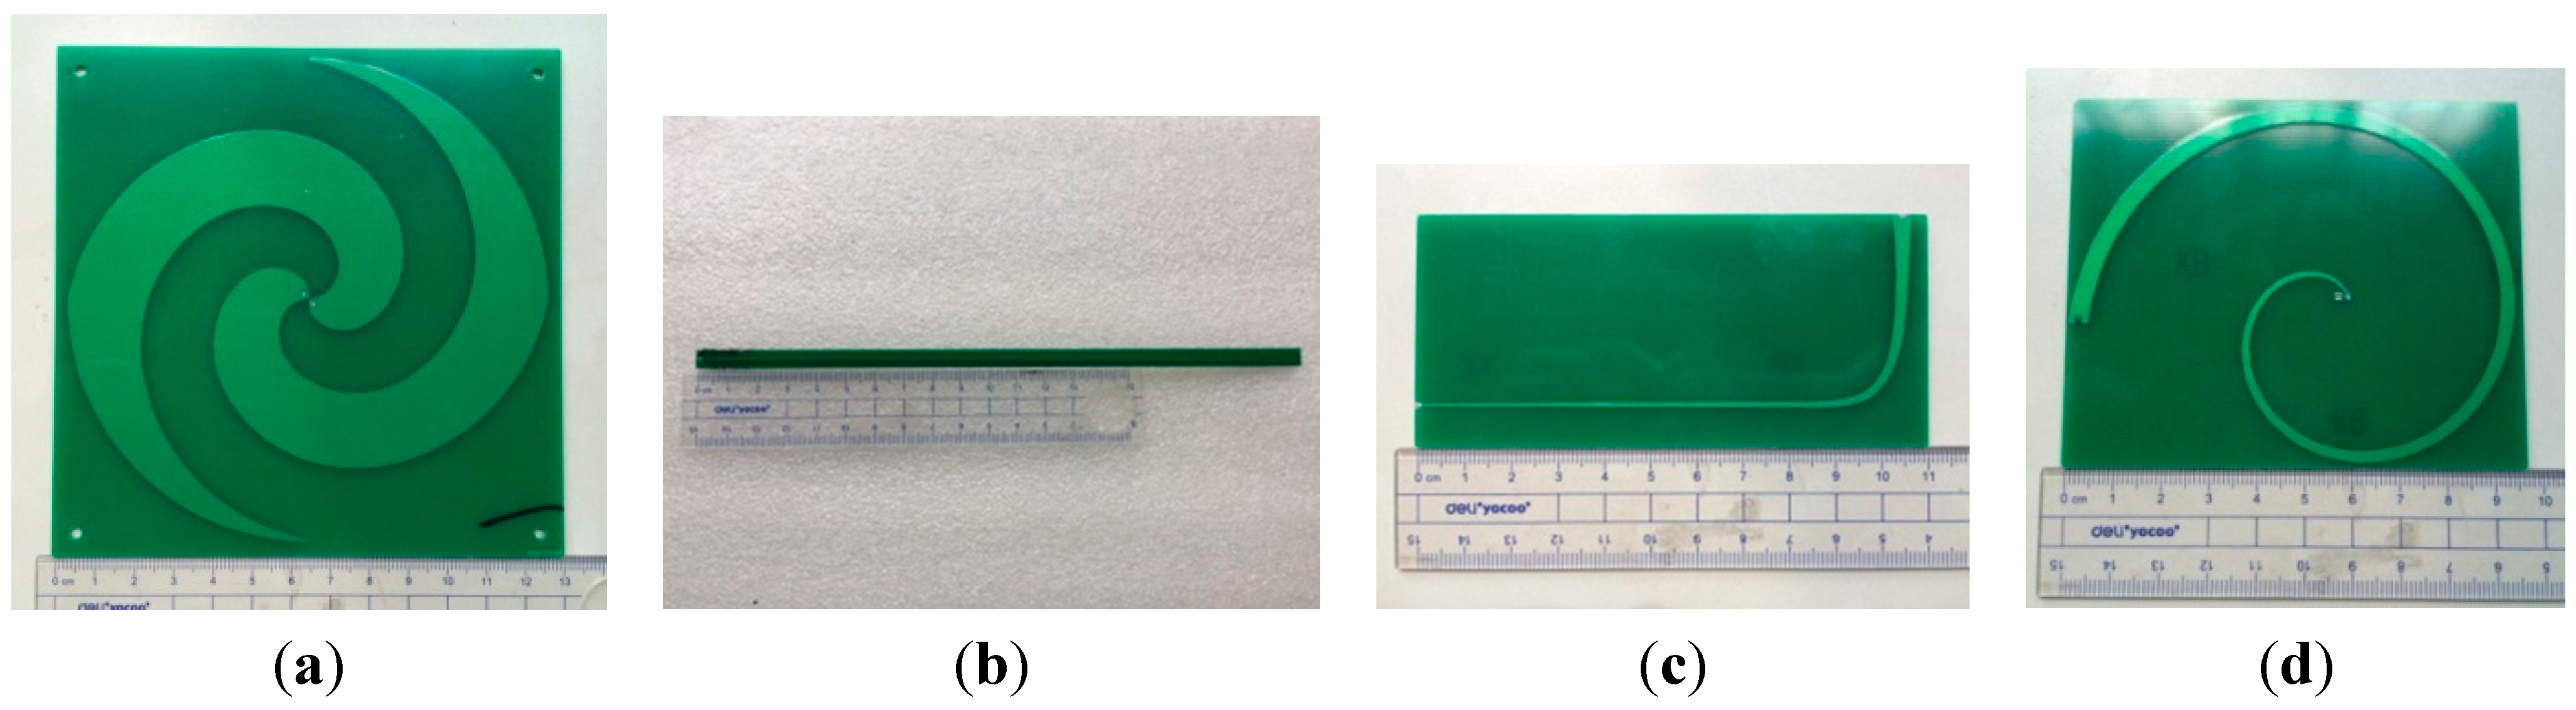
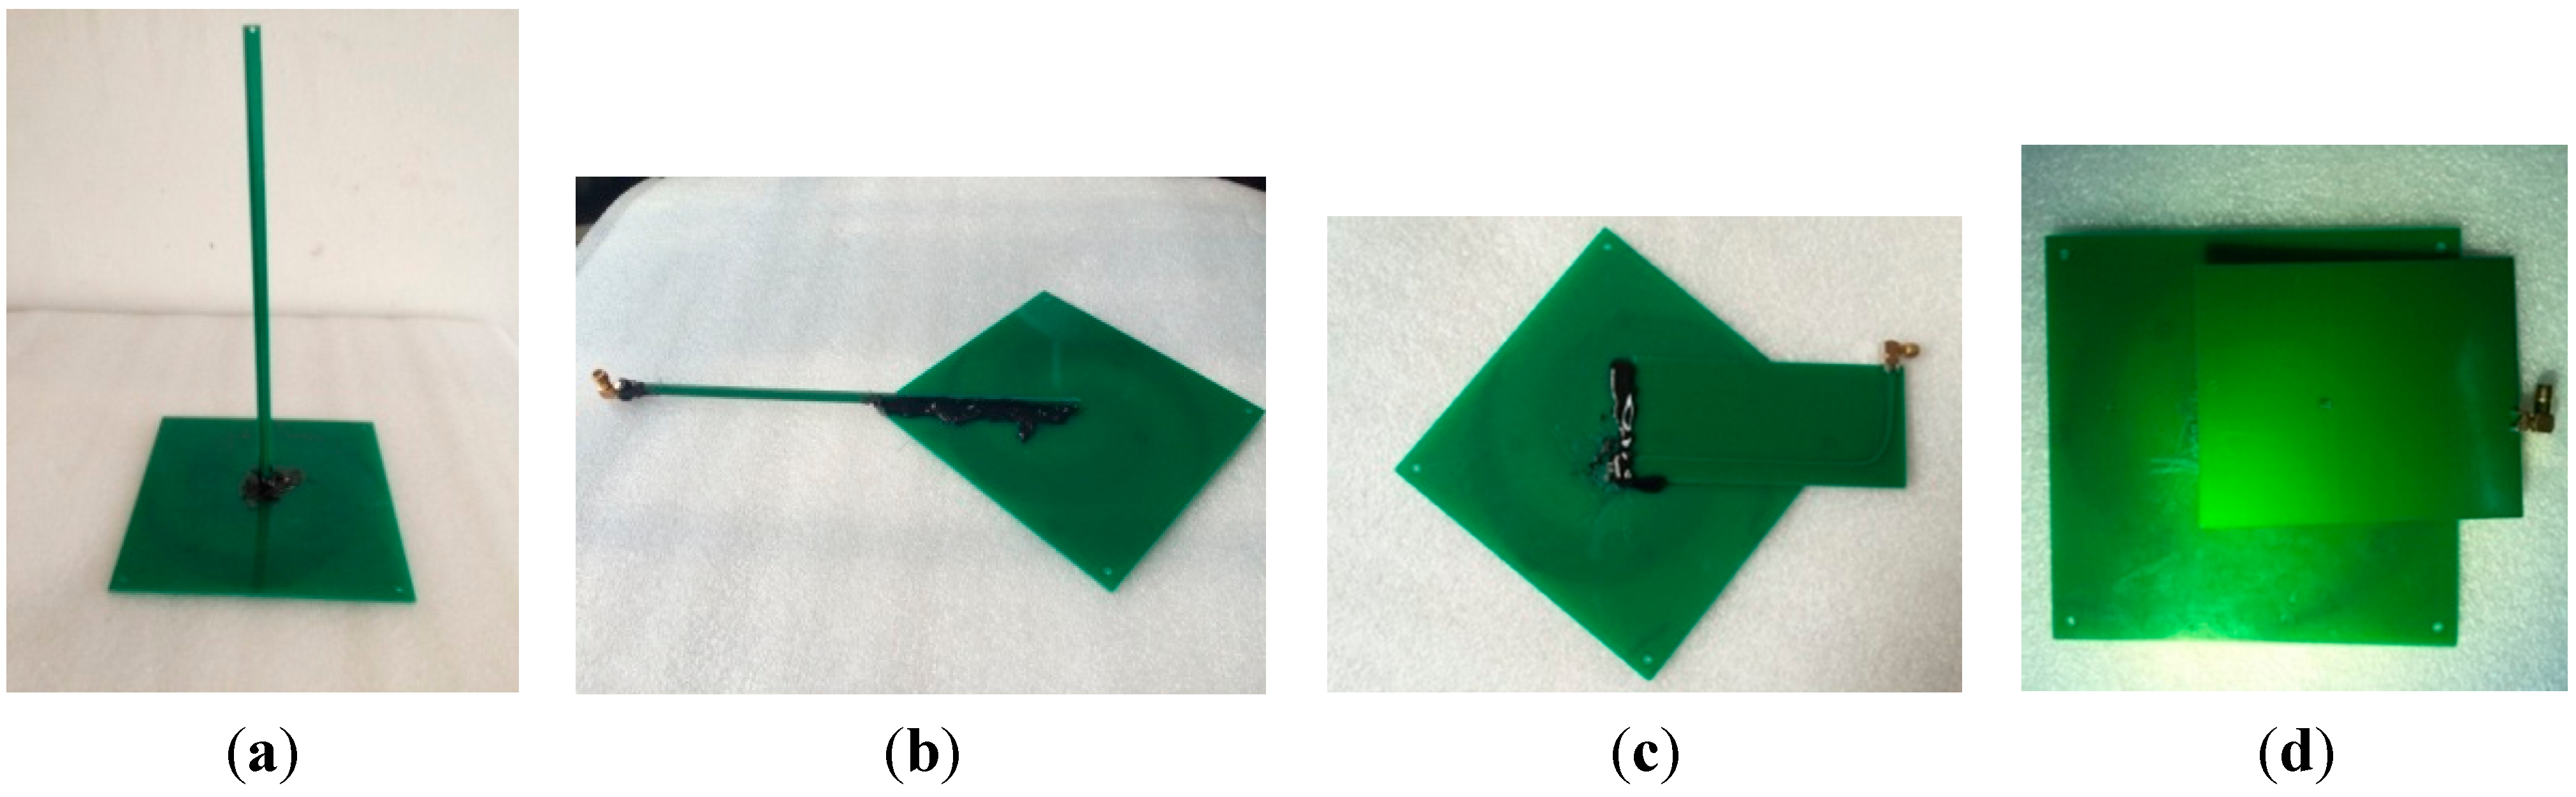
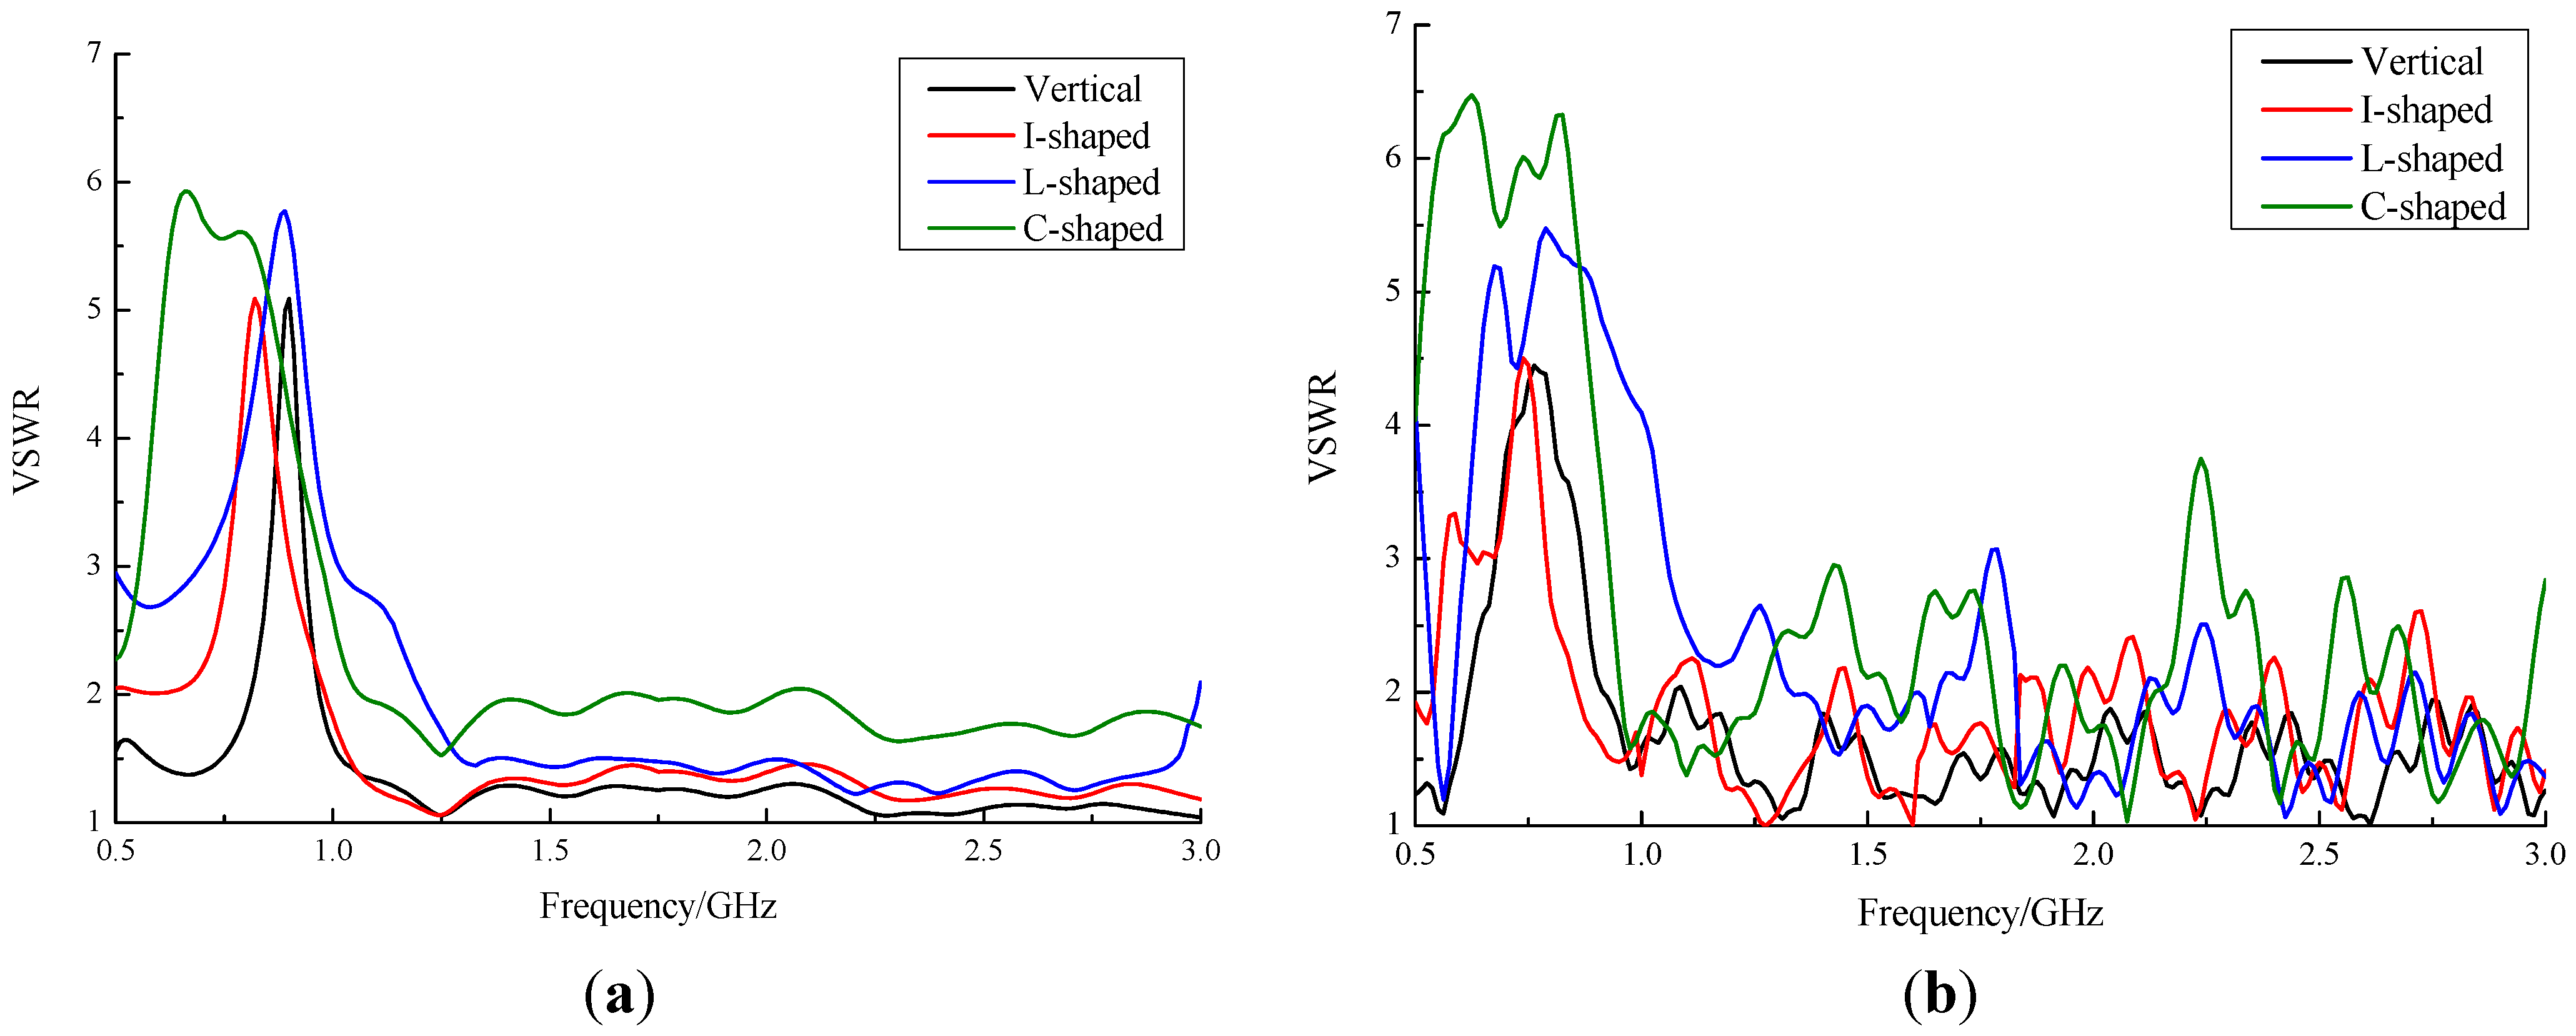
- An I-shaped balun, an L-shaped balun, and a C-shaped balun are attempted to further reduce the size of the entire sensor. A VSWR measurement on a VNA was conducted. The I-shaped horizontal balun performed like the original vertical type with a wide working band (500–550 MHz, 850–1050 MHz, and 1.15–3 GHz); the 2.1 GHz bandwidth was the best option.
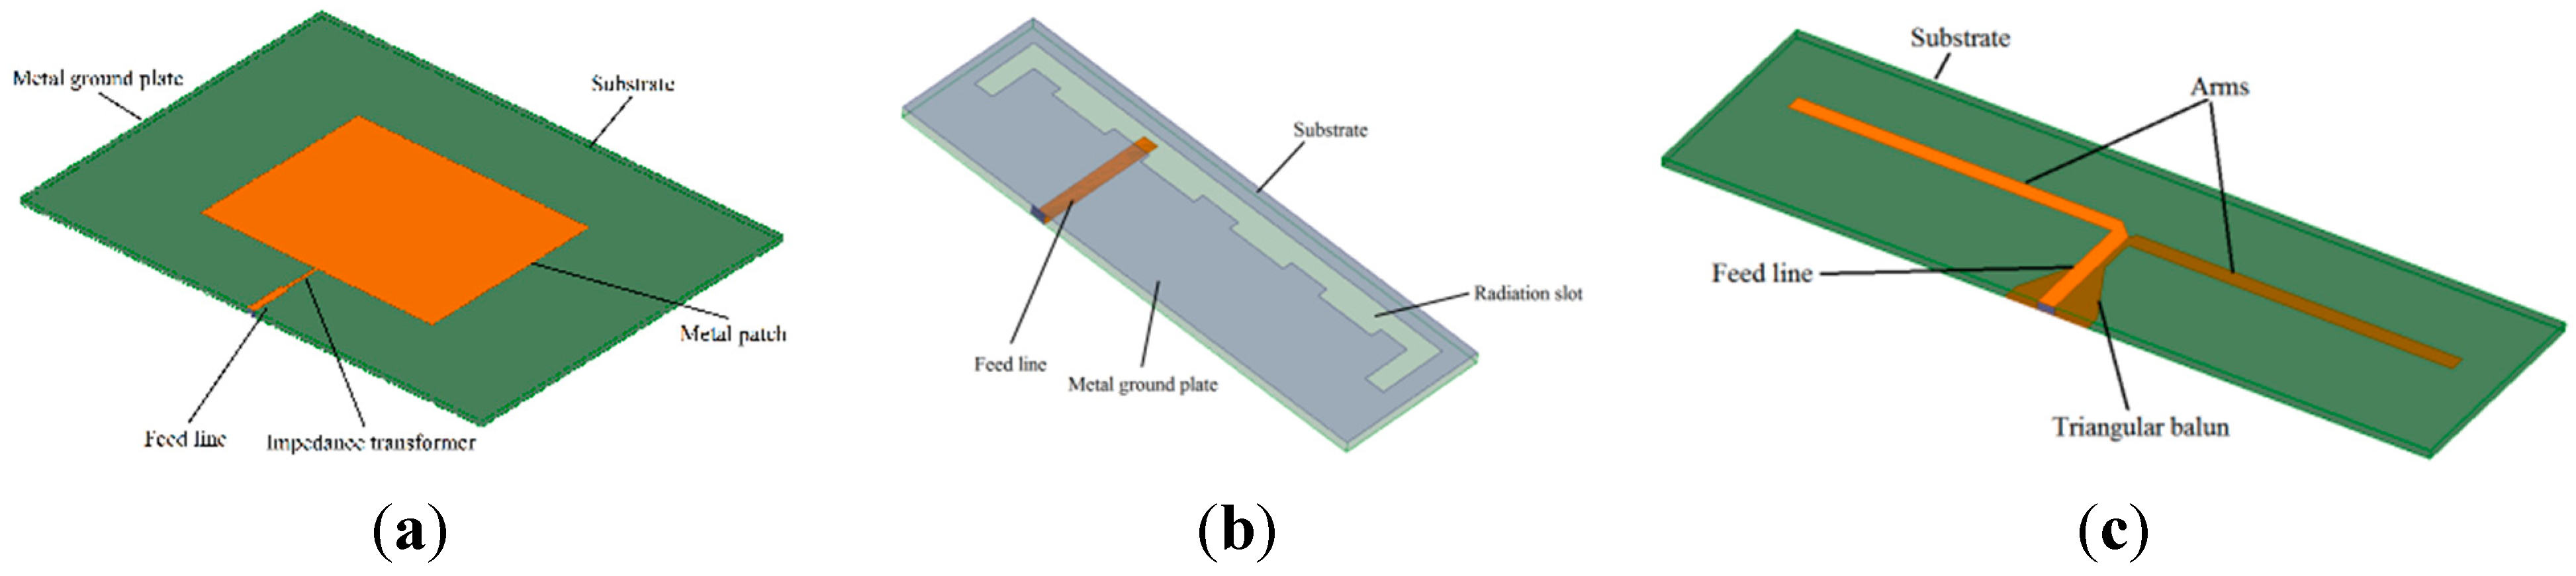
- (3)
- An MPA, an MSA, and a PDA were designed, and their performances were also analyzed and optimized. The main differences between the ESA and the other three types of sensors lay in bandwidth and the AF. The result of calibration in the GTEM cell indicated that the AF of the proposed ESA sensor was the lowest and most stable, while the AFs of the others were higher and fluctuated.
- (4)
- The experiment on UHF detection of PD by the four types of sensors showed that the performance of the ESA sensor surpassed those of the others. The magnitude of signal received by the ESA sensor was the largest, and the shape and details of the PD waveform were clearly visible on the oscilloscope. An experiment using a triangulation method to locate a PD source using the proposed ESA was also conducted. It was found that the proposed ESA revealed a PD source location with a precision of 5 cm.
Acknowledgments
Author Contributions
Conflicts of Interest
References
- Sarkar, B.; Mishra, D.K.; Koley, C.; Roy, N.K. Microstrip patch antenna based UHF sensor for detection of partial discharge in high voltage electrical equipments. In Proceedings of the Annual IEEE India Conference, Pune, India, 11–13 December 2014.
- Yao, C.; Chen, P.; Huang, C.; Chen, Y.; Qiao, P. Study on the application of an ultra-high-frequency fractal antenna to partial discharge detection in Switchgears. Sensors 2013, 13, 17362–17378. [Google Scholar] [CrossRef] [PubMed]
- Li, J.; Jiang, T.; Cheng, C.; Wang, C. Hilbert fractal antenna for UHF detection of partial discharges in transformers. IEEE Trans. Dielectr. Electr. Insul. 2013, 20, 2017–2025. [Google Scholar] [CrossRef]
- Sarathi, R.; Koperundevi, G. Investigation of partial discharge activity of single conducting particle in transformer oil under DC voltages using UHF technique. IET Sci. Meas. Technol. 2009, 3, 325–333. [Google Scholar] [CrossRef]
- Kaneko, S.; Okabe, S.; Yosh, M.; Muto, H.; Nishida, C.; Kamei, M. Detecting characteristics of various type antennas on partial discharge electromagnetic wave radiating through insulating spacer in gas insulated switchgear. IEEE Trans. Dielectr. Electr. Insul. 2009, 16, 1462–1472. [Google Scholar] [CrossRef]
- Álvarez, F.; Garnacho, F.; Ortego, J.; Sánchez-Urán, M.Á. Application of HFCT and UHF sensors in on-line partial discharge measurements for insulation diagnosis of high voltage equipment. Sensors 2015, 15, 7360–7387. [Google Scholar] [CrossRef] [PubMed]
- Wang, L.; Fang, N.; Wu, C.; Qin, H.; Huang, Z. A fiber optic PD sensor using a balanced Sagnac interferometer and an EDFA-Based DOP Tunable fiber ring laser. Sensors 2014, 14, 8398–8422. [Google Scholar] [CrossRef] [PubMed]
- Robles, G.; Sanchez-Fernandez, M.; Albarracin, S.R.; Rojas-Moreno, M.V.; Rajo-Iglesias, E.; Martinez-Tarifa, J.M. Antennas parameterization for the detection of partial discharges. IEEE Trans. Instrum. Meas. 2013, 62, 932–941. [Google Scholar] [CrossRef]
- Hoshino, T.; Maruyama, S.; Ohtsuka, S.; Hikita, M.; Wada, J.; Okabe, S. Sensitivity comparison of disc- and loop-type sensors using the UHF method to detect partial discharges in GIS. IEEE Trans. Dielectr. Electr. Insul. 2012, 19, 910–916. [Google Scholar] [CrossRef]
- Li, T.; Rong, M.; Zheng, C.; Wang, X. Development simulation and experiment study on UHF partial discharge sensor in GIS. IEEE Trans. Dielectr. Electr. Insul. 2012, 19, 1421–1430. [Google Scholar] [CrossRef]
- Piccin, R.; Mor, A.; Morshuis, P.; Girodet, A.; Smit, J. Partial discharge analysis of gas insulated systems at high voltage AC and DC. IEEE Trans. Dielectr. Electr. Insul. 2015, 22, 218–228. [Google Scholar] [CrossRef]
- Hai-feng, Y.; Xiu-chen, J.; Yong, Q.; Ge-hao, S.; Yue, D. Development of multi-band ultra-high-frequency sensor for partial discharge monitoring based on the meandering technique. IET Sci. Meas. Technol. 2014, 8, 327–335. [Google Scholar] [CrossRef]
- Muslim, J.; Susilo, A.; Nishigouchi, K.; Kozako, M.; Hikita, M.; Arief, Y.Z.; Khayam, U.; Suwarno. Enhanced bowtie UHF antenna for detecting partial discharge in gas insulated substation. In Proceedings of the 48th International Universities’ Power Engineering Conference, Dublin, Ireland, 2–5 September 2013.
- Lopez-Roldan, J.; Tang, T.; Gaskin, M. Optimisation of a sensor for onsite detection of partial discharges in power transformers by the UHF method. IEEE Trans. Dielectr. Electr. Insul. 2008, 15, 1634–1639. [Google Scholar] [CrossRef]
- Tenbohlen, S.; Denissov, D.; Hoek, S.; Markalous, S.M. Partial discharge measurement in the ultra high frequency (UHF) range. IEEE Trans. Dielectr. Electr. Insul. 2008, 15, 1544–1552. [Google Scholar] [CrossRef]
- Gao, W.; Ding, D.; Liu, W.; Huang, X. Analysis of the intrinsic characteristics of the partial discharge induced by typical defects in GIS. IEEE Trans. Dielectr. Electr. Insul. 2013, 20, 782–790. [Google Scholar] [CrossRef]
- Pinpart, T.; Judd, M.D. Experimental comparison of UHF sensor types for PD location applications. In Proceedings of the IEEE Electrical Insulation Conference, Montreal, QC, Canada, 31 May 2009–3 June 2009.
- McFadden, M.; Scott, W.R. Analysis of the equiangular spiral antenna on a dielectric substrate. IEEE Trans. Antennas Propag. 2007, 55, 3163–3171. [Google Scholar] [CrossRef]
- Fu, W.; Lopez, E.R.; Rowe, W.S.T.; Ghorbani, K. A planar dual-arm equiangular spiral antenna. IEEE Trans. Antennas Propag. 2010, 58, 1775–1779. [Google Scholar] [CrossRef]
- Eubanks, T.W.; Chang, K. A compact parallel-plane perpendicular-current feed for a modified equiangular spiral antenna. IEEE Trans. Antennas Propag. 2010, 58, 2193–2202. [Google Scholar] [CrossRef]
- Mao, S.-G.; Yeh, J.-C.; Chen, S.-L. Ultrawideband circularly polarized spiral antenna using integrated balun with application to time-domain target detection. IEEE Trans. Antennas Propag. 2009, 57, 1914–1920. [Google Scholar] [CrossRef]
- Chen, T.-K.; Huff, G.H. Stripline-fed Archimedean spiral antenna. IEEE Antennas Wirel. Propag. Lett. 2011, 10, 346–349. [Google Scholar] [CrossRef]
- Veysi, M.; Kamyab, M. Bandwidth enhancement of low-profile PEC-backed equiangular spiral antennas incorporating metallic posts. IEEE Trans. Antennas Propag. 2011, 59, 4315–4318. [Google Scholar] [CrossRef]
- Hou, H.; Sheng, G.; Jiang, X. Robust time delay estimation method for locating UHF signals of partial discharge in substation. IEEE Trans. Power Deliv. 2013, 28, 1960–1968. [Google Scholar]
- Markalous, S.; Tenbohlen, S.; Feser, K. Detection and location of partial discharges in power transformers using acoustic and electromagnetic signals. IEEE Trans. Dielectr. Electr. Insul. 2008, 15, 1576–1583. [Google Scholar] [CrossRef]
- Sinaga, H.H.; Phung, B.T.; Blackburn, T.R. Partial discharge localization in transformers using UHF detection method. IEEE Trans. Dielectr. Electr. Insul. 2012, 19, 1891–1900. [Google Scholar] [CrossRef]
© 2015 by the authors; licensee MDPI, Basel, Switzerland. This article is an open access article distributed under the terms and conditions of the Creative Commons Attribution license (http://creativecommons.org/licenses/by/4.0/).
Share and Cite
Liu, J.; Zhang, G.; Dong, J.; Wang, J. Study on Miniaturized UHF Antennas for Partial Discharge Detection in High-Voltage Electrical Equipment. Sensors 2015, 15, 29434-29451. https://doi.org/10.3390/s151129434
Liu J, Zhang G, Dong J, Wang J. Study on Miniaturized UHF Antennas for Partial Discharge Detection in High-Voltage Electrical Equipment. Sensors. 2015; 15(11):29434-29451. https://doi.org/10.3390/s151129434
Chicago/Turabian StyleLiu, Jingcun, Guogang Zhang, Jinlong Dong, and Jianhua Wang. 2015. "Study on Miniaturized UHF Antennas for Partial Discharge Detection in High-Voltage Electrical Equipment" Sensors 15, no. 11: 29434-29451. https://doi.org/10.3390/s151129434