
Sensor and Methodology for Dielectric Analysis of Vegetal Oils Submitted to Thermal Stress

 ,
,
Abstract
:1. Introduction
2. Materials and Methods
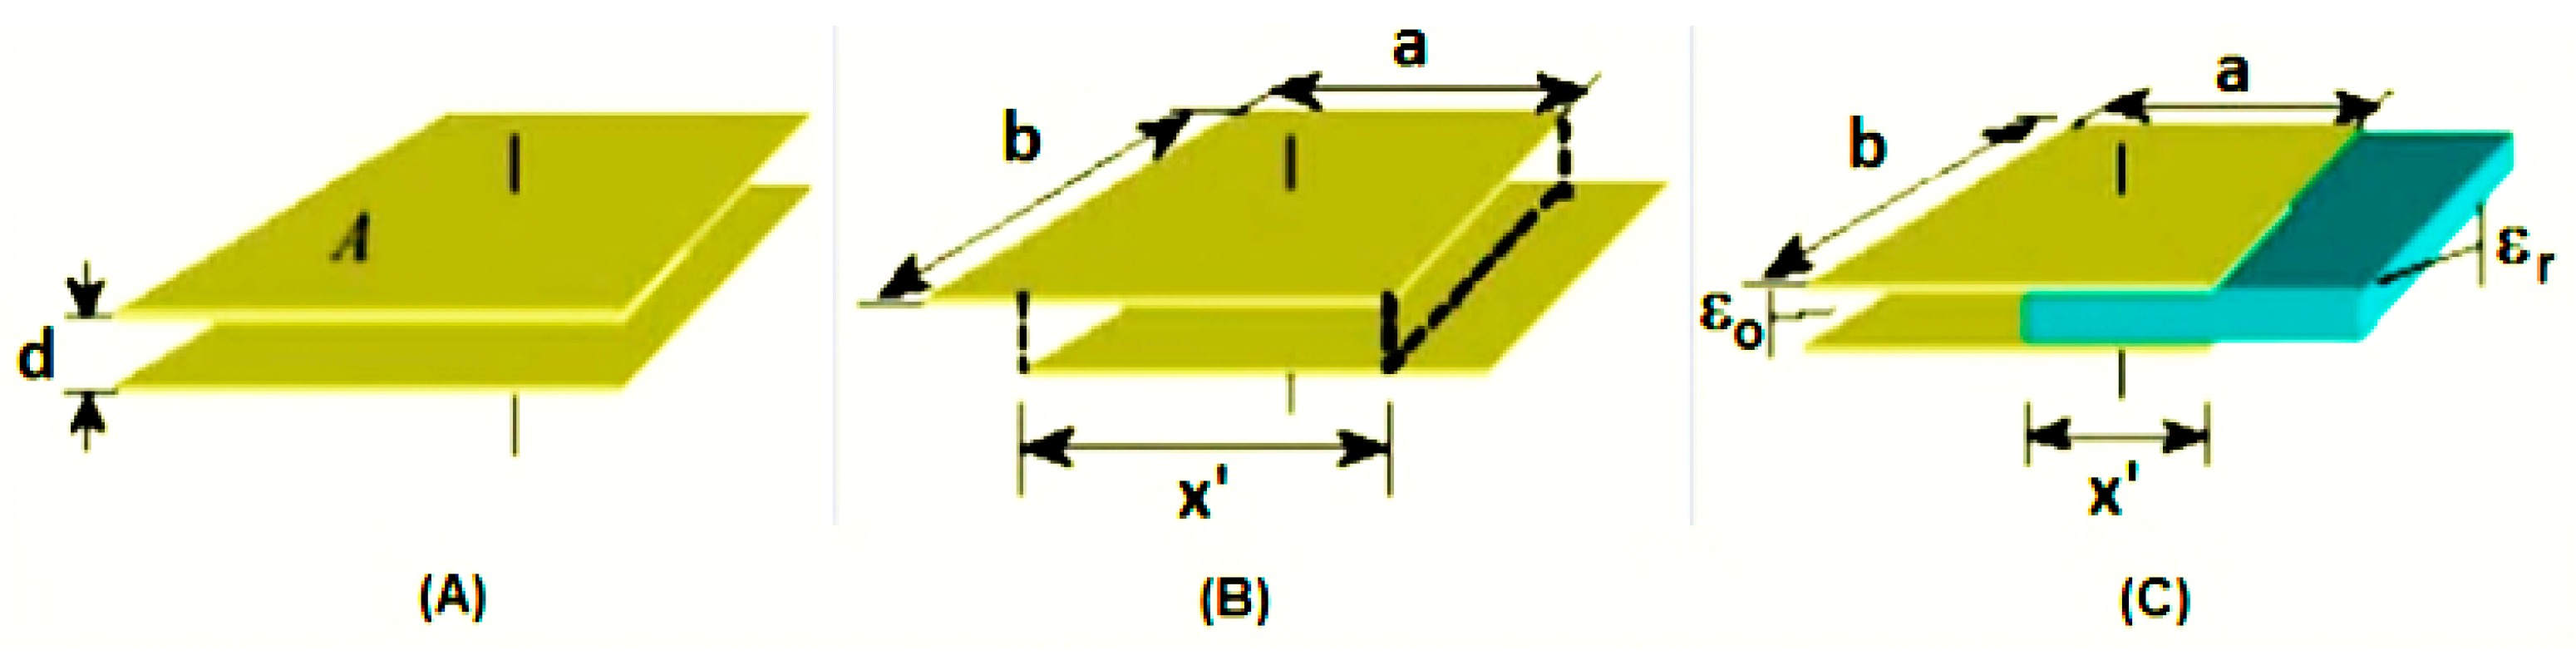
2.1. Capacitive Sensor

- (a)
- Measurement of capacitive impedance (given by 1/[2πfC]), monitoring the voltage over a resistor connected in series to the capacitor and an AC power source. When the capacitance increases, there is a reduction in the impedance of the capacitor and an increase in the voltage of the resistor. The increase is not linear with the capacitance, but it can be approximately linear for low values of ohmic resistance [28].
- (b)
- Measurement through a capacitive bridge fed by an alternate AC source (also non-linear). The advantage is that there is no alteration of the exit signal resulting from frequency changes. When adding an operational amplifier, it is possible to increase the exit signal proportionally to the capacitance [29].
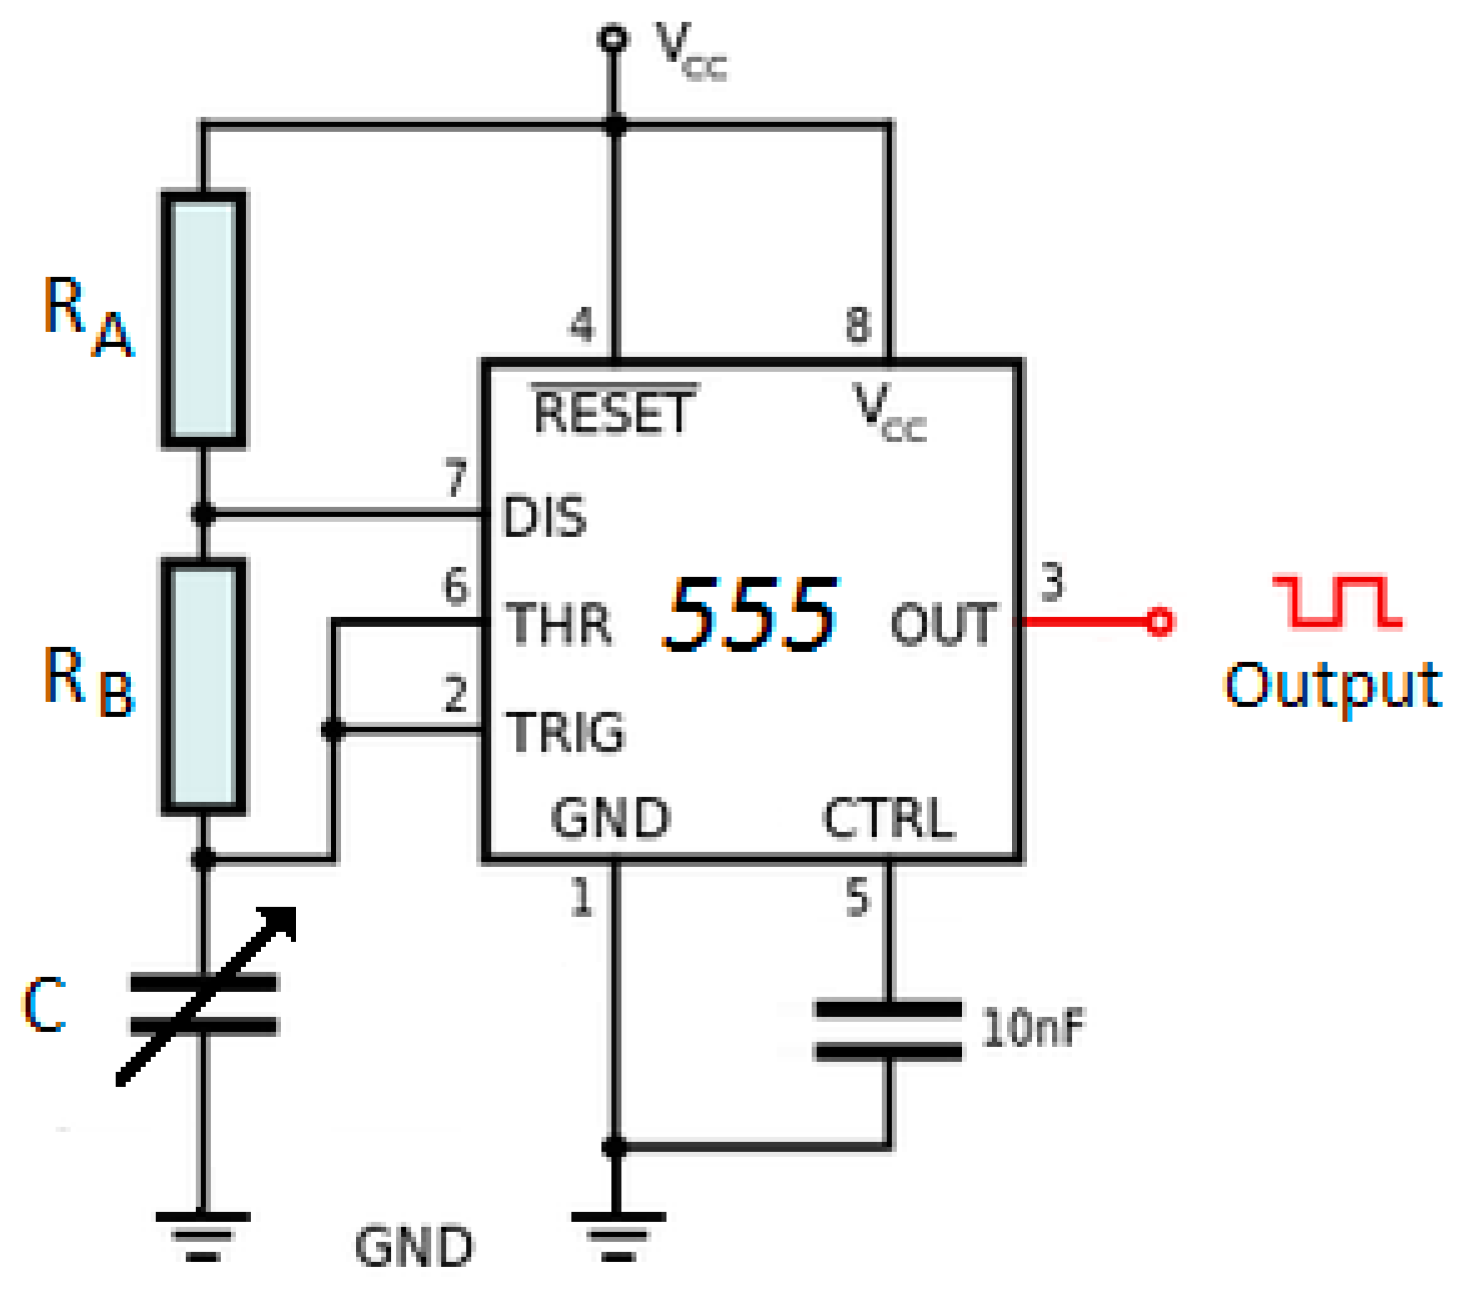
- (c)
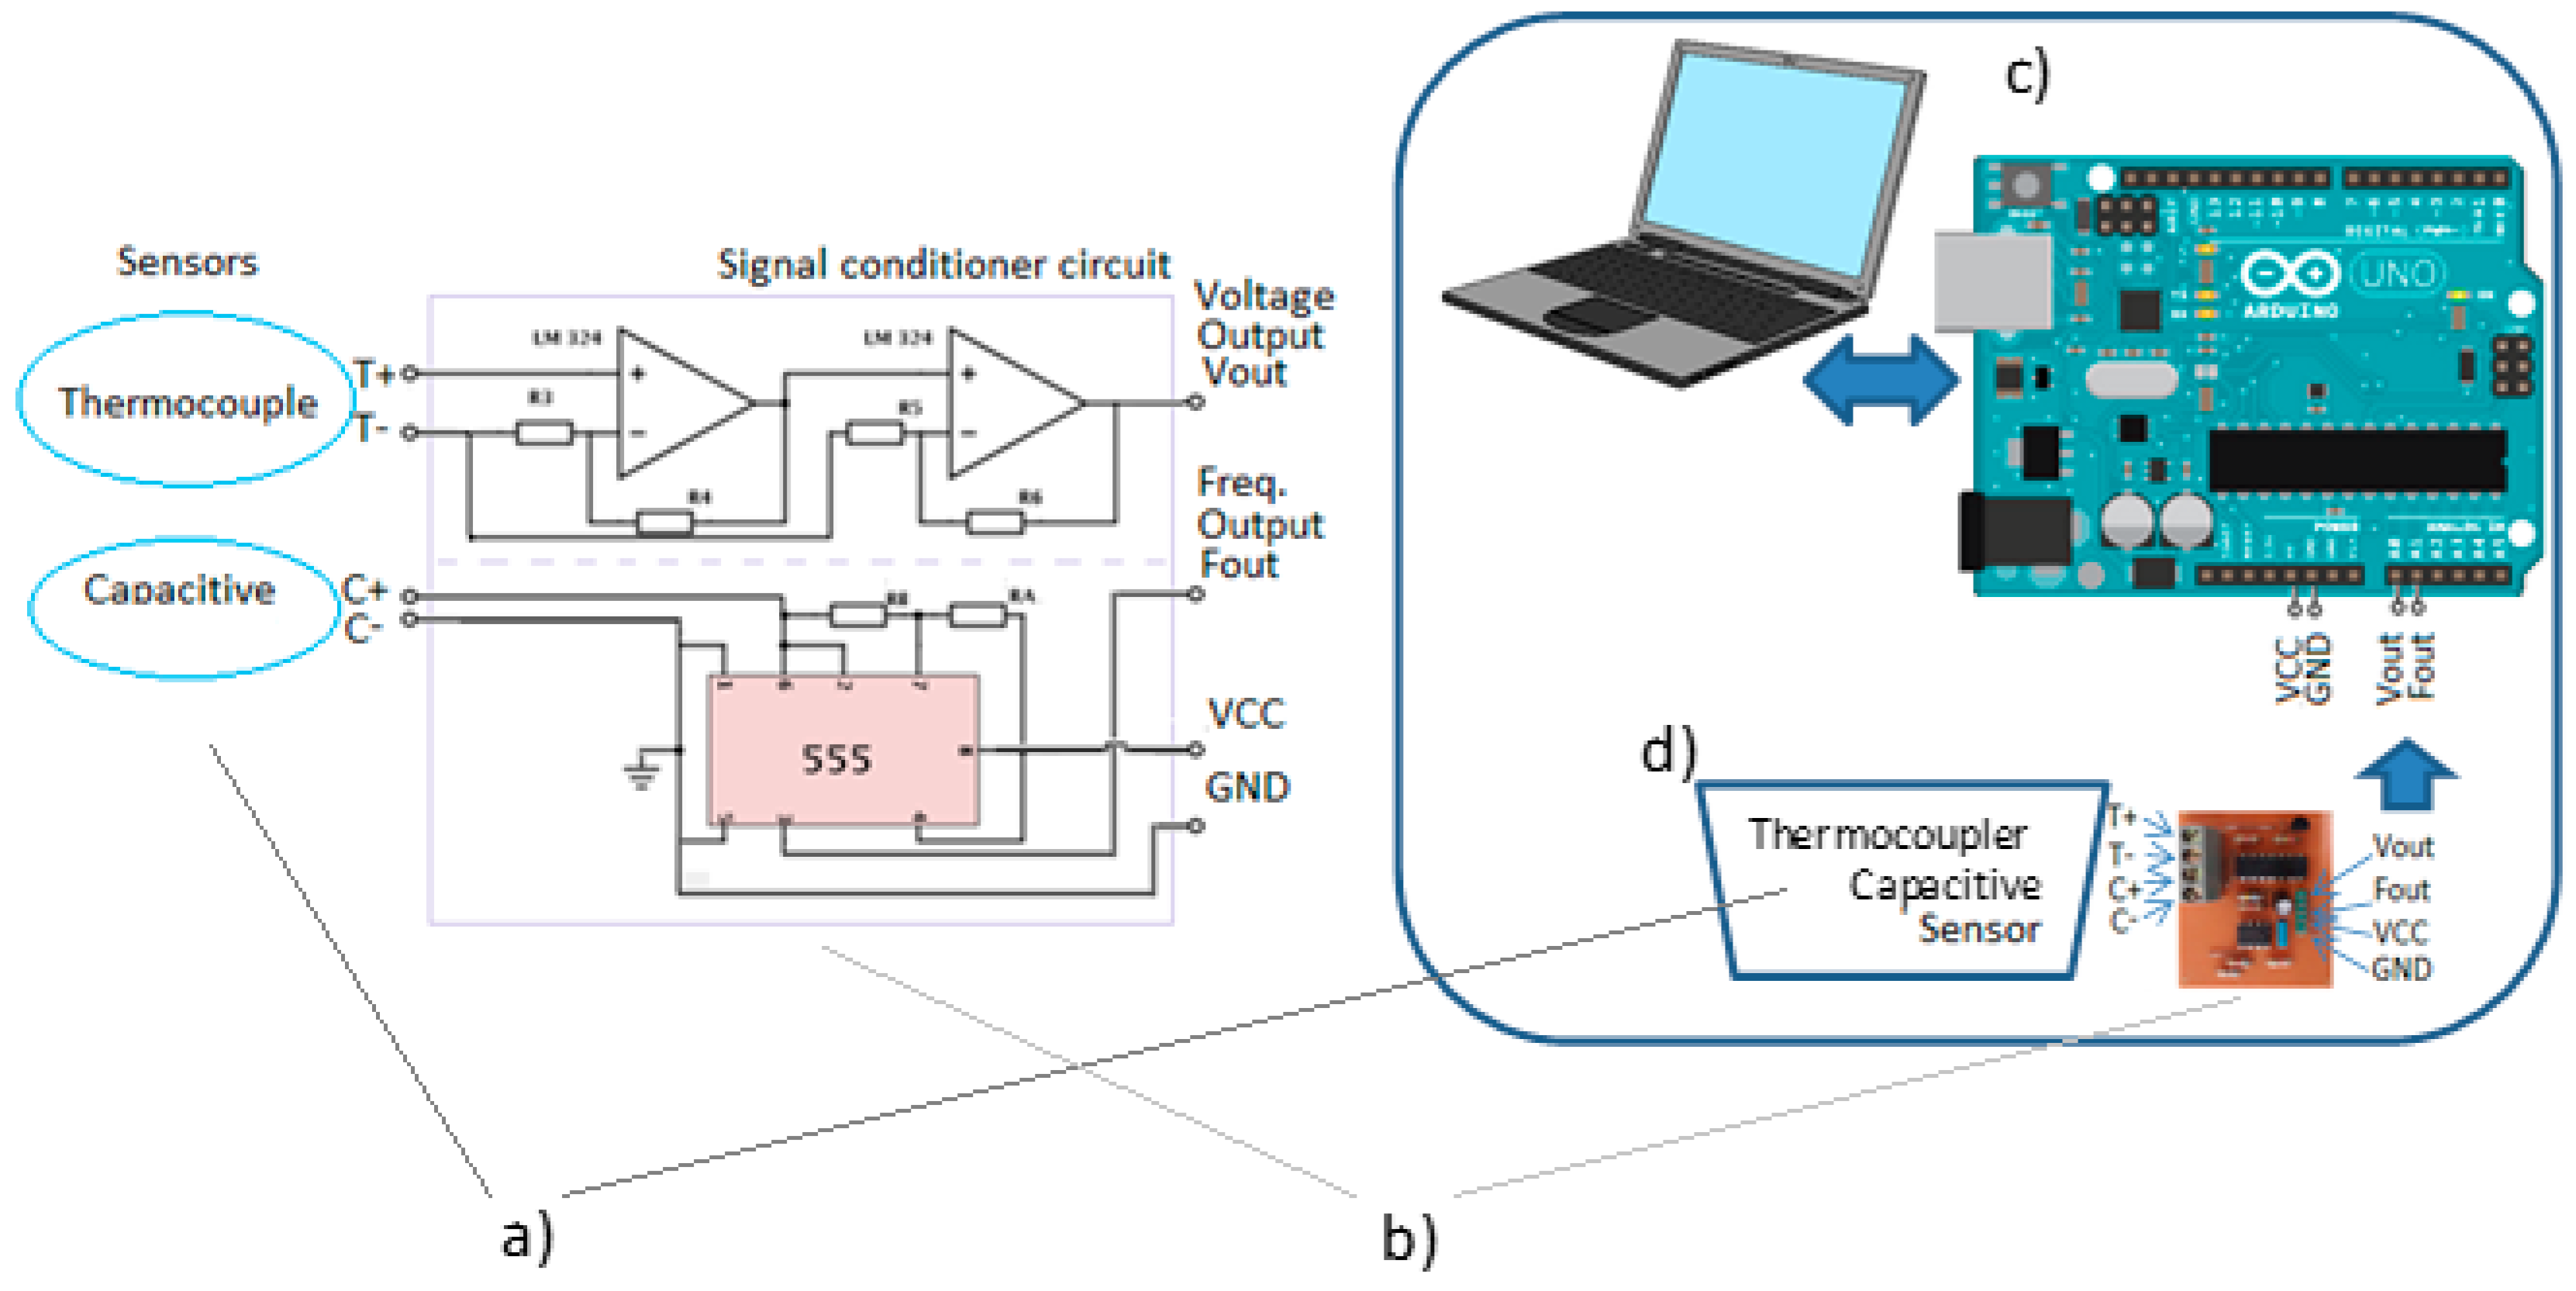
- Conversion of the sensor’s capacitance into a square wave signal with proportional frequency. Normally, an electronic oscillator circuit (as CI CA555, for industrial applications) can be used in a monostable configuration. The exit’s frequency depends on the sensor’s capacitance [30].
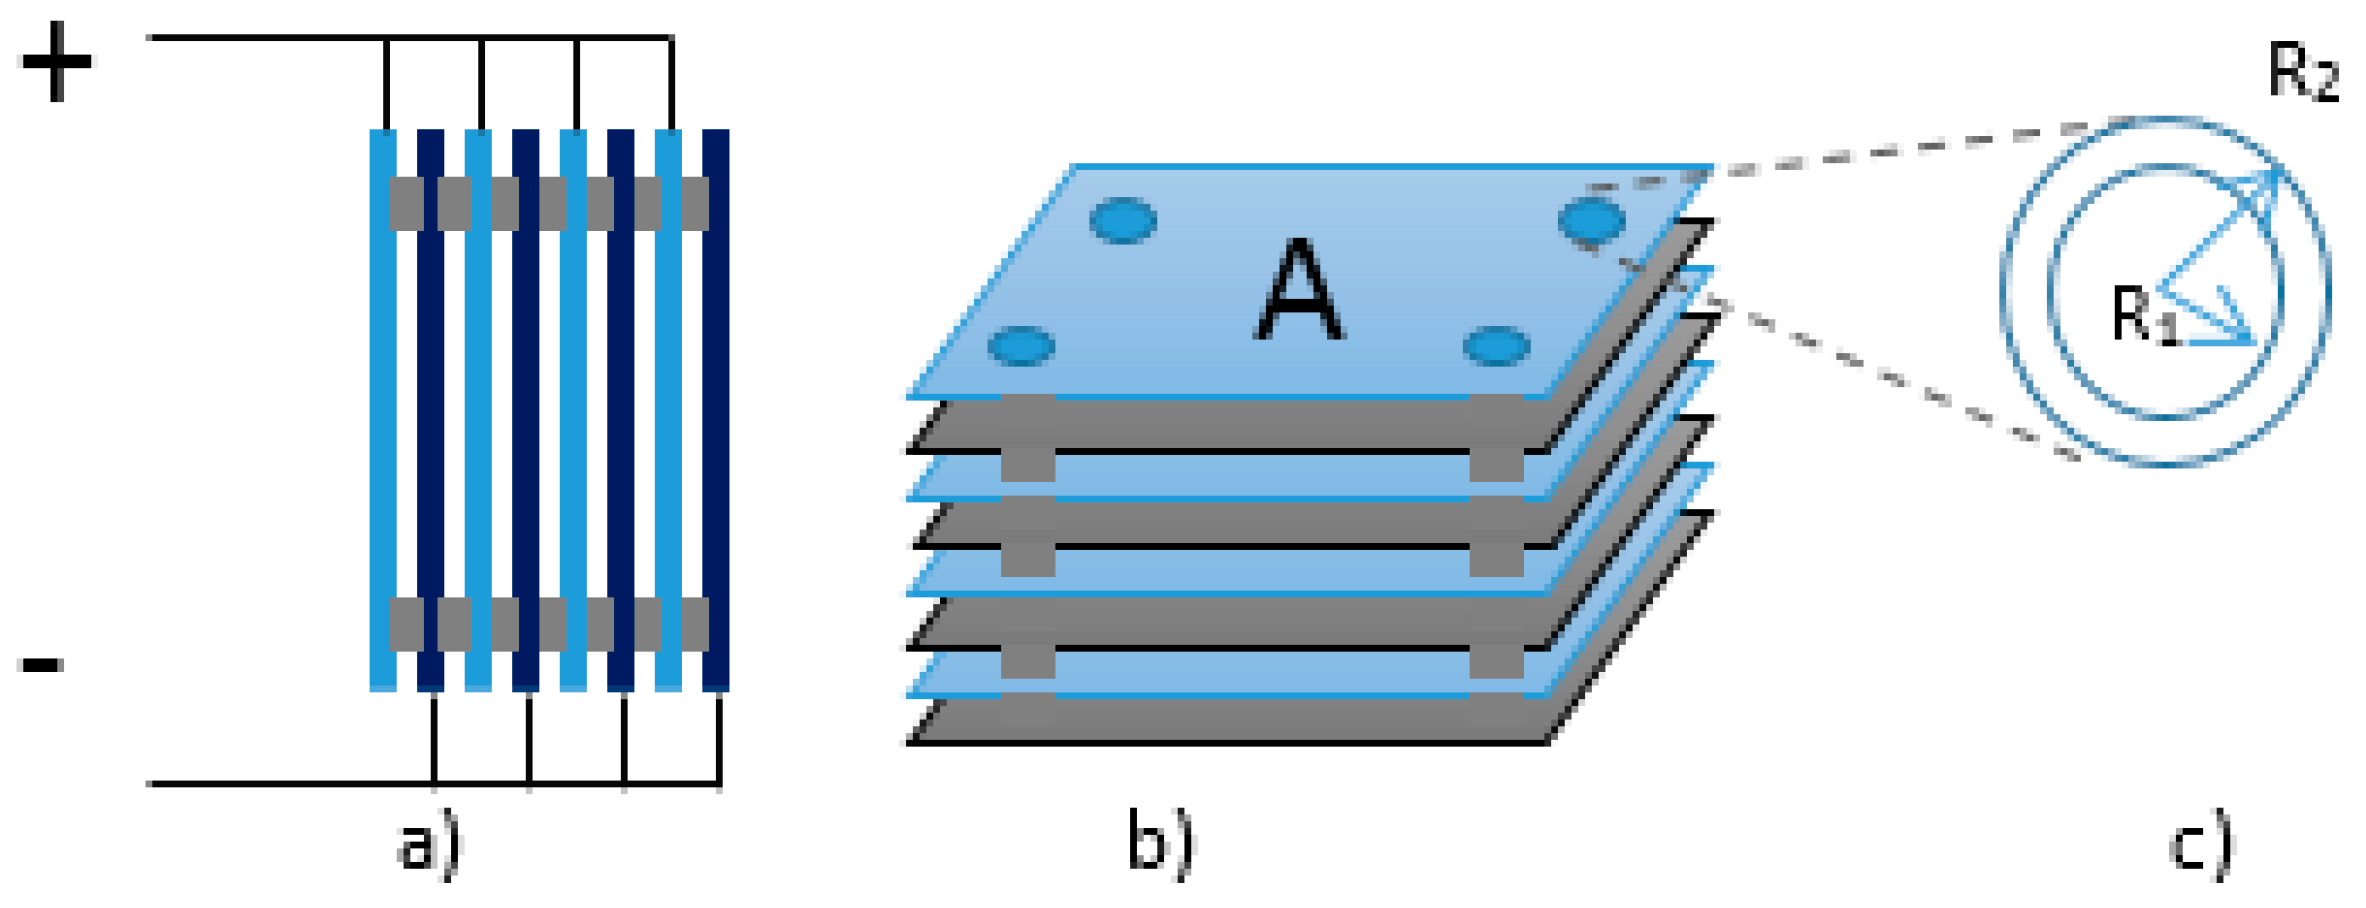
2.2. Materials and Methods Used to Build the Sensor


| Material | Melting Temperature (°C) |
|---|---|
| Teflon | 260 [31] |
| Zinc | 419.5 [32] |
| Brass | 900 [33] |
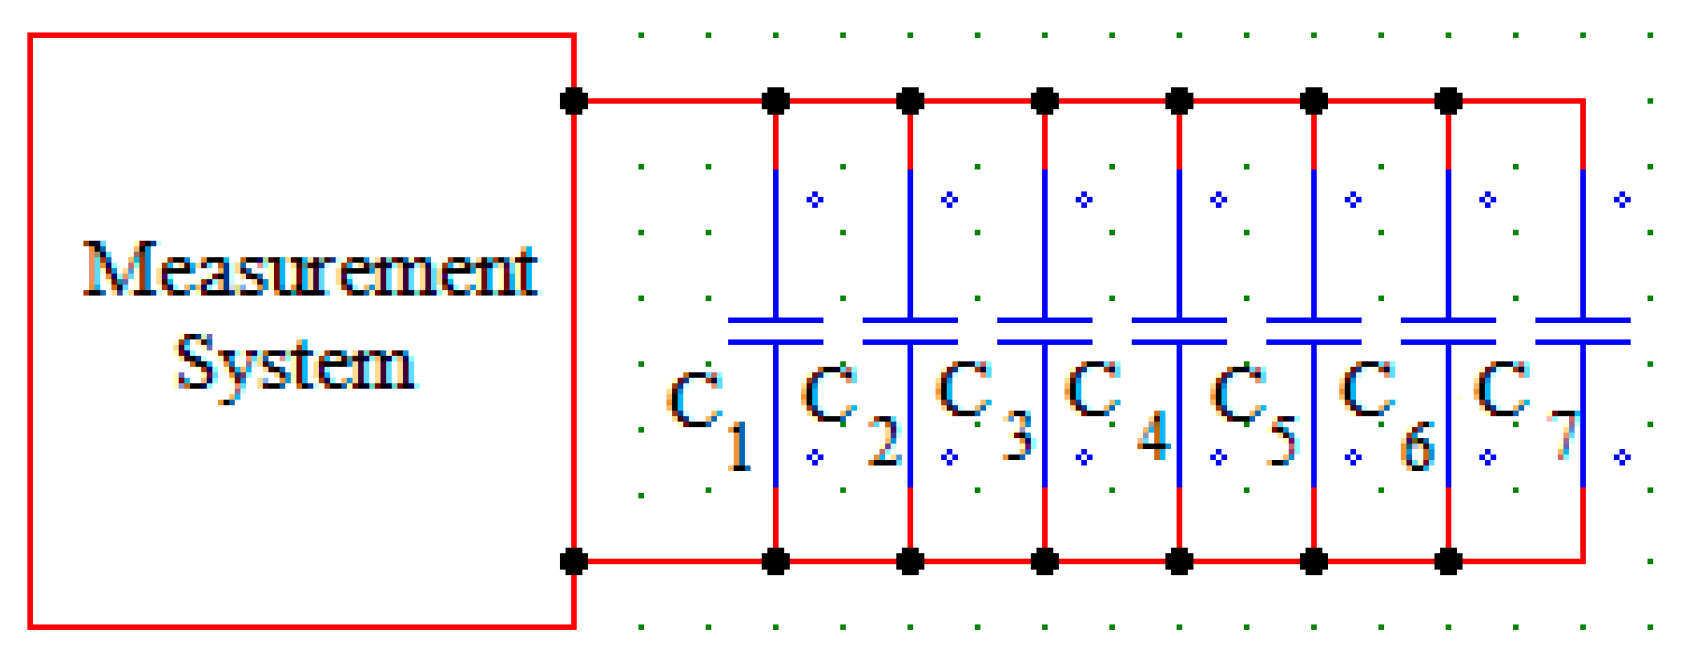
2.3. Data Acquisition Circuit


3. Introduction of Chemical Analysis
3.1. Determination of Acidity in Vegetable Oil
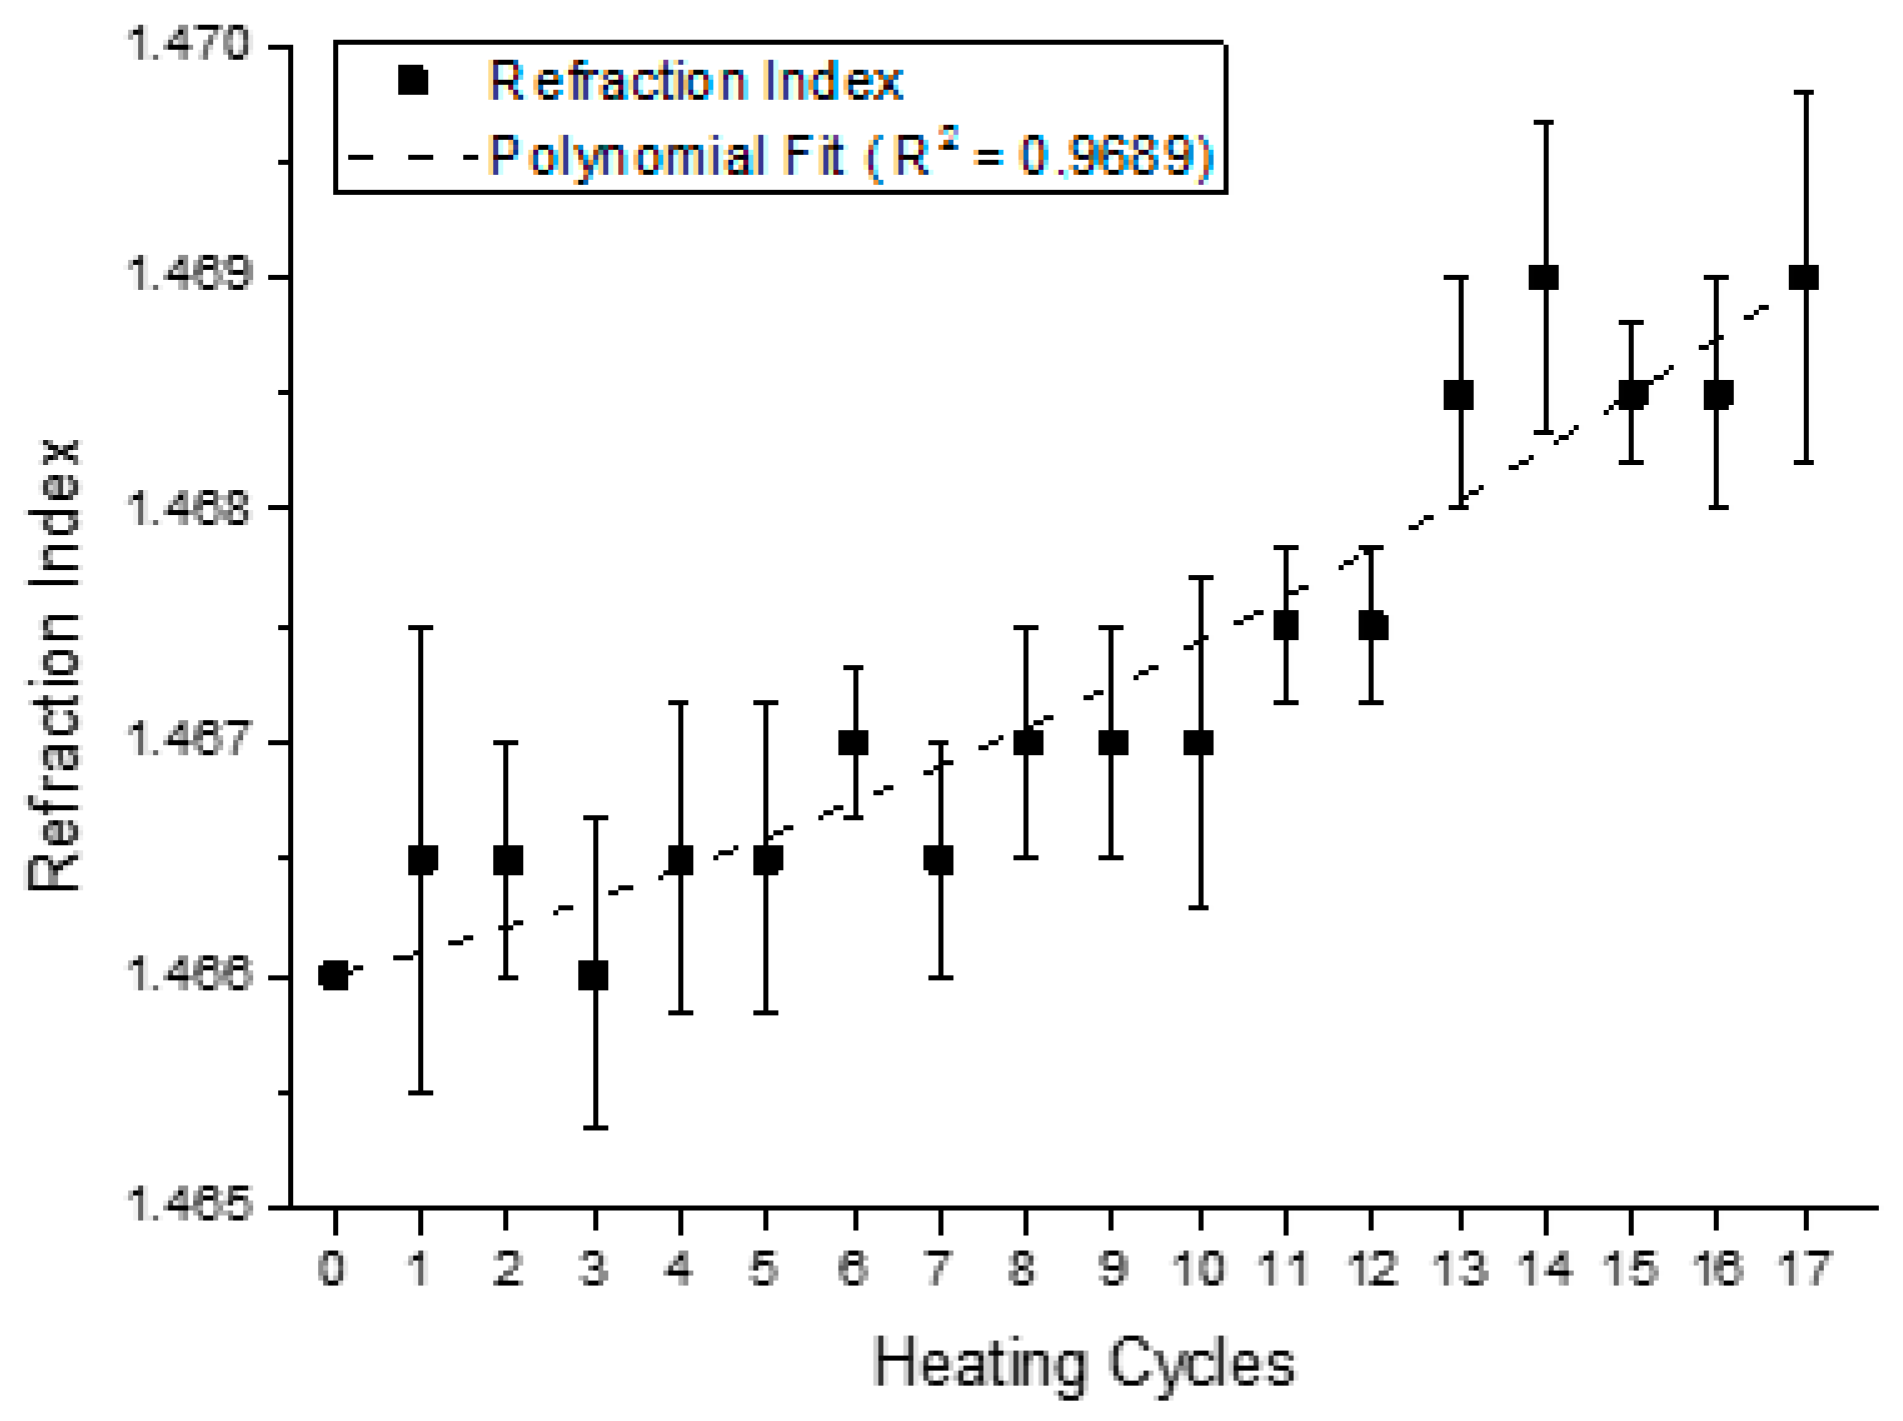
3.1.1. Refraction Index
3.1.2. Determination of the Iodine Index
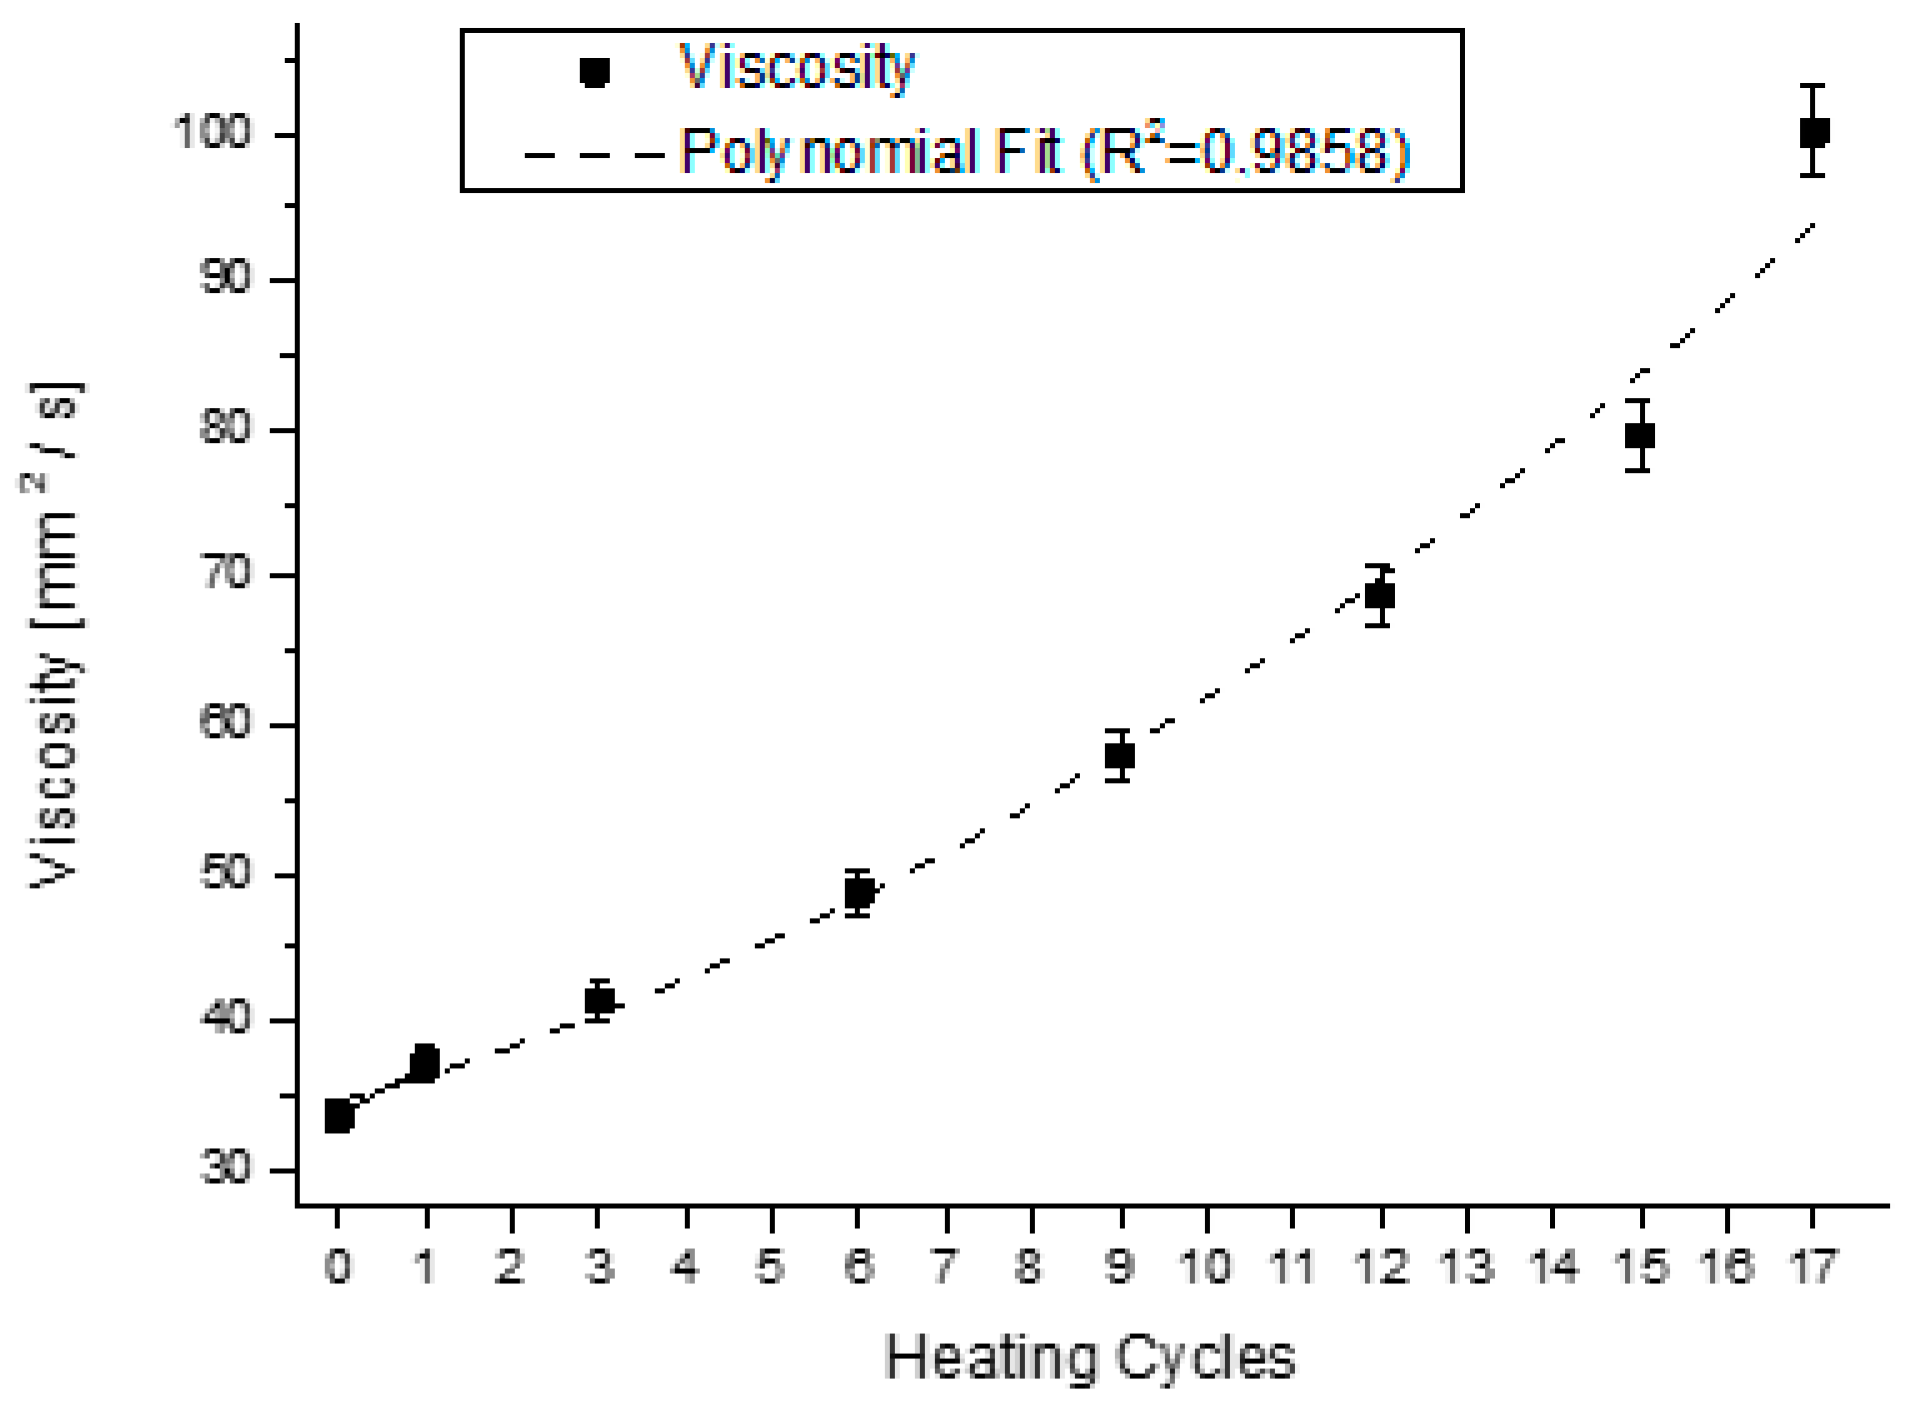
3.1.3. Determination of Viscosity
3.1.4. Measurements with Vegetable Oil

4. Results and Discussion
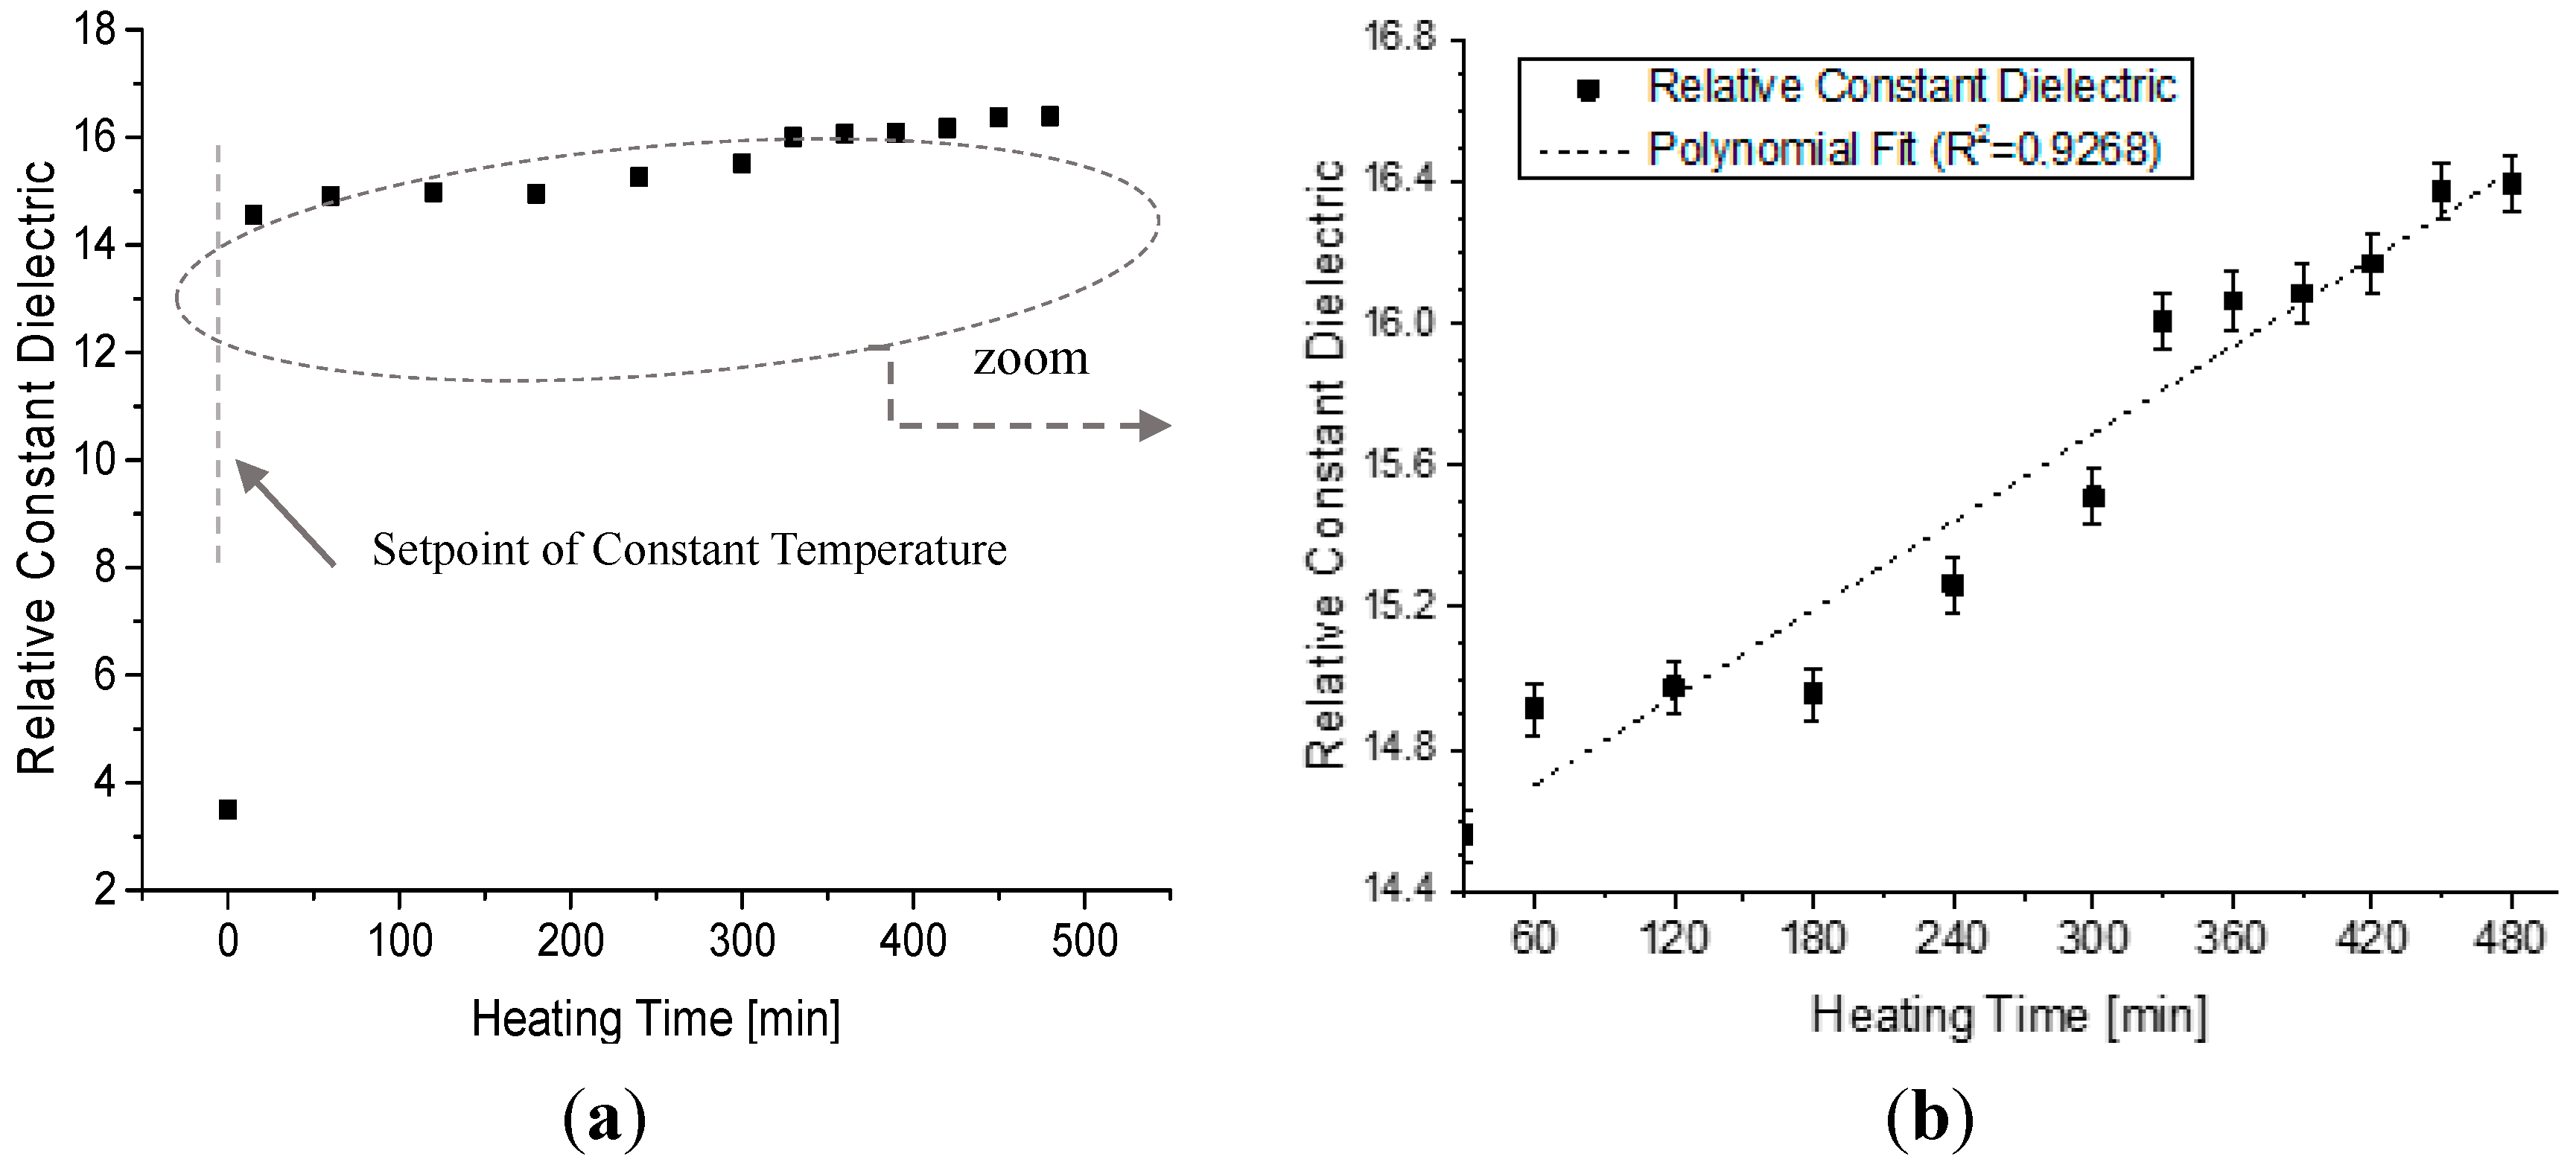
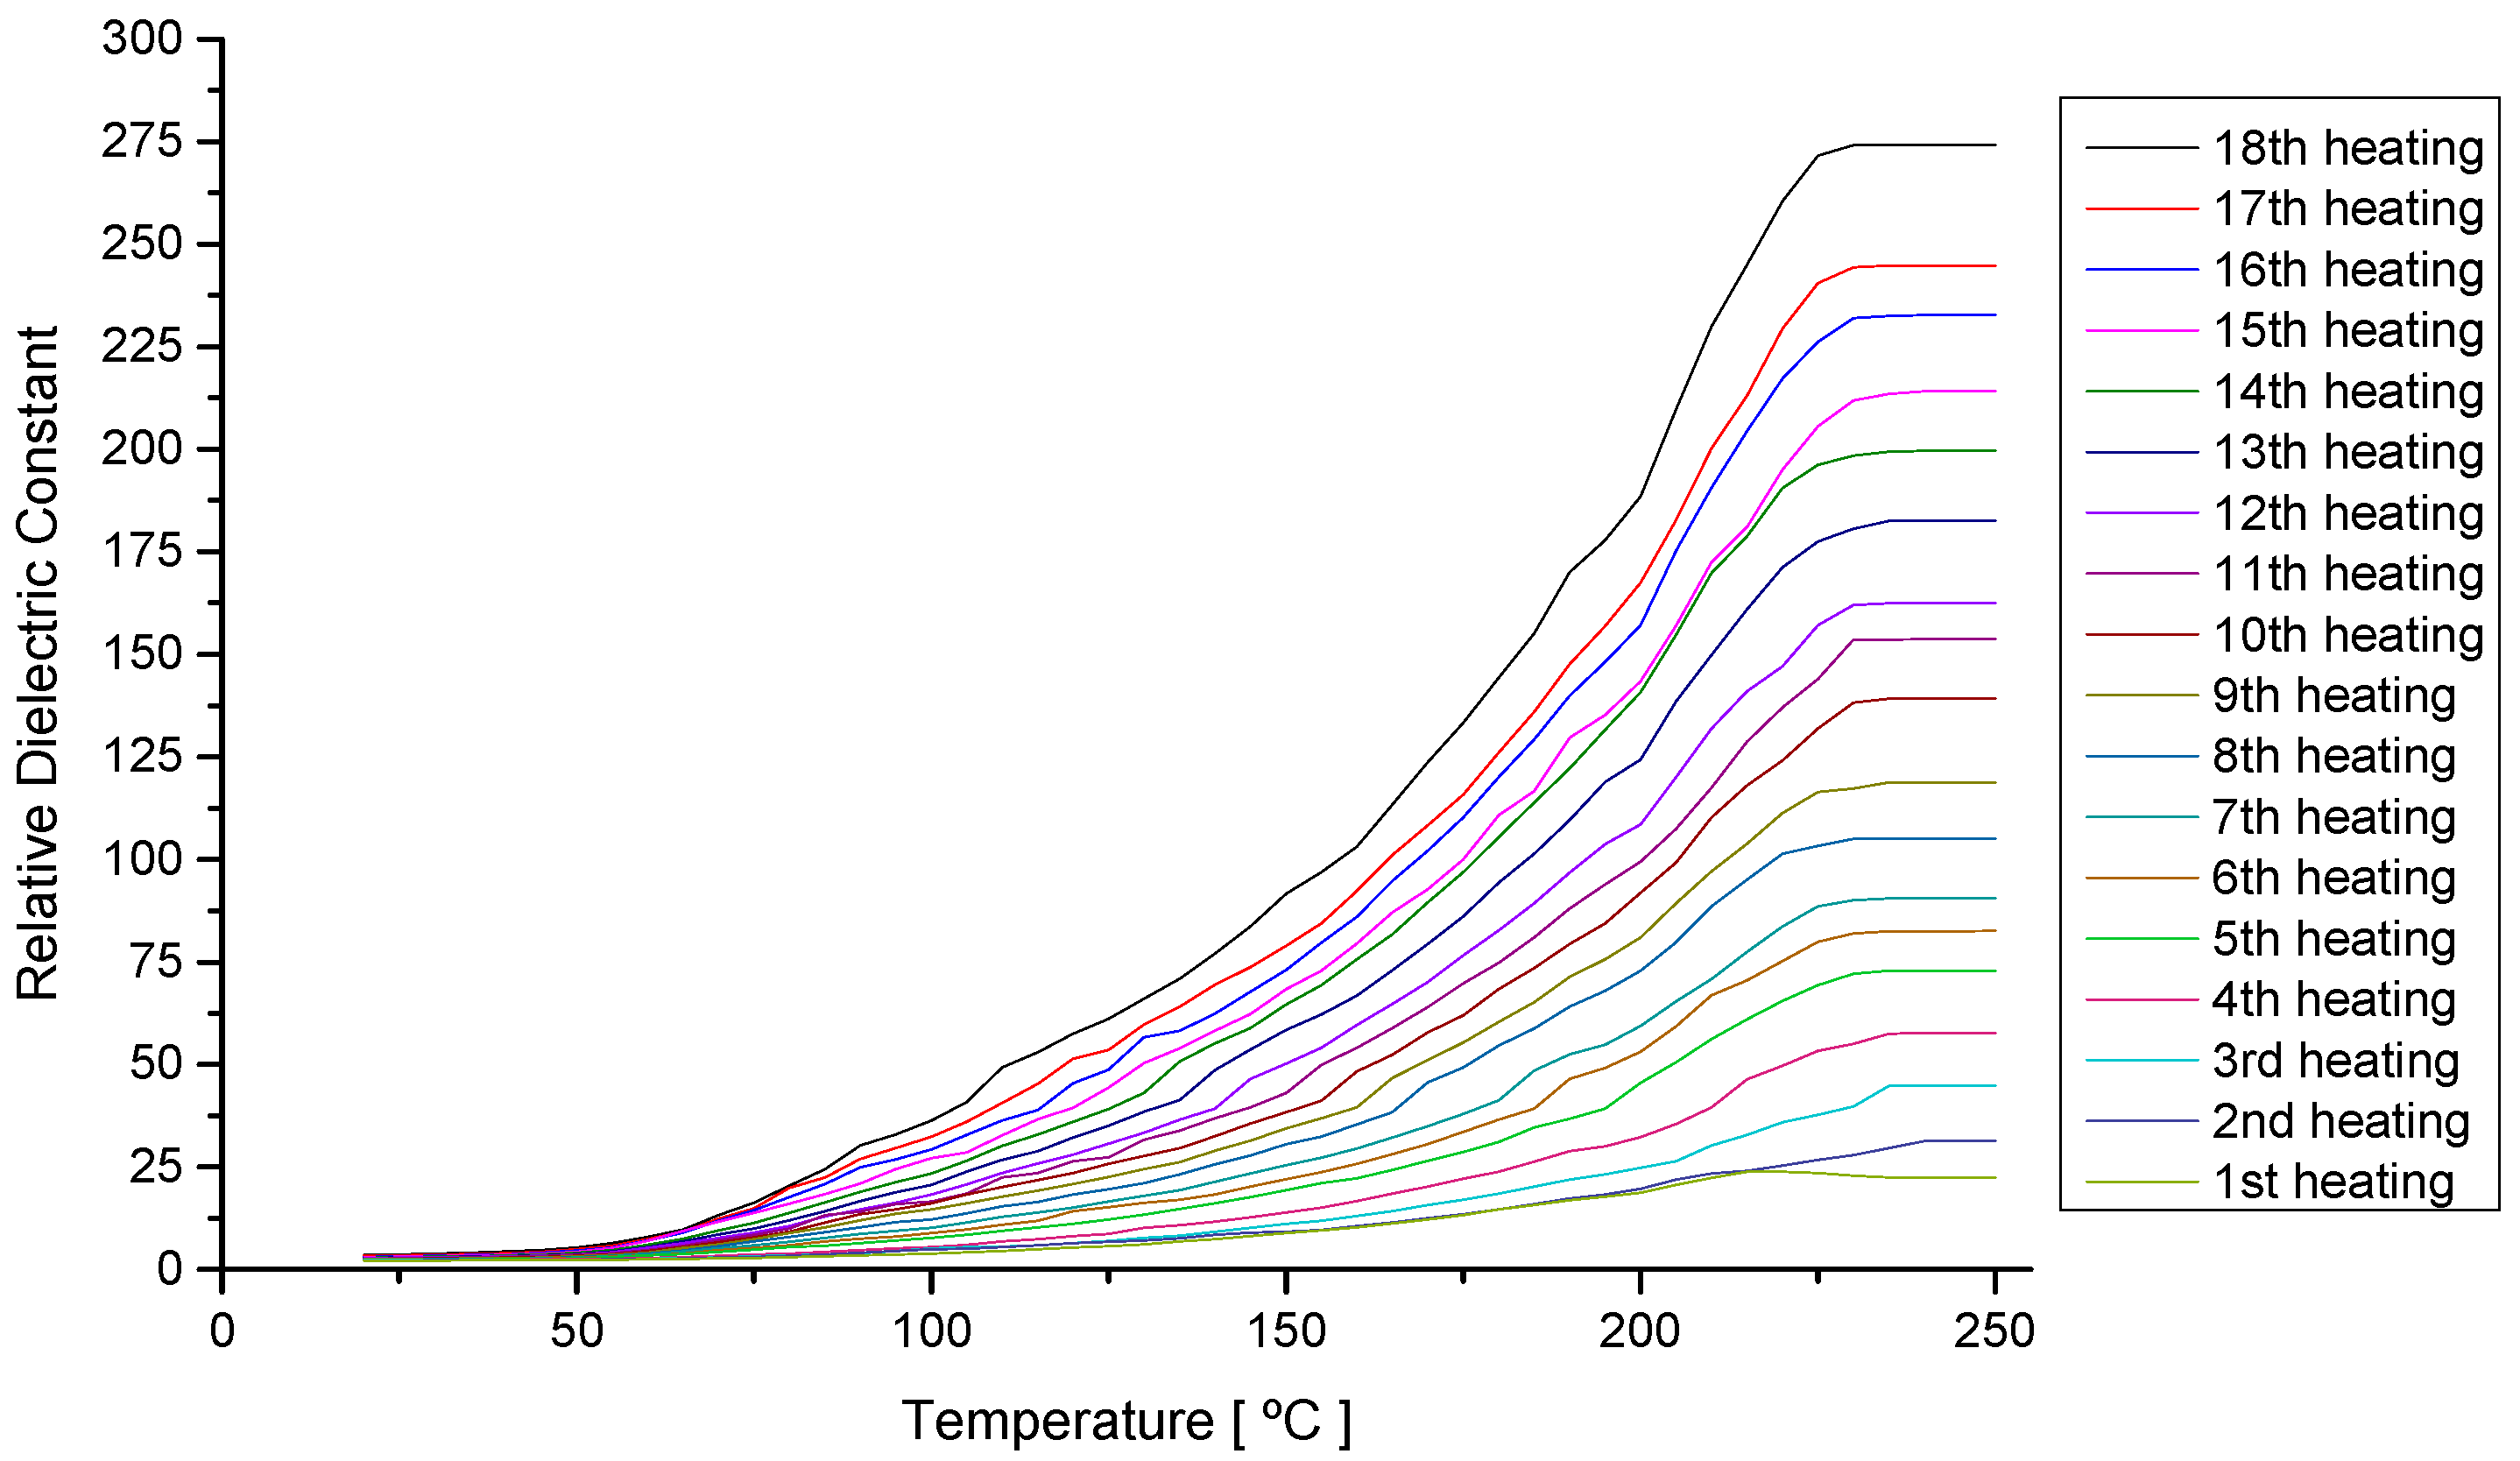
4.1. Analysis of the Oil Behavior during Continuous Heating

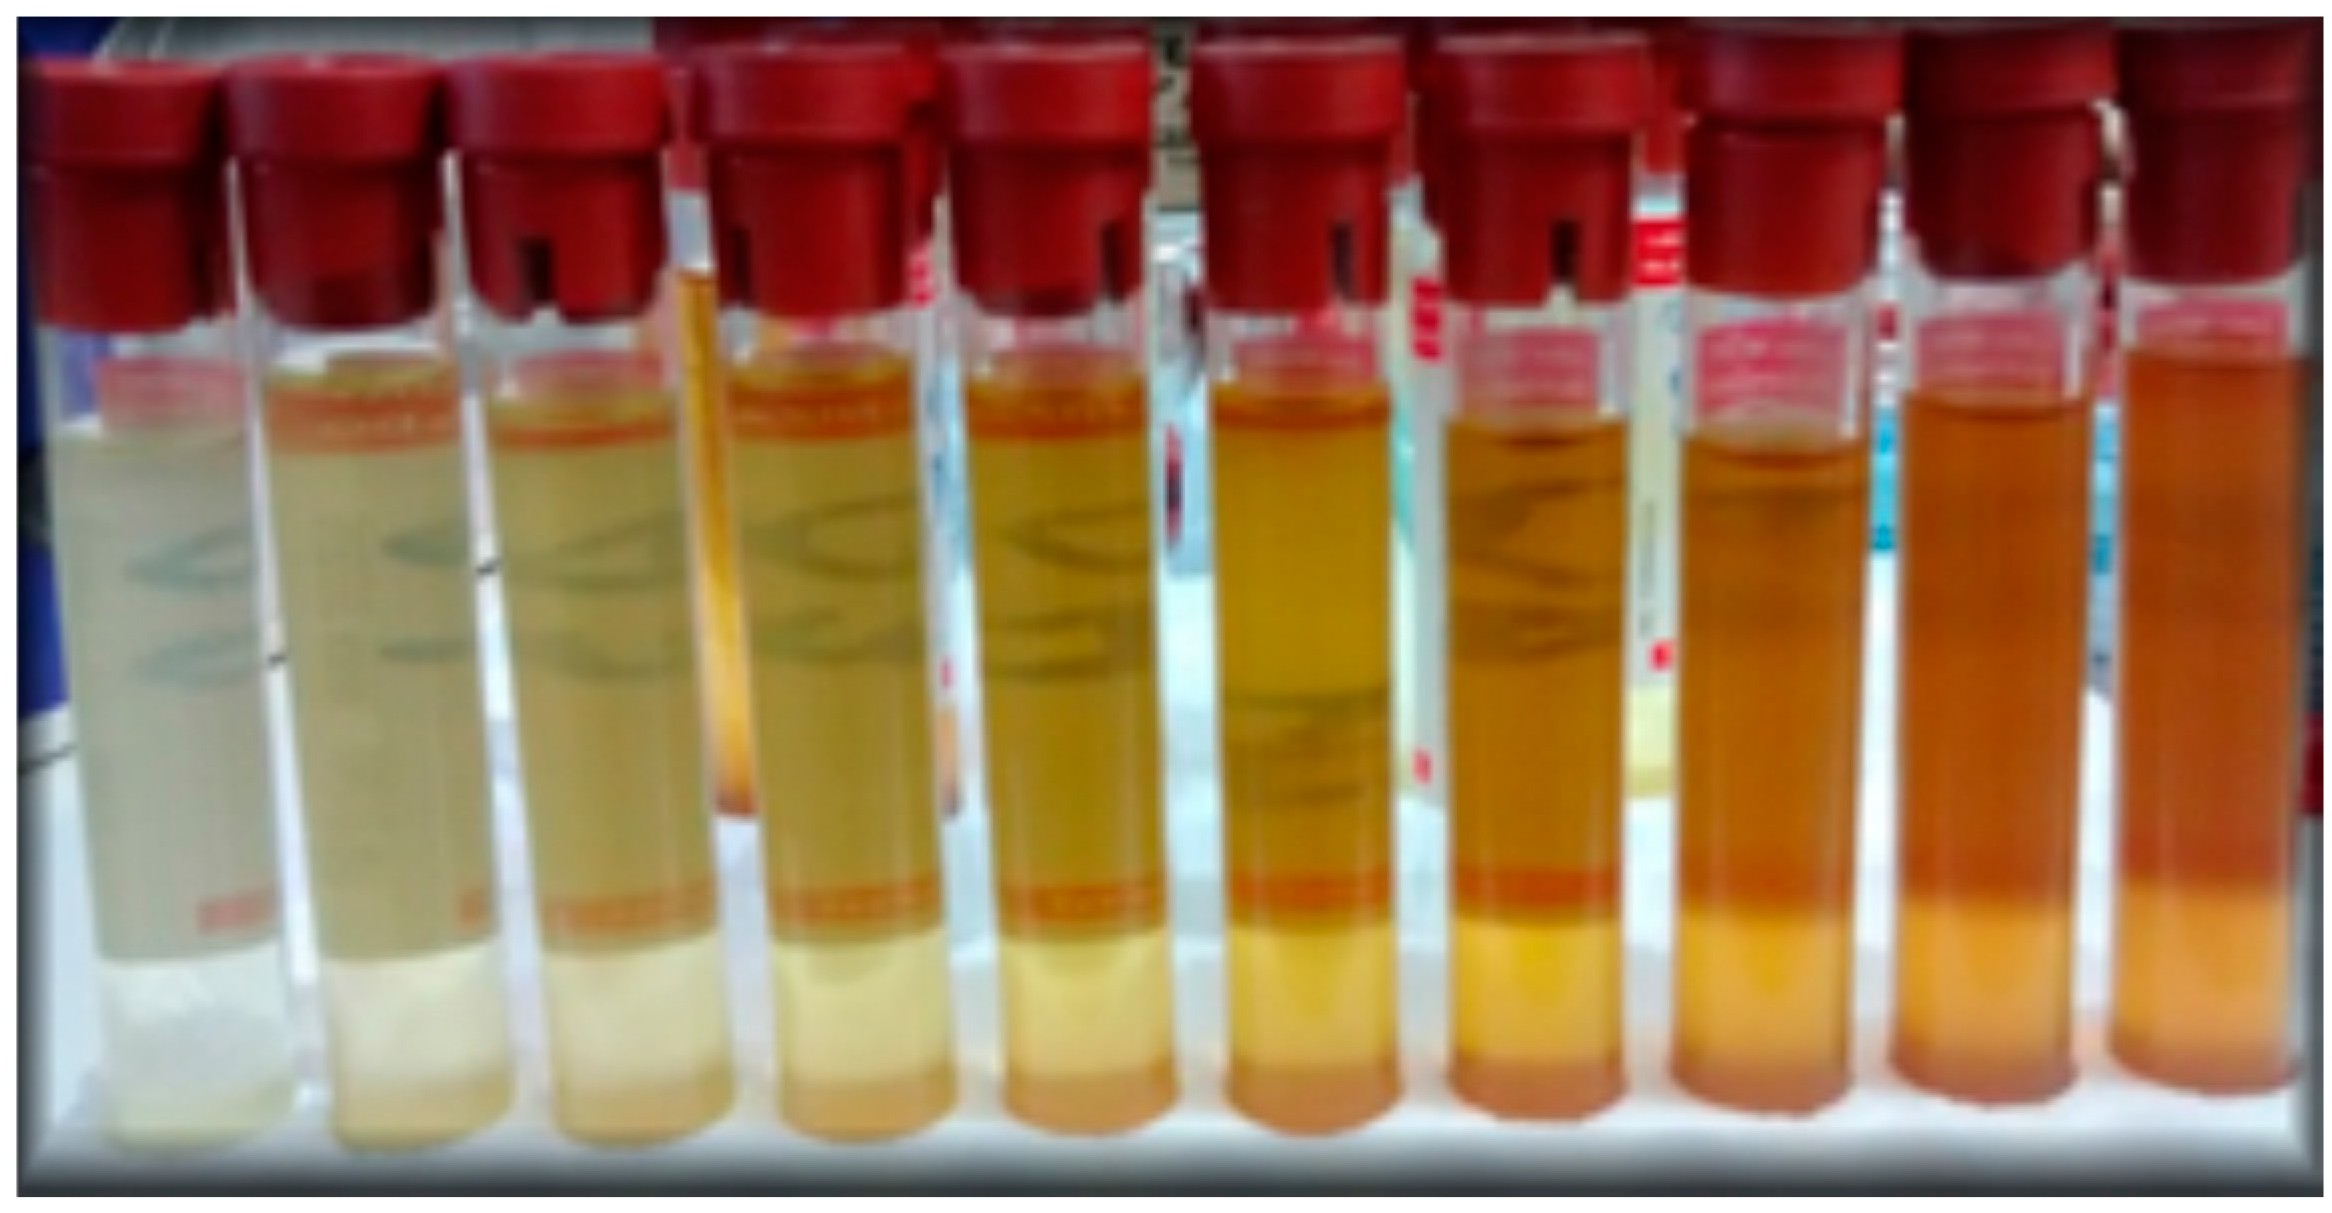
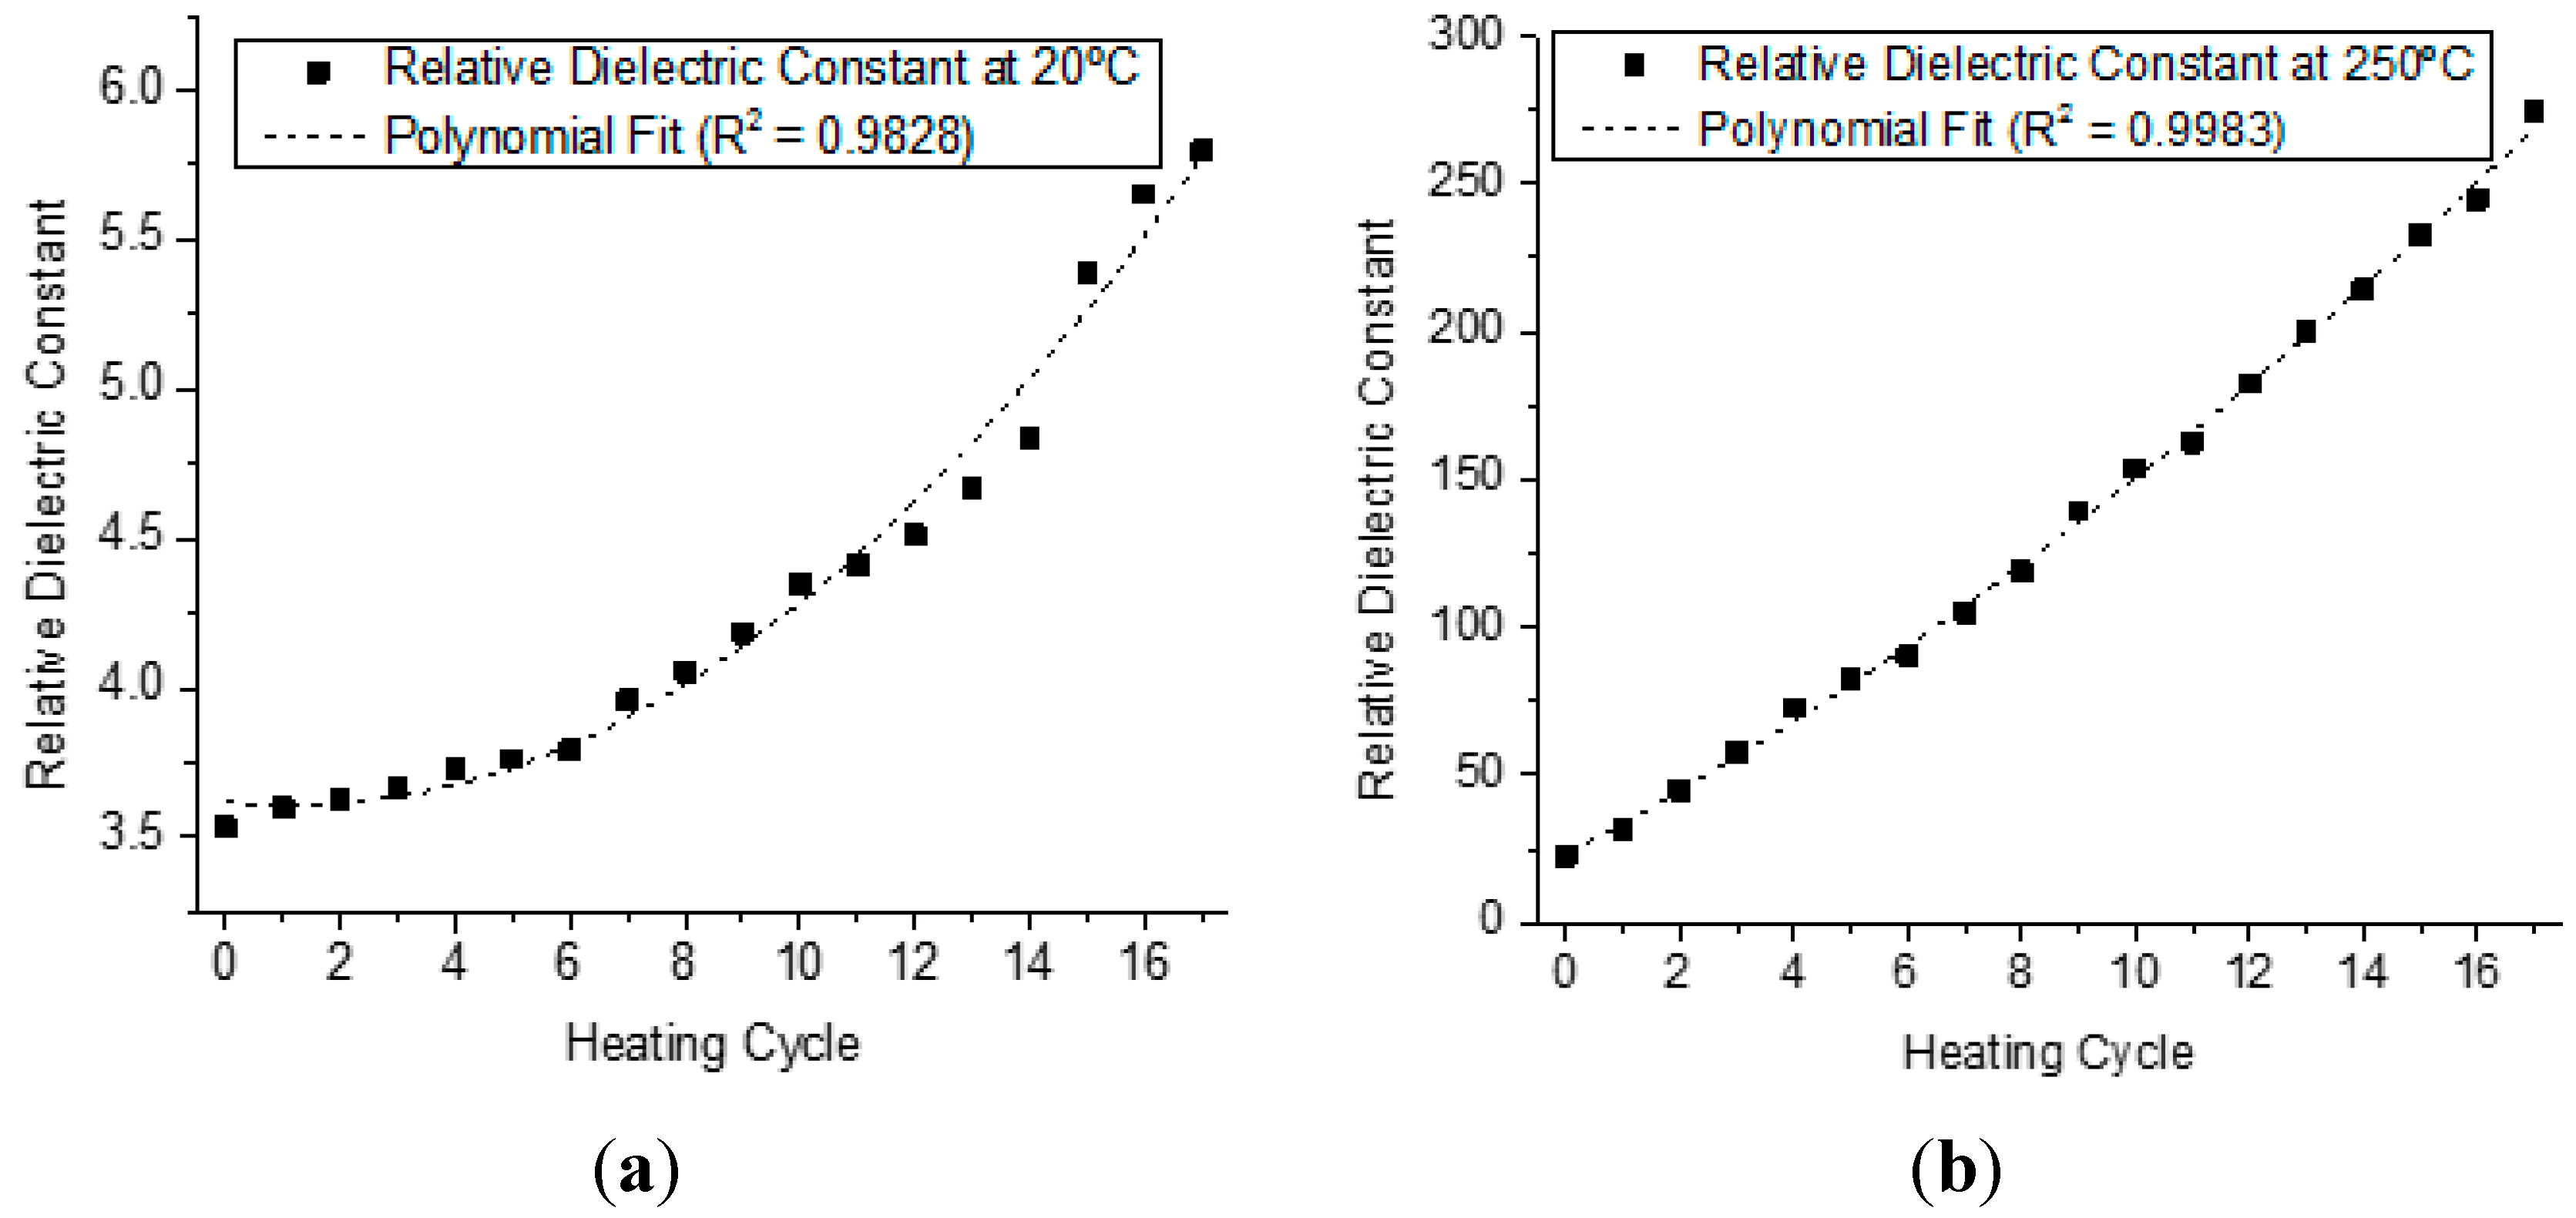
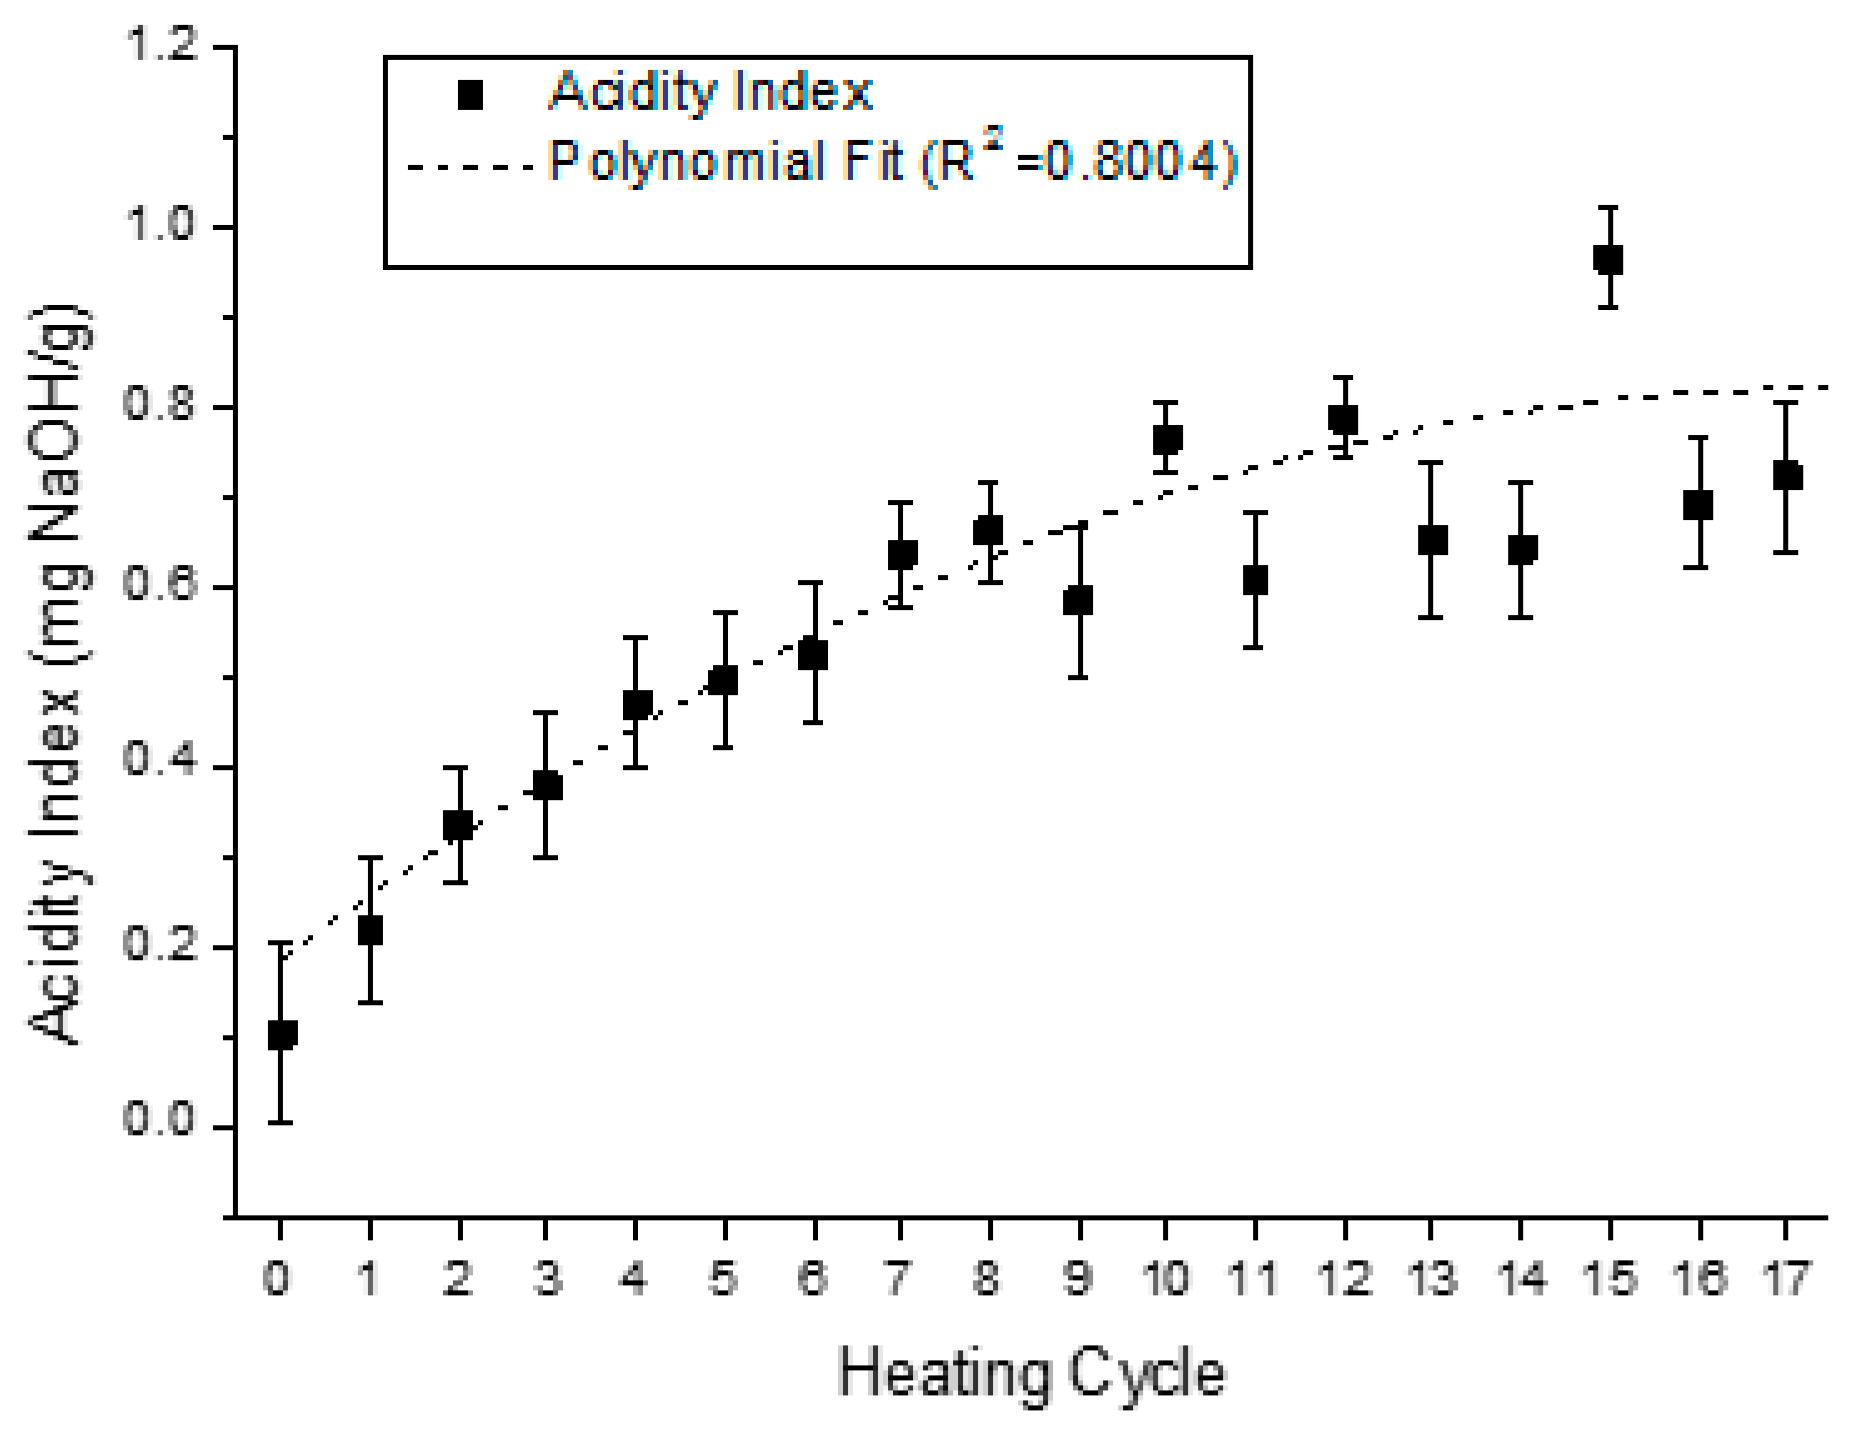
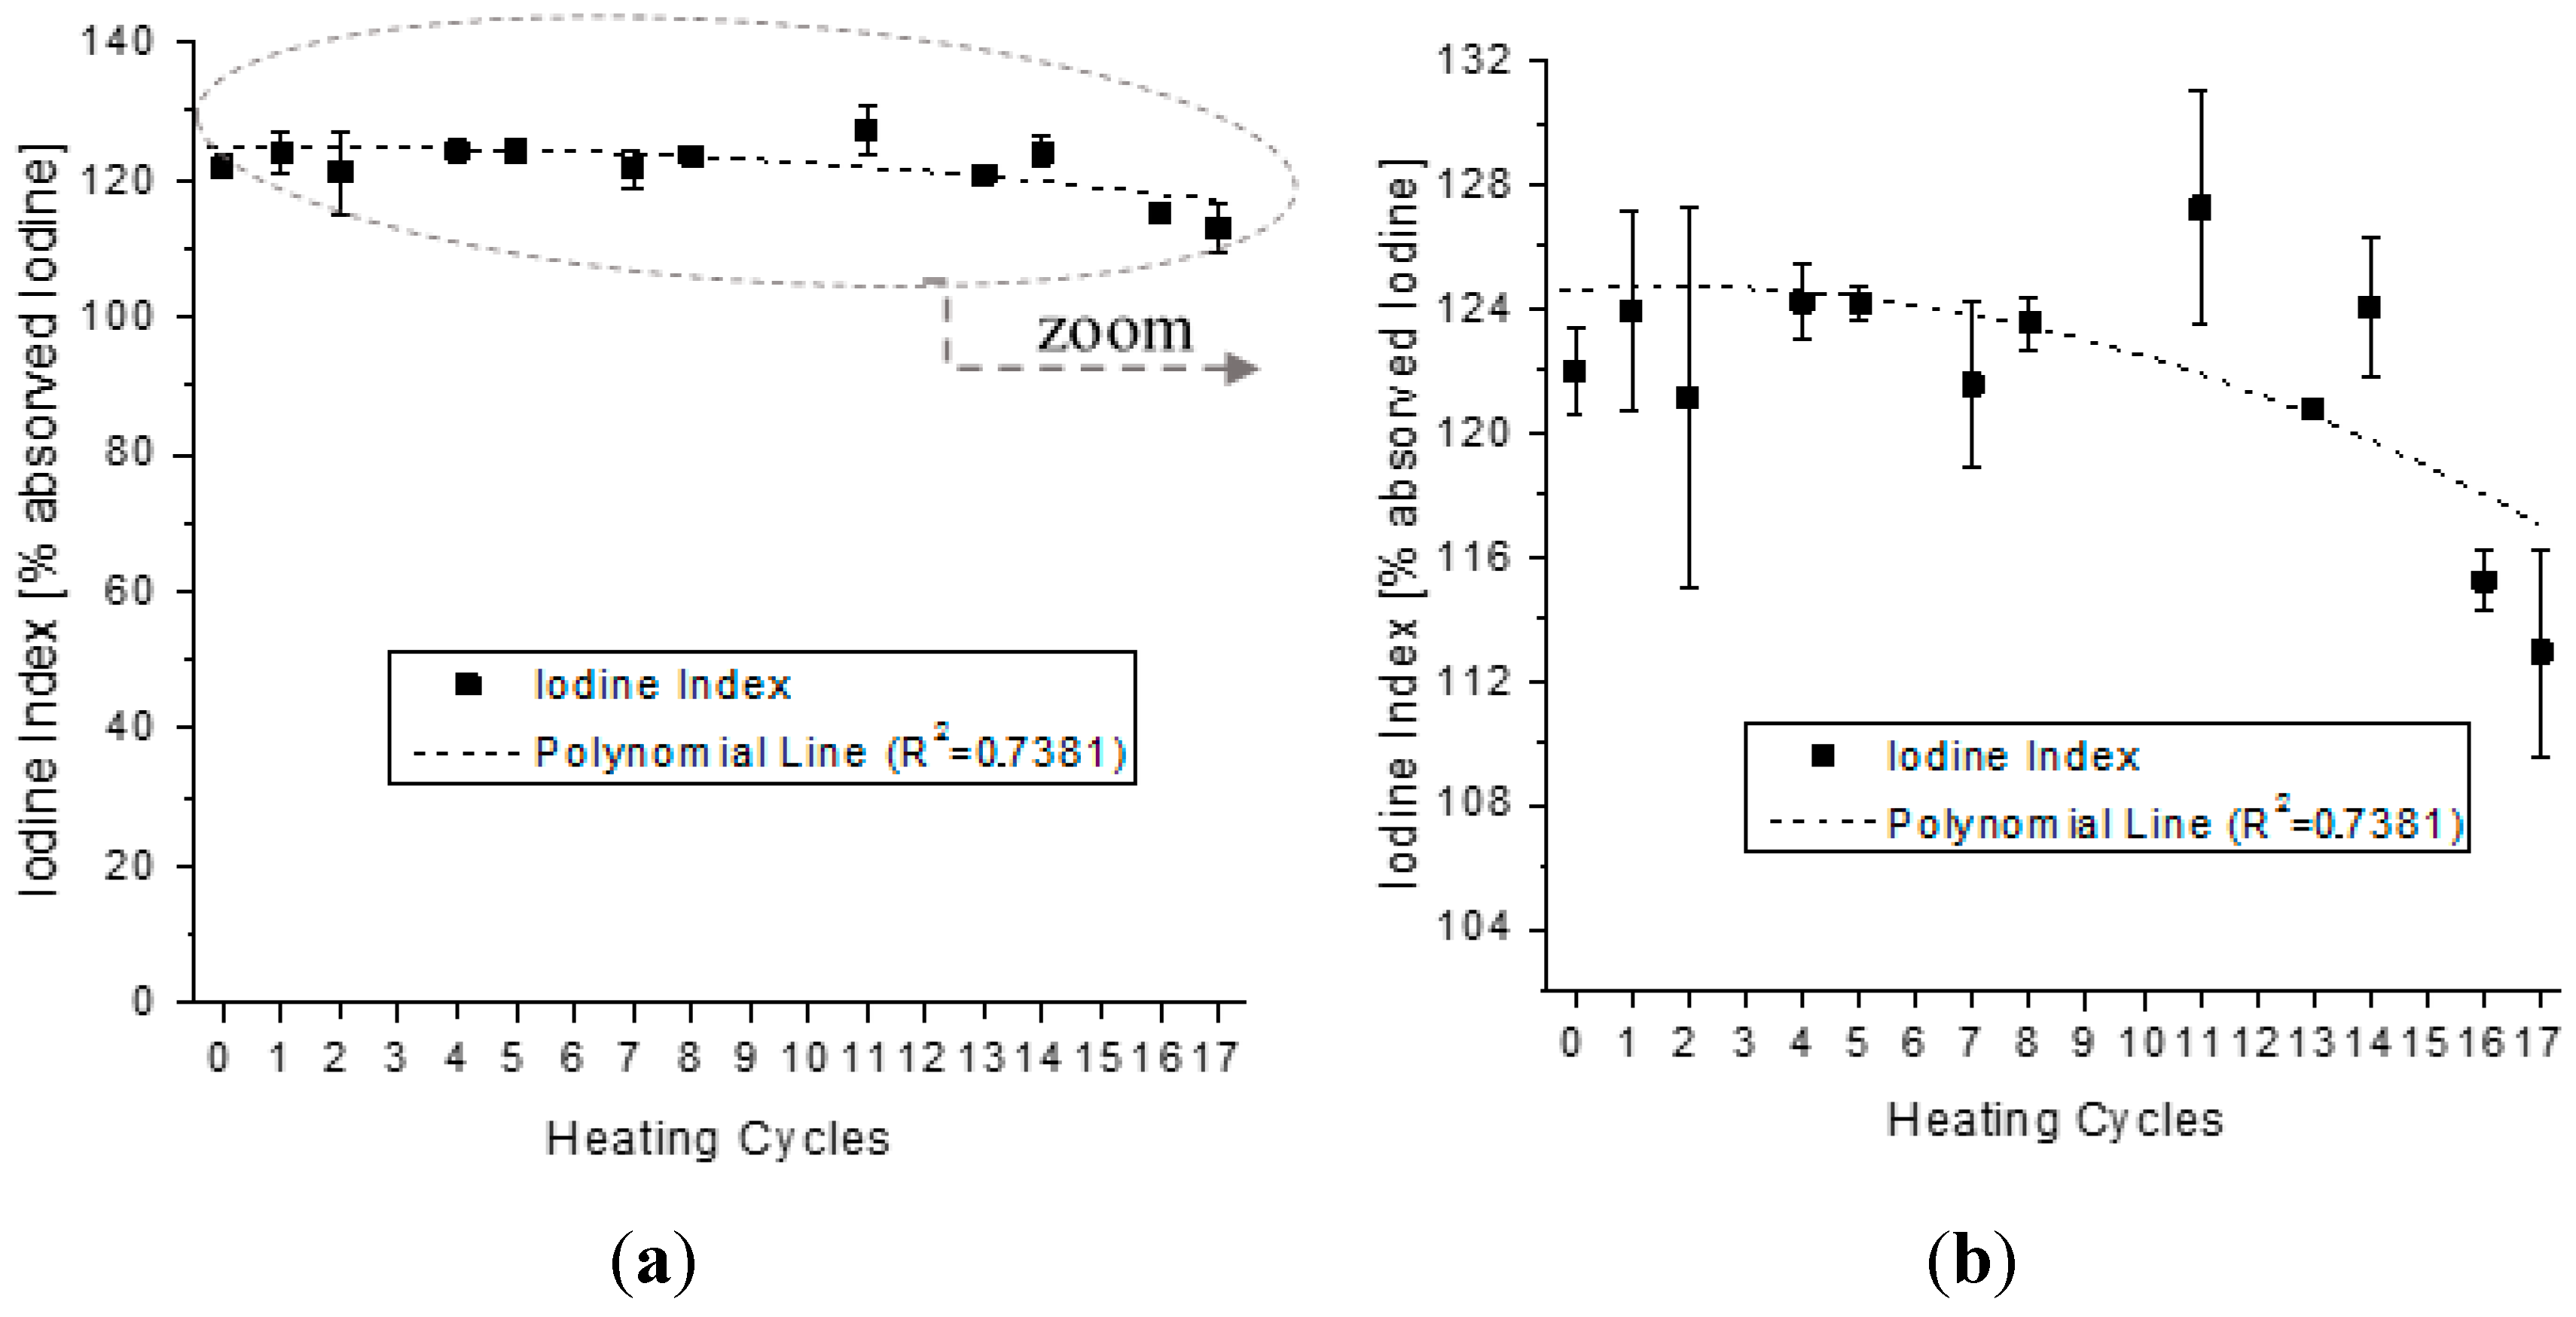
4.2. Analysis of the Behavior of the Virgin Oil through Thermal Stress in Cycles


| Parameter | Parameter in Function of T | |||||||
|---|---|---|---|---|---|---|---|---|
| Acidity Index | Acidity(T) | = | − | 0.0016·T2 | + | 0.0702·T | + | 0.1039 |
| Refraction Index | Refr(T) | = | 9.0·10−6·T2 | + | 1.0·10−5·T | + | 1.4662 | |
| Iodine Index | Iodine(T) | = | − | 0.0263·T2 | − | 0.1462·T | + | 124.1301 |
| Viscosity | Visco(T) | = | 0.1131·T2 | + | 1.4664·T | + | 35.067 | |
| Relative Dielectric Constant | Er(T) | = | 0.0079·T2 | − | 0.0224·T | + | 3.5848 | |
| Physico-Chemical Parameter | Coefficient of Determination (R2) | Pearson Correlation Coefficient (PCC) |
|---|---|---|
| Dielectric Constant | 0.9763 | 0.9466 |
| Acidity Index | 0.8004 | 0.8646 |
| Refraction Index | 0.9689 | 0.9853 |
| Iodine Index | 0.7381 | 0.8616 |
| Viscosity | 0.9858 | 0.9772 |

| Parameters Correlated | Pearson Correlation Coefficient | ||
|---|---|---|---|
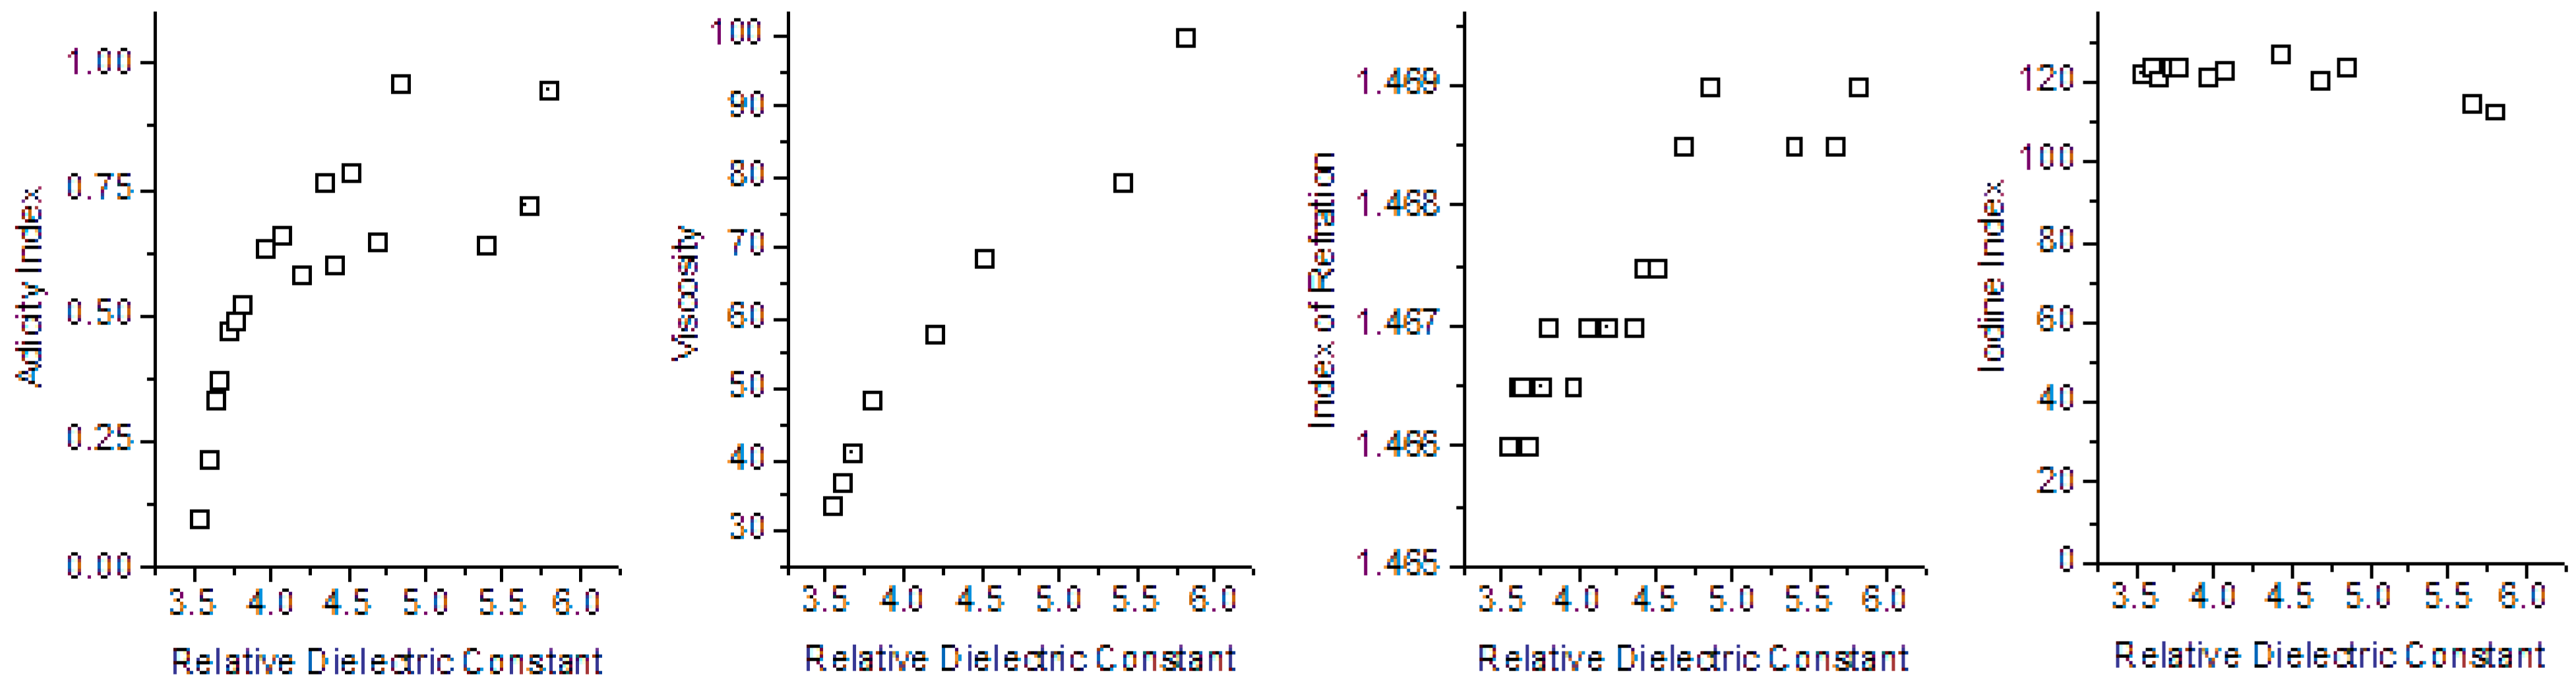
| Relative Dielectric Constant | versus | Acidity Index | 0.7255 |
| Relative Dielectric Constant | versus | Refraction Index | 0.9185 |
| Relative Dielectric Constant | versus | Iodine Index | −0.9080 |
| Relative Dielectric Constant | versus | Viscosity | 0.9880 |
5. Conclusions
Author Contributions
Conflicts of Interest
References
- Unii, S.K.; Yaakob, Z.; Pudukudy, M.; Narayanan, B.N. Single step production of biodiesel from used cooking oil. In Proceedings of the IEEE Renewable and Sustainable Energy Conference (IRSEC), Ouarzazate, Marrocos, 7–9 March 2013; pp. 461–464.
- Li, J.; Zhang, Z.; Zou, P.; Grzybowski, S. Preparation of a vegetable oil-based nanofluid and investigation of its breakdown and dielectric properties. IEEE Electr. Insul. Mag. 2012, 28, 43–50. [Google Scholar] [CrossRef]
- Spohner, M.; Klampar, M.; Liedermann, K. Electrical Properties of Natural Oils and Methyl Esters of Their Constitutive Fatty Acids. In Proceedings of the IEEE Electrical Insulation Conference, Ottawa, ON, Canada, 2–5 June 2013.
- Oommen, T.V. Vegetable oils for liquid-filled transformers. IEEE Electr. Insul. Mag. 2002, 18, 6–11. [Google Scholar] [CrossRef]
- Yang, L.; Liao, R.; Sun, C.; Zhu, M. Influence of vegetable oil on the thermal aging of transformer paper and its mechanism. IEEE Trans. Dielectr. Electr. Insul. 2011, 18, 692–700. [Google Scholar] [CrossRef]
- Ciuriuc, A.; Dumitran, L.M.; Notongher, P.V. Thermal ageing effects on the dieletric properties and moisture content of vegetable and mineral oil used in power transformer. In Proceedings of the IEEE 8th International Symposium on Advanced Topics in Electrical Engineering, Bucharest, Romania, 23–25 March 2013; pp. 1–6.
- Grossi, M.; di Lecci, G.; Toschi, T.G.; Ricco, B. Fast and accurate determination of olive oil acidity by electrochemical impedance spectroscopy. IEEE Sens. J. 2014, 14, 2947–2954. [Google Scholar] [CrossRef]
- Pereira, A.F.C.; Pontes, M.J.C.; Gambarra Neto, F.F.; Santos, S.R.B.; Galvão, R.K.H.; Araújo, M.C.U. NIR spectrometric determination of quality parameters in vegetable oils using PLS and variable selection. Food Res. Int. 2008, 41, 341–348. [Google Scholar] [CrossRef]
- Gila, D.M.; Marchal, P.C.; Garcia, J.G.; Ortega, J.G. Hyperspectral imaging for determination of some quality parameters for olive oil. In Proceedings of the IEEE 18th International Conference on Automation and Computing (ICAC), Loughborough, UK, 7–8 September 2012; pp. 1–6.
- Spohner, M.; Frk, M.; Liedermann, K. Study of electrical and rheological properties of natural and other oils. In Proceedings of the 19th IEEE International Symposium on Electrical Insulation, San Juan, Puerto Rico, 10–13 June 2012; pp. 30–33.
- Santos, C.S.P.; Cruz, R.; Cunha, S.C.; Casal, S. Effect of cooking on olive oil quality attributes. Food Res. Int. 2013, 54, 2016–2024. [Google Scholar] [CrossRef]
- Uriarte, P.S.; Guillén, M.D. Formation of toxic alkylbenzenes in edible oils submitted to frying temperature. Influence of oil composition in main components and heating time. Food Res. Int. 2010, 43, 2161–2170. [Google Scholar] [CrossRef]
- Bognár, A. Comparative study of frying to other cooking techniques in fluence on the nutritive value. Grasas Aceites 1998, 49, 250–260. [Google Scholar] [CrossRef]
- Caponio, F.; Pasqualone, A.; Gomes, T. Effects of conventional and microwave heating on the degradation of olive oil. Eur. Food Res. Technol. 2002, 215, 114–117. [Google Scholar] [CrossRef]
- Chatzilazarou, A.; Gortzi, O.; Lalas, S.; Zoidis, E.; Tsaknis, J. Physicochemical changes of olive oil and selected vegetable oils during frying. J. Food Lipids 2006, 13, 27–35. [Google Scholar] [CrossRef]
- Salta, F.N.; Kalogeropoulos, N.; Karavanou, N.; Andrikopoulos, N.K. Distribution and retention of phytosterols in frying oils and fried potatoes during repeated deep and pan frying. Eur. Food Res. Technol. 2008, 400, 227–391. [Google Scholar] [CrossRef]
- Bansal, G.; Zhou, W.; Barlow, P.J.; Joshi, P.; Neo, F.L.; Lo, H.L. Evaluation of commercially available rapid test kits for the determination of oil quality in deep-frying operations. Food Chem. 2010, 121, 621–626. [Google Scholar] [CrossRef]
- Khaled, A.Y.; Aziz, S.A.; Rokhani, F.Z. Development and evaluation of an impedance spectroscopy sensor to assess cooking oil quality. Int. J. Environ. Sci. Dev. 2014, 5, 299–302. [Google Scholar] [CrossRef]
- Khaled, A.Y.; Abd, A.S.; Rokhani, F.Z. Impedance sensor probe for degradation assessment of cooking oil. In Proceedings of the International Conference of Agricultural Engineering, Zurich, Switzerland, 6–10 July 2014.
- Sebastian, A.; Ghazani, S.M.; Marangoni, A.G. Quality and safety of frying oils used in restaurants. Food Res. Int. 2014, 64, 420–423. [Google Scholar] [CrossRef]
- Khaled, F.Y.; Aziz, S.A.; Rokhani, F.Z. Capacitive sensor probe to assess frying oil degradation. Inf. Process. Agric. 2015, 2, 142–148. [Google Scholar] [CrossRef]
- Christy, A.A.; Kasemsumran, S.; Du, Y.; Ozaki, Y. The detection and quantification of adulteration in olive oil by near-infrared spectroscopy and chemometrics. Anal. Sci. 2004, 20, 935–940. [Google Scholar] [CrossRef] [PubMed]
- Paiter, L.; Galvão, J.R.; Stevan, S.L., Jr. Empirical study of the degradation of soybean oil correlated with its dielectric constant based on capacitive sensor. Matéria 2015, 20, 392–398. [Google Scholar]
- Dhar, A.; Kevin, R.; Agarwal, A.K. Production of biodiesel from high-FFA neem oil and its performance, emission and combustion characterization in a single cylinder DICI engine. Fuel Process. Technol. 2012, 97, 118–129. [Google Scholar] [CrossRef]
- Band, V.; Pop, S.; Pitica, D.; Ciascai, I. Electrical model of a capacitive based level sensor. In Proceedings of the 36th International Spring Seminar on Electronics Technology (ISSE), Alba lulia, Roménia, 8–12 May 2013; pp. 333–338.
- Leus, V.; Elata, D. Fringing Field Effect in Electrostatic Actuators; Technical Report No. ETR-2004-2; Technion-Israel Institute of Technology: Haifa, Israel, 2004. [Google Scholar]
- Hosseini, M.; Zhu, G.; Peter, Y.-A. A new formulation of fringing capacitance and its application to the control of parallel-plate electrostatic micro actuators. Analog Integr. Circuits Signal Process. 2007, 53, 119–128. [Google Scholar] [CrossRef]
- Wintle, H.J. Capacitance corrections for the guard, edge and corner situations. In Proceedings of the Conference Record of the 1990 IEEE International Symposium on Electrical Insulation, Toronto, ON, Canada, 3–6 June 1990; pp. 435–438.
- Tereshchenko, O.V.; Buesink, F.J.K.; Leferink, F.B.J. An overview of the techniques for measuring the dielectric properties of materials. In Proceedings of the General Assembly and Scientific Symposium, Istambul, Turquia, 13–20 August 2011; pp. 1–4.
- Chung, Y.C.; Amarnath, N.N.; Furse, C.M. Capacitance and inductance sensor circuits for detecting the lengths of open and short circuited wires. IEEE Trans. Instrum. Meas. 2009, 58, 2495–2502. [Google Scholar] [CrossRef]
- Fluckiger, R.; Lovblom, R.; Ostinelli, O.; Benedickter, H. InP/GaAsSb DHBTs fabricated in a low-temperature teflon planarization process. IEEE Electron Device Lett. 2012, 33, 1135–1137. [Google Scholar] [CrossRef]
- Maheran, A.H.A.; Abdullah, H.; Said, M.; Fauzan, M.N.Z.A. Structural and morphology of zinc sulphide thin films on various temperature. In Proceedings of the IEEE Regional Symposium on Micro and Nanoelectronics (RSM), Kota Kinabalu, Malaysia, 28–30 September 2011; pp. 28–31.
- Otto, A.; Podtburg, E.; Manson, R.; Antaya, P. Advances in the brass and stainless steel reinforcement of high temperature superconducting wires. IEEE Trans. Appl. Supercond. 2007, 17, 3071–3074. [Google Scholar] [CrossRef]
- Camenzind, H.R. Redesigning the old 555 [timer circuit]. IEEE Spectr. 2002, 34, 80–85. [Google Scholar] [CrossRef]
- Kollie, T.G.; Horton, J.L.; Carr, K.R.; Herskovitz, M.B. Temperature measurement errors with type K (Chromel vs. Alumel) thermocouples due to short-ranged ordering in Chromel. Rev. Sci. Instrum. 1975, 46, 1447–1461. [Google Scholar] [CrossRef]
- Standard, ASTM. Standard Test Method for Kinematic Viscosity of Transparent and Opaque Liquids (and the Calculation of Dynamic Viscosity); ASTM D-4451990; American Society for Testing and Materials: West Conshohocken, PA, USA, 2006. [Google Scholar]
- ILYAS, M. Effects of temperature on dieletric properties of rhicinius oils as insulating liquid. In Proceedings of the International Conference on Condition Monitoring and Diagnosis, Beijing, China, 21–24 April 2008; pp. 286–289.
- Viswanath, D.S.; Ghosh, T.K.; Prasad, D.L.; Dutt, N.V.K.; Rani, K.Y. Viscosity of Liquids: Theory, Estimation, Experiment, and Data; Springer Science & Business Media: Berlin, Germany, 2007. [Google Scholar]
- Toudja, T.; Chetibi, F.; Beldjilali, A.; Moulai, H. Electrical and physicochemical properties of mineral and vegetable oils mixtures. In Proceedings of the IEEE 18th International Conference on Dielectric Liquids (ICDL), Bled, Eslovenia, 29 June–3 July 2014; pp. 1–4.
- Eloka-Ekoba, A.C.; Inambao, F.L. Blending feedstock—Fresh approach in biodiesel development: Moringa and Jatropha seed oils. In Proceedings of the IEEE Twenty-Second Domestic Use of Energy, Cape Town, South Africa, 1–2 April 2014; pp. 1–8.
- Sheskin, D.J. Handbook of Parametric and Nonparametric Statistical Procedures; CRC Press: Boca Raton, FL, USA, 2003. [Google Scholar]
© 2015 by the authors; licensee MDPI, Basel, Switzerland. This article is an open access article distributed under the terms and conditions of the Creative Commons Attribution license (http://creativecommons.org/licenses/by/4.0/).
Share and Cite
Stevan, S.L., Jr.; Paiter, L.; Galvão, J.R.; Roque, D.V.; Chaves, E.S. Sensor and Methodology for Dielectric Analysis of Vegetal Oils Submitted to Thermal Stress. Sensors 2015, 15, 26457-26477. https://doi.org/10.3390/s151026457
Stevan SL Jr., Paiter L, Galvão JR, Roque DV, Chaves ES. Sensor and Methodology for Dielectric Analysis of Vegetal Oils Submitted to Thermal Stress. Sensors. 2015; 15(10):26457-26477. https://doi.org/10.3390/s151026457
Chicago/Turabian StyleStevan, Sergio Luiz, Jr., Leandro Paiter, José Ricardo Galvão, Daniely Vieira Roque, and Eduardo Sidinei Chaves. 2015. "Sensor and Methodology for Dielectric Analysis of Vegetal Oils Submitted to Thermal Stress" Sensors 15, no. 10: 26457-26477. https://doi.org/10.3390/s151026457