
Data Fusion for Driver Behaviour Analysis


 ,
,  ,
,  and
and 
Abstract
:1. Introduction
2. Previous Works
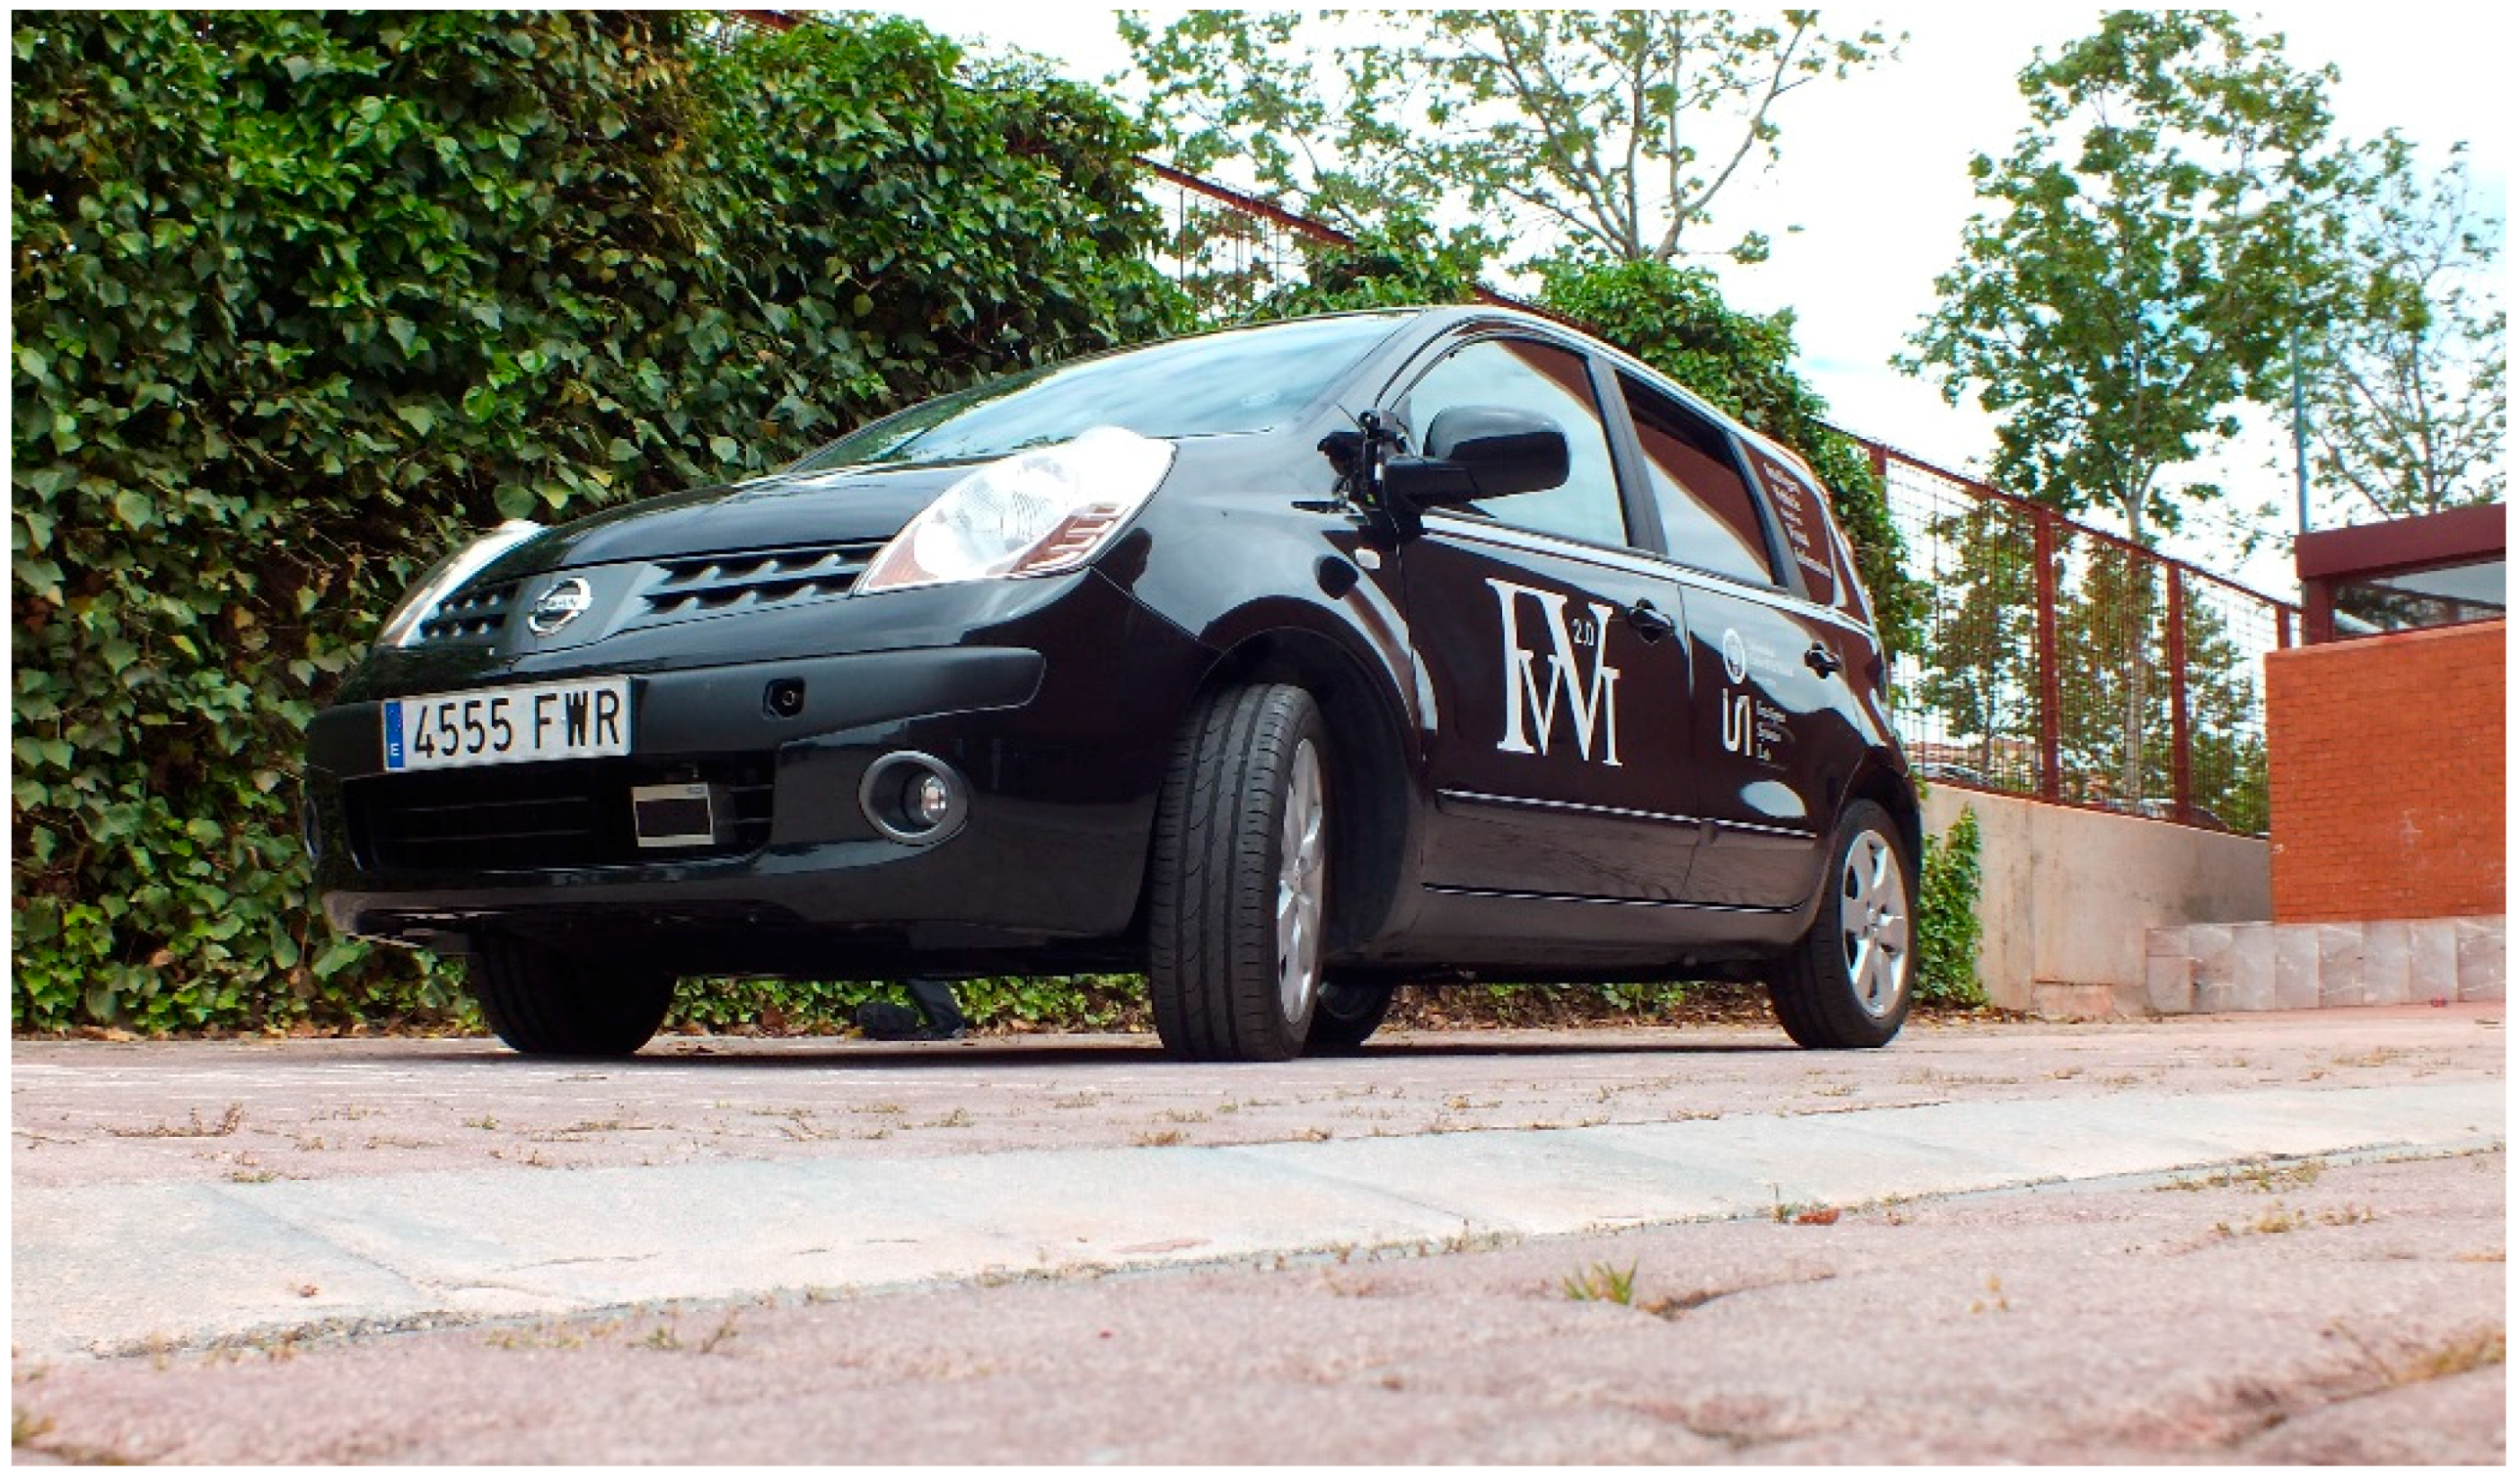
3. General Overview
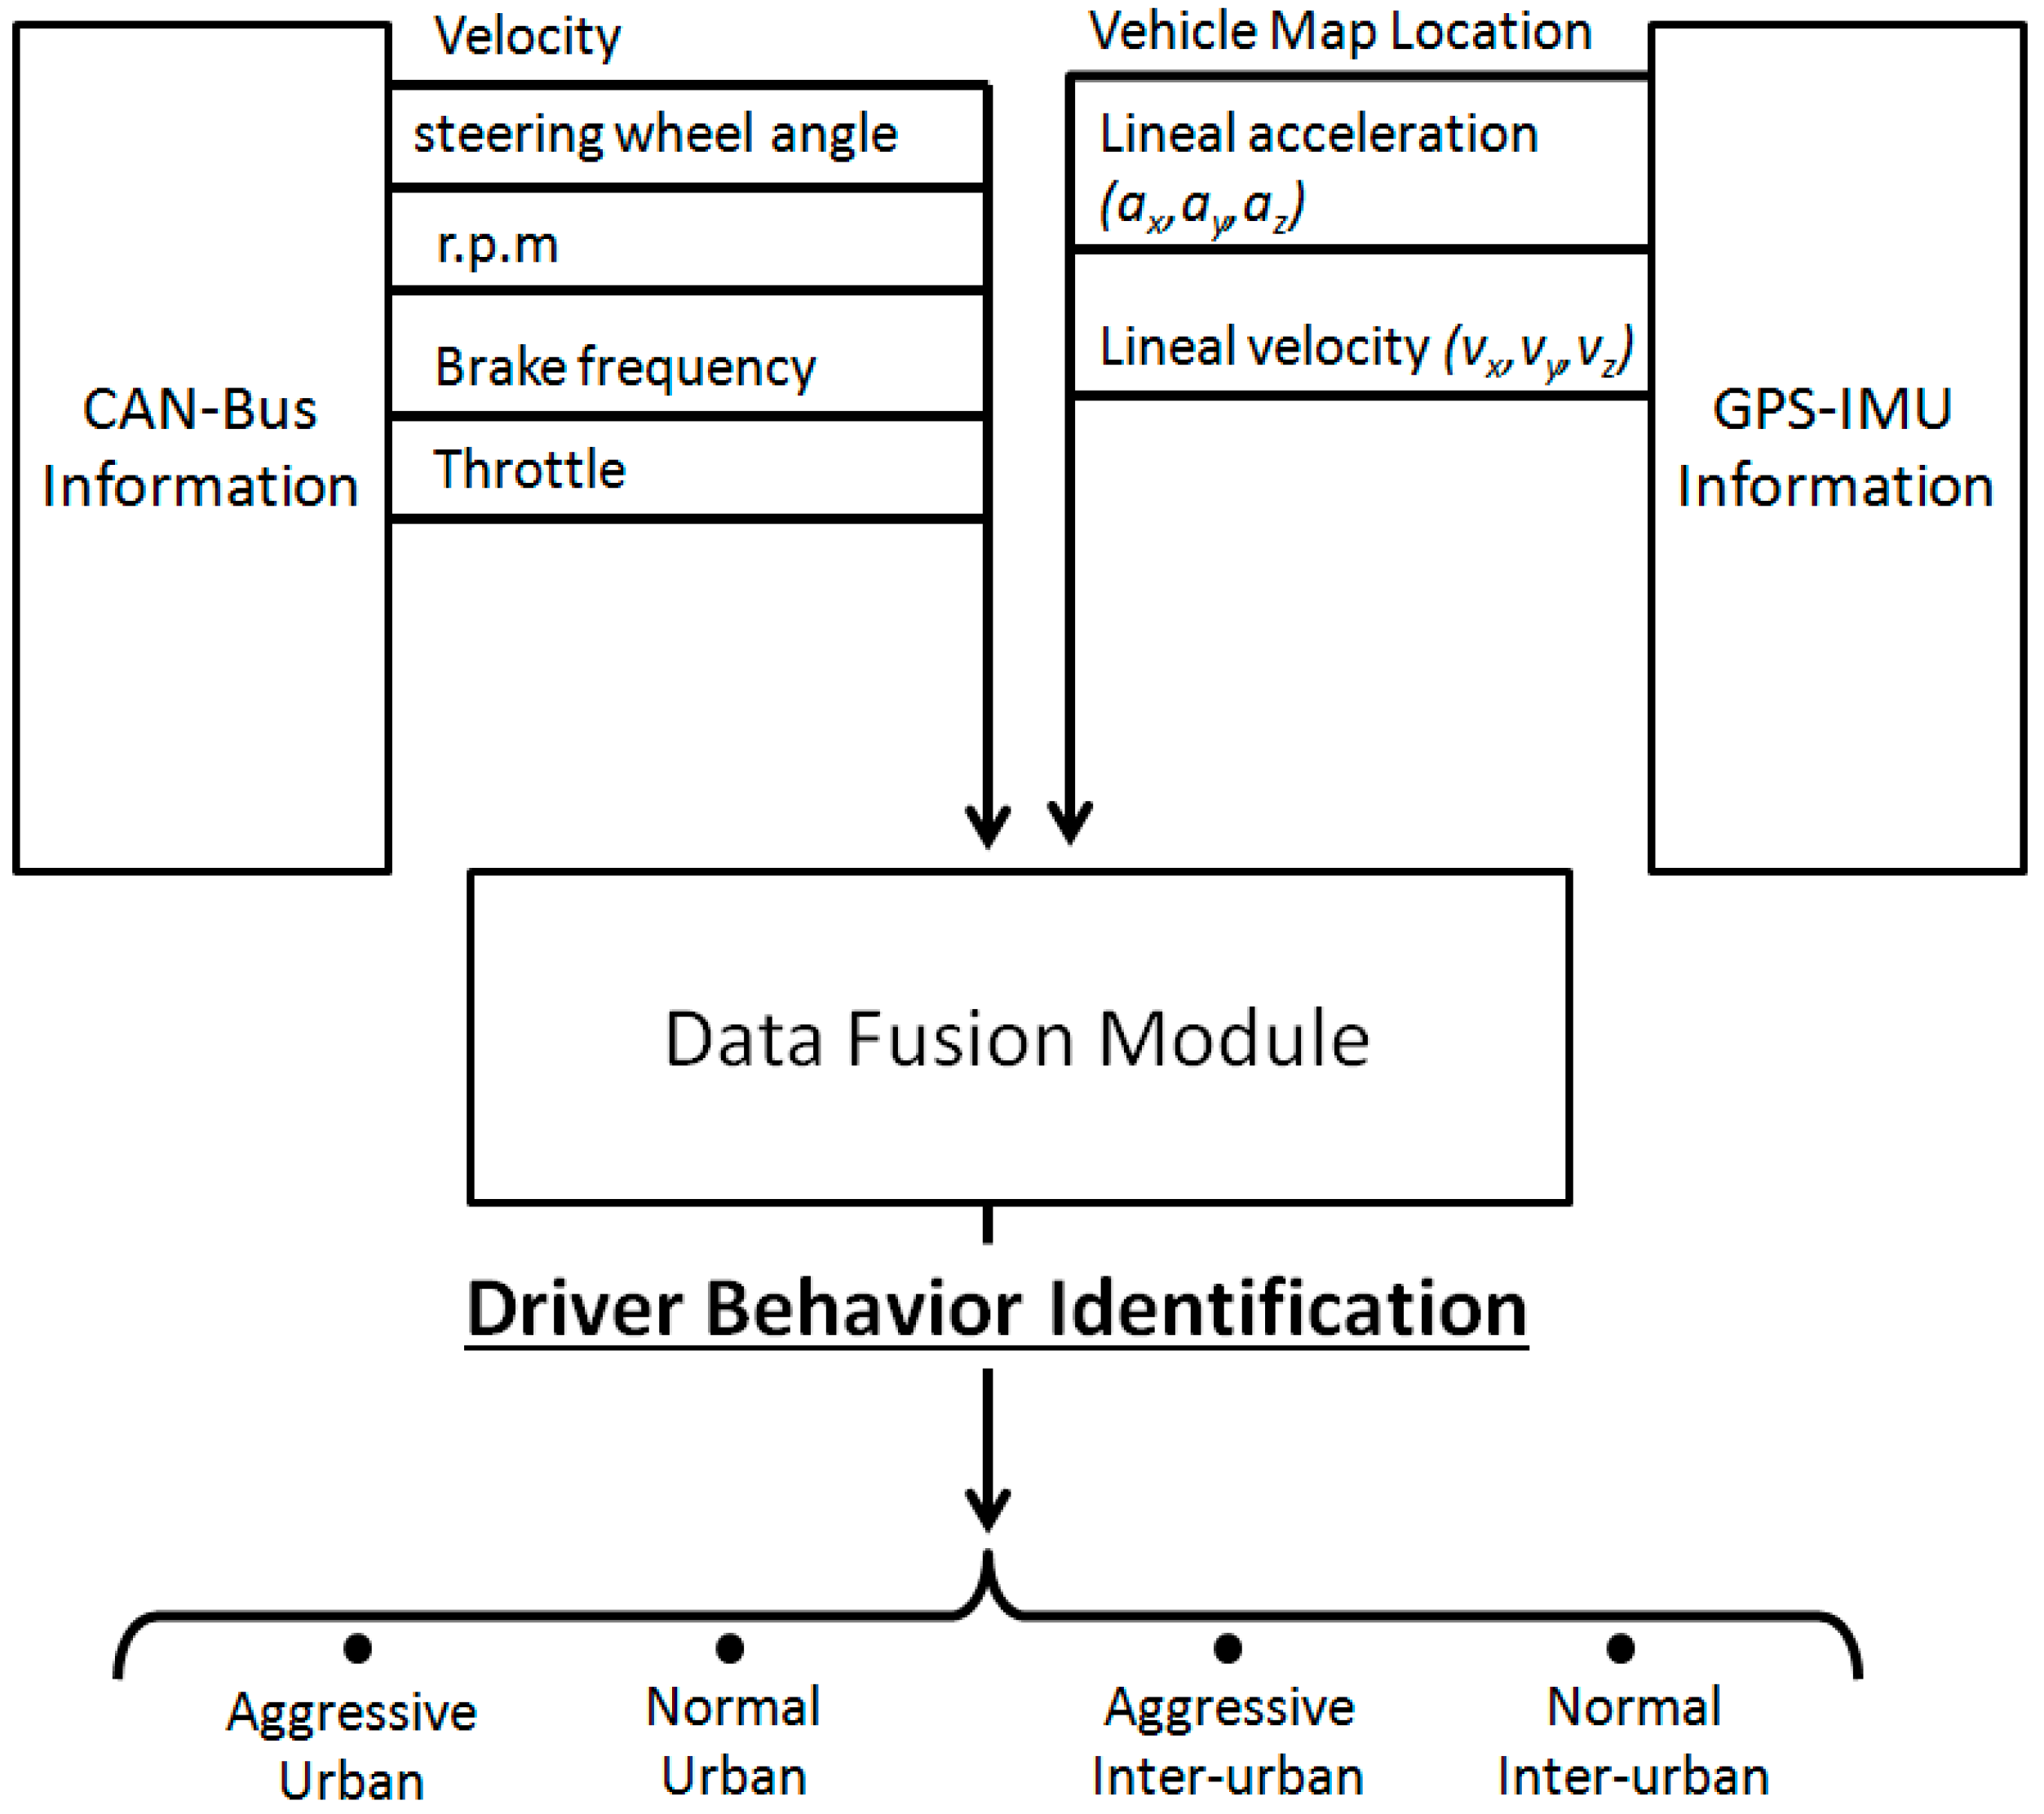
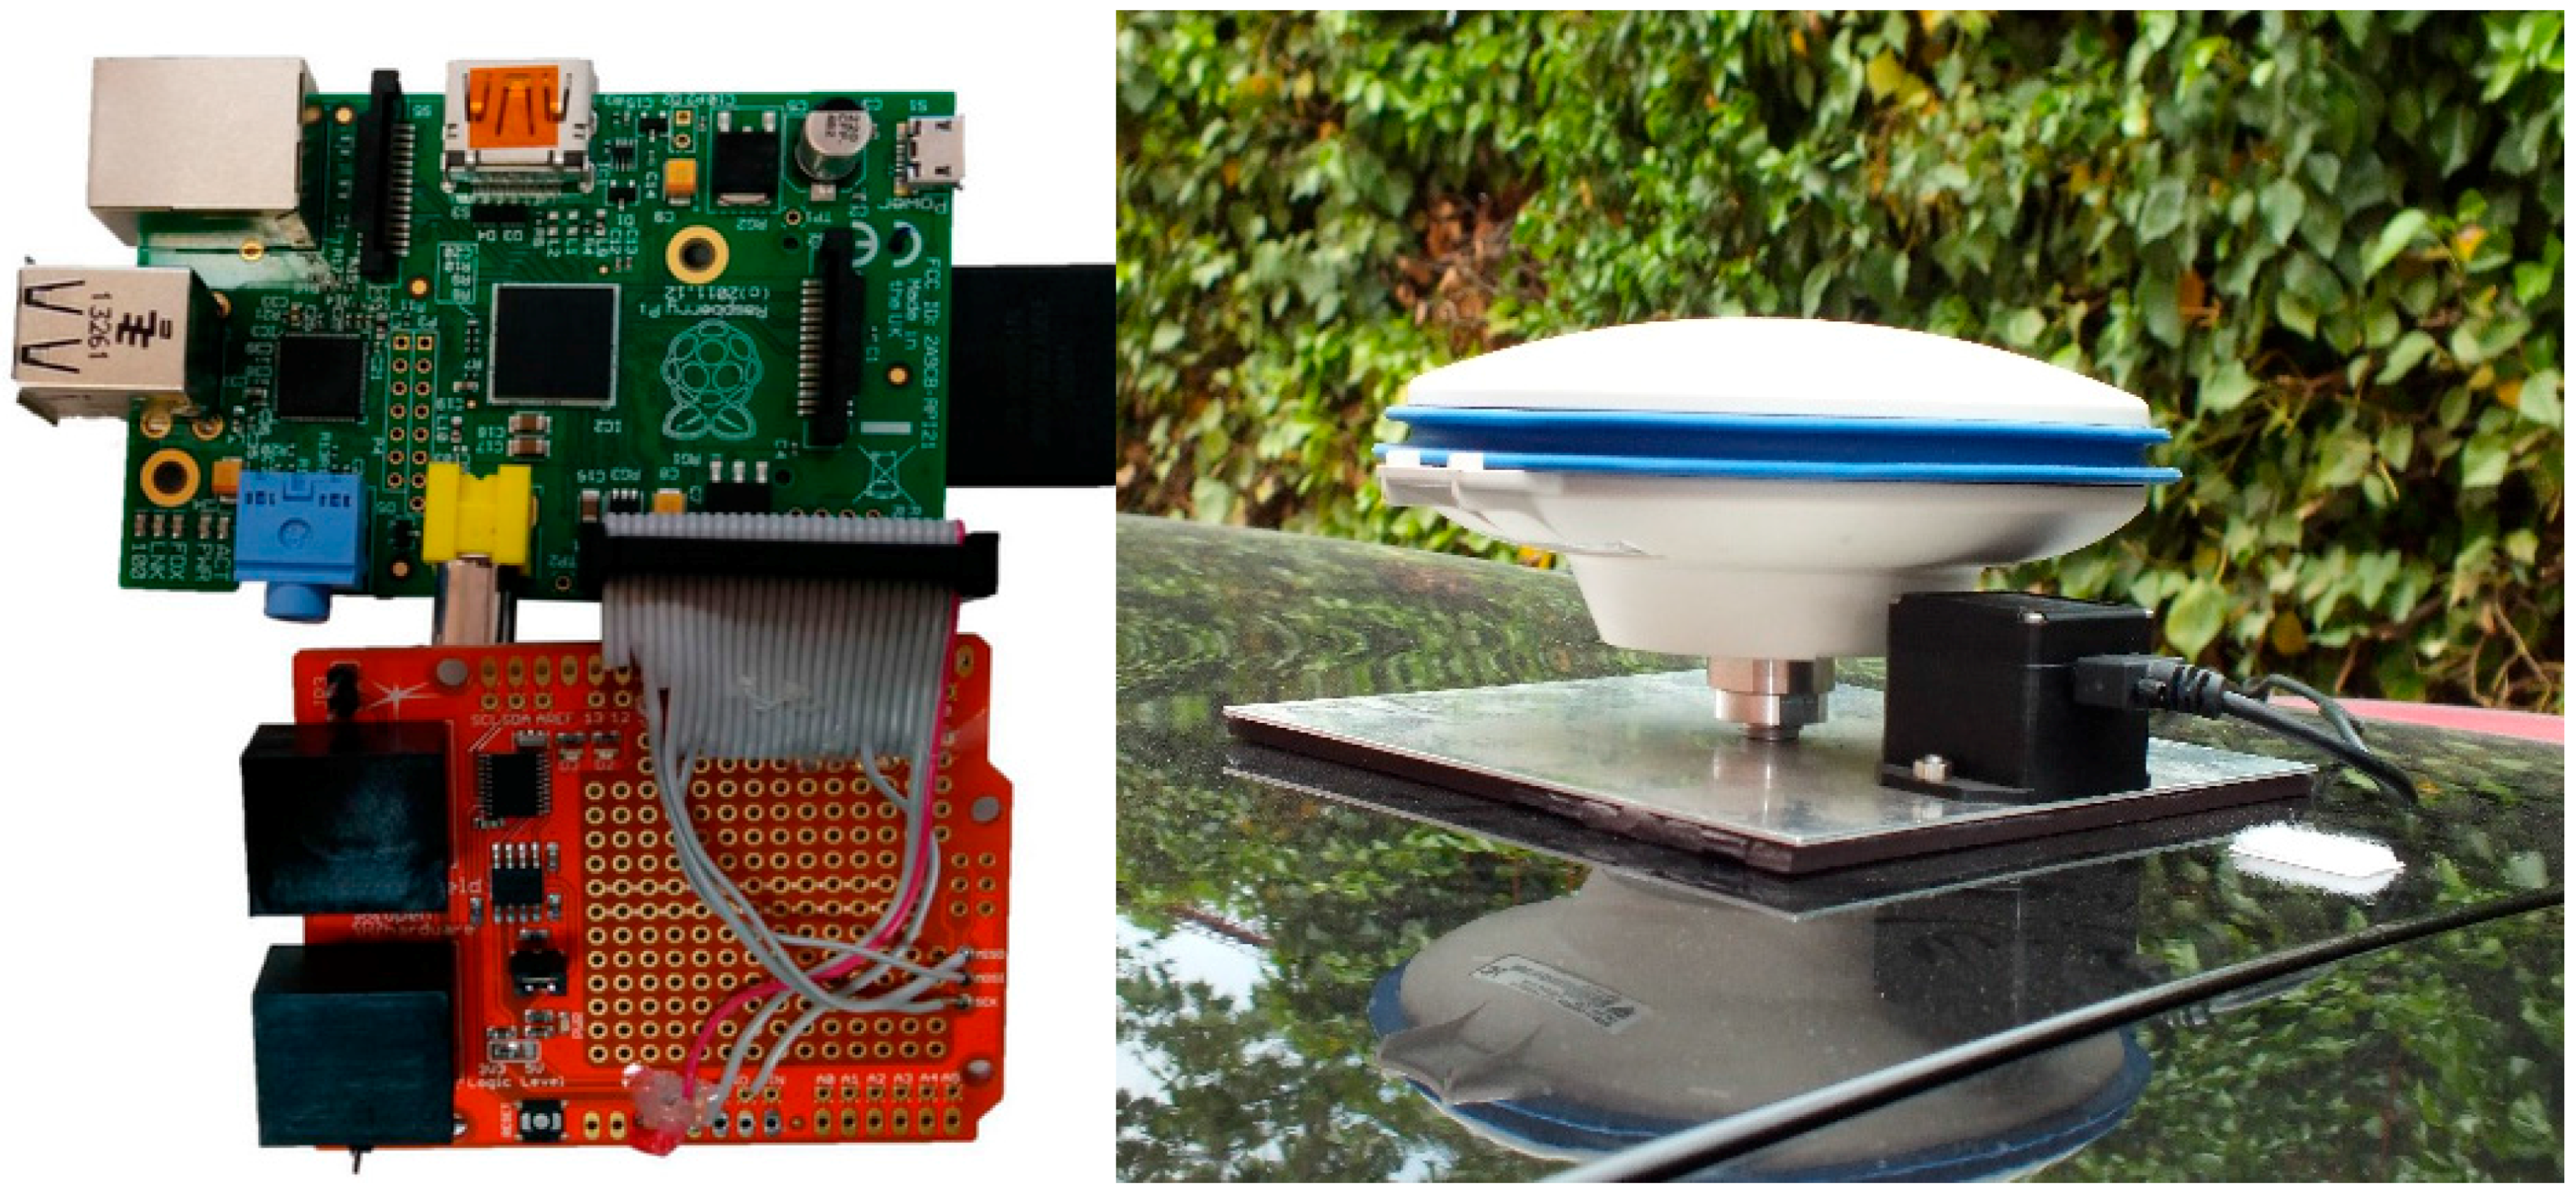

4. Hardware Architecture and Data Acquired
4.1. CAN-BUS Communication System

| Data | Units |
|---|---|
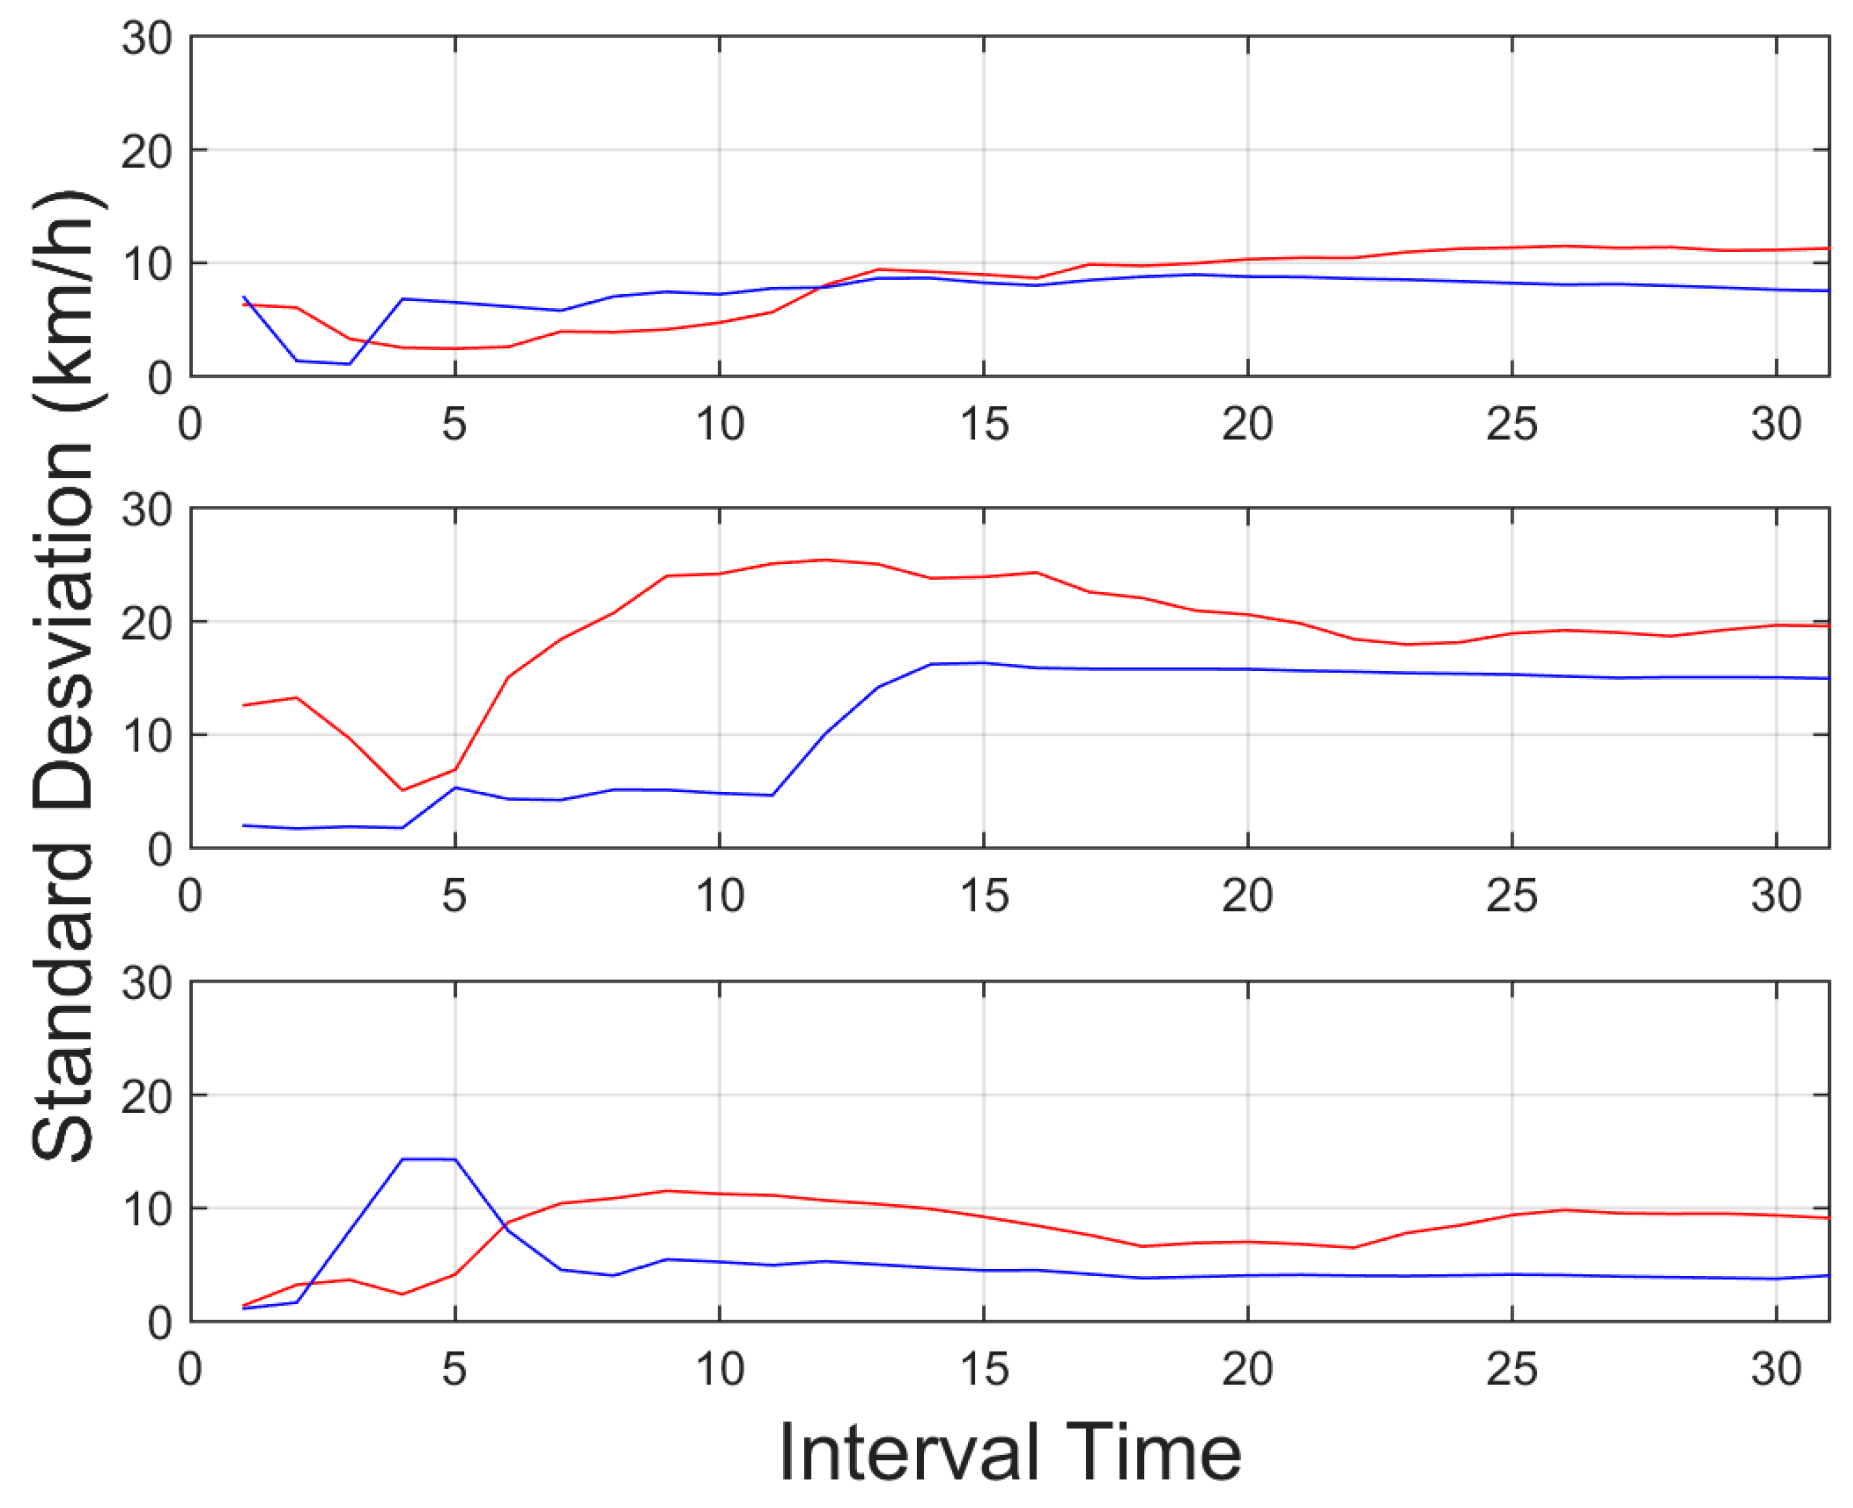
| Vehicle lineal velocity | (km/h) |
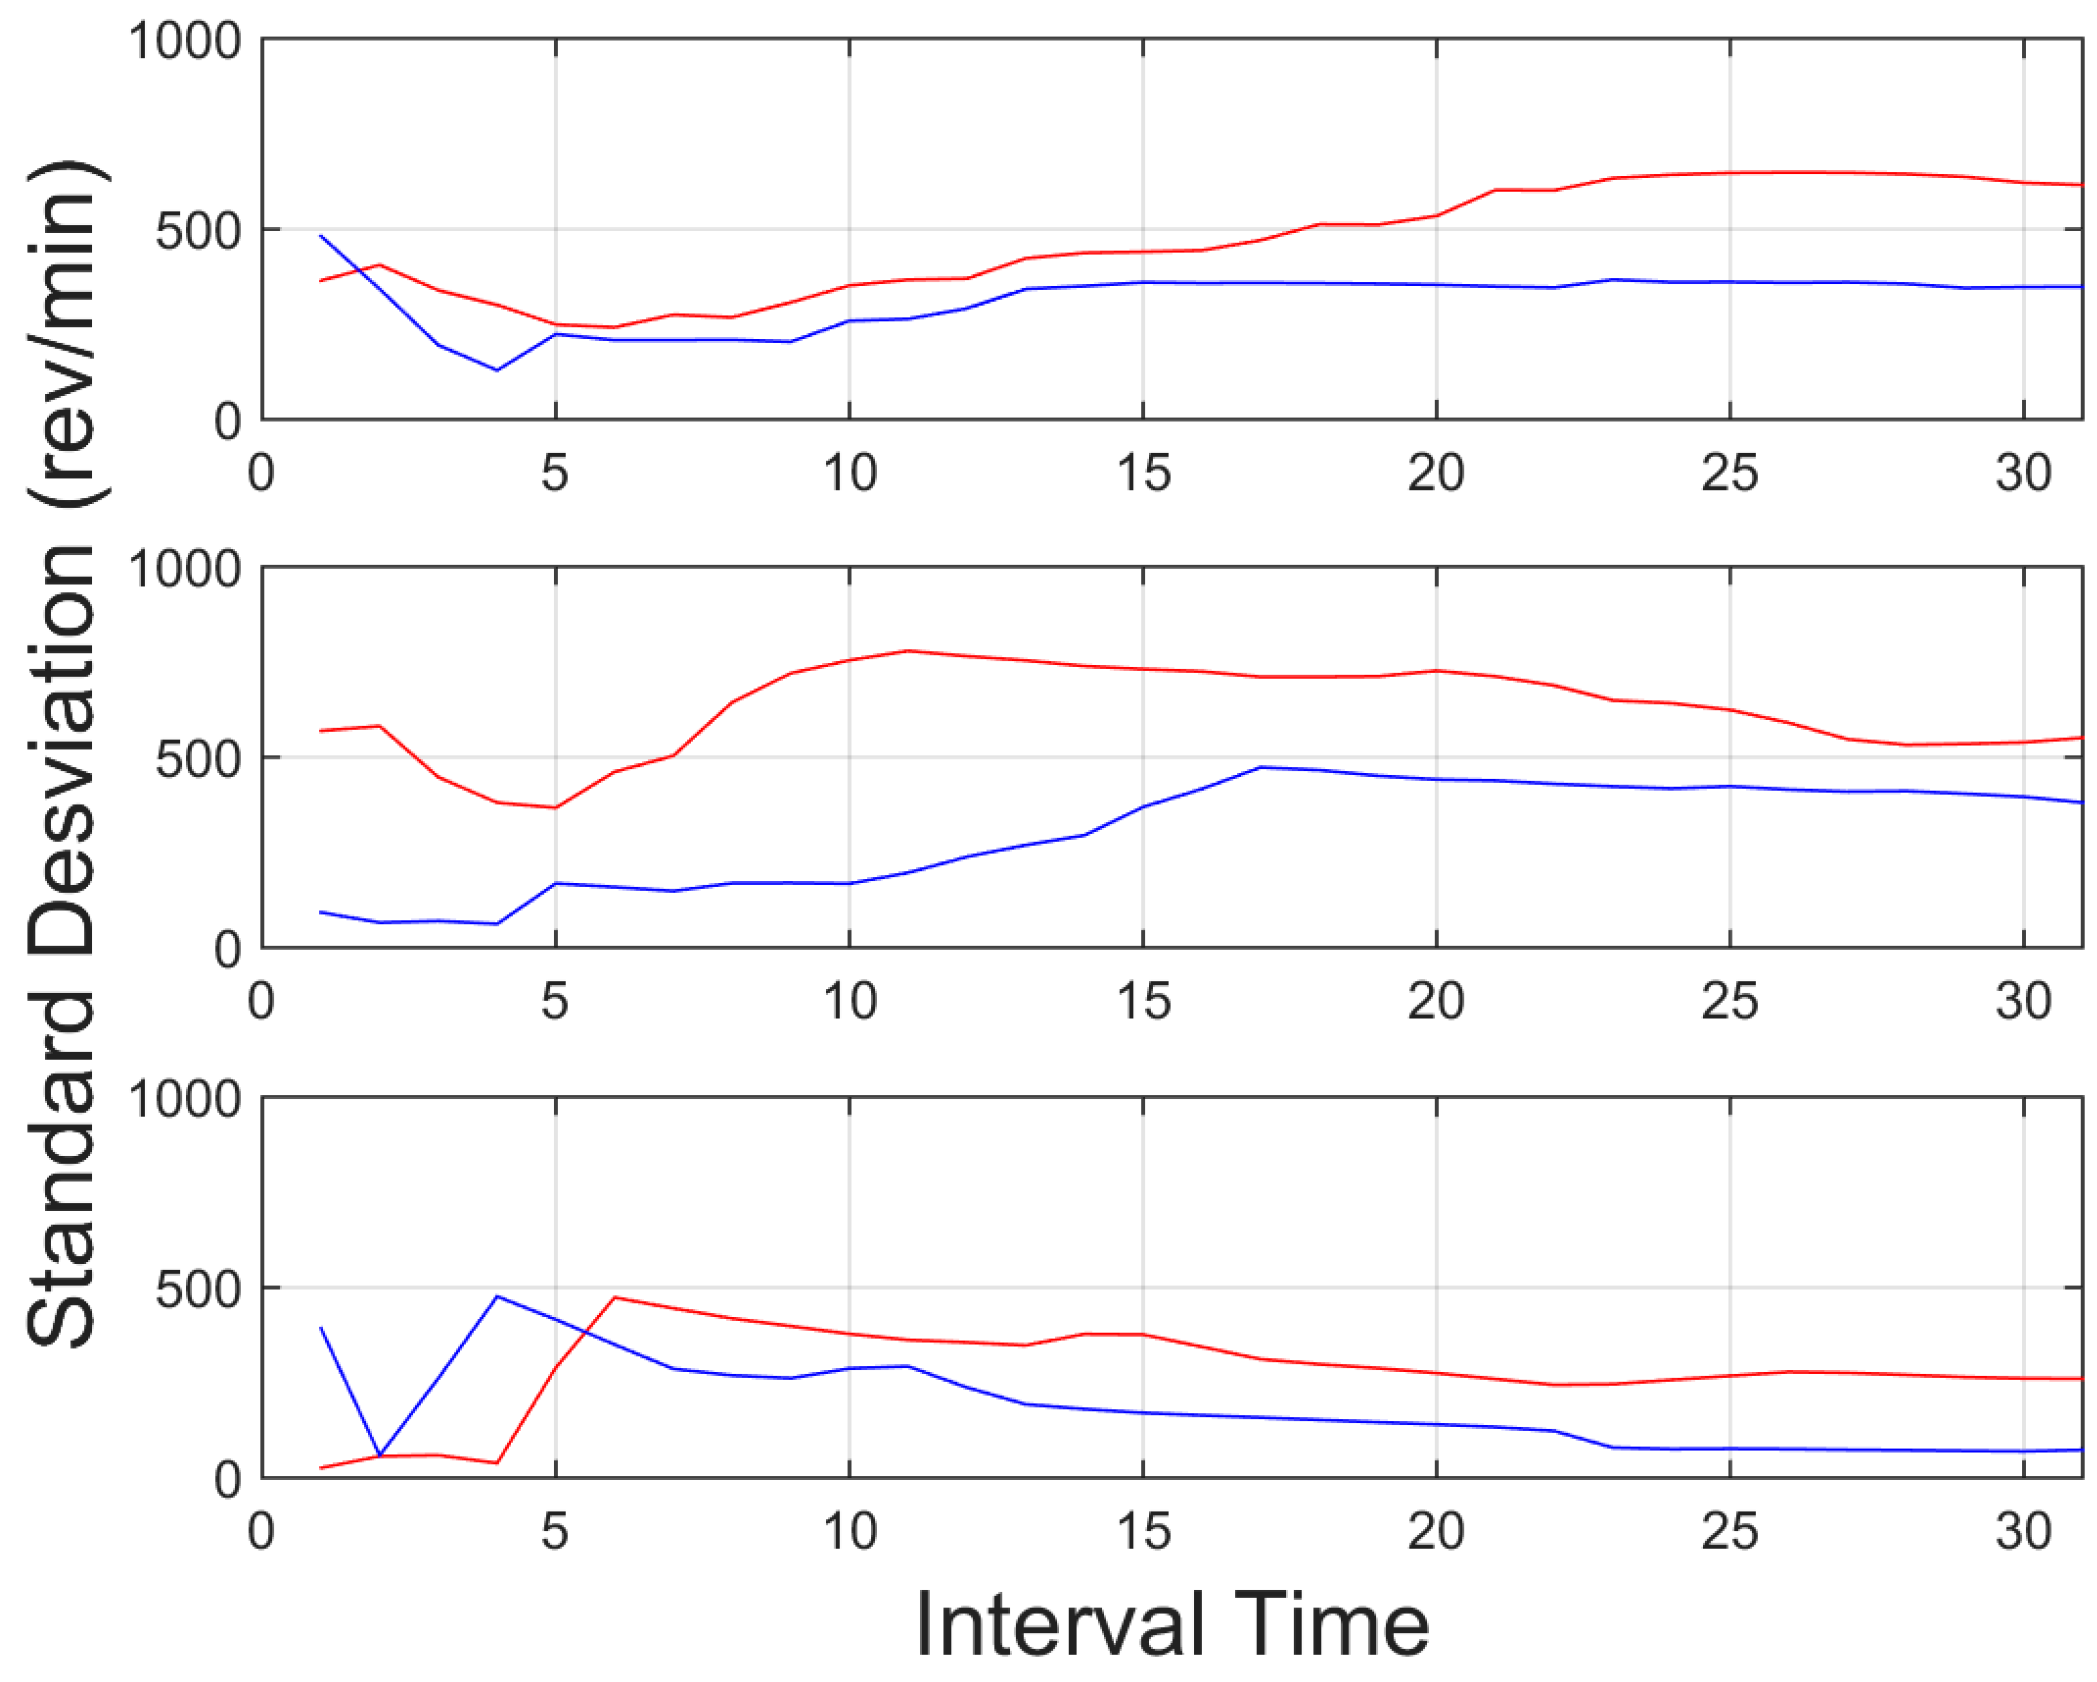
| Revolutions per minute | (r.p.m.) |
| Brake pedal | Binary data (pedal pressed or not) |
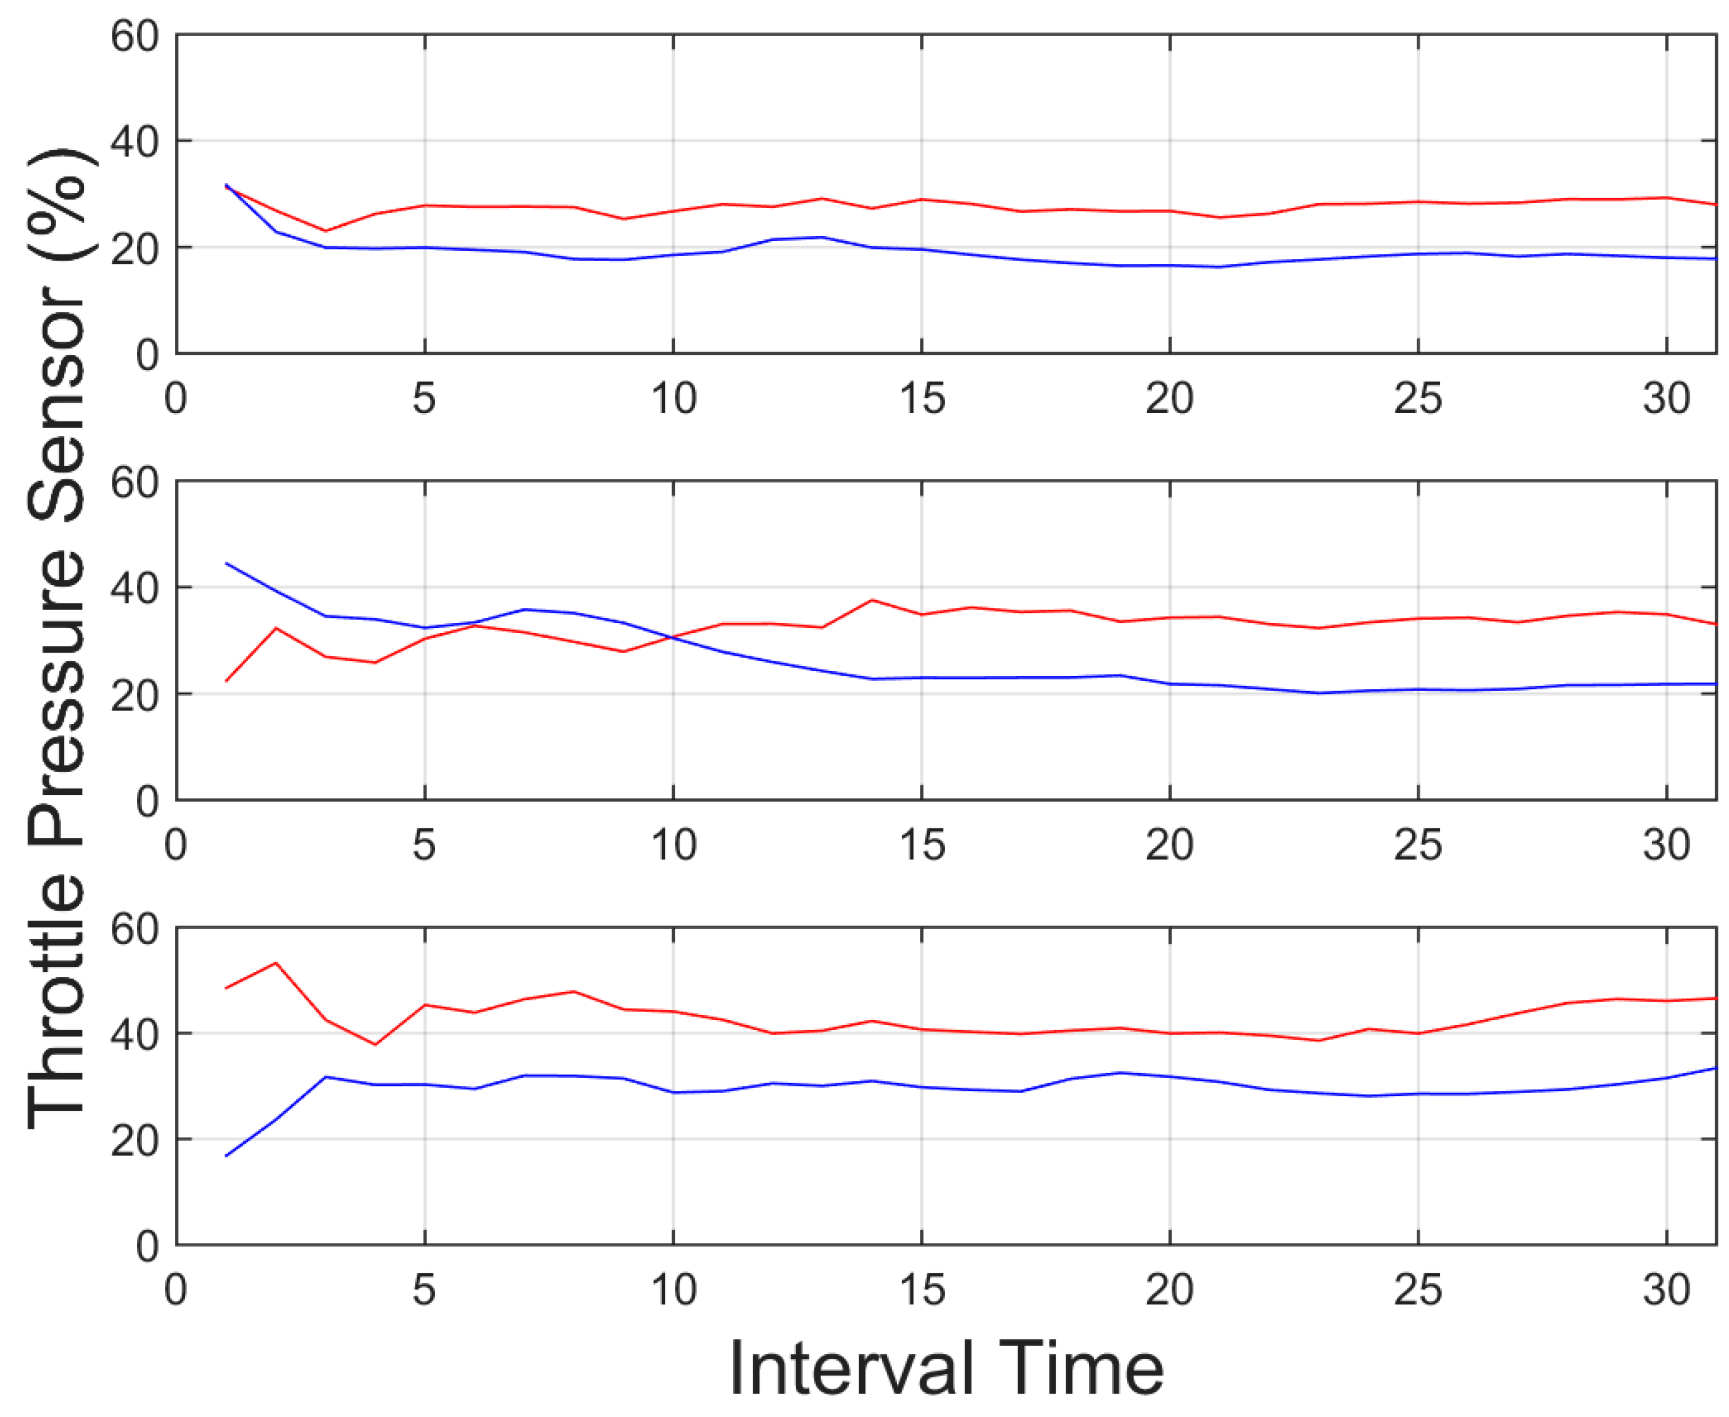
| Throttle pedal | (% of pedal pressed) |
| Steering wheel angle | (degrees) |
4.2. GPS and IMU Subsystem
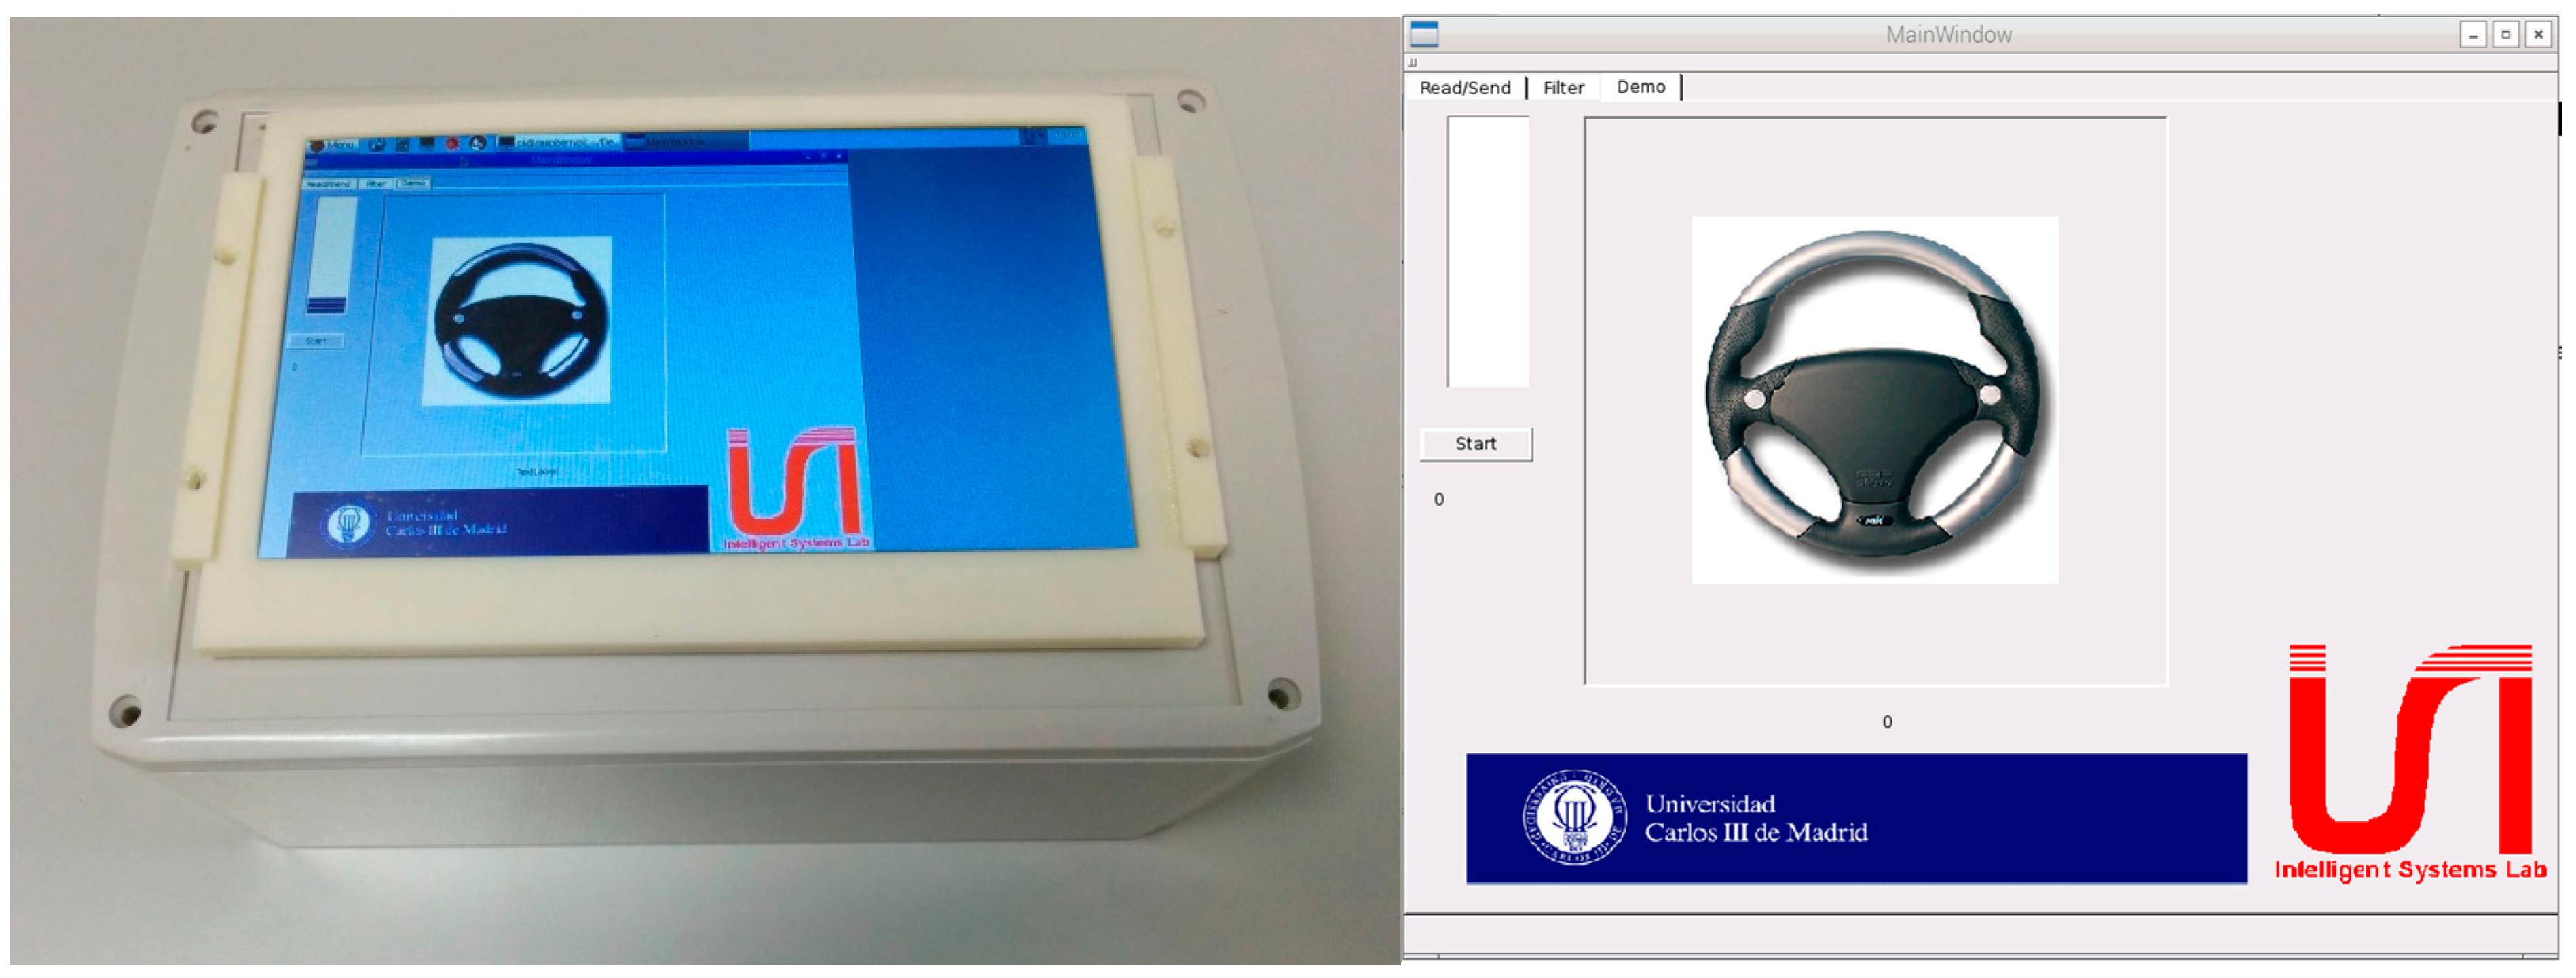
5. Driver Behaviour Analysis Software Module
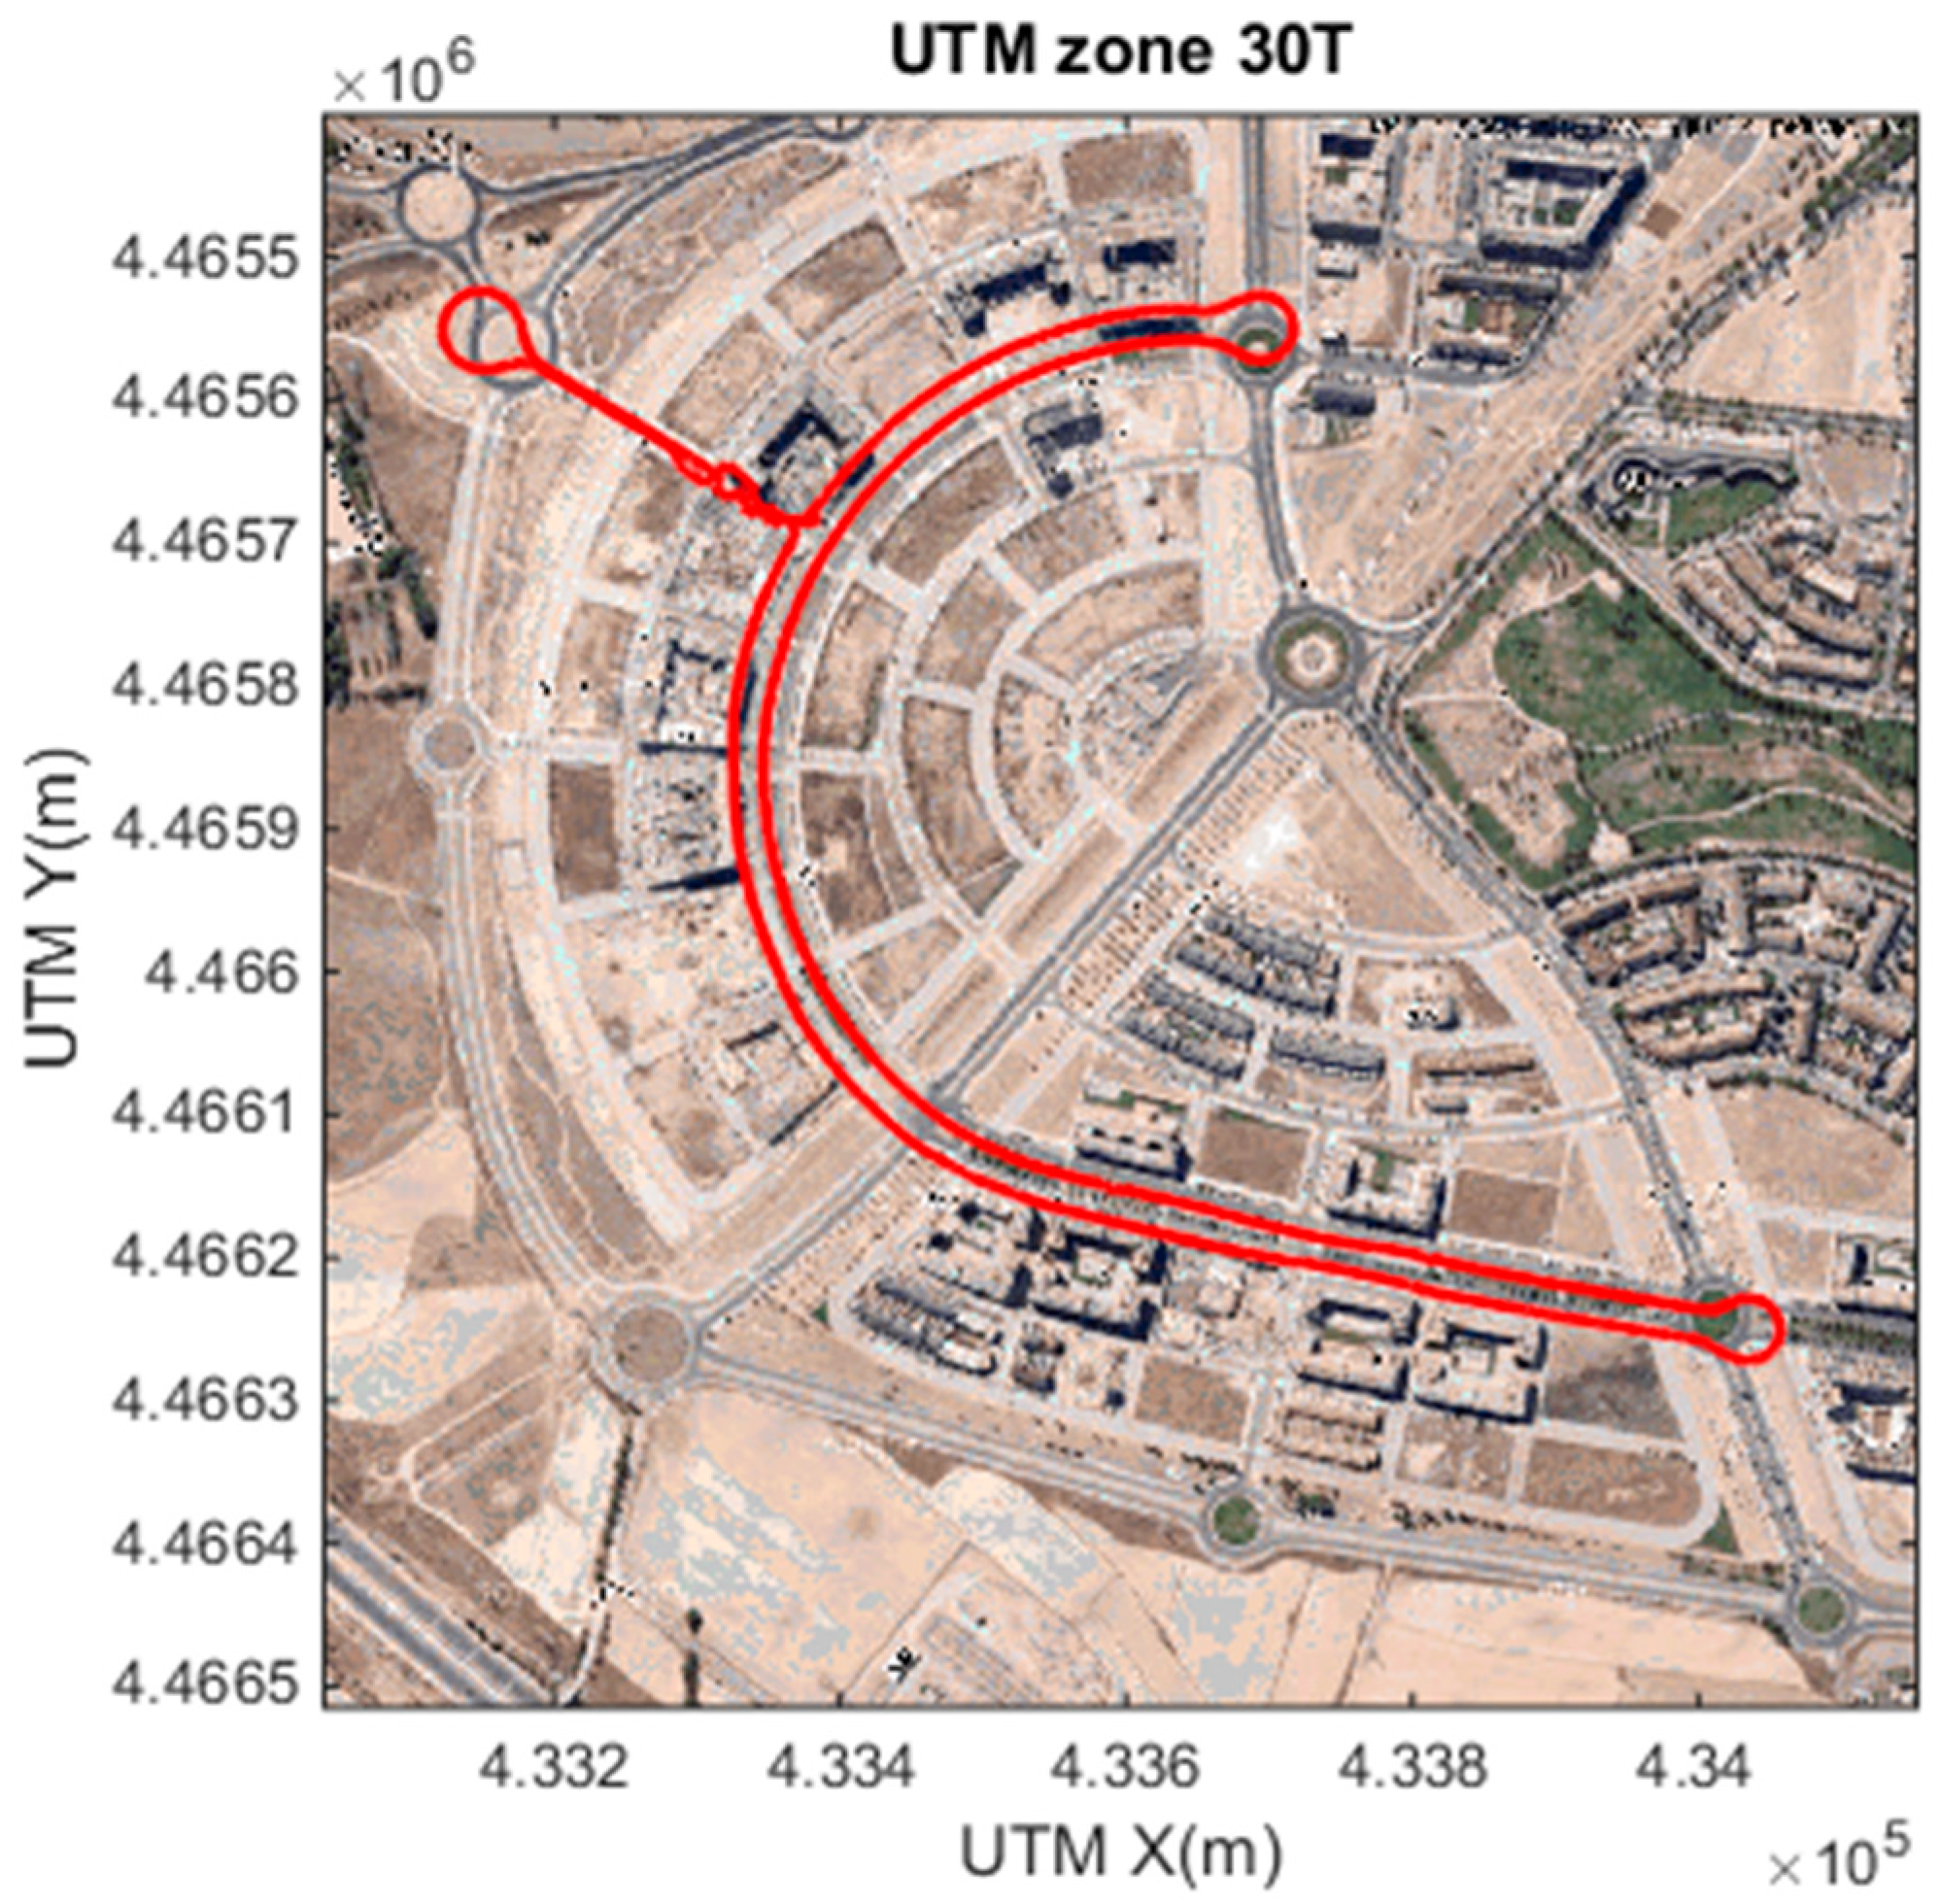
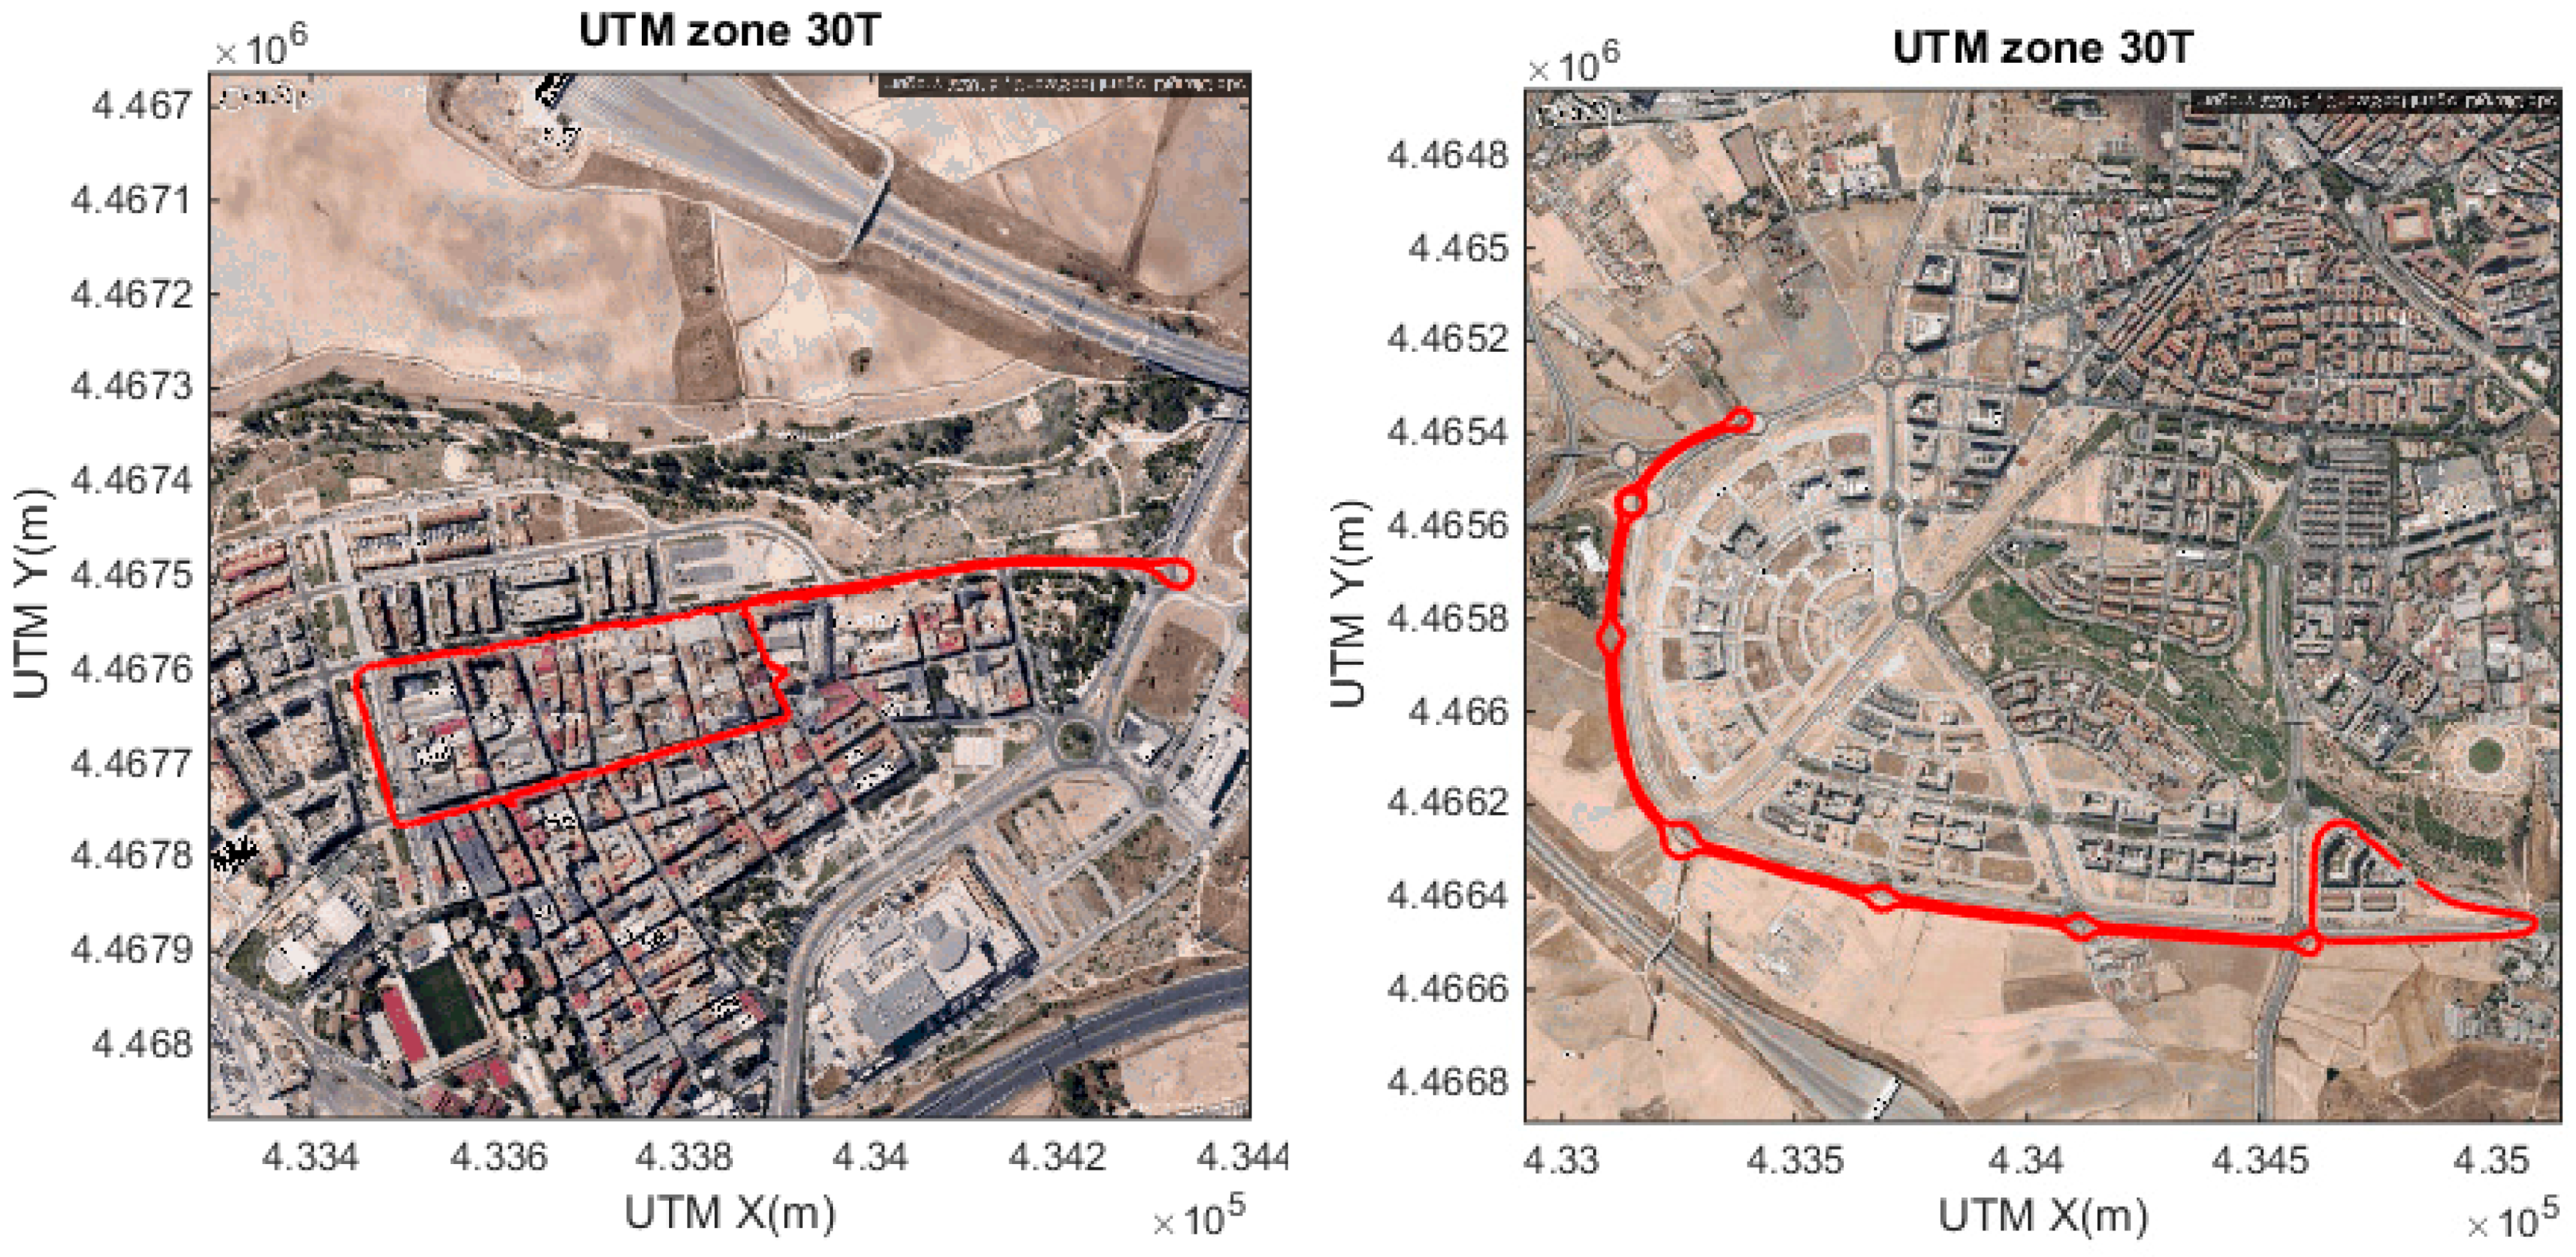
5.1. Accurate Localization and Digital Maps
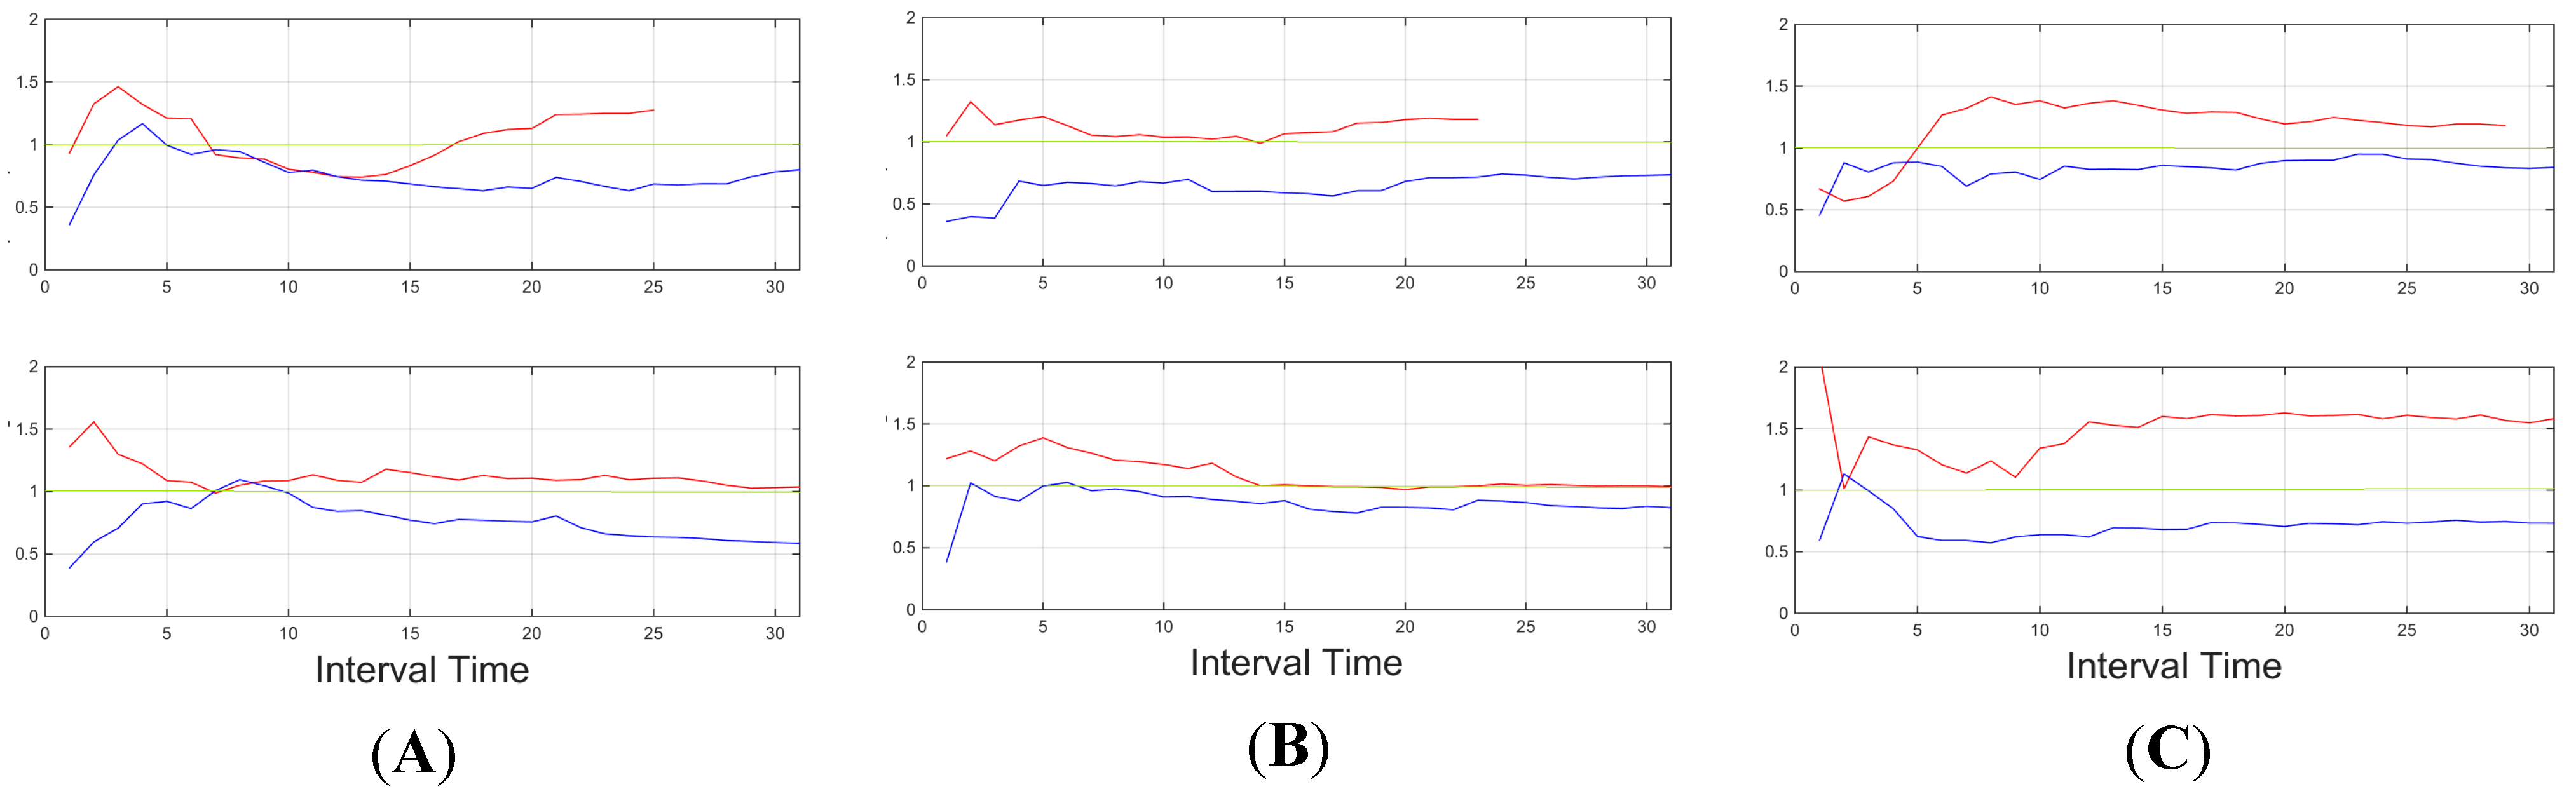
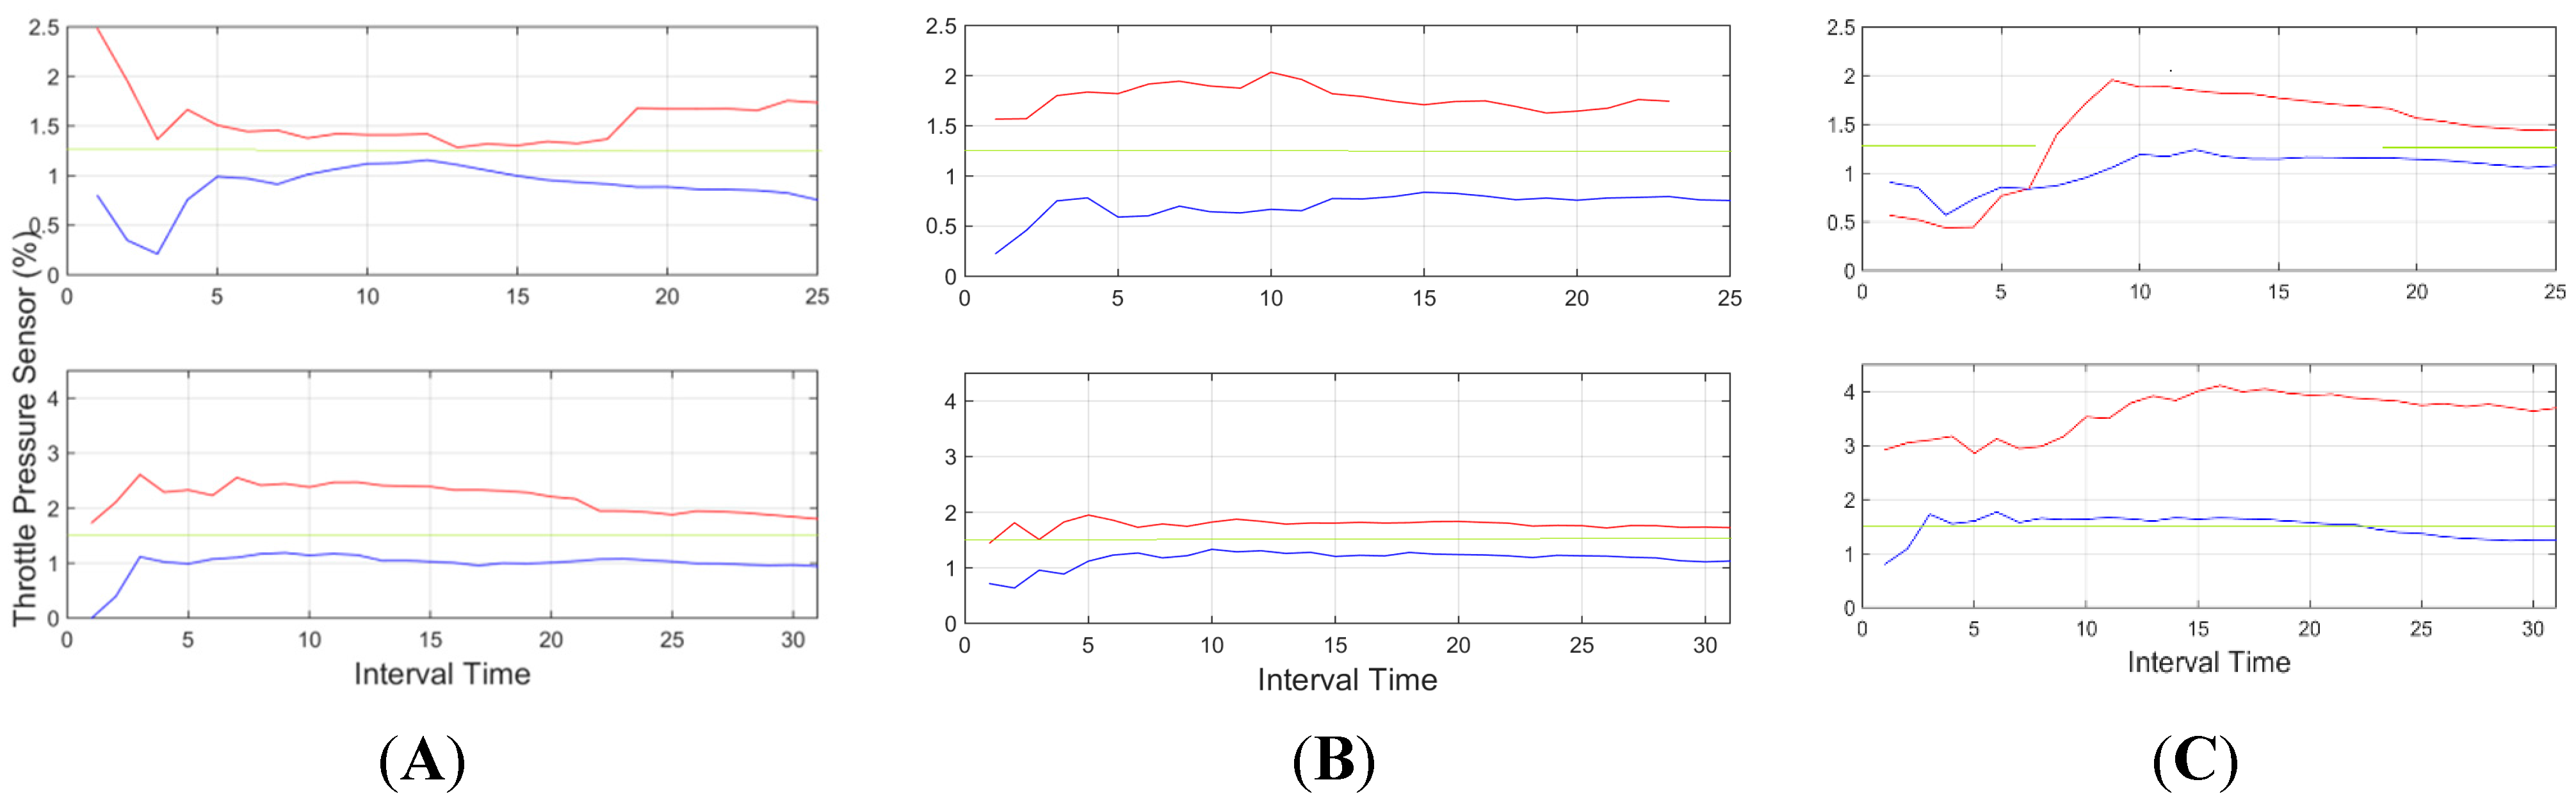
5.2. Time Domain Descriptors
5.2.1. CAN-BUS Based Descriptors
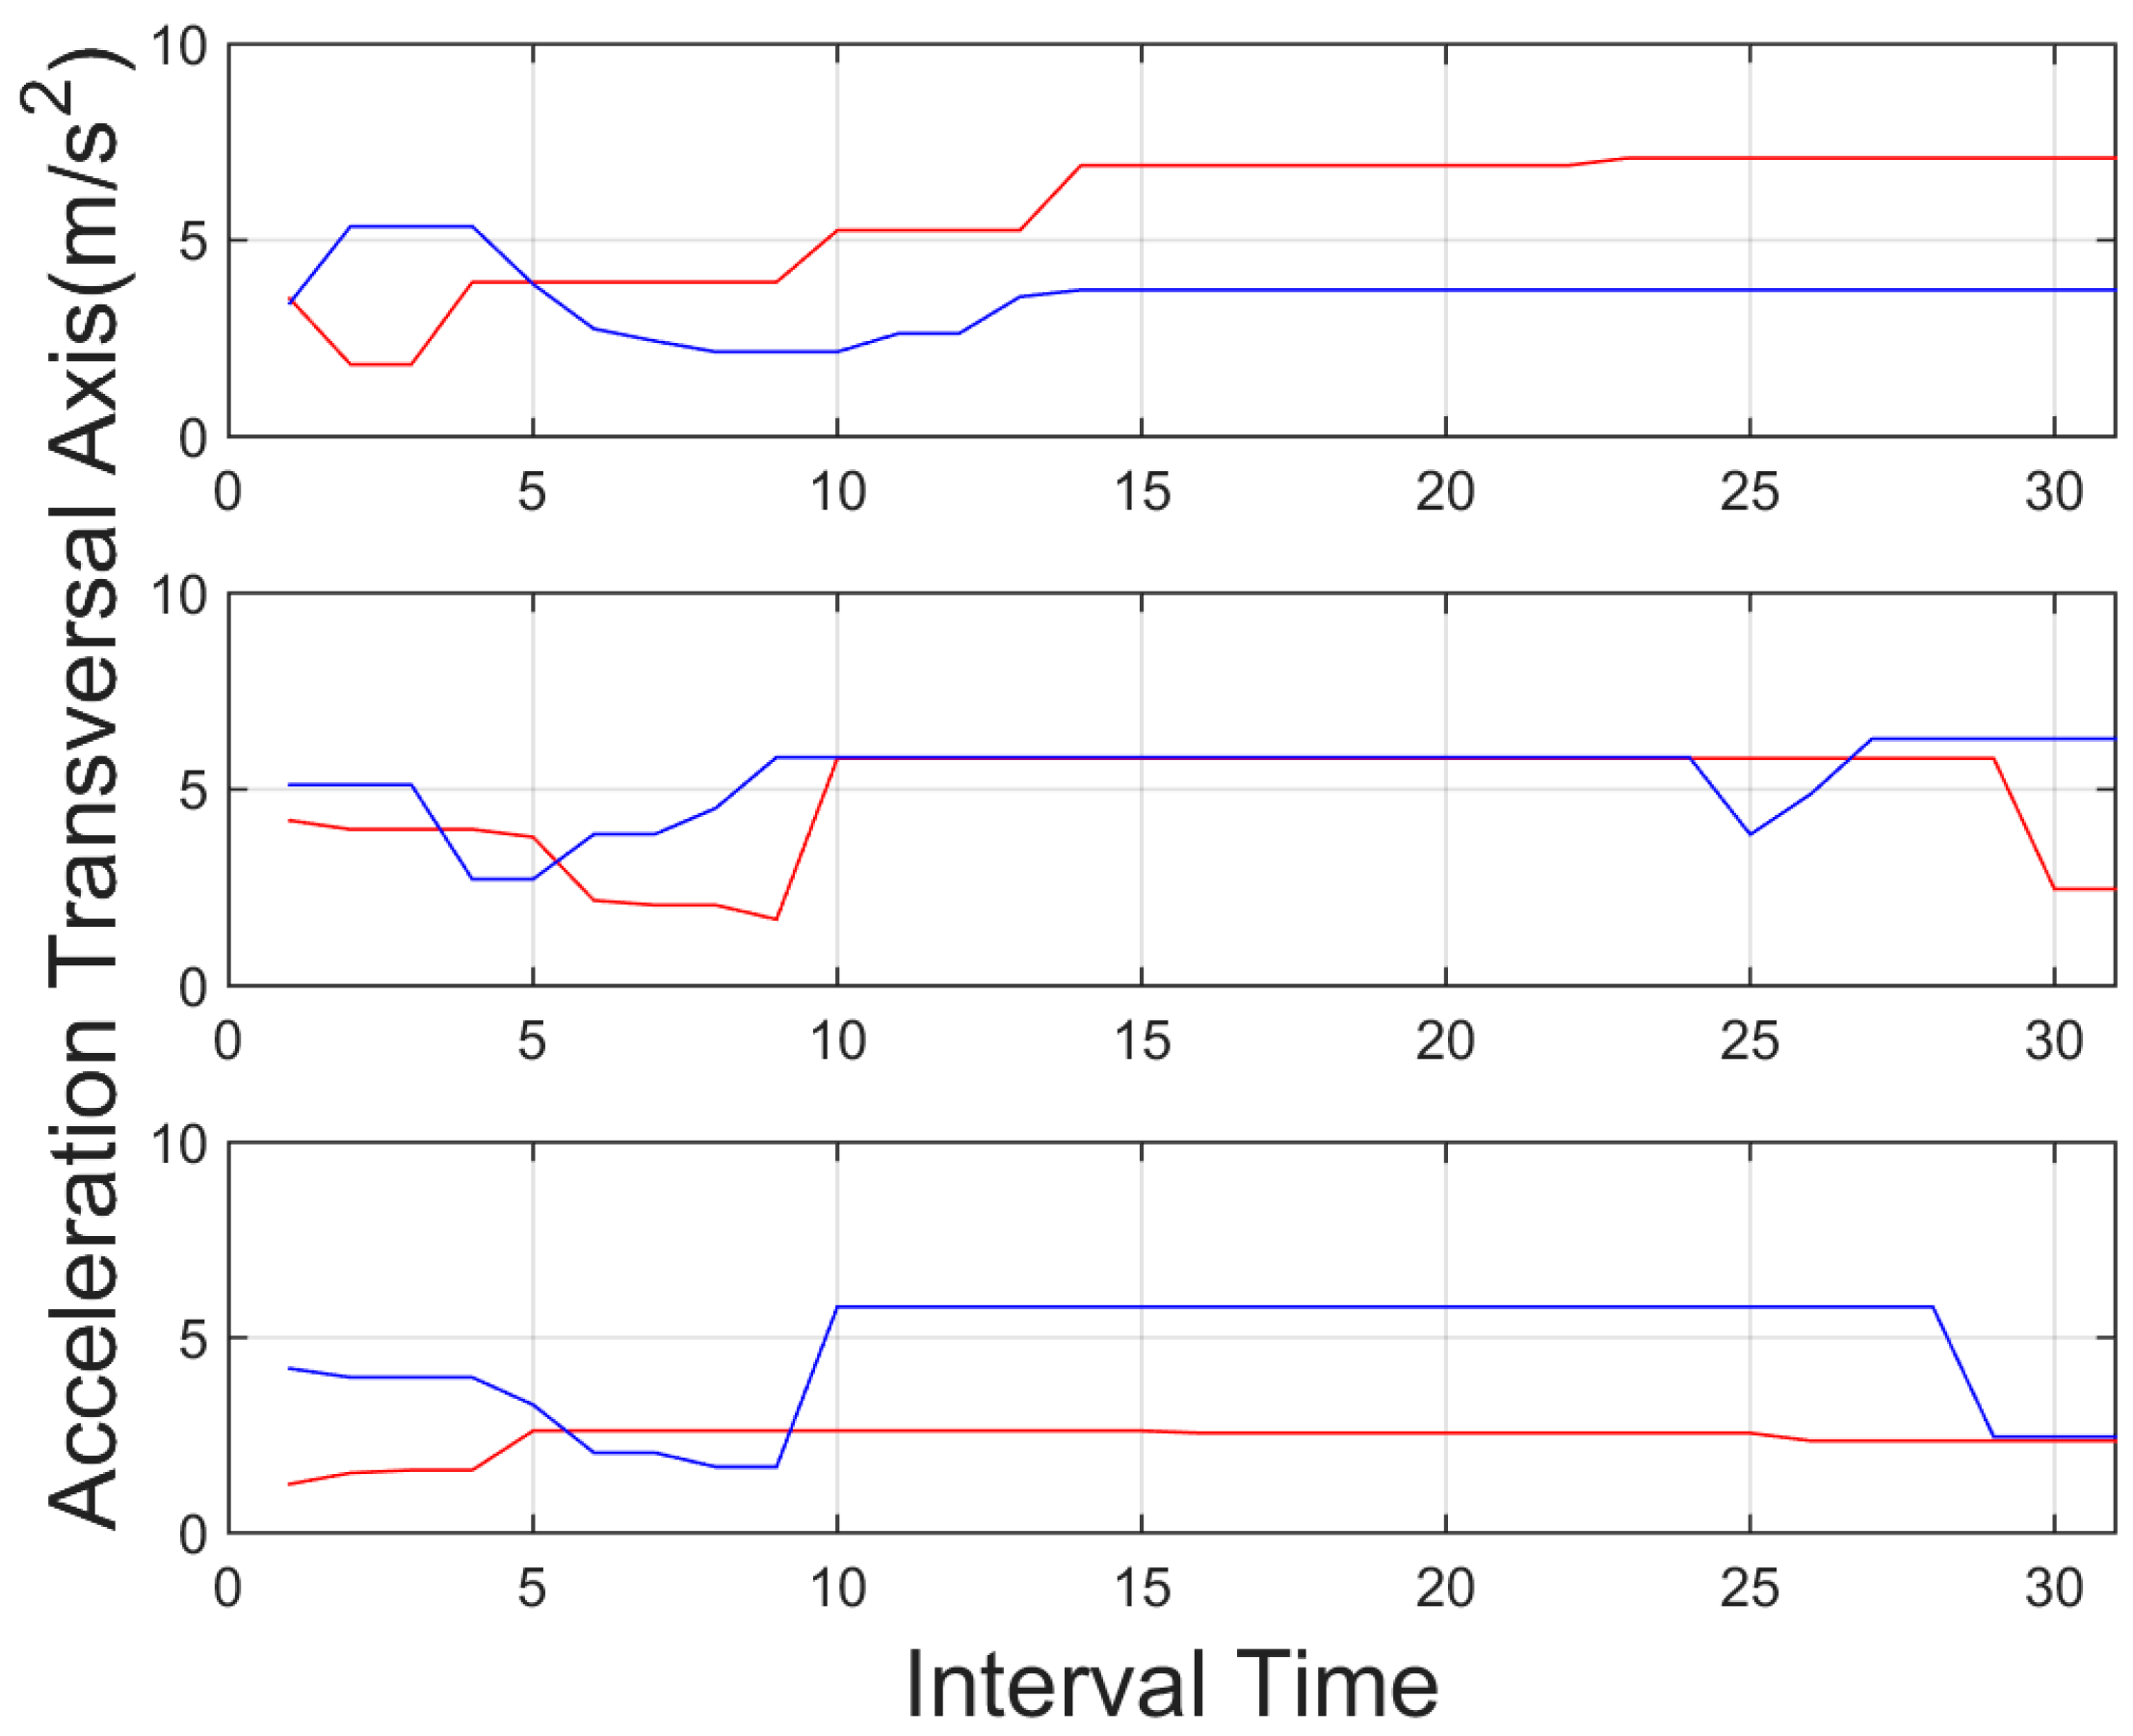
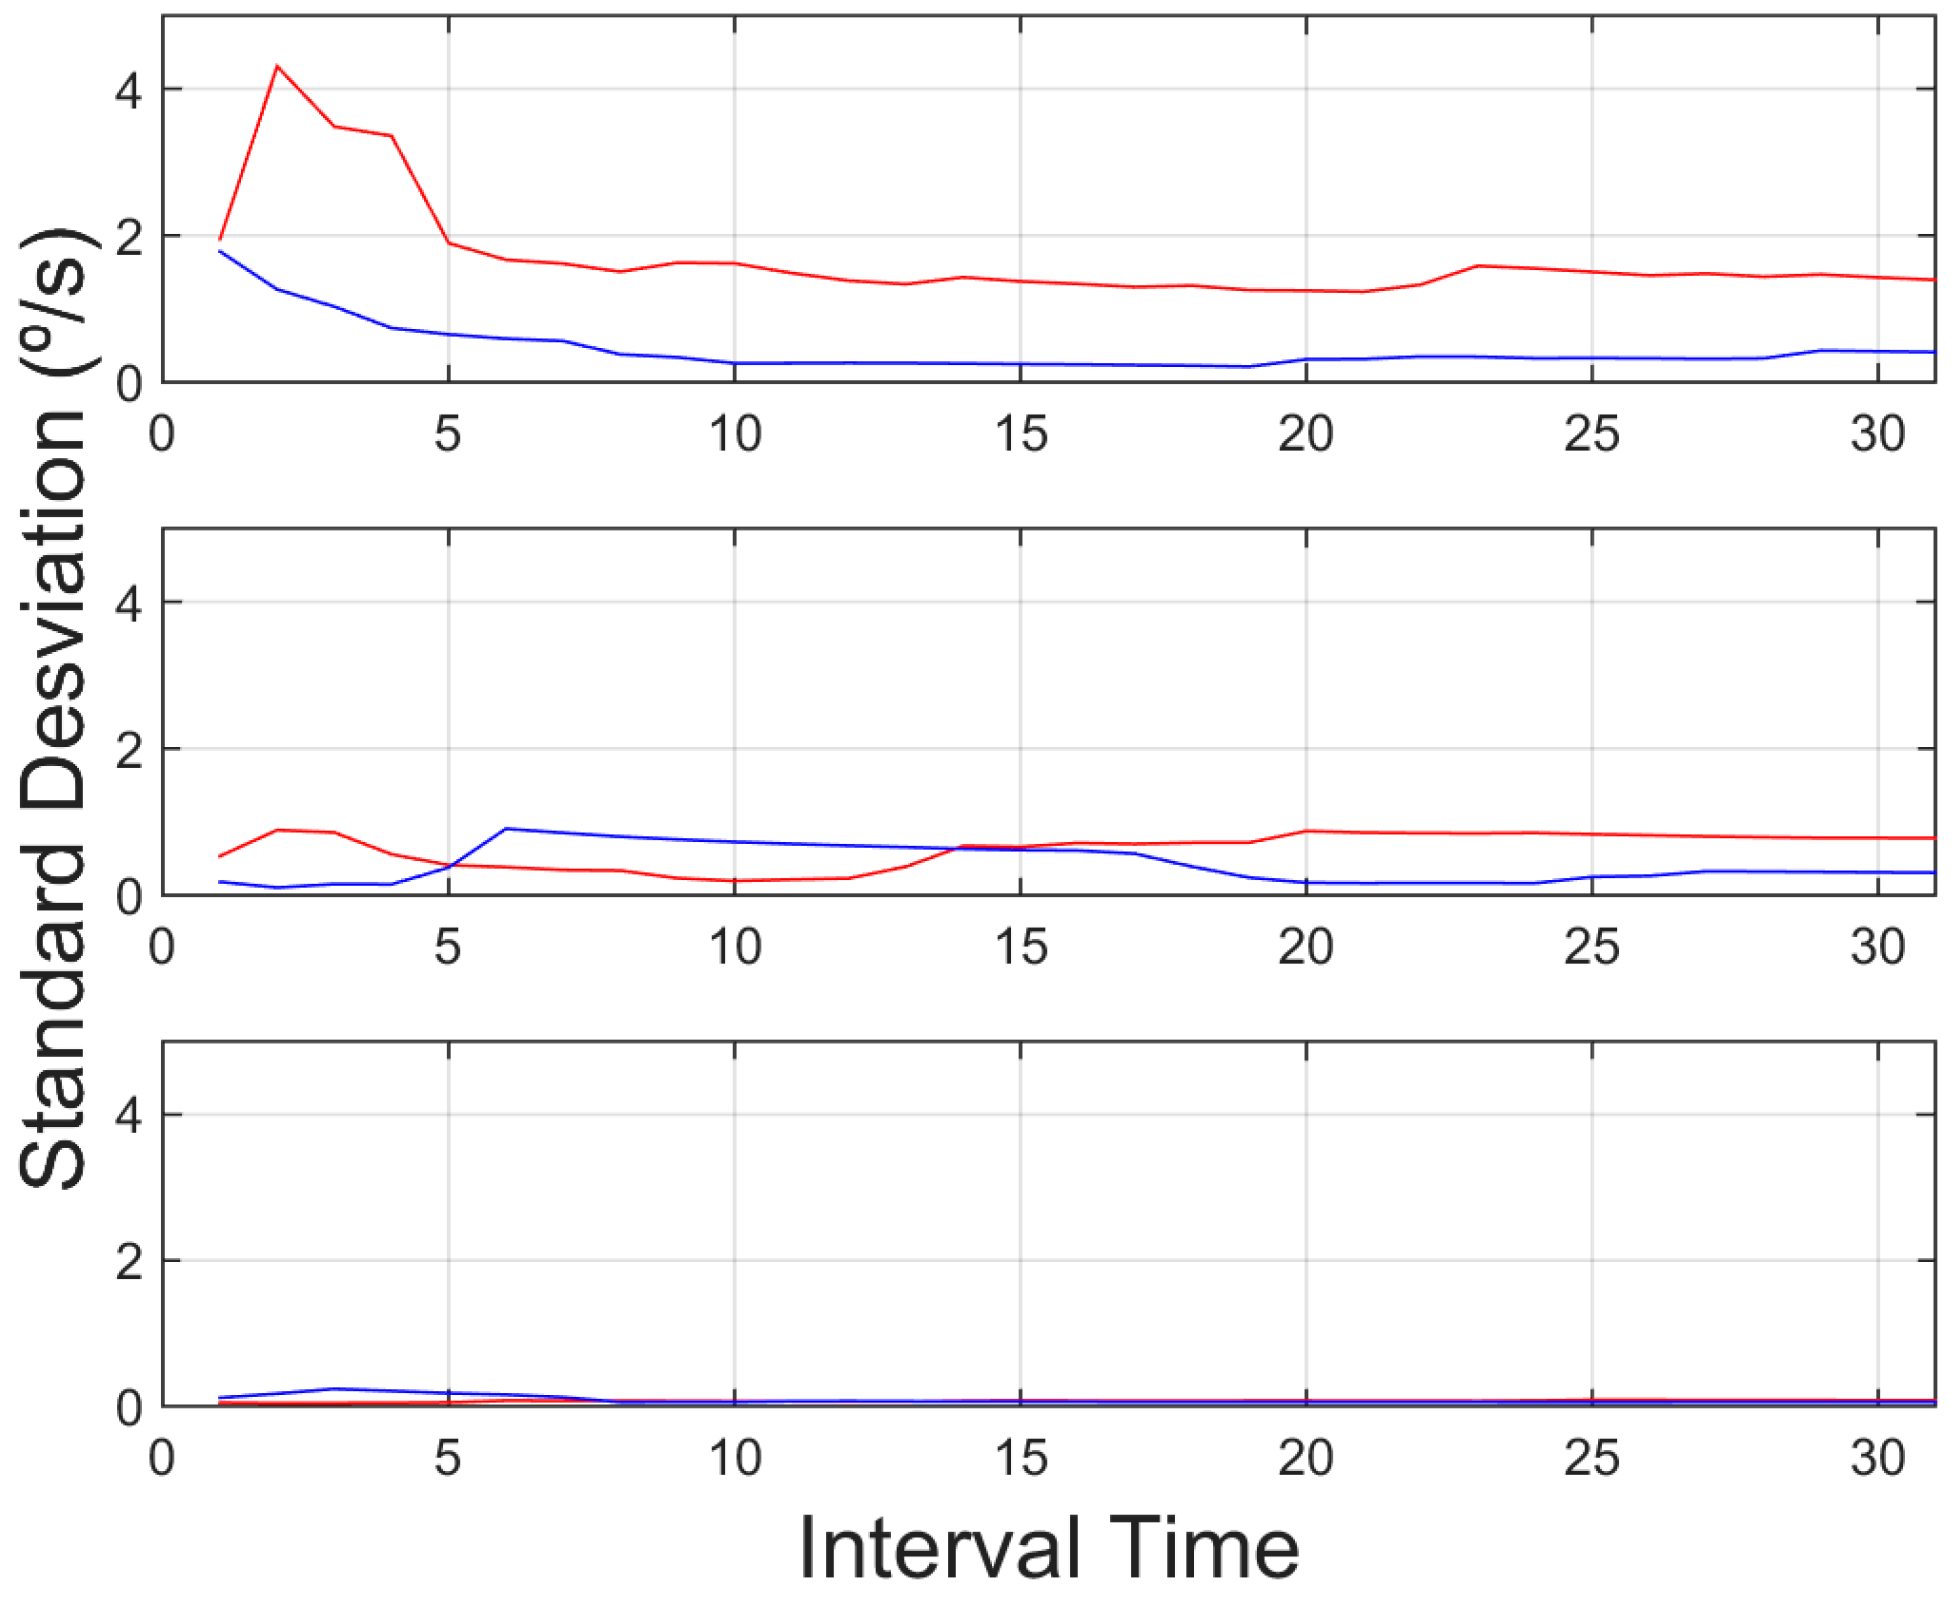
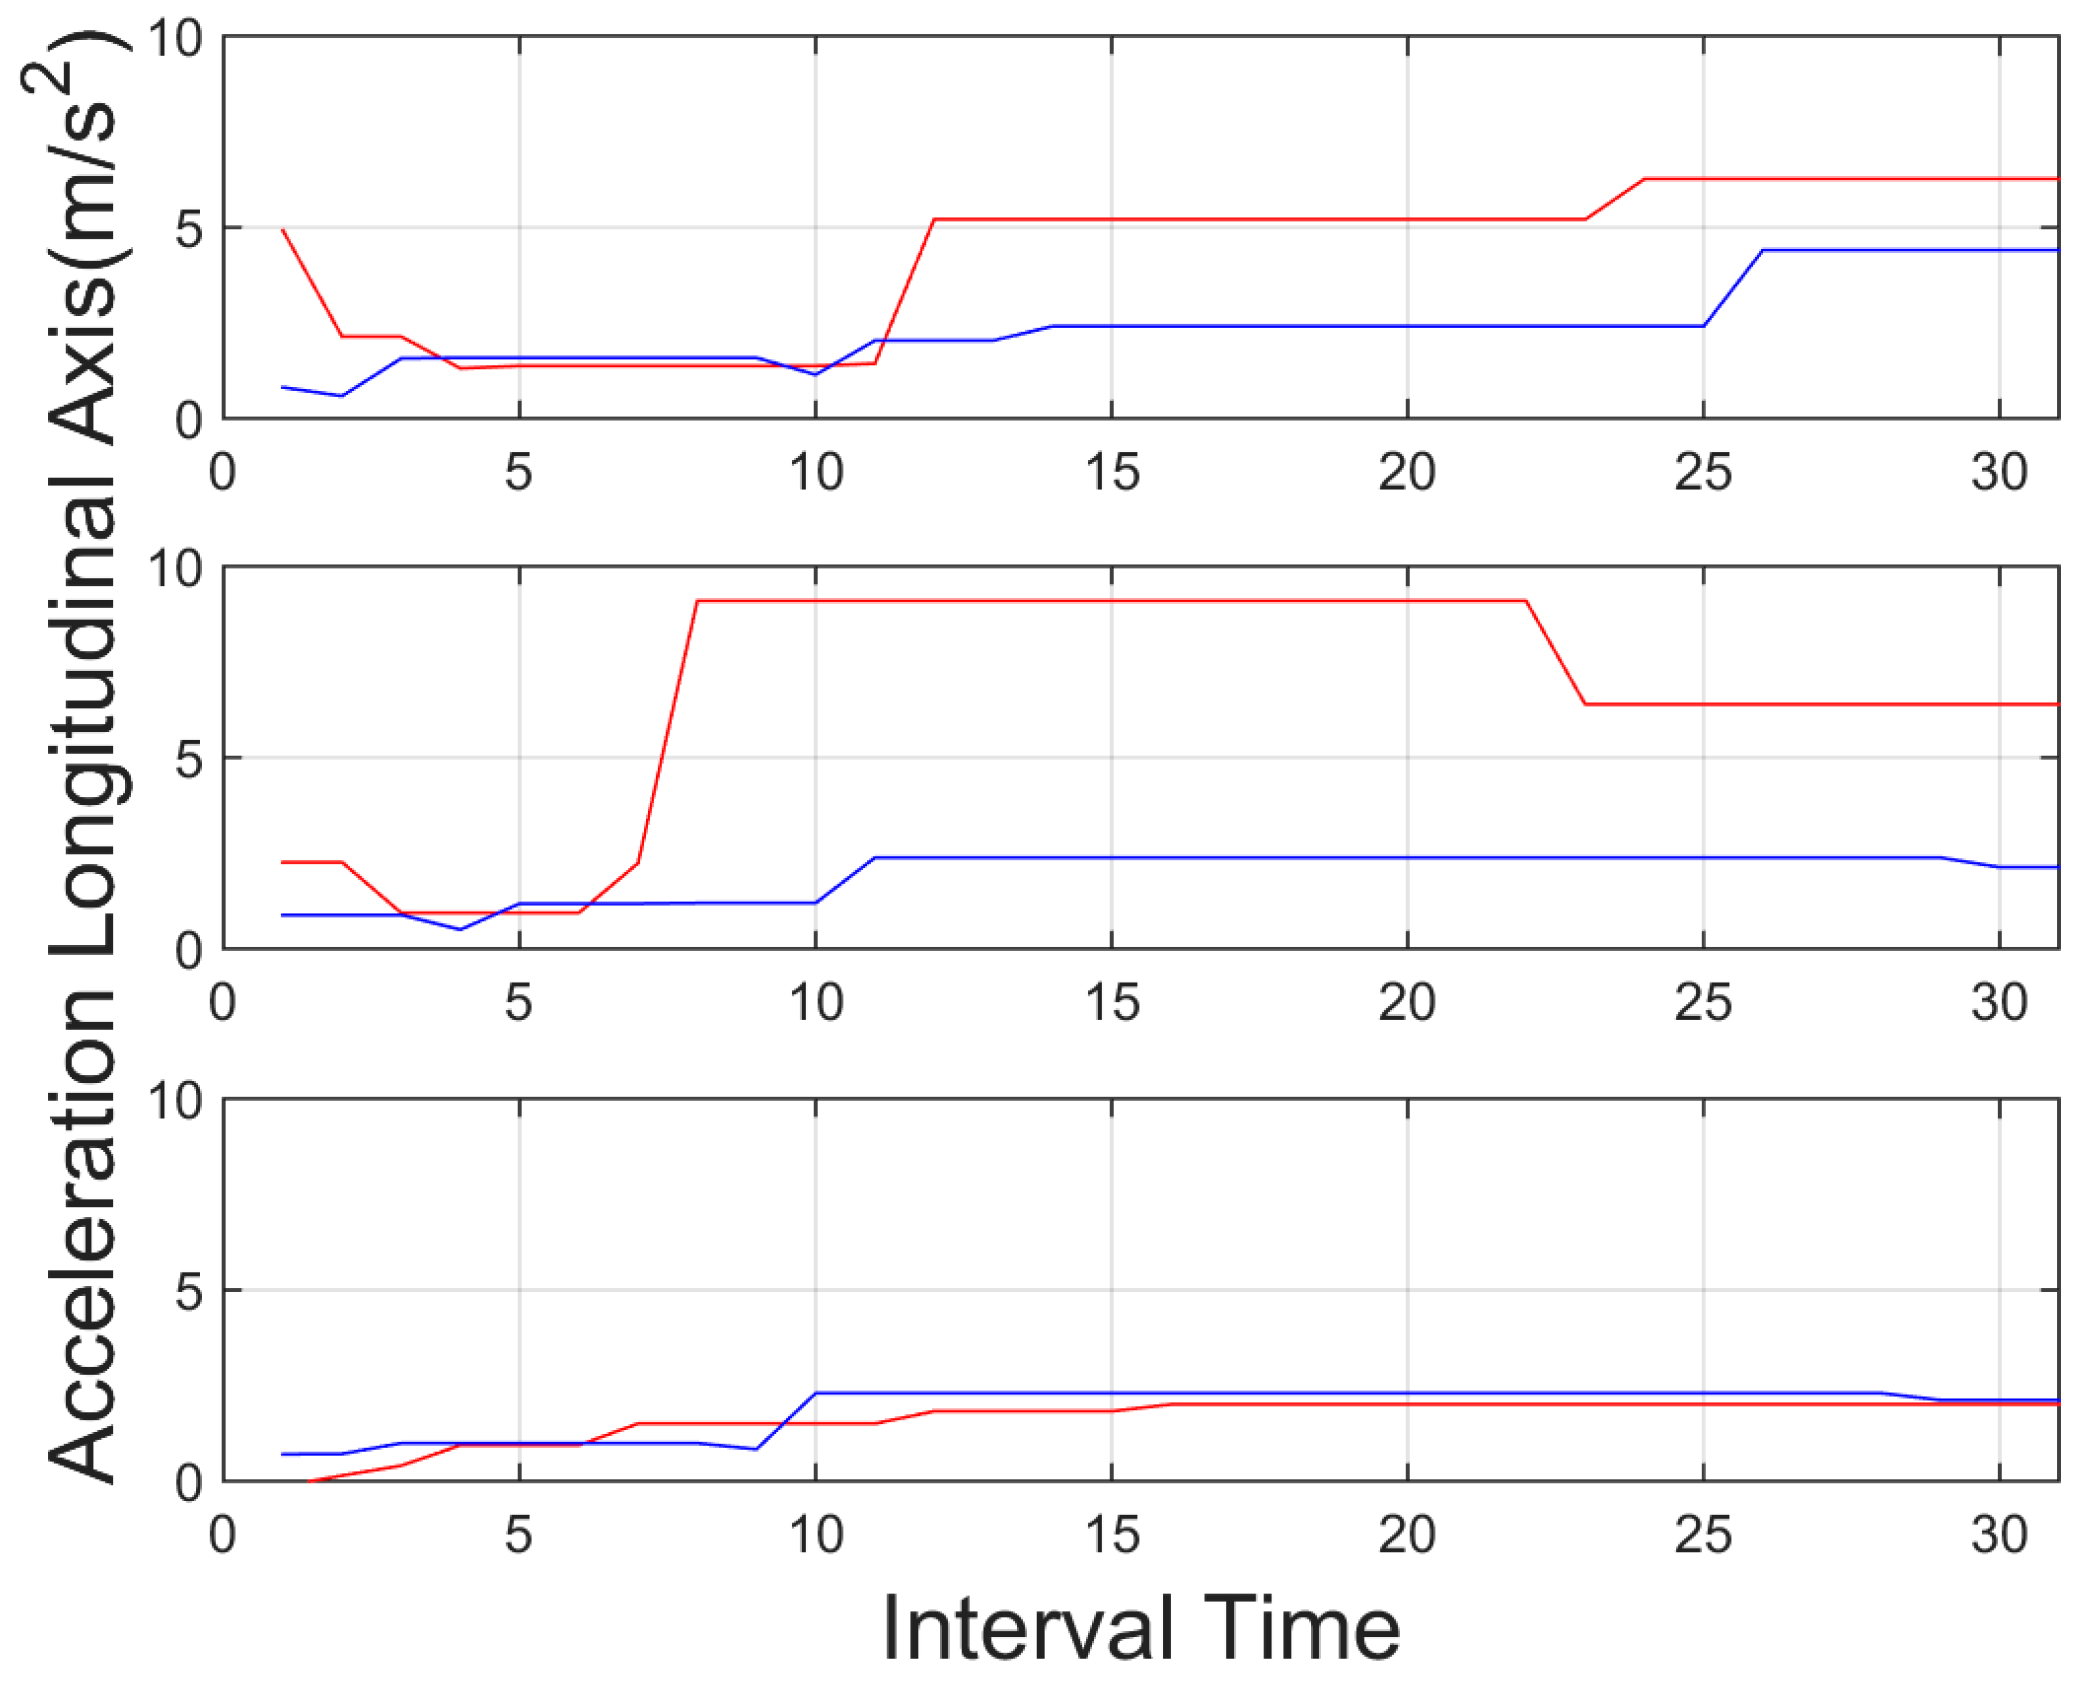
5.2.2. IMU Based Descriptors
Linear Acceleration
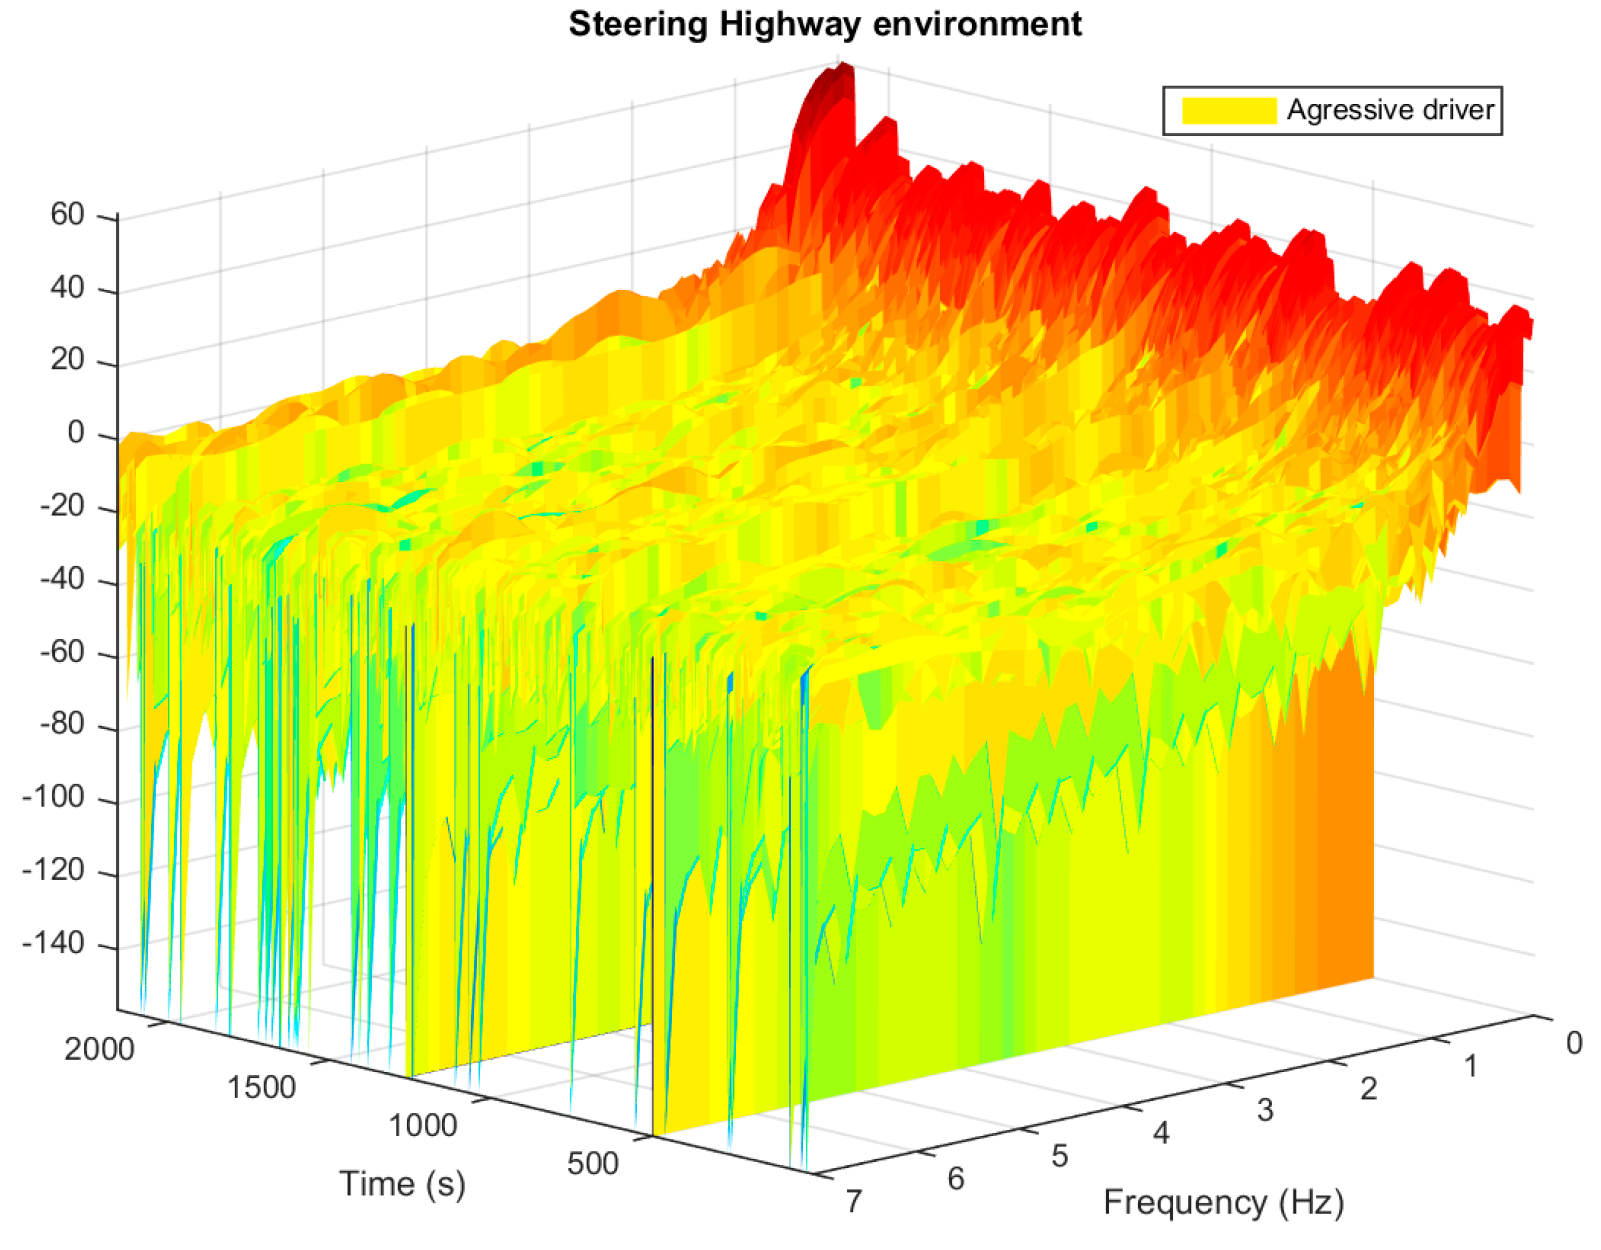
5.3. Frequency Domain Descriptors


5.4. Context Information
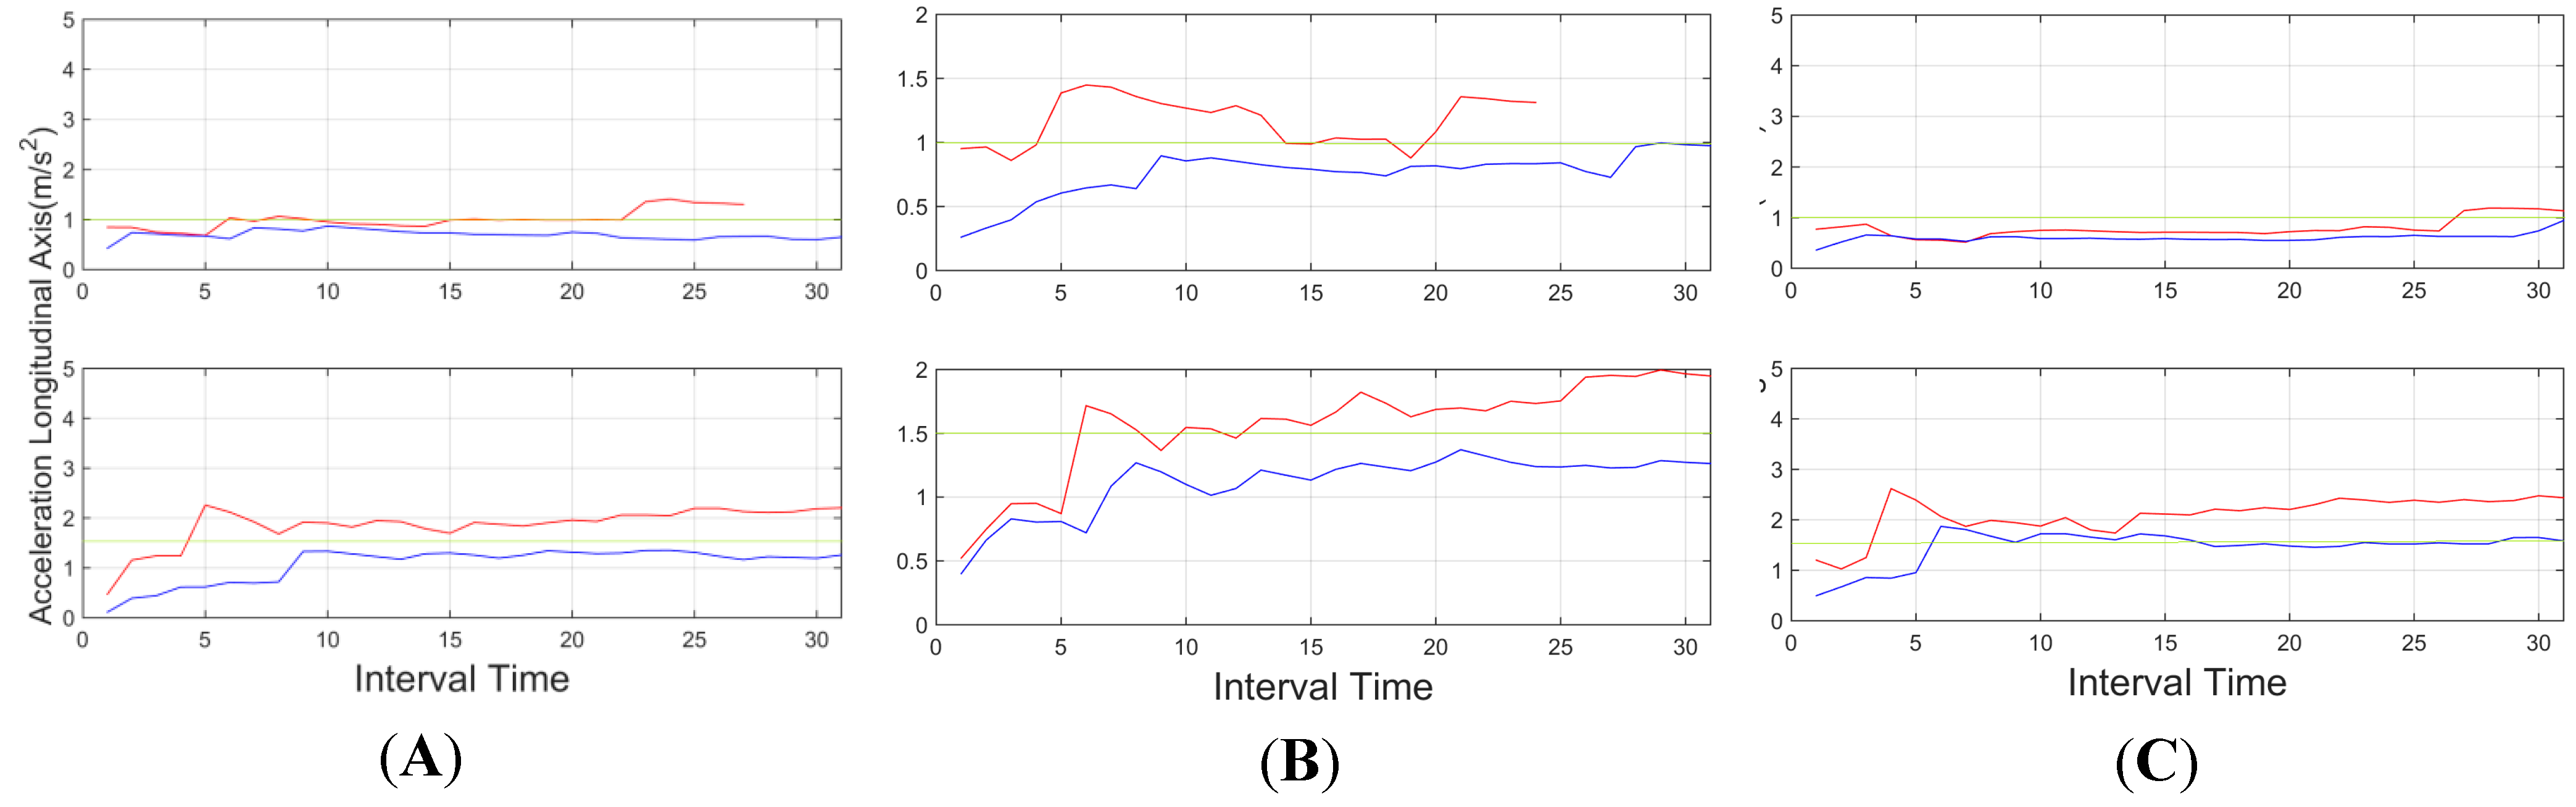
5.4.1. Maximum Recommended Acceleration
5.4.2. Maximum Allowed Speed
5.4.3. Urban/Interurban Location
6. Tests and Results
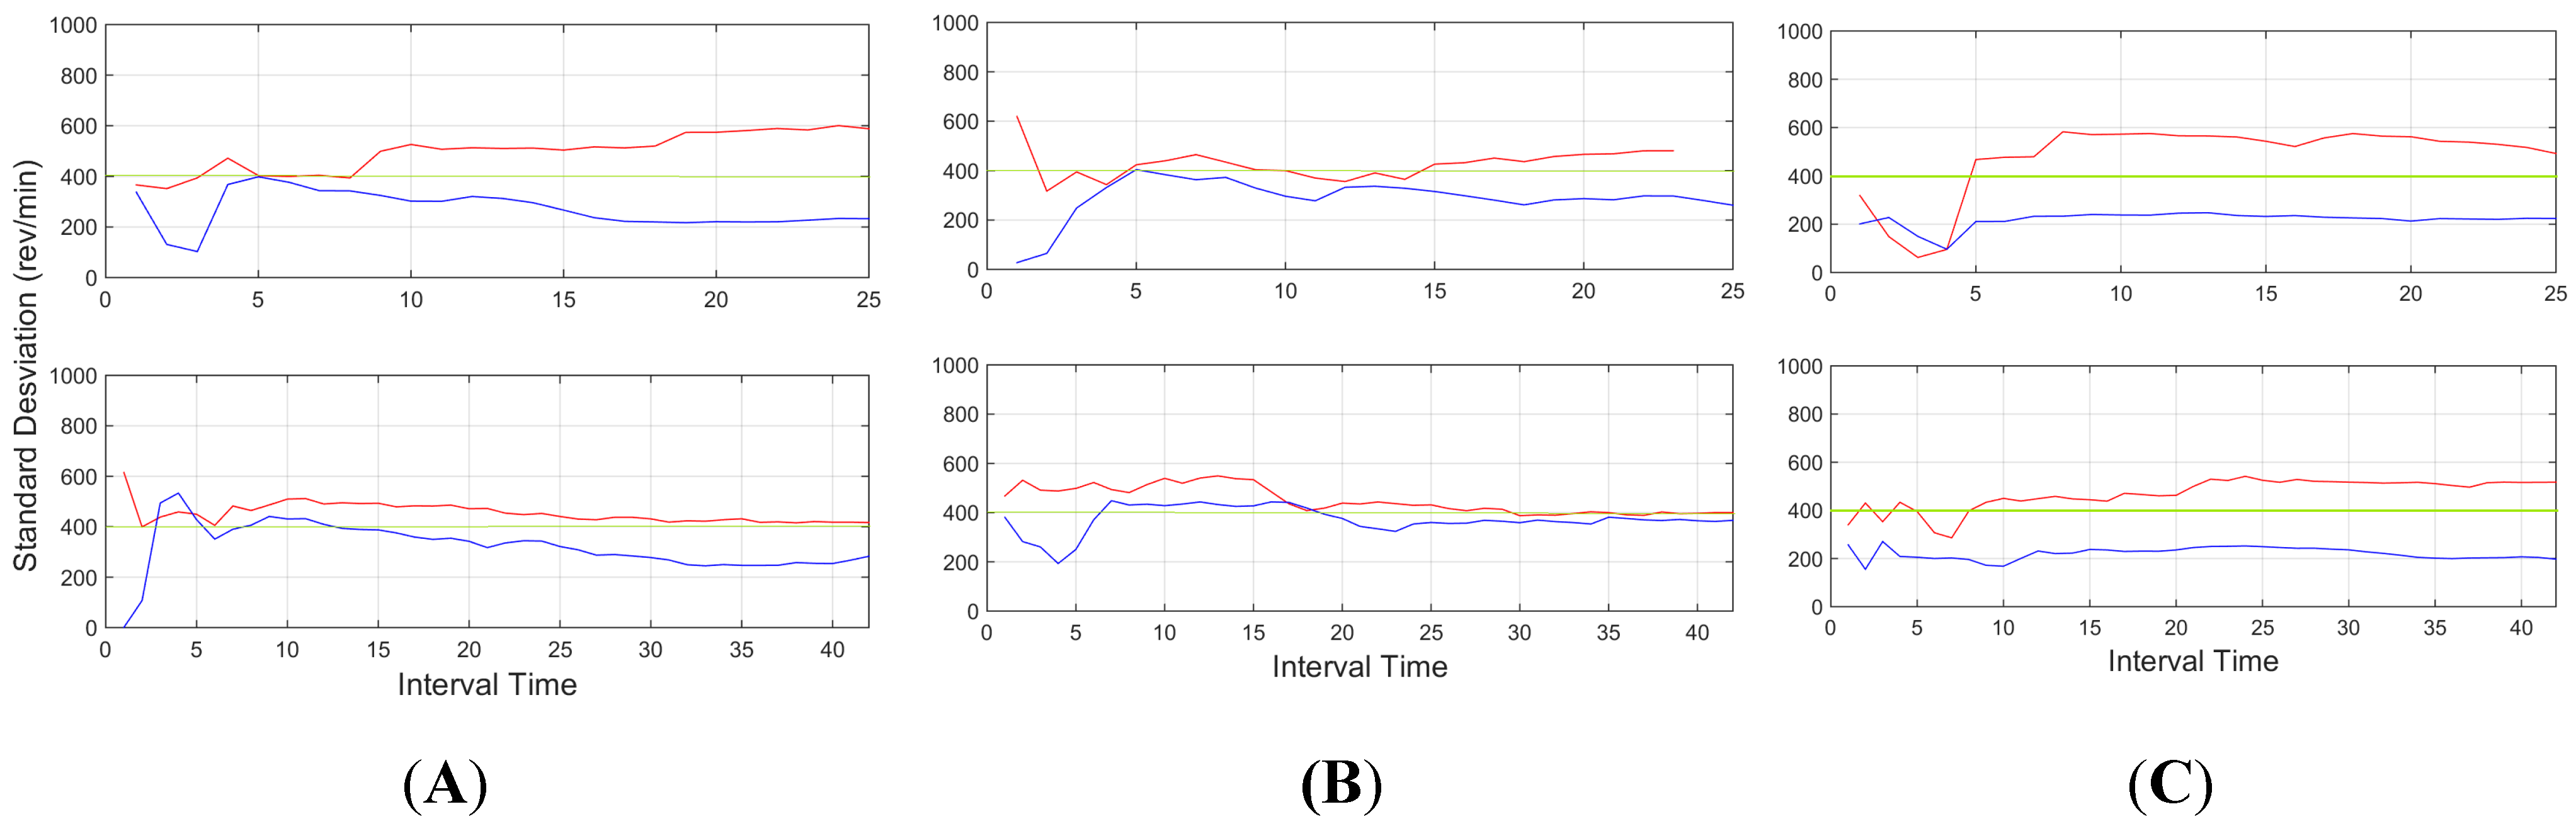
6.1. Configuration Tests

6.2. Field Tests

7. Conclusions
Acknowledgments
Author Contributions
Conflicts of Interest
References
- European Comission. Mobility and Transport. Statistics. Available online: http://ec.europa.eu/transport/road_safety/index_en.htm. (accessed on 12 October 2015).
- Pelaez, C.; Garcia, F.; de la Escalera, A.; Armingol, J.M. Driver Monitoring Based on Low-Cost 3-D Sensors. IEEE Trans. Intell. Transp. Syst. 2014, 14, 1855–1860. [Google Scholar] [CrossRef]
- Heo, J.; Savvides, M. Rapid 3D Face Modeling Using a Frontal Face and a Profile Face for Accurate 2D Pose Synthesis. In Proceedings of the IEEE International Conference on Automatic Face & Gesture Recognition and Workshops (FG 2011), Santa Barbara, CA, USA, 21–25 March 2011; pp. 632–638.
- Murphy-Chutorian, E.; Trivedi, M.M. Head Pose Estimation and Augmented Reality Tracking: An Integrated System and Evaluation for Monitoring Driver Awareness. IEEE Trans. Intell. Transp. Syst. 2010, 11, 300–311. [Google Scholar] [CrossRef]
- Oyini Mbouna, R.; Kong, S.G.; Chun, M.G. Visual Analysis of Eye State and Head Pose for Driver Alertness Monitoring. IEEE Trans. Intell. Transp. Syst. 2013, 14, 1462–1469. [Google Scholar] [CrossRef]
- Garcia, I.; Bronte, S.; Bergasa, L.M.; Almazan, J.; Yebes, J. Vision-Based Drowsiness Detector for Real Driving Conditions. In Proceedings of the IEEE 2012 Intelligent Vehicles Symposium (IV), Madrid, Spain, 3–7 June 2012; pp. 618–623.
- Li, X.; Seignez, E.; Loonis, P. Vision-based Estimation of Driver Drowsiness with ORD Model Using Evidence Theory. In Proceedings of the IEEE 2013 Intelligent Vehicles Symposium (IV), Gold Coast, Australia, 23–26 Junuary 2013; pp. 666–671.
- Seeingmachines. Available online: http://www.seeingmachines.com/ (accessed on 10 October 2014).
- Smarteye. Available online: http://www.smarteye.se/ (accessed on 10 October 2014).
- Papadelis, C.; Lithari, C.; Kourtidou-Papadeli, C.; Bamidis, P.D.; Portouli, E.; Bekiaris, E. Monitoring Driver’s Sleepiness on-Board for Preventing Road Accidents. Stud. Health Technol. Inform. 2009, 150, 485–489. [Google Scholar] [PubMed]
- Wakita, T.; Ozawa, K.; Miyajima, C.; Igarashi, K.; Itou, K.; Takeda, K.; Itakura, F. Driver Identification Using Driving Behavior Signals. In Proceedings of the IEEE 2005 Conference on Intelligent Transportation Systems, Vienna, Austria, 13–15 September 2005.
- Takei, Y.; Furukawa, Y. Estimate of Driver’s Fatigue Through Steering Motion. In Proceedings of the 2005 IEEE International Conference on Systems, Man and Cybernetics, Waikoloa, HI, USA, 10–12 October 2005; pp. 1765–1770.
- Krajewski, J.; Golz, M.; Schnieder, S.; Schnupp, T.; Heinze, C.; Sommer, D. Detecting Fatigue from Steering Behaviour Applying Continuous Wavelet Transform. In Proceedings of the 7th International Conference on Methods and Techniques in Behavioral Research, Eindhoven, The Netherlands, 24–27 August 2010.
- Choi, S.; Kim, J.; Kwak, D.; Angkititrakul, P.; Hansen, J.H.L. Analysis and Classification of Driver Behavior Using in-Vehicle CAN-BUS Information. Bienn. Workshop DSP In-Veh. Mob. Syst. 2007, 17–19. [Google Scholar]
- Al-Doori, M.; Paluszczyszyn, D.; Elizondo, D.; Passow, B.; Goodyer, E. Range Extended for Electric Vehicle Based on Driver Behaviour Recognition. In Proceedings of the Hybrid and Electric Vehicles Conference (HEVC 2014), London, UK, 5–6 November 2014; pp. 1–7.
- Johnson, D.A.; Trivedi, M.M. Driving Style Recognition Using a Smartphone as a Sensor Platform. In Proceedings of the IEEE Conference on Intelligent Transportation Systems, ITSC, Washington, DC, USA, 5–7 October 2011; pp. 1609–1615.
- Castignani, G.; Derrmann, T.; Frank, R.; Engel, T. Driver Behavior Profiling Using Smartphones: A Low-Cost Platform for Driver Monitoring. Intel. Transp. Syst. Mag. 2015, 7, 91–102. [Google Scholar] [CrossRef]
- Diaz Alvarez, A.; Serradilla Garcia, F.; Naranjo, J.E.; Anaya, J.J.; Jimenez, F. Modeling the Driving Behavior of Electric Vehicles Using Smartphones and Neural Networks. Intel. Transp. Syst. Mag. 2014, 6, 44–53. [Google Scholar] [CrossRef]
- Eren, H.; Makinist, S.; Akin, E.; Yilmaz, A. Estimating Driving Behavior by a Smartphone. In Proceedings of the IEEE Intelligent Vehicles Symposium, Madrid, Spain, 3–7 June 2012; pp. 234–239.
- Li, N.; Jain, J.J.; Busso, C. Modeling of Driver Behavior in Real World Scenarios Using Multiple Noninvasive Sensors. IEEE Trans. Multimed. 2013, 15, 1213–1225. [Google Scholar] [CrossRef]
- Jain, J.J.; Busso, C. Analysis of Driver Behaviors During Common Tasks Using Frontal Video Camera and CAN-BUS Information. In Proceedings of the IEEE International Conference on Multimedia and Expo, Barcelona, Spain, 11–15 July 2011.
- Martín, D.; García, F.; Musleh, B.; Olmeda, D.; Peláez, G.; Marín, P.; Ponz, A.; Rodríguez, C.; Al-Kaff, A.; de la Escalera, A.; et al. IVVI 2.0: An Intelligent Vehicle Based on Computational Perception. Expert Syst. Appl. 2014, 41, 7927–7944. [Google Scholar] [CrossRef]
- Martí, E.D.; Martín, D.; García, J.; de la Escalera, A.; Molina, J.M.; Armingol, J.M. Context-aided sensor fusion for enhanced urban navigation. Sensors 2012, 12, 16802–16837. [Google Scholar] [CrossRef] [PubMed]
- Hoberock, L.L. A Survey of Longitudinal Acceleration Comfort Studies in Ground Transportation Vehicles. J. Dyn. Syst. Meas. Control 1977, 99, 76–84. [Google Scholar] [CrossRef]
© 2015 by the authors; licensee MDPI, Basel, Switzerland. This article is an open access article distributed under the terms and conditions of the Creative Commons Attribution license (http://creativecommons.org/licenses/by/4.0/).
Share and Cite
Carmona, J.; García, F.; Martín, D.; Escalera, A.D.l.; Armingol, J.M. Data Fusion for Driver Behaviour Analysis. Sensors 2015, 15, 25968-25991. https://doi.org/10.3390/s151025968
Carmona J, García F, Martín D, Escalera ADl, Armingol JM. Data Fusion for Driver Behaviour Analysis. Sensors. 2015; 15(10):25968-25991. https://doi.org/10.3390/s151025968
Chicago/Turabian StyleCarmona, Juan, Fernando García, David Martín, Arturo De la Escalera, and José María Armingol. 2015. "Data Fusion for Driver Behaviour Analysis" Sensors 15, no. 10: 25968-25991. https://doi.org/10.3390/s151025968