A Novel HMM Distributed Classifier for the Detection of Gait Phases by Means of a Wearable Inertial Sensor Network


Abstract
: In this work, we decided to apply a hierarchical weighted decision, proposed and used in other research fields, for the recognition of gait phases. The developed and validated novel distributed classifier is based on hierarchical weighted decision from outputs of scalar Hidden Markov Models (HMM) applied to angular velocities of foot, shank, and thigh. The angular velocities of ten healthy subjects were acquired via three uni-axial gyroscopes embedded in inertial measurement units (IMUs) during one walking task, repeated three times, on a treadmill. After validating the novel distributed classifier and scalar and vectorial classifiers-already proposed in the literature, with a cross-validation, classifiers were compared for sensitivity, specificity, and computational load for all combinations of the three targeted anatomical segments. Moreover, the performance of the novel distributed classifier in the estimation of gait variability in terms of mean time and coefficient of variation was evaluated. The highest values of specificity and sensitivity (>0.98) for the three classifiers examined here were obtained when the angular velocity of the foot was processed. Distributed and vectorial classifiers reached acceptable values (>0.95) when the angular velocity of shank and thigh were analyzed. Distributed and scalar classifiers showed values of computational load about 100 times lower than the one obtained with the vectorial classifier. In addition, distributed classifiers showed an excellent reliability for the evaluation of mean time and a good/excellent reliability for the coefficient of variation. In conclusion, due to the better performance and the small value of computational load, the here proposed novel distributed classifier can be implemented in the real-time application of gait phases recognition, such as to evaluate gait variability in patients or to control active orthoses for the recovery of mobility of lower limb joints.
1. Introduction
The identification of events and phases in the human gait is an essential starting point for: (i) assessing the degree of recovery in walking ability in patients after interventions or rehabilitation treatments [1,2]; (ii) classifying the activity of daily living, including the overall health status of individuals [3,4]; and (iii) controlling synchronously active orthoses and exoskeletons for the recovery of lower limb mobility [5].
Several approaches and technologies have been developed in order to detect gait phases. Motion capture systems based on marker tracking and six-component force platforms still represent the gold standard for extracting gait patterns [6–10]. Alternatively, the detection of human motion can be evaluated by means of self-contained wearable systems, which do not rely on camera-based systems and can be also used outdoors for continuous data logging. The most used sensors are: wireless pressure sensing shoe insoles [11,12], shoe-mounted foot switches [13], smart textiles [14], accelerometers [15], gyroscopes [5,16,17], and the composite inertial measurement unit system IMU [18,19]. The cited references represent a few of the numerous works available in the literature.
Computational methodologies for gait phase detection fall into two major categories. Firstly, the post-processing analysis uses algorithms which partition the gait phases through the threshold selection of raw data [20–22]. Secondly, the procedure is based on matching-learning schemes which extract patterns on the basis of Support Vector Machines (SVM) [23], Linear Discriminant Analysis (LDA) [24], Gaussian Mixture Model (GMM) [25], and, finally, Hidden Markov Model (HMM) [5,16,26,27]; this procedure recently received a great deal of interest for its potential better performance. From a comparative examination of the matching-learning schemes, Mannini and Sabatini [26] have shown higher performance for HMM than SVM, GMM, and LDA in the recognition of seven different motor activities, using a classification method based on the analysis of outputs from four tri-axial linear accelerometers placed on hip, wrist, ankle, and thigh. The authors demonstrated that HMM is characterized by the highest values of accuracy, sensitivity and specificity. Abaid et al. [5] proved the applicability of a scalar HMM based on data from a uni-axial gyroscope to control powered orthoses worn by children, testing the HMM both in either normally developed children or children with hemiplegia. The algorithm proposed by the authors showed a sensitivity and specificity higher than 0.95 in the detection of gait phases.
In the case of a sensor network, hierarchical classifiers based on data-fusion processing were implemented after matching-learning algorithms in order to improve the performance [28] and robustness [29] of the classifiers. Kittler and colleagues [30] examined two methods of post-processing data based on the implementation of a hierarchical classification: Hierarchical Decision (HD) and Majority Voting (MV). The HD is based on giving more importance to the simple classifiers and then letting them decide first, due to their overall better performance. In the MV, however, the same opportunity is given to all the classifiers and the final decision is the one which obtains more votes. Briefly, the main limitations are: the HD is used only with a few decision classifiers; the MW is dependent on the effects of noisy environments, where a minority of high-accuracy decision entities can be hidden by a majority of weak-decision ones [28]. To overcome the above-mentioned limitations, several studies, in different research fields [28,31–35], introduced a Hierarchical Weighted Decision (HWD). HWD gives to all the entities the opportunity to collaborate in the decision making, while ranking the relative importance of each decision through the use of weights based on the individual performance of each entity. In particular, Banos et al. [28] demonstrated that the use of a hierarchical weighted decision allows to take the right decision in more cases with respect to HD and MV. However, this technique has not been applied, to the authors' knowledge, to detect gait phases.
From this perspective, we propose a novel HWD algorithm, called “Distributed Classifier” (DC), for the detection of gait phases in real-time applications. DC is based on the processing, by means of HMM, of two or more outputs gathered by uni-axial gyroscopes placed on different body segments of lower limbs. The goals of this study are two-fold. Firstly, we seek to answer the question of whether the DC can be used to detect gait phases. Secondly, we investigate whether the DC can be implemented in real-time applications, such as the control of active orthoses for the recovery of the mobility of lower limb joints. To validate the novel classifier we computed sensitivity, specificity and computational load and comparatively examined them with the values obtained with two classifiers based on scalar (SC) and vectorial (VC) HMM [36] that were already proposed and validated in gait detection.
2. Material and Methods
2.1. Theoretical Approach
In the present work, a new gait phase distributed classifier (DC), based on a Hidden Markov Model (HMM), is analyzed. In order to describe the DC, a short description of the scalar and vectorial HMM classifiers (SC and VC, respectively) follows.
2.1.1. Hidden Markov Model
HMM is a powerful statistical model for classification of time series [37,38]. HMM is defined as a doubly embedded stochastic process with an underlying process that is not observable, i.e., it is hidden. The hidden process can only be observed through another set of stochastic processes that produce the sequence of observations [36].
The set of the Q model states, and the set of the actual N model states as a function of time are, respectively:
The observation Y at time tn is thevector of M acquired signals which are emitted by the current state output at timetn. The vector Y is:
HMM can be written as a set λ of three parameters A, B, and π:
A is the probability distribution matrix of the state transitions:
B is the probability distribution matrix associated with the M-size set of the Y observations at the state Si:
Moving to a continuous HMM (cHMM), the previous probability can be computed hypothesizing a normal distribution:
where wjk is, for each state j, amixture coefficient, weighting K multivariate normal distributions N, with mean μjk and covariance matrix expressed by ΣMxM = {Σjk}.π is the initial state vector distribution:
The use of a cHMM as a feature classifier requires the two following phases. The first phase consists in the collection of a training data-set for the computation of the model parameters λ. The Baum-Welch algorithm [36], which is popular for tackling this problem, is used in the present paper.
The second phase, based on the results obtained during the first phase, allows featureclassification. The Viterbi algorithm is the best candidate for the classification and we adopted a“forward-only” modification of this method to obtain real-time processing[5]. The“forward-only” is applied to each signal in order to find the l-th state of likely sequence ltn and the probability associated at each i-th state γtn (i); in particular the algorithm is composed of three steps, as following:
Initialization
Recursion
Likely sequence
2.1.2. Scalar (SC) and Vectorial Classifiers (VC)
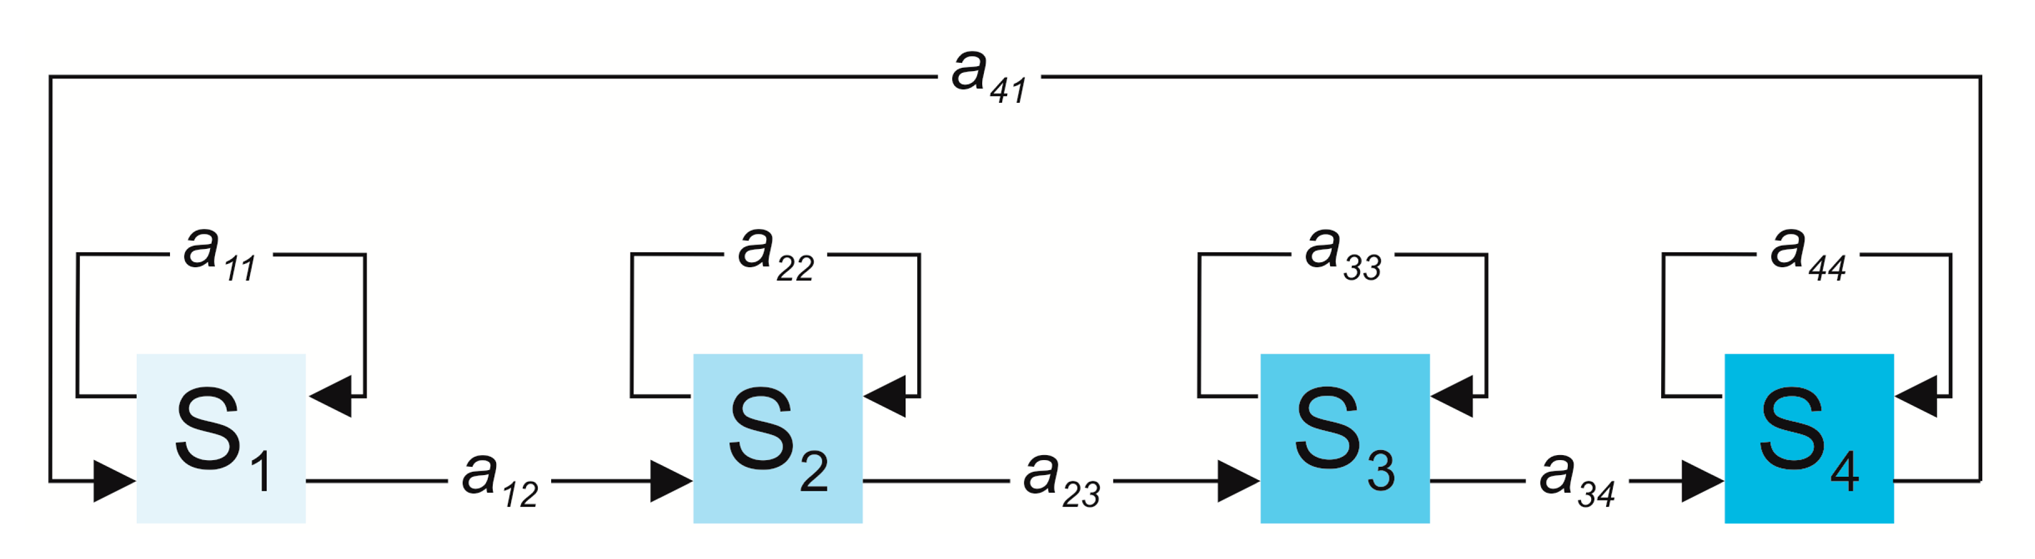
Gait cycle is generally divided in four gait phases, Flat Foot, Heel Off, Swing, and Heel Strike, which represent the hidden states of here adopted cHMM [5,16]; in normal gait, walking phases occur following the above-reported sequence. State transitions follow a left-right model and, consequently, transition matrix A, implemented in the present study, is [5]:
Since transitions are very quick with respect to the gait cycle, they are less frequent in the current state sequence; thus, diagonal elements assume higher values than the others [13] and in Figure 1 the possible transitions among gait phases are reported.
Because the initial state of the model at time t0 is not known, its distribution can be chosen as:
This means that each state has the same probability of being the first in a state sequence.
The VC is based on a multivariate Normal distribution:
Y(tn) is the observation value [1 × M];
μ(tn) is the vector of mean values [1 × M];
Σ(tn) is the covariance matrix [M × M].
When cHMM is applied to one signal (M = 1), the VC is coincident with the SC. SC is based on a univariate Normal distribution and the Equation (13) can be rewritten as:
By applying the “forward-only” algorithm proposed by Abaid etal. [5] to SC andVC, two parameters are calculated: (i) the most likely sequence of states (LSC and LVC), composed of each likely state l(tn) at time tn; (ii) the probability associated at each l-th state ( and ).
2.1.3. Distributed Classifier (DC)
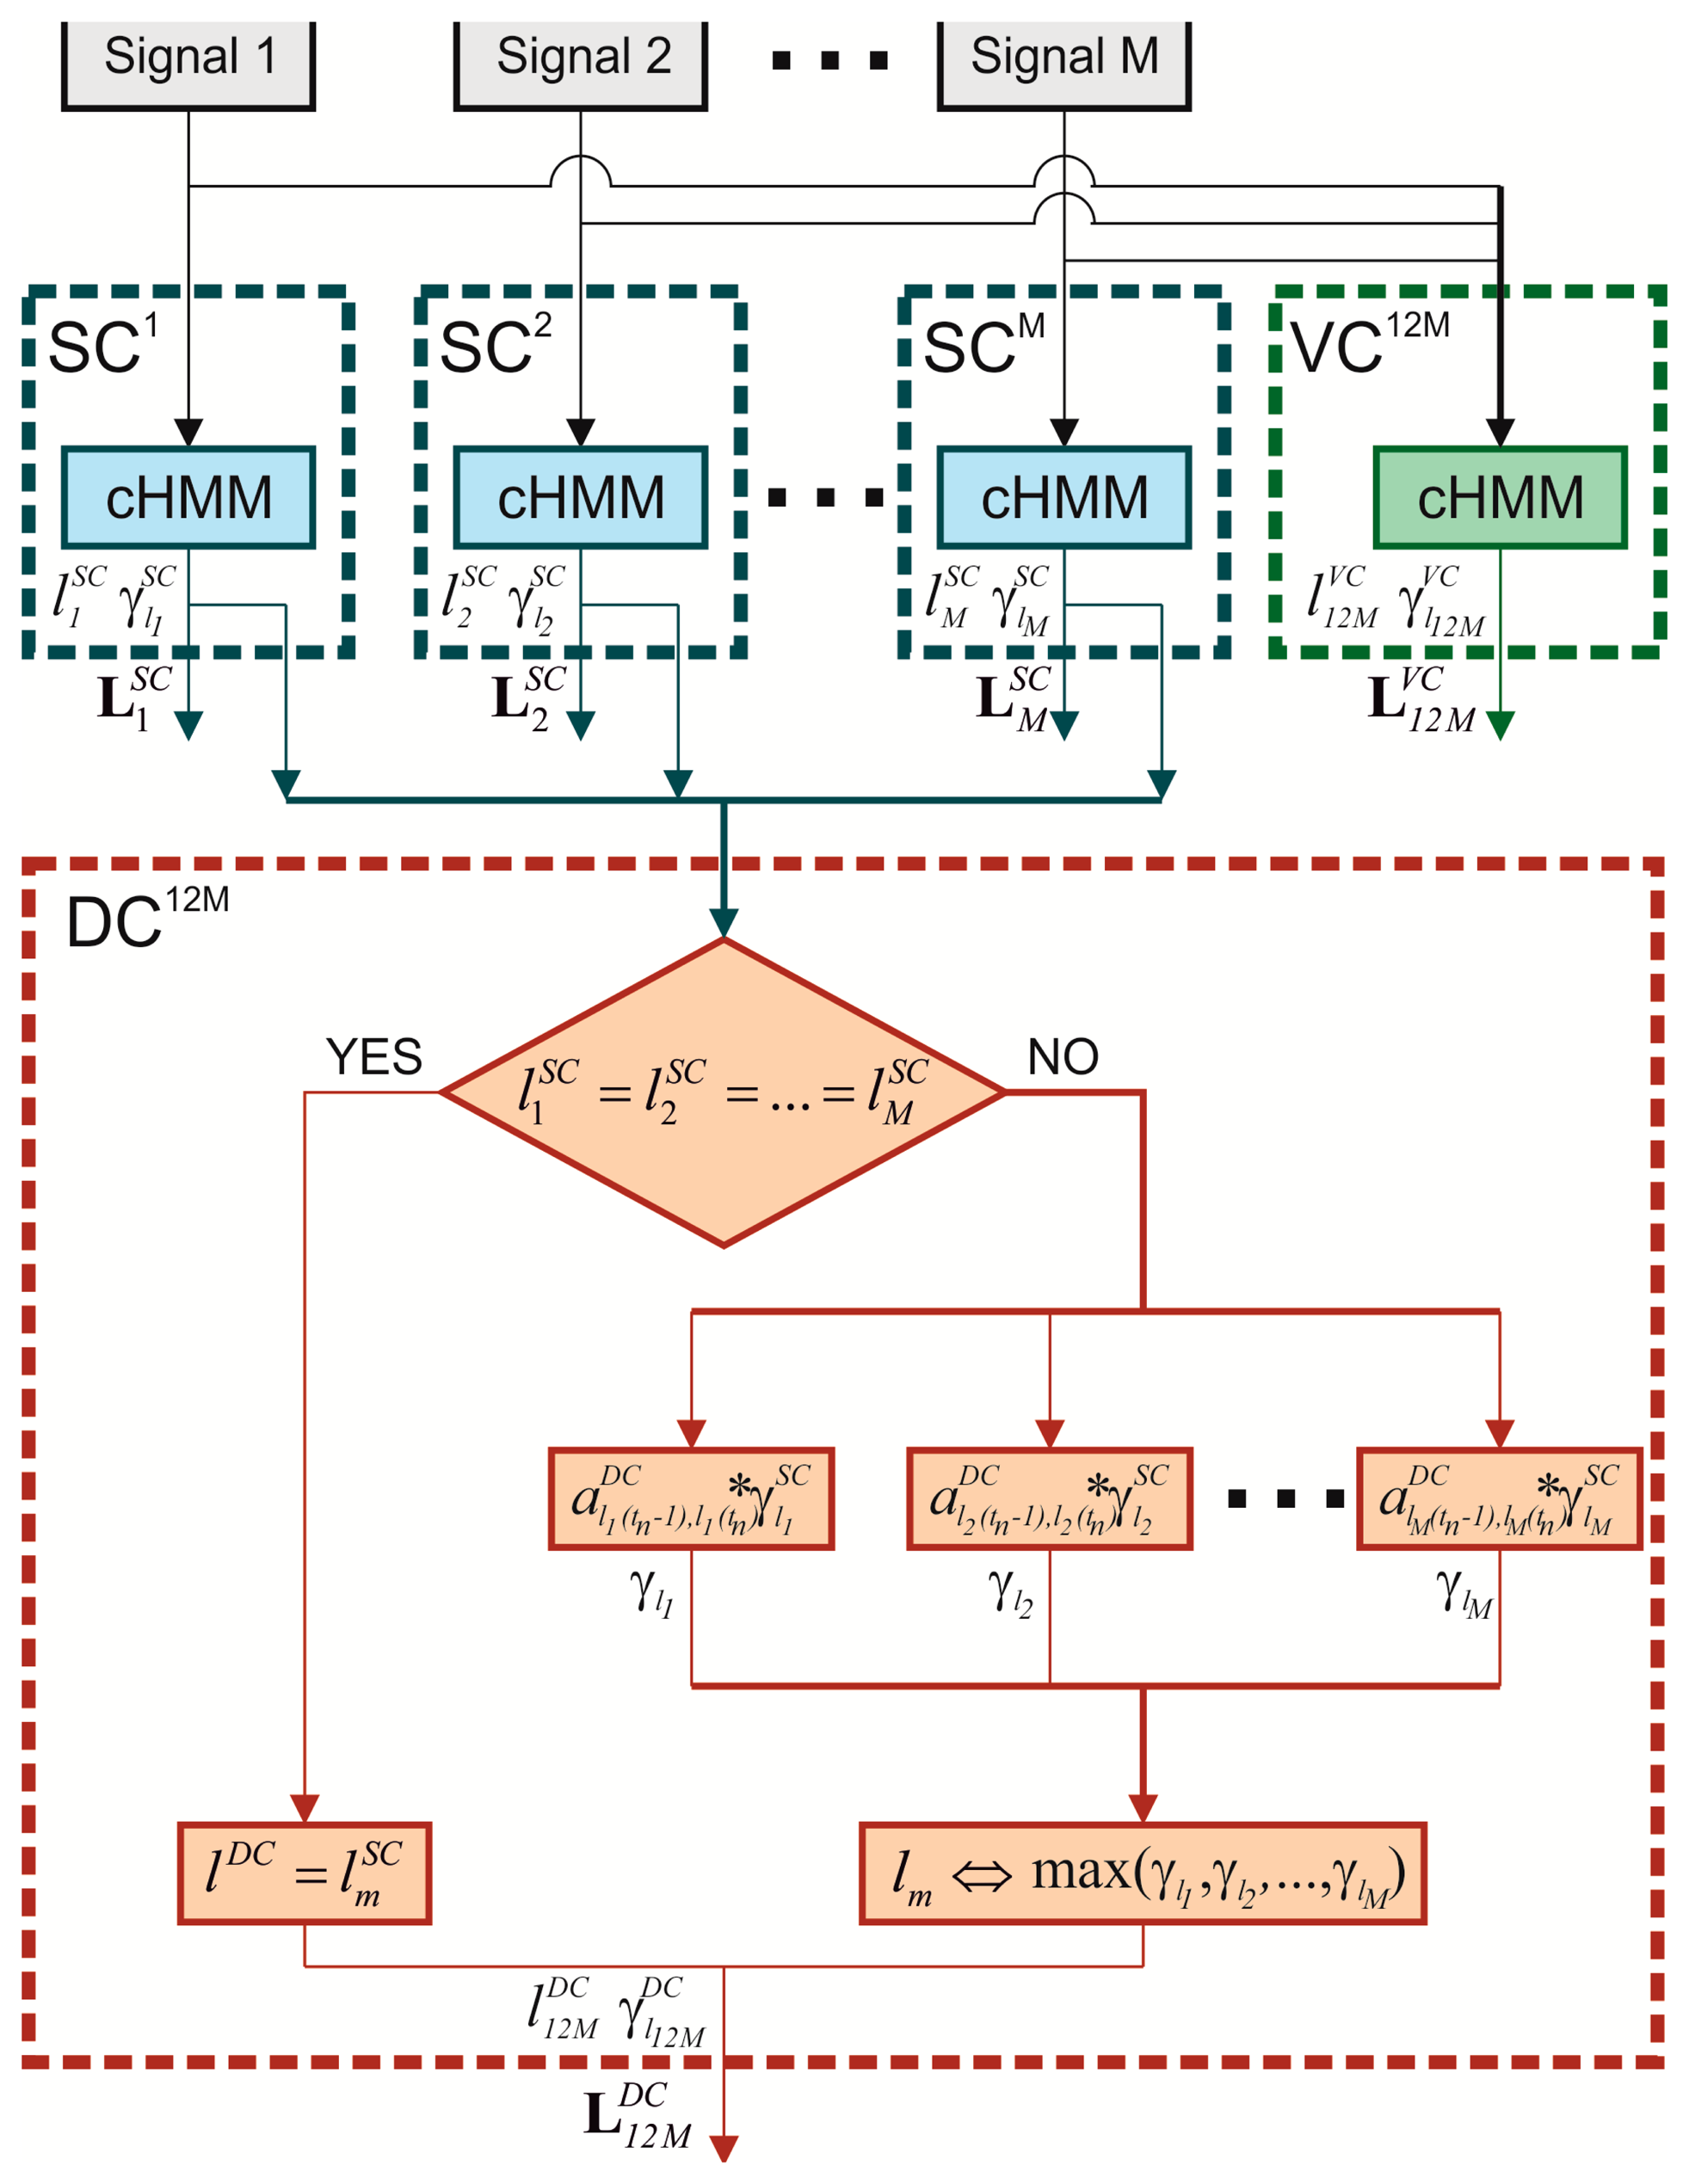
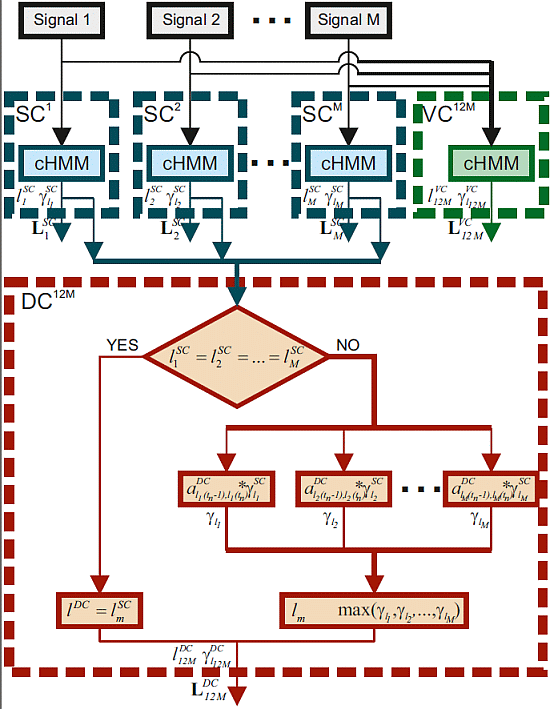
The novel contribution of the present study is the implementation of a new algorithm to detect gait phases based on a distributed stochastic model and on a hierarchical-weighted classification. The algorithm, as shown in Figure 2, is based on the processing of each LSC simultaneously obtained from more than one sensor in order to obtain the final likely sequence of states LDC.
Taking into account a number of signals equal to M, for each timetn and each signal m, the DC compares each state following the above if-structure:
If
Conversely, if at least a disagreement is found at tn, for each m signal, a new probability is calculated by the introduction of a distributed transition matrix :
Then, lDC(tn) is equal to which is obtained by the m-th signal characterized by the maximumvalue of γlm (tn).
By means of the repetition of the if-structure for each t, the final likely sequence of states LDC can be individuated. The performance of the algorithm is strictly related to the choice of the distributed transition matrix ADC implemented in the distributed classifier.
2.2. Experimental Procedure
Ten healthy subjects (26.2 ± 23.1 years), who had no known gait or other pathologies influencing their walking patterns, were enrolled in this study at the Movement Analysis and Robotics Laboratory (MARlab) of the Bambino Gesù Children's Hospital. Informed consent, in written form, was obtained from the participants. The Research Ethics and Medical Board of the Bambino Gesù Children's Hospital approved the experimental protocol. The protocol conforms to the ethical standards outlined in the 1964 Declaration of Helsinki.
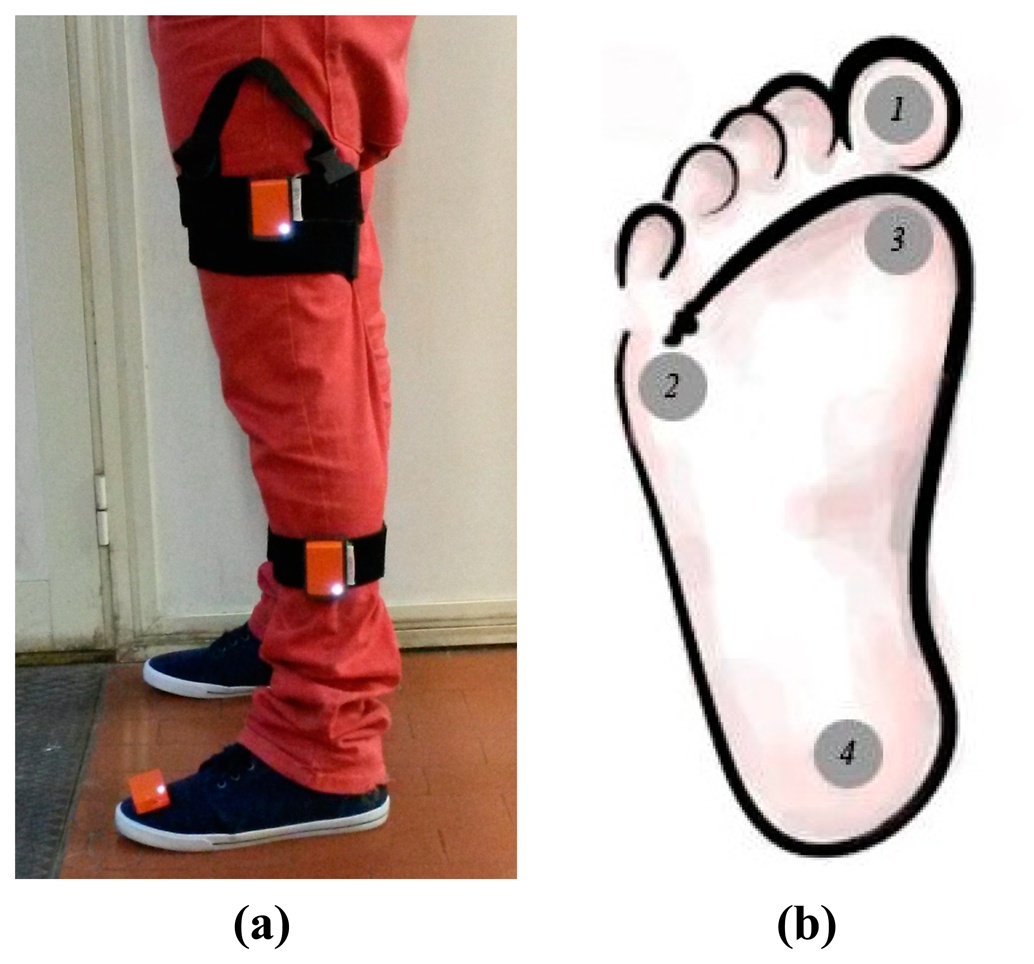
The participants' left lower limb was equipped with three Inertial Measurement Units (XBus Master, Xsens Technologies, The Netherland) on foot, shank, and thigh, as reported in Figure 3, and four footswitch sensors (Footswitch FSR sensors, Wave Cometa, Italy) on the foot sole, at the toe, at the heel and at the first and fifth metatarsophalangeal articulations, as reported in Figure 3b. As regards the IMU system, only the outputs of gyroscopes were used for the post-processing.
Since only gyroscope data were acquired from IMU sensors, no particular procedure was needed for Kalman filter stabilization in order to limit the effects induced by indoor magnetic distortions [39]. An operator precisely positioned the sensors on the subject, by aligning one of their sensible axes with the sagittal axis of each body segment. This alignment methods is easier to be performed than a functional calibration procedure [40–42] and it gives better results when only one axis for each sensor has to be taken into account. Thus, we decided to use the manual alignment because we analyzed only the sagittal component of angular velocity.
Sagittal angular velocities of the three body segments were captured through the tri-axial gyroscope into each IMU at a frequency of 60 Hz, while the actual sequence of gait phases was captured by means of foot switches at a frequency of 2 kHz.
Participants were asked to perform a walking task on a treadmill for at least 120 s at their preferred speed, in the range of 0.5–1.5 m/s; this range was chosen to guarantee a normal pace and prevent fatigue [43]. Each subject self-selected the preferred velocity by walking on the treadmill during a preliminary session before the walking task. The mean value of the chosen treadmill speed was 0.81 ± 0.08 m/s for all the subjects involved in the study. The actual data acquisition began five seconds after reaching the speed chosen by the subject and ended five seconds before the turning off of the treadmill to prevent acquisition during the transient state. The task was repeated three times. Between trials, the subject remained on the treadmill in standing position. The entire experiment, including instrumentation, walking tasks, and de-instrumentation, was completed within one hour by all participants. All participants completed the tasks without expressing fatigue.
2.3. Data Processing
Data processing and data analysis were performed using MATLAB software (MathWorks, Natick, MA, USA) and a Sony Vaio with Windows 7 Home Premium 64 bit (IntelCore i5 2410 M, [email protected] Ghz, Minato, TKY, Japan). Each gait cycle was subdivided into four phases, which were used as the states of cHMM: Flat Foot, Heel Off, Swing, and Heel Strike. In particular, Flat Foot corresponds to the state where the foot sole is in contact with the floor; during the Heel Off phase the heel is not in contact with the floor; Swing occurs when the foot is in the air; Heel Strike corresponds to the state where only the heel is in contact with the floor. Each phase has been recognized by means of the identification of which foot switches were activated such as reported in Figure 4.
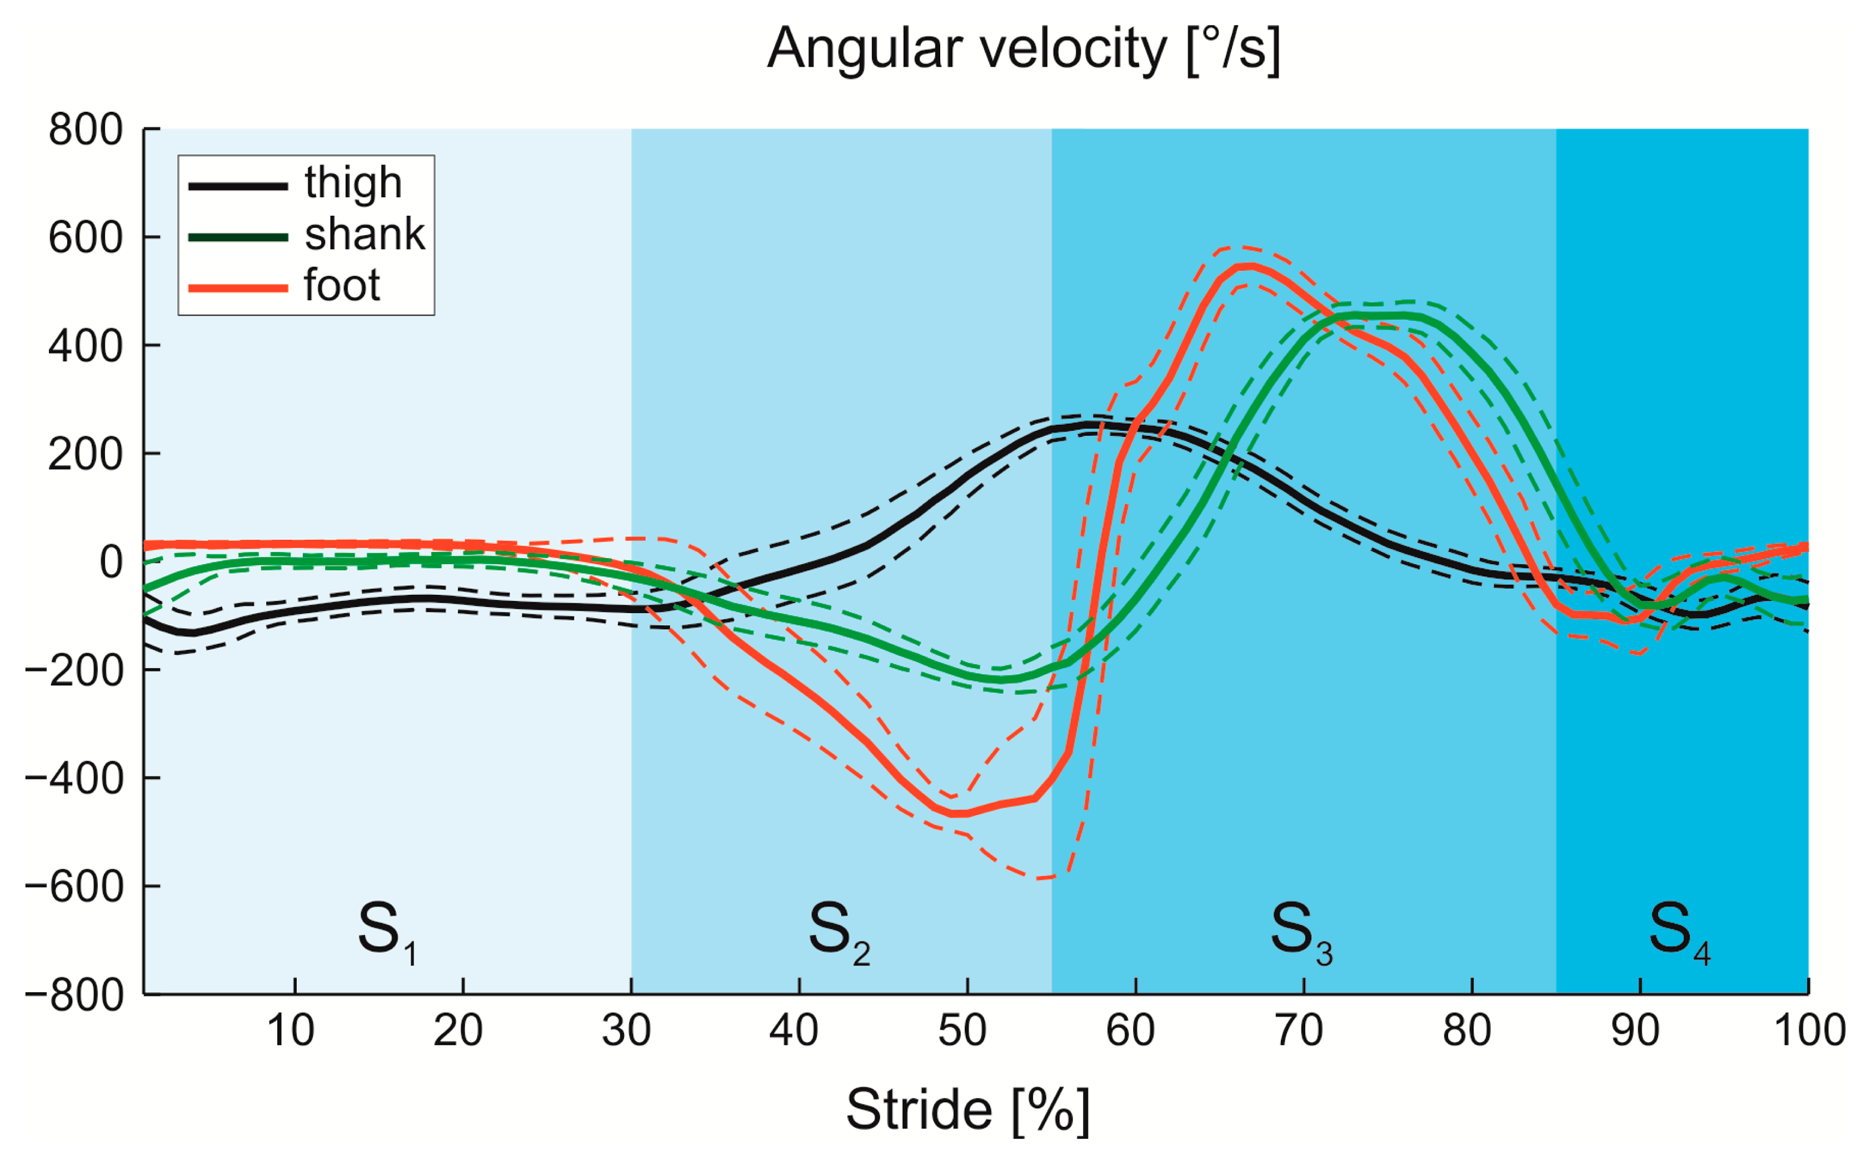
The output of the gyroscopes, which represents the observation Y of cHMM, was, firstly, treated with a low-pass Butterworth filter with 15 Hz cut-off frequency, and then partitioned into the four gait phases by means of the foot switch data [5]. After the normalization of the time length of each phase, mean and standard deviation of the angular velocities were calculated and used to train parameters of cHMM, according to the Baum-Welch algorithm. In Figure 5 the paradigmatic angular velocities of foot, shank and thigh are reported for one subject.
For each subject, a leave-one-out cross-validation analysis was applied to the three walking trials to validate cHMM in a recursive manner. Specifically, the model was trained by two trials, and the remaining one was used as the validation data. The procedure was repeated for all trials in turn [16]. After the data validation procedure, we obtained the likely state sequences LSC, LVC, and LDC for the three here examined classifiers. We chose a leave-one-out cross-validation because it is a model validation technique frequently used to estimate the generalization and capabilities of a classifier [44].
2.4. Data Analysis
The choice of the number of sensors and the body segments where the sensors were placed-foot (f), shank (s), and thigh (t)-allowed us to compare the performance of 11 classifiers: a cluster of three Scalar Classifiers (SCf, SCs, and SCt); a cluster of four Vectorial Classifiers (VCfs, VCft, VCst, and VCfst); and finally, a cluster of four Distributed Classifiers (DCfs, DCft, DCst, and DCfst).
We computed True Positive Rate (TPR) and True Negative Rate (TNR) relative to each of the three classifiers here examined, assuming the foot switch signals as a reference [5,16]. TPR and TNR represent the sensitivity and specificity of the classifier in the detection of gait phases. In particular, the phase transitions that are similarly detected by classifier and reference signal were considered as a True Positive, otherwise they were considered as a False Positive. The non-transitions that are similarly detected by classifier and reference signal were considered as a True Negative, otherwise as a False Negative. TPR and TNR are defined as:
Both indices were calculated using a tolerance window of 60 ms centered at each time step [5,45].
To estimate the weight of each sensor in the hierarchical classification of Distributed Classifier DC, a Decision Index was calculated. It represents how many times each sensor took the final decision in DC and it was expressed as a percentage of the total number of possible decisions. Decision Index was calculated for the four combinations of DC and for all subjects, then mean and standard deviation values were calculated.
To estimate the time processing required for each classifier in order to recognize the gait phases, the Computational Load was calculated as the time spent by each classifier to estimate a state Si of the state sequence. Computational Load was calculated for all the classifiers and for all subjects, consequently mean and standard deviation values were calculated.
To estimate the performance of DCs to evaluate the gait variability, we calculated Mean Time (MT) and Coefficient of Variation (CoV) of stride and of each gait phase. For the computation of the previous two indices, firstly the sequences of state, which are the outputs of DCs, were partitioned into the corresponding gait phases, then mean (MT) and standard deviation (std) of stride time and of each phase duration were evaluated for each walking task and for each subject. CoV [46] is defined as:
MT and CoV were also calculated for the reference signal (FSR) in order to compare them with the ones obtained from DCs.
2.5. Statistical Analysis
All data were tested for normality with the Shapiro-Wilk test. One-way ANOVA tests were conducted in order to find noteworthy differences among the 11 classifiers both for TPR and TNR. Differences among FSR and DCs in the evaluation of MT and CoV were also analyzed with one-way ANOVA tests. Statistical difference was set at 0.05. When significant differences were found, a Bonferroni's test for multiple comparisons was performed. Furthermore, to evaluate reliability Intra-class Correlation Coefficients (ICC) for MT and CoV were calculated. In accordance with literature [47], values in the range 0.0–0.4 were considered poor, 0.40–0.59 fair, 0.60–0.74 good, and 0.75–1.00 to be excellent.
The software package SPSS (IBM-SPSS Inc., Armonk, NY, USA) was used.
2.6. Preliminary Study for the Choice of the Matrix ADC
The selection of the distributed transition matrix ADC(Equation (17)) is crucial for the validation of the novel distributed classifier. The best ADC was chosen testing two different matrices. Firstly, we implemented a left-right model [36], where can be written as:
Secondly, we tested a matrix characterized by the possibility of passing from the current state to the previousone. This matrix, defined as Right-Left-Right, could be useful in the case where, due to a not negligible sensor noise, the actual state is misclassified and addressed as the following one. At the successive step of the algorithm, a simple left-right matrix would not allow going backwards, and, consequently, it determines a misclassification of the algorithm until the same transition phase in the next gait cycle occurs. A Right-Left-Right model can be written as:
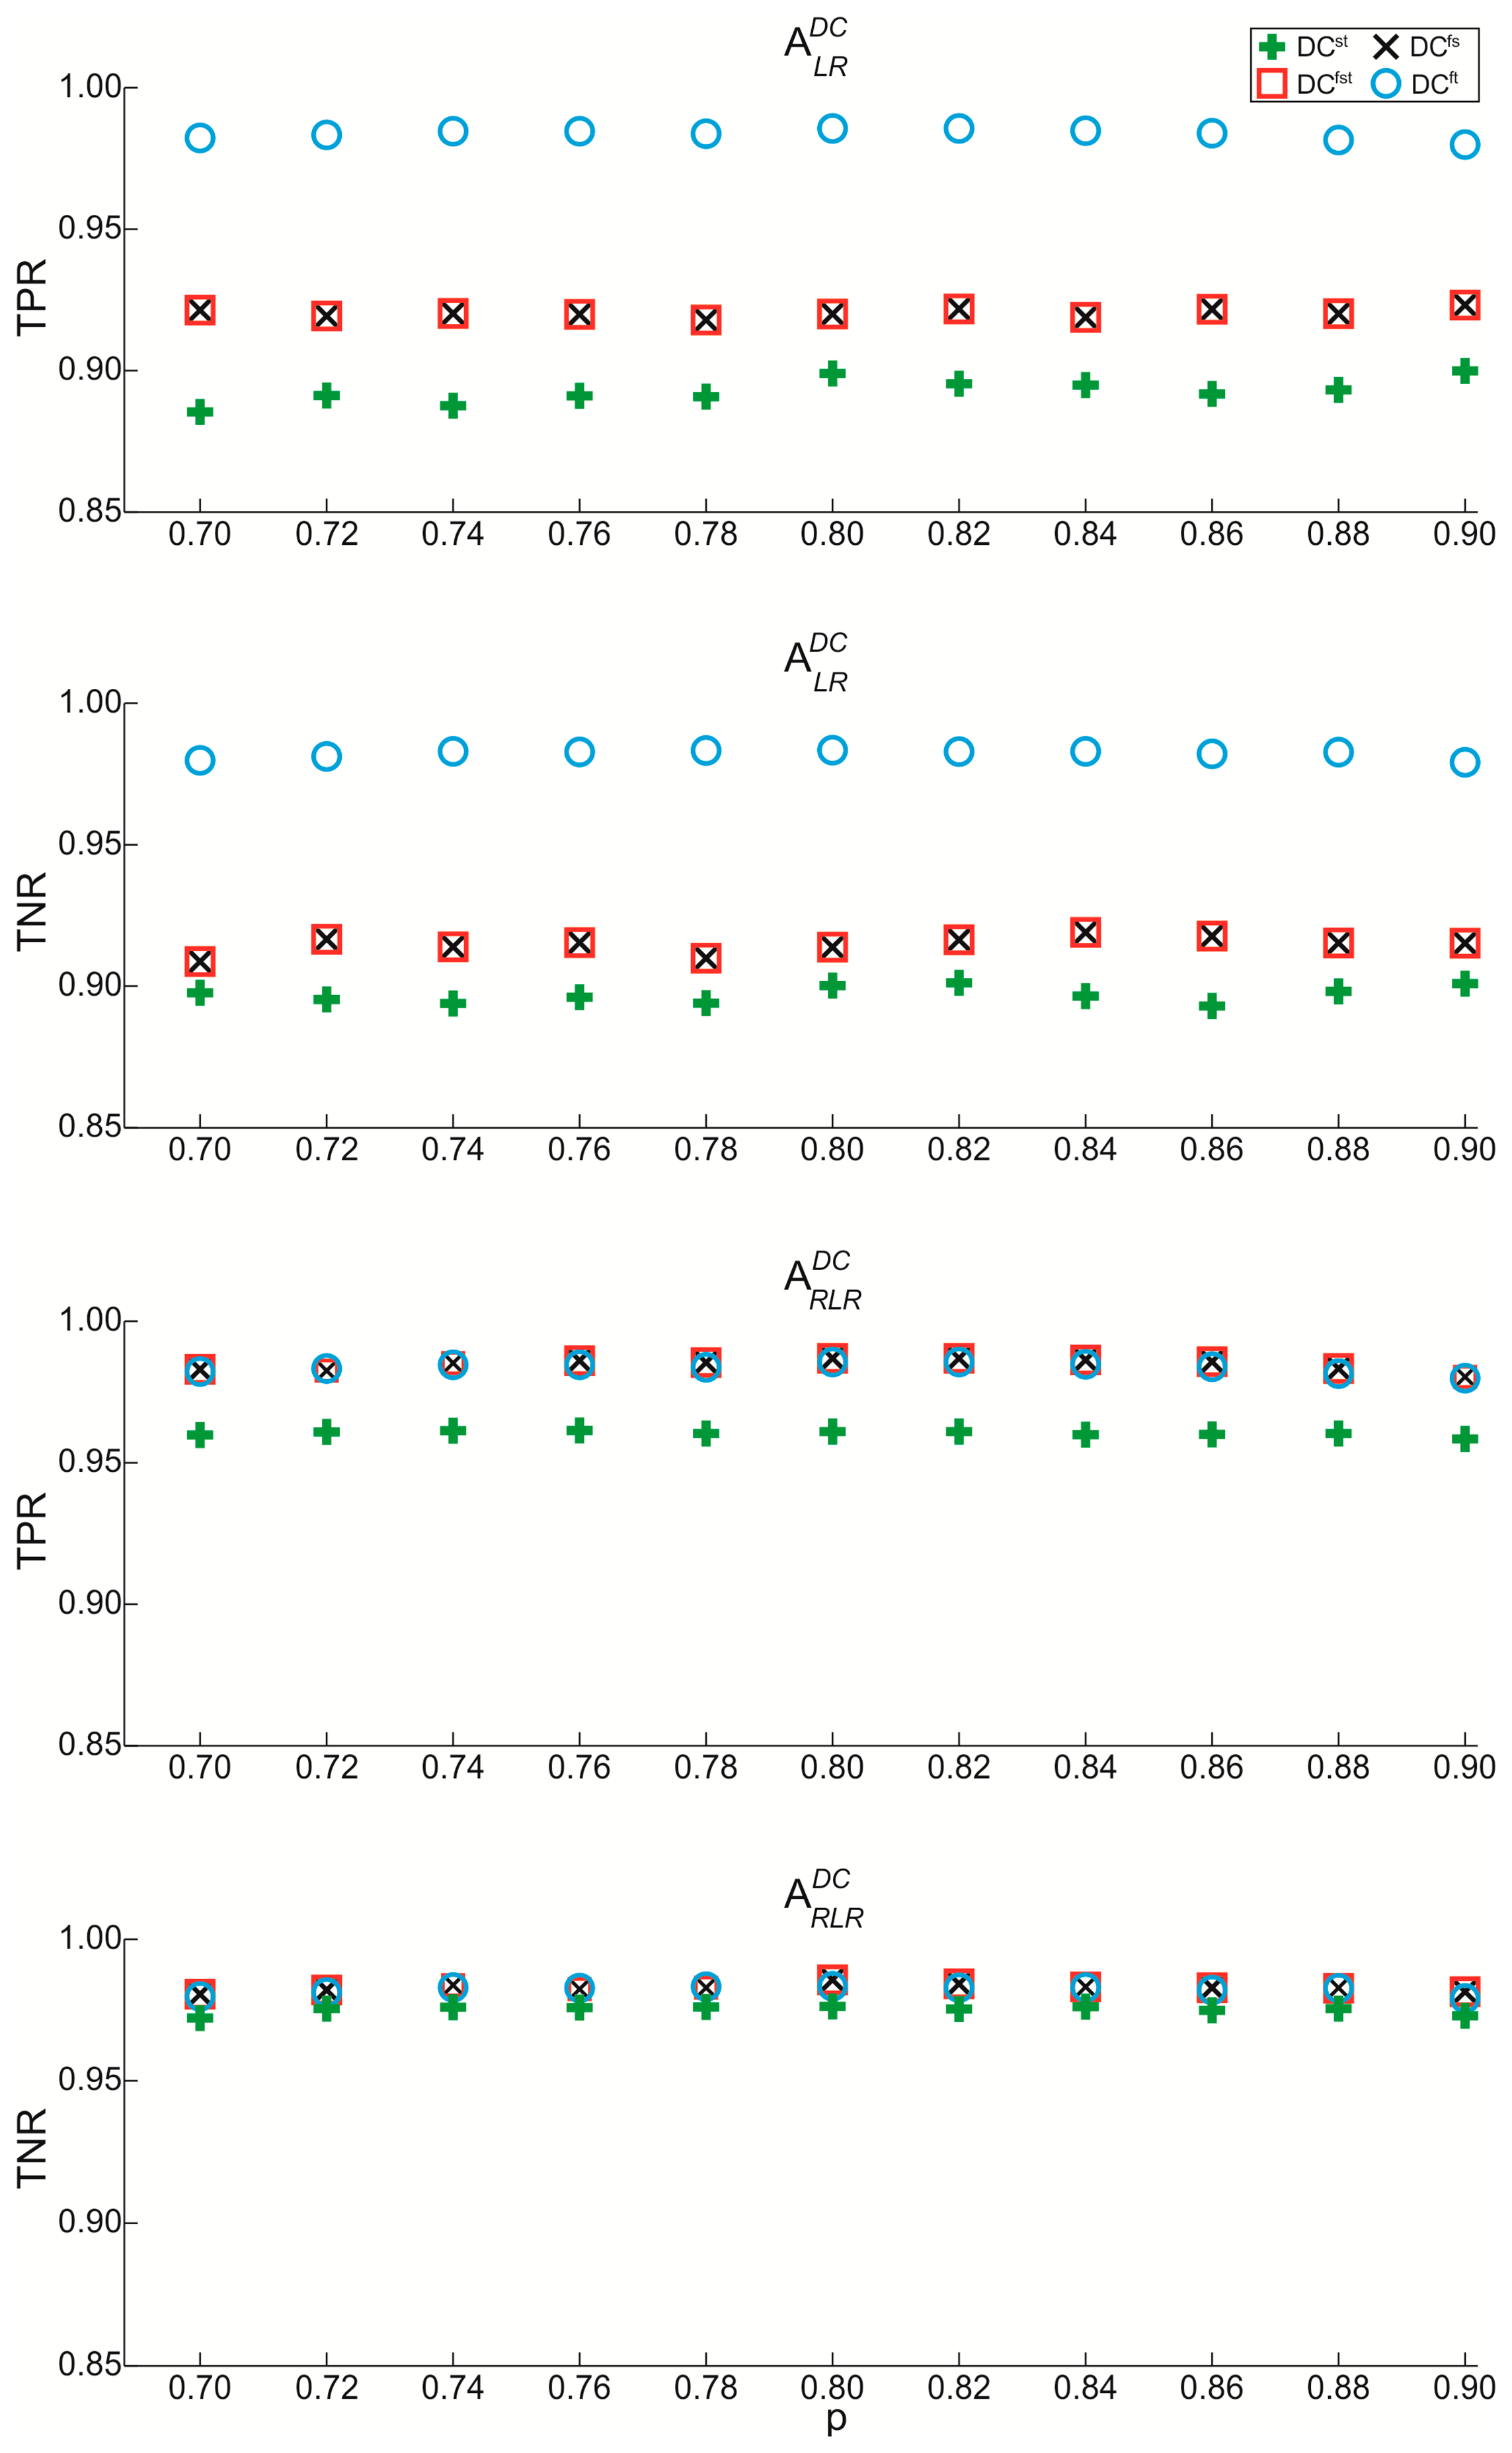
Values of probability p between 0.07 and 0.09 in steps of 0.02 were tested ondata acquired from all subjects for the two above reported matrices. TPR and TNR were evaluated both for and for to find the best distributed matrix that can be implemented in the distributedclassifier. In Figure 6, TPR and TNR values evaluated for matrices and are represented.
TPR and TNR assume similar values in the range of testedp both for and . Performing the comparison between matrices implemented in DCst,DCfs, and DCfst, TPR, and TNR for reach lower values than one evaluated by means of of about 6%. The observed differences are caused by the noise, whichimplies a misclassification of DCs. The matrix can be implemented in place of only when the sensors placed on foot and thigh are used (DCft). Therefore, for the application of experimental protocol, any value of p included between 0.7 and 0.9 can be utilized; in particular we chose, from Equation (22), the following matrix:
3. Results
In Table 1 mean and standard deviation values of TPR and TNR, as well as statistical differences (p < 0.05) are reported for all tested combinations of the three classifiers here examined.
With regards to the Scalar Classifiers, statistical differences among all SCs were found; in particular, TPRSCf and TPRSCf showed the highest values, while TPRSCt and TPRSCt showed the lowest. Regarding the Vectorial Classifiers, although TPRVCst and TNRVCst values were high, i.e., 0.97 and 0.96 respectively, they were statistically lower than the ones measured with the other Vectorial Classifiers. Moreover, TPRVCfst and TNRVCfst showed maximum values, but they were not statistically different from ones evaluated with VCfs and VCft. Taking into account the Distributed Classifiers, TPRDCst and TNRDCst were statistically lower than the same parameters evaluated with the other DC. Moreover, DCfs and DCfst showed higher values of specificity and sensitivity that were not statistically different from the ones evaluated with DCft. Analyzing the three classifiers together, both parameters evaluated with SCs and SCt were statistically different from ones obtained with all other combinations of VC and DC. On the contrary, TPRSCf and TPRSCf did not show any differences comparing them with specificity and sensitivity measured with all combinations of VC and DC. Moreover, for each combination of sensors, TPRVC and TPRVC were not statistically different from TPRDC and TPRDC.
Table 2 shows Decision Index values calculated for all Distributed Classifiers. The value of Decision Index measured for the thigh is 0.00% for DCft and DCfst and this means that the sensor placed on the thigh did not take part in the decision-making process. The sensor on the foot, in all combinations in which it was present, made the decision in most cases. In the absence of the sensor placed on foot, i.e., DCst, the final decision was made mainly by the sensor placed on the shank.
In Table 3 values of Computational Load are reported. The results showed that all DCs did not present any difference with respect to Computational Load values evaluated with all SCs; moreover, VCs showed the highest values of Computational Load that appeared to be on the order of about 102 larger than the others.
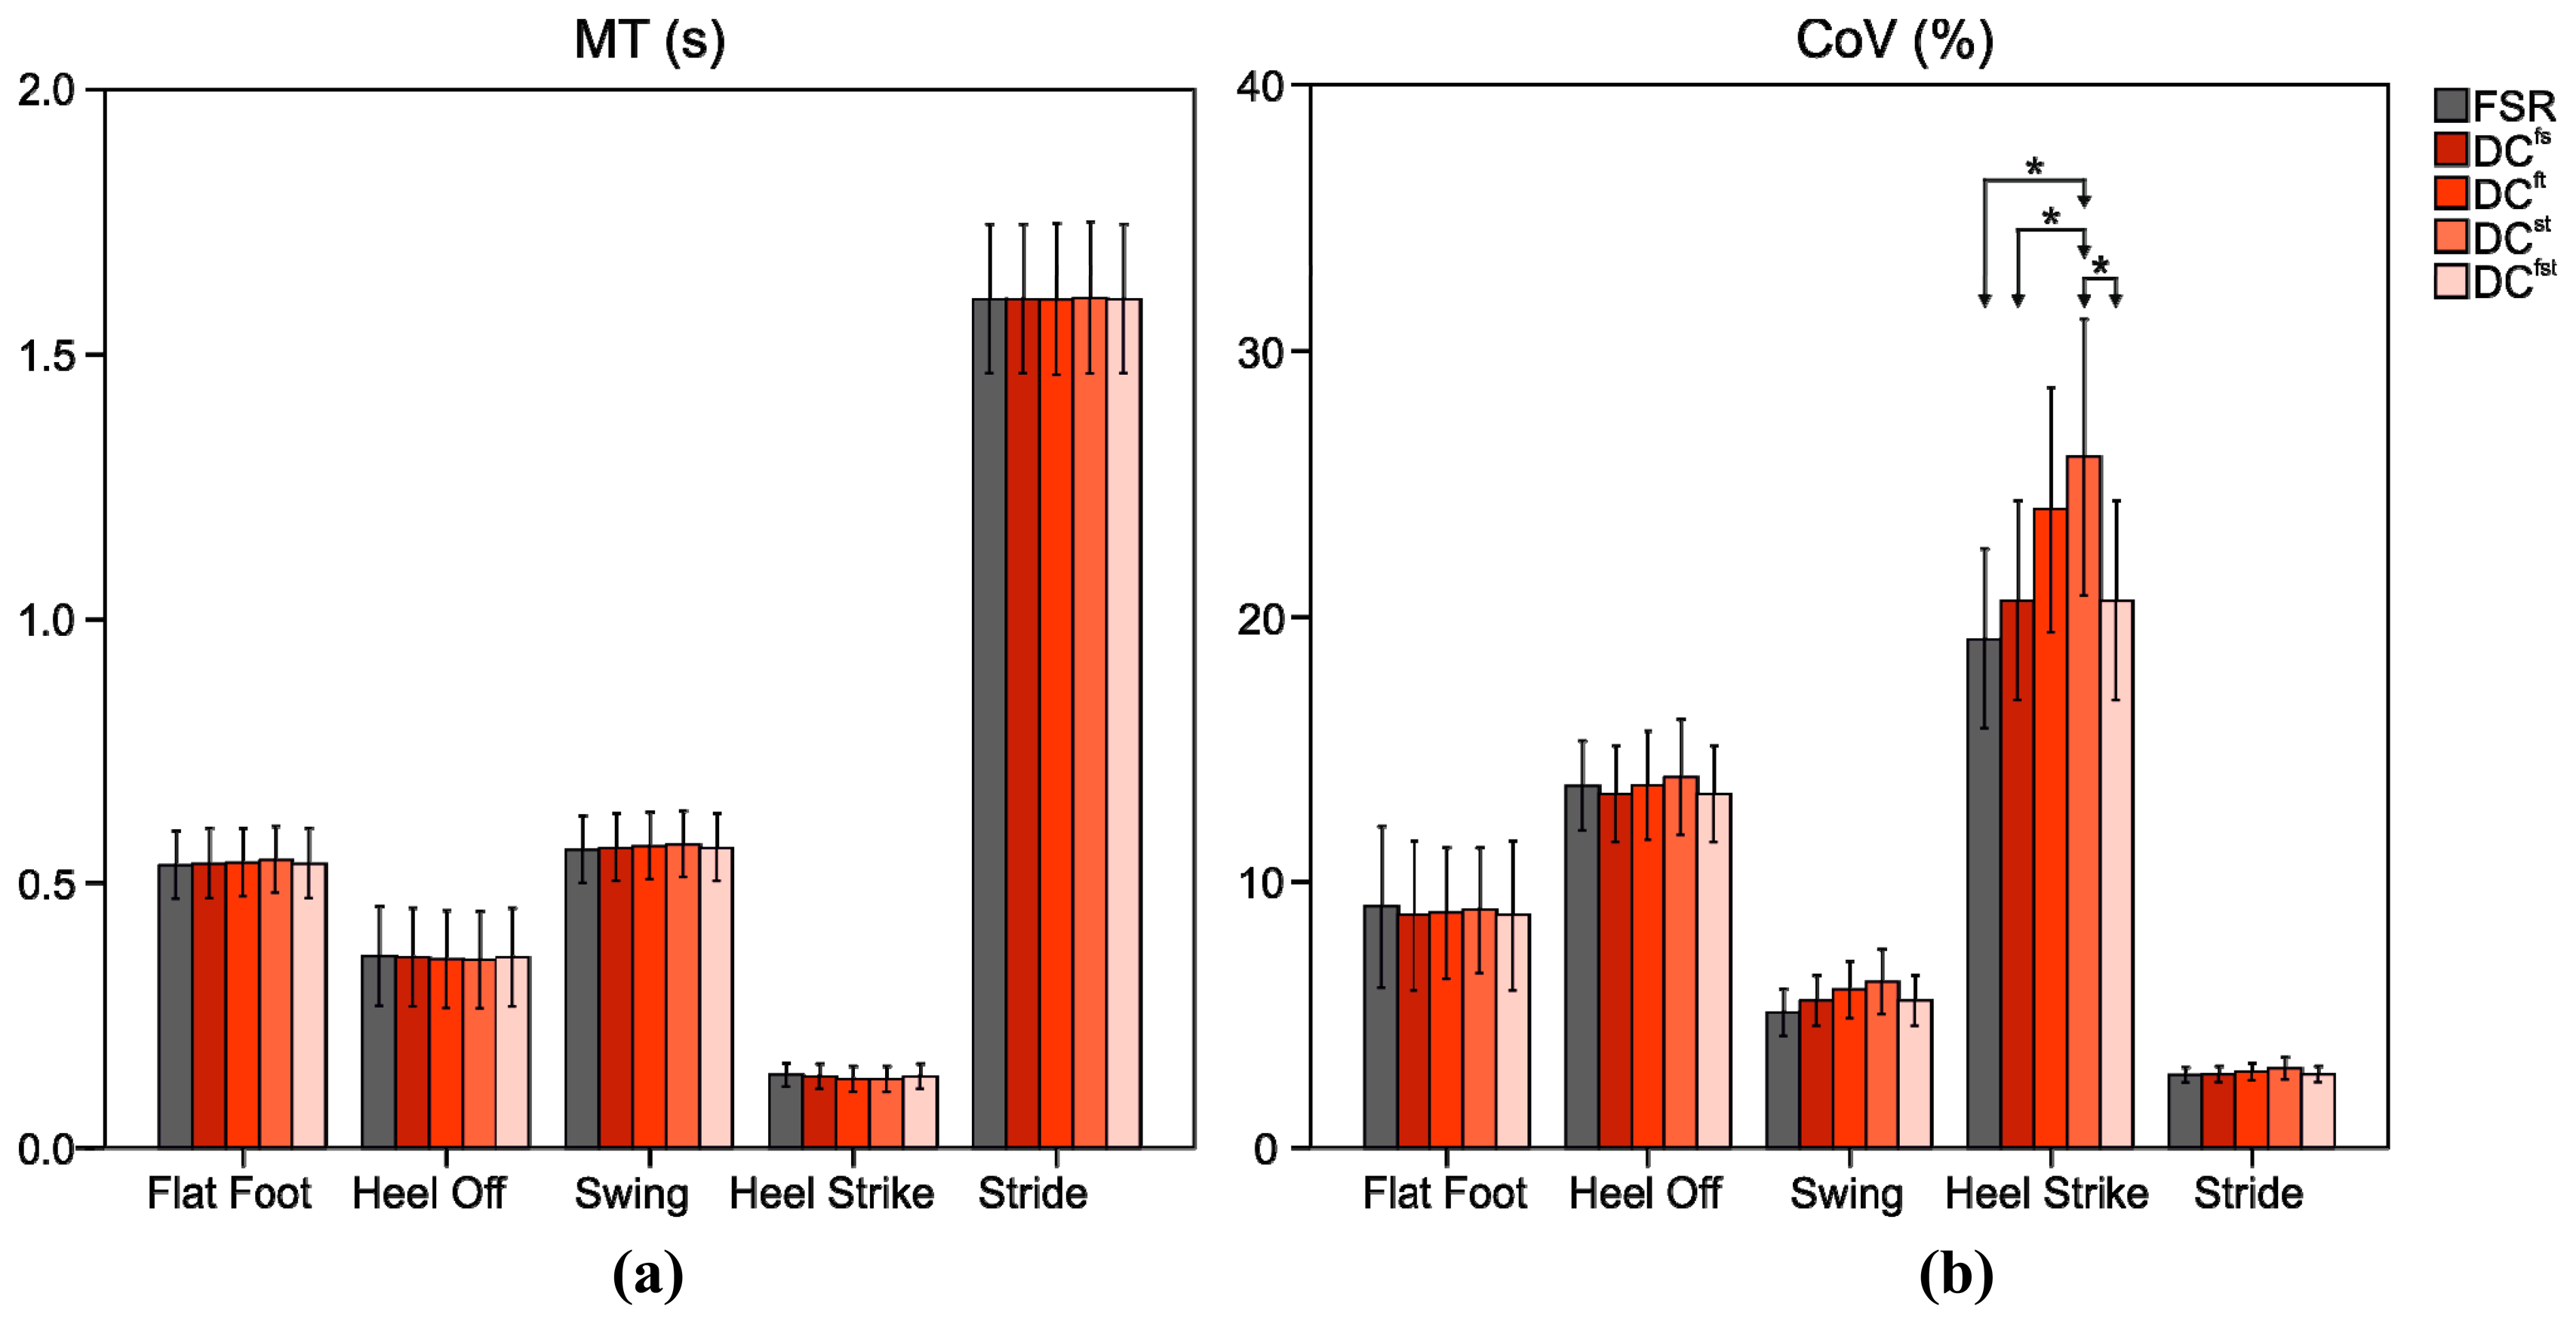
In Figure 7 mean and standard deviation of MT and CoV for stride and each gait phase as well as statistical differences (p < 0.05) are reported for FSR and DCs. As regards MT no statistically significant differences were observed among DCs and FSR. DCs and FSR detected a Stride MT equal to 1.60 ± 0.13 s; in particular MT assumes the lowest values for Heel Strike and the highest ones for the Flat Foot/Swing. Taking into account CoV, significant differences were found in the evaluation of Heel Strike CoV between DCst and FSR, DCfs, and DCfst. In the Stride and in the other gait phases no statistically significant differences were found among FSR and DCs. In particular, Heel Strike CoV reached higher values (always higher than 19%), while Stride CoV assumed lower values (always less than 3%).
In Table 4, values of ICC for MT and CoV are reported. The results showed that ICC for MT was always more than 0.97, while ICC for CoV reached lower values, but always in the range of good or excellent reliability.
4. Discussions
4.1. Scalar Classifier
SC shows the best performance when the sensor has been placed on the foot (SCf). This reflects the conclusion of Abaid et colleagues [5], in which authors stated that the classifier based on the angular velocity of the foot is sufficient for the identification of gait phases in comparison with the other scalar classifiers. In reality, SCs could be also used, even though this would lead to a decrease in sensitivity and specificity performance of about 4%, which limits use when the highest accuracy is required. In addition, SCt achieves performance significantly lower than others, and in particular small value of specificity causes an increase of the detection of false transitions; it implies a shorter duration for each gait phase with an increase in the number of continuous transitions among states.
When the classifier is implemented to control gait phases in active orthoses, as also reported by Abaid et al. [5], the detection of false transition could determine an incorrect actuator control, causing lack of synchrony between the patient's needs and the assistance offered by the device. In fact, active orthoses for ankle rehabilitation are designed to assist impaired gait by providing assistance at the beginning of propulsion phase, i.e., the end of Flat Foot, and by supporting the foot in the middle and at the end of swing phase to prevent the drop-foot [48–50]. This means that low values of specificity would provide wrong information on the actual gait phases and, consequently, a not-suitable assistance to patients. The significant differences among the three scalar classifiers is due to the variability of angular velocity of foot, shank and thigh. As reported in Figure 5, the angular velocity of each body segment shows different variability related to each gait phase. From an examination of the figure, it emerges that the angular velocity of the foot presents, unlike the others, the greatest differences between gyroscope signal patterns in the four phases, as also reported in [16]. In order to detect gait phases, it is sufficient to train cHMM only once with the subject instrumented with FSRsfoot switches, and then the classifier based on gyro signals of the foot is able to detect gait phases in post-processing without any kind of operator intervention. Conversely, training process is not sufficient for gyros applied on the shank and the thigh, which cannot be used as classifiers for gait detection, due to high possibility of detecting false transitions.
In conclusion, SCf is the only combination among SCs usable as classifier to detect gait phases with acceptable performance.
4.2. Vectorial Classifier
As regards the vectorial classifiers, the highest values of TPR and TNR are reached using all sensors placed on the lower limb (VCfst). Moreover, these values are comparable with the sensitivity and specificity obtained with VCs based on two sensors where one is placed on the foot, i.e., VCfs and VCft. It implies that, when a gyroscope is mounted on the foot, the increase in performance due to the utilization of the third sensor can be considered negligible. Despite the fact that the angular velocities of shank and thigh are less variable during gait, VCst provides values higher than 0.96 for both parameters. This implies that, in the absence of the contribution of a sensor placed on the foot, the two angular velocities can train the parameters of cHMM to recognize gait phases, providing performance comparable to those obtained with the other VCs.
In conclusion, all of VCs can be considered as classifiers when gait recognition is required.
4.3. Distributed Classifier
Comparing the performance of all DCs, it appears that DCst is the worst classifier in terms of sensitivity and specificity although its values are always higher than 0.95%. This implies that the lack of information relating to the angular velocity of foot causes a decrease in performance, but the values of TPR and TNR remain acceptable for robust gait detection. In addition, the performance of DCfs are the same as the ones obtained with DCfst; this implies that the sensor place on the thigh never took the decision in the DCfst algorithm. It is also confirmed by the Decision Index of foot and shank, which assume the same values for DCfs and DCfst and the Decision Index of thigh that is always equal to zero in DCfst. Actually, the Decision Index reflects the level of variability of the measured angular velocities. In fact, the probability associated at the states estimated with angular velocity of foot is always higher than the one estimated with other sensors. The sensor on the thigh takes part in decisions only when the sensor on the foot is not connected. As also reported for VCst, the small variability of angular velocity of the thigh makes its decision possible only in DCst.
In conclusion, all DCs can be taken into account as classifiers for gait detection.
4.4. Comparison between SC, VC, and DC
As regards the comparison between the SCs and VCs, the statistical differences among parameters evaluated with VCst, SCs and SCt, imply that, in the absence of the sensor placed on the foot, the use of a VC is mandatory in order to reach the highest values of TPR and TNR. However, when the algorithms involve the use of the angular velocity of the foot, VCs do not significantly improve the capability of detecting gait phases compared with SCf; this result allows the utilization of a single sensor with respect to more complex configurations of sensors avoiding a further increase of computational complexity.
Comparing DCs and SCs, statistical differences were found among each DC and both SCs and SCt. This implies that, as also reported in [28], the use of a hierarchical classification based on a data fusion procedure causes an improvement in performance with respect to the most parts of ones based on the analysis of a single signal. In particular, the main peculiarity of the use of a distributed classifier with respect to scalar ones is pinpointed when the performance of DCst are compared with those of both SCs and SCt; actually, when the foot is not sensorized, the fusion of the individual characteristics of scalar signals determines a significant increase of both TPR and TNR. This finding confirms that DC can be used as classifier for gait detection when the signal of foot angular velocity is not available. Moreover, in the presence of a sensor placed on the foot, DCs show the same behavior as VCs when they are compared with SCs. This implies that DCs can be considered useless for the detection of gait phases when almost a gyroscope is placed on foot. Examining DCft and SCf, it emerges that the two classifiers show the same values of specificity and sensitivity. This can be explained by analyzing the values of Decision Index for DCft, which is equal to zero for the sensor placed on the thigh. Therefore, only the sensor on the foot takes the final decision in the hierarchical algorithm based on thigh and foot sensors with the consequently coincident performances of SCf and DCft.
Comparing the performance of VCs and DCs in terms of specificity and sensitivity, no significant difference was found between each combination of sensors. It confirms the quality of the novel distributed classifier that shows performance comparable with the vectorial one. However, taking into account the Computational Load parameter, it emerges that all of VCs are characterized by the highest values with respect to those of DC. Therefore, VCs show an increase of processing time mainly due to the evaluation of the multivariate probability distribution, which is computationally more demanding, during each step of cHMM. Thus, the high value of computational time determines the limitation of the use of VCs only in an off-line recognition of gait phases. Conversely, when a real-time detection of gait is required, only DCs can be considered as powerful classifiers since they show values of Computational Load of about 9 ms that are comparable with the ones obtainable with SCs. It is important to note that our findings related to Computational Load are dependent on the type of the chosen processor and software.
DCs show performance comparable with VCs in terms of sensitivity and specificity, and computational loads equal to the ones calculated with SCs. The high values of sensitivity and specificity and the low value of processing time obtained with DCs can permit its implementation in the real-time control of active orthoses of knee, such as [51,52], in order to block the rotation of the joint during foot flat phase and to allow free motion during the swing phase [53]. Consequently, the implementation of the DC allows us to avoid the use of additional sensors mounted on the foot, simplifying the design of active orthoses for the recovery of knee mobility. By contrast, in case of active orthoses of the ankle, the cHMM applied to the angular velocities of the foot can be considered sufficient to correctly detect gait phases.
In conclusion, only the novel hierarchical algorithm herewith proposed can be useful to control the movement of active orthoses of the knee if the robotic devices are sensorized at the shank and thigh and not at the foot.
4.5. Are DCs Reliable in Study of Gait Variability?
The analysis of MT values related to Flat Foot, Heel Off, Swing and Heel Strike confirmed the results reported by Abaid et al. [5] as regards the percentage of time spent by each phase during the stride; in particular Heel Strike has the less duration, while Swing and Flat Foot are characterized by the highest time length. In the evaluation of MT, we found no statistically significant differences between all combinations of DC and FSR, this implies that MT values are comparable between DCs and FSR, agreeing to within a few percent. Moreover, the analysis of ICC confirms the excellent reliability of the novel distributed classifier in the evaluation of the gait variability based on MT.
As regards the analysis of CoV, the Stride CoV was never higher than 3%, confirming values reported in literature, both for adults [54] and for children over 11 years old [46]. Furthermore CoV values for Stride and all gait phases decreased when the time length increased; it is in accordance to the findings of Liu et al. [55] where higher values of CoV were measured in gait phases of less duration. Differently from MT, we found statistically significant differences between DCst and FSR, DSfs and DCfst in the evaluation of Heel Strike CoV, while no differences were found between FSR and DCs in the other gait phases and in Stride. This outcome implies that in studies of gait variability, that required the analysis of CoV, DCs are comparable to FSR, except for the evaluation of Heel Strike CoV, in which DCst is not able to provide the same performance of other classifiers. This finding confirms that DCst is the worst classifier among DCs as also emerged from the outputs of the ANOVA tests applied to TPR and TNR. Even if we demonstrated that, in most cases, DCs are comparable to FSR, the error in the estimation of the likely state sequence of the novel distributed classifier could compromise the studies of gait variability based on CoV. In fact, the classification of false transitions or false non-transitions implies the identification of gait phases shorter or longer than the actual duration, with an increase of standard deviations and, consequently, of the CoV values. As regards the ICC analysis of CoV, no differences were found between the novel distributed classifiers and the reference measurement system even if the ICC values appeared to be lower than the ones evaluated for MT. Nevertheless, ICC values were in the range of good or excellent in all cases. This findings confirmed the lower reliability of CoV evaluation with respect to others time-variability parameters [56].
In conclusion, considering the observed performance of DCs with reference to FSR, the novel algorithm could also represent a useful tool in identifying and quantifying gait variability also in a clinical perspective to select a patient specific treatment.
5. Conclusions
This study presents a novel gait detection algorithm based on hierarchical weighted decision, addressed as a Distributed Classifier, applied to process data generated by uni-axial gyroscopes. The innovation of the Distributed Classifier algorithm is on the implementation of a data‐fusion procedure using the angular velocity signals of two or three gyroscopes placed on the lower limbs. Our findings show that the here proposed and validated Distributed Classifier applied to each combination of gyroscopes can successfully detect gait phases with better performance when each DC has been compared with a Scalar Classifier of both shank and thigh. Furthermore, the performance of each DC can be considered similar to the ones obtainable with a Vectorial Classifier applied to the same signals; regardless VCs, DCs can, instead, also be implemented in the real-time application of gait phase recognition, such as the control of active orthoses for the recovery of the mobility of lower limb joints and in the quantification of gait variability.
Acknowledgments
This project was sponsored by a grant from the Italian Institute of Technology (IIT) 2009 Call Project Seed ‘ITINERE-interactive technology: an instrumented novel exoskeleton for rehabilitation’ (PI: Paolo Cappa) and by a grant from Italian Health Ministry Call 2009 ‘Pilot study on a novel typology of medical devices: robotic exoskeletons for knee rehabilitation’ (PI: Paolo Cappa).
Author Contributions
All authors contributed in the plan and design of the work, in the data analysis, and in theliterature search. Juri Taborri and Eduardo Palermo performed data collection. Juri Taborri, StefanoRossi, Eduardo Palermo and Fabrizio Patanè analyzed data. Juri Taborri and Stefano Rossi wrote the manuscript. Paolo Cappa collaborated in funding search and research management, and provided his suggestions in the research project and in the critical revision of the manuscript.
Conflicts of Interest
The authors declare no conflicts of interest.
References
- Simon, S.R. Quantification of human motion: Gait analysis-benefits and limitations to its application to clinical problems. J. Biomech. 2004, 37, 1869–1880. [Google Scholar]
- Wren, T.A.; Gorton, G.E., 3rd; Ounpuu, S.; Tucker, C.A. Efficacy of clinical gait analysis: A systematic review. Gait Posture 2011, 34, 149–153. [Google Scholar]
- Ryoo, M.S.; Aggarwal, J.K. Hierarchical recognition of human activities interacting with objects. Proceedings of the 2nd International Workshop on Semantic Learning Application in Multimedia, Minneapolis, MN, USA, 11–22 June 2007.
- Leutheuser, H.; Schuldhaus, D.; Eskofier, B.M. Hierarchical, multi-sensor based classification of daily life activities: Comparison with state-of-the-art algorithms using a benchmark dataset. PLoS One 2013, 8. [Google Scholar] [CrossRef]
- Abaid, N.; Cappa, P.; Palermo, E.; Petrarca, M.; Porfiri, M. Gait detection in children with and without hemiplegia using single-axis wearable gyroscopes. PLoS One 2013, 8. [Google Scholar] [CrossRef]
- O'Connor, C.M.; Thorpe, S.K.; O'Malley, M.J.; Vaughan, C.L. Automatic detection of gait events using kinematic data. Gait Posture 2007, 25, 469–474. [Google Scholar]
- Zeni, J., Jr; Richards, J.; Higginson, J.S. Two simple methods for determining gait events during treadmill and overground walking using kinematic data. Gait Posture 2008, 27, 710–714. [Google Scholar]
- Desailly, E.; Daniel, Y.; Sardain, P.; Lacouture, P. Foot contact event detection using kinematic data in cerebral palsy children and normal adults gait. Gait Posture 2009, 29, 76–80. [Google Scholar]
- Miller, A. Gait event detection using a multilayer neural network. Gait Posture 2009, 29, 542–545. [Google Scholar]
- Boulgouris, N.V.; Huang, X. Gait recognition using HMMs and dual discriminative observations for sub-dynamics analysis. IEEE Trans. Image Process. 2013, 22, 3636–3647. [Google Scholar]
- Bamberg, S.J.M.; Benbasat, A.Y.; Scarborough, D.M.; Krebs, D.E.; Paradiso, J.A.; Member, S. Gait analysis using a shoe-integrated wireless sensor system. IEEE Trans. Inf. Technol. Biomed. 2008, 12, 413–423. [Google Scholar]
- Goršič, M.; Kamnik, R.; Ambrožič, L.; Vitiello, N.; Lefeber, D.; Pasquini, G.; Munih, M. Online phase detection using wearable sensors for walking with a robotic prosthesis. Sensors 2014, 14, 2776–2794. [Google Scholar]
- Bae, J.; Tomizuka, M. Gait phase analysis based on a Hidden Markov Model. Mechatronics 2011, 21, 961–970. [Google Scholar]
- Preece, S.J.; Kenney, L.P.J.; Major, M.J.; Dias, T.; Lay, E.; Fernandes, B.T. Automatic identification of gait events using an instrumented sock. J. Neuroeng. Rehabil. 2011, 8, 1–10. [Google Scholar]
- Sun, H.; Yuao, T. Curve aligning approach for gait authentication based on a wearable accelerometer. Physiol. Meas. 2012, 33, 1111–1120. [Google Scholar]
- Mannini, A.; Sabatini, A.M. Gait phase detection and discrimination between walking-jogging activities using hidden Markov models applied to foot motion data from a gyroscope. Gait Posture 2012, 36, 657–661. [Google Scholar]
- Formento, P.C.; Acevedo, R.; Ghoussayni, S.; Ewins, D. Gait event detection during stair walking using a rate gyroscope. Sensors 2014, 14, 5470–5485. [Google Scholar]
- Hundza, S.; Hook, W.; Harris, C. Accurate and reliable gait cycle detection in Parkinson's disease. IEEE Trans. Neural Syst. Rehabil. Eng. 2013, 22, 127–137. [Google Scholar]
- Nogueira, S.L.; Siqueira, A.G.; Inoue, R.S.; Terra, M.H. Markov jump linear systems-based position estimation for lower limb exoskeletons. Sensors 2014, 14, 1835–1849. [Google Scholar]
- Blaya, J.A.; Herr, H. Adaptive control of a variable-impedance ankle-foot orthosis to assist drop-foot gait. IEEE Trans. Neural Syst. Rehabil. Eng. 2004, 12, 24–31. [Google Scholar]
- Furusho, J.; Kikuchi, T.; Tokuda, M.; Kakehashi, T.; Ikeda, K.; Morimoto, S.; Hashimoto, Y.; Tomiyama, H.; Nakagawa, A.; Akazawa, Y. Development of shear type compact MR brake for the intelligent ankle-foot orthosis and its control. Proceedings of IEEE 10th International Conference on Rehabilitation Robotics, Noordwijk, The Netherlands, 12–15 June 2007; pp. 89–94.
- Kanthi, M.; Karteek, I.S.V.; Mruthyunjaya, H.S.; George, V.I. Real-time control of active ankle foot orthosis using LabVIEW and Compact-RIO. Proceedings of International Conference on Biomedical Engineering (ICoBE), Penang, Malaysia, 27–28 February 2012; pp. 296–299.
- Cheng, W.-C.; Jhan, D.-M. Triaxial Accelerometer-Based Fall Detection Method Using a Self-Constructing. IEEE J. Biomed. Heal. Inf. 2013, 17, 411–419. [Google Scholar]
- Li, S.; Wang, J.; Wang, X. A novel gait recognition analysis system based on body sensor networks for patients with parkinson's disease. Proceedings of 2010 IEEE Globecom Workshops on Advanced Sensor Integration Technology, Miami, FL, USA, 6–10 December 2010; pp. 256–260.
- Chu, J.-U.; Song, K.-I.; Han, S.; Lee, S.H.; Kang, J.Y.; Hwang, D.; Suh, J.-K.F.; Choi, K.; Youn, I. Gait phase detection from sciatic nerve recordings in functional electrical stimulation systems for foot drop correction. Physiol. Meas. 2013, 34, 541–565. [Google Scholar]
- Mannini, A.; Sabatini, A.M. Machine learning methods for classifying human physical activity from on-body accelerometers. Sensors 2010, 10, 1154–1175. [Google Scholar]
- Kolawole, A.; Tavakkoli, A. A novel gait recognition system based on Hidden Markov Models. Adv. Vis. Comput. Lect. Notes Comput. Sci. 2012, 7432, 125–134. [Google Scholar]
- Banos, O.; Damas, M.; Pomares, H.; Rojas, F.; Delgado-Marquez, B.; Valenzuela, O. Human activity recognition based on a sensor weighting hierarchical classifier. Soft Comput. 2013, 17, 333–343. [Google Scholar]
- Zappi, P.; Stiefmeier, T.; Farella, E.; Roggen, D.; Benini, L.; Tr, G. Activity recognition from on-body sensors by classifier fusion: Sensor scalability and robustness. Proceedings of the 3rd International Conference on Intelligent Sensors, Sensor Networks and Information, Melbourne, Australia, 3–6 December 2007; pp. 281–286.
- Kittler, J.; Society, I.C.; Hatef, M.; Duin, R.P.W.; Matas, J. On combining classifiers. IEEE Trans. Pattern Anal. Mach. Intell. 1998, 20, 226–239. [Google Scholar]
- Doyle, S.; Rodriguez, C.; Madabhushi, A.; Tomaszeweski, J.; Feldman, M. Detecting prostatic adenocarcinoma from digitized histology using a multi-scalehierarchical classification approach. Proceedings of the 28th IEEE EMBS Annual International Conference, New York, NY, USA, 30 August–3 September 2006; Volume 1, pp. 4759–4762.
- Marin, M.; Sucar, L.E.; Gonzalez, J.A.; Diaz, R. A hierarchical model for morphological galaxy classification. Proceedings of the 26th International Florida Artificial Intelligence Research Society Conference, Pete Beach, FL, USA, 7–9 May 2007; pp. 438–443.
- Zhao, X.; Li, M.; Song, G.; Xu, J. Hierarchical ensemble-based data fusion for structural health monitoring. Smart Mater. Struct. 2010, 19, 1–7. [Google Scholar]
- Lin, C.; Zou, Y.; Qin, J.; Liu, X.; Jiang, Y.; Ke, C.; Zou, Q. Hierarchical classification of protein folds using a novel ensemble classifier. PLoS One 2013, 8. [Google Scholar] [CrossRef]
- Voisin, A.; Krylov, V.A.; Moser, G.; Serpico, S.B. Classification of very high resolution SAR images of urban areas using copulas and texture in a hierarchical Markov random field model. IEEE Geosci. Remote Sens. Lett. 2013, 10, 96–100. [Google Scholar]
- Rabineer, L. A tutorial on Hidden Markov Models and selected applications in speech recognition. Proc. IEEE 1989, 77, 257–286. [Google Scholar]
- Rabiner, L.; Juang, B.H. An introduction to hidden Markov models. IEEE ASSP Mag. 1986, 3, 4–16. [Google Scholar]
- Jordan, M.I. Graphical models. Stat. Sci. 2004, 19, 140–155. [Google Scholar]
- Palermo, E.; Rossi, S.; Patanè, F.; Cappa, P. Experimental evaluation of indoor magnetic distortion effects on gait analysis performed with wearable inertial sensors. Physiol. Meas. 2014, 35. [Google Scholar] [CrossRef]
- Favre, J.; Aissaoui, R.; Jolles, B.M.; de Guise, J.A.; Aminian, K. Functional calibration procedure for 3D knee joint angle description using inertial sensors. J. Biomech. 2009, 42, 2330–2335. [Google Scholar]
- Cutti, A.; Ferrari, A.; Garofalo, P.; Raggi, M.; Cappello, A.; Ferrari, A. “Outwalk”: A protocol for clinical gait analysis based on inertial and magnetic sensors. Med. Biol. Eng. Comput. 2010, 48, 17–25. [Google Scholar]
- Palermo, E.; Rossi, S.; Marini, F.; Patanè, F.; Cappa, P. Experimental evaluation of accuracy and repeatability of a novel body-to-sensor calibration procedure for inertial sensor-based gait analysis. Measurement 2014, 52, 145–155. [Google Scholar]
- Ainsworth, B.E.; Haskell, W.L.; Whitt, M.C.; Irwin, M.L.; Swartz, M.; Strath, S.J.; O'Brien, W.L.; Bassett, D.R.; Schmitz, K.H.; Emplaincourt, P.O.; et al. Compendium of physical activities: An update of activity codes and MET intensities. Med. Sci. Sports Exerc. 2000, 32, S498–S504. [Google Scholar]
- Cawley, G.C.; Talbot, N.L.C. Efficient leave-one-out cross-validation of kernel fisher discriminant classifiers. Pattern Recognit. 2003, 36, 2585–2592. [Google Scholar]
- Aung, M.S.H.; Thies, S.B.; Kenney, L.P.J.; Howard, D.; Selles, R.W.; Findlow, A.H.; Goulermas, J.Y. Automated detection of instantaneous gait events using time frequency analysis and manifold embedding. IEEE Trans. Neural Syst. Rehabil. Eng. 2013, 21, 908–916. [Google Scholar]
- Hausdorff, J.M.; Zemany, L.; Peng, C.; Goldberger, A.L. Maturation of gait dynamics: Stride-to-stride variability and its temporal organization in children. Appl. Physiol. 1999, 86, 1040–1047. [Google Scholar]
- Cicchetti, D.V. Guidelines, criteria, and rules of thumb for evaluating normed and standardized assessment instruments in psychology. Psychol. Assess. 1994, 6, 284–290. [Google Scholar]
- Tanida, S.; Kikuchi, T.; Otsuki, K.; Ozawa, T.; Fujikawa, T.; Yasuda, T.; Furusho, J.; Shoji, A.; Hashimoto, Y. Intelligently controllable Ankle Foot Orthosis (I-AFO) and its application for a patient of Guillain-Barre syndrome. Proceedings of IEEE 11th Internation Conference on Rehabilitation Robotics, Kyoto, Japan, 23–26 June 2009; pp. 857–862.
- Shorter, A.K.; Kogler, G.F.; Loth, E.; Durfee, W.K.; Hsiao-Wecksler, E.T. A portable powered ankle-foot orthosis for rehabilitation. J. Rehabil. Res. Dev. 2011, 48, 459–472. [Google Scholar]
- Krebs, H.I.; Rossi, S.; Kim, S.-J.; Artemiadis, P.K.; Williams, D.; Castelli, E.; Cappa, P. Pediatric anklebot. Proceedings of IEEE International Conference on Rehabilitation Robotics, ETH Zurich, Switzerland, 29 June–1 July 2011.
- Weinberg, B.A.; Nikitczuk, J.A.; Patel, S.A.; Patritti, B.; Mavroidis, C.; Bonato, P.; Canavan, P. Design, control and human testing of an active knee rehabilitation orthotic device. Proceedings of IEEE International Conference on Robotics and Automation, Rome, Italy, 10–14 April 2007; pp. 4126–4133.
- Nikitczuk, J.A.; Weinberg, B.A.; Canavan, P.; Mavroidis, C. Active knee rehabilitation orthotic device with variable damping characteristics implemented via an electrorheological fluid. IEEE/ASME Trans. Mechatron. 2010, 15, 952–960. [Google Scholar]
- Lemaire, E.D.; Goudreau, L.; Yakimovich, T.; Kofman, J. Angular-velocity control approach for stance-control orthoses. IEEE Trans. Neural Syst. Rehabil. Eng. 2009, 17, 497–503. [Google Scholar]
- Brisswalter, J.; Mottet, D. Energy cost and stride duration variabilitu at preferred transition gait speed between walking and running. Appl. Physiol. 1996, 21, 471–480. [Google Scholar]
- Liu, Y.; Lu, K.; Yan, S.; Sun, M.; Lester, D.K.; Zhang, K. Gait phase varies over velocities. Gait Posture 2014, 39, 756–760. [Google Scholar]
- Riva, F.; Bisi, M.C.; Stagni, R. Gait variability and stability measures: Minimum number of strides and within-session reliability. Comput. Biol. Med. 2014, 50, 9–13. [Google Scholar]


| Algorithm | TPR | TNR | ||
|---|---|---|---|---|
| Mean (std) | Differences | Mean (std) | Differences | |
| SCf | 0.98 (0.01) | SCs, SCt | 0.98 (0.02) | SCs, SCt |
| SCs | 0.94 (0.01) | All | 0.93 (0.02) | All |
| SCt | 0.83 (0.01) | All | 0.77 (0.01) | All |
| VCfs | 0.99 (0.01) | SCs, SCt, VCst, DCst | 0.98 (0.01) | SCs, SCt, VCst, DCst |
| VCft | 0.98 (0.01) | SCs, SCt | 0.98 (0.02) | SCs, SCt |
| VCst | 0.97 (0.01) | SCs, SCt, VCfs, VCft, VCfst | 0.96 (0.02) | SCs, SCt, VCfs, VCft, VCfst |
| VCfst | 0.99 (0.01) | SCs, SCt, VCst, DCst | 0.99 (0.01) | SCs, SCt, VCst, DCst |
| DCfs | 0.99 (0.01) | SCs, SCt, DCst | 0.98 (0.01) | SCs, SCt, DCst |
| DCft | 0.98 (0.01) | SCs, SCt | 0.98 (0.02) | SCs, SCt |
| DCst | 0.96 (0.02) | SCs, SCt, VCfs, VCfst, DCfst, DCfs | 0.95 (0.02) | SCs, SCt, VCfs, VCfst, DCfst, DCfs |
| DCfst | 0.99 (0.01) | SCs, SCt, DCst | 0.98 (0.01) | SCs, SCt, DCst |
| Body Segment | Decision Index (%) | |||
|---|---|---|---|---|
| DCfs | DCft | DCst | DCfst | |
| Foot | 85.45 (2.35) | 100.00 (0.00) | / | 85.45 (2.35) |
| Shank | 14.55 (2.35) | / | 76.97 (1.55) | 14.55 (2.50) |
| Thigh | / | 0.00 (0.00) | 23.03 (1.55) | 0.00 (0.00) |
| Classifier | Computational Load (s) |
|---|---|
| SCf, SCs, SCt | 0.009 |
| VCfs, VCft, VCst | 0.147 |
| VCfst | 0.254 |
| DCfs, DCft, DCst | 0.009 |
| DCfst | 0.009 |
© 2014 by the authors; licensee MDPI, Basel, Switzerland. This article is an open access article distributed under the terms and conditions of the Creative Commons Attribution license ( http://creativecommons.org/licenses/by/3.0/).
Share and Cite
Taborri, J.; Rossi, S.; Palermo, E.; Patanè, F.; Cappa, P. A Novel HMM Distributed Classifier for the Detection of Gait Phases by Means of a Wearable Inertial Sensor Network. Sensors 2014, 14, 16212-16234. https://doi.org/10.3390/s140916212
Taborri J, Rossi S, Palermo E, Patanè F, Cappa P. A Novel HMM Distributed Classifier for the Detection of Gait Phases by Means of a Wearable Inertial Sensor Network. Sensors. 2014; 14(9):16212-16234. https://doi.org/10.3390/s140916212
Chicago/Turabian StyleTaborri, Juri, Stefano Rossi, Eduardo Palermo, Fabrizio Patanè, and Paolo Cappa. 2014. "A Novel HMM Distributed Classifier for the Detection of Gait Phases by Means of a Wearable Inertial Sensor Network" Sensors 14, no. 9: 16212-16234. https://doi.org/10.3390/s140916212