A Large Response Range Reflectometric Urea Biosensor Made from Silica-Gel Nanoparticles

Abstract
: A new silica-gel nanospheres (SiO2NPs) composition was formulated, followed by biochemical surface functionalization to examine its potential in urea biosensor development. The SiO2NPs were basically synthesized based on sol–gel chemistry using a modified Stober method. The SiO2NPs surfaces were modified with amine (-NH2) functional groups for urease immobilization in the presence of glutaric acid (GA) cross-linker. The chromoionophore pH-sensitive dye ETH 5294 was physically adsorbed on the functionalized SiO2NPs as pH transducer. The immobilized urease determined urea concentration reflectometrically based on the colour change of the immobilized chromoionophore as a result of the enzymatic hydrolysis of urea. The pH changes on the biosensor due to the catalytic enzyme reaction of immobilized urease were found to correlate with the urea concentrations over a linear response range of 50–500 mM (R2 = 0.96) with a detection limit of 10 mM urea. The biosensor response time was 9 min with reproducibility of less than 10% relative standard deviation (RSD). This optical urea biosensor did not show interferences by Na+, K+, Mg2+ and NH4+ ions. The biosensor performance has been validated using urine samples in comparison with a non-enzymatic method based on the use of p-dimethylaminobenzaldehyde (DMAB) reagent and demonstrated a good correlation between the two different methods (R2 = 0.996 and regression slope of 1.0307). The SiO2NPs-based reflectometric urea biosensor showed improved dynamic linear response range when compared to other nanoparticle-based optical urea biosensors.1. Introduction
Urea (NH2)2CO is a nitrogen organic compound commonly found in blood and other bodily fluids. Urea is formed in the kidney from ammonia (NH3), which in turn is produced from the breakdown of protein during tissue metabolism. Measurement of urea concentrations in blood provides an indication of kidney and liver functions, congestive heart failure, excessive protein intake or protein catabolism, malnutrition, pregnancy, shock and stress [1–5]. There are many methods known for the determination of urea concentration. Calorimetry, fluorimetry and gas chromatography are conventional methods used for urea concentration determination [5], however, these methods have many disadvantages, e.g., complicated sample pre-treatment, need for skillful operators, high cost of instrumentation and sometimes they require long analysis time [6].
Nanoparticles are interesting materials that bridge the gap between bulk and nano-scale materials. Nanoparticles exhibit electronic, magnetic, ionization potential and optical properties that are different from their bulk counterpart materials. Nanomaterials improve the mechanical properties of both bulk and composite materials [7,8]. To date very few optical urea biosensors have been reported using different kinds of nanoparticles as urease immobilization matrices. Swati et al. [9], for instance, reported urease encapsulated in calcium alginate microspheres coated with polyelectrolyte nanofilms containing cresol red dye for optical urea biosensor construction. Duong and Rhee [10] developed luminescent quantum dots incorporated within a sol–gel matrix for urea biosensor construction. Malinowski et al. [11] constructed a UV-Vis spectrophotometric urea biosensor based on PANI/cellulose polyacetate membrane for urease immobilization.
Among all available nanoparticle materials, SiO2NPs possess optical, biological and other technologically useful features for industrial applications [12]. They are a non-toxic compound with high chemical stability [13], that can be combined with a diversity of chemical and biochemical surface modifiers to adjust the surface reactivity [14]. In this work, SiO2NPs were synthesized based on sol–gel chemistry by hydrolyzing alkyl silicates in a mixed NH3/alcohol/water solution [15]. The influence of varying precursor compositions on the SiO2NP size distribution was investigated. The optimum composition was then selected for urea biosensor construction. SiO2NPs functionalized with -NH2 groups and GA cross-linker were used for binding of urease enzyme to the NH2-modified SiO2NPs (SiO2NPs-NH2) via ammonium carboxylate salt (-COO− NH3+-) attachment. A pH-sensitive chromoionophore indicator was physically immobilized onto the SiO2NPs. The SiO2NPs containing immobilized urease and chromoionophore were finally placed in a plastic case as illustrated in Figure 1.
The immobilized urease catalyzed the hydrolysis of urea and increased the biosensor pH due to the increased number of hydroxyl ions produced (Equation (1)). The resulting increase in alkalinity of the SiO2NPs biosensor deprotonated the immobilized chromoionophore and rendered a colour change of chromoionophore from blue to red [16,17], which can be visualized using a reflectance spectrophotometric method:
2. Materials and Methods
2.1. Chemicals
Tetraethylorthosilicate (TEOS, 98%) and 3-aminopropyltriethoxysilane (APS, 99%) were purchased from Aldrich (Louis, MO, USA). Sodium chloride (99.5%), ammonium chloride (99.5%) and urea (99%) from UNIVAR (Seattle, WA, USA). Chromoionophore ETH 5294, magnesium chloride (99.5%), KH2PO4 (99.5%) and K2HPO4 were obtained from Fluka (Buchs, Switzerland). NH3 solution (25%, A.R.) was purchased from Baker Analyzed (Corporate Parkway, Center Valley, USA), ethanol (EtOH, 95%) from Systerm Company (Zellwood, FL, USA), glutaric acid (GA, 99%) from Merck (Boston, MA, USA), glutaraldehyde (GD, 25% w/w) from Unilap (Doncaster, UK), cetyltrimethylammonium bromide (C16TAB, 99%) from BDH-GPR (Lutterworth, UK), potassium chloride (99.5%) from Merck, urease enzyme type III-Jack Bens EC 3.5.1.5 (40,100 units/g) from Sigma-Aldrich and p-dimethylaminobenzaldehyde (DMAB, 99%) from Riedel de Haen (Seelze, Germany). Pure water with a resistivity of 18.2 MΩ · cm was used in all solution preparations. All chemicals were used without further purification.
2.2. Instrumentation
Reflectance intensity was measured using Ocean Optics Mikropack DH-2000-BAL spectrometer (Dunedin, FL, USA) with a UV-Vis-NIR light source. A personal computer was used for on-line data collection. The instrumental parameters were controlled and data was processed by ocean optic software. A Varian (Cary, NC, USA) Cary 50 UV-Vis spectrophotometer was used for UV-Vis absorption measurements. The surface morphology images of SiO2NPs were acquired using scanning electron microscopy (Philips: Peabody, MA, USA). FTIR spectra of SiO2 nanoparticle samples were carried out and analyzed by using Perkin Elmer Infrared Spectrometer (Waltham, MA, USA) in the wavenumber range of 400–4000 cm−1 with 4 cm−1 resolution using KBr disc method.
2.3. SiO2NPs Preparation and Surface Modification
2.3.1. Synthesis of SiO2NPs
SiO2NPs were prepared following the conventional Stober method as described in the literature with some modifications [12,15,18–22]. NH3 solution (25%) was added to a mixture of ethanol, deionized water, C16TAB and TEOS solution, and vigorously stirred at room temperature (25 °C) for 24 h to obtain a very uniform sized SiO2NPs. The resulting SiO2NPs were then washed thrice with deionized water via centrifugation followed by decantation and re-suspension in ethanol in an ultrasonic bath. Then, the SiO2NPs suspension was centrifuged again at 4000 rpm for 30 min and washed three times with ethanol. Finally, the SiO2NPs were dried in a vacuum oven at 60 °C.
2.3.2. SiO2NP Surface Modification with -NH2 Functional Groups
SiO2NP surface modification was carried out based on methods reported in the literature [18,19,21,23,24] with some modifications. The SiO2NPs obtained in Section 2.3.1 were treated with an appropriate amount of APS modifier under vigorous stirring to functionalize the SiO2NPs with -NH2 functional groups. The reaction mixture was kept stirring overnight at ambient temperature. The NH2-functionalized SiO2NPs were then washed thrice with deionized water via centrifugation followed by decantation and re-suspension in ethanol in an ultrasonic bath. Then, the SiO2NPs-NH2 suspension was centrifuged again at 4000 rpm for 30 min and washed twice with ethanol. The SiO2NPs-NH2 was finally dried in a vacuum oven at 50 °C until a constant weight was obtained.
2.3.3. Cross-Linking of SiO2NPs-NH2 with GD and GA Cross-Linkers
Two types of cross-linkers i.e., GD and GA were used to attach the enzymes to SiO2NPs-NH2 according to a method reported previously [25–30] with some modifications. Some 16 mL of water was added to 400 mg of SiO2NPs-NH2 and the mixture sonicated for 5 min until a suspension was obtained. GD (25%, 4 mL) was then added into the suspension and stirred for 24 h. Then, the GD-modified SiO2NPs-NH2 (SiO2NPs-NH2–GD) was isolated via 6000 rpm centrifugation for 15 min, washed three times with water and kept until use. The same procedure was applied to modify the SiO2NPs-NH2 with GA using 1 g of GA with 10 min sonication.
2.4. Optical Urea Biosensor Construction
The pH sensor was first prepared prior to the construction of urea biosensor. An adequate amount of pH indicator was added to the GD- or GA-modified SiO2NPs-NH2 and sonicated until a homogeneous solution was obtained. The mixture was then re-suspended by adding 30 mL water with sonication. The suspended particles were then washed thrice with deionized water followed by centrifugation at 6000 rpm for 15 min. Then, the resulting particles were re-suspended again in 3 mL of 0.05 M phosphate buffer (pH 7) with sonication. Urease enzyme solution (2 mL, 10 mg/mL) was then introduced into the resulting particle suspension and kept at 4 °C for 24 h to allow attachment of urease enzyme onto the surface-modified SiO2NPs. The urease-immobilized SiO2NPs (urease-SiO2NPs) suspension was finally centrifuged at 3000 rpm for 30 min, and washed three times with 0.05 M phosphate buffer (pH 7) to remove the loosely bound urease enzyme. An amount of urease-SiO2NPs was collected and placed in an Eppendorf tube cap to be used as an optical urea biosensor.
2.5. Optimization of Urea Biosensor
2.5.1. Chromoionophore Concentration Optimization
Different urea biosensors were prepared by immobilizing urease onto GA-modified SiO2NPs-NH2. The effect of immobilized chromoionophore concentration on the biosensor response was examined from 0.125–0.800 mg chromoionophore/mL ethanol. A calibration curve was obtained for every biosensor in the range of 50–500 mM urea. The biosensor performance was evaluated based on the calculated linear correlation coefficient (R2) and sensitivity values
2.5.2. Buffer Capacity and pH Optimizations
Buffer concentration effect was examined between 10 mM and 100 mM phosphate buffer at pH 7 containing 300 mM urea. The biosensor reflectance response was evaluated at the wavelength of 650 nm. For studying the effect of pH, the reaction medium was varied between pH 6 and pH 8 using 50 mM phosphate buffer solution containing 50–500 mM urea. Three calibration curves for urea at pH 6, pH 7 and pH 8 were then plotted.
2.5.3. Evaluation of Urea Biosensor Response
The biosensor response towards different urea concentrations from 50 to 500 mM in 50 mM phosphate buffer (pH 7) was investigated. Maximum reflectance intensity was captured at the wavelength of 650 nm for each urea standard solution with the urea biosensor. Besides, the response time of the urea biosensor was also optimized.
2.5.4. Determination of Urease Loading and Urea Biosensor Stability
Bradford assay is a rapid and sensitive method to determine protein concentration in the solution [31,32]. Bradford reagent was used in the present study to determine the percentage of immobilized urease and the time taken for urease immobilization. A series of urease concentrations in 50 mM phosphate buffer (pH 7) were prepared in the concentration range of 0–4 mg/mL. A 200 μL aliquot from each enzyme solutions were then transferred into separate cuvettes followed by addition of 325 μL deionized water and 1 mL Bradford reagent. The solutions were thoroughly shaken and incubated for five min. Then, the absorbance spectra were recorded within the wavelength range of 595–800 nm. The Bradford standard curve was then constructed based on the absorbance obtained and standard urease concentration. For the determination of unimmobilized urease adhering to the SiO2 nanoparticles' surfaces, about 1 mL of urease-SiO2NPs from Section 2.4 was centrifuged, and the supernatant liquid was decanted. Some 200 μL of the decanted solution was then mixed with 1 mL of Bradford reagent and 325 μL of deionized water, and incubated for five min followed by absorbance measurement in the wavelength range of 595–800 nm. The incubation time was also varied from 0–90 min to determine the optimum urease incubation time. The stability of the optimized urea biosensor was also assessed. The relative absorbance was calculated and the non-immobilized urease concentration (UI) was estimated based on the Bradford standard curve. And, to determine the amount of immobilized urease, the following equation was used to calculate the percentage of immobilized urease:
2.5.5. Recovery Study of Urea Biosensor
To evaluate the recovery performance of the urea biosensor, a standard procedure for urea determination based on UV-Vis spectrophotometric and DMAB reagent was adopted [33]. The urea contents in both unspiked and spiked urine samples were determined by both biosensor and non-enzymatic DMAB methods. The DMAB reagent was prepared by dissolving 1.6 g of DMAB in 100 mL ethanol in the presence of 10 mL of concentrated HCl. Urea solutions in the working concentration range of 0.5–7.0 mM were prepared from the urea stock solution. Some 2 mL aliquots of each urea solution was separately pipetted into cuvette and reacted with 2 mL of DMAB reagent. The mixtures were then thoroughly shaken and left for 10 min in a water bath at 25 °C. A blank reagent was also prepared by mixing 2 mL of phosphate buffer solution with 2 mL of DMAB reagent in a cuvette. Absorbance reading was measured at the wavelength of 420 nm. A standard calibration curve for DMAB method was then established and the urea concentrations in urine samples determined by both biosensor and DMAB methods were compared.
2.5.6. Selectivity Study of Urea Biosensor
Na+, K+, Mg2+ and NH4+ ions' solutions were prepared in the concentration range of 10−5–10−1 M for interference study of urea biosensor. The urea biosensor was exposed to each interfering ion solution and the reflectance response was obtained at the wavelength of 650 nm. The relationship between reflectance intensity and interfering ion concentration was then plotted. The relative reflectance intensity (ΔInt) was calculated by using Equation (3):
3. Results and Discussion
3.1. Optimization of SiO2NPs Composition
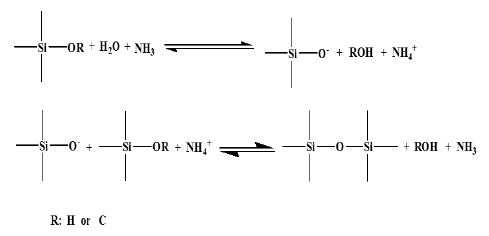
In the sol-gel process, three dimensional inorganic networks formation occurred under acidic or basic medium for the colloidal suspension forming nanometer particles. Three reactions occur in the sol-gel process, namely hydrolysis of an alkoxide, alcohol condensation and water condensation, which then is converted into a gel through polycondensation of the sol [34–37]. The hydrolysis and condensation of TEOS in the Stober method can be illustrated in Figure 2 [38]:
A supersaturated solution of silicic acid occurred as a result of TEOS hydrolysis and condensation of silicic acid as small primary SiO2NPs with diameters of less than 5 nm. The unstable primary particle aggregates are ready to aggregate into bigger particles with large surface charge to prevent the irreversible Brownian aggregation. The SiO2NPs could aggregate with each other due to the chemical affinity of their surfaces to SiO2. Thus, further deposition of silica may allow the formation and assembly into the secondary submicron-sized bigger particles [13,38].
As described in the literature, the size of SiO2NP correlates with the molar ratio of NH3, alcohol, TEOS and water. The nanoparticles size depends on two factors: (1) the reaction kinetics and (2) the colloidal stability, which depends on thermodynamic effects [39]. Surfactant (e.g., C16TAB) is another reported factor could affect the size and distribution of SiO2NPs synthesis [40–43].
In this work, an investigation between SiO2NPs size and its chemical composition was studied at 25 °C. The SiO2NPs chemical compositions prepared under basic medium and the average particle sizes obtained is tabulated in Table 1.
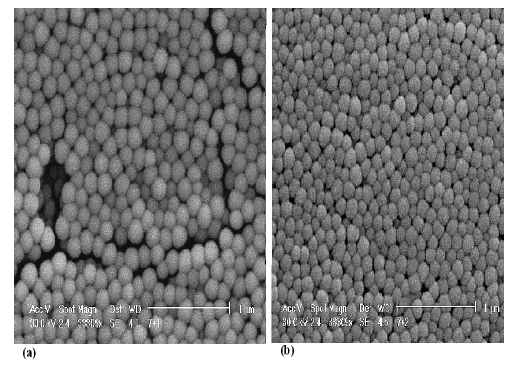
It was found that the higher the volume of ethanol or water the smaller the SiO2NPs size obtained, while higher TEOS or NH3 amount produced larger SiO2NPs size. t2 denotes the optimized SiO2NPs precursor composition with the smallest SiO2NPs size obtained at 153.94 nm. The size distributions of SiO2NPs for t1 and t2 compositions are shown in Figure 3.
3.2. Biochemically Functionalized SiO2NPs
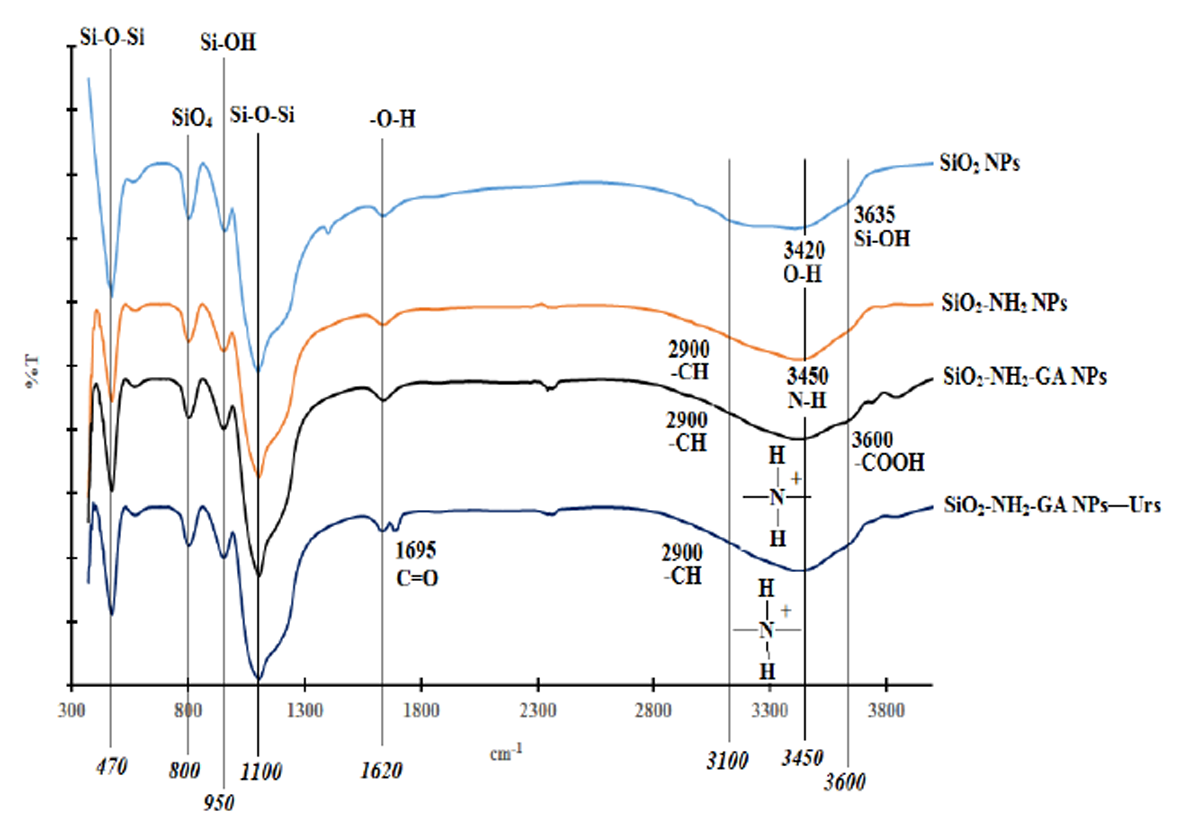
APS was used as a chemical modifier to modify the SiO2NPs with -NH2 groups. GA and GD were used to bind the urease enzyme to SiO2NPs-NH2.The white coloured SiO2NPs-NH2 was noticed to turn to a red colour when cross-linked to GD cross-linker, and the particles remained white in colour with GA cross-linking agent. The white coloured GA-cross-linked SiO2NPs-NH2 was more useful for pH dye indicator immobilization, therefore it was chosen for subsequent urea biosensor construction. Figure 4 illustrates the FTIR spectra of SiO2NPs prepared from the t2 composition, SiO2NPs-NH2, SiO2NPs-NH2-GA and SiO2NPs-NH2-GA-urease.
The pure SiO2NPs has two strong FTIR absorption bands at ∼1100 cm−1 and ∼470 cm−1 due to the extension and flexural vibrations of Si-O-Si bonds. The FTIR absorption band at ∼800 cm−1 corresponds to the vibrations of SiO4 tetrahedrons. The absorption bands at ∼3420 and ∼1620 cm−1 are attributed to the extension and flexural vibrations of O-H bonds in adsorbed water. The absorption bands at ∼3635 and ∼954 cm−1 are due to the vibration of Si-OH bonds [20,44–46].
Absorption bands at ∼470 cm−1, ∼800 cm−1, ∼950 cm−1, ∼1100 cm−1 and ∼1620 cm−1 are observed in SiO2NPs-NH2, SiO2NPs-NH2-GA and SiO2NPs-NH2-GA-urease. These absorption bands are consistent with the previously reported pure SiO2NPs [47]. The FTIR spectrum of SiO2NPs-NH2 shows a broad FTIR absorption band from approximately 3100 to 3700 cm−1, which correspond to hydrogen bonds and partially hydrated silanols. The spectrum shows an FTIR absorption band around 3100 cm−1 from the N-H stretching mode as well as some weaker bands around 2900 cm−1 from the –CH and –CH– stretching modes of alkylamine chains [18,47].
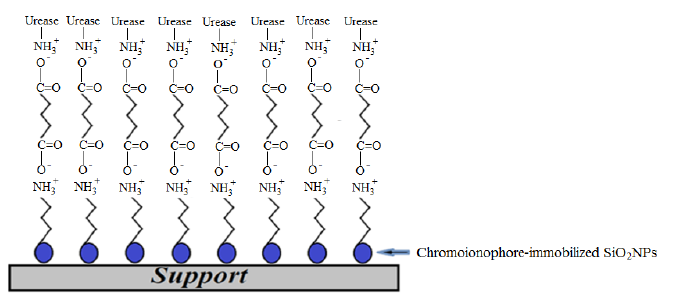
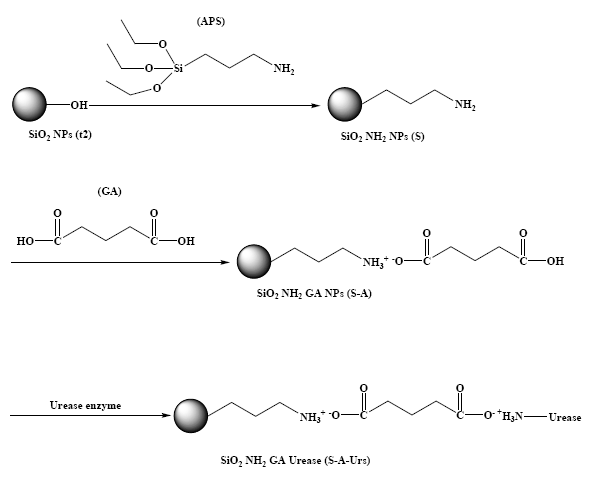
The peak corresponding to N-H stretching is overlapped with the O–H stretching vibrations at ∼3450 cm−1 [47]. Also, C-H stretching bands are seen at ∼3000 cm−1 confirming the presence of propyl chains with -NH2 functional groups [18]. The FTIR spectrum for SiO2NPs-NH2-GA shows simultaneous appearance of a shoulder at about 3600 cm−1, which corresponds to the O-H stretching mode of -COOH functional groups [18]. The strong broad peak observed in the 3100–3450 cm−1 region is attributed to the presence of ammonium (NH4+) ions [48]. The FTIR spectrum for SiO2 NPs-NH2-GA-urease shows an additional peak at 1695 cm−1 that corresponds to C=O stretching related to the amide I band of urease which indicates the presence of immobilized Urs (Ahuja et al. [49]). The FTIR spectrum for SiO2NPs-NH2-GA-urease shows the disappearance of a shoulder at absorption band of 3600 cm−1 due to the reaction between the -COOH group of immobilized GA and the -NH2 group of the enzyme forming an amide (-CONH) bond. Based on FTIR structural analysis, Figure 5 shows a schematic illustration for the SiO2NPs' biochemical surface modification.
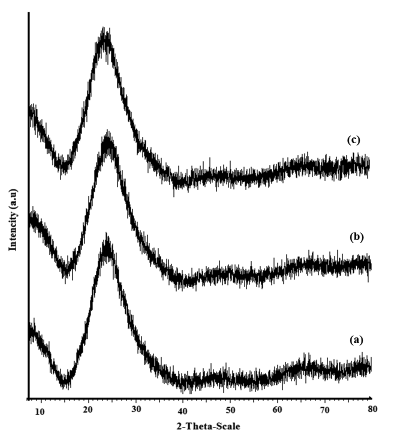
Figure 6 shows the XRD spectra for SiO2NPs (t2 composition), SiO2NPs-NH2 and SiO2NPs-NH2-GA. At 2θ ≈ 24, broad peaks are observed for each spectrum, which are assigned to amorphous structures of silica gel nanoparticles, and indicate the small size or incomplete inner structures of these particles. This demonstrated that a high percentage of these particles are amorphous [50–55].
3.3. Optimization Studies of Urea Biosensor Response
3.3.1. Optimization of Chromoionophore Concentration
Chromoionophore ETH 5294 has an excellent selectivity to proton donors with a wide range of pKa values. The chromoionophore demonstrates changes in optical properties during protonation and deprotonation reactions. It is often used as a pH sensitive dye that forms a blue coloration during protonated state and a red coloration in deprotonated state [16,17]. It has optical transduction properties, which can be used in conjunction with other sensing reagents to detect a wide variety of analytes [56]. When urea is hydrolyzed by the immobilized urease enzyme, the higher hydroxyl ion concentration causes an increase in pH of the reaction medium, and this leads to a colour change in the immobilized chromoionophore, which can be related to the urea concentration [57].
Reflectance spectroscopy investigates the spectral composition of surface-reflected optical radiation, which referred to its angularly dependent intensity and composition of the incident radiation [58,59]. The blue coloured immobilized chromoionophore gives a darker background to the biosensor, which reduces the optical reflected radiation intensity. In view of the variation in reflected light intensity corresponds to the immobilized chromoinophore concentration, an optimization on the immobilized chromoionophore concentration was conducted.
Some four biosensors were prepared with different chromoionophore concentrations. Each biosensor was analyzed within a urea concentration range of 50–500 mM at maximum reflectance wavelengths of 650 nm (for biosensor B1, B2 and B3) and 760 nm (for biosensor B4).The trends of the relation between reflectance intensity and urea concentration with different chromoionophore loadings were plotted. The R2 and sensitivity values of each response curve were calculated and are listed in Table 2. Biosensor B2 showed optimum response with good sensitivity and satisfactory R2 values compared to biosensor B1, B3 and B4. Thus, biosensor B2 was used for further optimization.
3.3.2. Optimization of Urease Immobilization Duration
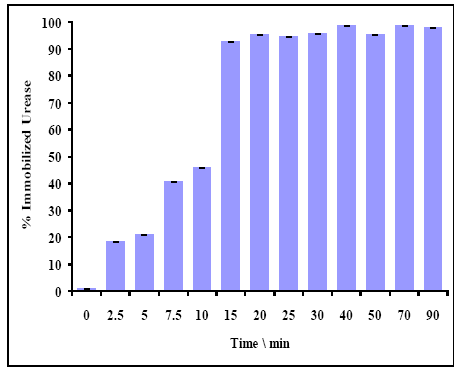
Figure 7 shows the amount of immobilized urease with different enzyme incubation durations. It was noticed that 15 min of enzyme incubation period was sufficient to obtain 100% immobilized urease.
3.3.3. Effect of Buffer Concentration on Biosensor Response
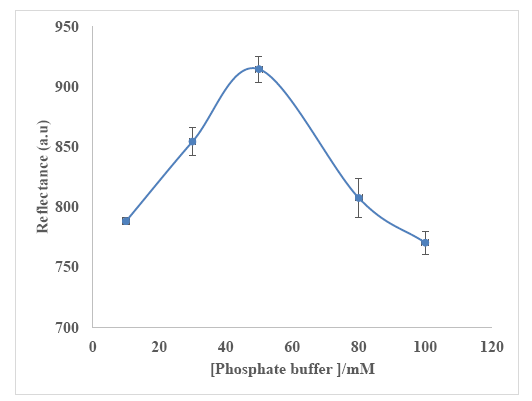
Buffer capacity is an important parameter that must be taken into account to compromise between a high response, repeatability and sensitivity to fluctuations [60,61] of the urea biosensor. Three biosensors were analyzed in the same phosphate buffer concentration range from 10 to 100 mM (pH 7) containing 300 mM urea. The maximum reflectance intensity at 650 nm was obtained at 50 mM phosphate buffer (pH 7) (Figure 8), and this buffer concentration was used throughout the biosensor optimization experiments. The biosensor response declined at phosphate buffer concentration higher than 50 mM due to quenching of enzymatic reaction, whilst lower phosphate buffer concentration gave low ionic concentration effect [60,61].
3.3.4. Optimization of Buffer pH
The buffer pH has an effect on urease hydrolysis rate [62]. Basically, the variation in pH or temperature medium has an ionic strength impact on the enzyme due to changes in the ionic state of the amino acid residuals of the enzyme, and this will further influence the ability of substrate binding with enzyme and ultimately affect the enzymatic reaction rate of urease [63]. Calibration curves for urea biosensor between 50 mM and 500 mM urea were established at pH 6, pH 7 and pH 8. The R2 and sensitivity values for each response curve were calculated and presented in Table 3. The optimum biosensor response was obtained at pH 7 with the highest sensitivity compared to pH 6 and pH 8.The maximum free urease activity has also been reported at pH 7 [64]. Lower and higher pH values inhibited urease activity as the enzyme conformation is altered in both alkaline and acidic reaction media [65].
3.3.5. Dynamic Linear Response Range of the Urea Biosensor
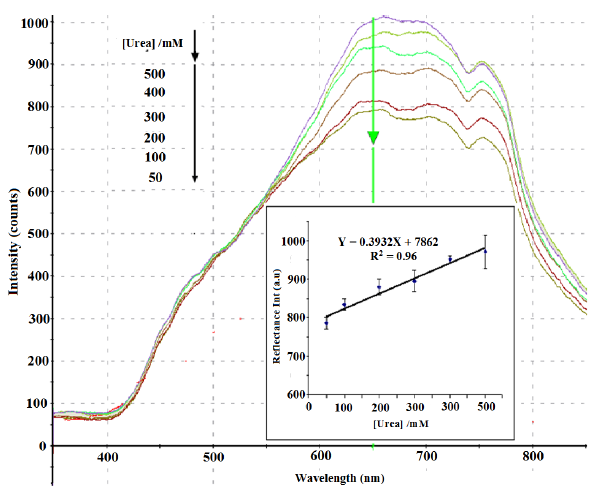
Under optimum conditions, a linear response (Y = 0.3932X + 7862, R2 = 0.96) between 50 mM and 500 mM urea was obtained at the wavelength of 650 nm. The detection limit of the biosensor was 10 mM urea. At this concentration, a slight peak change was observed. The reproducibility RSD values of the biosensor was in the range of 1.7%–4.5% (n = 6). Figure 9 shows the reflectance spectra between 350 to 850 nm and the calibration curve of urea biosensor in 50–500 mM urea. The large response range of the SiO2NPs-based urea biosensor was attributed to the large surface-to-volume ratio of the SiO2NPs, which provided high surface reaction activity and allowed large amount of immobilized urease enzymes [66]. The high enzyme loading increased the hydrolysis of urea, and thus the linearity of the biosensor response to urea has increased to higher urea concentration [57].
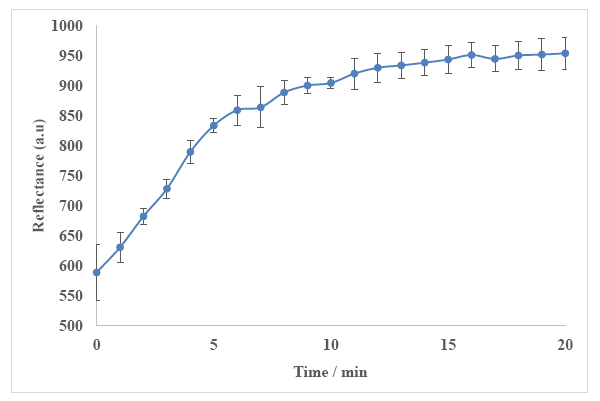
3.3.6. Response Time of the Biosensor
Response time of the biosensor is influenced by kinetic parameters, diffusion barriers, enzyme loading, enzyme activity and enzyme immobilization procedure [67]. The response time study of the biosensor was carried out for 20 min using 500 mM urea in 50 mM phosphate buffer at pH 7. When the urea solution was introduced into the biosensor surface, reflectance measurement was commenced. The reflectance reading was taken every minute until a constant reflectance response was achieved. The reflectance intensity at the wavelength of 650 nm was then plotted against time (Figure 10). Large changes in the biosensor response were observed in the first 6 min. The changes of the biosensor response became less than 4% per minute after 9 min of reaction time and remained rather constant thereafter. Thus, the response time of the optical urea biosensor is approximately 9 min.
3.4. SiO2NPs-based Optical Urea Biosensor Performance
3.4.1. Recovery Performance of the Optical Urea Biosensor
The developed reflectometric urea biosensor response was in the range of 50–500 mM, therefore this biosensor is suitable to determine urea in human urine samples as the urea concentration in human urine is reported to be in the 10–20 mg/mL (166.5–333.0 mM) range (Liu et al. [63]). The performance of the biosensor has been compared with the DMAB spectrophotometric method [33] for urea determination in urine samples. The working range of the DMAB method for urea determination is 0.5–7.0 mM, whereas the biosensor linear response range is from 50 to 500 mM. Therefore, dilutions of urine samples were performed to determine urea concentration using the DMAB method. Figure 11 shows the correlation between the two studied methods. The slope value obtained at 1.0307 is close to one, and thus the biosensor method is comparable to the DMAB standard method. The R2 value of 0.996 indicates a strong correlation between the two methods.
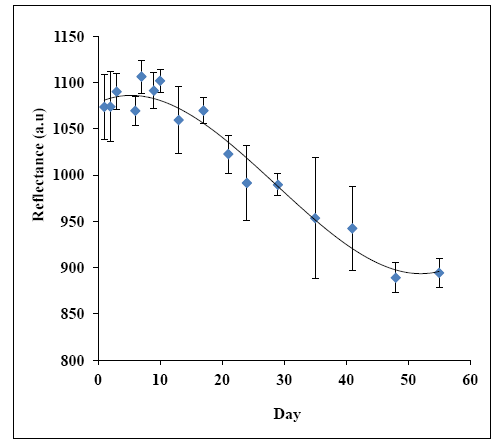
3.4.2. Stability Study of the Biosensor
Enzymes are known for their instability if they are left for a long period of time and are sensitive to their environmental conditions. Generally, the biosensor stability is governed by the stability of the sensing element e.g., the immobilized enzyme [68]. Operational life of a biosensor is important for practical applications and is governed by the immobilization method. In the present study, the urea biosensor stability was studied for about 55 days. The changes of biosensor response over 55 days towards a fixed amount of urea concentration at 500 mM in 50 mM phosphate buffer (pH 7) is shown in Figure 12. The biosensor response was found constant at high reflectance intensity for the first 17 days. Then, the biosensor response decreased gradually with time until the 48th day of the experimental period, and the biosensor response maintained at low reflectance intensity thereafter. The loss of enzyme activity may be occurred in the immobilized state due to denaturation and deactivation of the enzyme, which diminished the biosensor service life [69–71]. Thus, the optical urea biosensor operational period is about 17 days.
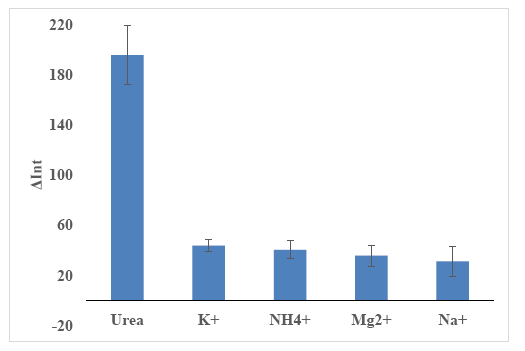
3.4.3. Selectivity of the Biosensor towards Urea
The optimized urea biosensor response is expected to be selective towards urea due to the following reasons: (1) Urease is an enzyme specific to urea catalysis; (2) The chromoionophore is a pH dye sensitive towards pH changes [72]. The immobilized chromoionophore is blue in colour in protonated state and red/pink in deprotonated state [16,17], which corresponds to a reflectance wavelength of 650 nm. To confirm the biosensor selectivity, an interference study was carried out using different concentrations (10−5–10−1 M) of Na+, K+, Mg2+ and NH4+ ions. These cations were chosen because these cations are a common cationic species existing in our urine real sample (Olsauskaite et al. [73]). Based on Figure 13, it is clearly seen that the largest relative reflectance was obtained for urea, and interfering ions (i.e., Na+, K+, Mg2+ and NH4+ ions) gave negligible responses. Therefore, it can be deduced that the biosensor is selective only towards urea.
3.5. Comparison with Other Nanoparticles-Based Optical Urea Biosensors
Several optical urea biosensors based on different kinds of nanoparticle immobilization matrices were reported in the literature (Table 4).
A potentiometric urea biosensor based on urease (Urs) covalently immobilized on multi-walled carbon nanotubes (MWCNTs) embedded in silica matrix deposited on the surface of an indium tin oxide (ITO) coated glass plate was fabricated by Ahuja et al. [49]. The biosensor showed a response in the range of 0.02–1070 mM urea with a response time of around 25 s. A reflectometric urea biosensor was fabricated by Ulianas et al. [74], based on succinimide-modified acrylic microspheres (nBA MPs) immobilized with a Nile blue chromoionophore and urease. The biosensor showed a response in the range of 0.01 to 1000 mM urea with a limit of detection of 9.97 μM.
The optical urea biosensor developed in this research exhibited the largest linear response range of 50–500 mM and detection limit of 10 mM urea, whilst other reported urea biosensors showed linear response range limits of up to 10 mM urea. The large surface area of SiO2NPs enhanced the enzyme and dye loading on the nanoparticles' surfaces. As a result, higher enzyme activity can be achieved and this yielded a larger dynamic linear concentration range of the biosensor. The silica-gel nanoparticles reduced the diffusion barriers to both reactant and product of a biochemical reaction, and shorter biosensor response times were obtained compared to microparticle-based biosensors.
Another significance of using silica-gel nanoparticles is the ability of the immobilization of both sensing materials onto the surface of silica-gel nanoparticles without a leaching problem. The weakness of this biosensor is the low detection limit. As reported by Lee et al. [75], Sheldon et al. [76] and Hanefeld et al. [77], ionic immobilization is a strong enzyme immobilization method but the charge of the carrier could have an effect on the residual enzyme charges or sometimes on the enzyme active site that results in the reduction of the immobilized enzyme activity. Even though the enzyme immobilization method was efficient enough to prevent enzyme leaching from the biosensor, this efficiency affected the sensitivity and the stability of the biosensor due to ionic immobilization effects.
4. Conclusions
Different silica-gel nano-compositions were synthesized based on the Stober method. The pH changes from the immobilized urease enzyme catalysis were found to correlate to urea concentrations, which enabled detection of urea concentrations based on the colour change of the immobilized chromoionophore dye. The use of SiO2NPs for urease and chromoionophore immobilizations demonstrated remarkable analytical improvement in terms of linear response range, reproducibility and selectivity. Due to the large surface area to volume ratio of SiO2NPs, the catalytic efficiency of the enzyme biosensor was improved as higher amounts of enzyme can be loaded. The urea biosensor has been used to determine urea concentration in urine samples, and the result was found to be in good agreement with the established DMAB method.
Acknowledgments
We gratefully acknowledge financial support from the Malaysian Ministry of Sciences, Technology and Innovation (MOSTI) through research grants NND/ND/(2)/TD11-009, and Universiti Kebangsaan research grants DPP-2014-060 and DIP-2012-11.
Author Contributions
Muawia Alqasaimeh: Conducting lab work
Lee Yook Heng: Main supervisor
Musa Ahmad: Co-supervisor
A.S. Santhana Raj: Research collaborator
Tan Ling Ling: Research collaborator
Conflicts of Interest
The authors declare no conflict of interest.
References
- Lee, W.Y.; Kim, S.R.; Kim, T.H.; Lee, K.S.; Shin, M.C.; Park, J.K. Sol-gel-derived thick-film conductometric biosensor for urea determination in serum. Anal. Chim. Acta 2000, 404, 195–203. [Google Scholar]
- Sawicka, K.; Gouma, P.; Sanford, S. Electrospun biocomposite nanofibers for urea biosensing. Sens. Actuators B. Chem. 2005, 108, 585–588. [Google Scholar]
- Rajesh, B.V.; Wataru, T.; Keiichi, K. An amperometric urea biosensor based on covalent immobilization of urease onto an electrochemically prepared copolymer poly(N-3-aminopropyl pyrrole-co-pyrrole) film. Biomaterials 2005, 26, 3683–3690. [Google Scholar]
- Rajesh, B.V.; Takashima, W.; Kaneto, K. A novel thin film urea biosensor based on copolymer poly(N-3-aminopropylpyrrole-co-pyrrole) film. Surface Coat. Technol. 2005, 198, 231–236. [Google Scholar]
- Rajesh, B.V.; Takashima, W.; Kaneto, K. Development of a potentiometric urea biosensor based on copolymer poly(N-3-aminopropyl pyrrole-co-pyrrole) film. React. Funct. Polym. 2005, 62, 51–59. [Google Scholar]
- Rodriguez, B.B.; Bolbot, J.A.; Tothill, I.E. Development of urease and glutamic dehydrogenase amperometric assay for heavy metals screening in polluted samples. Biosens. Bioelectron. 2004, 19, 1157–1167. [Google Scholar]
- Liu, Y.; Cui, T. Ion-sensitive field-effect transistor based pH sensors using nano self-assembled polyelectrolyte/nanoparticle multilayer films. Sens. Actuators B Chem. 2007, 123, 148–152. [Google Scholar]
- Muraviev, D.N.; Macańas, J.; Farre, M.; Mũoz, M.; Alegret, S. Novel routes for inter-matrix synthesis and characterization of polymer stabilized metal nanoparticles for molecular recognition devices. Sens. Actuators B Chem. 2006, 118, 408–417. [Google Scholar]
- Swati, M.; Hase, N.K.; Rohit, S. Nanoengineered optical urea biosensor for estimating hemodialysis parametersin spent dialysate. Anal. Chim. Acta 2010, 676, 68–74. [Google Scholar]
- Duong, H.D.; Rhee, J.I. Use of CdSe/ZnS luminescent quantum dots incorporated within sol-gel matrix for urea detection. Anal. Chim. Acta 2008, 626, 53–61. [Google Scholar]
- Malinowski, P.; Grzegrzółka, I.; Michalska, A.; Maksymiuk, K. Dual potentiometric and UV/Vis spectrophotometric disposable sensors with dispersion cast polyaniline. J. Solid State Electrochem. 2010, 14, 2027–2037. [Google Scholar]
- Chen, H.; He, J. Rapid evaporation-induced synthesis of monodisperse budded silica spheres. J. Colloid Interface Sci. 2007, 316, 211–215. [Google Scholar]
- Inai, S.; Harao, A.; Nishikawa, H. Correlation between the luminescence properties and the surface structures of submicron silica particles. J. Non-Crystalline Solids 2007, 353, 510–513. [Google Scholar]
- Csogor, Z.; Nackena, M.; Sametib, M.; Lehrb, C.-M.; Schmidta, H. Modified silica particles for gene delivery. Mater. Sci. Eng. C 2003, 23, 93–97. [Google Scholar]
- Liu, S.; Lu, L.; Yang, Z.; Cool, P.; Vansant, E.F. Further investigations on the modified Stober method for spherical MCM-41. Mater. Chem. Phys. 2006, 97, 203–206. [Google Scholar]
- Wong, F.C.M.; Ahmad, M.; Heng, L.Y.; Peng, L.B. An optical biosensor for dichlovos using stacked sol-gel films containing acetylcholinesterase and a lipophilic chromoionophore. Talanta 2006, 69, 888–893. [Google Scholar]
- Choi, M.M.F.; Chung, K.O.P.; Wu, X. Nicotine derivative optode membrane with nonactin as ionophore. Talanta 2002, 56, 1027–1038. [Google Scholar]
- Balas, F.; Rodríguez-Delgado, M.; Otero-Arean, C.; Conde, F.; Matesanz, E.; Esquivias, L.; Ramírez-Castellanos, J.; Gonzalez-Calbet, J.; Vallet-Regí, M. Structural characterization of nanosized silica spheres. Solid State Sci. 2007, 9, 351–356. [Google Scholar]
- Kim, M.; Ok Ham, H.; Oh, S.-D.; Park, H.G.; Chang, H.N.; Choi, S.-H. Immobilization of Mucorjavanicus lipase on effectively functionalized silica nanoparticles. J. Mol. Catal. B Enzym. 2006, 39, 62–68. [Google Scholar]
- Liu, G.; Yang, X.; Wang, Y. Silica/poly (N, N0-methylenebisacrylamide) composite materials by encapsulation based on a hydrogen-bonding interaction. Polymer 2007, 48, 4385–4392. [Google Scholar]
- Petit, L.; Griffin, J.; Carlie, N.; Jubera, V.; García, M.; Hernández, F.E.; Richardson, K. Luminescence properties of Eu3+ or Dy3+/Au co-doped SiO2 nanoparticles. Mater. Lett. 2007, 61, 2879–2882. [Google Scholar]
- Gu, S.; Kondo, T.; Konno, M. Preparation of silica–polystyrene core–shell particles up to micron sizes. J. Colloid Interface Sci. 2004, 272, 314–320. [Google Scholar]
- Shi, B.; Wang, Y.; Ren, J.; Liu, X.; Zhang, Y.; Guo, Y.; Guo, Y.; Lu, G. Super paramagnetic aminopropyl-functionalized silica core-shell microspheres as magnetically separable carriers for immobilization of penicillin G acylase. J. Mol. Catal. B Enzym. 2010, 63, 50–56. [Google Scholar]
- Sun, Y.; Yan, F.; Yang, W.; Sun, C. Multilayered construction of glucose oxidase and silica nanoparticles on Au electrodes based on layer-by-layer covalent attachment. Biomaterials 2006, 27, 4042–4049. [Google Scholar]
- Shi, B.; Wang, Y.; Guo, Y.; Wang, Y.; Wang, Y.; Guo, Y.; Zhang, Z.; Liu, X.; Lu, G. Aminopropyl-functionalized silicas synthesized by W/O microemulsion for immobilization of penicillin G acylase. Catal. Today 2009, 148, 184–188. [Google Scholar]
- Park, S.W.; Kim, Y.I.; Chung, K.H.; Hong, S.I.; Kim, S.W. Covalent immobilization of GL-7-ACA acylase on silica gel through silanization. React. Funct. Polym. 2002, 51, 79–92. [Google Scholar]
- Koopal, L.K.; Yang, Y.; Minnaard, A.J.; Theunissen, P.L.M.; van Riemsdijk, W.H. Chemical immobilisation of humic acid on silica. Colloids Surfaces A Physicochem. Eng. Asp. 1998, 141, 385–395. [Google Scholar]
- Liu, X.; Xing, J.; Guan, Y.; Shan, G.; Liu, H. Synthesis of amino-silane modified superparamagnetic silica supports and their use for protein immobilization. Colloids Surfaces A Physicochem. Eng. Asp. 2004, 238, 127–131. [Google Scholar]
- Šulek, F.; Drofenik, M.; Habulin, M.; Knez, Ž. Surface functionalization of silica-coated magnetic nanoparticles for covalent attachment of cholesterol oxidase. J. Magn. Magn. Mater. 2010, 322, 179–185. [Google Scholar]
- Zhu, N.; Cai, H.; He, P.; Fang, Y. Tris(2,2′-bipyridyl)cobalt(III)-doped silica nanoparticle DNA probe for the electrochemical detection of DNA hybridization. Anal. Chim. Acta 2003, 481, 181–189. [Google Scholar]
- Zor, T.; Selinger, Z. Linearization of the bradford protein assay increases its sensitivity: Theoretical and experimental studies. Anal. Biochem. 1996, 36, 302–308. [Google Scholar]
- Bradford, M.M. A dye binding assay for protein. Anal. Biochem. 1976, 72, 248–254. [Google Scholar]
- Williams, S. Official Methods of Analysis of the Association of Official Analytical Chemists; The Association of Official Analytical Chemists Inc.: Colombia, MD, USA, 1984. [Google Scholar]
- Estella, J.; Echeverria, J.C.; Laguna, M.; Garrido, J.J. Silica xerogels of tailored porosity as support matrix for optical chemical sensors. Simultaneous effect of pH, ethanol:TEOS and water:TEOS molar ratios, and synthesis temperature on gelation time, and textural and structural properties. J. Non-Crystalline Solids 2007, 353, 286–294. [Google Scholar]
- Jerónimo, P.C.A.; Araújo, A.N.; Montenegro, M.C.B.S.M. Development of a sol-gel optical sensor for analysis of zinc in pharmaceuticals. Sens. Actuators B 2004, 103, 169–177. [Google Scholar]
- Tess Mark, E.; Cox James, A. Chemical and biochemical sensors based on advances in materials chemistry. J. Pharm. Biomed. Anal. 1999, 19, 55–68. [Google Scholar]
- Jerónimo, P.C.A.; Araujo, A.N.; Montenegro, M.C.B.S.M. Optical sensors and biosensors based on sol-gel films. Talanta 2007, 72, 13–27. [Google Scholar]
- Lu, Z.; Dai, J.; Song, X.; Wang, G.; Yang, W. Facile synthesis of Fe3O4/SiO2 composite nanoparticles from primary silica particles. Colloids Surfaces A Physicochem. Eng. Asp. 2008, 317, 450–456. [Google Scholar]
- Plumeré, N.; Ruff, A.; Speiser, B.; Feldmann, V.; Mayer, H.A. Stober silica particles as basis for redox modifications: Particle shape, size, polydispersity, and porosity. J. Colloid Interface Sci. 2012, 368, 208–219. [Google Scholar]
- Caparrós, C.; Benelmekki, M.; Martins, P.M.; Xuriguera, E.; Silva, C.J.R.; Martinez, L.I.M.; Lanceros-Méndez, S. Hydrothermal assisted synthesis of iron oxide-based magnetic silica spheres and their performance in magnetophoretic water purification. Mater. Chem. Phys. 2012, 135, 510–517. [Google Scholar]
- Zhang, J.; Xu, L.; Rosenholm, J.; Gu, H. Synthesis and characterization of pore size-tunable magnetic mesoporous silica nanoparticles. J. Colloid Interface Sci. 2011, 361, 16–24. [Google Scholar]
- Wang, S.; Li, B.; Bi, L.; Zhang, M.; Chen, Y.; Li, Y.; Yang, Y. Preparation of helical mesoporous ethylene-silica nanofibers using CTAB and (S)-2-methyl-1-butanol. Mater. Lett. 2011, 65, 2261–2264. [Google Scholar]
- Kowalczyk, B.; Lagzi, I.; Grzybowski, B.A. Nanoseparations: Strategies for size and/or shape-selective purification of nanoparticles. Curr. Opin. Colloid Interface Sci. 2011, 16, 135–148. [Google Scholar]
- Xu, G.Q.; Zheng, Z.X.; Tang, W.M.; Wu, Y.C. Multi-peak behavior of photoluminescence of silica particles heat-treated in hydrogen at elevated temperature. J. Lumin. 2007, 126, 43–47. [Google Scholar]
- Rubio, E.; Almaral, J.; Ramirez-Bon, R.; Castano, V.; Rodriguez, V. Organic-inorganic hybrid coating (poly(methyl methacrylate)/monodisperse silica). Opt. Mater. 2005, 27, 1266–1269. [Google Scholar]
- Xiao, Q.-G.; Tao, X.; Zou, H.-K.; Chen, J.-F. Comparative study of solid silica nanoparticles and hollow silica nanoparticles for the immobilization of lysozyme. Chem. Eng. J. 2008, 137, 38–44. [Google Scholar]
- Vejayakumaran, P.; Rahman, I.A.; Sipaut, C.S.; Ismail, J.; Chee, C.K. Structural and thermal characterizations of silica nanoparticles grafted with pendant maleimide and epoxide groups. J. Colloid Interface Sci. 2008, 328, 81–91. [Google Scholar]
- Vivekanandhan, S.; Venkateswarlu, M.; Satyanarayana, N. Ammonium carboxylates assisted combustion process for the synthesis of nanocrystalline LiCoO2 powders. Mater. Chem. Phys. 2008, 109, 241–248. [Google Scholar]
- Ahuja, T.; Kumar, D.; Singh, N.; Biradar, A.M.; Rajesh. Potentiometric urea biosensor based on multi-walled carbon nanotubes(MWCNTs)/silica composite material. Mater. Sci. Eng. C 2011, 31, 90–94. [Google Scholar]
- Singho, N.D.; Johan, M.R. Complex Impedance Spectroscopy Study of Silica Nanoparticles Via Sol-Gel Method. Int. J. Electrochem. Sci. 2012, 7, 5604–5615. [Google Scholar]
- Park, J.T.; Seo, J.A.; Ahn, S.H.; Kim, J.H.; Kang, S.W. Surface modification of silica nanoparticles with hydrophilic polymers. J. Ind. Eng. Chem. 2010, 16, 517–522. [Google Scholar]
- Debnath, N.; Mitra, S.; Das, S.; Goswami, A. Synthesis of surface functionalized silica nanoparticles and their use as entomotoxic nanocides. Powder Technol. 2012, 221, 252–256. [Google Scholar]
- Song, X.; Jiang, N.; Li, Y.; Xu, D.; Qiu, G. Synthesis of CeO2-coated SiO2 nanoparticle and dispersion stability of its suspension. Mater. Chem. Phys. 2008, 110, 128–135. [Google Scholar]
- Singh, L.P.; Agarwal, S.K.; Bhattacharyya, S.K.; Sharma, U.; Ahalawat, S. Preparation of Silica Nanoparticles and Its Beneficial Role in Cementitious Materials. Nanomater. Nanotechnol. 2011, 1, 44–51. [Google Scholar]
- Ye, C.; Kong, Q.; Wu, R.; Hu, J.; Chen, Z.; Li, A. Synthesis and enhanced electrochemical properties of pod-shaped gold/silica nanoparticles. Mater. Lett. 2010, 64, 1720–1723. [Google Scholar]
- Long, R.; Bakker, E. Optical determination of ionophore diffusion coefficients in plasticized poly(vinyl chloride) sensing films. Anal. Chim. Acta 2004, 511, 91–95. [Google Scholar]
- Alqasaimeh, M.S.; Heng, L.Y.; Ahmad, M. A Urea Biosensor from Stacked Sol-Gel Films with Immobilized Nile Blue Chromoionophore and Urease Enzyme. Sensors 2007, 7, 2251–2262. [Google Scholar]
- Filik, H.; Aksu, D.; Apaka, R.; Sener, I.; Kilic, E. An optical fibre reflectance sensor for p-aminophenol determination based ontetrahydroxycalix[4]arene as sensing reagent. Sens. Actuators B Chem. 2009, 136, 105–112. [Google Scholar]
- Filik, H.; Hayvali, M.; Kilic, E.; Apak, R.; Aksu, D.; Yanaz, Z.; Cenge, T.L. Development of an optical fibre reflectance sensor for p-aminophenol detection based on immobilised bis-8-hydroxyquinoline. Talanta 2008, 77, 103–109. [Google Scholar]
- Kuralay, F.; Ozyoruk, H.; Yildiz, A. Potentiometric enzyme electrode for urea determination using immobilized urease in poly(vinylferrocenium) film. Sens. Actuators B Chem. 2005, 109, 194–199. [Google Scholar]
- Kriz, D.; Johansson, A. A preliminary study of a biosensor based on flow injection of the recognition element. Biosens. Bioelectron. 1996, 11, 1259–1265. [Google Scholar]
- Kovacs, B.; Nagy, G.; Dombi, R.; Toth, K. Optical biosensor for urea with improved response time. Biosens. Bioelectron. 2003, 18, 111–118. [Google Scholar]
- Liu, D.; Chen, K.; Ge, K.; Nie, L.; Yao, S. urea sensor based on combining the surface acoustic wave device with urease extracted from green soya bean and its application-determination of urea in human urine. Biosens. Bioelectron. 1996, 11, 435–442. [Google Scholar]
- Yang, Z.; Si, S.; Dai, H.; Zhang, C. Piezoelectric urea biosensor based on immobilization of urease onto nanoporous alumina membranes. Biosens. Bioelectron. 2007, 22, 3283–3287. [Google Scholar]
- Limbut, W.; Thavarungkul, P.; Kanatharana, P.; Asawatreratanakul, P.; Limsakul, C.; Wongkittisuksa, B. Comparative study of controlled pore glass, silica gel and Poraver for the immobilization of urease to determine urea in a flow injection conductimetric biosensor system. Biosens. Bioelectron. 2004, 19, 813–821. [Google Scholar]
- Zheng, B.; Xie, S.; Qian, L.; Yuan, H.; Xiao, D.; Choi, M.M.F. Gold nanoparticles-coated eggshell membrane with immobilized glucose oxidase for fabrication of glucose biosensor. Sens. Actuators B Chem. 2011, 152, 49–55. [Google Scholar]
- Mutlu, S.; Mutlu, M.; Pipkin, E. A kinetic approach to oxidase based enzyme electrodes: The effect of enzyme layer formation on the response time. Biochem. Eng. J. 1998, 1, 39–43. [Google Scholar]
- Stikoniene, O.; Ivanauskas, F.; Laurinavicius, V. The influence of external factors on the operational stability of the biosensor Response. Talanta 2010, 81, 1245–1249. [Google Scholar]
- Campas, M.; Prieto-Simon, B.; Marty, J. A review of the use of genetically engineered enzymes in electrochemical biosensors. Semin. Cell Dev. Biol. 2009, 20, 3–9. [Google Scholar]
- Gouda, M.D.; Kumar, M.A.; Thakur, M.S.; Karanth, N.G. Enhancement of operational stability of an enzyme biosensor for glucose and sucrose using protein based stabilizing agents. Biosens. Bioelectron. 2002, 17, 503–507. [Google Scholar]
- Sassolas, A.; Blum, L.J.; Leca-BouvierBéatrice, D. Research review paper Immobilization strategies to develop enzymatic biosensors. Biotechnol. Adv. 2012, 30, 489–511. [Google Scholar]
- Krajewska, B.; Ureases, I. Functional, catalytic and kinetic properties: A review. J. Mol. Catal. B Enzym. 2009, 59, 9–21. [Google Scholar]
- Olsauskaite, V.; Paliulionyte, V.; Padarauskas, A. Rapid analysis of cation constituents of urine by capillary electrophoresis. Clin. Chim. Acta 2000, 293, 181–186. [Google Scholar]
- Ulianas, A.; Heng, L.Y.; Ahmad, M. A Biosensor for Urea from Succinimide-Modified Acrylic Microspheres Based on Reflectance Transduction. Sensors 2011, 1, 8323–8338. [Google Scholar]
- Lee, C.-H.; Lin, T.-S.; Chung, M.Y. Mesoporous materials for encapsulating enzymes. Nano Today 2009, 4, 165–179. [Google Scholar]
- Sheldon, R.A. Enzyme Immobilization: The Quest for Optimum Performance. Adv. Synth. Catal. 2007, 349, 1289–1307. [Google Scholar]
- Hanefeld, U.L.F.; Gardossi, L.; Magner, E. Understanding enzyme immobilization. R. Soc. Chem. 2009, 38, 453–468. [Google Scholar]


| SiO2NPs Composition | TEOS (mL) | EtOH (mL) | NH3 (mL) | H2O (mL) | C16TAB (mg) | Size (nm) | SD |
|---|---|---|---|---|---|---|---|
| E1 | 1 | 30 | 4 | 255.45 | 14.49 | ||
| E7 | 1 | 24 | 4 | 285.20 | 14.18 | ||
| E13 | 1 | 18 | 4 | 322.26 | 18.04 | ||
| E20 | 1 | 11 | 4 | 451.10 | 12.03 | ||
| T1 | 0.5 | 20 | 4 | 261.12 | 18.17 | ||
| T4 | 0.8 | 20 | 4 | 285.30 | 10.84 | ||
| T8 | 1.2 | 20 | 4 | 309.43 | 12.68 | ||
| T11 | 1.5 | 20 | 4 | 325.72 | 14.77 | ||
| H1 | 1 | 20 | 4 | 0.5 | 319.56 | 18.72 | |
| H5 | 1 | 20 | 4 | 2.5 | 292.79 | 14.32 | |
| H9 | 1 | 20 | 4 | 4.5 | 264.06 | 30.46 | |
| H13 | 1 | 20 | 4 | 6.5 | 258.22 | 25.02 | |
| N5 | 1 | 20 | 3 | 280.18 | 7.13 | ||
| N9 | 1 | 20 | 5 | 316.09 | 19.31 | ||
| N13 | 1 | 20 | 7 | 322.97 | 26.25 | ||
| N17 | 1 | 20 | 9 | 326.76 | 30.04 | ||
| C4 | 1 | 20 | 4 | 1.2 | 100 | - | - |
| C9 | 1 | 20 | 4 | 1.2 | 200 | - | - |
| C14 | 1 | 20 | 4 | 1.2 | 300 | - | - |
| C19 | 1 | 20 | 4 | 1.2 | 400 | - | - |
| t1 | 0.4 | 20 | 0.8 | 1.6 | 194.60 | 10.65 | |
| t2 | 2 | 20 | 0.8 | 1.6 | 153.94 | 25.04 | |
| t3 | 1.2 | 20 | 0.4 | 1.6 | - | - | |
| t4 | 1.2 | 20 | 1.6 | 1.6 | 263.99 | 13.71 |
E: variation in ethanol volume, T: variation in TEOS volume, H: variation in H2O volume, N: variation in NH3volume, C: variation in CTAB volume, t: trial compositions.
| Biosensor | Chromoionophore wt/mg | Wavelength (nm) | Correlation Coefficient, R2 | Sensitivity | Linear Range (mM) |
|---|---|---|---|---|---|
| B1 | 0.10 | 650 | 0.7204 | 0.1957 | 50–500 |
| B2 | 0.20 | 650 | 0.9609 | 0.3932 | 50–500 |
| B3 | 0.25 | 650 | 0.9384 | 0.3985 | 50–500 |
| B4 | 0.64 | 760 | 0.9417 | 0.3056 | 50–500 |
| pH | The Correlation Coefficient, R2 | Sensitivity | Linear Range (mM) |
|---|---|---|---|
| 6 | 0.7896 | 0.2639 | 50–500 |
| 7 | 0.9609 | 0.3932 | 50–500 |
| 8 | 0.8637 | 0.2410 | 50–500 |
| Method | Immobilization Matrix | Linear Range (mM) | Detection Limit (mM) | Response Time (min) | Reference |
|---|---|---|---|---|---|
| UV/Vis spectrophotometric | calcium alginate microspheres | 0.017–10 | 0.017 | 8 | [9] |
| Fluorometric | Sol-gel | 0–10 | - | 0.2 | [10] |
| UV/Vis spectrophotometric | PANI/cellulose polyacetate membrane | 1–10 | 1 | 3 | [11] |
| potentiometric | Urs/MWCNTs/SiO2/ITO | 0.0218–1070 | - | 0.4 | [49] |
| Reflectance spectrophotometric | nBA MPs | 0.00997 | 10 | [74] | |
| Reflectance spectrophotometric | SiO2NPs | 50–500 | 10 | 6 | Present work |
© 2014 by the authors; licensee MDPI, Basel, Switzerland. This article is an open access article distributed under the terms and conditions of the Creative Commons Attribution license ( http://creativecommons.org/licenses/by/3.0/).
Share and Cite
Alqasaimeh, M.; Heng, L.Y.; Ahmad, M.; Raj, A.S.S.; Ling, T.L. A Large Response Range Reflectometric Urea Biosensor Made from Silica-Gel Nanoparticles. Sensors 2014, 14, 13186-13209. https://doi.org/10.3390/s140713186
Alqasaimeh M, Heng LY, Ahmad M, Raj ASS, Ling TL. A Large Response Range Reflectometric Urea Biosensor Made from Silica-Gel Nanoparticles. Sensors. 2014; 14(7):13186-13209. https://doi.org/10.3390/s140713186
Chicago/Turabian StyleAlqasaimeh, Muawia, Lee Yook Heng, Musa Ahmad, A.S. Santhana Raj, and Tan Ling Ling. 2014. "A Large Response Range Reflectometric Urea Biosensor Made from Silica-Gel Nanoparticles" Sensors 14, no. 7: 13186-13209. https://doi.org/10.3390/s140713186