Effect of CSA Concentration on the Ammonia Sensing Properties of CSA-Doped PA6/PANI Composite Nanofibers

Abstract
: Camphor sulfonic acid (CSA)-doped polyamide 6/polyaniline (PA6/PANI) composite nanofibers were fabricated using in situ polymerization of aniline under different CSA concentrations (0.02, 0.04, 0.06, 0.08 and 0.10 M) with electrospun PA6 nanofibers as templates. The structural, morphological and ammonia sensing properties of the prepared composite nanofibers were studied using scanning electron microscopy (SEM), Fourier transform infrared spectroscopy (FT-IR), four-point probe techniques, X-ray diffraction (XRD) and a home-made gas sensing test system. All the results indicated that the CSA concentration had a great influence on the sensing properties of CSA-doped PA6/PANI composite nanofibers. The composite nanofibers doped with 0.02 M CSA showed the best ammonia sensing properties, with a significant sensitivity toward ammonia (NH3) at room temperature, superior to that of the composite nanofibers doped with 0.04–0.10 mol/L CSA. It was found that for high concentrations of CSA, the number of PANI–H+ reacted with NH3 would not make up a high proportion of all PANI–H+ within certain limits. As a result, within a certain range even though higher CSA-doped PA6/PANI nanofibers had better conductivity, their ammonia sensing performance would degrade.1. Introduction
Gas sensors are important in environmental monitoring, home safety and chemical control [1]. Conducting polymers can work as gas sensors at room temperature [2,3], which is a competitive advantage compared with metal or metal oxides. As a result, conducting polymers have recently attracted more attention for realizing their applications in gas sensors [4,5]. Polyaniline (PANI) is a typical conducting polymer, having distinctive redox properties, good thermal stability [6,7], controllable conductivity and an easy fabrication process [8]. Due to these interesting properties, PANI has been a good potential candidate in batteries [9], electrochromic materials [10], electromagnetic shielding materials [11,12], metal anticorrosion products [13], tissue engineering [14] and sensing applications [15,16]. It is known that the conductivity of PANI can be influenced by some important factors, such as effective degree of polymerization, percentage of crystallinity, oxidation state level, percentage of doping, and type of dopant [17]. Depending on the oxidation states and doping processes, polyaniline has four forms: fully reduced leucoemeraldine base (LB), half oxidized emeraldine base (EB), half oxidized and protonated conducting emeraldine salt (ES), and fully oxidized pernigraniline base (PB) [18]. The ES state is highly conducting, while the others are mainly insulating in nature. By now, significant research efforts have been made to study the mechanism of doping or the effects of dopant on the properties of PANI. For example, Wang et al. [17] fabricated nanostructured PANI counter electrodes (CEs) using different H2SO4 doping concentrations for applications in dye-sensitized solar cells (DSSCs). It was found that PANI CE polymerized with 0.35 M H2SO4 shows the best photovoltaic performance with a solar-to-energy conversion efficiency of up to 5.57%. Arenas et al. [19] synthesized PANI with bicyclic aliphatic camphor sulfonic acid (CSA), aromatic toluenesulfonic acid (TSA) and carboxylic trifluoroacetic acid (TFA) were employed as dopants, and CSA mixed with TSA and CSA mixed with TFA were employed as the co-doping materials. The prepared PANI obtained from TSA-doping is the most sensitive in ammonia gas sensing. In addition, many researchers chose CSA as dopant. Patil et al. [1] prepared CSA-doped PANI-ZnO nanocomposites by grinding 10–50 wt.% of CSA into PANI-ZnO nanocomposite powder and then studied their ammonia sensing properties. Wu et al. [20] synthesized PANI by in situ polymerization of aniline with CSA as dopant, and then the sensors based on micro/nano-PANI were directly fabricated onto the interdigital electrodes by a self-assembly method. Zhou et al. [21] dissolved PANI and CSA into chloroform and m-cresol, and then the product was cast on slides to obtain CSA-PANI films. However, many of the materials mentioned above are powders, and for many functional materials, especially for those applied to sensors, specific surface area is very important. Nanofibers have larger specific surface area and their shapes are controllable. There are already several published papers dealing with the preparation of PANI-based nanofibers. Nevertheless, there are few reporting the effects of CSA concentration on the ammonia sensing properties of PANI-based composite nanofibers.
In this work, for the first time, CSA-doped PA6/PANI composite nanofibers were prepared as ammonia sensors by in situ polymerization of aniline under different CSA concentration (0.02, 0.04, 0.06, 0.08 and 0.10 M) conditions with electrospun PA6 nanofibers as templates. The ammonia sensing properties of the composite nanofibers and the sensing mechanism were studied and discussed.
2. Experimental Section
2.1. Materials
Polyamide 6 (PA6) (Mw = 2.1 × 10⁴ g/mol) was obtained from Zig Zheng Industrial Co. Ltd. (Taibei, Taiwan). Formic acid (FA), aniline monomer, ammonium persulfate (APS) and ammonium hydroxide (NH3·H2O) were purchased from Sinopharm Chemical Reagent Co. Ltd. (Beijing, China). (1S)-(+)-10-Camphorsulfonic acid (CSA) was purchased from Aladdin Reagent Database Inc. (Shanghai, China). All chemicals and reagents were used as received, except for aniline monomer, which was distilled twice under reduced pressure before use. Distilled water was used in this study.
2.2. Preparation of CSA-Doped PA6/PANI Composite Nanofibers
PA6 nanofibers were prepared by electrospinning PA6/FA solutions of 20 wt.% PA6 concentration. Firstly, aniline and APS were dissolved separately in CSA aqueous solutions, at a mole ratio of aniline to APS of 1:1. The CSA concentrations of the aqueous solutions were 0.02, 0.04, 0.06, 0.08 and 0.10 M, respectively. Secondly, the electrospun PA6 nanofibers were immersed into the aniline/CSA solution for 30 min. Then, polymerization of aniline was initiated by dropping the APS/CSA solution into the above diffusion bath. PANI was synthesized on the surface of PA6 nanofibers and doped with CSA at 0–5 °C for 5 h. Finally, the samples were taken out and the rest of the PANI in the bath was also collected by filtration. All composite nanofibers and CSA-PANI nanopowders (490–620 nm) were washed with deionized water followed by acetone, and dried in vacuum at 50 °C for 24 h.
2.3. Characterization
The surface morphologies of the CSA-doped PA6/PANI composite nanofibers were investigated using a field emission scanning electron microscope (FESEM, S-4800, Hitachi, Tokyo, Japan). Fourier transform infrared (FTIR) spectra were obtained in the range of 4000–400 cm−1 with a 4 cm−1 spectral resolution by using a NEXUS 470 spectrometer (Nicolet, Madison, WI, USA). The conductive properties of the composite nanofibers and composite nanopowders were investigated by four-point probe techniques. The crystalline structure analysis was also performed on a D8 Advance X-diffractometer (Bruker AXS, Billerica, Germany), over the 2θ range of 3°–90°. The particle diameter was measured by Brookhaven Instruments (Zeta Plus, Holtsville, NY, USA).
2.4. Ammonia Sensing Tests
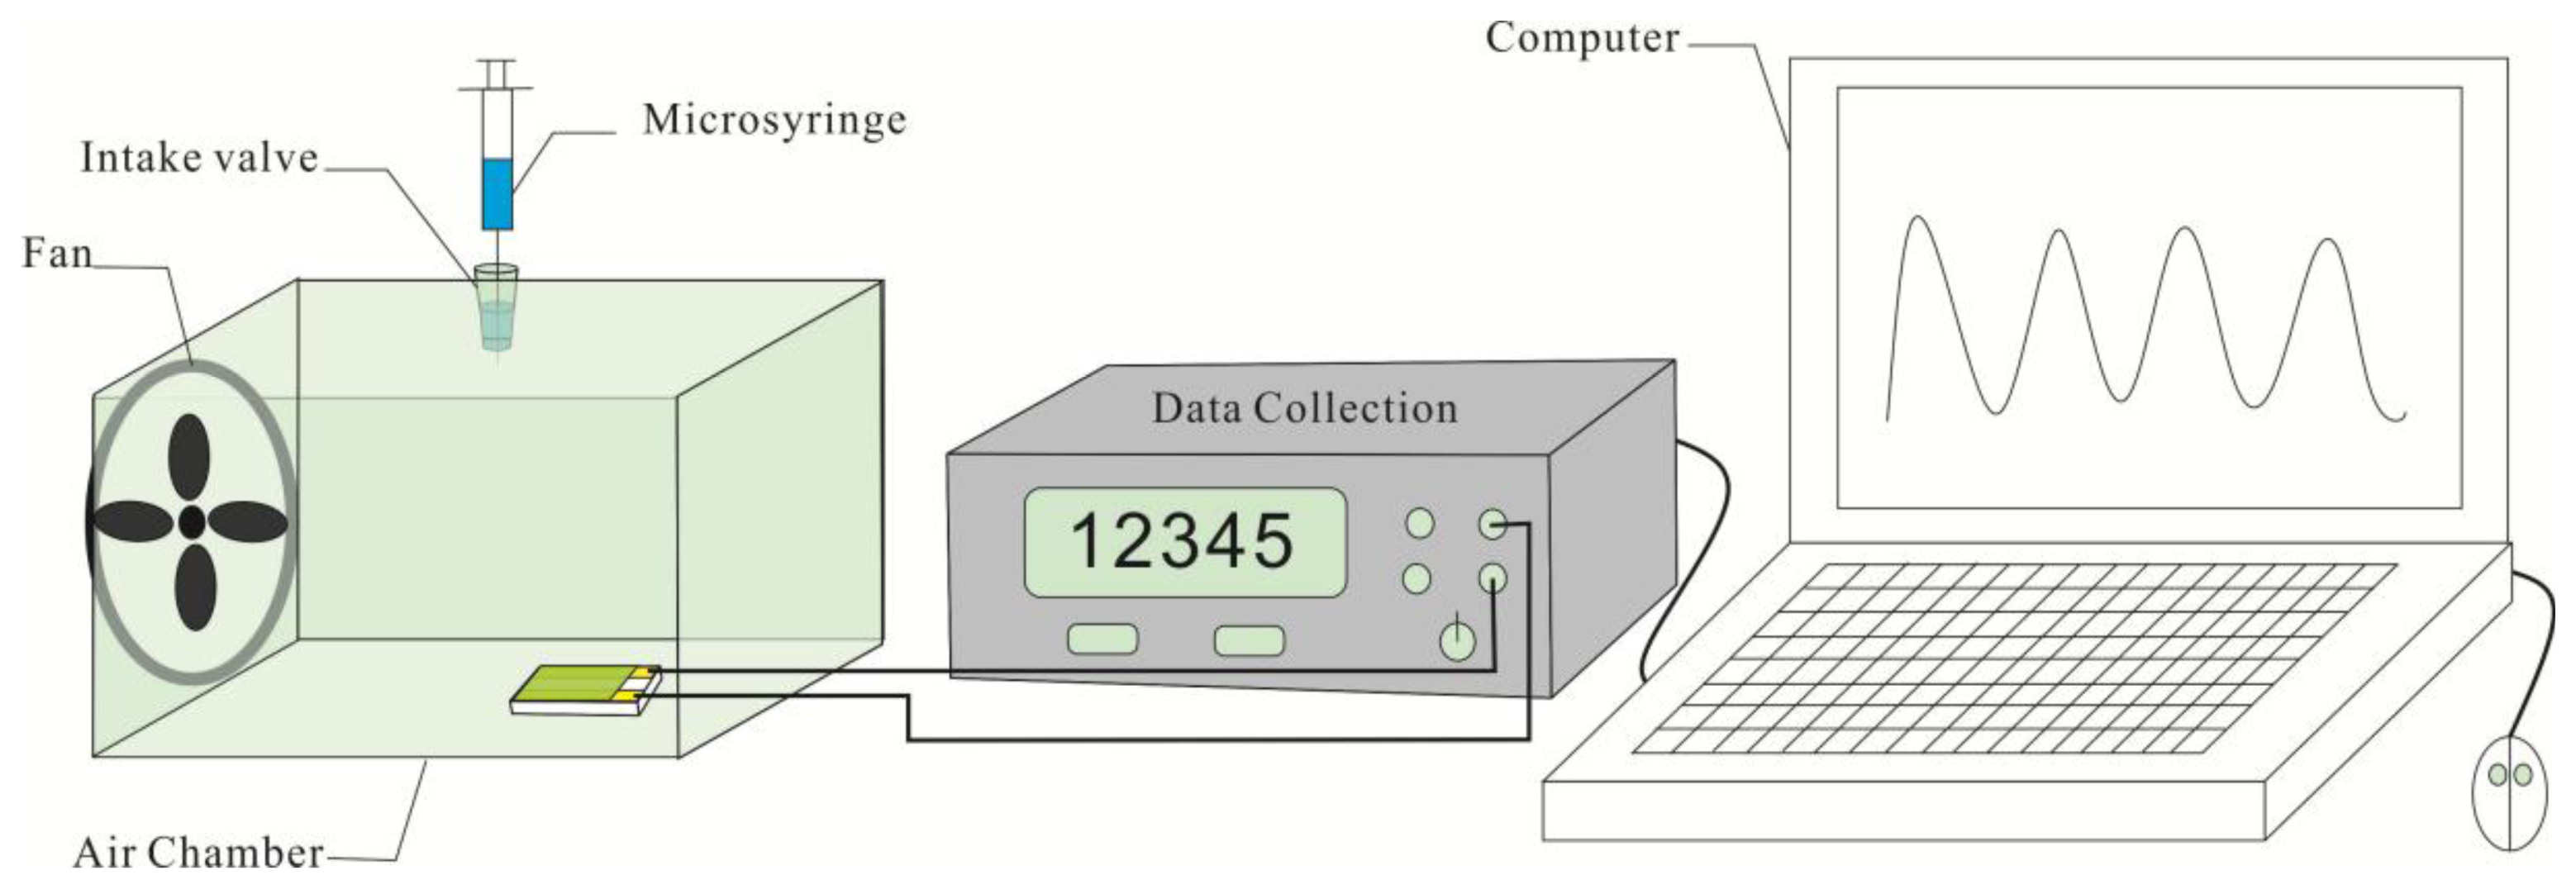
The sensing behaviors of the samples to NH3 were investigated with a home-made test system as shown in Figure 1. A home-made Au electrode with a gap of 0.5 mm between two Au stripes was firstly prepared by depositing Au on phenolic resin, and then the prepared CSA-PA6/PANI composite nanofibers with area of 4 × 4 mm2 were pasted onto the open area between the two electrodes. The tests were performed at room temperature (25 ± 1 °C). The actual ammonia volumes injected into the air chamber were 0.3367, 0.6734, 1.3468, 2.0202, 2.6936 and 3.3670 μL, corresponding to ammonia vapor with the concentration of 25, 50, 100, 150, 200 and 250 ppm respectively. The resistance of the composite nanofbiers was measured using an Agilent-34401A data acquisition system (Agilent Technologies (China) Co. Ltd., Beijing, China). The resistance of CSA-doped PA6/PANI composite nanofibers in air (R0) and in the presence of NH3 (Ri) were measured to evaluate the gas response, S, defined as S(%) = (Ri − R0)/R0 × 100.
3. Results and Discussion
3.1. Surface Morphology
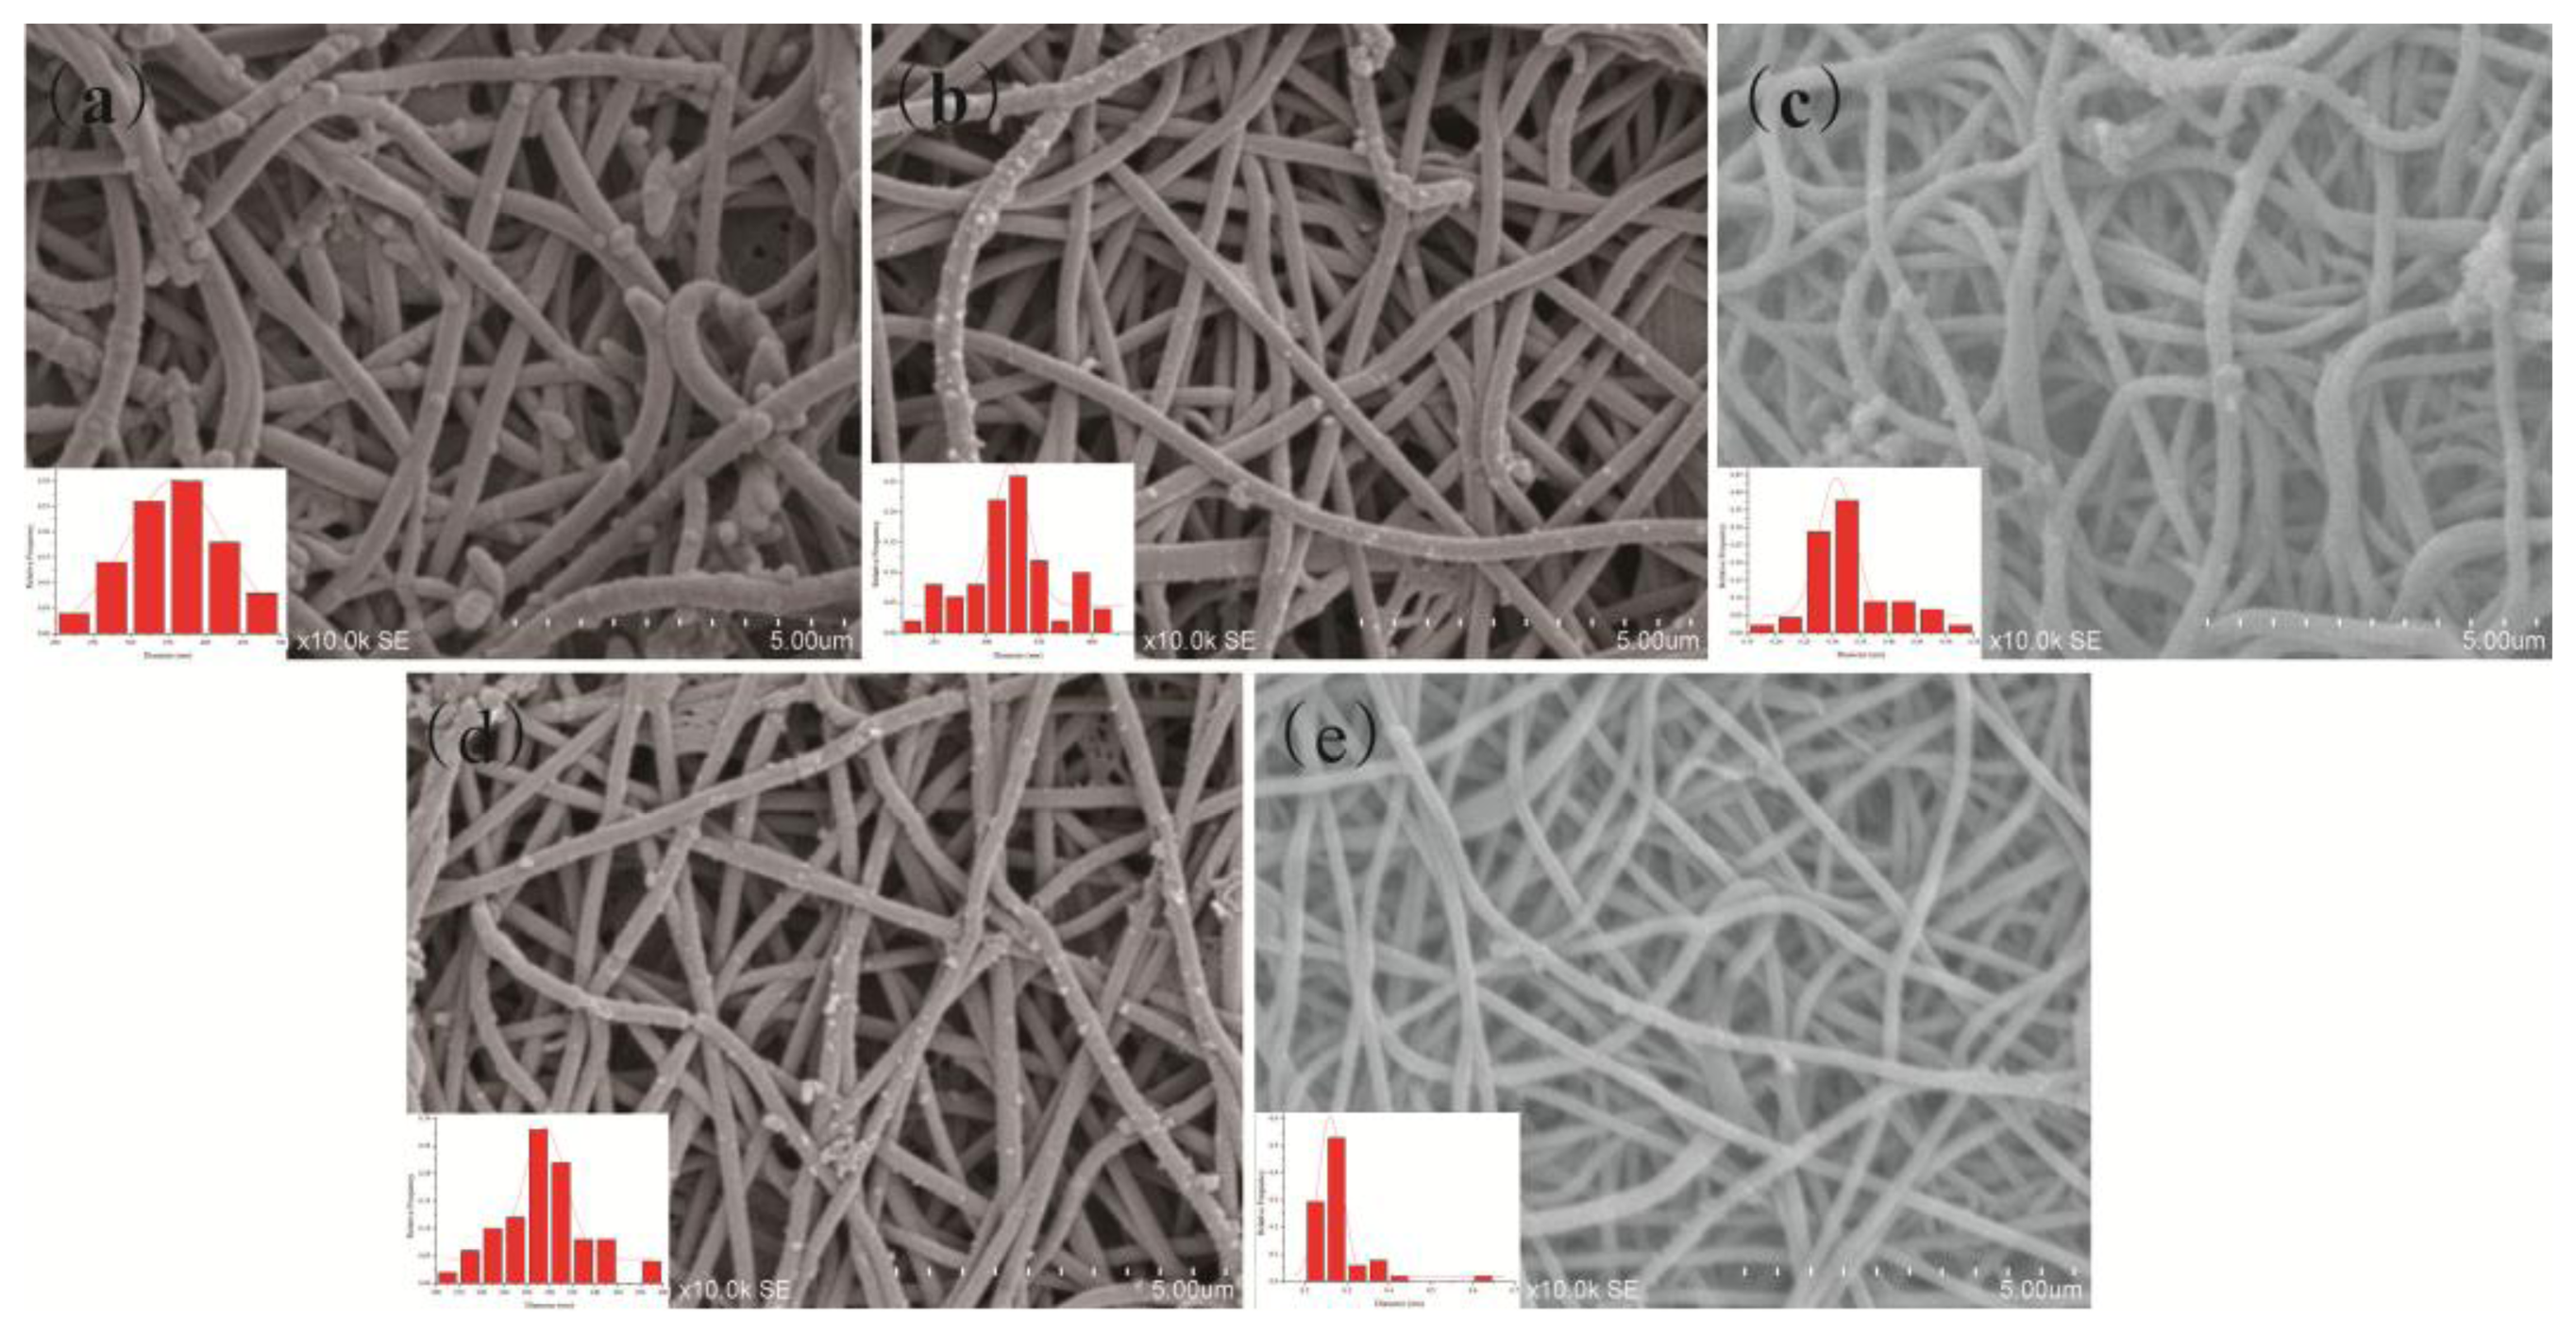
Figure 2 shows the SEM images and diameter distributions of CSA-doped PA6/PANI composite nanofibers with different CSA concentrations of 0.02, 0.04, 0.06, 0.08 and 0.10 M, denoted respectively as 0.02 M CSA-PA6/PANI, 0.04 M CSA-PA6/PANI, 0.06 M CSA-PA6/PANI, 0.08 M CSA-PA6/PANI and 0.10 M CSA-PA6/PANI. The SEM images for all PA6/PANI composite nanofibers doped with CSA indicated a non-woven film with good fiber structure.
For PANI, fiber structure would provide a big specific surface area which could help improve the sensitivity of a gas sensor [22]. The surfaces of the composite nanofibers were not very smooth, with some particles on the surface. The particles may be some residual PANI. The diameter distributions showed that the diameter of 0.02 M CSA-PA6/PANI appeared more uniform, and the average diameters of the composite nanofibers, which was around 320 nm looked similar.
3.2. FTIR Analysis
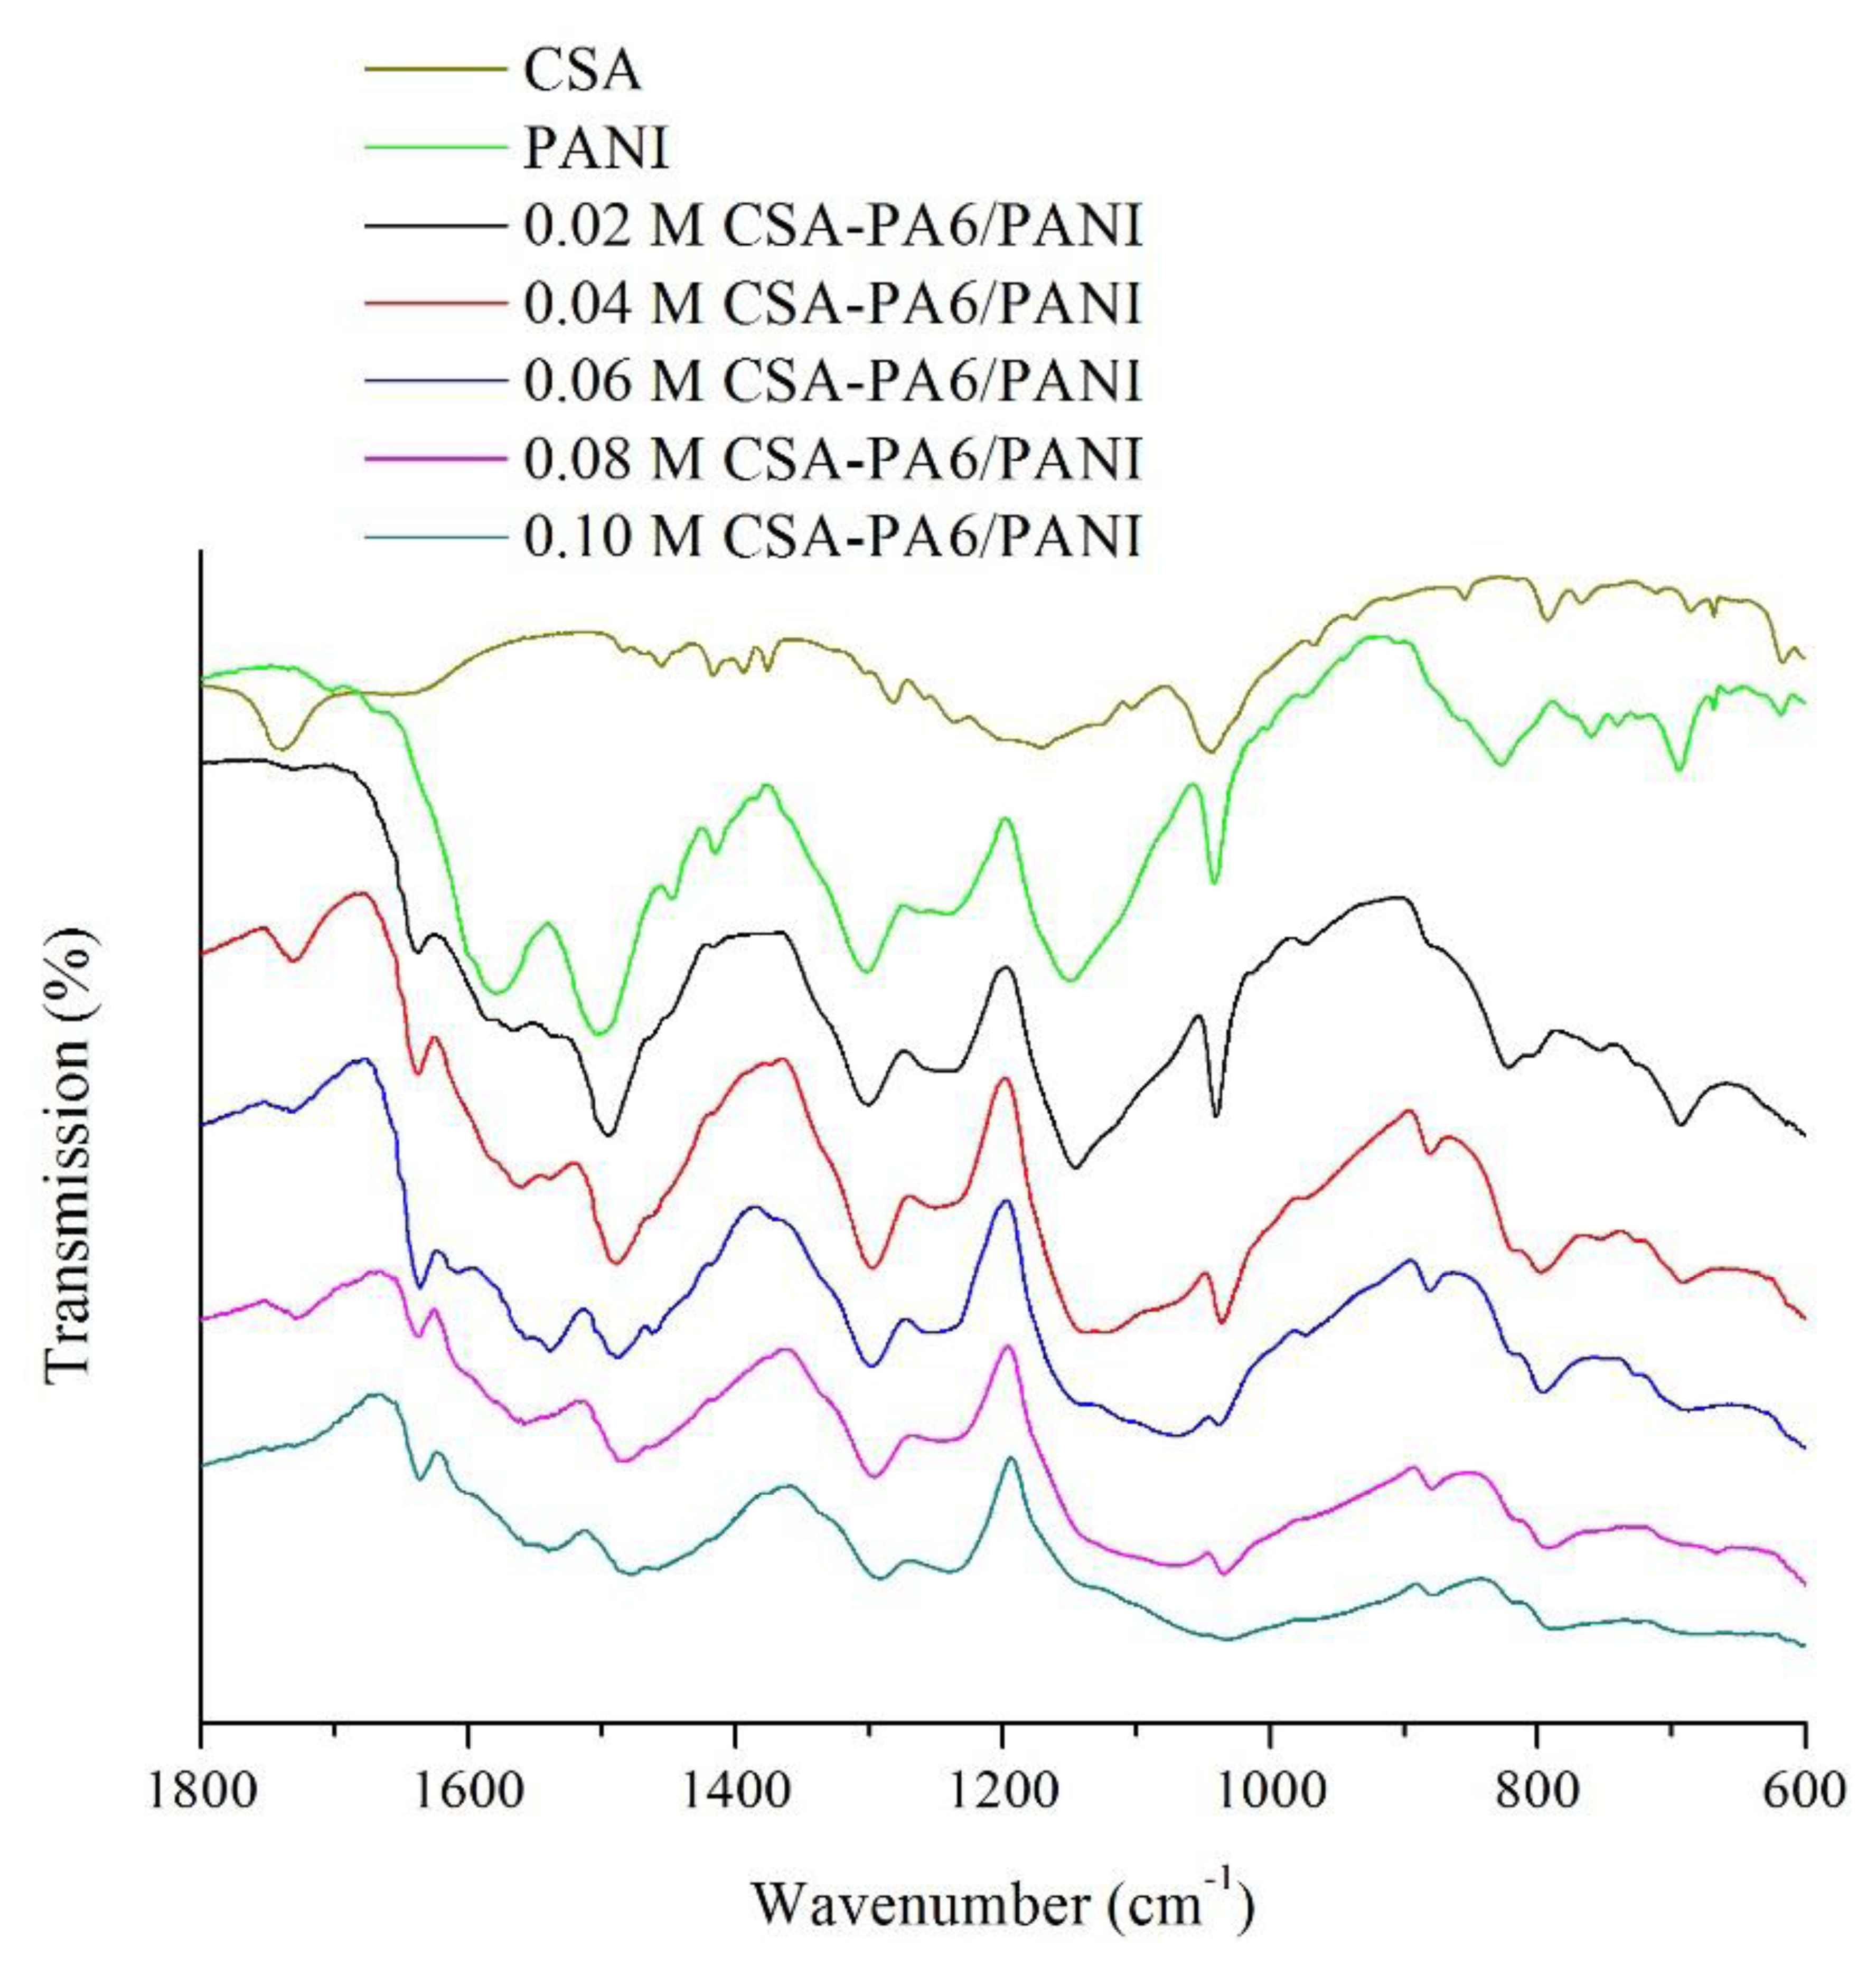
Figure 3 presents the FTIR spectra of the pure CSA, pure PANI and the prepared CSA-PA6/PANI composite nanofibers. It was observed that the characteristic peak of CSA around 1740 cm−1 [23] can be found at the other spectra of CSA-PA6/PANI composite nanofibers. For pure PANI, the band at 1495 cm−1 assigned to the stretching vibration of the C-C in the benzene ring and the peak around 1559 cm−1 originated from stretching vibrations of C=N and C=C bonds in quinone units can be found. These characteristic peaks also existed at the spectra of the CSA-PA6/PANI composite nanofibers. In addition, the stretching vibration peak at 1637 cm−1 assigned to the C=O stretching of PA6 can be found at the spectra of the CSA-PA6/PANI composite nanofibers, too. It can also be observed that the characteristic peaks of the prepared composite nanofibers shifted slightly. This may be the results of the differences in doping percentage.
3.3. XRD Patterns
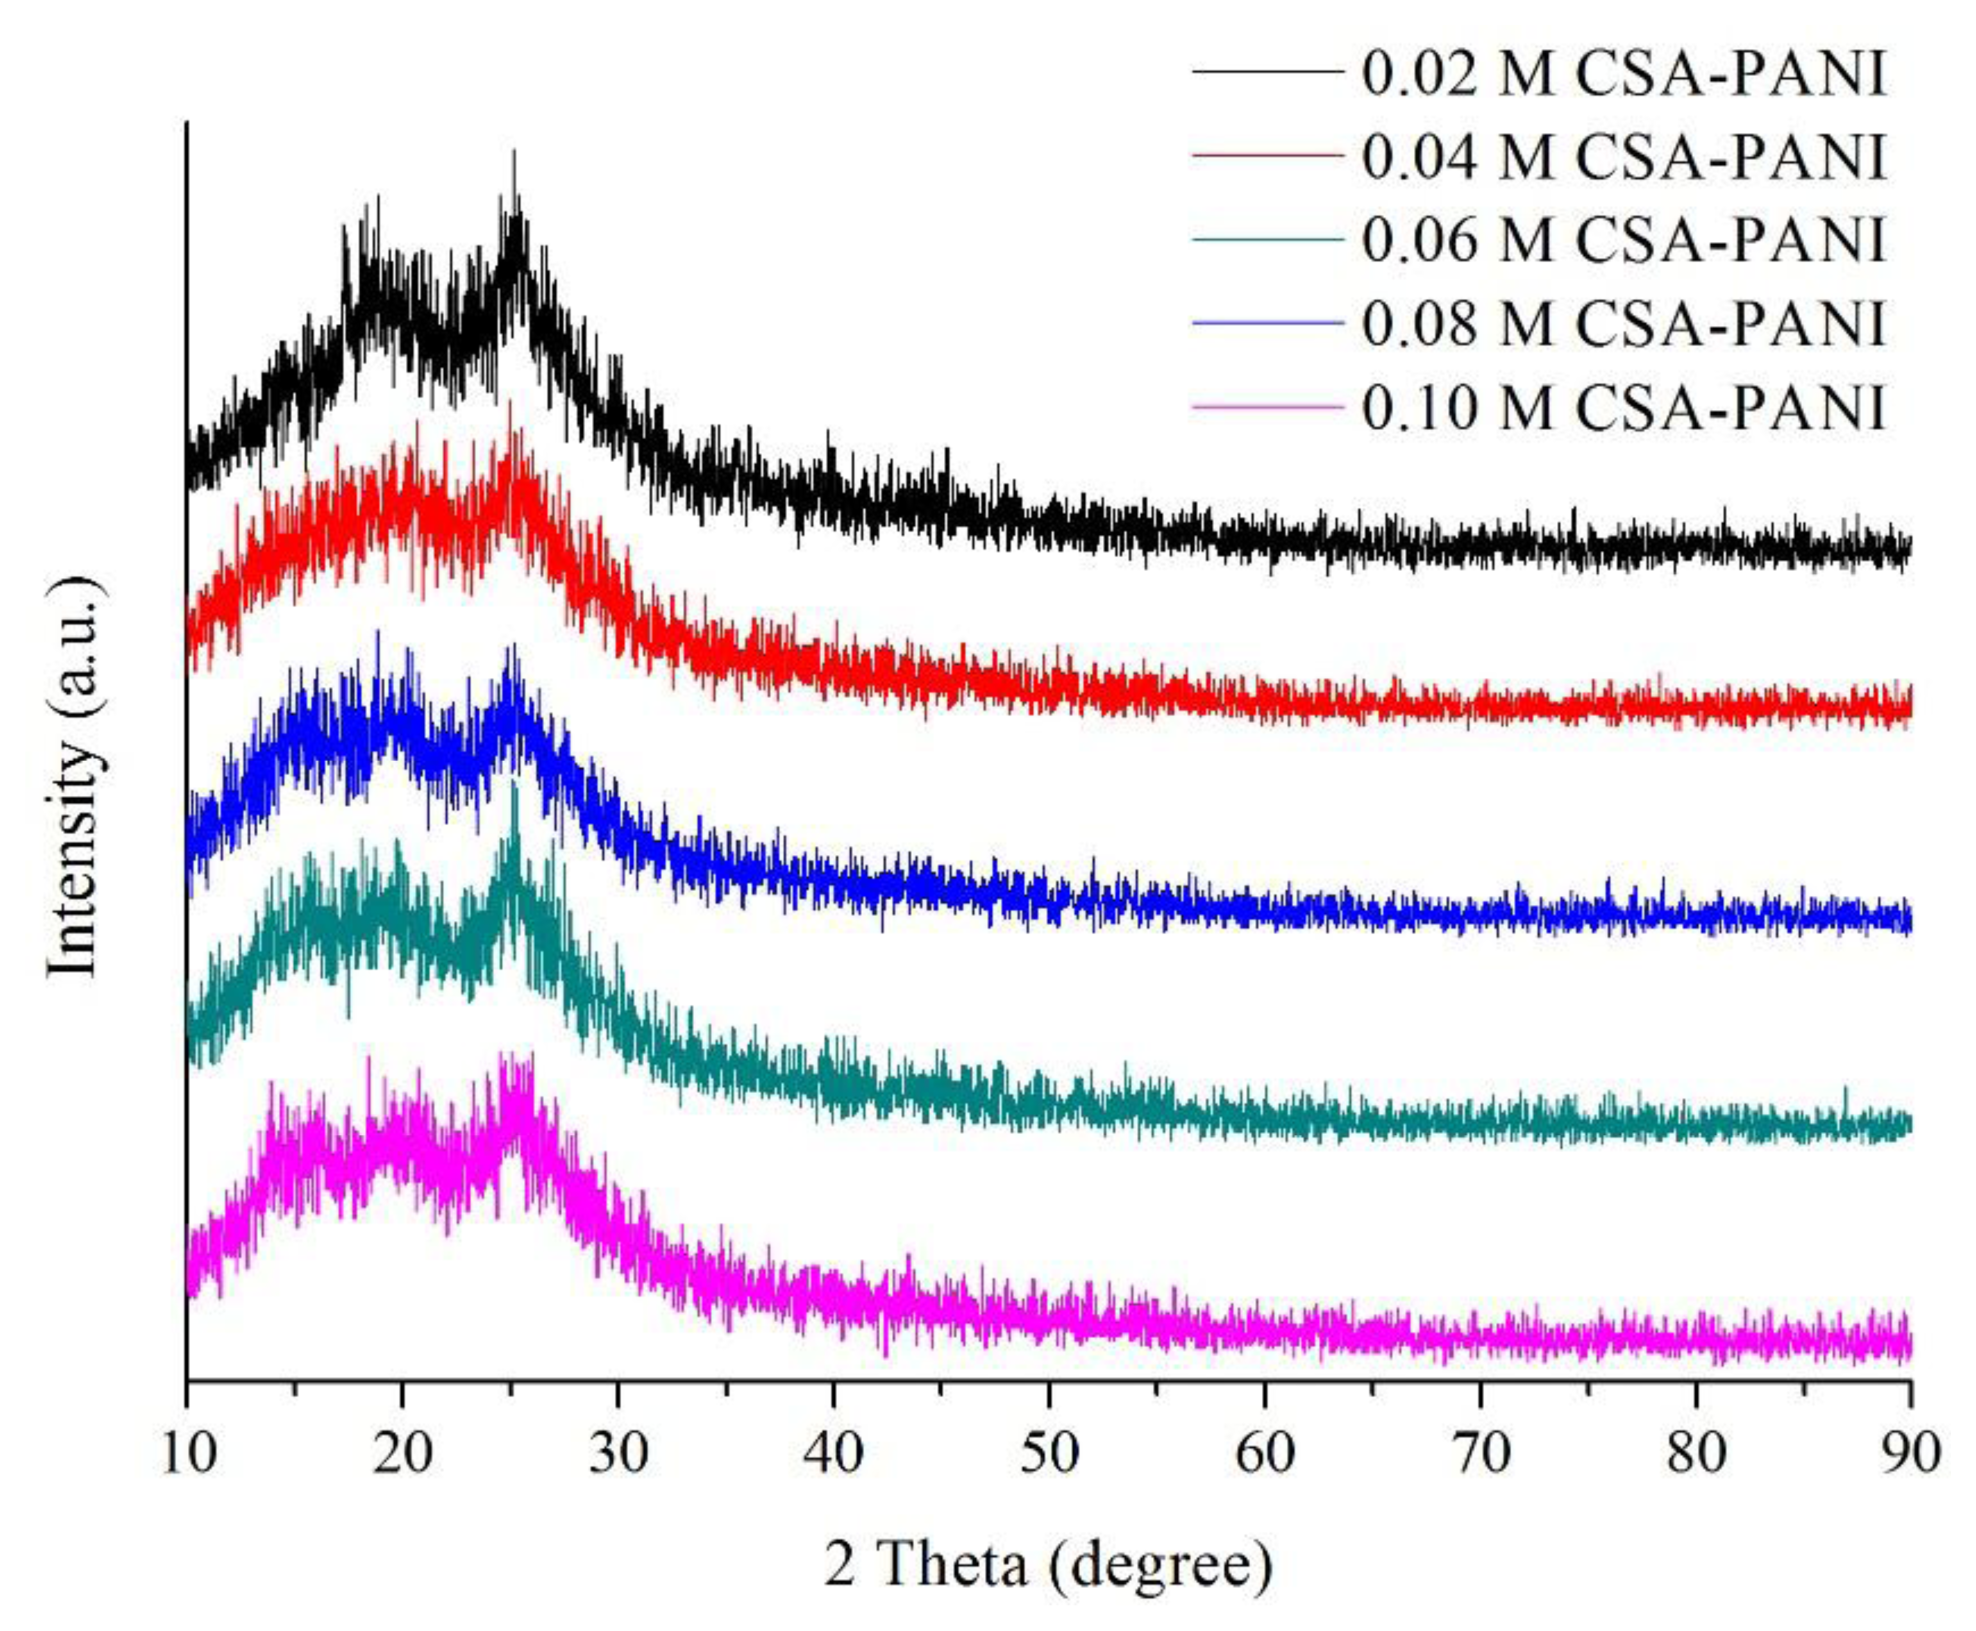
The X-ray diffraction patterns of CSA-PANI nanopowders with different doping degrees are presented in Figure 4. It is known that the characteristic peaks of PANI are at 2θ = 16°, 21° and 26°. The characteristic peaks of PANI can be seen clearly. In addition, with increase of concentration, more and more sharp peaks are observed, indicating that the crystallinity of CSA was increased. However, when the doping concentration was too high, CSA could not be completely doped into PANI and had to adhere on the surface of the film [21].
3.4. Conductive Properties
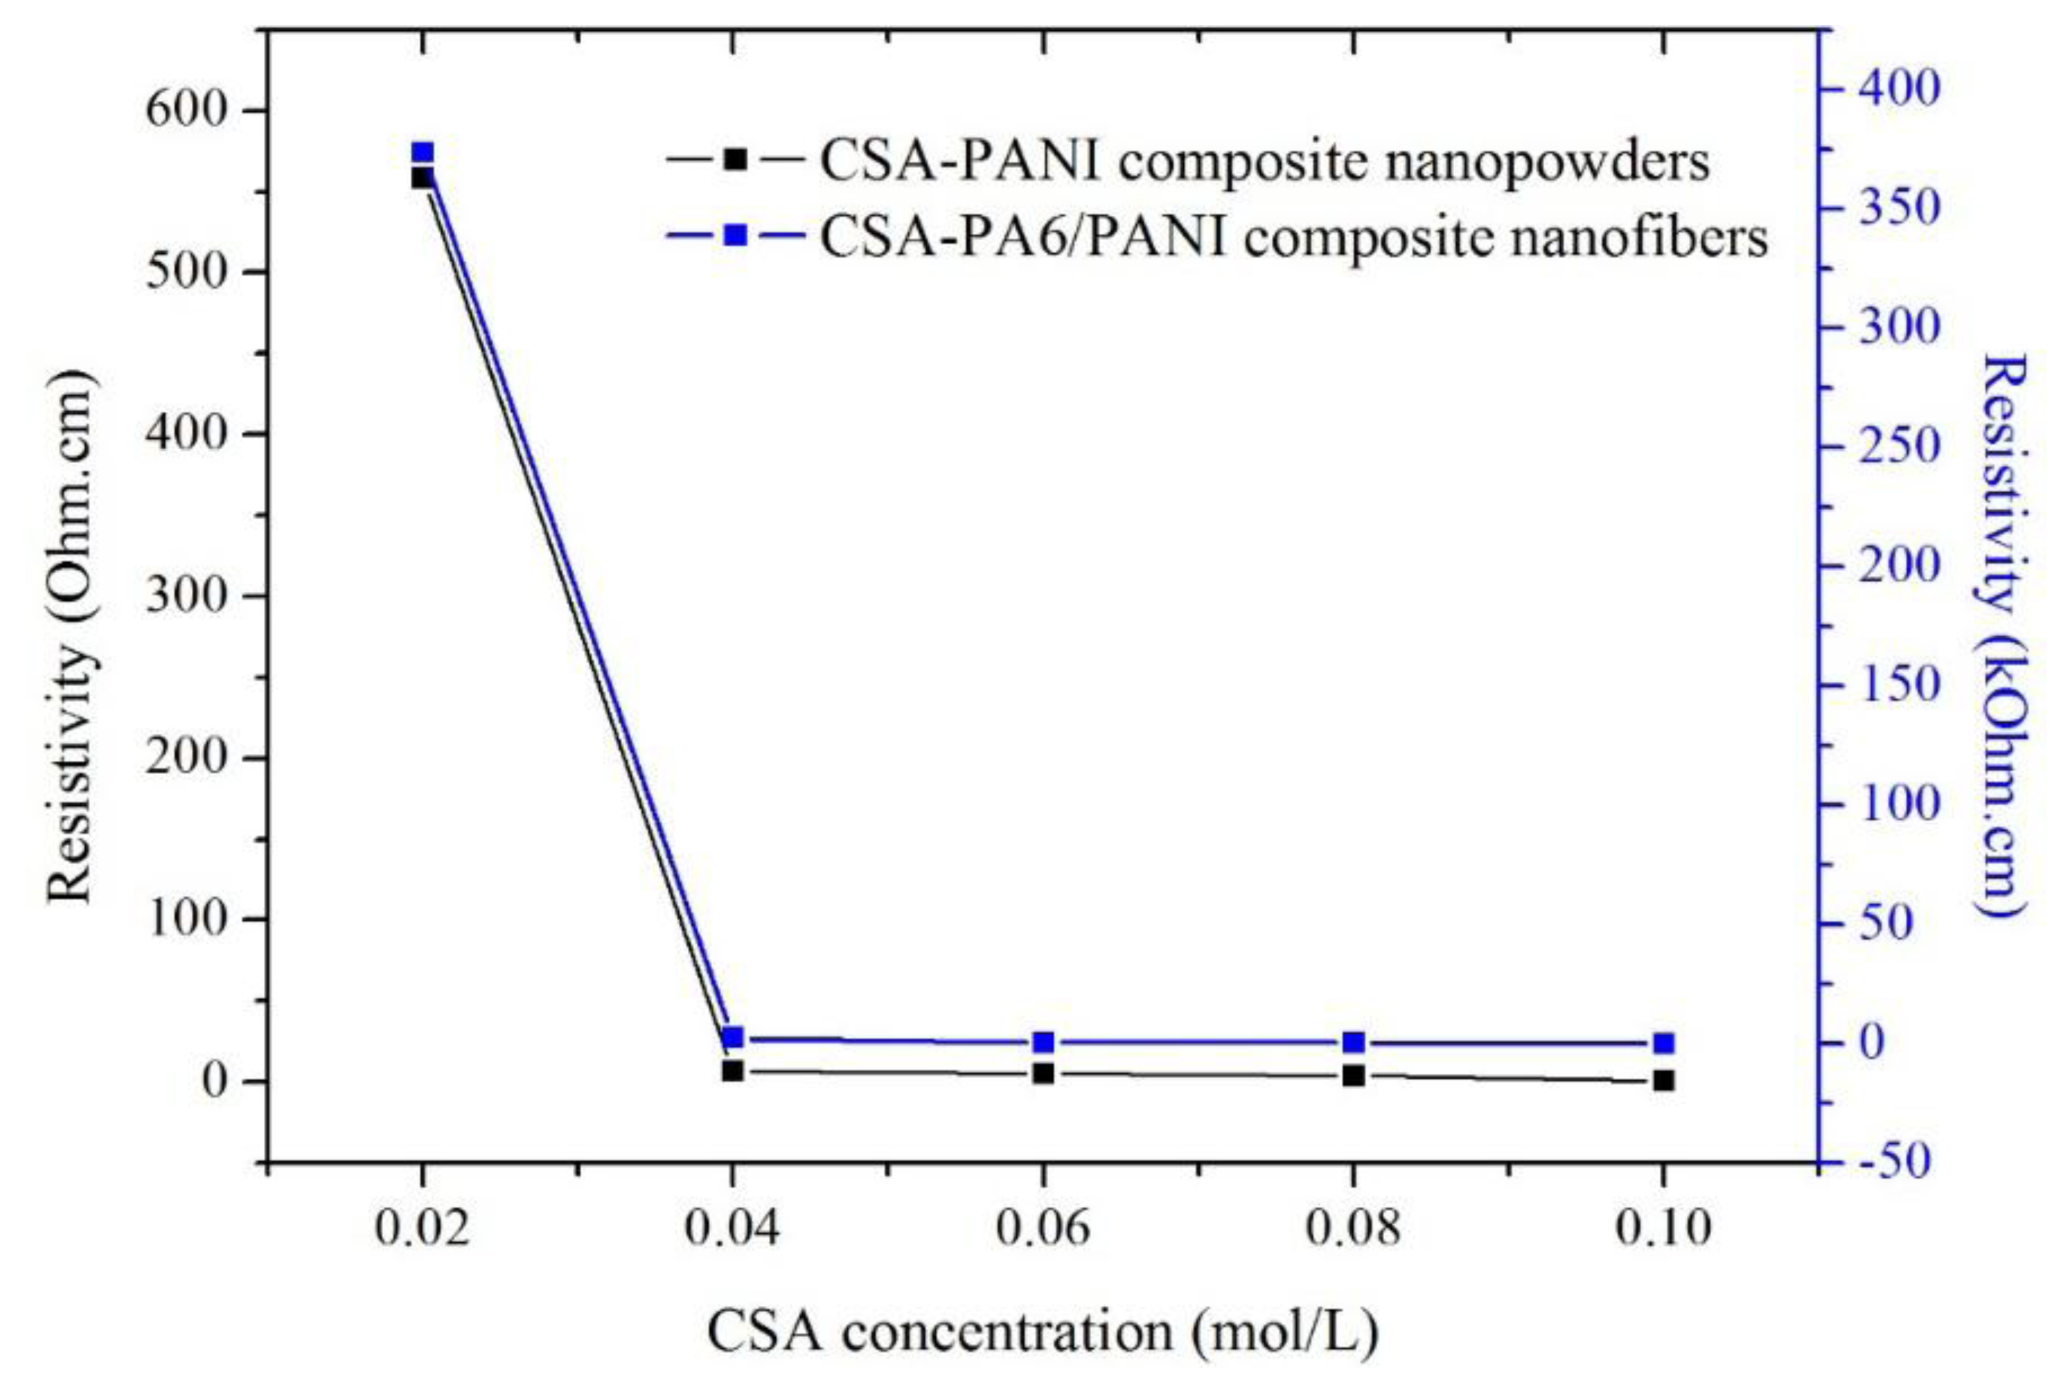
Figure 5 shows the resistivity of the CSA-PANI nanopowders and CSA-PA6/PANI composite nanofibers in air at room temperature. The prepared materials doped with 0.02 M CSA showed the highest resistivity and the conductivities of those doped with 0.10 M CSA were the best. In addition, the conductivities of the prepared materials doped with 0.02 M CSA were very different from those of the others doped with higher CSA concentrations.
This showed that when the CSA concentration was in the range of 0.02–0.10 M, the higher the CSA concentration was, the better conduction the materials had, which was because there were more H+ captured by PANI chains. However, the sensitivity of the prepared nanofibers did not become higher when the nanofibers' conduction was improved.
3.5. Ammonia Sensing Properties
3.5.1. Gas Sensitivity of CSA-Doped PA6/PANI Composite Nanofibers
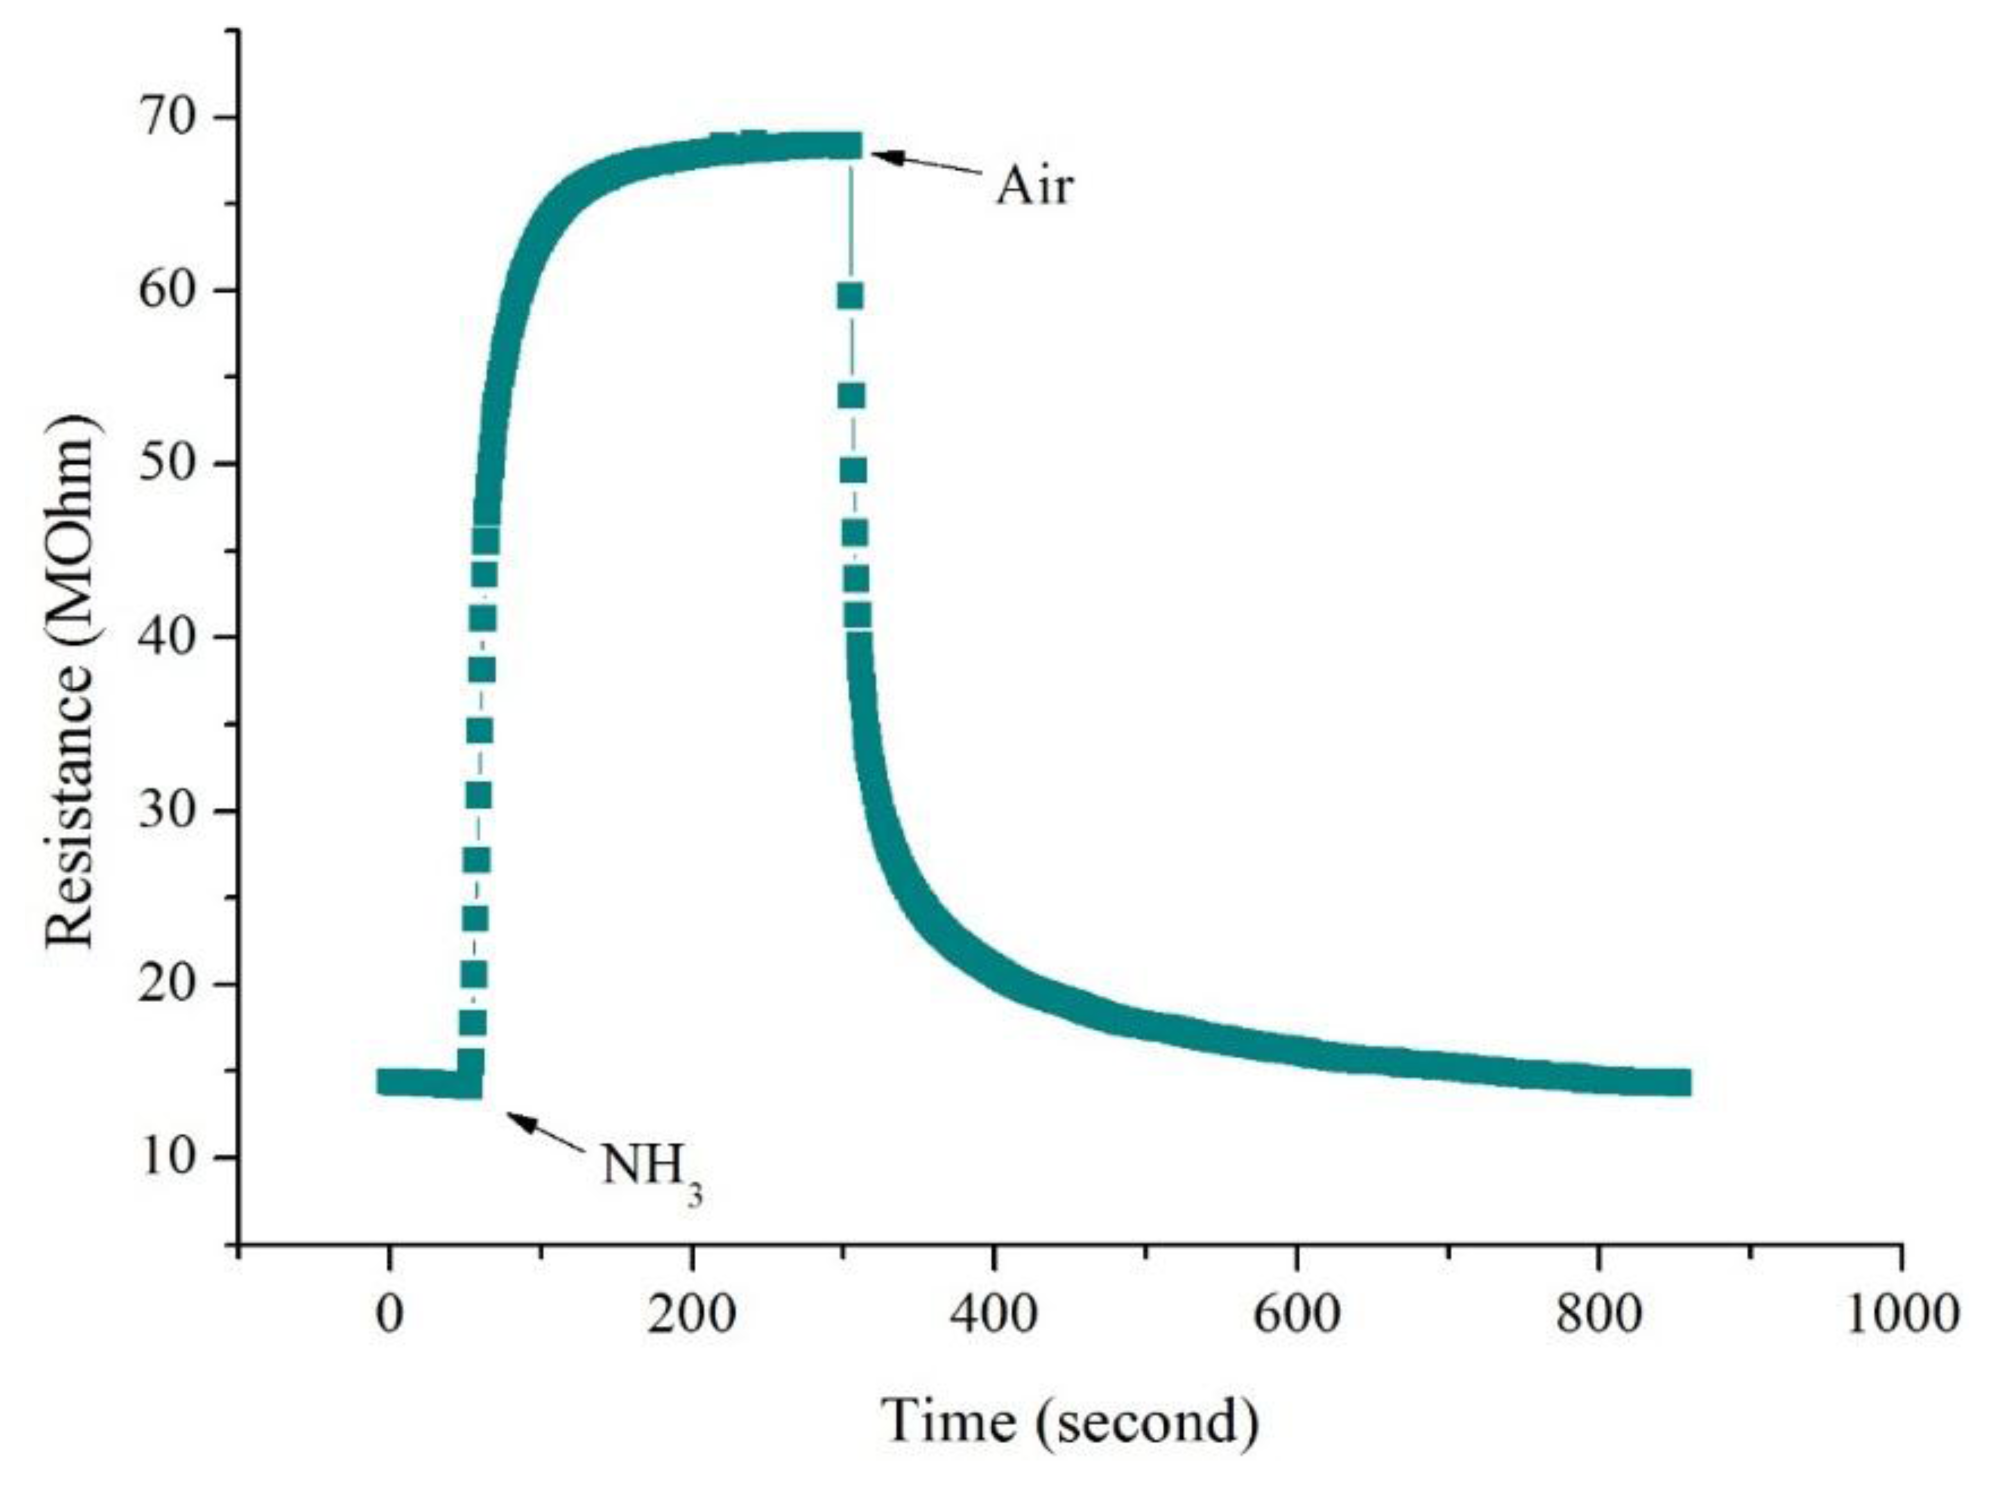
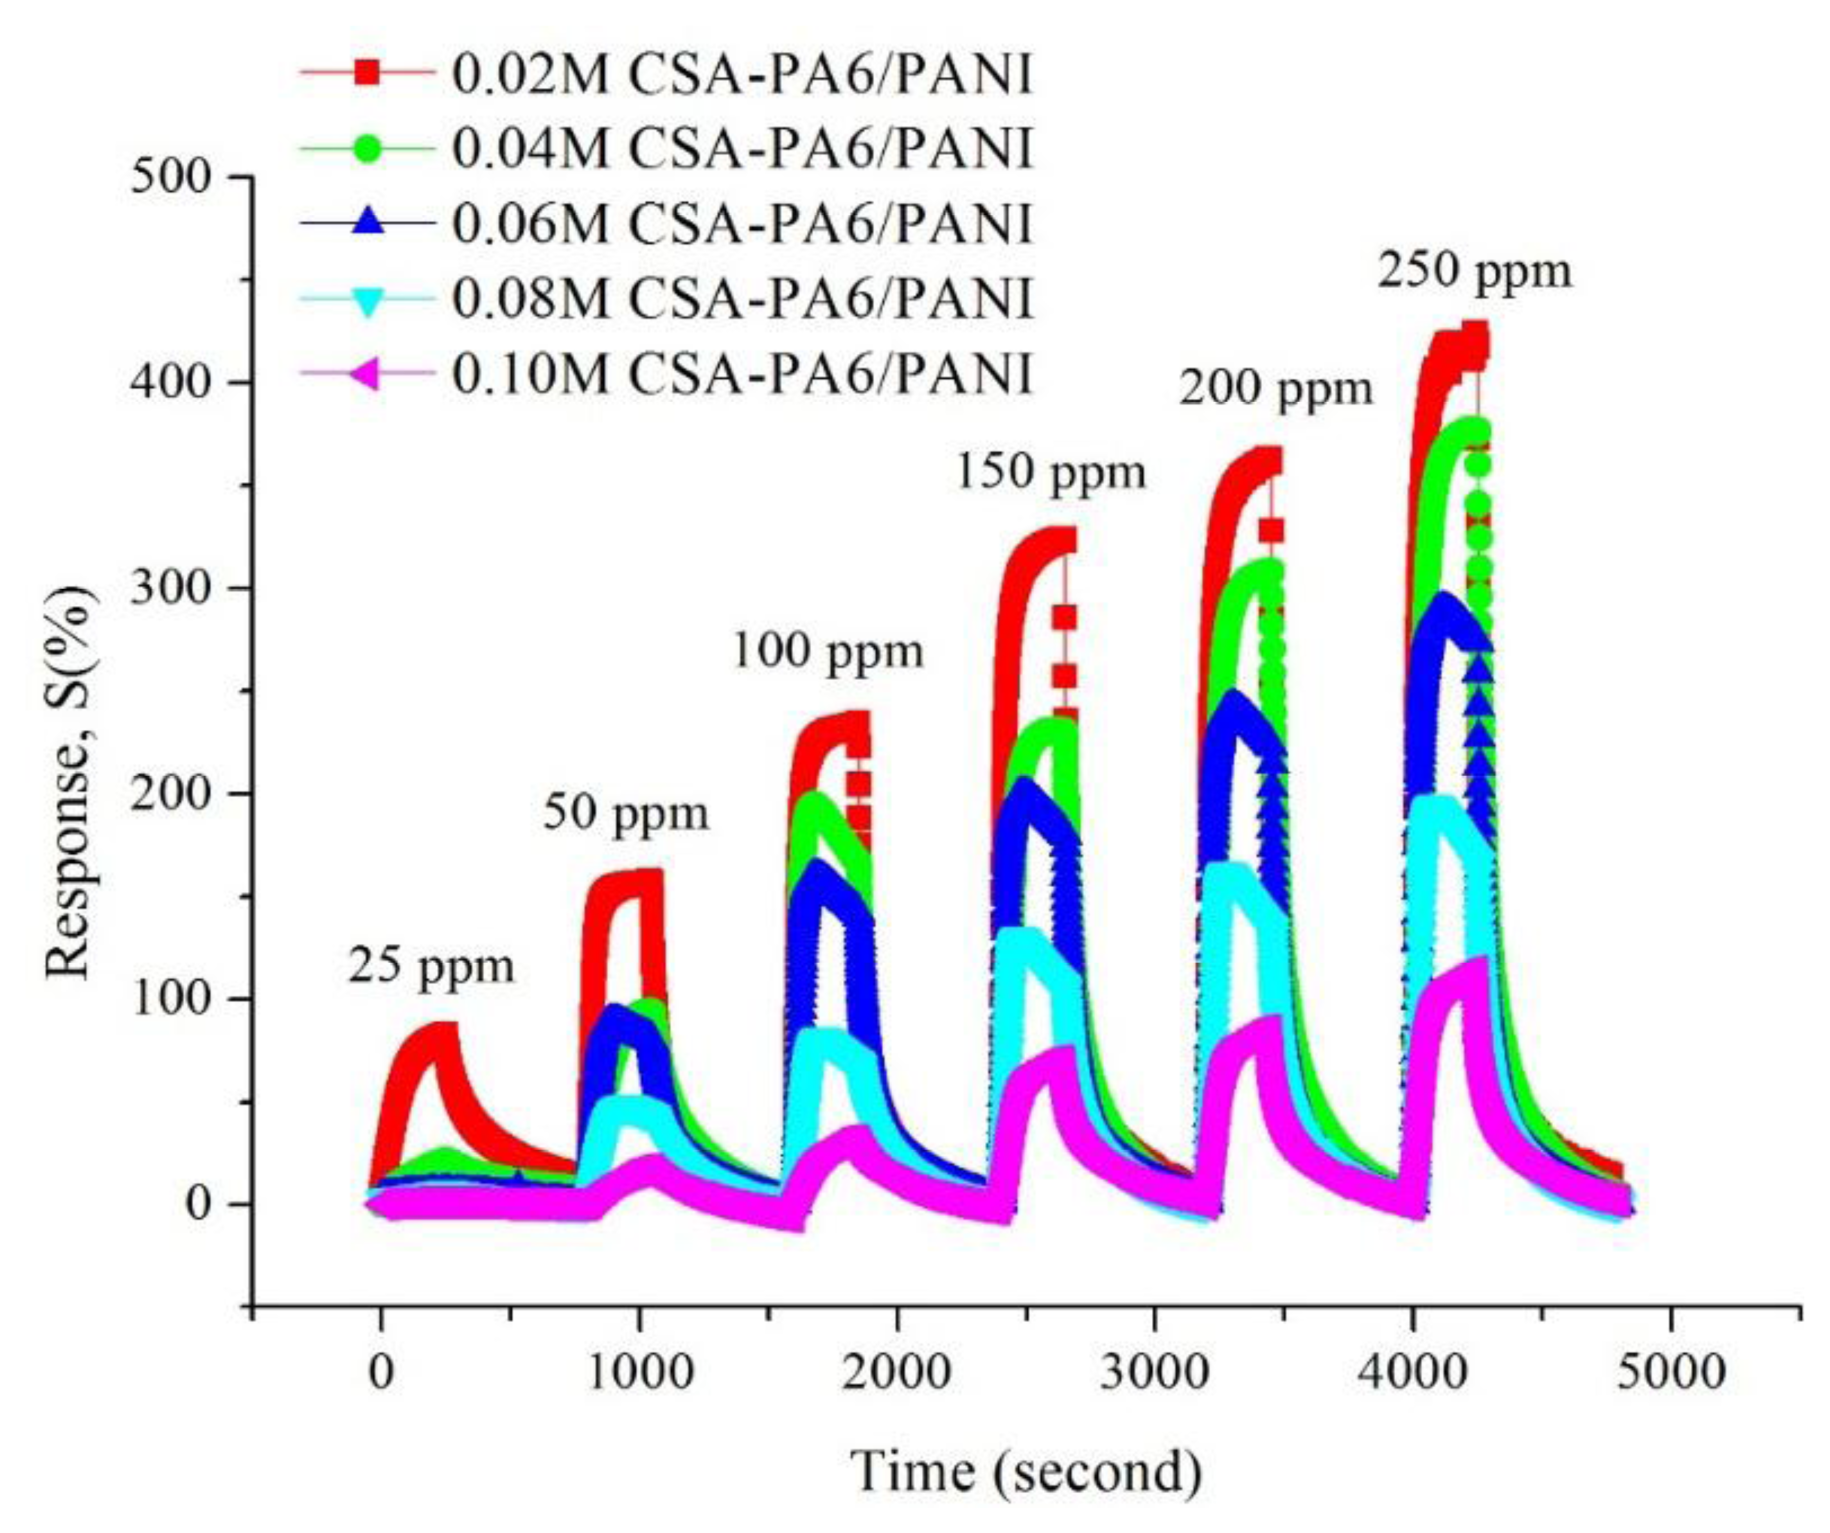
The changes in resistance of CSA-doped PA6/PANI composite nanofibers with respect to time on the exposure of NH3 are shown in Figure 6. It is obvious that the resistance of the CSA-doped PA6/PANI composite nanofibers increased dramatically when they were exposed to NH3. A moment later, the resistance became stable. When the gas room was opened and fresh air was introduced, the resistance decreased and returned to the original resistance gradually.
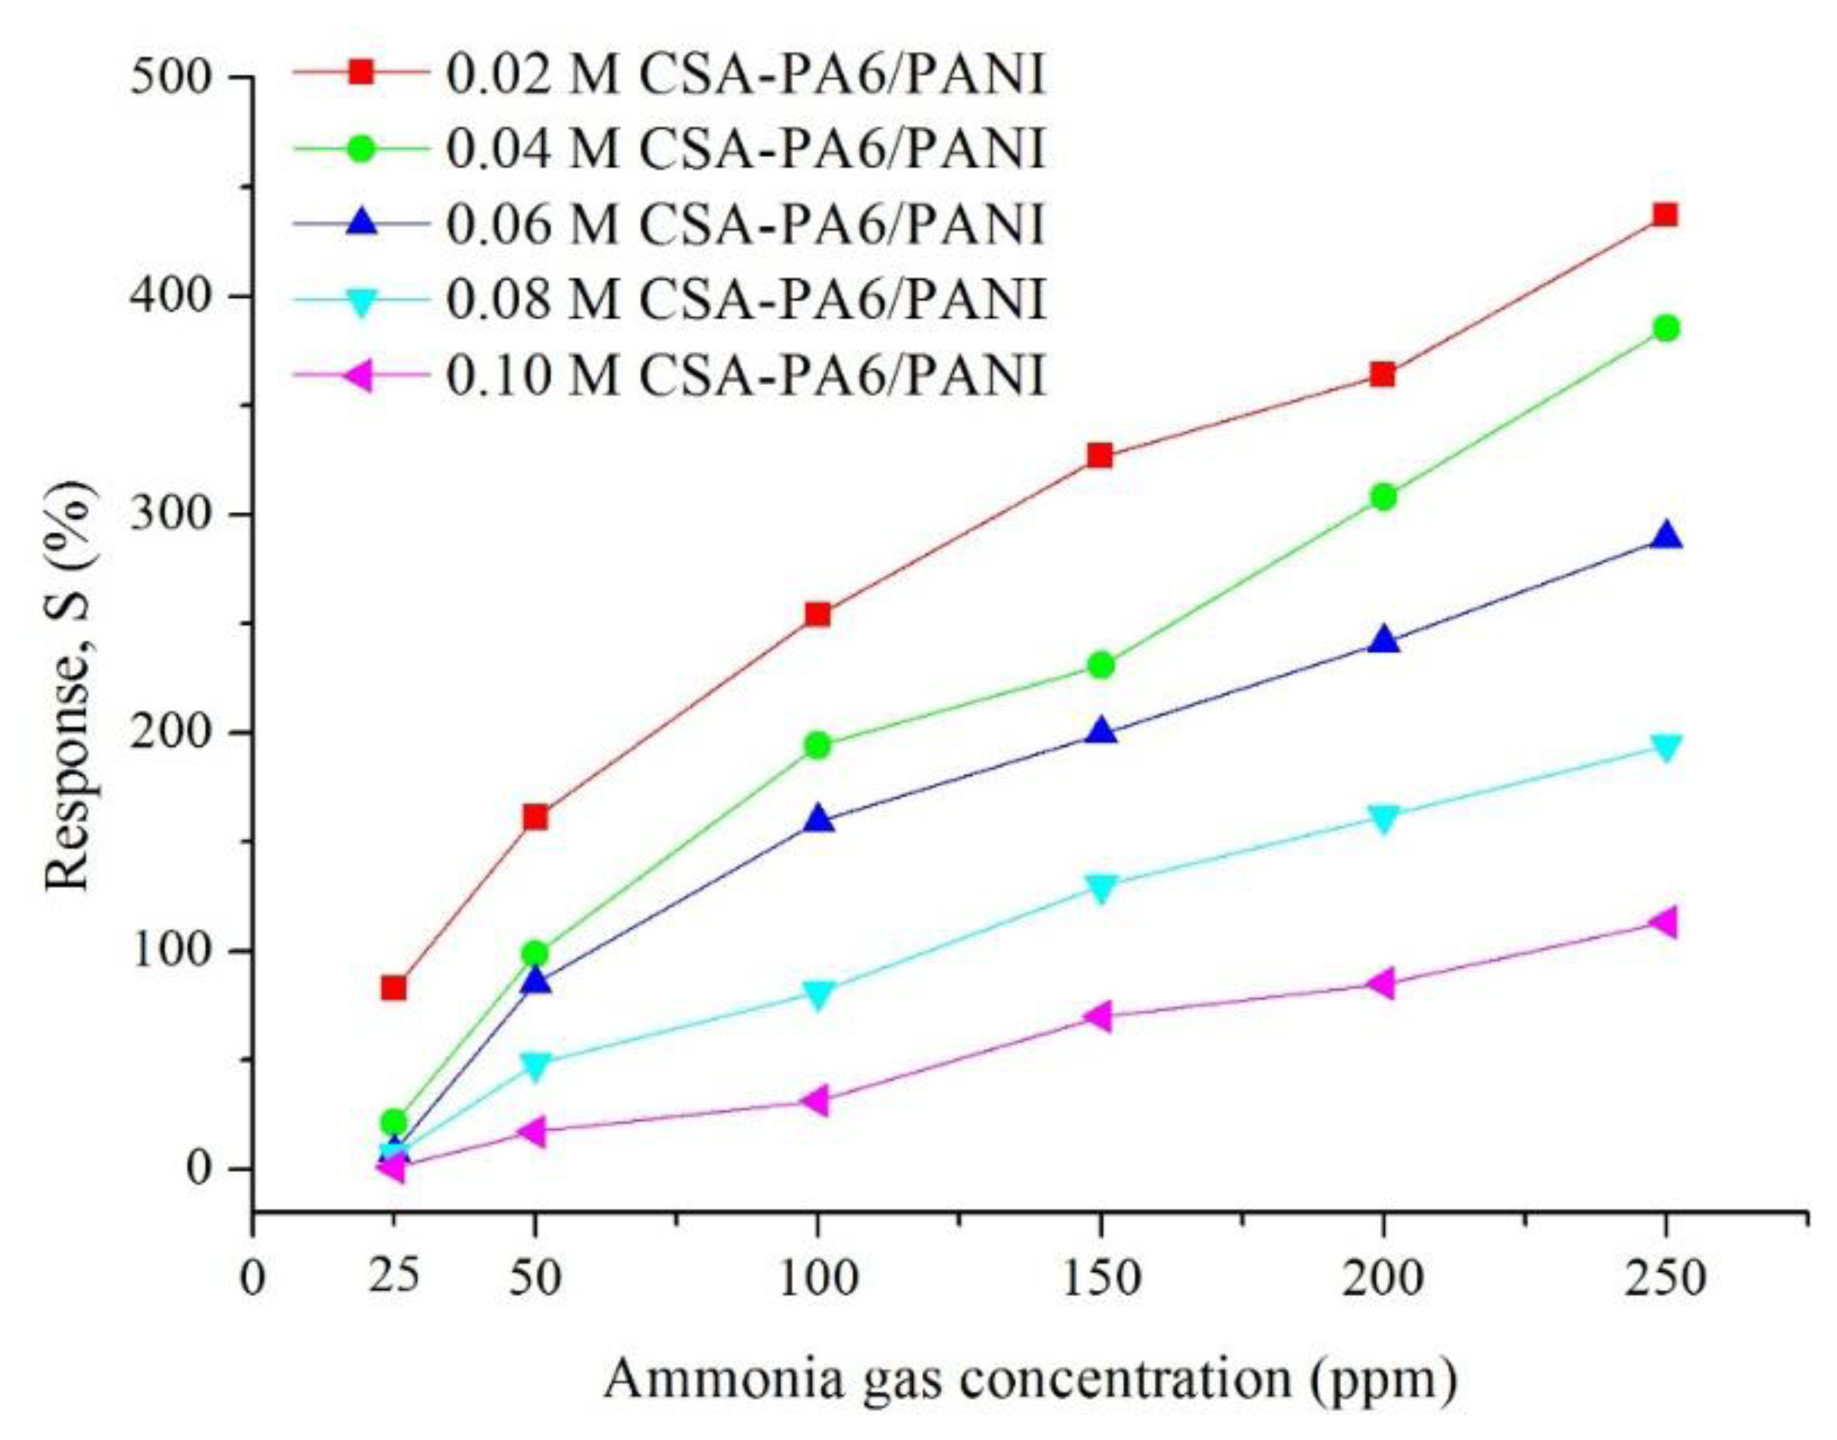
Figure 7 shows the gas response of CSA (0.02–0.10 M)-doped PA6/PANI composite nanofibers for 25–250 ppm NH3 gas. The response of CSA-doped PA6/PANI composite nanofibers was enhanced with increasing concentration of NH3 gas from 25 to 250 ppm operating at room temperature. The CSA-doped PA6/PANI composite nanofibers gas sensors all showed a good sensitivity to ammonia vapor, and the gas sensor of 0.02 M CSA-doped PA6/PANI composite nanofibers possessed the highest response amplitude to ammonia among the five sensors tested. The response values are depicted in Figure 8 which is obtained from Figure 7. It is very clear that the response of 0.02 M CSA-doped PA6/PANI composite nanofibers sensor was much higher than the other four composite nanofibers sensors. The response value of 0.02 M CSA-doped PA6/PANI composite nanofibers sensor to 250 ppm ammonia was 436.98% which was 1.13, 1.51, 2.25 and 3.86 times of that of 0.04 M, 0.06 M, 0.08 M and 0.10 M CSA-doped PA6/PANI composite nanofibers sensors, respectively. When the NH3 concentration was 100 ppm, the response value of 0.02 M CSA-PA6/PANI was 253.96%. This was superior to the results (100.00%, 215.60% and 91.00%) recently reported by Pang et al. [24], Pan et al. [25] and Khuspe et al. [26].
3.5.2. Gas Sensitivity of 0.02 M CSA-Doped PA6/PANI Composite Nanofibers
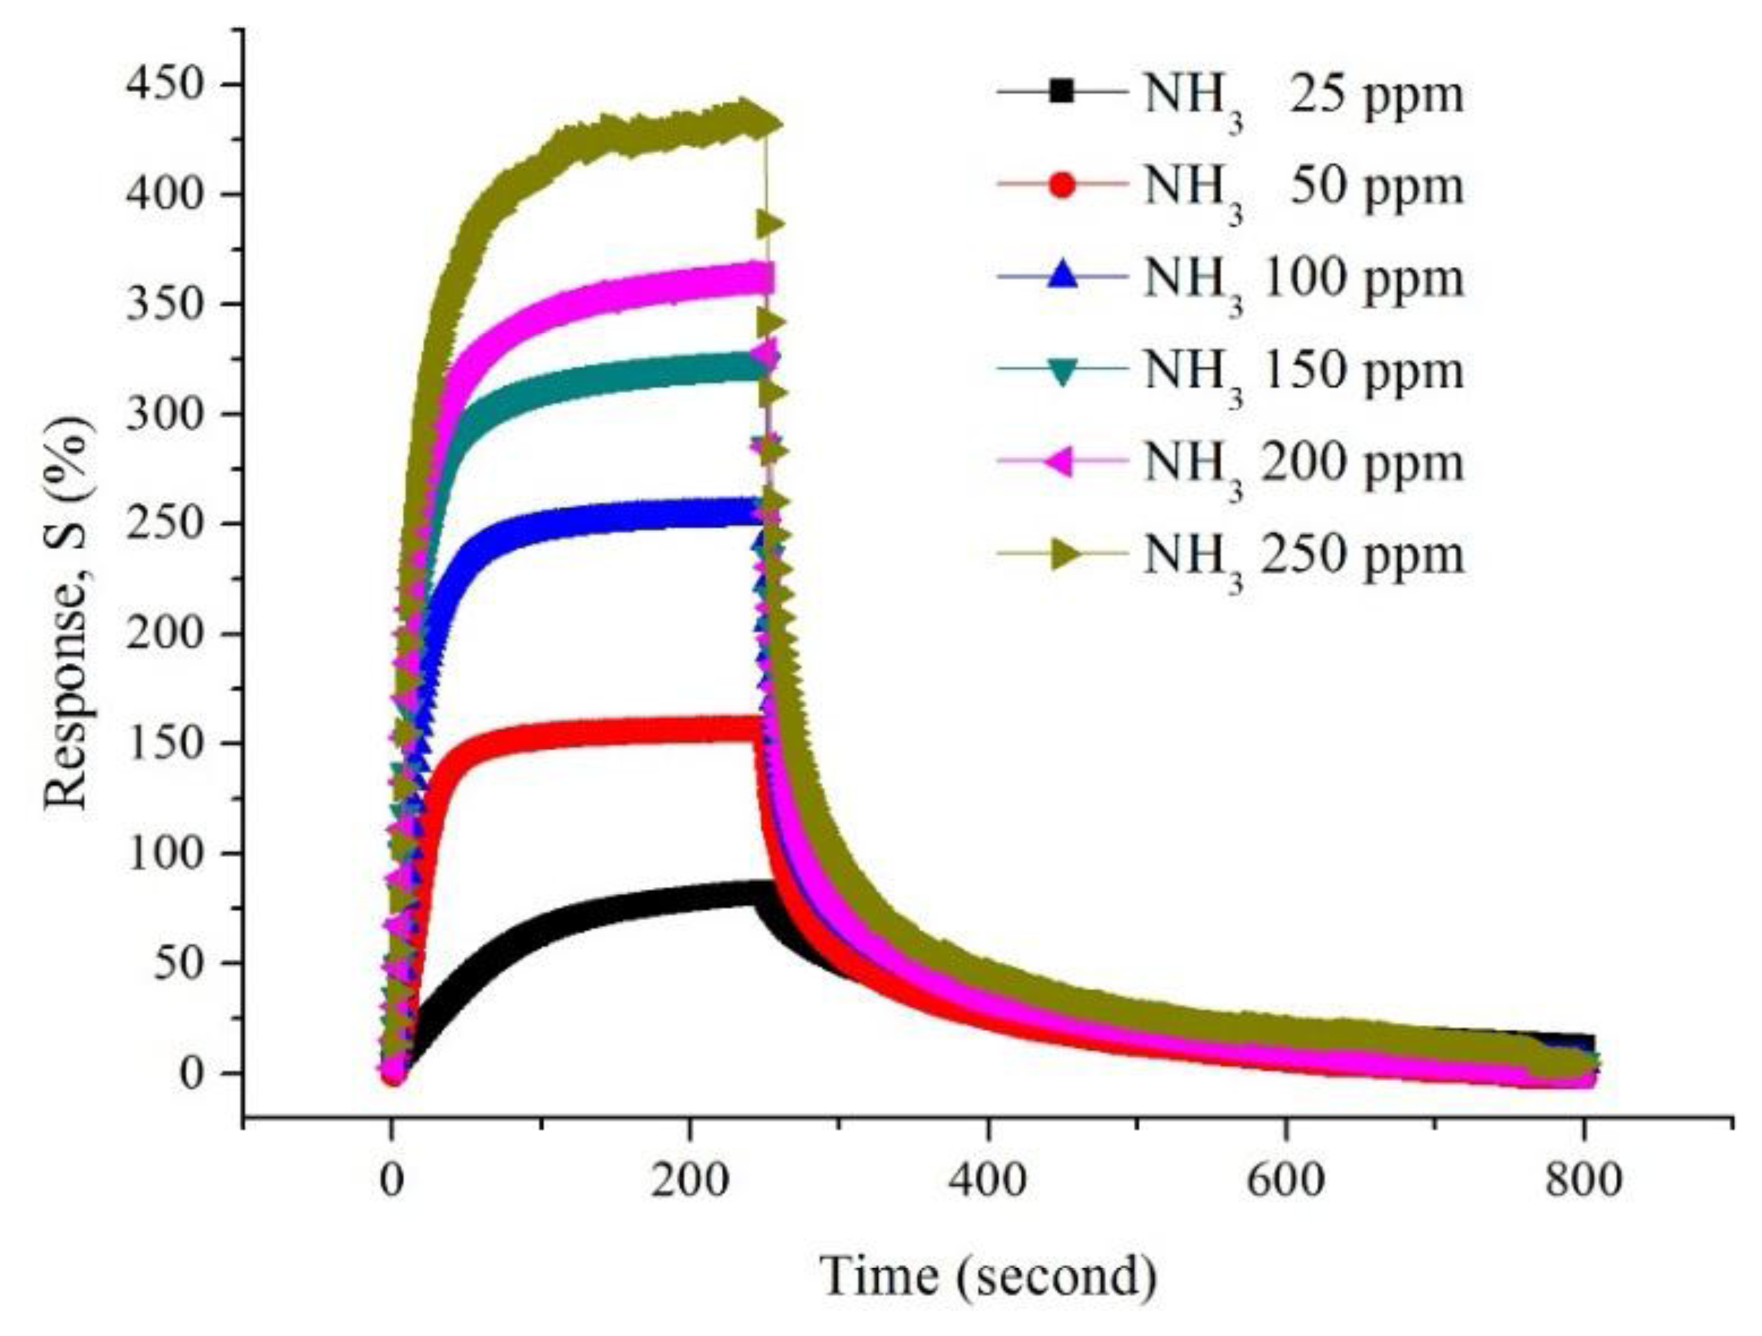
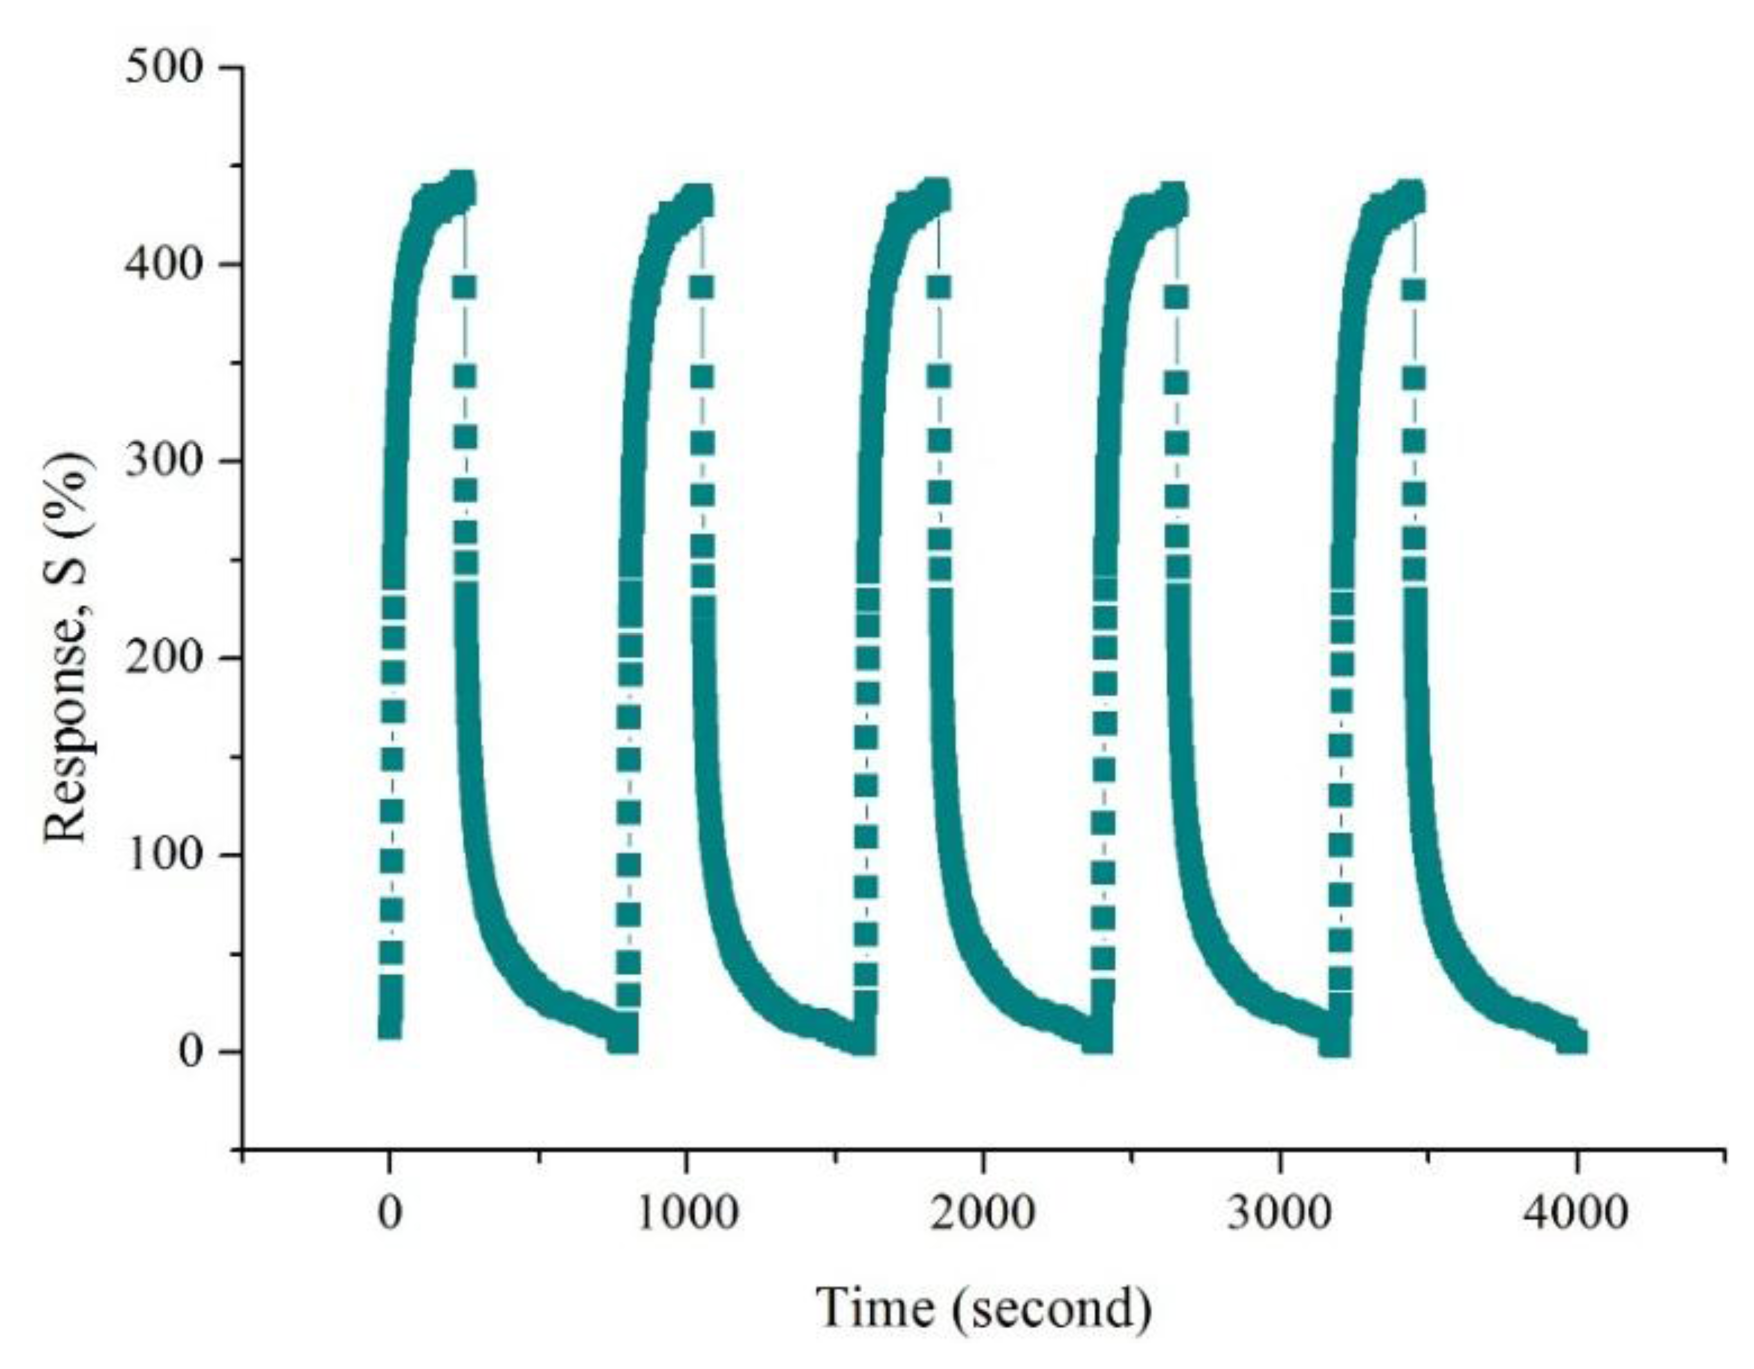
Because the 0.02 M CSA-doped PA6/PANI composite nanofibers gas sensor showed the highest sensitivity among the samples tested, the other properties of 0.02 M CSA-doped PA6/PANI composite nanofibers were also examined. Figure 9 shows the response of 0.02 M CSA-doped PA6/PANI composite nanofibers to 25–250 ppm of NH3. The sensitivity of the composite nanofibers increased with increasing concentration of NH3 gas from 25 to 250 ppm and it was found to be 82.67%, 161.16%, 253.96%, 326.54%, 363.90%, 436.98%, respectively operating at room temperature. The repeatability is a very important property of gas sensor. The response of 0.02 M CSA-doped PA6/PANI composite nanofibers gas sensor was monitored for repeated exposure and removal of 250 ppm ammonia up to five cycles, as shown in Figure 10.
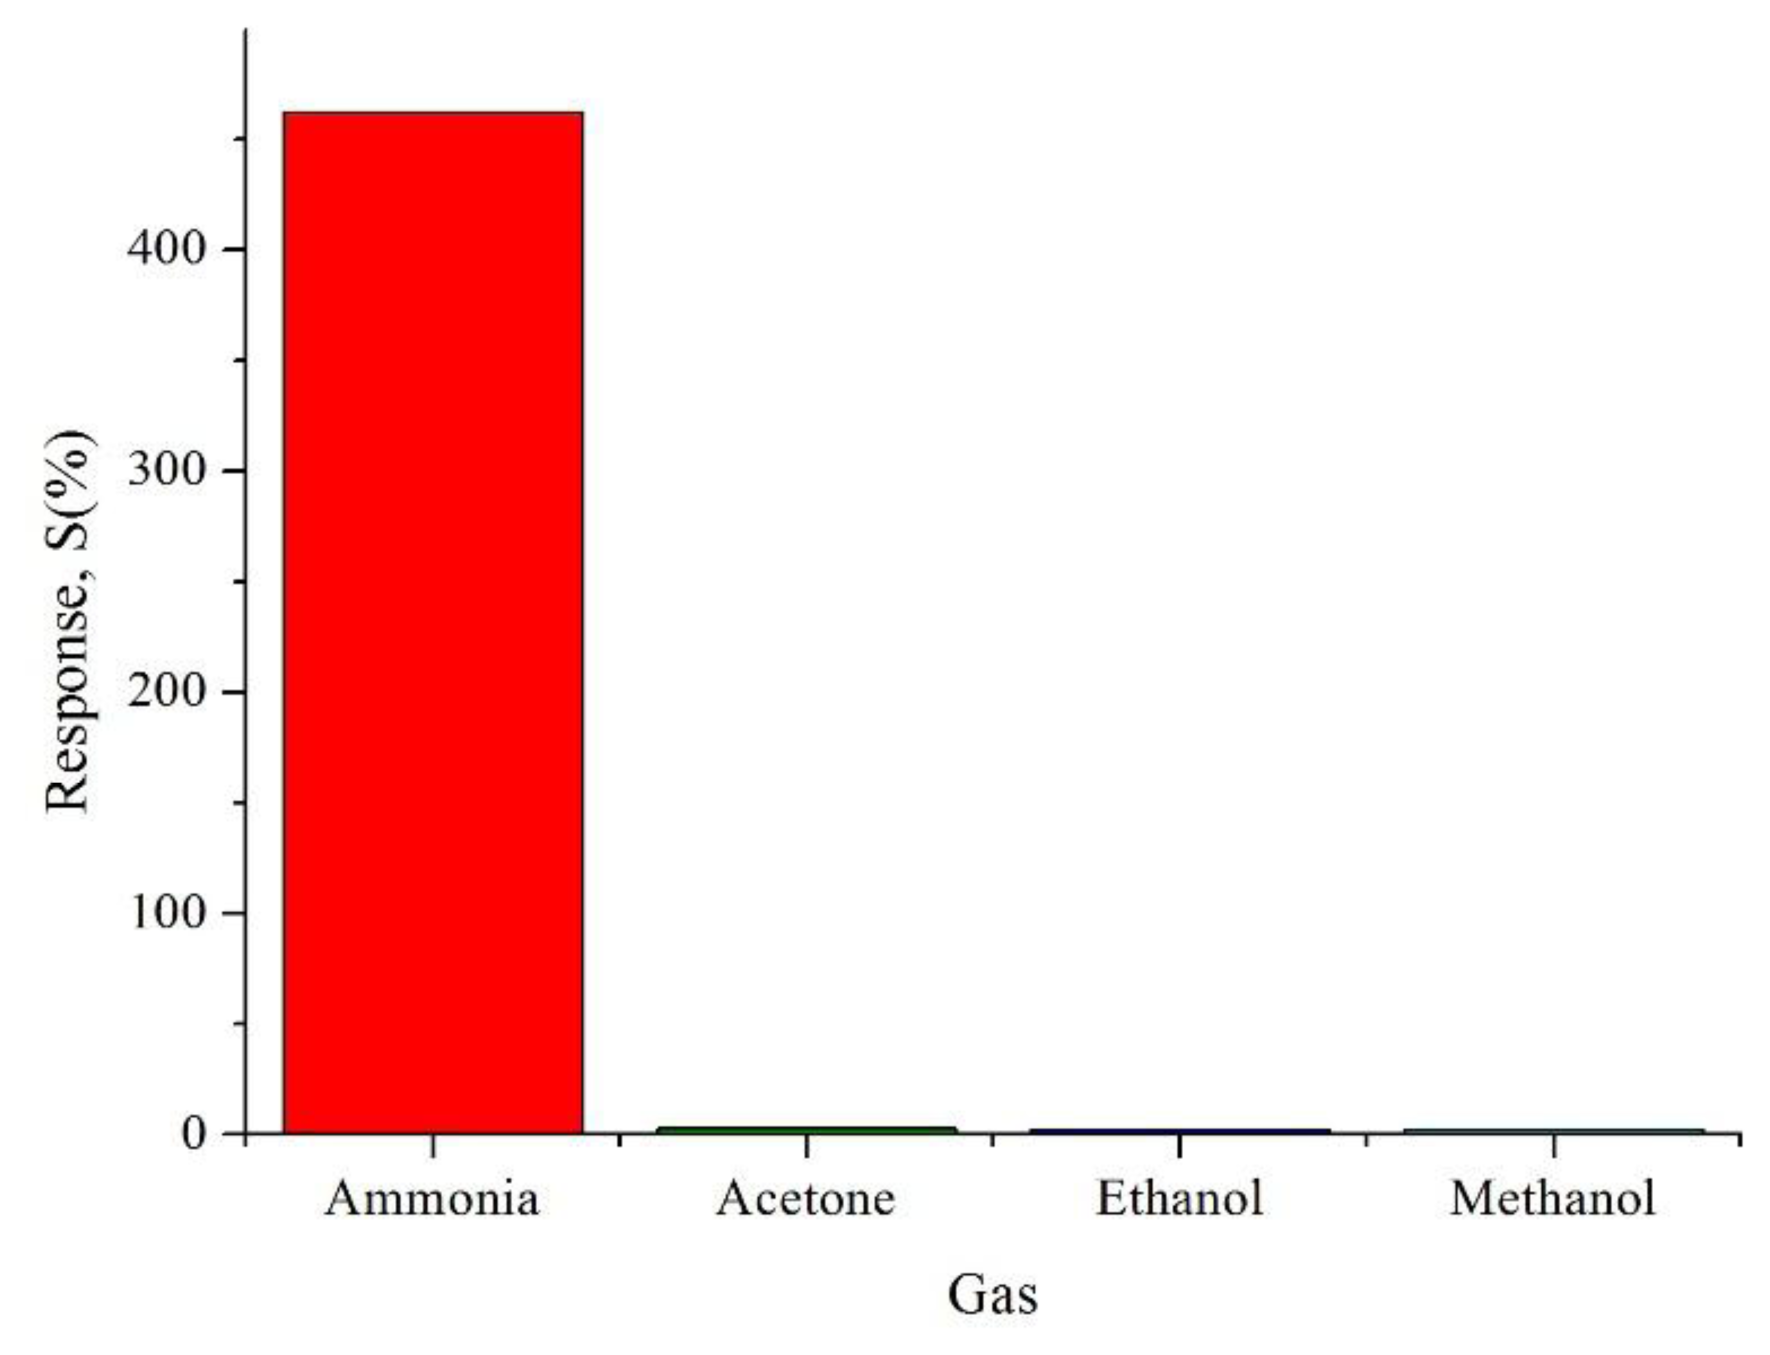
It can be observed that the prepared CSA-doped PA6/PANI composite nanofibers sensor had high repeatability. In addition, to test the cross sensitivity, 0.02 M CSA-doped PA6/PANI composite nanofibers were exposed to 250 ppm acetone, ethanol and methanol, respectively, at room temperature. As shown in Figure 11, it can be seen that there was a distinct difference in the response to the tested gases. The sensors showed very weak responses to acetone, ethanol and methanol. As a result, it can be concluded that the sensor exhibited high selectivity to NH3.
3.5.3. Sensing Mechanism of CSA-Doped PA6/PANI Composite Nanofibers
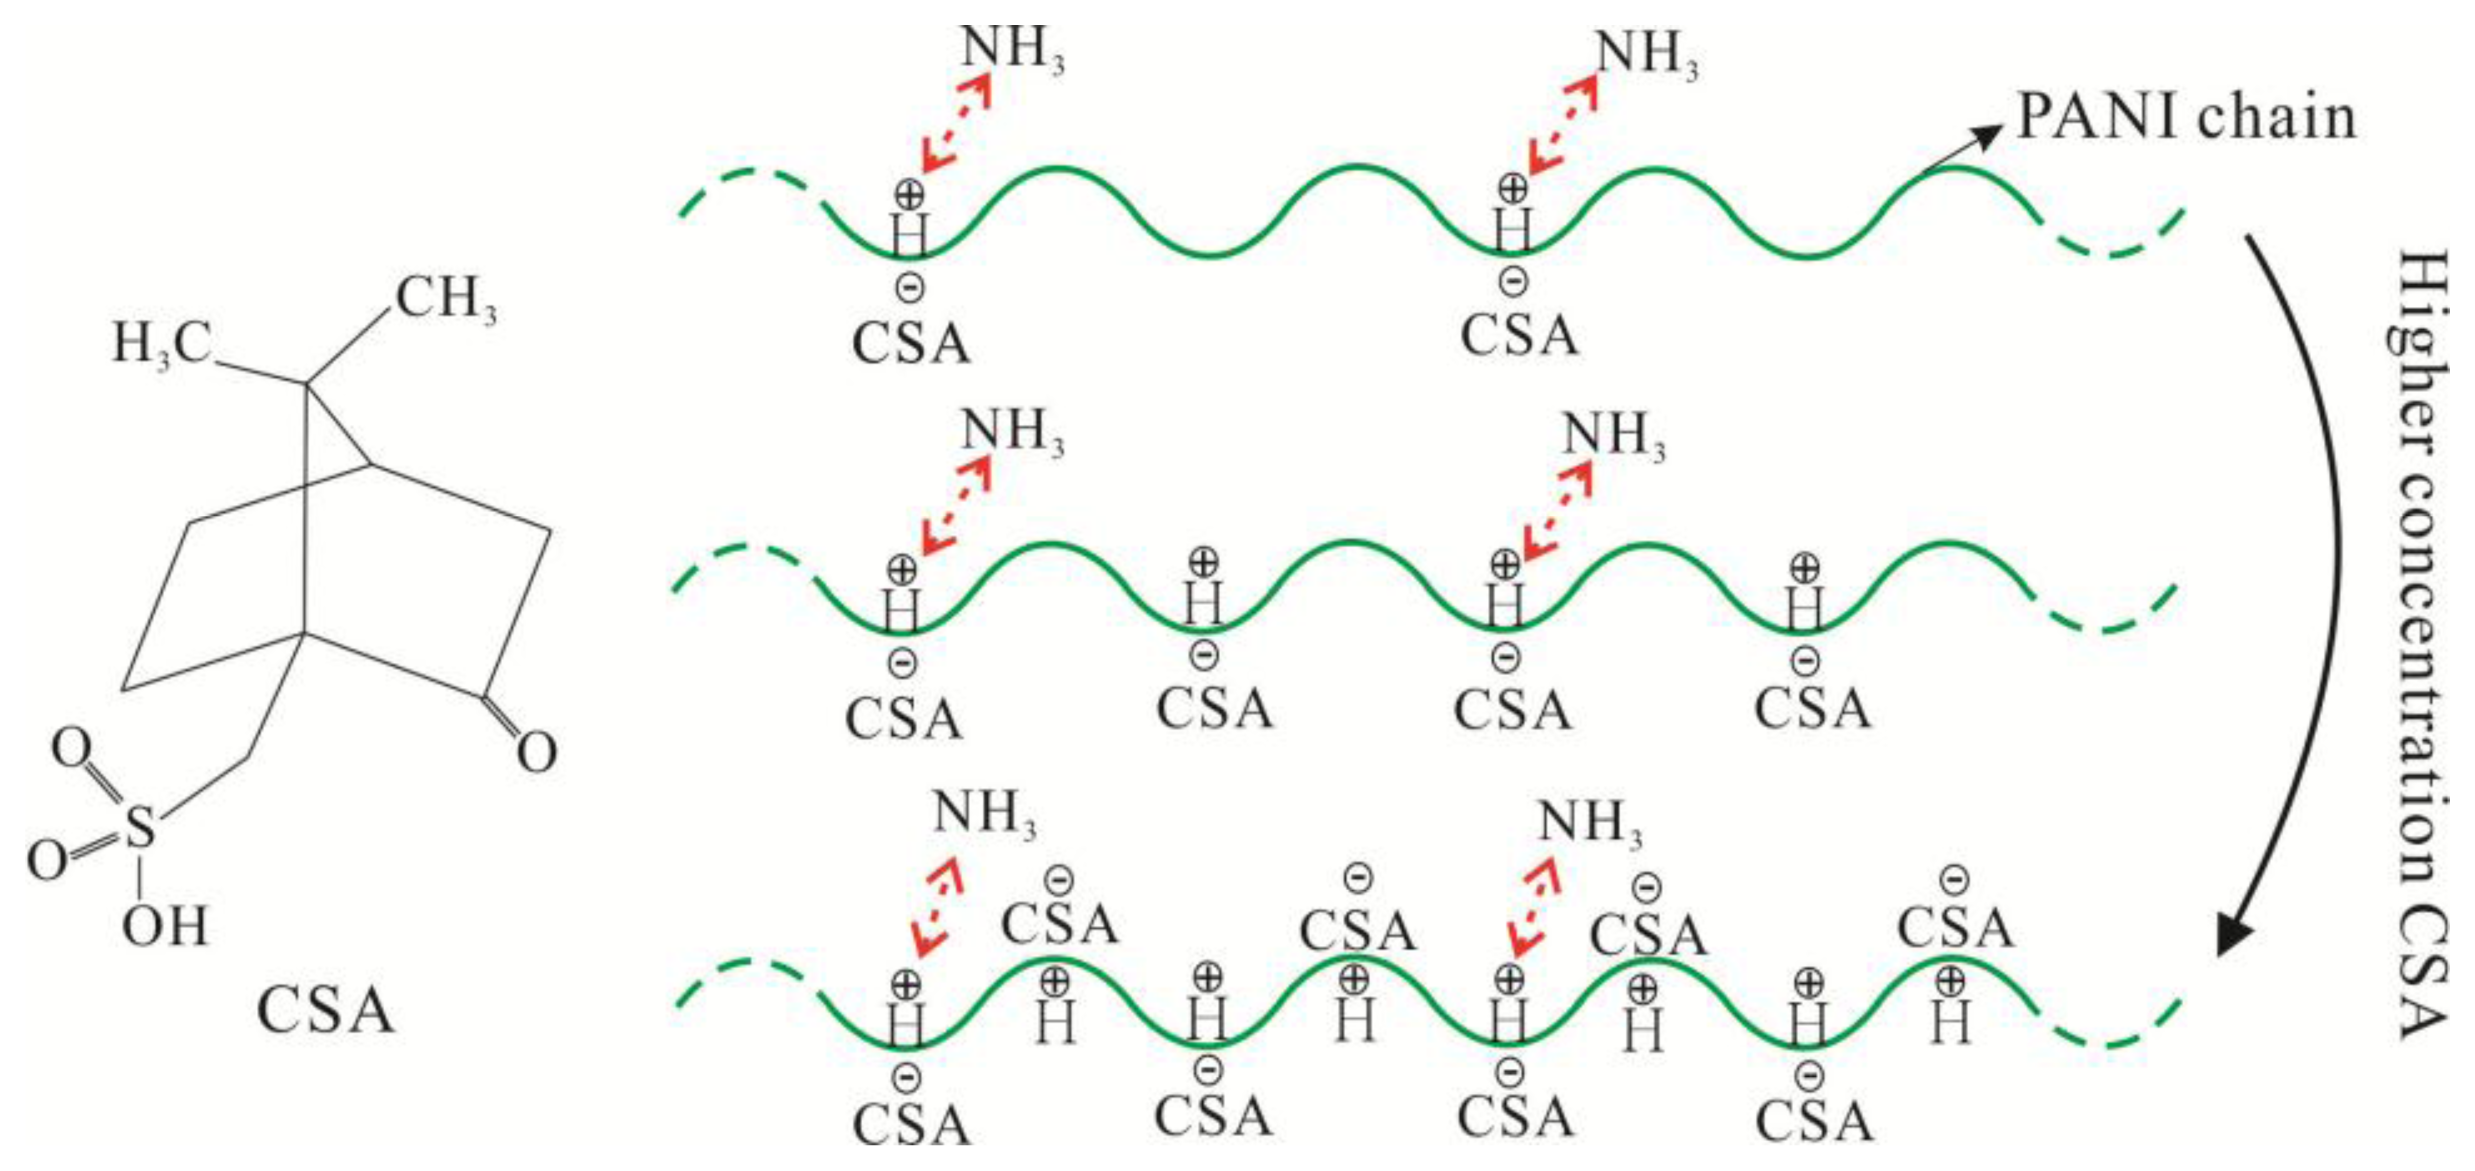
The sensing mechanism of CSA-doped PA6/PANI composite nanofibers is illustrated in Figure 12. As shown in Figure 12, PANI was doped with CSA, which was a protonic acid with large molecules.
When exposed to NH3, PANI was de-doped and the reversible reaction [27]: PANI–H+ + NH3 ⇌ PANI + NH4+ ocurred. As a result, the resistance of PANI changed, embodied as sensitivity. To improve the conductivity of PANI, high concentrations of CSA were introduced, within certain limits. High concentrations of CSA would improve the conductivity of PANI and more PANI–H+ would exist. When the NH3 concentration was constant, the number of NH3 molecules was also constant under certain conditions. This resulted in a certain amount of the PANI–H+ which could react with NH3. Then, when the concentration of CSA was high, the PANI–H+ reacted with NH3 would not make up a high proportion of all PANI–H+ within certain limits. As a result, the resistance change of the tested sensor would not account for a big percentage of the initial resistance. That is, the value of S(%) = (Ri − R0)/R0 × 100 was not very obvious, which appeared as low sensitivity. In addition, when the large molecule protonic acid CSA modified the PA6/PANI composite nanofibers as a dopant, it would increase the steric hindrance of the de-doping reactions. Therefore, when the concentration of CSA increased, the response values of the composite nanofibers decreased.
4. Conclusions
The present work reported the preparation of different concentration CSA-doped PA6/PANI composite nanofibers for the detection of NH3 gas at room temperature. The gas sensing properties of the composite nanofibers to NH3 indicated that these thin films of CSA-doped PA6/PANI composite nanofibers were good candidates for NH3 detection. It was also found that for high concentrations of CSA, the number of the PANI–H+ reacted with NH3 would not make up a high proportion of all PANI–H+ within certain limits and steric hindrance would reduce NH3's chances of being absorbed by PANI. As a result, even though high concentration CSA-doped PA6/PANI nanofibers had better conductivity, their ammonia sensing performance was degraded.
Acknowledgments
This research was financially supported by the National High-tech R&D Program of China (No.2012AA030313), Changjiang Scholars and Innovative Research Team in University (No.IRT1135), The Priority Academic Program Development of Jiangsu Higher Education Institutions, Industry-Academia-Research Joint Innovation Fund of Jiangsu Province (BY2012068) and Science and Technology Support Program of Jiangsu Province (SBE201201094), the Innovation Program for Graduate Education in Jiangsu Province (No. KYLX_1134).
Author Contributions
Zengyuan Pang designed the experiments and wrote the manuscript. Jiapeng Fu and Pengfei Lv performed the experiments. Fenglin Huang analyzed the data. Qufu Wei modified the manuscript.
Conflicts of Interest
The authors declare no conflict of interest.
References
- Patil, S.L.; Chougule, M.A.; Shashwati, S.; Patil, V.B. Measurements on room temperature gas sensing properties of CSA doped polyaniline-ZnO nanocomposites. Measurement 2012, 45, 243–249. [Google Scholar]
- Lee, J.S.; Jun, J.; Shin, D.H.; Jang, J. Urchin-like polypyrrole nanoparticles for highly sensitive and selective chemiresistive sensor application. Nanoscale 2014, 6, 4188–4194. [Google Scholar]
- Chen, D.J.; Sheng, L.; Chen, Y.Q. A single polyaniline nanofiber field effect transistor and its gas sensing mechanisms. Sensors 2011, 11, 6509–6516. [Google Scholar]
- Huyen, D.N.; Tung, N.T.; Vinh, T.D.; Thien, N.D. Synergistic effects in the gas sensitivity of polypyrrole/single wall carbon nanotube composites. Sensors 2012, 12, 7965–7974. [Google Scholar]
- Li, C.L.; Chartuprayoon, N.; Bosze, W.; Low, K.; Lee, K.H.; Nam, J.; Myung, N.V. Electrospun polyaniline/poly(ethylene oxide) composite nanofibers based gas sensor. Electroanalysis 2014, 26, 711–722. [Google Scholar]
- Wang, Q.Q.; Dong, X.J.; Pang, Z.Y.; Du, Y.Z.; X, X.; Wei, Q.F.; Huang, F.L. Ammonia sensing behaviors of TiO2-PANI/PA6 composite nanofibers. Sensors 2012, 12, 17046–17057. [Google Scholar]
- Gemeay, A.H.; Sharkawy, R.G.E.; Mansour, I.A.; Zaki, A.B. Preparation and characterization of polyaniline/manganese dioxide composites and their catalytic activity. J. Colloid Interf. Sci. 2007, 308, 385–394. [Google Scholar]
- Pawar, S.G.; Patil, S.L.; Chougule, M.A.; Raut, B.T.; Godase, P.R.; Mulik, R.N.; Sen, S.; Patil, V.B. New method for fabrication of CSA doped PANI-TiO2 thin film ammonia sensor. IEEE Sens. J. 2011, 11, 2980–2985. [Google Scholar]
- Miao, Y.E.; Fan, W.; Chen, D.; Liu, T.X. High-performance supercapacitors based on hollow polyaniline nanofibers by electrospinning. ACS Appl. Mater. Inter. 2013, 5, 4423–4428. [Google Scholar]
- Cai, G.F.; Tu, J.P.; Zhou, D.; Zhang, J.H.; Xiong, Q.Q.; Zhao, X.Y.; Wang, X.L.; Guts, C.D. Multicolor electrochromic film based on TiO2@polyaniline core/shell nanorod array. J. Phys. Chem. C. 2013, 117, 15967–15975. [Google Scholar]
- Wang, Y.Y.; Jing, X.L. Intrinsically conducting polymers for electromagnetic interference shielding. Poly. Adv. Technol. 2005, 16, 344–351. [Google Scholar]
- Gupta, T.K.; Singh, B.P.; Mathur, R.B.; Dhakate, S.R. Multi-walled carbon nanotube-graphene-polyaniline multiphase nanocomposite with superior electromagnetic shielding effectiveness. Nanoscale 2014, 6, 842–851. [Google Scholar]
- Arefinia, R.; Shojaei, A.; Shariatpanahi, H.; Neshati, J. Anticorrosion properties of smart coating based on polyaniline nanoparticles/epoxy-ester system. Prog. Org. Coat. 2012, 75, 502–508. [Google Scholar]
- Chen, M.C.; Sun, Y.C.; Chen, Y.H. Electrically conductive nanofibers with highly oriented structures and their potential application in skeletal muscle tissue engineering. ACTA Biomater. 2013, 9, 5562–5572. [Google Scholar]
- Singh, M.; Nesakumar, N.; Sethuraman, S.; Krishnan, U.M.; Rayappan, J.B.B. Electrochemical biosensor with ceria-polyaniline core shell nano-interface for the detection of carbonic acid in blood. J. Colloid Interf. Sci. 2014, 425, 52–58. [Google Scholar]
- Albanese, D.; Malvano, F.; Sannini, A.; Pilloton, R.; Di Matteo, M. A doped polyaniline modified electrode amperometric biosensor for gluconic acid determination in grapes. Sensors 2014, 14, 11097–11109. [Google Scholar]
- Wang, S.S.; Lu, S.; Li, X.M.; Zhang, X.H.; He, S.T.; He, T. Study of H2SO4 concentration on properties of H2SO4 doped polyaniline counter electrodes for dye-sensitized solar cells. J. Power Sources 2013, 242, 438–446. [Google Scholar]
- Kulkarni, M.V.; Viswanath, A.K. Scanning electron microscopy, spectroscopy, and thermal studies of polyaniline doped with various sulfonic acids. J. Macromol. Sci. Pure Appl. Chem. 2004, 41, 1173–1186. [Google Scholar]
- Arenas, M.C.; Sanchez, G.; Nicho, M.E.; Elizalde-Torres, J.; Castano, V.M. Engineered doped and codoped polyaniline gas sensors synthesized in N,N,dimethylformamide media. Appl. Phys. A 2012, 106, 901–908. [Google Scholar]
- Wu, Z.Q.; Chen, X.D.; Zhu, S.B.; Yao, Y.; Guo, H.H. Effect of humidity on electrical properties of micro/nano-polyaniline thin films with different D-CSA doping degree. Measurement 2013, 46, 411–419. [Google Scholar]
- Zhou, Y.K.; Wang, Y.S.; He, D.W.; Ju, C.B.; Gao, Q.; Gao, L.; Fu, M. Synthesis and properties of nano-polyaniline films doped with camphor sulfonic acid. J. Nanosci. Nanotechno. 2014, 14, 3417–3421. [Google Scholar]
- Choi, S.W.; Katoch, A.; Zhang, J.; Kim, S.S. Electrospun nanofibers of CuO-SnO2 nanocomposite as semiconductor gas sensors for H2S detection. Sens. Actuators B 2013, 176, 585–591. [Google Scholar]
- Raut, B.T.; Chougule, M.A.; Nalage, S.R.; Dalavi, D.S.; Mali, S.; Patil, P.S.; Patil, V.B. CSA doped polyaniline/CdS organic–inorganic nanohybrid: physical and gas sensing properties. Ceram. Int. 2012, 38, 5501–5506. [Google Scholar]
- Pang, Z.Y.; Fu, J.P.; Luo, L.; Huang, F.L.; Wei, Q.F. Fabrication of PA6/TiO2/PANI composite nanofibers by electrospinning-electrospraying for ammonia sensor. Colloids Surf. A 2014, 461, 113–118. [Google Scholar]
- Pan, Y.J.; Dong, X.J.; Wei, Q.F.; Hung, W.M.; Lin, C.Y.; Ho, Y.H.; Hsieh, C.Y. Preparation and ammonia sensing properties of PANI-TSA/PA6 core-shell nanofibers by electrospinning. Adv. Mater. Res. 2012, 421, 23–26. [Google Scholar]
- Khuspe, G.D.; Navale, S.T.; Chougule, M.A.; Patil, V.B. Ammonia gas sensing properties of CSA doped PANI-SnO2 nanohybrid. Synth. Met. 2013, 185–186, 1–8. [Google Scholar]
- Kebiche, H.; Debarnot, D.; Merzouki, A.; Poncin-Epaillard, F.; Haddaoui, N. Relationship between ammonia sensing properties of polyaniline nanostructures and their deposition and synthesis methods. Anal. Chim. Acta 2012, 737, 64–71. [Google Scholar]


© 2014 by the authors; licensee MDPI, Basel, Switzerland. This article is an open access article distributed under the terms and conditions of the Creative Commons Attribution license ( http://creativecommons.org/licenses/by/4.0/).
Share and Cite
Pang, Z.; Fu, J.; Lv, P.; Huang, F.; Wei, Q. Effect of CSA Concentration on the Ammonia Sensing Properties of CSA-Doped PA6/PANI Composite Nanofibers. Sensors 2014, 14, 21453-21465. https://doi.org/10.3390/s141121453
Pang Z, Fu J, Lv P, Huang F, Wei Q. Effect of CSA Concentration on the Ammonia Sensing Properties of CSA-Doped PA6/PANI Composite Nanofibers. Sensors. 2014; 14(11):21453-21465. https://doi.org/10.3390/s141121453
Chicago/Turabian StylePang, Zengyuan, Jiapeng Fu, Pengfei Lv, Fenglin Huang, and Qufu Wei. 2014. "Effect of CSA Concentration on the Ammonia Sensing Properties of CSA-Doped PA6/PANI Composite Nanofibers" Sensors 14, no. 11: 21453-21465. https://doi.org/10.3390/s141121453