Application of Visible and Near Infrared Spectroscopy for Rapid Analysis of Chrysin and Galangin in Chinese Propolis


Abstract
: A novel method for the rapid determination of chrysin and galangin in Chinese propolis of poplar origin by means of visible and near infrared spectroscopy (Vis-NIR) was developed. Spectral data of 114 Chinese propolis samples were acquired in the 325 to 1,075 nm wavelength range using a Vis-NIR spectroradiometer. The reference values of chrysin and galangin of the samples were determined by high performance liquid chromatography (HPLC). Partial least squares (PLS) models were established using the spectra analyzed by different preprocessing methods. The effective wavelengths were selected by successive projections algorithm (SPA) and employed as the inputs of PLS, back propagation-artificial neural networks (BP-ANN), multiple linear regression (MLR) and least square-support vector machine (LS-SVM) models. The best results were achieved by SPA-BP-ANN models established with the Savitzky-Golay smoothing (SG) preprocessed spectra, where the r and RMSEP were 0.9823 and 1.5239 for galangin determination and 0.9668 and 2.4841 for chrysin determination, respectively. The results show that Vis-NIR demosntrates powerful capability for the rapid determination of chrysin and galangin contents in Chinese propolis.1. Introduction
Propolis, also called bee glue, is a brownish, sticky resinous substance collected by honeybees from leaf buds and cracks in the bark of certain trees and plants. Propolis has a complex chemical composition and has been used widely in folk medicine for many years. It is reported that propolis has many biological and pharmacological characteristics, including antibacterial, anti-inflammatory, antiviral, antitumor, anticancer, and immunomodulatory effects [1]. There are over 150 constituents in propolis, including polyphenols, terpenoids, steroids and amino acids. Flavonoids, as one of the most important groups, can represent around 50% of the propolis contents, depending on the harvest region, since the characteristics of propolis are influenced by the local plant varieties and weather [2]. Chrysin and galangin as two of the main flavonoids in propiolis are generally analyzed using chromatographic methods according to the Chinese Pharmacopeia and the current standard of Ministry of Agriculture of China [3]. Generally, methods for determining chrysin and galangin in Chinese propolis include TLC, GC [4] and HPLC [5,6], that are helpful in identification and quantification of the various chemical constituents of propolis, but these methods are complex and time-consuming. Therefore, it is necessary to develop a rapid and effective quantitative analysis method for the quality determination of Chinese propolis.
With the development of spectroscopic techniques and modern chemometrics, visible and near infrared (Vis-NIR) spectroscopy that is considered to be non-destructive, simple and rapid, has been widely applied in the research of agricultural, food, and natural products [7–10]. Especially, in recent years, there are many reports about the application of spectroscopy techniques in various aspects of research on traditional Chinese medicines (TCMs), such as geographical source identification, quality control, stability forecasting, etc. [11–14]. However, there are few studies evaluating the potential of Vis-NIR for quantitative analysis of chrysin and galangin in Chinese propolis.
The objective of the study was thus to develop a new method to quantitatively and non-destructively determine the contents of chrysin and galangin in Chinese propolis by the Vis-NIR technique. For this purpose the performances of established prediction models using different chemometric methods were compared and evaluated.
2. Materials and Methods
2.1. Apparatus and Reagents
ASD FieldSpec Pro FR (350–1,075 nm, Analytical Spectral Device, Boulder, CO, USA), Agilent 1100 high performance liquid chromatograph (Agilent Technologies Inc., Santa Clara, CA, USA), KQ-100DB ultrasonic cleaner (Shanghai, China), Mettler Toledo AB204-S electronic balance (Zurich, Switzerland).
Chrysin and galangin were purchased from the National Institute for the Control of Pharmaceutical and Biological Products (Beijing, China). The HPLC-grade methanol and acetonitrile both were obtained from Tedia Scientific Inc. (Cincinnati, OH, USA). Phosphoric acid (analytical grade, P85%) was purchased from Zhejiang Chemicals Company (Zhejiang, China). All the other reagents were of analytical grade. Water used throughout the experiments was purified water provided by Wahaha Company (Zhejiang, China).
A total of 114 samples of Chinese propolis of poplar origin used in this research were purchased from beekeepers in the Shandong, Jilin, Anhui, Zhejiang, Jiangsu, Jiangxi and Henan provinces of China. Each sample was dehydrated into a powder. Among the prepared samples, 76 samples were selected randomly to be used as the calibration set, and the remaining 38 samples were used as the prediction set.
2.2. Spectra Measurements
Each sample was put in a Petri dish and then scanned using a spectroradiometer working in the wavelength range of 325 to 1,075 nm. A white disk was used as the reference board. Spectra data were collected and processed using RS2 V4.02 software for Windows (Analytical Spectral Devices, Inc., Boulder, CO, USA). The probe of the spectroradiometer was fixed 100 mm above the surface of the sample with the field of view (FOV) of 25° and an angle of 45° away from the center of the sample container. Each sample was scanned 30 times, and the acquired spectra were averaged as the measured spectrum of this sample.
2.3. Liquid Chromatographic Conditions
Contents of chrysin and galangin were determined on an Agilent 1100 series HPLC system, which consists of a G1322A vacuum degasser, a G1311A quaternary pump, a G1329A autosampler, a G1314B programmable variable wavelength detector (VWD), and a G1316A Thermostatted Column Compartment. All analyses were performed by using a Diamonsil C18 column (250 × 4.6 mm, 5 μm) at 30 °C. The detection wavelength was set at 268 nm. The mobile phase consisted of (A) methanol and (B) 0.15% aqueous phosphoric acid at a flow rate of 1 ml/min. Separations were performed by the following linear gradient: 64% A in 25 min, 75% A in 8 min. The injection volume was 10 μL.
2.4. Pretreatment of Spectral Data
Before the calibration process, the spectra of all samples were pretreated to reduce baseline variation, light scattering, and path length differences using several preprocessing algorithms, including Savitzky-Golay smoothing (SG), moving averages smoothing (MAS), standard normal variate transformation (SNV), multiplicative scattering correction (MSC), the first derivative (1st-Der), the second derivative (2nd-Der) and de-trending (De-trending). The details of these pretreatment methods could be found in the literature [15]. These methods were compared to choose the optimum preprocessing strategy. The pre-process and calculations were carried out using the Unscrambler X10.1 software (Camo Process AS, Oslo, Norway).
2.5. Data Analysis
Partial least square (PLS) [16] was applied to develop the calibration models as well as a way to extract latent variables (LVs). PLS is performed to establish a regression model to perform the prediction of physiological concentrations [17]. The LVs are considered as new eigenvectors of the original spectra to reduce the dimensionality and compress the original spectral data.
Multiple linear regression (MLR) is aimed to establish a direct, simple, and linear combination of independent variables (referring spectral wavelengths in this work, X) that corresponds as closely as possible to the dependent variable (referring a quality attribute, Y) [18,19]. The drawback of MLR is that the number of samples for MLR must be larger than the number of variables. In this study, effective wavelengths (EWs) were set as the independent variables of MLR, so that the number of input variables of the MLR model could be smaller than that of samples.
A back propagation-artificial neural network (BP-ANN) as one of the most popular neural network topologies, was employed in this paper to establish the relationship between EWs and galangin/chrysin contents. In the calculation of BP-ANN, the EWs are introduced into the network as inputs via the nodes of the input layer. The input signals are then transferred from the input node to the output node via the hidden layer. The BP-ANN model is developed by adjusting the nodes of hidden layers and other parameters.
Least square-support vector machine (LS-SVM) is a modified algorithm based on the classical SVM and has been applied for spectral analysis [20]. It uses a set of least squares linear equations as loss functions instead of the quadratic programming to obtain the supported vectors, and is capable of dealing with linear and nonlinear multivariate calibration and solves multivariate calibration problems in a relatively fast way [21]. It is very important to select a proper kernel function and determine its optimal parameters for the construction of LS-SVM models. Radial basis function (RBF) is a simple Gaussian function that can simplify the complexity of the computation during the course of training LS-SVM models, so that RBF kernel was chosen for LS-SVM modeling in the study. It was found having more capability in prediction than other kernels [22]. The formula of RBF can be expressed as:
In this study, EWs were selected in order to reduce the input variables and improve the speed of model calibration. Successive projection algorithm (SPA) was used to identify EWs from the whole spectral range, where a variable group that contains a minimum of redundant information in the spectral matrix is chosen to minimize the colinearity of different variables, so that the input variables were simplified and the efficiency of modeling could be improved. SPA was performed by Matlab 7.10.0 software (The Mathworks, Inc., Natick, MA, USA). EWs selected by SPA were employed as the inputs of PLS, BP-ANN, MLR and LS-SVM to develop calibration models, and their performances were compared. The correlation coefficient (r) and root mean square error of prediction (RMSEP) were applied to evaluate the performances of the established models. PLS and MLR were implemented by Unscrambler X10.1, and LS-SVM and BP-ANN were compiled by the Matlab 7.10.0 software.
3. Results and Discussion
3.1. Features of Vis-NIR Spectra and HPLC Analysis
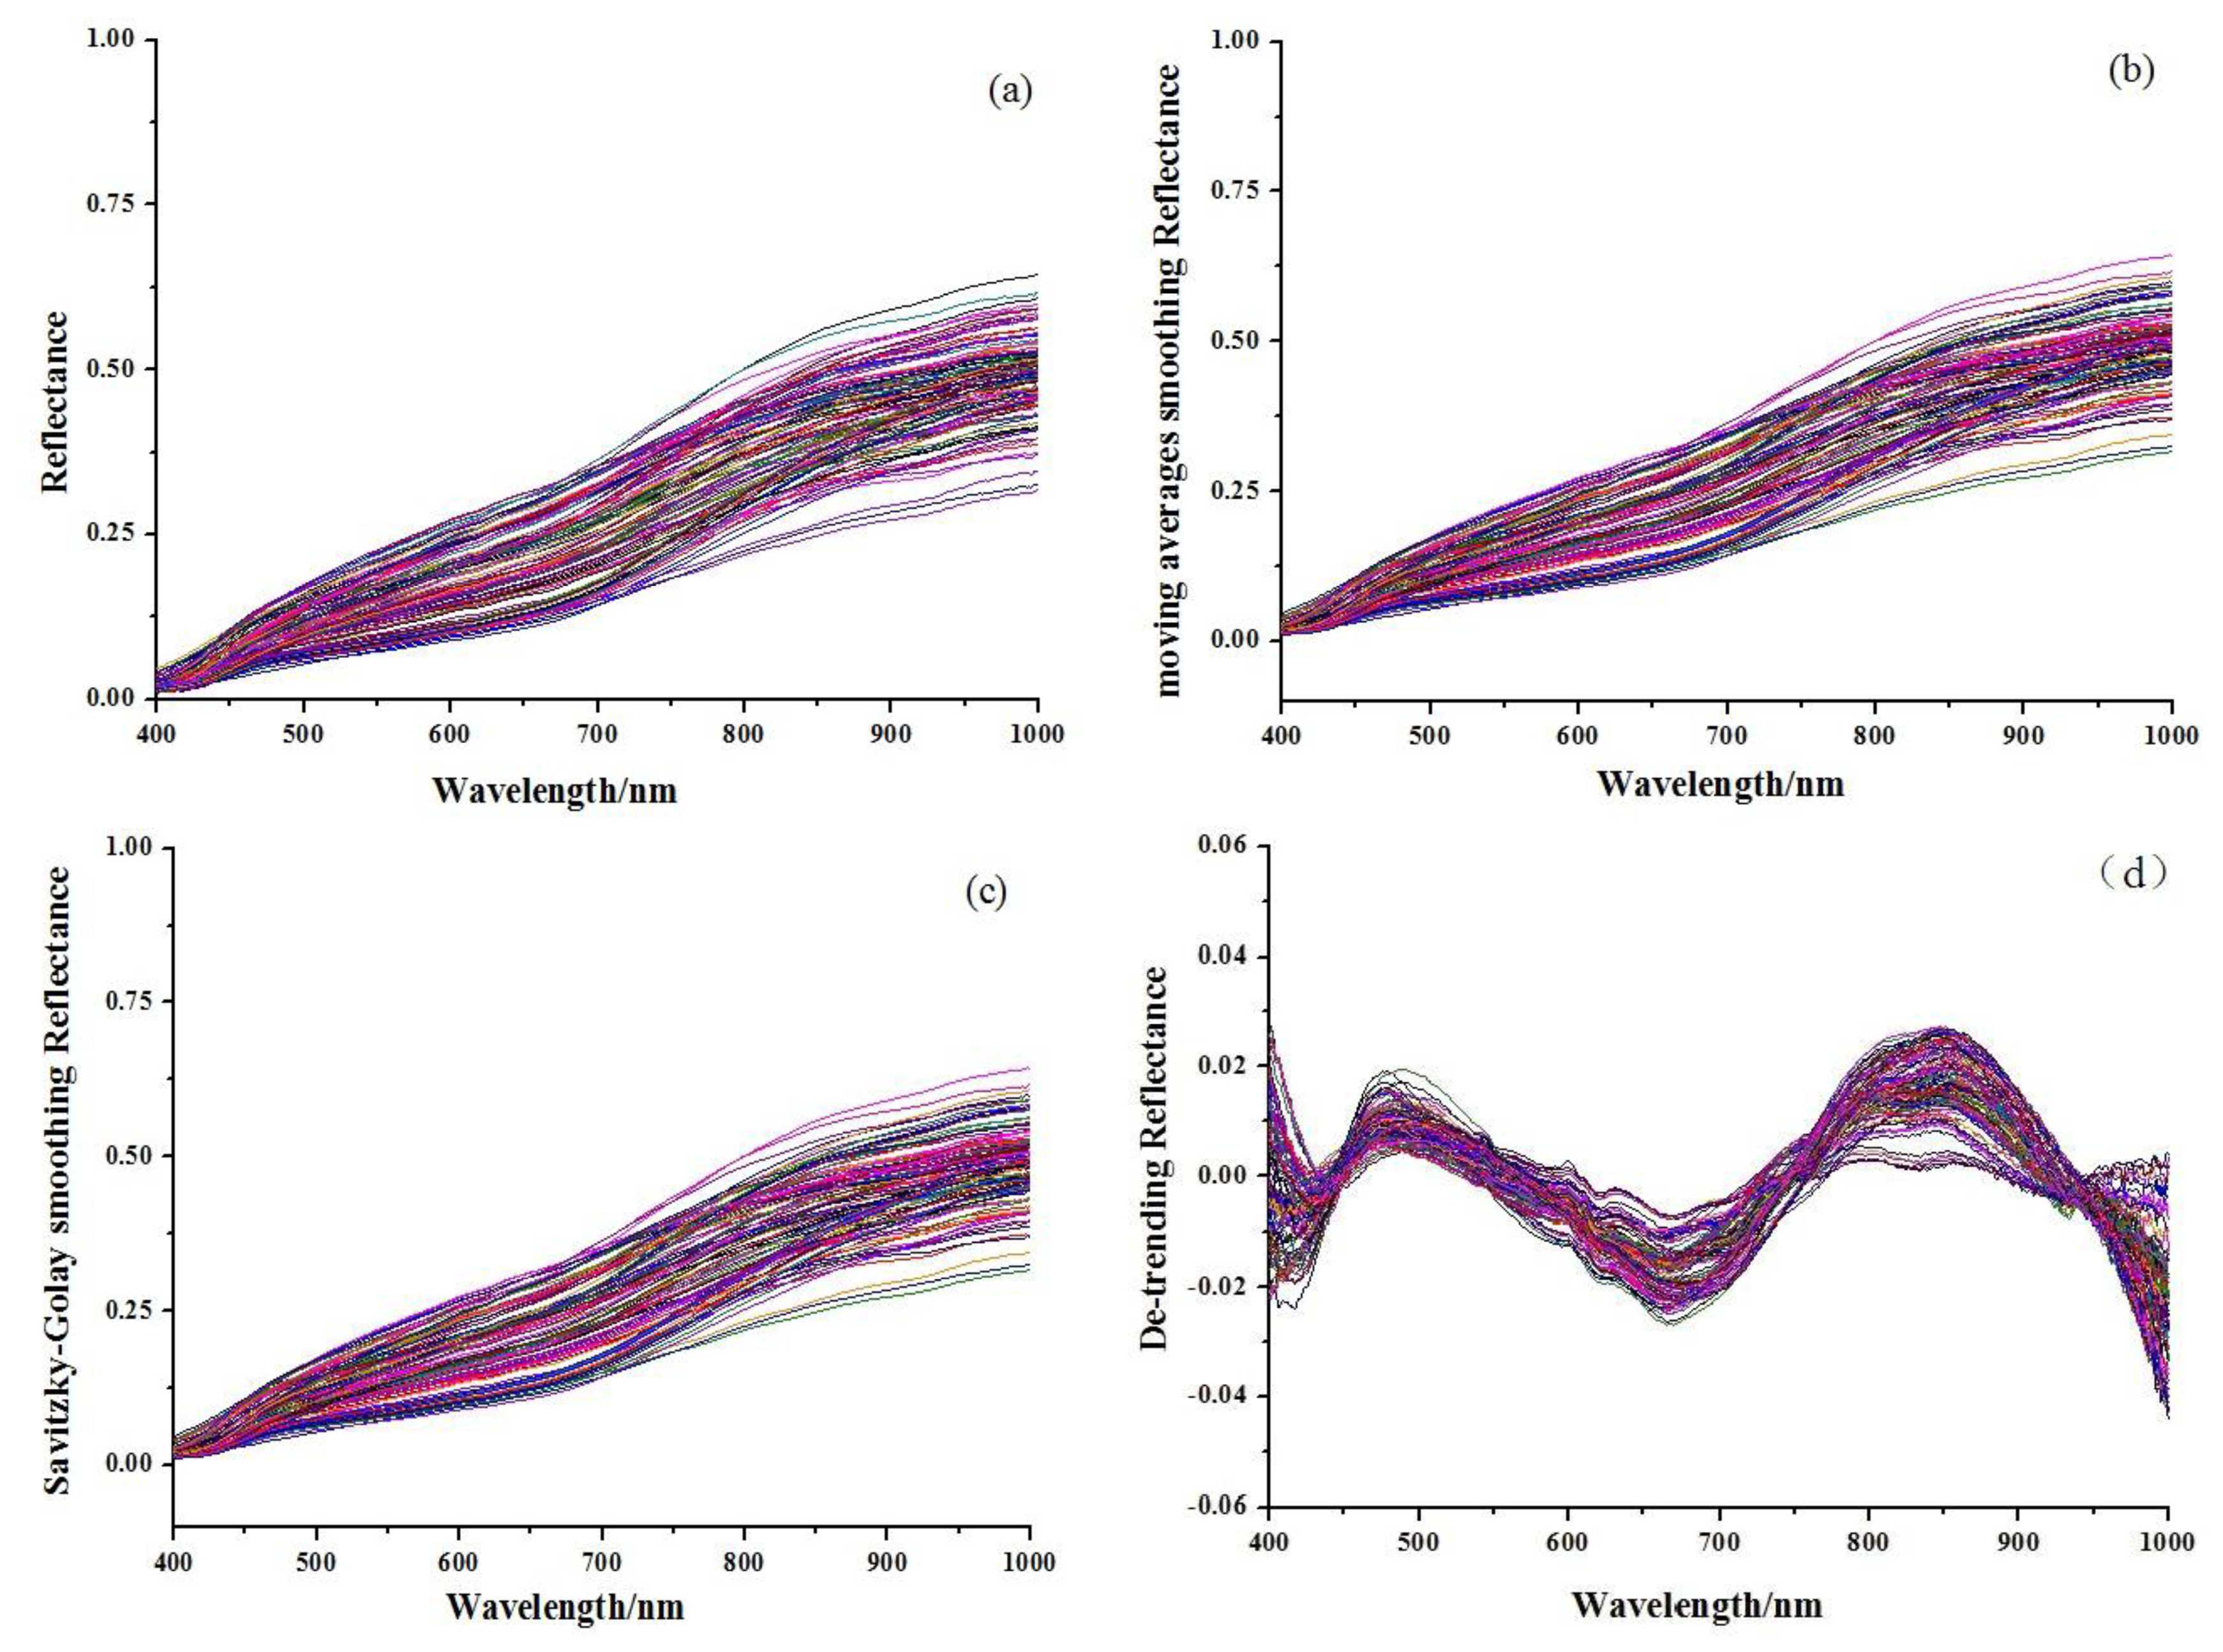
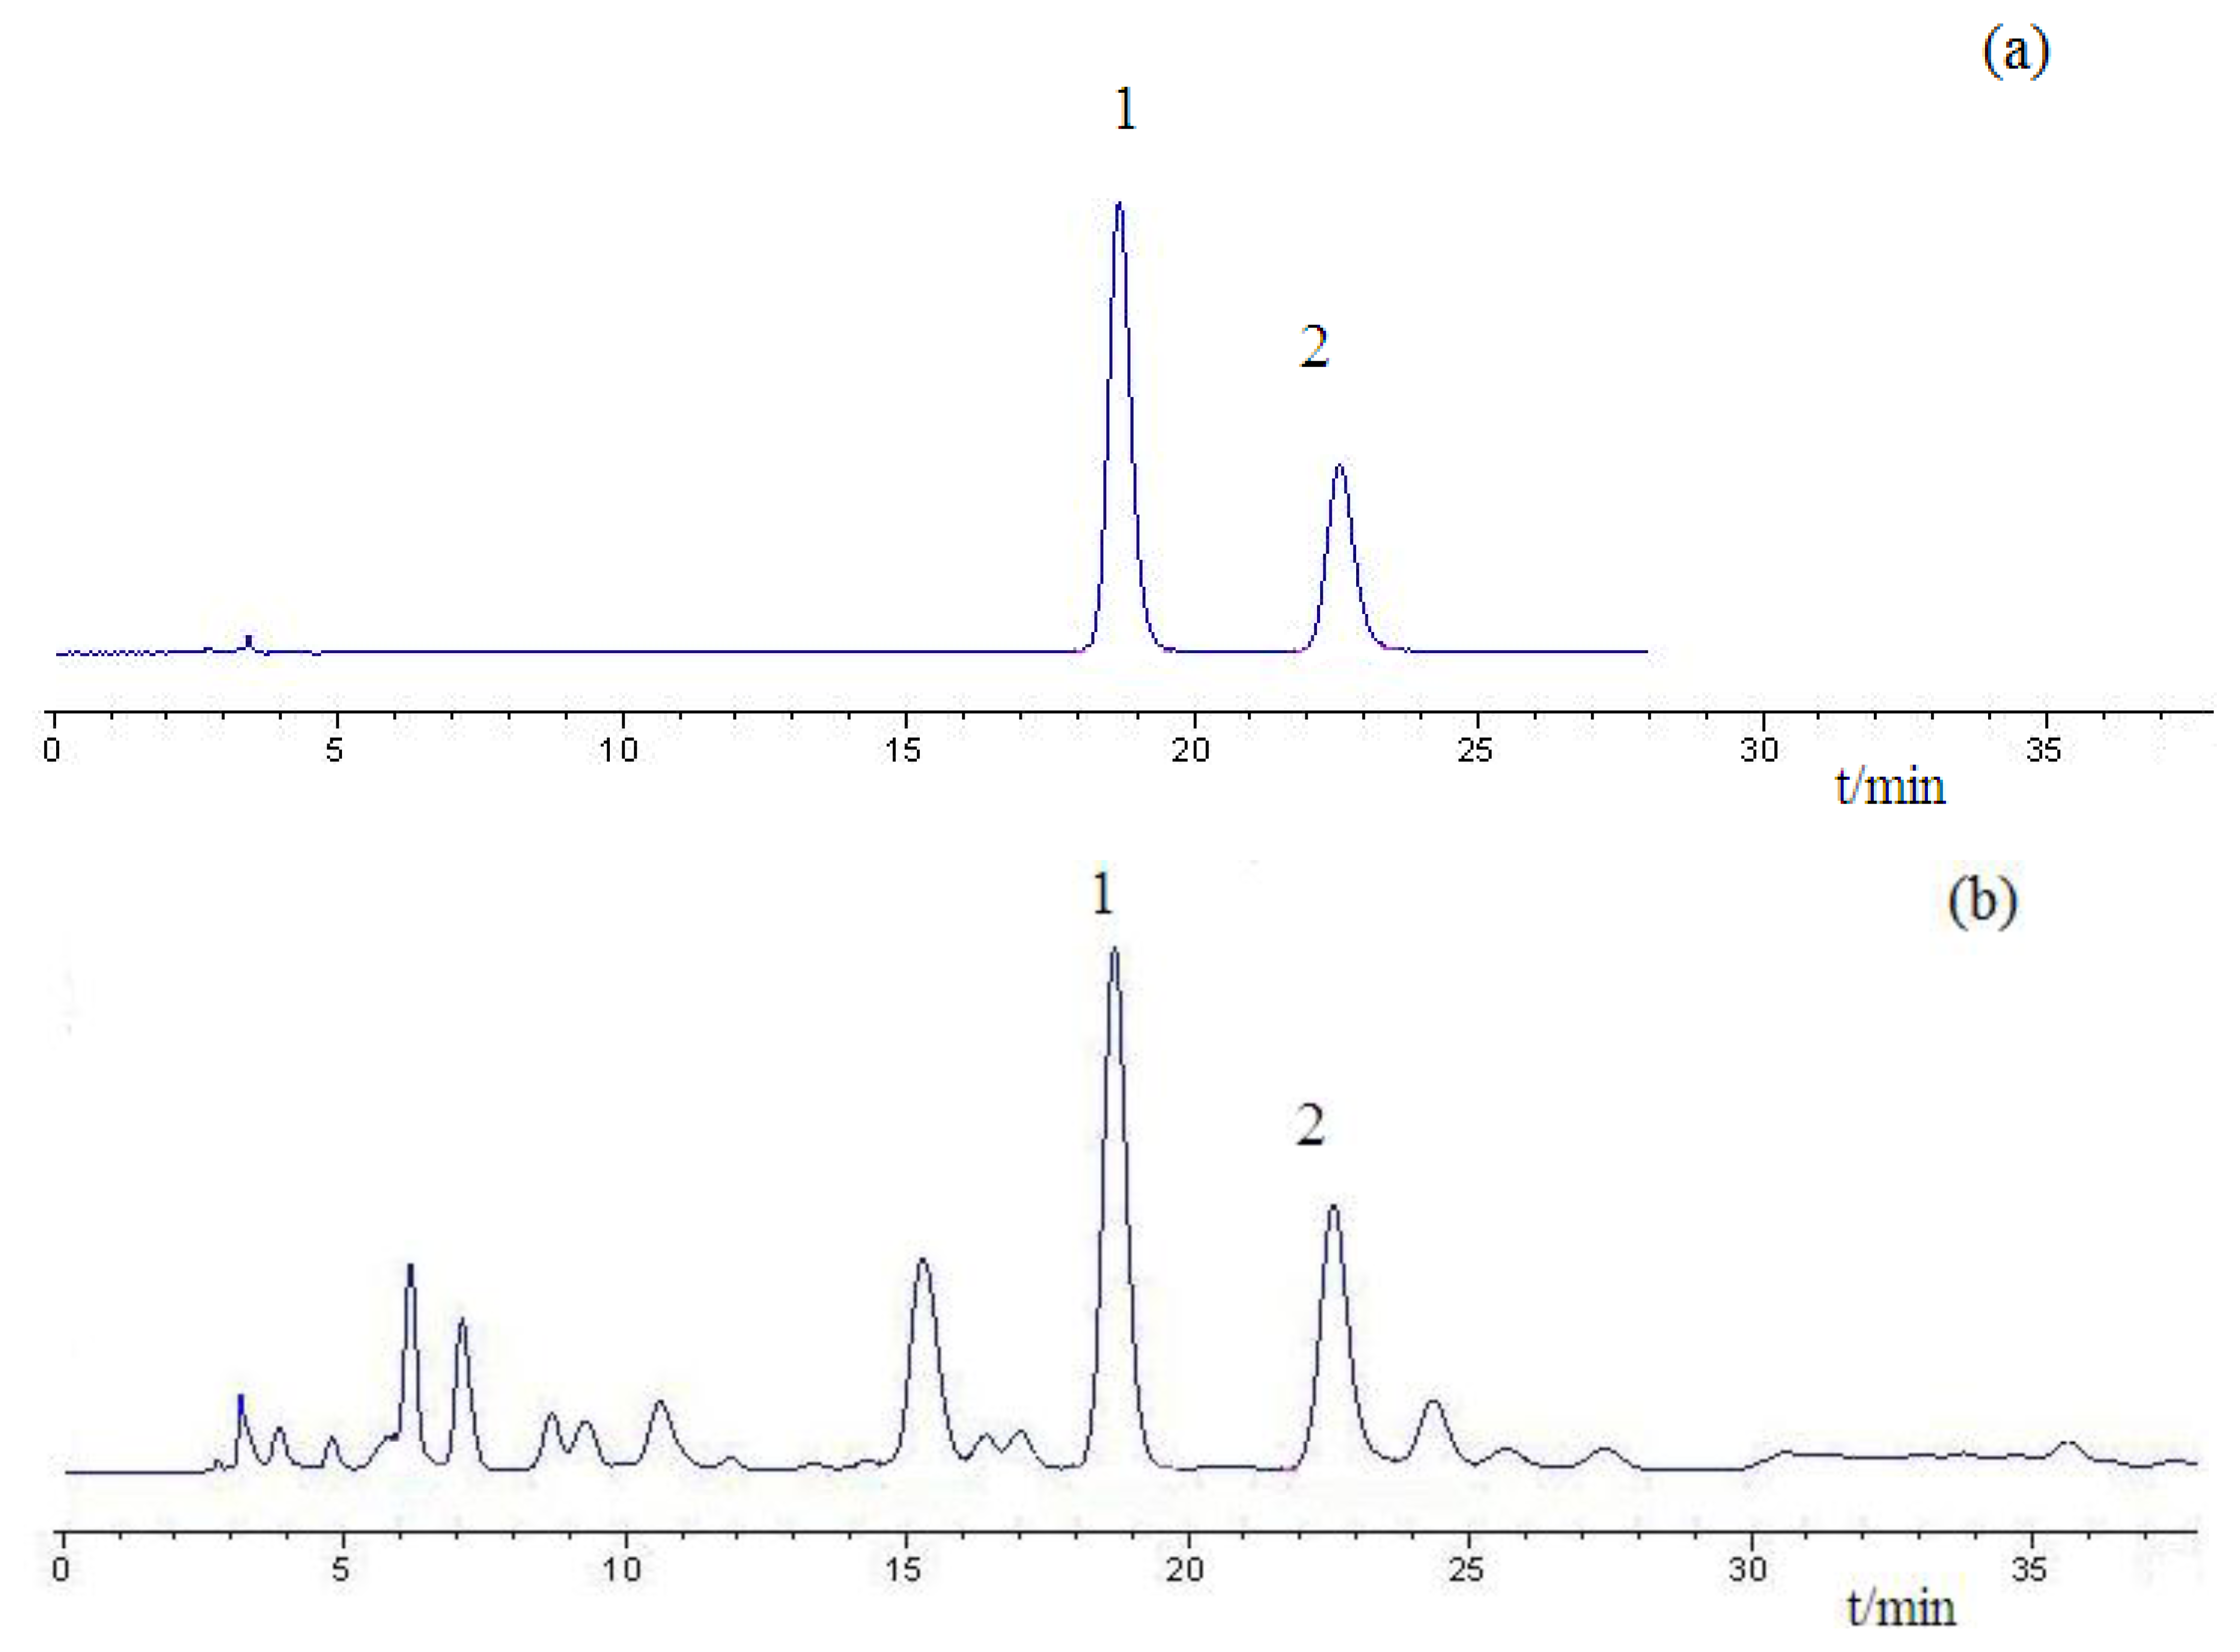
Figure 1 shows the original absorbance spectra and preprocessed spectra of 114 Chinese propolis samples. It was noticed that all spectra had similar profiles that were quite even throughout the whole wavelength range. The main difference of spectra was the different magnitudes of the spectral reflectance as shown in Figure 1, which might be caused by different contents of the internal attributes for the samples, including galangin and chrysin. The reference values of chrysin and galangin in Chinese propolis samples determined by HPLC are shown in Table 1. HPLC chromatograms of a typical propolis samples and standard solution are shown in Figure 2.
3.2. PLS Analysis
Different spectral pretreatment algorithms were executed on the raw Vis-NIR spectral data. The pretreated spectra were set as inputs to develop PLS models to determine the optimal pretreatment way. Results of the PLS models established using the raw and pretreated spectra are shown in Table 2. The best result was obtained based on De-trending process for the chrysin prediction, followed by SG process. The prediction result of De-trending model had a good correlation coefficient (r) of 0.9476 and a small root mean square error of prediction (RMSEP) of 3.0172. On the other hand, the best PLS model (r = 0.9394 and RMSEP = 2.5733) was achieved by considering the raw spectra for galangin analysis, followed by MAS and SG process. The original/pretreated spectra shown the best performances were employed for further treatment.
3.3. EWs Extracted by SPA
SPA was applied to select EWs based on the spectral data processed by raw spectra for galangin, De-trending and SG for chrysin, respectively. These preprocessing methods achieved good prediction performance in PLS models for galangin or chrysin prediction. In addition, the original spectral data were also applied for a comparison. Maximum number of EWs extracted by SPA was set at 30.
After the process of leave-one-out cross validation, the extracted EWs based on the original and pretreated spectra are shown in Table 3. The EWs were arranged according to the importance. Higher ranking indicates the EW is more important for the prediction of chrysin and galangin in Chinese propolis.
3.4. Model Calibration
In order to establish quantitative models for the determination of chrysin and galangin in Chinese propolis, EWs selected by SPA were employed as inputs of PLS, LS-SVM, MLR and BP-ANN methods, resulting in establishing SPA-PLS, SPA-LS-SVM, SPA-MLR, SPA-BP-ANN models, respectively (Table 4). In the establishment of SPA-LS-SVM model, the values of two parameters of gam(γ) and sig2(σ2) were determined by a two-step grid search method with leave-one-out cross-validation. The search region of γ, σ2 was set as 10−3–108. BP-ANN model was constructed with three layers, and the number of nodes in the hidden layer was set as nine. The least learning rate was set as 0.6, and the goal error was set to 1.0 × 10⁻⁵. The networks were trained by gradient descend method and the minimum gradient was set as 1.0 × 10⁻¹⁰. The biggest epochs was set as 1,000.
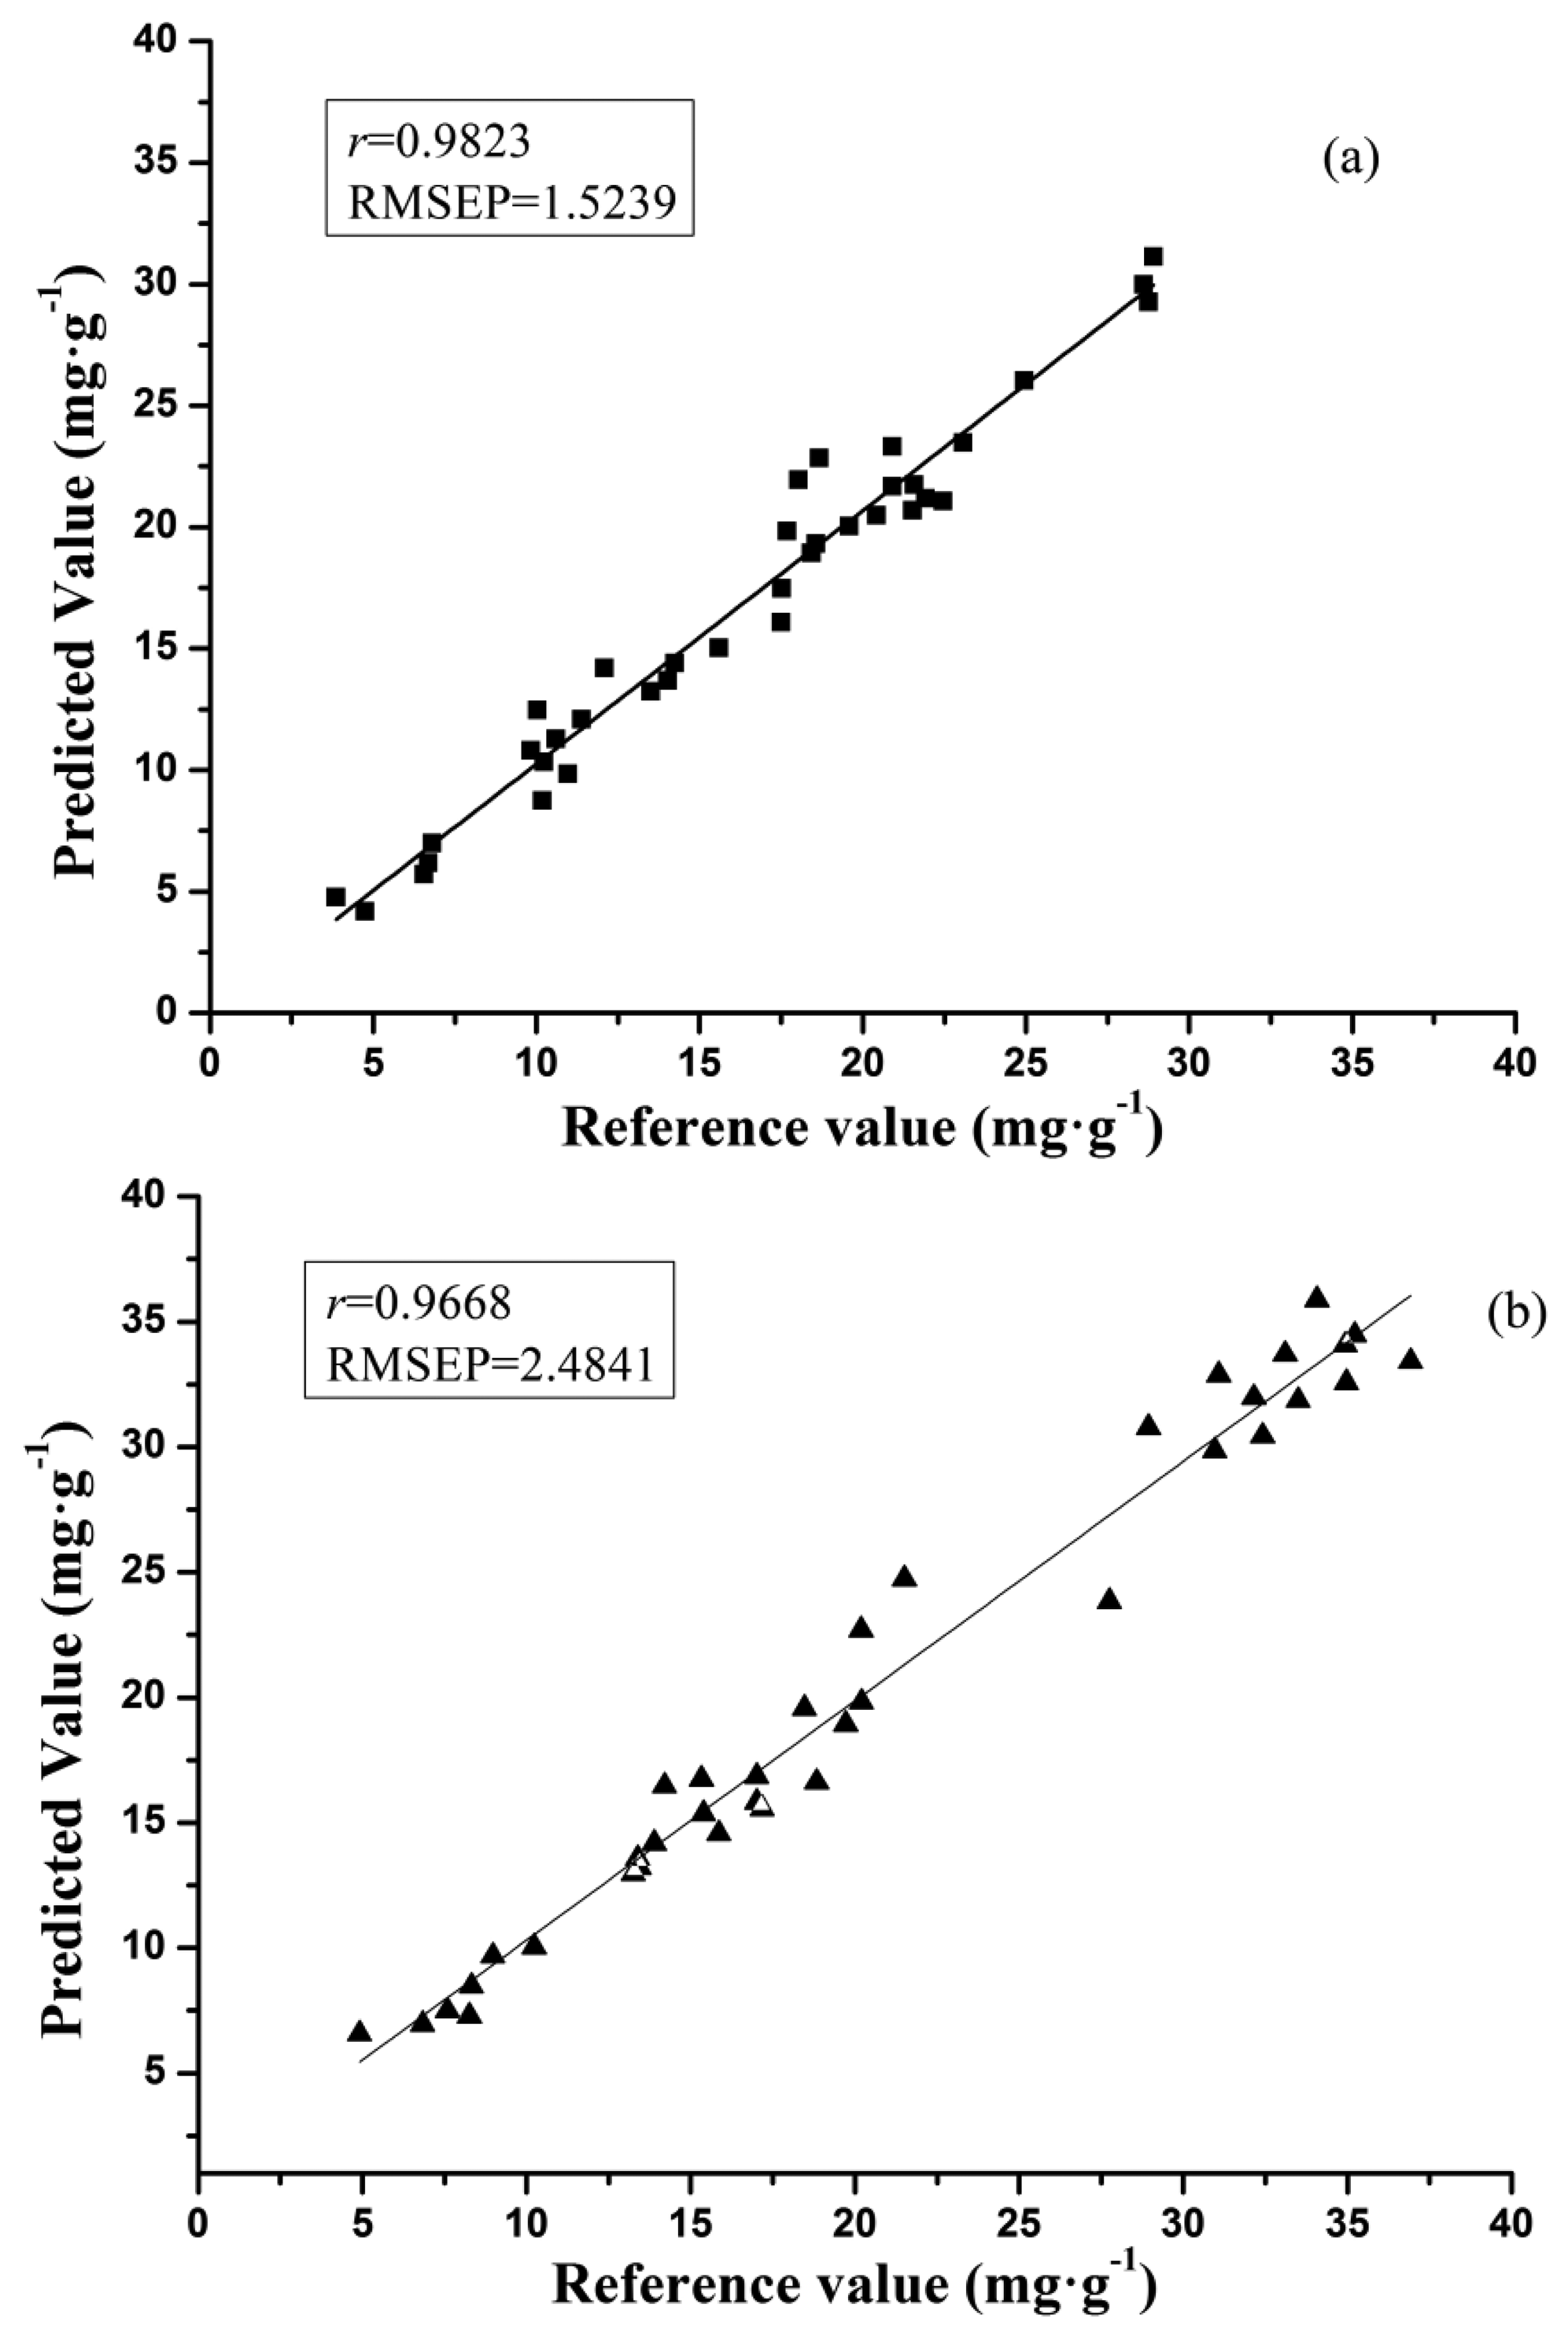
As shown in Table 4, the optimal prediction performance for the galangin determination was achieved by SPA-BP-ANN model (processed by SG) with r of 0.9823 and RMSEP of 1.5239, and SPA-BP-ANN model (processed by SG) was found to be the best one for the chrysin determination, in which r was 0.9668 and RMSEP was 2.4841. The scatter plots of SPA-BP-ANN models for samples in the prediction set in both galangin and chrysin analysis are shown in Figure 3.
As the SPA-BP-ANN model outperformed the SPA-PLS, SPA-MLR and SPA-LS-SVM models, it might indicate that there was a nonlinear relationship between the spectral data and the dependent variable (galangin or chrysin). Therefore, BP-ANN models could perform better prediction by taking useful nonlinear information in the selected EWs, while PLS and MLR models only have the ability to quantify the information in the spectral data to the dependent variable in linear ways.
4. Conclusions
In this study, the use of Vis-NIR spectroscopy combined with the reference HPLC method to determine chrysin and galangin contents in Chinese propolis was evaluated. Different pretreatment and modeling methods were compared. In specific, De-trending were determined as the optimal preprocessing method for chrysin, and raw data was the best for galangin. EWs extracted by SPA were proved to be informative inputs for developing models. The best prediction performance with r of 0.9823 and RMSEP of 1.5239 was achieved by the SPA-BP-ANN model for galangin, while SPA-BP-ANN model also had a better performance for chrysin with r of 0.9668 and RMSEP of 2.4841. The results indicate the feasibility of using Vis-NIR spectroscopy with a BP-ANN model chemometrics method based on EWs identified by SPA as inputs to measure chrysin and galangin in Chinese propolis rapidly and quantitatively. In the future, more samples and varieties of propolis should be considered to establish a more stable model for industrial application. In general, a high precision detection of chrysin and galangin was attained by the HPLC method, however, the method was complex and time-consuming. Rapid, nondestructive and efficient determination of chrysin and galangin was achieved by Vis-NIR spectroscopy, although the precision and adaptability still need to be further improved.
Acknowledgments
This study was supported by the National Science Foundation for Post-doctoral Scientists of China (2013M531463) and Zhejiang postdoctoral science fund (Bsh1202090).
Conflicts of Interest
The authors declare no conflict of interest.
References
- Banskota, A.H.; Nagaoka, T.; Sumioka, L.Y.; Tezuka, Y.; Awale, S.; Midorikawa, K. Antiproliferative activity of the Netherlands propolis and its active principles in cancer cells lines. J. Ethnopharmacol. 2002, 80, 67–73. [Google Scholar]
- Beatriz, C.B.S.M.; José, C.C.P.; Miriam, D.H. Concentration of flavonoids and phenolic compounds in aqueous and ethanolic propolis extracts through nanofiltration. J. Food Eng. 2010, 96, 533–539. [Google Scholar]
- Committee of National Pharmacopoeia. In Pharmacopoeia of People's Republic of China; Chemical Industry Press: Beijing, China, 2010; p. 336.
- Popova, M.; Silicib, S.; Kaftanoglu, O.; Bankova, V. Antibacterial activity of Turkish propolis and its qualitative and quantitative chemical composition. Phytomedicine 2005, 12, 221–228. [Google Scholar]
- Volpi, N.; Bergonzini, G. Analysis of flavonoids from propolis by on-line HPLC–electrospray mass spectrometry. Pharm. Biomed. Anal. 2006, 42, 354–361. [Google Scholar]
- Gómez-Caravaca, A.M.; Gómez-Romero, M.; Arráez-Román, D.; Segura-Carretero, A.; Fernández-Gutiérrez, A. Advances in the analysis of phenolic compounds in products derived from bees. J. Pharm. Biomed. Anal. 2006, 41, 1220–1234. [Google Scholar]
- Nie, P.C.; Wu, D.; Yang, Y.; He, Y. Fast determination of boiling time of yardlong bean using visible and near infrared spectroscopy and chemometrics. J. Food Eng. 2012, 109, 155–161. [Google Scholar]
- Nie, P.C.; Wu, D.; Yang, Y.; Zhao, K.; He, Y. Development of a portable plant nutrition test instrument based on spectroscopic technique. Afr. J. Microbiol. Res. 2012, 6, 1958–1965. [Google Scholar]
- Wu, D.; Chen, X.; Zhu, X.; Guan, X.; Wu, G. Uninformative variable elimination for improvement of successive projections algorithm on spectral multivariable selection with different calibration algorithms for the rapid and non-destructive determination of protein content in dried laver. Anal. Methods. 2011, 3, 1790–1796. [Google Scholar]
- Xin, N.; Gu, X.F.; Wu, H.; Hu, Y.Z.; Yang, Z.L. Discrimination of raw and processed Dipsacus asperoides by near infrared spectroscopy combined with least squares-support vector machine and random forests. Spectrochim. Acta Part A Mol. Biomol. Spectrosc. 2012, 89, 18–24. [Google Scholar]
- Wu, D.; Chen, J.; Lu, B.; Xiong, L.; He, Y.; Zhang, Y. Application of near infrared spectroscopy for the rapid determination of antioxidant activity of bamboo leaf extract. Food Chem. 2012, 135, 2147–2156. [Google Scholar]
- Huck, P.V.A.; Pallua, J.D.; Pezzei, C.; Schönbichler, S.A.; Bittner, L.K.; Bonn, G.K.; Huck, C.W. Application of near-infrared spectroscopy (NIRS) as a tool for quality control in Traditional Chinese Medicine (TCM). Planta Med. 2011, 77, 55–61. [Google Scholar]
- Xu, B.; Wu, Z.S.; Lin, Z.Z.; Sui, C.L.; Shi, X.Y.; Qiao, Y.J. NIR analysis for batch process of ethanol precipitation coupled with a new calibration model updating strategy. Anal. Chim. Acta 2012, 720, 22–28. [Google Scholar]
- Wu, Y.W.; Sun, S.Q.; Zhou, Q.; Leung, H.W. Fourier transform mid-infrared (MIR) and near-infrared (NIR) spectroscopy for rapid quality assessment of Chinese medicine preparation Honghua Oil. J. Pharm. Biomed. Anal. 2008, 46, 498–504. [Google Scholar]
- Wu, D.; Sun, D.-W. Advanced applications of hyperspectral imaging technology for food quality and safety analysis and assessment: A review—Part I: Fundamentals. Innov Food Sci Emerg. 2013, 19, 1–14. [Google Scholar]
- Geladi, P.; Kowalski, B.R. Partial least-squares regression: A tutorial. Anal. Chim. Acta 1986, 185, 1–17. [Google Scholar]
- Wu, D.; He, Y.; Nie, P.C.; Cao, F.; Bao, Y.D. Hybrid variable selection in visible and near-infrared spectral analysis for non-invasive quality determination of grape juice. Anal. Chim. Acta 2010, 659, 229–237. [Google Scholar]
- Li, X.L.; He, Y. Chlorophyll assessment and sensitive wavelength exploration for tea (camellia sinensis) based on reflectance spectral characteristics. Hortscience 2008, 43, 1586–1591. [Google Scholar]
- Liu, F.; Jin, Z.L.; Naeem, M.S.; Tian, T.; Zhang, F.; He, Y.; Fang, H.; Ye, Q.F.; Zhou, W.J. Applying near infrared spectroscopy and Chemometrics to determine total amino acids in herbicide-stressed oilseed rape leave. Food Bioprocess. Technol. 2011, 4, 1314–1321. [Google Scholar]
- Wu, D.; Nie, P.C.; Cuello, J.; He, Y.; Wang, Z.P.; Wu, H.X. Application of visible and near infrared spectroscopy for rapid and non-invasive quantification of common adulterants in Spirulina powder. J. Food Eng. 2011, 102, 278–286. [Google Scholar]
- Ni, Y.N.; Mei, M.H.; Kokot, S. Analysis of complex, processed substances with the use of NIR spectroscopy and chemometrics: Classification and prediction of properties-the potato crisps example. Chemom. Intell. Lab. Syst. 2011, 105, 147–156. [Google Scholar]
- Wu, D.; Sun, D.-W. Application of visible and near infrared hyperspectral imaging for non-invasively measuring distribution of water-holding capacity in salmon flesh. Talanta 2013, 116, 266–276. [Google Scholar]
- Wu, D.; Feng, S.; He, Y. Short-wave near-infrared spectroscopy of milk powder for brand identification and component analysis. J. Dairy Sci. 2008, 91, 939–949. [Google Scholar]


| Data Set | Sample No. | Galangin | Chrysin | ||||
|---|---|---|---|---|---|---|---|
| Range(mg/g) | Mean(mg/g) | S.D. | Range(mg/g) | Mean(mg/g) | S.D. | ||
| Calibration | 76 | 4.2–34.8 | 17.2 | 7.56 | 6.9-37.3 | 20.8 | 9.53 |
| Validation | 38 | 4.2–32.6 | 17.2 | 7.53 | 7.5-34.7 | 20.8 | 9.59 |
S.D.: Standard deviation.
| Quality | Pretreatment | Number of Latent Variables | Calibration | Validation | Prediction | |||
|---|---|---|---|---|---|---|---|---|
| r | RMSEC | r | RMSEV | r | RMSEP | |||
| Galangin | None | 7 | 0.9437 | 2.4835 | 0.9152 | 3.0366 | 0.9394 | 2.5733 |
| MAS | 7 | 0.9427 | 2.5053 | 0.9146 | 3.0440 | 0.9370 | 2.6183 | |
| SG | 7 | 0.9425 | 2.5092 | 0.9142 | 3.0520 | 0.9360 | 2.6366 | |
| Normalize | 10 | 0.9751 | 1.6662 | 0.9155 | 3.0547 | 0.9054 | 3.1586 | |
| SNV | 10 | 0.9721 | 1.7608 | 0.9191 | 2.9810 | 0.9057 | 3.1548 | |
| MSC | 9 | 0.9674 | 1.8995 | 0.9175 | 2.9985 | 0.9071 | 3.1286 | |
| 1-Der | 6 | 0.9559 | 2.2049 | 0.9190 | 2.9638 | 0.9307 | 2.7945 | |
| 2-Der | 2 | 0.9269 | 2.8177 | 0.8408 | 4.0652 | 0.8212 | 4.2476 | |
| De-trending | 9 | 0.9644 | 1.9853 | 0.8936 | 3.3770 | 0.9232 | 2.9015 | |
| Chrysin | None | 11 | 0.9877 | 1.1416 | 0.9549 | 2.8303 | 0.9288 | 3.6754 |
| MAS | 11 | 0.9737 | 1.5342 | 0.9235 | 2.6527 | 0.9282 | 3.7202 | |
| SG | 11 | 0.9789 | 1.9397 | 0.9473 | 3.0715 | 0.9474 | 3.0385 | |
| SNV | 5 | 0.9797 | 1.9001 | 0.9393 | 3.2831 | 0.9456 | 3.1314 | |
| MSC | 10 | 0.9228 | 3.6547 | 0.8918 | 4.2966 | 0.9111 | 3.9628 | |
| 1-Der | 8 | 0.9764 | 2.0466 | 0.9388 | 3.3112 | 0.9398 | 3.2202 | |
| 2-Der | 7 | 0.9793 | 1.9198 | 0.8127 | 5.5377 | 0.7643 | 6.1602 | |
| De-trending | 8 | 0.9722 | 2.2222 | 0.9326 | 3.4352 | 0.9476 | 3.0172 | |
| Quality | Pretreatment | No. | Selected EWs/nm |
|---|---|---|---|
| Galangin | raw | 8 | 973, 932, 997, 714, 447, 992, 1000, 646 |
| MAS | 13 | 456, 929, 487, 598, 543, 887, 434, 839, 694, 998, 1,000, 407, 409 | |
| SG | 14 | 931, 456, 486, 600, 542, 886, 698, 995, 434, 839, 994, 997, 998, 412 | |
| Chrysin | raw | 5 | 999, 406, 400, 421, 463 |
| De-trending | 9 | 681, 572, 424, 962, 929, 970, 545, 938, 400 | |
| SG | 19 | 574, 636, 772, 527, 720,849, 443, 886, 430, 460,976, 543, 968, 494, 986, 997, 998, 424 ,409 | |
| Quality | Model | Pretreatment | LV/EW/(γ, σ2) | Prediction | |
|---|---|---|---|---|---|
| Rp | RMSEP | ||||
| Galangin | SPA-PLS | Raw | 5/8/- | 0.8823 | 3.6368 |
| MAS | 10/13/- | 0.9389 | 2.6105 | ||
| SG | 10/14/- | 0.9387 | 2.5683 | ||
| SPA-LS-SVM | Raw | -/8/(4.62 × 103,0.0042) | 0.4000 | 6.9668 | |
| MAS | -/13/(0.4796,0.0308) | 0.4708 | 7.1444 | ||
| SG | -/14/(0.0858, 4.62 × 10³) | 0.7016 | 7.3476 | ||
| SPA-MLR | Raw | -/8/- | 0.8736 | 3.8170 | |
| MAS | -/13/- | 0.9294 | 2.7915 | ||
| SG | -/14/- | 0.9505 | 2.3154 | ||
| SPA-BP-ANN | Raw | -/8/- | 0.9269 | 3.0468 | |
| MAS | -/13/- | 0.9739 | 1.7263 | ||
| SG | -/14/- | 0.9823 | 1.5239 | ||
| Chrysin | SPA-PLS | Raw | 4/5/- | 0.6686 | 7.0933 |
| De-trending | 7/9/- | 0.8951 | 4.4475 | ||
| S.G | 11/19/- | 0.8743 | 5.1252 | ||
| SPA-LS-SVM | Raw | -/5/(2.66×103,0.0074) | 0.2867 | 9.1218 | |
| De-trending | -/9/(0.0022,5.8750) | 0.8450 | 9.3474 | ||
| S.G | -/19/(0.0667,1.59×103) | 0.6769 | 9.3138 | ||
| SPA-MLR | Raw | -/5/- | 0.6774 | 6.9974 | |
| De-trending | -/9/- | 0.8919 | 4.5041 | ||
| S.G | -/19/- | 0.8900 | 4.7457 | ||
| SPA-BP-ANN | Raw | -/5/- | 0.9355 | 3.3515 | |
| De-trending | -/9/- | 0.9597 | 2.8953 | ||
| S.G | -/19/- | 0.9668 | 2.4841 | ||
© 2013 by the authors; licensee MDPI, Basel, Switzerland. This article is an open access article distributed under the terms and conditions of the Creative Commons Attribution license (http://creativecommons.org/licenses/by/3.0/).
Share and Cite
Nie, P.; Xia, Z.; Sun, D.-W.; He, Y. Application of Visible and Near Infrared Spectroscopy for Rapid Analysis of Chrysin and Galangin in Chinese Propolis. Sensors 2013, 13, 10539-10549. https://doi.org/10.3390/s130810539
Nie P, Xia Z, Sun D-W, He Y. Application of Visible and Near Infrared Spectroscopy for Rapid Analysis of Chrysin and Galangin in Chinese Propolis. Sensors. 2013; 13(8):10539-10549. https://doi.org/10.3390/s130810539
Chicago/Turabian StyleNie, Pengcheng, Zhengyan Xia, Da-Wen Sun, and Yong He. 2013. "Application of Visible and Near Infrared Spectroscopy for Rapid Analysis of Chrysin and Galangin in Chinese Propolis" Sensors 13, no. 8: 10539-10549. https://doi.org/10.3390/s130810539