Development of Anodic Titania Nanotubes for Application in High Sensitivity Amperometric Glucose and Uric Acid Biosensors

Abstract
: The purpose of this study was to develop novel nanoscale biosensors using titania nanotubes (TNTs) made by anodization. Titania nanotubes were produced on pure titanium sheets by anodization at room temperature. In this research, the electrolyte composition ethylene glycol 250 mL/NH4F 1.5 g/DI water 20 mL was found to produce the best titania nanotubes array films for application in amperometric biosensors. The amperometric results exhibit an excellent linearity for uric acid (UA) concentrations in the range between 2 and 14 mg/dL, with 23.3 (μA·cm−2)·(mg/dL)−1 UA sensitivity, and a correlation coefficient of 0.993. The glucose biosensor presented a good linear relationship in the lower glucose concentration range between 50 and 125 mg/dL, and the corresponding sensitivity was approximately 249.6 (μA·cm−2)·(100 mg/dL)−1 glucose, with a correlation coefficient of 0.973.1. Introduction
Since their introduction in 1950, biosensors have undergone continuous development, and become widely used in industrial process control, food industries, environmental monitoring, and various applications in medicine and biotechnology. They are able to detect a small amount of enzyme on test paper. Formal development began in 1962, when Clark and Lyons proposed the “enzyme electrode”, which reacted dissolved oxygen (O2) with glucose, allowing the glucose concentration to be measured by monitoring the consumption of O2 [1]. Updike and Hicks fixed glucose oxidase with polyacylamide gel. The electrode was used to detect the dissolved oxygen to measure the glucose concentration as a first generation biosensor [2]. In 1974, Nanjo and Guilbault fabricated a platinum electrode which was covered with an immobilized uricase as a uric acid biosensor. Using a direct amperometric measurement, they were able to observe the decrease in the dissolved oxygen level by the uricase-catalyzed oxidation of uric acid [3]. In 1988 the Medisense Company used first-generation biosensors as the foundation of their research and development. A successful biosensor was developed using a mediator molecule. The sensitivity and speed of testing increased over time, and the pen type (Pen 2) and the credit card type (Companion) sensors were developed.
Titanium dioxide (TiO2, titania) has attracted great interest since the discovery of its photosensitivity [4], and due to its strong photo-oxidizing potential, high chemical stability, non-toxicity and a wide band gap semiconductor [5], so there are many applications for this transition-metal oxide, including use in pH sensors, gas sensors, biosensors, humidity sensors, radiation sensors, and solar cells [6–10]. In earlier work, we reported on TiO2 film with porosity that can be used to detect pH, sodium ions, potassium ions, and glucose by extended-gate ion-sensitive field effect transistors (EGFETs) and amperometric structures [11,12]. In the last decade, nanostructural materials have attracted increased scientific and technological attention due to their unique properties of high aspect ratio, large current-carrying capacity, good thermal stability, good mechanical strength and their potential applications.
Titania nanotubes (TNTs) have improved properties compared to any other form of titania for application in water and air purification photocatalysis, sensing, water photoelectrolysis for hydrogen generation, photovoltaics, photoelectrochemical solar cells, electronics, optics, tissue engineering and molecular filtration [13–18]. Titanium dioxide nanotubes and nanotube arrays have been produced by a variety of methods, including deposition into a nanoporous alumina template [19–22], sol–gel transcription using organo-gelators as templates [23,24], seeded growth [25], and hydrothermal processes [26–28]. However, of all nanotube fabrication methods, the architecture demonstrating by far the most remarkable properties are highly ordered nanotube arrays made by the anodization of titanium in fluoride-based baths [29–33], the dimensions of which can be precisely controlled. In 1991, Zwilling and co-workers [34] reported the porous surface of titania films electrochemically formed in fluorinated electrolyte by anodization. A decade later, in 2001, the fabrication of titanium dioxide nanotube arrays via anodic oxidation of titanium foil in a fluoride-based solution was first reported by Gong, et al. [14]. Further studies focused on the precise control and extension of the nanotube morphology, length and pore size, and wall thickness. Recently more research efforts have been devoted to the synthesis, characterization and applications of self-organized titanium dioxide nanotube arrays with well-defined and controlled nanostructures by means of acidic anodization of titanium foils [31,35]. The diameters and lengths of the titanium dioxide nanotube are easily tailored by controlling the synthesis parameters of the anodization process. Such ordered titanium dioxide nanotube arrays offer high surface areas, well defined nanostructures, favorable transport pathways, n-type properties, good adhesion to the substrate, and have thus become a popular choice of electrodes for chemical and biosensors, in which the sensitivity is dependent on both surface reaction and charge transfer.
Biosensors have developed rapidly over the last few years. Some clinically important analytes include glucose, uric acid (UA), etc. The analysis of biologically important analytes is the primary basis of disease diagnosis by clinicians. Therefore, the detection capabilities of small, portable biosensors are of particular importance in the medical field, and such measurement systems as the one used in this paper can be miniaturized, made portable, and thereby offer a significant advantage in on-site analysis.
2. Experiment
2.1. Anodization for Preparing TNT Array Films
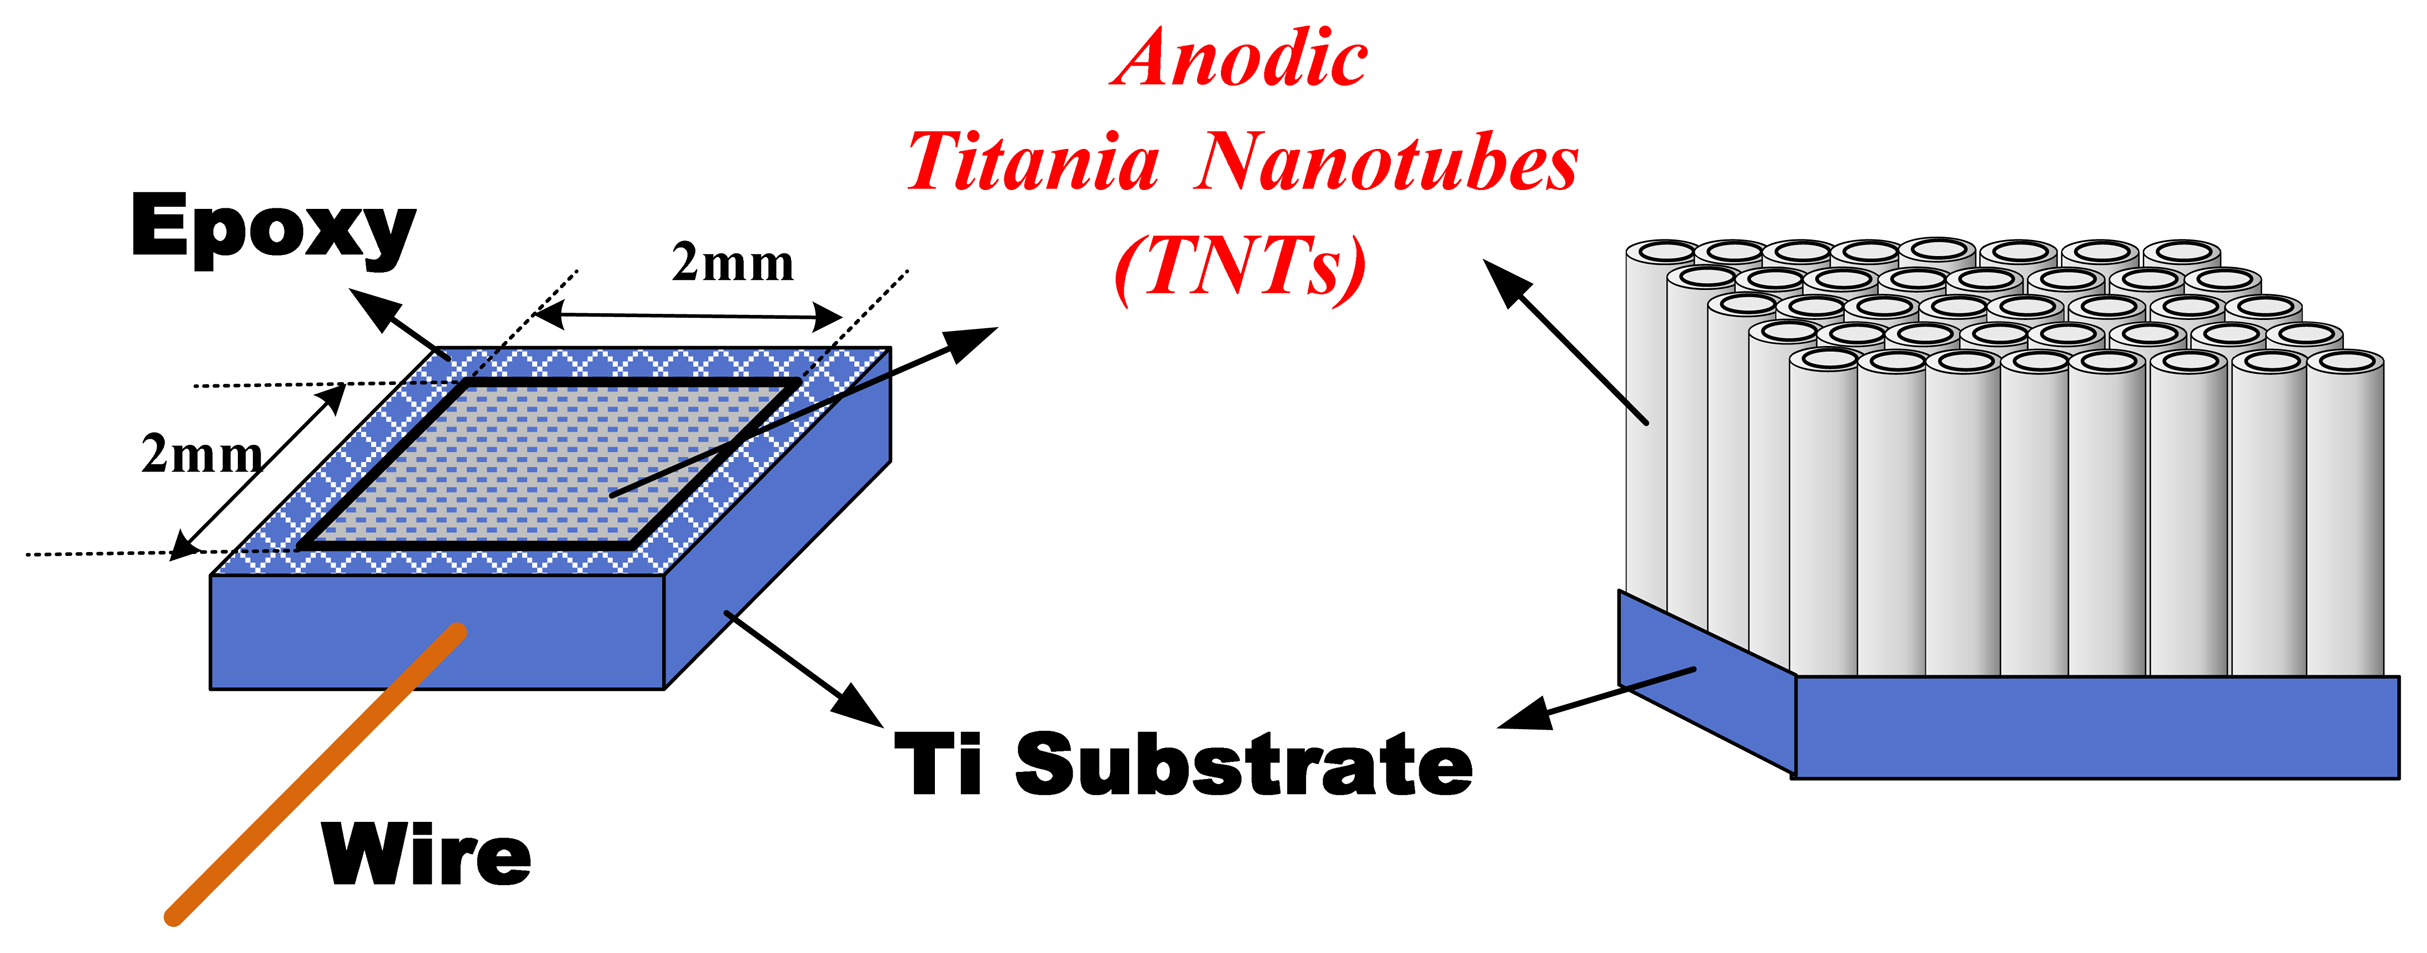
Titania nanotube array films were fabricated from high purity titanium foils (99.99%) by titanium anodization. First, the Ti foil was cleaned to remove the oil and then dried in an oven. Second, the Ti foil was formed by epoxy and connected with conductive wire as an anode-electrode, with a 2 mm × 2 mm electrode area covered by insulating epoxy. Third, the anode-electrode was placed in an electrolyte that consisted of ammonium fluoride, ethylene glycol and high-purity de-ionized water (DI water) [17,18]; only two different ratios of these components were used in this study. The compositions of these two types of electrolyte are shown in Table 1, where electrolyte baths A and B have different H2O contents. Finally, the TNTs array films were fabricated at room temperature using a platinum cathode-electrode and potentiostatic mode at 60 V for 1 h. The TNTs array film electrode structure is illustrated in Figure 1.
The formation of nanotubes in an electrolyte that contains hydrogen ions (H+), oxygen anions (O2−) and fluorine anions (F−) is described by a localized dissolution model [29], with an oxide layer initially formed due to interaction of the surface titanium ions (Ti4+) with oxygen ions in the electrolyte, and via the following reactions [36]:
The pore formation occurs as a result of the localized chemical dissolution of the oxide by F−, according to the following reaction [36]:
This leads to a higher field at the bottom of the pore that drives further oxidation and field assisted dissolution, where titanium ions come out of the metal and dissolve in solution. The metallic region between the pores also undergoes a similar transition, leading to tube formation. For a given rate of pore formation, the chemical dissolution of the oxide at the pore mouth by fluorine anions determines the tube length. Higher anodization voltages increase the oxidation and field-assisted dissolution; hence, a greater nanotube layer thickness can be achieved before equilibrating and then chemical dissolution [15,37].
2.2. Preparation of Uric Acid and Glucose Biosensors on TNT Array Films
Glucose and uric acid biosensors were manufactured using glucose oxidase (GOD) and urate oxidase (uricase), and covering the TNTs array films with ferrocenecarboxylic acid with PVA-SbQ, using the entrapment method. Polyvinylalcohol-bearing styrylpyridinium groups (PVA-SbQ: degree of polymerization 3500, degree of saponification 88, betaine SbQ 1.05 mol%, solid content 10.22 mol%, pH 5.7 and SPP-H-13) were obtained from Toyo Gosei Kogyo (Chuo-Ku, Tokyo, Japan). GOD and uricase were both purchased from Sigma. All reagents were of analytical grade. Glucose and uric acid biosensors were prepared as follows [11]:
Step 1. First, glucose oxidase (9 mg) or urate oxidase (10 mg) and luxuriant irons (ferrocenecarboxylic acid) were placed in a phosphate buffer liquid solution (phosphate-KOH buffer solution, PBS, 100 μL). The concentration of the phosphate buffer liquid solution was 5 mM and its pH was 7.0.
Step 2. PVA-SbQ (100 mg) was placed in a phosphate buffer liquid (100 μL). They were mixed in a 1:1 proportion.
Step 3. Oxidized enzyme liquid (1 μL) and PVA-SbQ buffer mixture was dropped onto the TNTs sensing window. The whole was then exposed to an ultraviolet lamp for 20 min, and then stored under dry conditions for about 24 h at 4 °C.
Step 4. The above sample was soaked for 60 min in DI water, and then soaked in the Phosphate-KOH Buffer Solution (PBS, 5 mM, pH 7.0) for about 1 h before use.
2.3. The Cyclic Voltammetry Measurement System
Uric acid and glucose measurement responses were based on the electrochemical oxidation of H2O2. The oxygen atoms serve as the electron transduction mediators, which catalyze the production of H2O2 as byproducts of UA and glucose. The hydrogen peroxide is electrochemically oxidized at the sensing electrode. Therefore, the UA and glucose concentration can be determined by measuring the current in the sensing electrode. However, oxygen is extremely active, and the oxidation or reduction over-potential of H2O2 on an electrode surface is large, and electronically active components are generated that interfere with the reaction. Therefore, a small electron transduction mediator molecule, ferrocene, must be added to the enzymatic electrode to catalyze the reduction of H2O2, and to reduce the reduction over-potential of H2O2 on the electrode surface [38]. The oxidases catalyze the oxidation of substrates according to the follow reactions [39]:
The cyclic voltammetry (CV) method is a type of oxidation-reduction reaction measurement. The system includes a biosensor as a working electrode, and a reference electrode (RE) using Ag/AgCl forming a two-electrode setup. The potential was cycled between −3 V and 3 V at a scan rate of 120 mV/s.
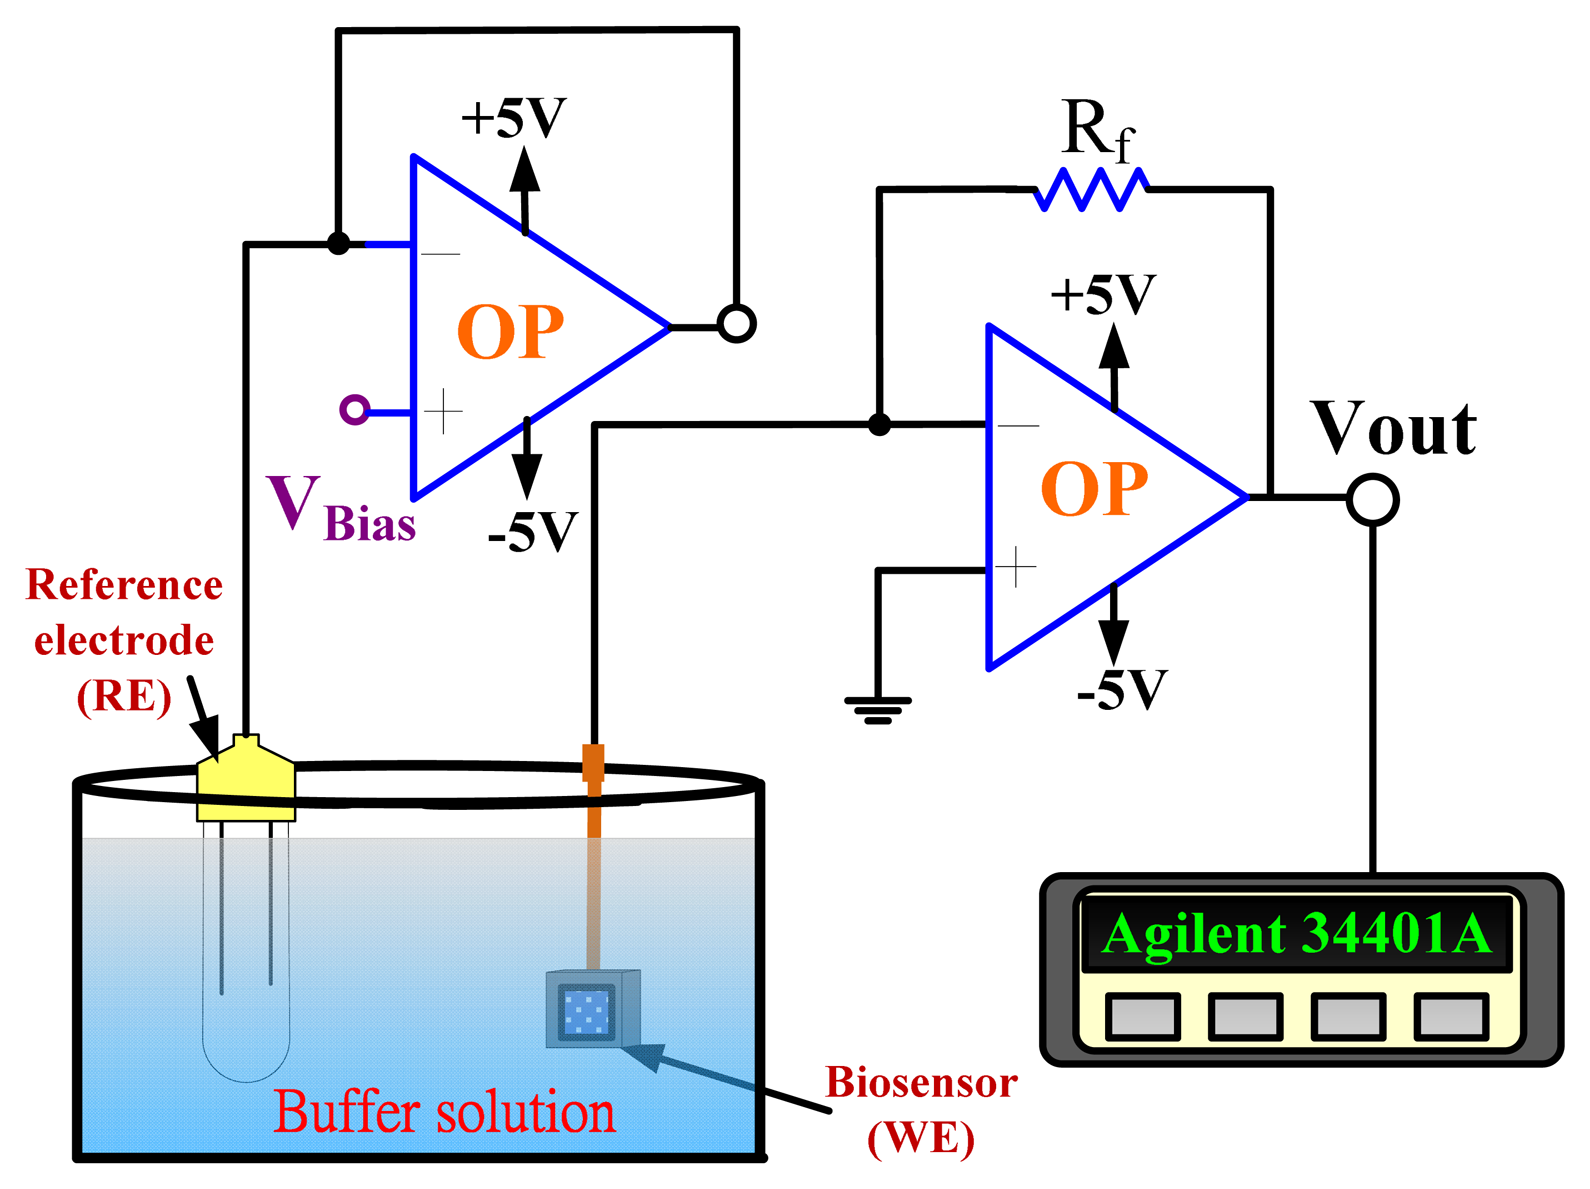
2.4. The Amperometry Measurement System
An amperometric readout circuit (Figure 2) including two operational amplifiers and a 10 kΩ resistor (Rf) was used for biosensor measurement.
The amperometric measurement system used biosensors as the working electrode, and the Ag/AgCl reference electrode (RE) which delivered the base potential for the working electrode. The output current density was:
3. Results and Discussion
3.1. TNT Array Films
3.1.1. Titanium Anodization
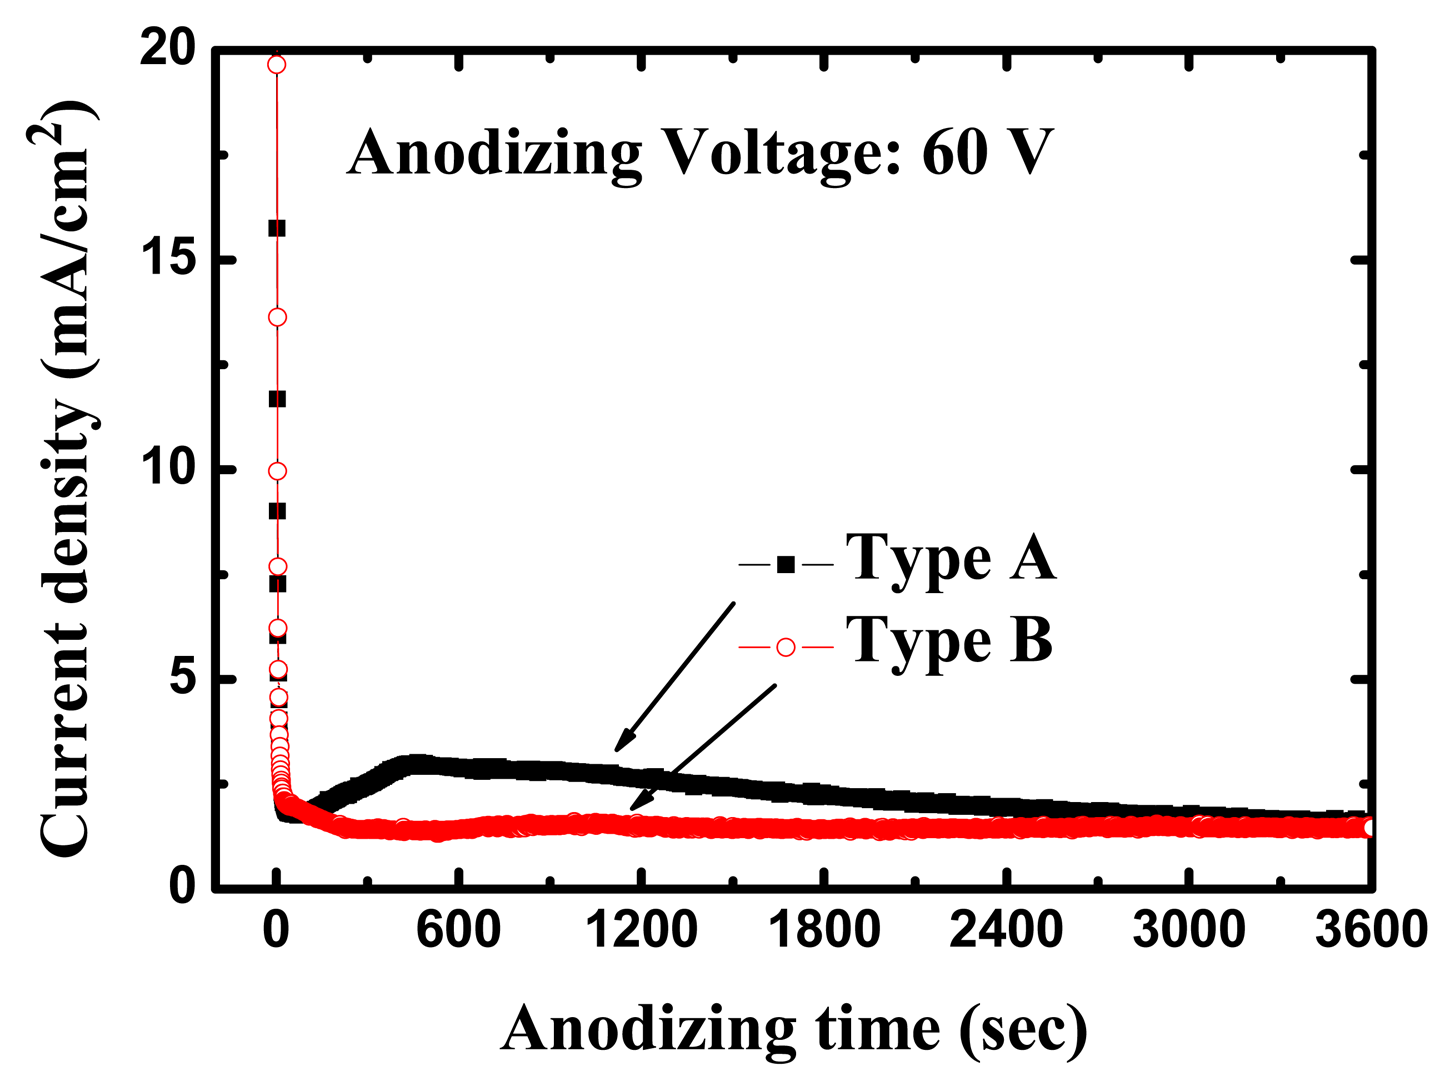
The high-purity (99.99%) titanium foils used in this work were obtained from Alfa Aesar (Ward Hill, MA, USA). All anodization experiments were conducted at room temperature (24 °C). The anodizing voltages were kept at 60 V for 1 h with a platinum counter-electrode during the entire process. Figure 3 shows the variation of current density during the anodization process for different electrolytes. Within 1 min after application of the anodizing voltage, the measured current density was reduced from >30 mA/cm2 to a local-minimum of 1.77 mA/cm2; about 400 sec later, it reached a maximum of approximately 3 mA/cm2, after which the current density gradually decreased to 1.55 mA/cm2 for the type A electrolyte with 20 g less water. In the first 60 s of the anodization the current density was observed to drop drastically to 1.96 mA/cm2, and afterwards remained stable at around 1.4 mA/cm2 for the type B electrolyte with 50 g more water. With reference to the anodization behavior, the current density curve for the type A electrolyte was more active than that of the type B electrolyte in our experiment.
3.1.2. Surface Analysis
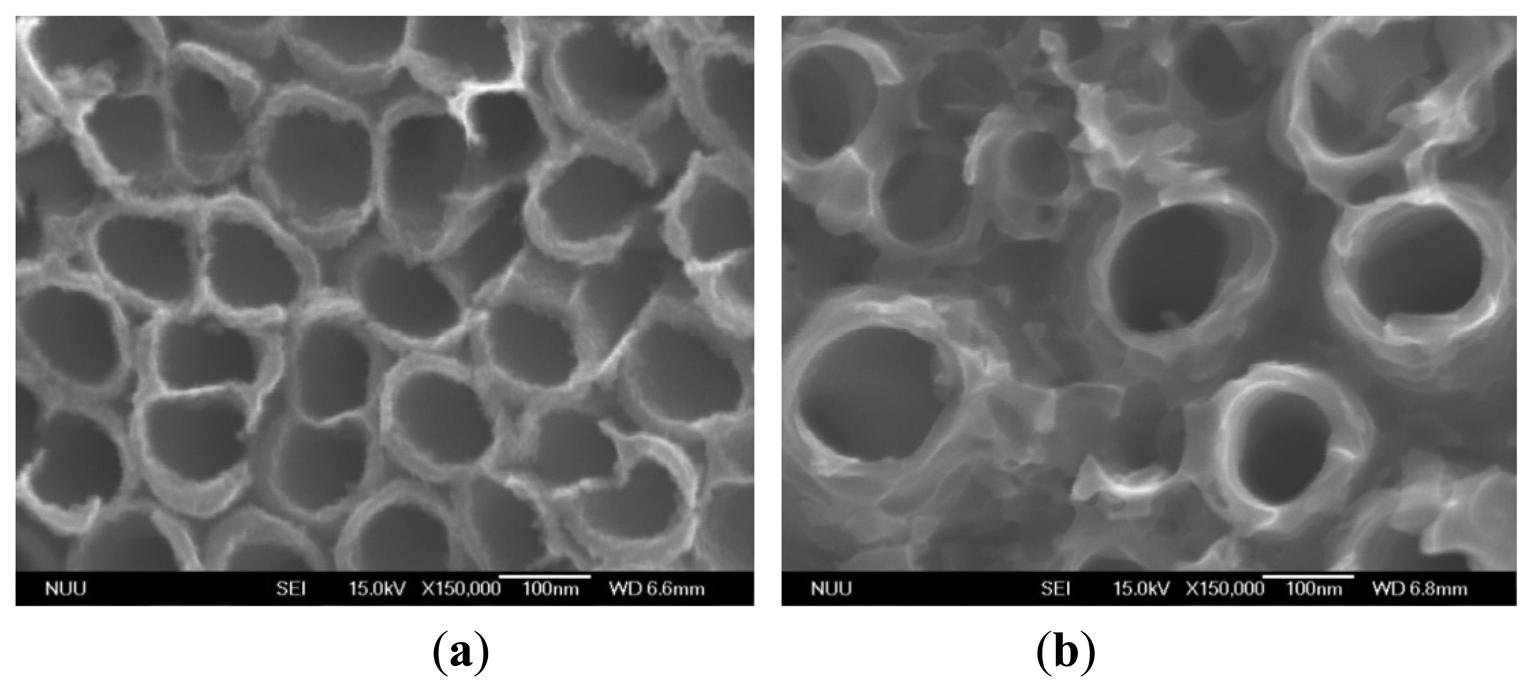
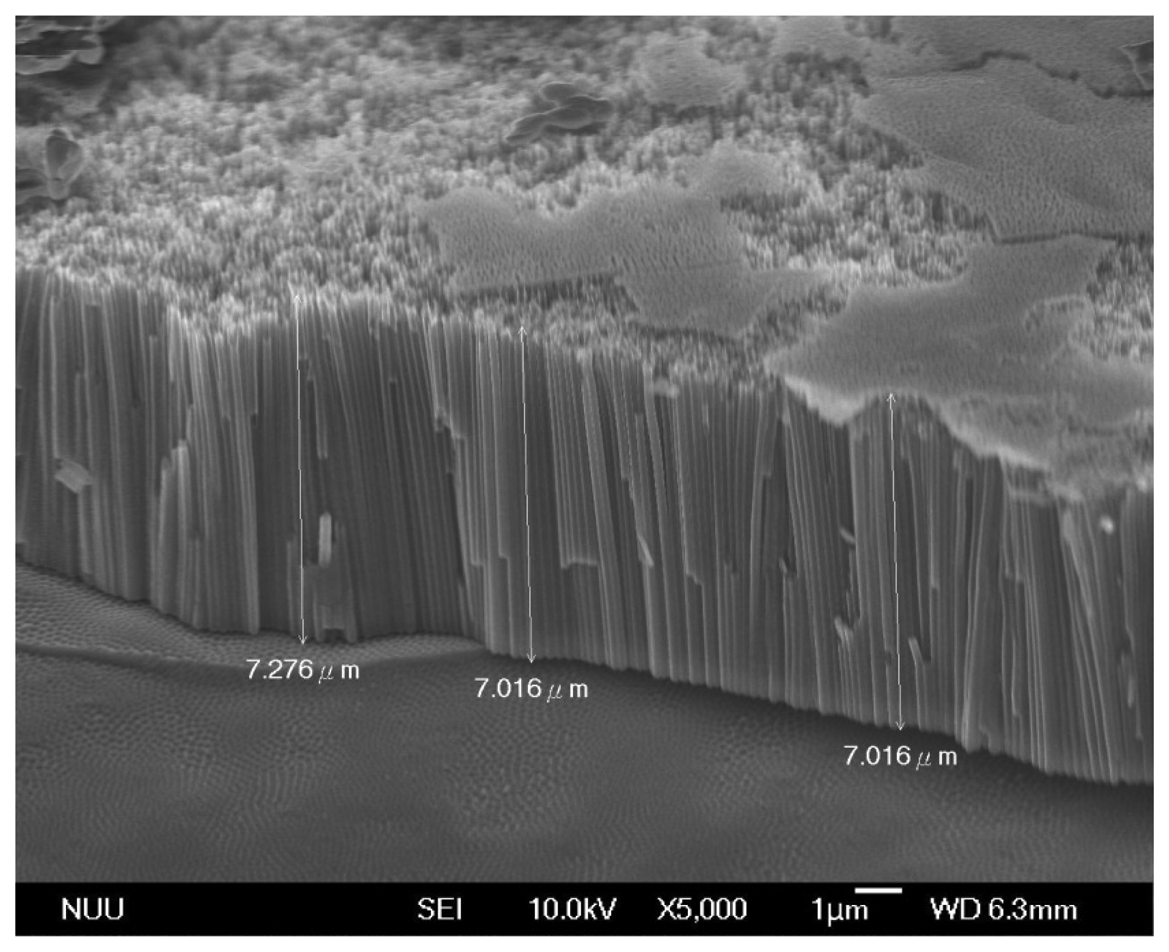
The composition of the electrolyte used is a critical factor for nanostructures during anodization. In this work, two types of TNTs array films were obtained by different electrolytes, and the corresponding NH4F concentration of electrolyte type A is 0.05 wt% greater than that of type B. Figure 4 shows the field emission scanning electron microscope (FE-SEM) analysis for the type A TNTs array films (Figure 4a), and the type B TNTs array films (Figure 4b). The tube inner diameters averaged 101 nm and 117 nm, respectively, the ultrathin tube walls were about 20 nm and 30 nm thick for type A and type B TNTs array films, respectively. The tube lengths were approximately 7 μm as shown in Figure 5. According to the FE-SEMs, the architecture demonstrated that the quality of type A TNTs array films was uniformly high. In addition, the surface areas of type A TNTs array films were greater than those of type B. Therefore, we fabricated glucose and uric acid biosensors based only on the type A TNTs array films.
3.2. Uric Acid Biosensors with TNT Films
3.2.1. Cyclic Voltammetry Analysis
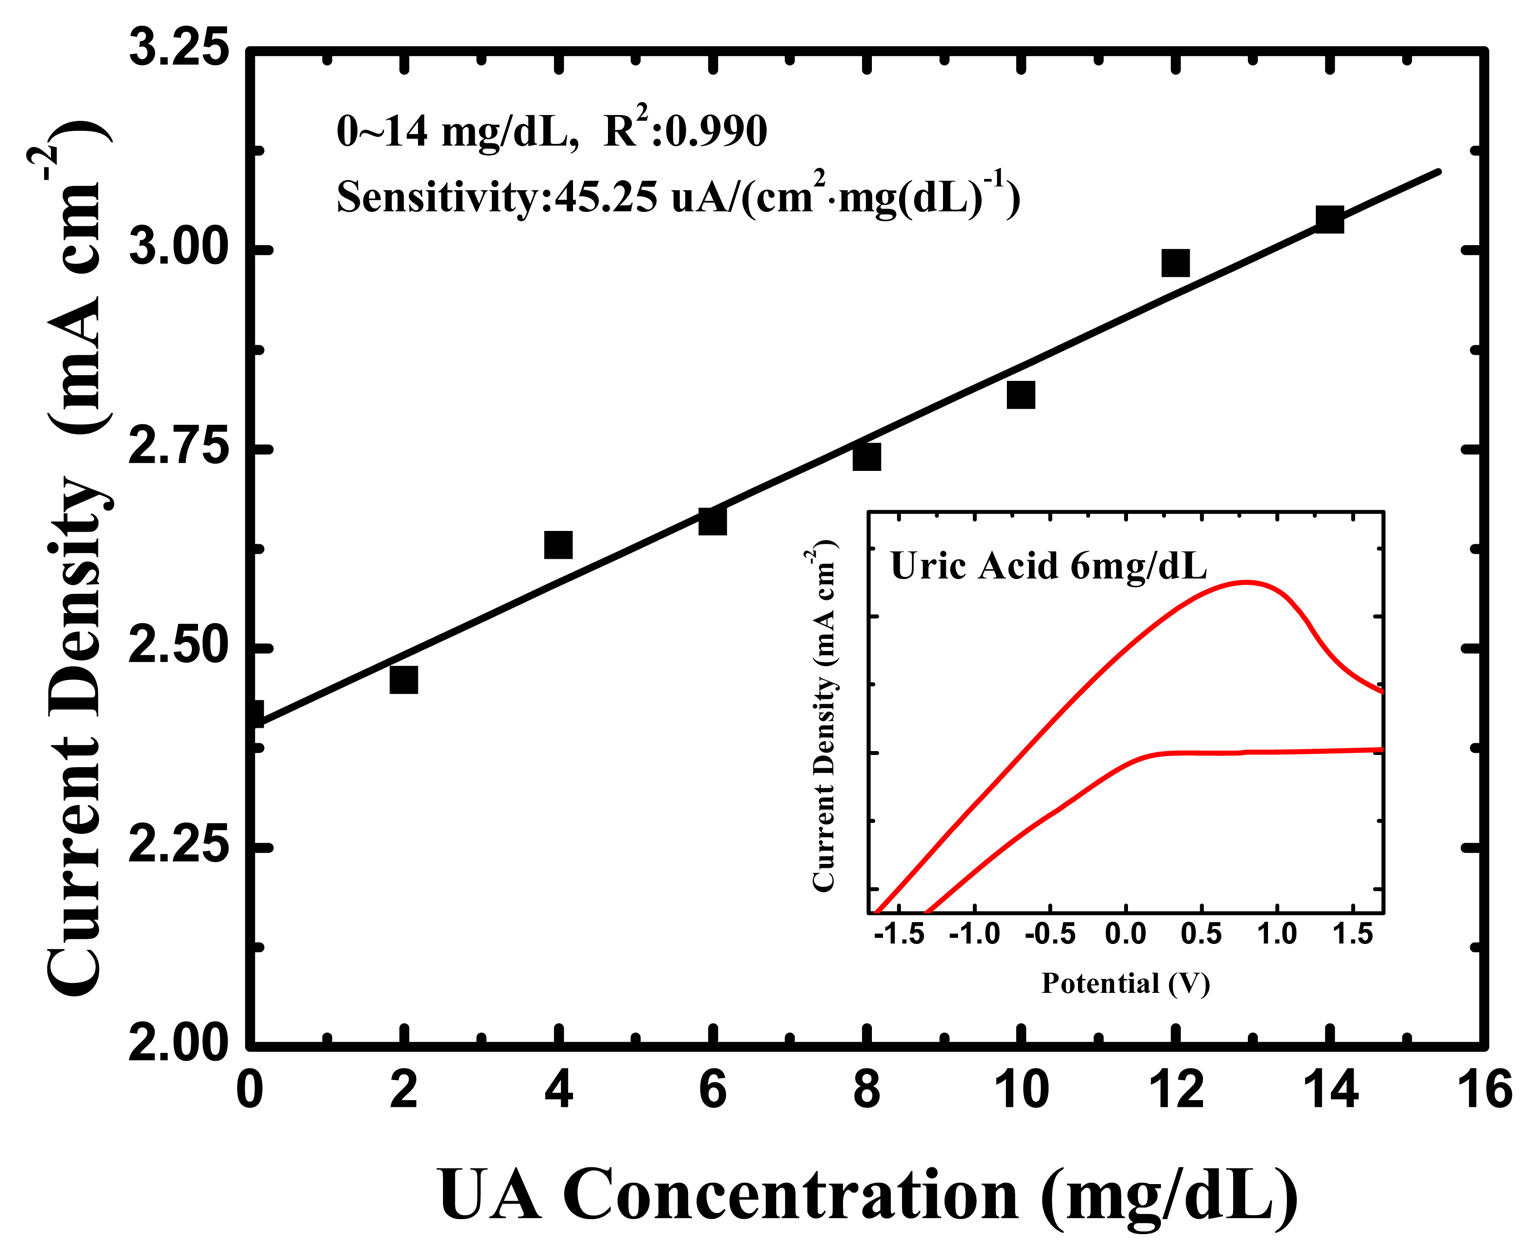
The cyclic voltammetry measurement of uric acid cycled through the range of −3 V and 3 V potential at a scan rate of 120 mV/s. The inset of Figure 6 indicates that a sensitive anodic peak current occurred in the potential range between 0.8 V and 1 V at a UA concentration of 6 mg/dL. It can be inferred that TNTs are an efficient electron conducting tunnel facilitating electron transfer, and electrochemical oxidation was promoted. Figure 6 displays a typical plot of the anodic peak current versus UA concentration for a uric acid biosensor. The response peak current densities of the UA biosensor had a 45.25 (μA·cm2)·(mg/dL)−1 sensitivity, and a correlation coefficient of 0.990, between UA concentrations of 0 and 14 mg/dL.
3.2.2. The Amperometry Measurement Systems
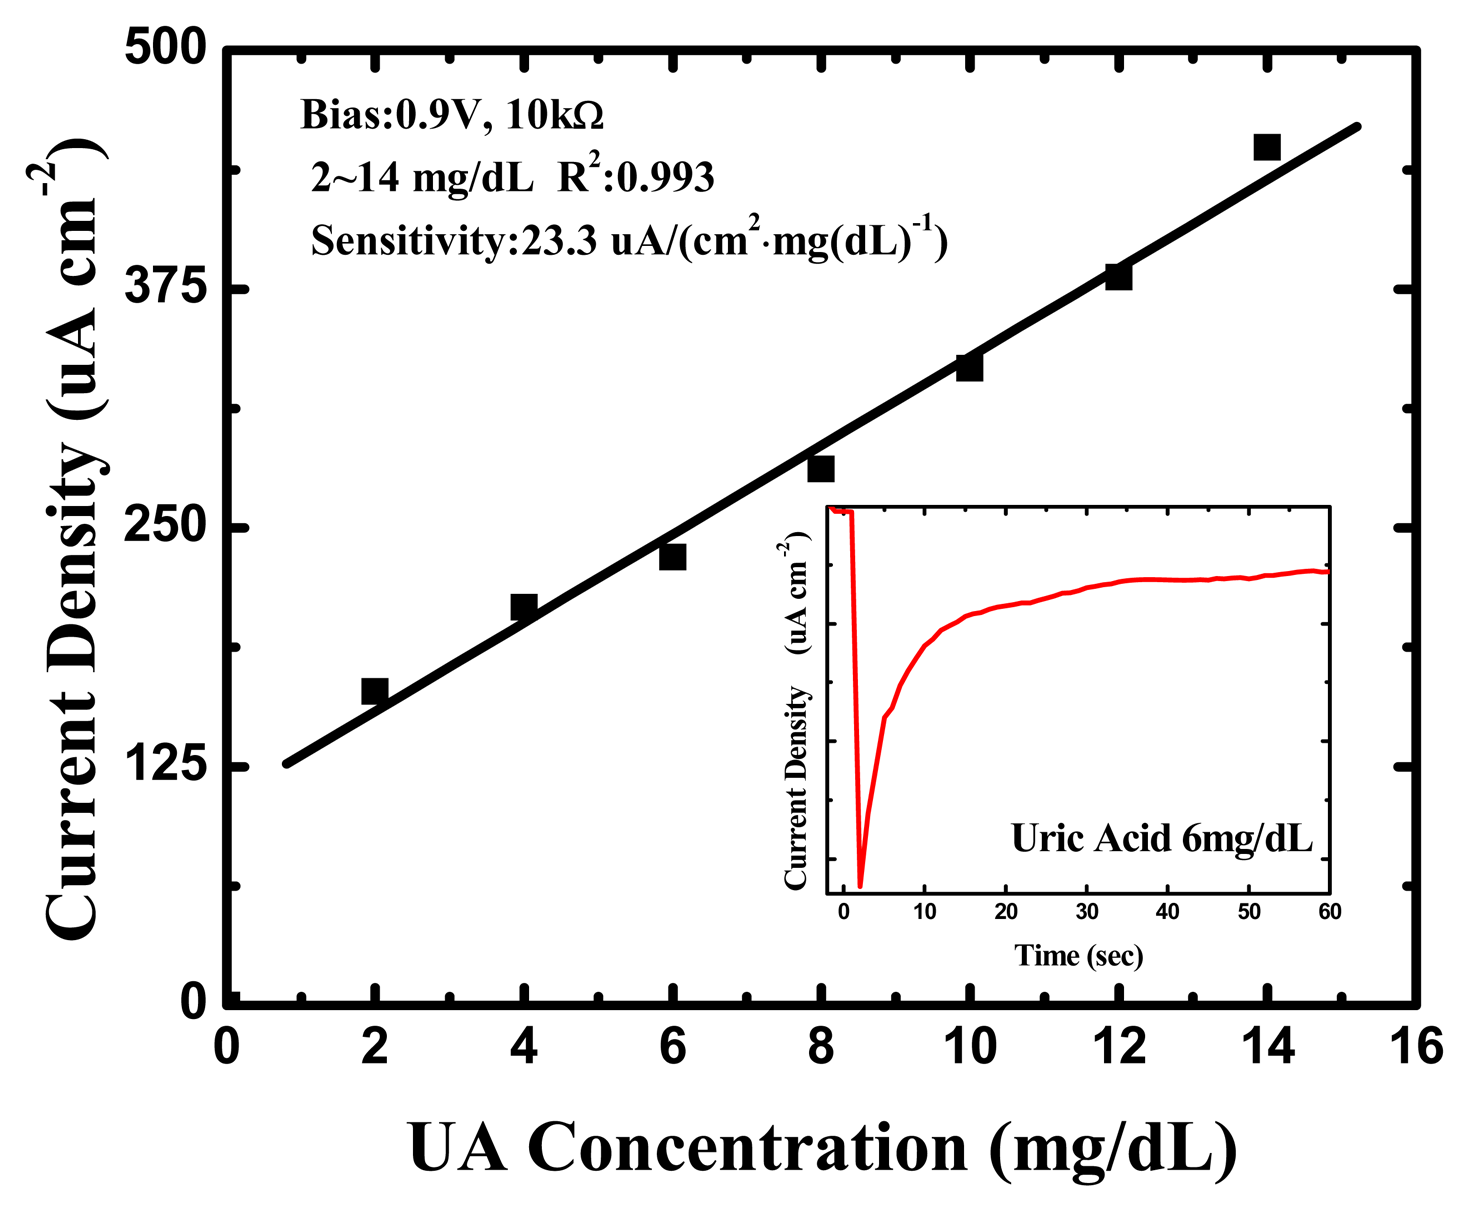
The amperometric readout circuit shown in Figure 2 was used as the amperometry measurement system for each UA concentration (0, 2, 4, 6, 8, 10, 12 and 14 mg/dL) and the bias was set at 0.9 V. One of the original response curves by amperometric readout circuit at a UA concentration of 6 mg/dL is shown in the inset of Figure 7.
The response was very rapid, and an available current signal was generated within a few seconds in every UA concentration. Furthermore, they exhibited splendid linearity for UA concentrations between 2 and 14 mg/dL, and the sensitivity was approximately 23.3 (μA·cm−2)·(mg/dL)−1 UA, with a correlation coefficient of 0.993, as shown in Figure 7. This is higher than the UA biosensors based on other nanomaterials [40–44] and the biomimetic titanate nanotubes by hydrothermal decomposition [45], the corresponding detailed comparisons are shown in Table 2.
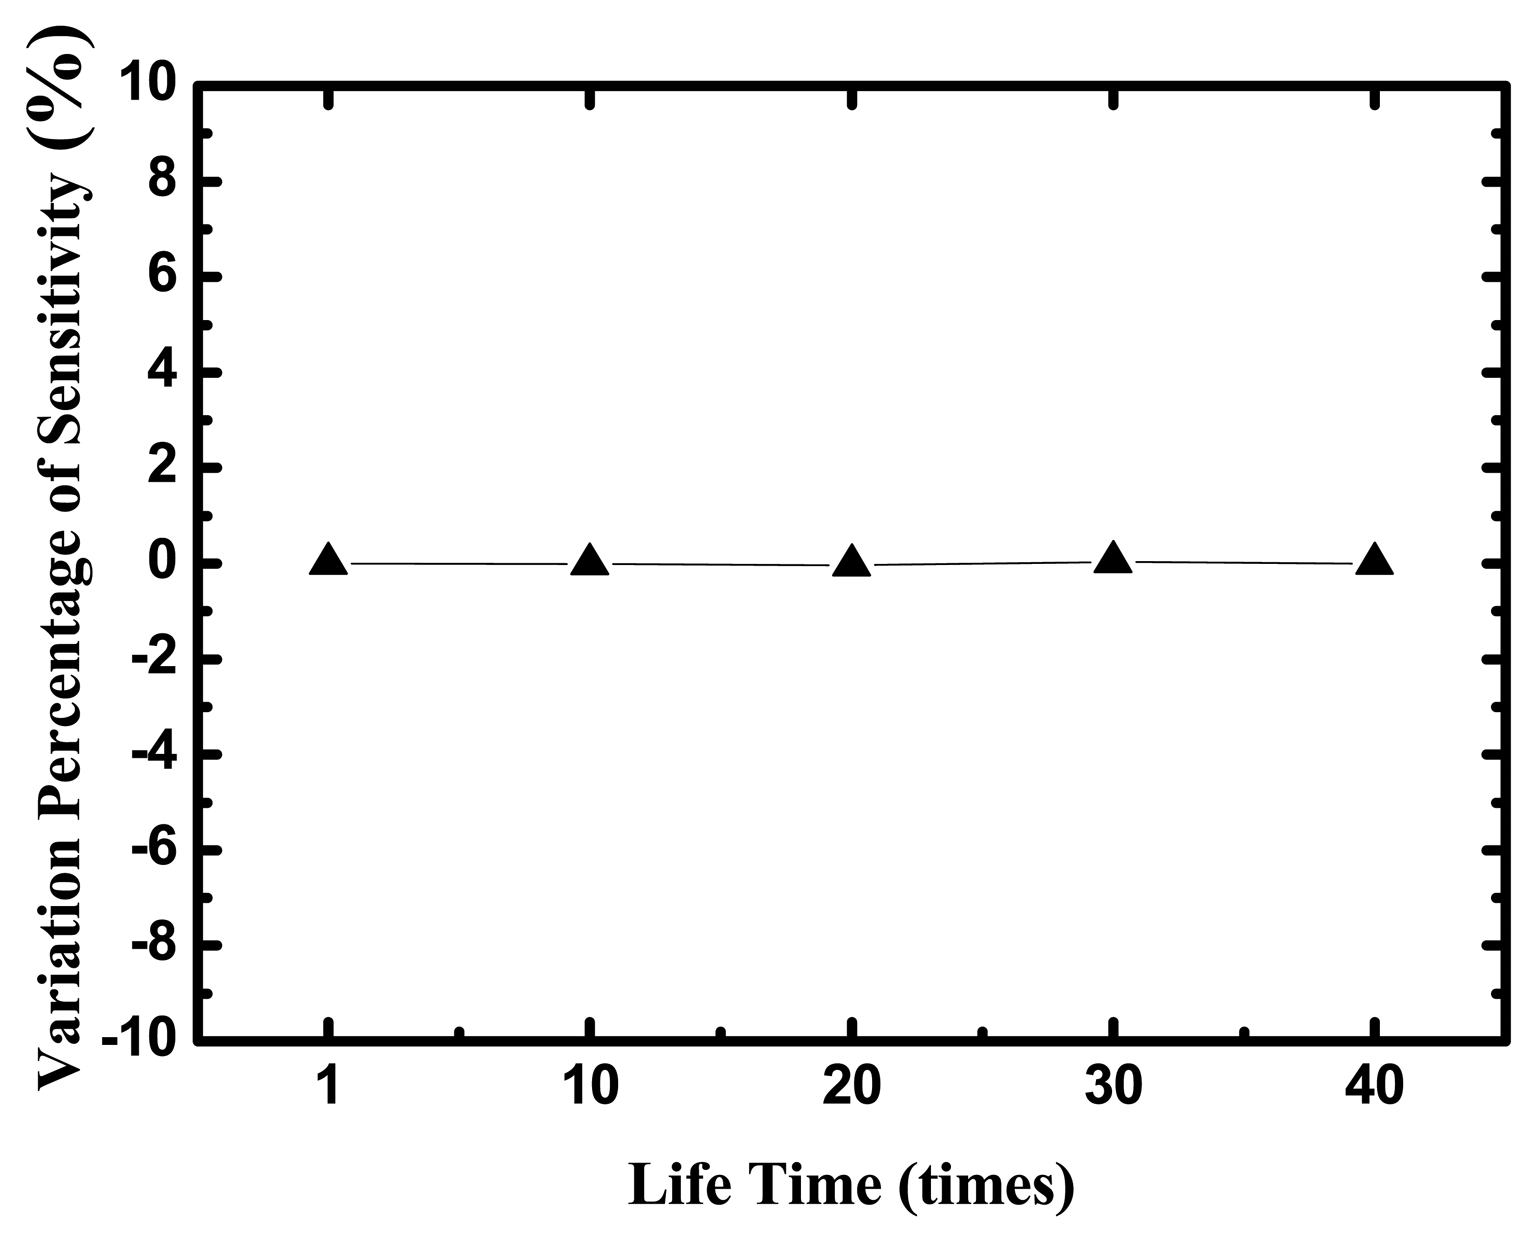
The life time of the uric acid biosensor is investigated in Figure 8, where y-axis is the variation percentage of sensitivities and x-axis is the times of measurements during five days and eight tests every day.
The uric acid biosensors were stored under dry conditions at 4 °C in a refrigerator when they were not in use. After 40-times measurements in different UA concentrations, the variation percentage of sensitivities is small 5%.
3.3. Glucose Biosensors with TNT Films
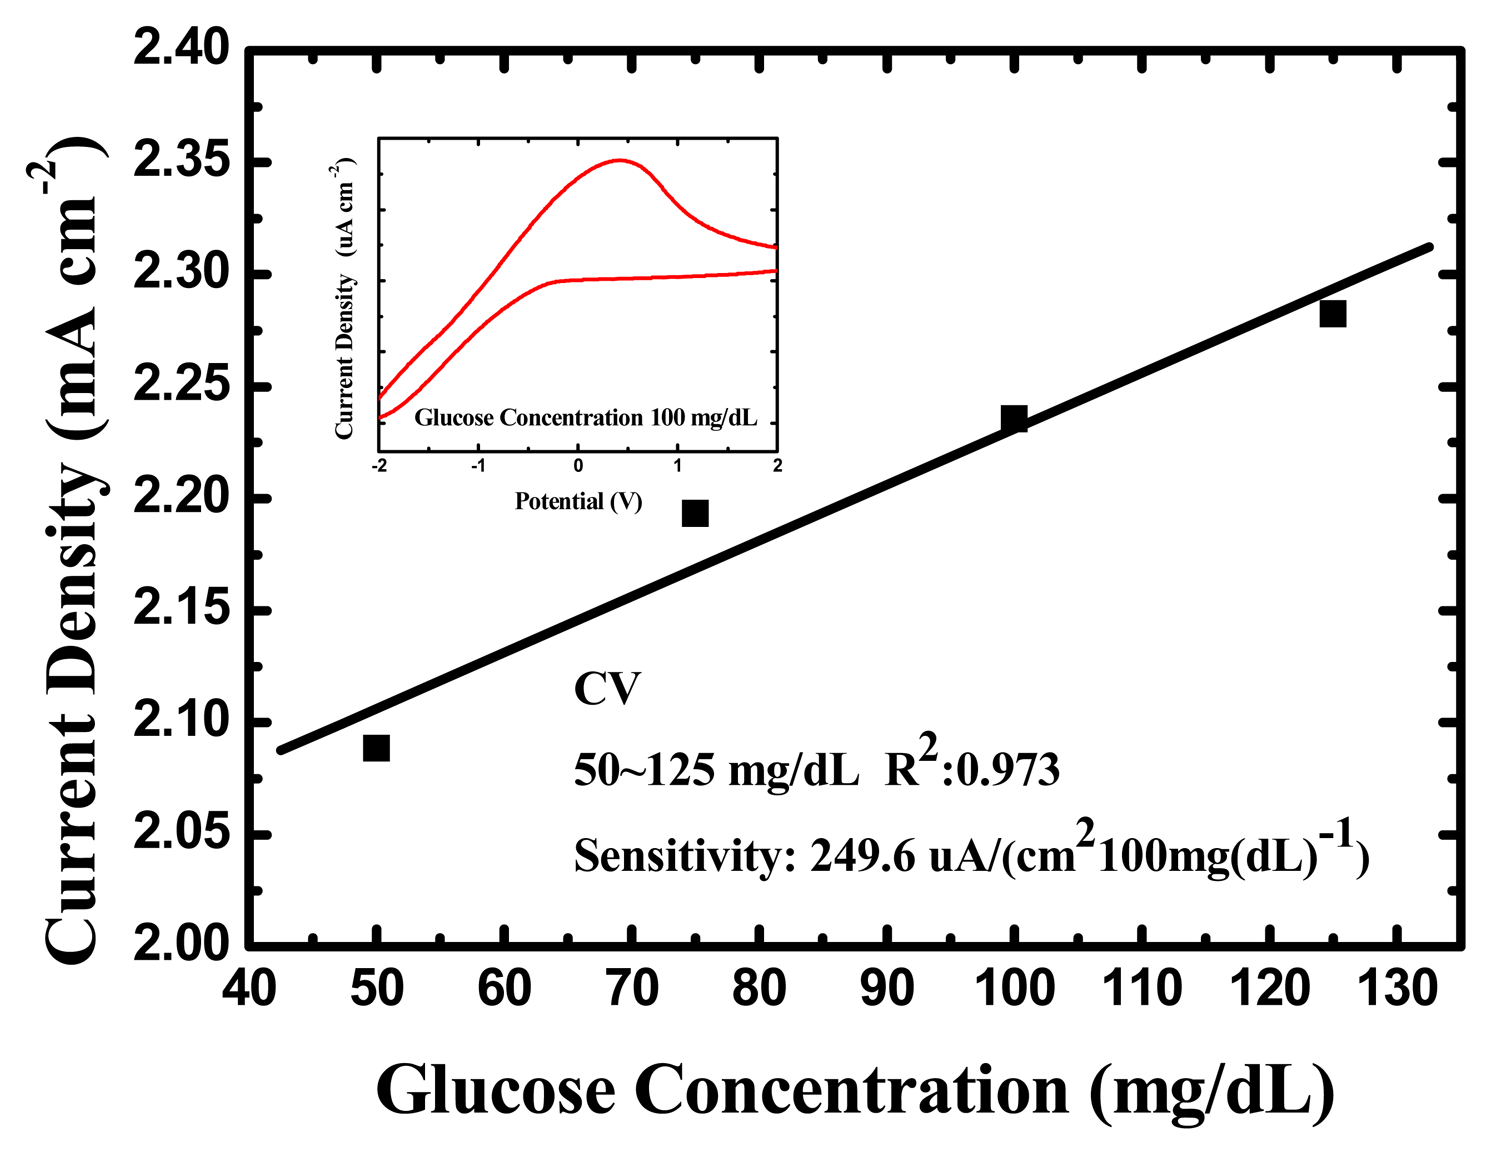
The glucose biosensor assayed with the cyclic voltammetry measurement as Section 3.2.1 presented a good linear relationship between current density and glucose concentration in the lower glucose concentration range between 50 and 125 mg/dL, and the corresponding sensitivity was approximately 249.6 (μA·cm−2)·(100 mg/dL)−1 glucose with a correlation coefficient of 0.973. The calibration curve of the glucose biosensor is plotted in Figure 9. The sensitivity demonstrates better than other literatures that based on nanostructured metal-oxides [46–49] except ZnO nanowire reported by Basu et al. and MWNTs/CuO nanoparticle reported by Jiang et al. [50]. Nanostructured metal-oxides have been extensively studied to develop biosensors with high sensitivity and fast response time for glucose by electrochemical oxidation. The results of our glucose biosensors manufactured on TNTs indeed prove the characteristics of nanomaterials.
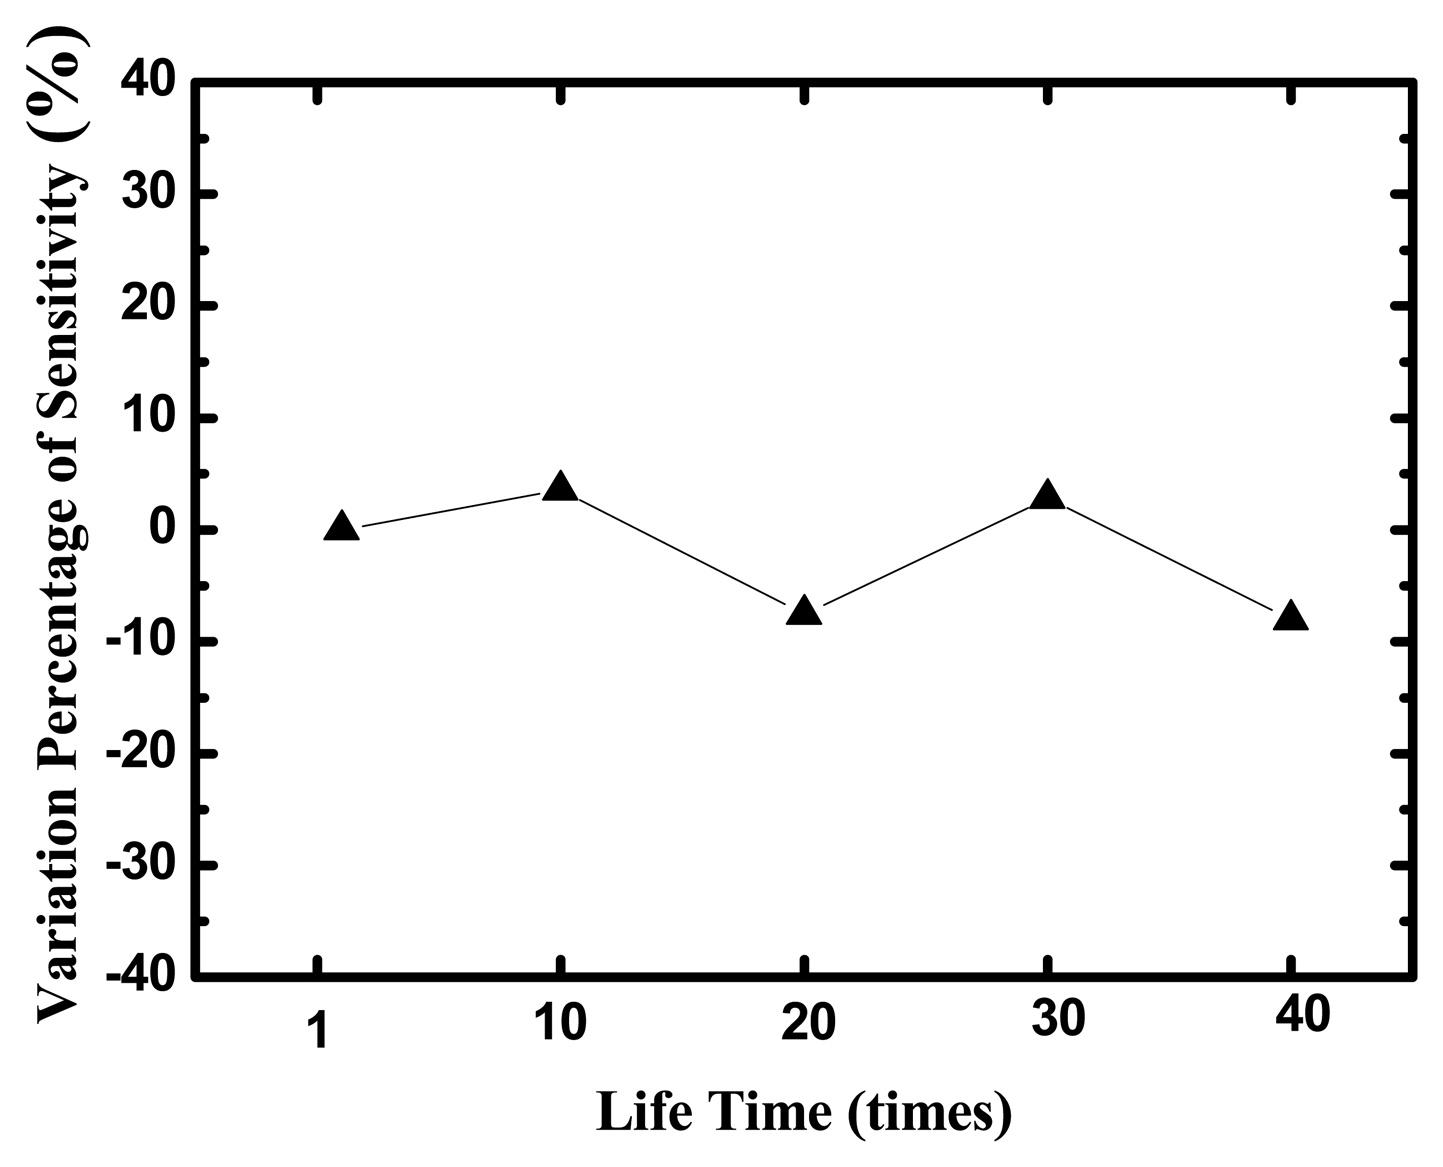
The life-time test of the glucose biosensor with TNTs films made by anodization is displayed in Figure 10. The sensors were measured during five days and eight tests were performed every day. After 40 measurements at different glucose concentrations, the variation percentage of sensitivities is small 10%.
4. Conclusions
In this study, we developed a novel nanoscale biosensor using titanium oxide nanotubes made by anodization. The anodization treatment created large surface areas on the tubes' inner and outer sidewalls, which were involved in redox reactions and formed a microenvironment favorable for enhancing the direct electron transfer between the enzymatic active sites and the electrode. Otherwise, some metal-oxide nanomaterials have high isoelectric point (IEP) and a good surface for oxidase immobilization. Therefore, much attention to these electrode materials will be paid. Since titanium oxide has high IEP (3.9–8.2) dependent on the manufacture method and is environmentally-friendly [50], we have frequently proposed it as a prospective interface for the immobilization of biomolecules. In this study, biosensors with TNTs for uric acid had an excellent linearity for UA concentrations by amperometry in the range between 2 and 14 mg/dL, with 23.3 (μA·cm−2)·(mg/dL)−1 UA sensitivity, namely 450 (μA·cm−2)·(mM)−1 UA, and a correlation coefficient of 0.993. On the other hand, the biosensors for glucose also had good linearity between 50 and 125 mg/dL glucose, and high sensitivity, 249.6 (μA·cm−2)·(mg/dL)−1 glucose, with a correlation coefficient of 0.973 by amperometry. Furthermore, it is easy to fabricate the TNTs for any kind of flexible and bendable material, even at room temperature.
Acknowledgments
The authors would like to thank the National Science Council of the Republic of China, Taiwan, for financially supporting this research under Contract No. NSC 100-2221-E-211-003-. They also thank Shukai Lee, Rongwei Chang, Yulung Lu, and Yupei Huang of Huafan University for their technical assistance.
Conflicts of Interest
The authors declare no conflicts of interest.
References
- Clark, L.C., Jr.; Lyons, C. Electrode systems for continuous monitoring in cardiovascular surgery. Ann. N. Y. Acad. Sci 1962, 102, 29–45. [Google Scholar]
- Updike, S.J.; Hicks, G.P. The enzyme electrode. Nature 1967, 214, 986–988. [Google Scholar]
- Nanjo, M.; Guilbault, G.G. Enzyme electrode sensing oxygen for uric acid in serum and urine. Anal. Chem. 1974, 46, 1769–1772. [Google Scholar]
- Fujishima, A.; Honda, K. Electrochemical photolysis of water at a semiconductor electrode. Nature 1972, 238, 37–38. [Google Scholar]
- Cao, G. Nanostructures and Nanomaterials: Synthesis, Properties and Applications; Imperial College Press: London, UK, 2004; pp. 15–16. [Google Scholar]
- Macak, J.M.; Zlamal, M.; Krysa, J.; Schmuki, P. Self-organized TiO2 nanotube layers as highly efficient photocatalysts. Small 2007, 3, 300–304. [Google Scholar]
- Yin, Y.; Jin, Z.; Hou, F.; Wang, X. Synthesis and morphology of TiO2 nanotube arrays by anodic oxidation using modified glycerol-based electrolytes. J. Am. Ceram. Soc. 2007, 90, 2384–2389. [Google Scholar]
- Zhu, K.; Neale, N.R.; Miedaner, A.; Frank, A.J. Enhanced charge-collection efficiencies and light scattering in dye-sensitized solar cells using oriented TiO2 nanotubes arrays. Nano Lett. 2007, 7, 69–74. [Google Scholar]
- Paulose, M.; Varghese, O.K.; Mor, G.K.; Grimes, C.A.; Ong, K.G. Unprecedented ultra-high hydrogen gas sensitivity in undoped titania nanotubes. Nanotechnology 2006, 17, 398–402. [Google Scholar]
- Oh, S.H.; Finones, R.R.; Daraio, C.; Chen, L.H.; Jin, S. Growth of nano-scale—Hydroxyapatite using chemically treated titanium oxide nanotubes. Biomaterials 2005, 26, 4938–4943. [Google Scholar]
- Lee, H.C.; Lin, J.L.; Chin, Y.L.; Sun, T.P. Comparison of carbon and platinum performance as TiO2 membrane substrate material and applied to glucose biosensor using amperometric readout circuit. Sens. Lett. 2008, 6, 1001–1004. [Google Scholar]
- Lee, H.C.; Hsu, H.Y.; Wu, C.Y.; Lin, J.L.; Chin, Y.L.; Sun, T.P. Linear arrays of ion-selective sensors based on titanium oxide membrane for multi-component analysis. Sens. Lett. 2011, 9, 41–45. [Google Scholar]
- Mohamed, A.E.R.; Rohani, S. Synthesis of titania nanotube arrays by anodization. AIDIC Conf. Ser. 2009, 9, 121–129. [Google Scholar]
- Gong, D.; Grimes, C.A.; Varghese, O.K.; Hu, W.; Singh, R.S.; Chen, Z.; Dickey, E.C. Titanium oxide nanotube arrays prepared by anodic oxidation. J. Mater. Res. 2001, 16, 3331–3334. [Google Scholar]
- Mor, G.K.; Varghese, O.K.; Paulose, M.; Shankar, K.; Grimes, C.A. A review on highly ordered, vertically oriented TiO2 nanotube arrays: Fabrication material properties, and solar energy applications. Sol. Energy Mater. Sol. Cell. 2006, 90, 2011–2075. [Google Scholar]
- Zhang, Y.; Xiao, P.; Zhou, X.; Liu, D. Betzaida batalla garcia and guozhong cao carbon monoxide annealed TiO2 nanotube array electrodes for efficient biosensor applications. J. Mater. Chem. 2009, 19, 948–953. [Google Scholar]
- Shankar, K.; Mor, G.K.; Prakasam, H.E.; Yoriya, S.; Paulose, M.; Varghese, O.K.; Grimes, C.A. Highly-ordered TiO2 nanotube arrays up to 220 mm in length: Use in water photoelectrolysis and dye-sensitized solar cells. Nanotechnology 2007, 18, 1–11. [Google Scholar]
- Chen, C.H.; Chen, K.C.; He, J.L. Transparent conducting oxide glass grown with TiO2-nanotube array for dye-sensitized solar cell. Curr. Appl. Phys. 2010, 10, 176–179. [Google Scholar]
- Hoyer, P. Formation of a titanium dioxide nanotube array. Langmuir 1996, 12, 1411–1413. [Google Scholar]
- Lakshmi, B.B.; Dorhout, P.K.; Martin, C.R. Sol–gel template synthesis of semiconductor nanostructures. Chem. Mater. 1997, 9, 857–862. [Google Scholar]
- Imai, H.; Takei, Y.; Shimizu, K.; Matsuda, M.; Hirashima, H. Direct preparation of anatase TiO2 nanotubes in porous alumina membranes. J. Mater. Chem. 1999, 9, 2971–2972. [Google Scholar]
- Michailowski, A.; AlMawlwai, D.; Cheng, G.S.; Moskovits, M. Highly regular anatase nanotubule arrays fabricated in porous anodic templates. Chem. Phys. Lett. 2001, 349, 1–5. [Google Scholar]
- Jung, J.H.; Kobayashi, H.; Bommel, K.J.C.; Shinkai, S.; Moskovits, M. Creation of novel helical ribbon and double-layered nanotube TiO2 structures using an organogel templates. Chem. Mater. 2002, 14, 1445–1447. [Google Scholar]
- Kobayashi, S.; Hamasaki, N.; Suzuki, M.; Kimura, M.; Shirai, H.; Hanabusa, K. Preparation of helical transition-metal oxide tubes using organogelators as structure-directing agents. Am. Chem. Soc. 2002, 124, 6550–6551. [Google Scholar]
- Tian, Z.R.; Voigt, J.A.; Liu, J.; McKenzie, B.; Xu, H.F. Large oriented arrays and continuous films of TiO2-based nanotubes. J. Am. Chem. Soc. 2003, 125, 12384–12385. [Google Scholar]
- Kasuga, T.; Hiramatsu, M.; Hoson, A.; Sekino, T.; Niihara, K. Formation of titanium oxide nanotube. Langmuir 1998, 14, 3160–3163. [Google Scholar]
- Chen, Q.; Zhou, W.Z.; Du, G.H.; Peng, L.H. Layer-by-layer grafting of molecularly imprinted polymers via iniferter modified supports. Adv. Mater. 2002, 14, 1204–1208. [Google Scholar]
- Yao, B.D.; Chan, Y.F.; Zhang, X.Y.; Zhang, W.F.; Yang, Z.Y.; Wang, N. Formation mechanism of TiO2 nanotubes. Appl. Phys. Lett. 2003, 82, 281–283. [Google Scholar]
- Mor, G.K.; Varghese, O.K.; Paulose, M.; Mukherjee, N.; Grimes, C.A. Fabrication of tapered, conical-shaped titania nanotubes. J. Mater. Res. 2011, 18, 2588–2593. [Google Scholar]
- Ruan, C.; Paulose, M.; Varghese, O.K.; Mor, G.K.; Grimes, C.A. Fabrication of highly ordered TiO2 nanotube arrays using an organic electrolyt. J. Phys. Chem. B 2005, 109, 15754–15759. [Google Scholar]
- Macak, J.M.; Tsuchiya, H.; Schmuki, P. High-aspect-ratio TiO2 nanotubes by anodization of titanium. Angew. Chem. Int. Ed. 2005, 44, 2100–2102. [Google Scholar]
- Macak, M.; Tsuchiya, H.; Taveira, L.; Aldabergerova, S.; Schmuki, P. Smooth anodic TiO2 nanotubes. Angew. Chem. Int. Ed. 2005, 44, 7463–7465. [Google Scholar]
- Quan, X.; Yang, S.; Ruan, X.; Zhao, H. Preparation of titania nanotubes and their environmental applications as electrode. Environ. Sci. Technol. 2005, 39, 3770–3775. [Google Scholar]
- Zwilling, V.; Aucouturier, M.; Darque-Ceretti, E. Anodic oxidation of titanium and TA6V alloy in chromic media. An electrochemical approach. Electrochim. Acta 1999, 45, 921–929. [Google Scholar]
- Albu, S.P.; Ghicov, A.; Macak, J.M.; Schmuki, P. 250 μm long anodic TiO2 nanotubes with hexagonal self-ordering. Phys. Status Solidi RRL 2007, 1, R65–R67. [Google Scholar]
- Cai, Q.; Paulose, M.; Varghese, O.K.; Grimes, C.A. The effect of electrolyte composition on the fabrication of self-organized titanium oxide nanotube arrays by anodic oxidation. J. Mater. Res. 2005, 20, 230–236. [Google Scholar]
- Paulose, M.; Shankar, K.; Yoriya, S.; Prakasam, H.E.; Varghese, O.K.; Mor, G.K.; Latempa, T.A.; Fitzgerald, A.; Grimes, C.A. Anodic growth of highly ordered TiO2 nanotube arrays to 134 um in length. J. Phys. Chem. B 2006, 110, 16179–16184. [Google Scholar]
- Armada, M.P.G.; Losada, J.; Cuadrado, I.; Alonso, B.; Gonzalez, B.; Casado, C.M.; Zhang, J. Preparation of biosensors based in a siloxane homopolymer with interacting ferrocenes for the amperometric detection of peroxides. Sens. Actuator. B Chem. 2004, 101, 143–149. [Google Scholar]
- Elekes, O.; Moscone, D.; Venema, K.; Korf, J. Bi-enzyme reactor for electrochemical detection of low concentrations of uric acid and glucose. Clin. Chim. Acta 1995, 239, 153–165. [Google Scholar]
- Zhang, F.; Wang, X.; Ai, S.; Sun, Z.; Wan, Q.; Zhu, Z.; Xian, Y.; Jin, L.; Yamamoto, K. Immobilization of uricase on ZnO nanorods for a reagentless uric acid biosensor. Anal. Chim. Acta 2004, 519, 155–160. [Google Scholar]
- Huand, X.J.; IM, H.S.; Yarimaga, O.; Kim, J.H.; Lee, D.H.; Kim, H.S.; Choi, Y.K. Direct electrochemistry of uric acid chemically assembled carboxylated single-walled carbon nanotubes netlike electrode. J. Phys. Chem. B 2006, 110, 21850–21856. [Google Scholar]
- Kannan, P.; John, S.A. Determination of nanomolar uric and ascorbic acids using enlarged gold nanoparticles modified electrode. Anal. Biochem. 2009, 386, 65–72. [Google Scholar]
- Wang, Y.T.; Yu, L.; Zhu, Z.Q.; Zhang, J.; Zhu, J.Z. Novel uric acid sensor based on enzyme electrode modified by zno nanoparticles and multiwall carbon nanotubes. Anal. Lett. 2009, 42, 775–789. [Google Scholar]
- Rawal, R.; Chawla, S.; Chauhan, N.; Dahiya, T.; Pundir, C.S. Construction of amperometric uric acid biosensor based on uricase immobilized on PBNPs/cMWCNT/PANI/Au composite. Int. J. Biol. Macromol. 2012, 50, 112–118. [Google Scholar]
- Tao, H.; Wang, X.; Wang, X.; Hu, Y.; Ma, Y.; Lu, Y.; Hu, Z. Construction of uric acid biosensor based on biomimetic titanate nanotubes. J. Nanosci. Nanotechnol. 2010, 10, 860–864. [Google Scholar]
- Cui, H.F.; Ye, J.S.; Zhang, W.D.; Li, C.M.; Luong, J.H.; Sheu, F.S. Selective and sensitive electrochemical detection of glucose in neutral solution using platinum-lead alloy nanoparticle/carbon nanotube nanocomposites. Anal. Chim. Acta 2007, 594, 175–183. [Google Scholar]
- Singh, K.; Singh, B.P.; Chauhan, R.; Basu, T. Fabrication of amperometric bienzymatic glucose biosensor based on MWCNT tube and polypyrrole multilayered nanocomposite. J. Appl. Polym. Sci. 2012, 125, 235–246. [Google Scholar]
- Xue, C.H.; Zhou, R.J.; Shi, M.M.; Wu, G.; Zhang, X.B.; Wang, M.; Chen, H.Z. Electrochemistry of glucose oxidase immobilized on carbon nanotubes noncovalently functionalized by multihydroxyl and multicarboxyl groups. J. Electroanal. Chem. 2010, 642, 92–97. [Google Scholar]
- Li, H.; Huang, X.; Lu, J.; Sun, F.; Yi, F.; Wang, Y.; Tang, Y. A novel glucose biosensor fabricated with electroactive Nb0.95Ti0.95O4 nano-composite film. Int. J. Electrochem. Sci. 2012, 7, 9354–9365. [Google Scholar]
- Rahman, M.M.; Ahammad, A.J.S.; Jin, J.H.; Ahn, S.J.; Lee, J.J. A comprehensive review of glucose biosensors based on nanostructured metal-oxides. Sensors 2010, 10, 4855–4886. [Google Scholar]


| Type | Ethylene Glycol (mL) | NH4F (g) | DI Water·(mL) |
|---|---|---|---|
| A | 250 | 1.5 | 20 |
| B | 250 | 1.5 | 50 |
| Group [reference] | sensitivity μA/cm2/mM | Dynamic Range | Method | Manufacture |
|---|---|---|---|---|
| Fenfen Zhang, et al. [40] | 105.4 | 0 μM∼15 μM | Nafion coating | GCE/ZnO nanorods carboxylated |
| Xing-Jiu Huang, et al. [41] | 34.2 | 0 μM∼18μM | Surface adsorption-controlled | SWCNT net electrode |
| P. Kannan, et al. [42] | 75 | 50 nM∼0.4μM | Self-assembly and seeding | DMT/AuNPs |
| Yiting Wang, et al. [43] | 393 | 5 μM∼1 mM | Vapour Liquid Solid (VLS) growth. | MWNTs/ZnO nanoparticles |
| Haisheng Tao, et al. [45] | 184.3 | 1 μM∼5 mM | Hydrothermal decomposition | GCE/TONTs |
| Rachna Rawal, et al. [44] | 100 | 120 μM∼830 μM | Electrochemical deposition | Au/PANI/cMWCNT/PBNPs |
| (5 μM∼830 μM) | ||||
| This study | 394 | 120 μM ∼ 830 μM | Anodization | Ti/ATONTs |
| (30 μM∼830 μM) |
© 2013 by the authors; licensee MDPI, Basel, Switzerland. This article is an open access article distributed under the terms and conditions of the Creative Commons Attribution license (http://creativecommons.org/licenses/by/3.0/).
Share and Cite
Lee, H.-C.; Zhang, L.-F.; Lin, J.-L.; Chin, Y.-L.; Sun, T.-P. Development of Anodic Titania Nanotubes for Application in High Sensitivity Amperometric Glucose and Uric Acid Biosensors. Sensors 2013, 13, 14161-14174. https://doi.org/10.3390/s131014161
Lee H-C, Zhang L-F, Lin J-L, Chin Y-L, Sun T-P. Development of Anodic Titania Nanotubes for Application in High Sensitivity Amperometric Glucose and Uric Acid Biosensors. Sensors. 2013; 13(10):14161-14174. https://doi.org/10.3390/s131014161
Chicago/Turabian StyleLee, Hsiang-Ching, Li-Fan Zhang, Jyh-Ling Lin, Yuan-Lung Chin, and Tai-Ping Sun. 2013. "Development of Anodic Titania Nanotubes for Application in High Sensitivity Amperometric Glucose and Uric Acid Biosensors" Sensors 13, no. 10: 14161-14174. https://doi.org/10.3390/s131014161