Respiratory Physiology and the Impact of Different Modes of Ventilation on the Photoplethysmographic Waveform

Abstract
: The photoplethysmographic waveform sits at the core of the most used, and arguably the most important, clinical monitor, the pulse oximeter. Interestingly, the pulse oximeter was discovered while examining an artifact during the development of a noninvasive cardiac output monitor. This article will explore the response of the pulse oximeter waveform to various modes of ventilation. Modern digital signal processing is allowing for a re-examination of this ubiquitous signal. The effect of ventilation on the photoplethysmographic waveform has long been thought of as a source of artifact. The primary goal of this article is to improve the understanding of the underlying physiology responsible for the observed phenomena, thereby encouraging the utilization of this understanding to develop new methods of patient monitoring. The reader will be presented with a review of respiratory physiology followed by numerous examples of the impact of ventilation on the photoplethysmographic waveform.1. Introduction
Assessment of fluid responsiveness is an important issue in the fluid management of critically ill patients. A fluid challenge in patients with borderline cardiac reserve may result in an overt pulmonary edema, necessitating ventilatory support [1,2]. Static measures such as central venous pressure or the pulmonary artery wedge pressure, if not extremely low, are not useful for assessment of fluid responsiveness [3–5], while dynamic measures such as pulse pressure variation (PPV), systolic pressure variation (SPV) and stroke volume variation (SVV) predict fluid responsiveness well during mechanical ventilation. These variations are caused by tidal changes in the intrathoracic pressure induced by positive pressure ventilation [6–9]. Thus, dynamic preload variables were considered to be important in guiding fluid and catecholamine therapy in critically ill patients [10,11].
During spontaneous ventilation, dynamic parameters like pulse pressure variation (PPV) and systolic pressure variation (SPV) are usually small. Inspiratory and/or expiratory threshold resistors were used in spontaneously breathing pigs as an effort to magnify SPV and PPV during hypovolemia [12].
In the following article the authors will discuss briefly the physiologic impact of mechanical ventilation, spontaneous breathing and incentive spirometry on right and left ventricular preload and afterload. We will then examine how these effect they might appear on photoplethysmographic (PPG) waveforms. Different examples of different modes of ventilation and their impact on plethysmographic waveforms will be given.
For lung volume to expand, transpulmonary pressure (i.e., alveolar pressure-pleural pressure (Ppl)) must increase. This is accomplished by an increase in alveolar pressure during positive pressure inspiration or by a decrease in Ppl during spontaneous inspiration. Because of their anatomic position in the closed thoracic cavity, the heart and lungs interact during each ventilation cycle.
2. During Controlled Mechanical Ventilation
2.1. Right Heart Effects of Positive-Pressure Ventilation
Preload During inspiration, the positive intrathoracic pressure compresses the compliant vena cava and increases resistance to venous flow and results in reductions in venous return [13].
Afterload Right ventricular afterload indicators, such as pulmonary vascular resistance and right ventricular output impedance, are augmented during the mechanical ventilation inspiratory cycle as well as spontaneous inspiration. The vascular resistance of alveolar vessels increases as alveoli expands with gas, and vessel compression occurs as alveoli inflate; thus, tidal volume is the primary determinant of right ventricular afterload [14–16]. Augmentation in right ventricular afterload necessitates the right ventricle generate greater pressure to eject blood into the pulmonary artery. Accordingly, right ventricular work and myocardial oxygen demands are increased. Individuals who are unable to sufficiently increase contractile force in response to increased right ventricular afterload have a subsequent reduction in right ventricular stroke volume and ejection fraction. The resultant increase in end-diastolic volume dilates the right ventricle. Ventricular dilation will alter the pressure gradient for coronary artery blood flow, increase ventricular wall tension, and shift the interventricular septum toward the left ventricle [17].
2.2. Left Heart Effects of Positive-Pressure Ventilation
Preload The reduced right ventricular venous return subsequently decreases left ventricular preload, stroke volume and cardiac output and the increased right ventricular afterload and right ventricular dilation with shift of the interventricular septum. Hyperinflated lungs directly compress the heart, reduce cardiac compliance, and lessen ventricular filling and end diastolic volumes [17,18]. Left ventricular preload may also be influenced by increased pericardial pressure [19].
Afterload Positive pressure mechanical ventilation also reduces left ventricular afterload or transmural pressure on inspiration and throughout the ventilatory cycle with the application of PEEP or CPAP [18,20].Transmural pressure is the pressure inside the ventricular chamber minus pressure outside the ventricle (intrathoracic pressure). Left ventricular transmural pressure is an indication of the pressure the ventricle must overcome to eject blood into the aorta. Positive intrathoracic pressure actually unloads the left ventricle by reducing transmural pressure. Consequently, the left ventricle is able to eject a greater stroke volume of blood with less pressure generation. Thus, myocardial oxygen demand is reduced and cardiac output improves.
3. During Spontaneous Breathing
Spontaneous inspiration was associated with a simultaneous fall in arterial pressure (Pa), pulmonary artery pressure (PAP) and left atrial pressure (LAP). The pleural pressure (Ppl) fell more than did chamber pressures which resulted in an increased transmural LAP, PAP, RAP (right atrial pressure), and aortic transmural pressure increased. Systemic venous return augmented as a result of increased transmural RAP and the LV afterload increased as the transmural aortic pressure (Pa-Ppl) increased. Both of these factors may have contributed to the increase in left atrial filling pressure (LAP-Ppl).
4. During Spontaneous Breathing Using Incentive Spirometry (IS)
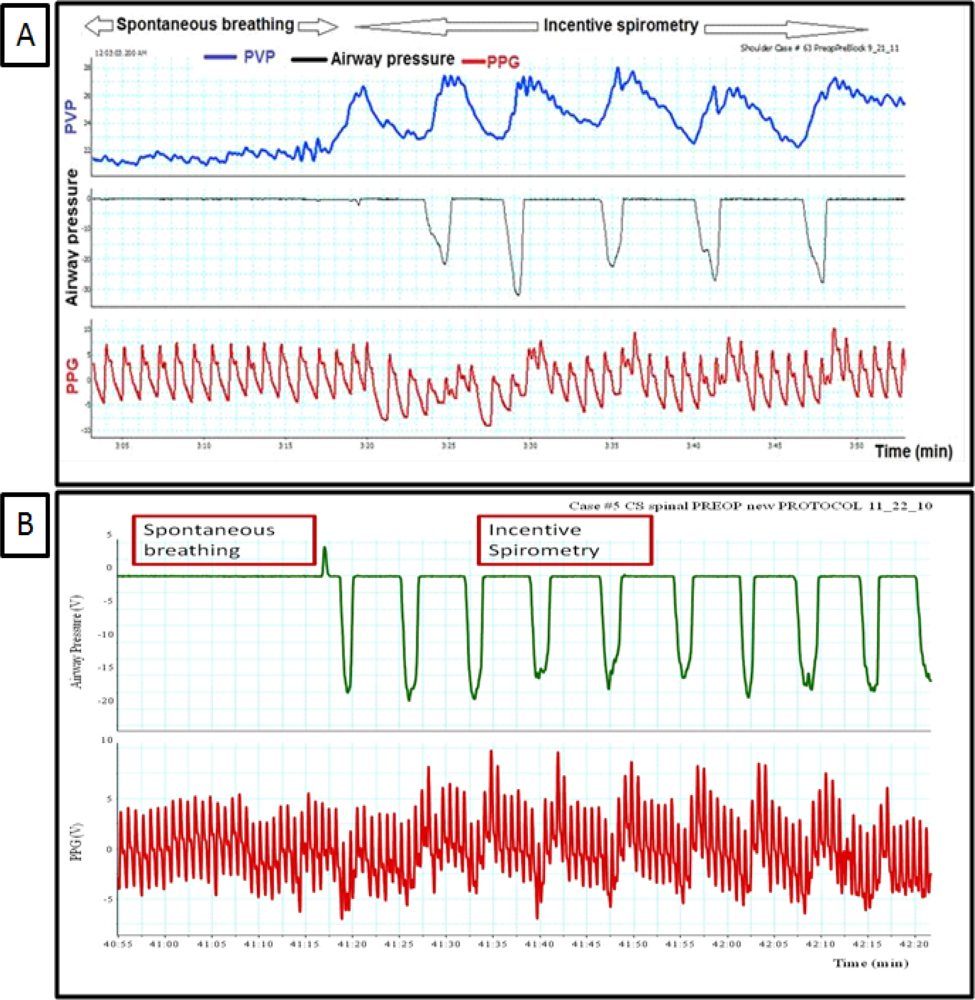
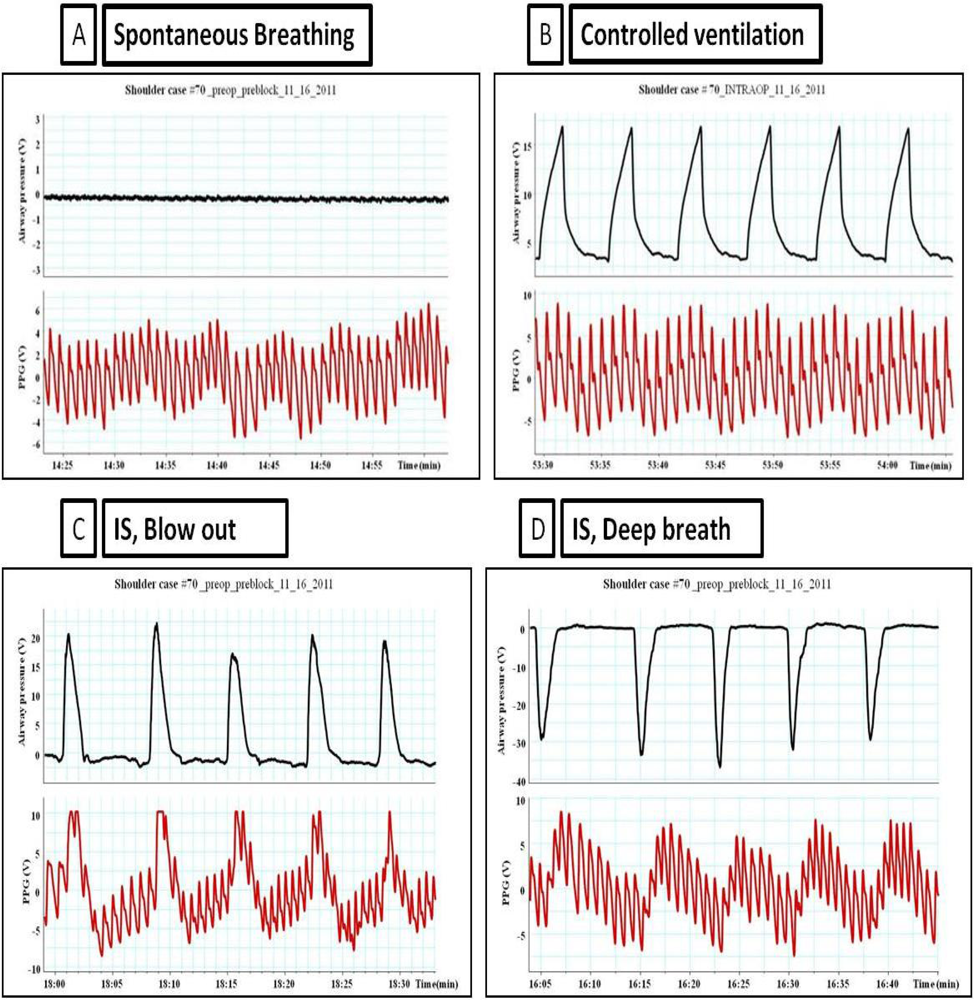
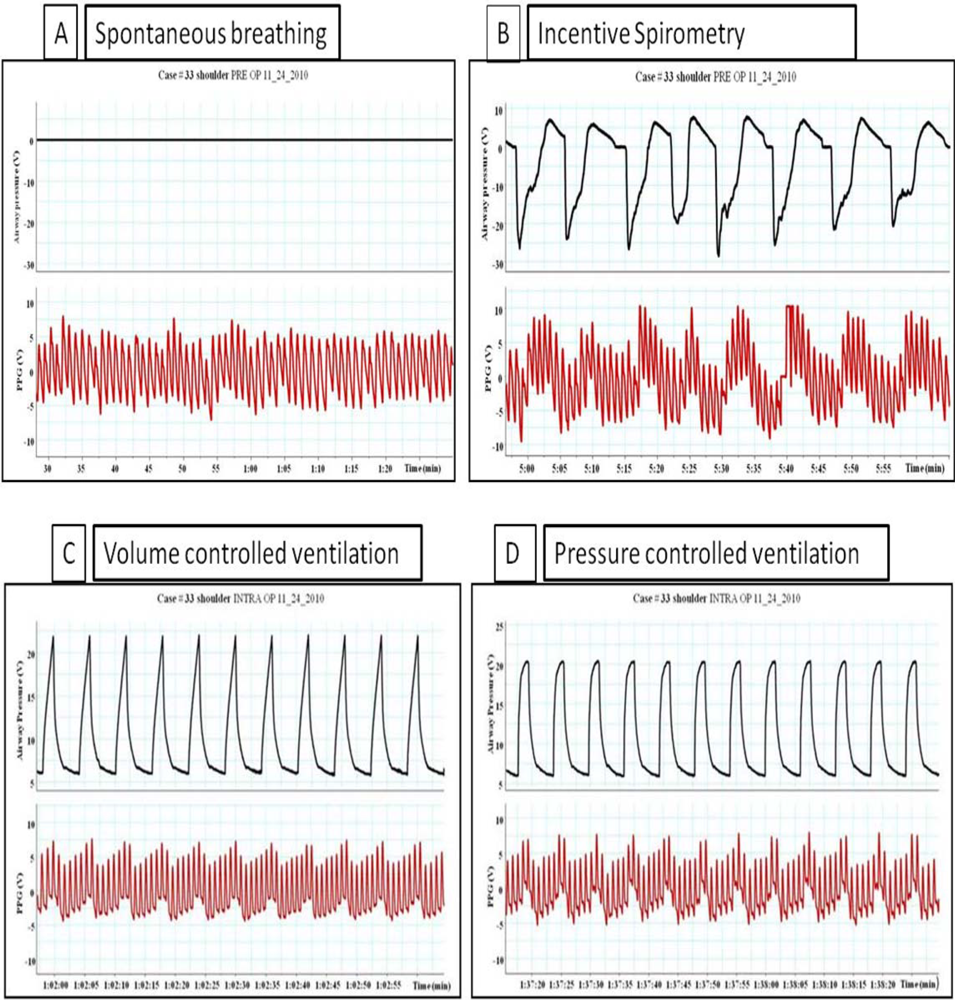
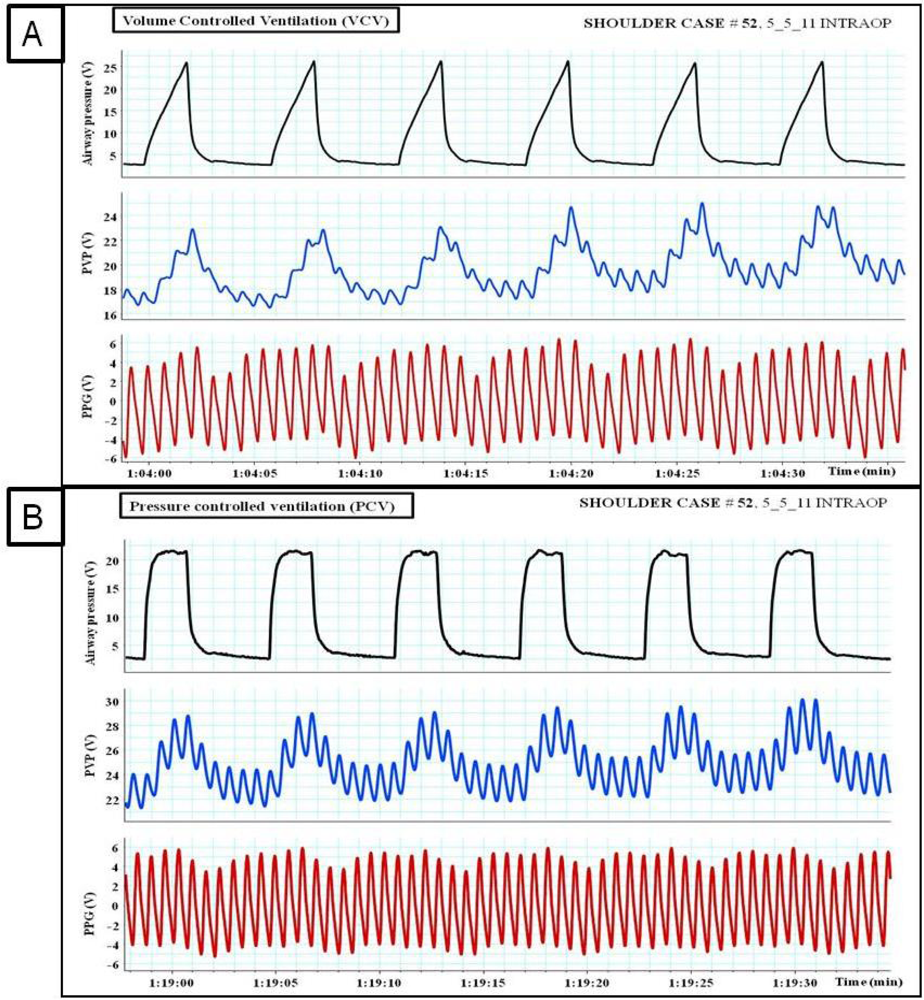
Breathing through the incentive spirometry (IS) was associated with rapid expansion of the lung with a volume close to 2.5 to 3.5 liter with a simultaneous fall in Pa, PAP, and LAP and an increase in the peripheral venous pressure as shown in Figure 1. The impact of breathing through incentive spirometry is considered an exaggerated response of normal spontaneous breathing (Figure 2), as pleural pressure (Ppl) fell more than did chamber pressures, transmural LAP, PAP and aortic transmural pressure increased and that was associated with increased LV preload and afterload of both RV and LV (similar to spontaneous breathing). Rapid expansion of the lung will directly compress compliant vena cava, increases resistance to venous flow and results in reductions in venous return (reduction of RV preload) and an increase in the peripheral venous pressure (similar to controlled ventilation) as explained in Table 1.
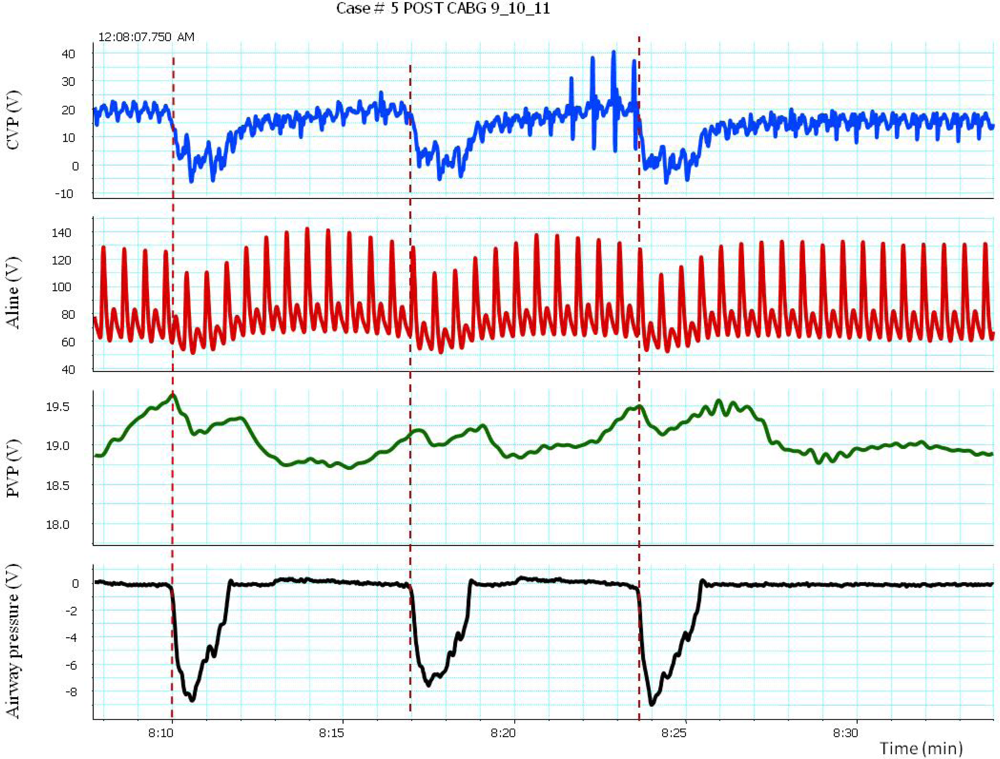
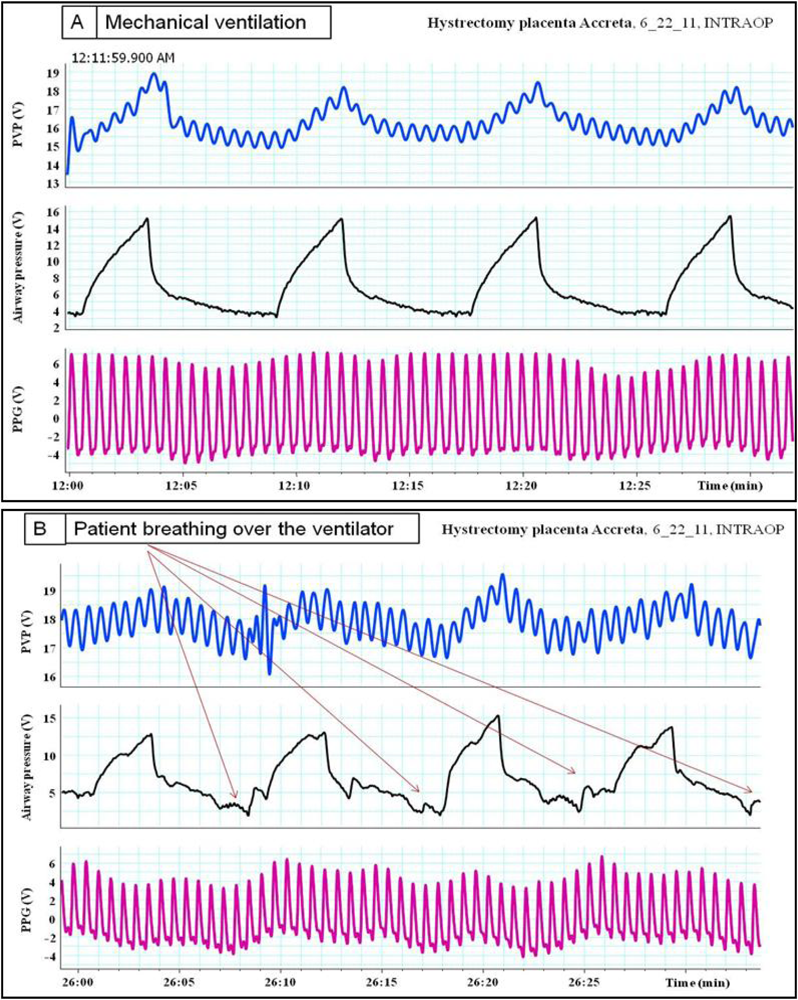
The transient increase in arterial pressure associated with positive pressure inspiration is termed reversed pulsus paradoxus (RPP). Positive pressure ventilation was associated with increased pleural pressure (Ppl) together with mean arterial pressure (Pa), right atrial pressure (RAP), left atrial pressure (LAP) and peripheral venous pressure as shown in Figure 3. It has been shown that with positive pressure ventilation there was more increase in pleural pressure (Ppl) than the rise in mean arterial pressure (Pa) left atrial pressure (LAP) which results in reduction of the transmural chamber pressure, which represents the actual filling pressures, of the aorta and LAP respectively. The decreased in transmural LAP could result from either diminished afterload of LV or decreased systemic venous return. Compression of the compliant vena cava and increases resistance to venous flow results in reductions in systemic venous return [13]. Thus, RPP occurred when LV preload and afterload, as estimated from transmural LAP and the transmural aortic pressure respectively, were actually decreased [21].
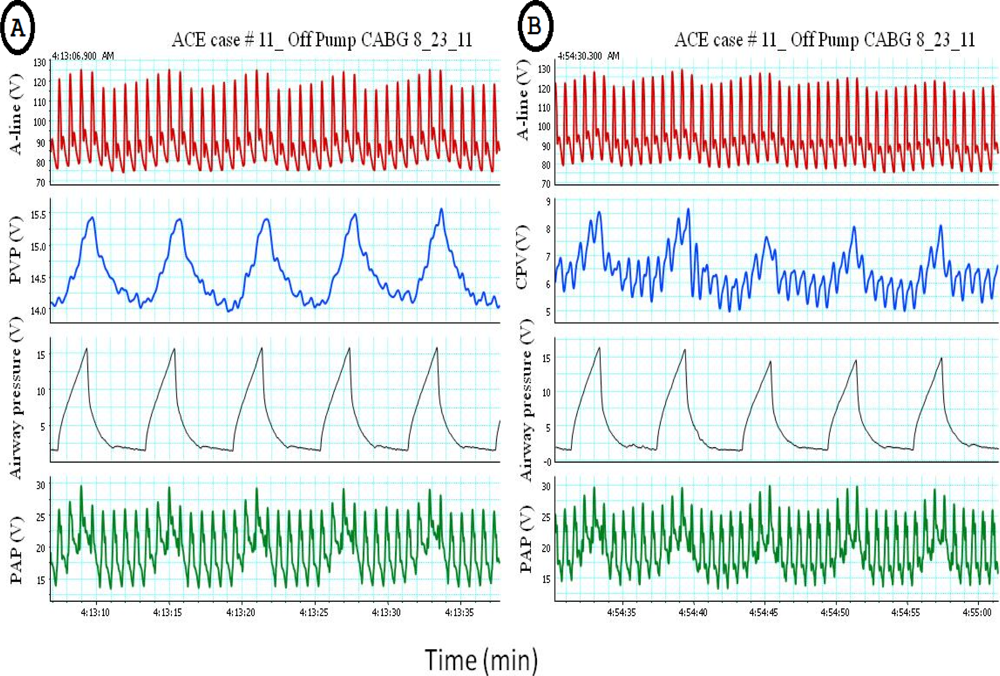
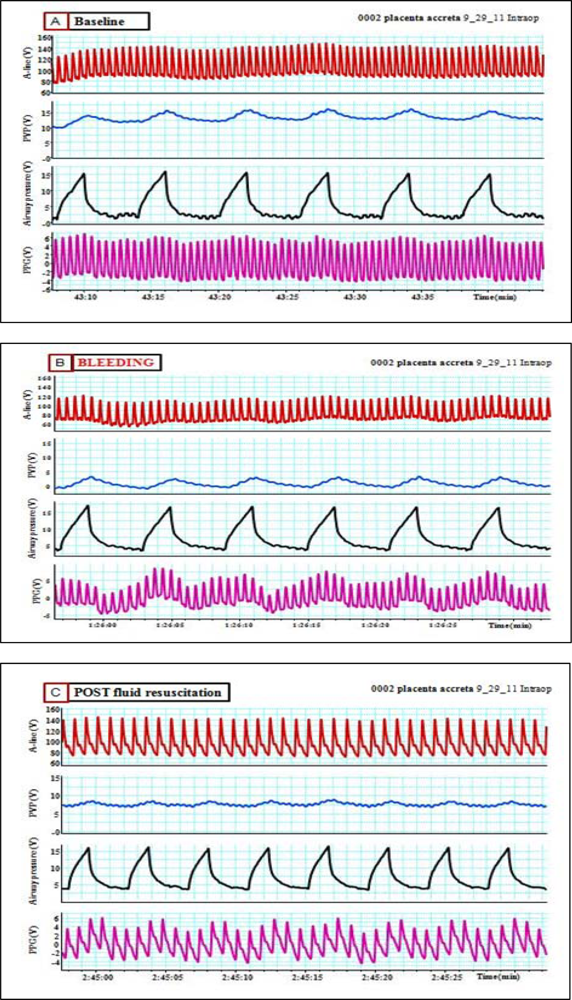
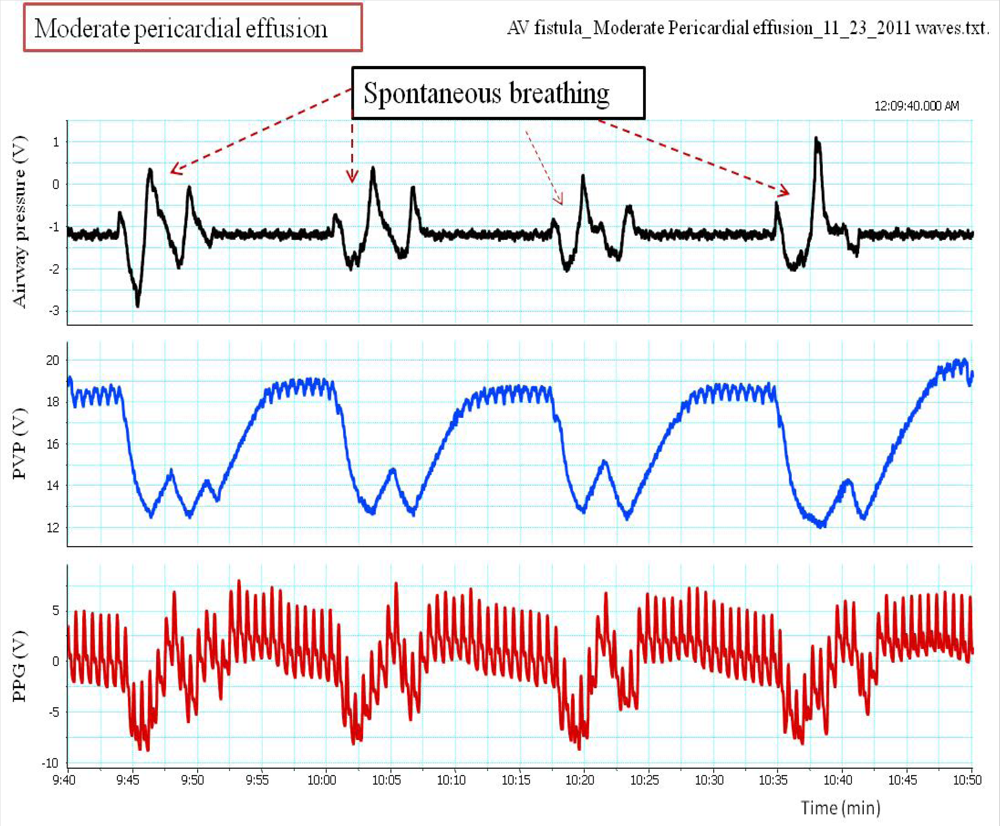
Pulsus paradoxus is the pathological exaggeration of the normal transient decrease in arterial blood pressure during spontaneous breathing. During spontaneous breathing the pleural pressure decreased relative to atmospheric pressure with simultaneous fall in arterial pressure, LAP, PAP and RAP. Pleural pressure fell more than did chamber pressures which resulted in an increased in transmural RA, LA and aortic pressures. Spontaneous breathing was associated with augmentation of LA filling pressure as a result of increased transmural RAP which promotes systemic venous return and increased LV afterload. Despite this increase in LV filling pressure, systemic arterial pressure decreased due to increased LV afterload during spontaneous inspiration [21]. Comparison between pulsus paradoxus and reversed pulsus paradoxus is shown in Table 2. In certain pathological conditions such as cardiac tamponade, where the left heart filling is hampered during inspiration, or acute exacerbation of chronic obstructive lung disease or asthma when the right heart filling is reduced during expiration by high intrathoracic pressure, pulsus paradoxus may be enhanced [22,23]. Figure 4 shows the impact of spontaneous breathing on the PPG and peripheral venous pressure waveforms in patients with moderate pericardial effusion. Figures 5 through 13 given further examples of the interaction of the respiratory system and the PPG.
5. Conclusions
The use of the photoplethysmographic (PPG) waveform for patient monitoring offers a number of significant advantages. The technology has proven to be inexpensive, low risk, and easy-to-use by both the patient and the clinician. The primary goal for the clinical engineer should be to develop an understanding of the underlying physiology responsible for the waveform. Especially with the PPG where features that are originally considered to be artifactual in nature, have become a source of rich physiologic signal.
The next step is the utilization of this understanding to develop new methods of patient monitoring. It is important to keep in mind that monitors in themselves do not change patient outcomes, it is only change in therapy that can do that. The results of monitoring should be presented in such a way as to allow for guidance of therapy, which might take on many forms including pharmaceutical agents, the administration of intravenous fluids (saline or blood) or the administration of oxygen.
From the examples shown above it is obvious that ventilation is affecting the PPG waveforms morphology. Until recently, these changes in the waveforms have been seen as a source of artifact which interferes with the calculation of arterial saturation and further analysis of the waveforms. Modern digital signal processing is allowing for a re-examination of this ubiquitous waveform.
Evidence now suggests that the DC component (baseline modulation) is associated with the movement of venous blood [24,25]. Unlike static pre-load measurements (i.e., CVP & PAP), which have a poor reputation for guiding fluid therapy, the potential of using respiratory induced peripheral venous modulation remains to be explored. From a theoretical view point, venous modulation should be immune to the effects of cardiac arrhythmia and vascular tone changes. In the long run, this approach may reveal a new method of monitoring cardiovascular physiology which would be focused on the pre-load side of the circulation.
There are already commercial medical devices (PVI, Masimo, Irving CA) on the market that measure arterial modulations (AC) which is felt to be due to modulations in stroke volume [26]. When used as an index of fluid responsiveness (e.g., predicting if a patients cardiac output would increase with a fluid bolus) this method of monitor has fared well [27]. The fact that information regarding both the pre-load condition and its effect on stroke volume is obtainable from a PPG is intriguing and may give insight in the underlying cardiac function.
References
- Magder, S. Predicting volume responsiveness in spontaneously breathing patients: Still a challenging problem. Crit. Care 2006, 10, 165. [Google Scholar]
- Coudray, A.; Romand, J.-A.; Treggiari, M.; Bendjelid, K. Fluid responsiveness in spontaneously breathing patients: A review of indexes used in intensive care. Crit. Care Med 2005, 33, 2757–2762. [Google Scholar]
- Marik, P.E.; Baram, M.; Vahid, B. Does central venous pressure predict fluid responsiveness? A systematic review of the literature and the tale of seven mares. Chest 2008, 134, 172–178. [Google Scholar]
- Michard, F.; Teboul, J.L. Predicting fluid responsiveness in ICU patients. A critical analysis of the evidence. Chest 2002, 121, 2000–2008. [Google Scholar]
- Bendjelid, K.; Romand, J.A. Fluid responsiveness in mechanically ventilated patients: A review of indices used in intensive care. Intensive Care Med 2003, 29, 352–360. [Google Scholar]
- Tavernier, B.; Makhotine, O.; Lebuffe, G.; Dupont, J.; Scherpereel, P. Systolic pressure variation as a guide to fluid therapy in patients with sepsis-induced hypotension. Anesthesiology 1998, 89, 1313–1321. [Google Scholar]
- Feissel, M.; Michard, F.; Mangin, I.; Ruyer, O.; Faller, J.P.; Teboul, J.L. Respiratory changes in aortic blood velocity as an indicator of fluid responsiveness in ventilated patients with septic shock. Chest 2001, 119, 867–873. [Google Scholar]
- Berkenstadt, H.; Margalit, N.; Hadani, M.; Friedman, Z.; Segal, E.; Villa, Y.; Perel, A. Stroke volume variation as a predictor of fluid responsiveness in patients undergoing brain surgery. Anesth. Analg 2001, 92, 984–989. [Google Scholar]
- Michard, F.; Boussat, S.; Chemla, D.; Anguel, N.; Mercat, A.; Lecarpentier, Y.; Richard, C.; Pinsky, M.R.; Teboul, J.L. Relation between respiratory changes in arterial pulse pressure and fluid responsiveness in septic patients with acute circulatory failure. Am. J. Respir. Crit. Care Med 2000, 162, 134–138. [Google Scholar]
- Pinsky, M.R. Functional haemodynamic monitoring. Intensive Care Med 2002, 28, 386–388. [Google Scholar]
- Perel, A. Assessing fluid responsiveness by the systolic pressure variation in mechanically ventilated patients: Systolic pressure variation as a guide to fluid therapy in patients with sepsis-induced hypotension. Anesthesiology 1998, 89, 1309–1310. [Google Scholar]
- Dahl, M.K.; Vistisen, S.T.; Nielsen, J.K.; Larsson, A. Using an expiratory resistor, arterial pulse pressure variations predict fluid responsiveness during spontaneous breathing: An experimental porcine study. Crit. Care 2009, 13, R39. [Google Scholar]
- Jellinek, H.; Krenn, H.; Oczenski, W.; Veit, F.; Schwarz, S.; Fitzgerald, R.D. Influence of positive airway pressure on the pressure gradient for venous return in humans. J. Appl. Physiol 2000, 88, 926–932. [Google Scholar]
- Koganov, Y.; Weiss, Y.G.; Oppenheim, A.; Elami, A.; Pizov, R. Positive end-expiratory pressure increases pulmonary venous vascular resistance in patients after coronary artery surgery. Crit. Care Med 1997, 25, 767–772. [Google Scholar]
- Jardin, F.; Vieillard-Baron, A. Right ventricular function and positive pressure ventilation in clinical practice: From hemodynamic subsets to respirator settings. Intensive Care Med 2003, 29, 1426–1434. [Google Scholar]
- Viellard-Barton, A.; Loubieres, Y.; Schmitt, J.M.; Page, B.; Dubourg, O.; Jardin, F. Cyclic changes in right ventricular output impedance during mechanical ventilation. J. Appl. Physiol 1999, 87, 1644–1650. [Google Scholar]
- Mitchell, J.R.; Whitelaw, W.A.; Sas, R.; Smith, E.R.; Tyberg, J.V.; Belenkie, I. RV filling modulates LV function by direct ventricular interaction during mechanical ventilation. Am. J. Physiol. Heart Circ. Physiol 2005, 289, H549–H557. [Google Scholar]
- Pinsky, M.R. Cardiovascular issues in respiratory care. Chest 2005, 128, 592S–597S. [Google Scholar]
- Fessler, H.E.; Brower, R.G.; Wise, R; Permutt, S. Positive pleural pressure decreases coronary perfusion. Am. J. Physiol 1990, 258, H814–H820. [Google Scholar]
- Steingrub, J.S.; Tidswell, M.; Higgins, T.I. Hemodynamic consequences of heart-lung interactions. J. Intensive Care Med 2003, 18, 92–99. [Google Scholar]
- Abel, J.G.; Salerno, T.A; Panos, A.; Greyson, N.D.; Rice, T.W.; Teoh, K.; Lichtenstein, S.V. Cardiovascular effects of positive pressure ventilation in humans. Ann. Thorac. Surg 1987, 43, 198–206. [Google Scholar]
- Dornhorst, A.C.; Howard, P.; Leathart, G.L. Pulsus paradoxus. Lancet 1952, 1, 746–748. [Google Scholar]
- Cohn, J.N.; Pinkerson, A.L.; Tristani, F.E. Mechanism of pulsus paradoxus in clinical shock. J. Clin. Invest 1967, 46, 1744–1755. [Google Scholar]
- Walton, Z.D.; Kyriacou, P.A.; Silverman, D.G.; Shelley, K.H. Measuring venous oxygenation using the photoplethysmograph waveform. J. Clin. Monit. Comput 2010, 24, 295–303. [Google Scholar]
- Thiele, R.H.; Tucker-Schwartz, J.M.; Lu, Y.; Gillies, G.T.; Durieux, M.E. Technical communication: Transcutaneous regional venous oximetry: A feasibility study. Anesth. Analg 2011, 112, 1353–1357. [Google Scholar]
- Cannesson, M.; Besnard, C; Durand, P.G.; Bohé, J.; Jacques, D. Relation between respiratory variations in pulse oximetry plethysmographic waveform amplitude and arterial pulse pressure in ventilated patients. Crit. Care 2005, 9, 562–568. [Google Scholar]
- Hamilton, M.A.; Cecconi, M.; Rhodes, A. A systematic review and meta-analysis on the use of preemptive hemodynamic intervention to improve postoperative outcomes in moderate and high-risk surgical patients. Anesth. Analg 2011, 112, 1392–402. [Google Scholar]


| Mechanical ventilation | ||
| Right Ventricle (RV) | Left Ventricle (LV) | |
| Preload | Decreased | Decreased |
| Afterload | Increased | Decreased |
| Spontaneous breathing | ||
| Right Ventricle (RV) | Left Ventricle (LV) | |
| Preload | Increased | Increased |
| Afterload | Increased | Increased |
| Spontaneous breathing with incentive spirometry (IS) | ||
| Right Ventricle (RV) | Left Ventricle (LV) | |
| Preload | Decreased | Increased |
| Afterload | Increased | Increased |
| Pulsus paradoxus Inspiration (spontaneous. Breathing) | Reverse Pulsus paradoxus (RPP) Inspiration (Positive pressure ventilation) | |
|---|---|---|
| RA pressure | decreased | increased |
| Transmural RA, LA, aortic pressure | increased | decreased |
| LVESV | increased | decreased |
| LVEDV | No change | No change |
| LV afterload | increased | decreased |
| Arterial pressure | decreased | Transient Increased |
© 2012 by the authors; licensee MDPI, Basel, Switzerland This article is an open access article distributed under the terms and conditions of the Creative Commons Attribution license ( http://creativecommons.org/licenses/by/3.0/).
Share and Cite
Alian, A.A.; Shelley, K.H. Respiratory Physiology and the Impact of Different Modes of Ventilation on the Photoplethysmographic Waveform. Sensors 2012, 12, 2236-2254. https://doi.org/10.3390/s120202236
Alian AA, Shelley KH. Respiratory Physiology and the Impact of Different Modes of Ventilation on the Photoplethysmographic Waveform. Sensors. 2012; 12(2):2236-2254. https://doi.org/10.3390/s120202236
Chicago/Turabian StyleAlian, Aymen A., and Kirk H. Shelley. 2012. "Respiratory Physiology and the Impact of Different Modes of Ventilation on the Photoplethysmographic Waveform" Sensors 12, no. 2: 2236-2254. https://doi.org/10.3390/s120202236