An Efficient and Compact Difference-Frequency-Generation Spectrometer and Its Application to 12CH3D/12CH4 Isotope Ratio Measurements

Abstract
:1. Introduction
2. Methods
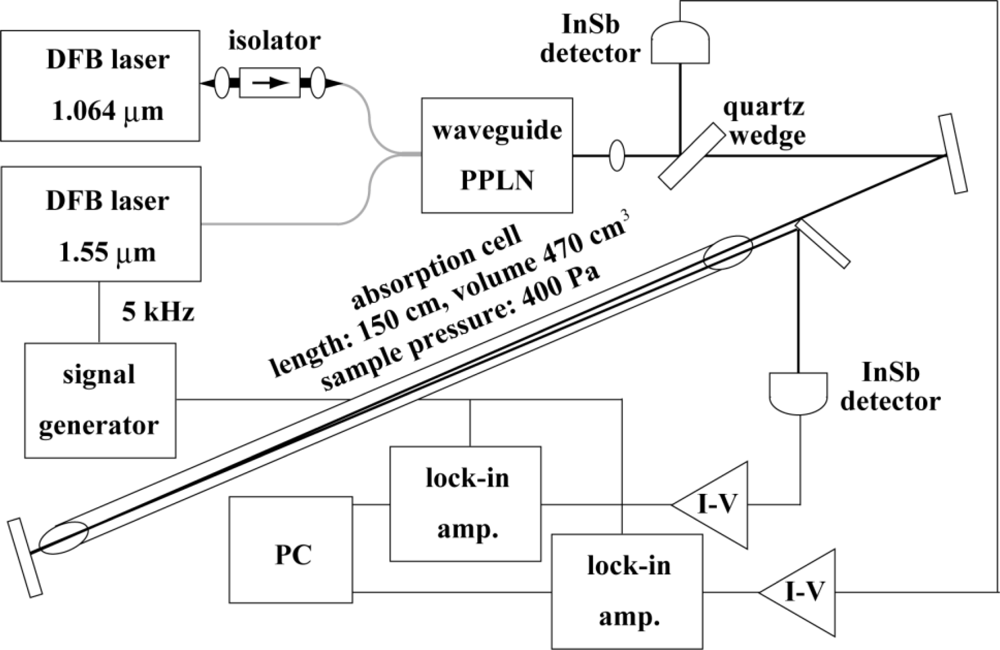
2.1. Experimental Setup
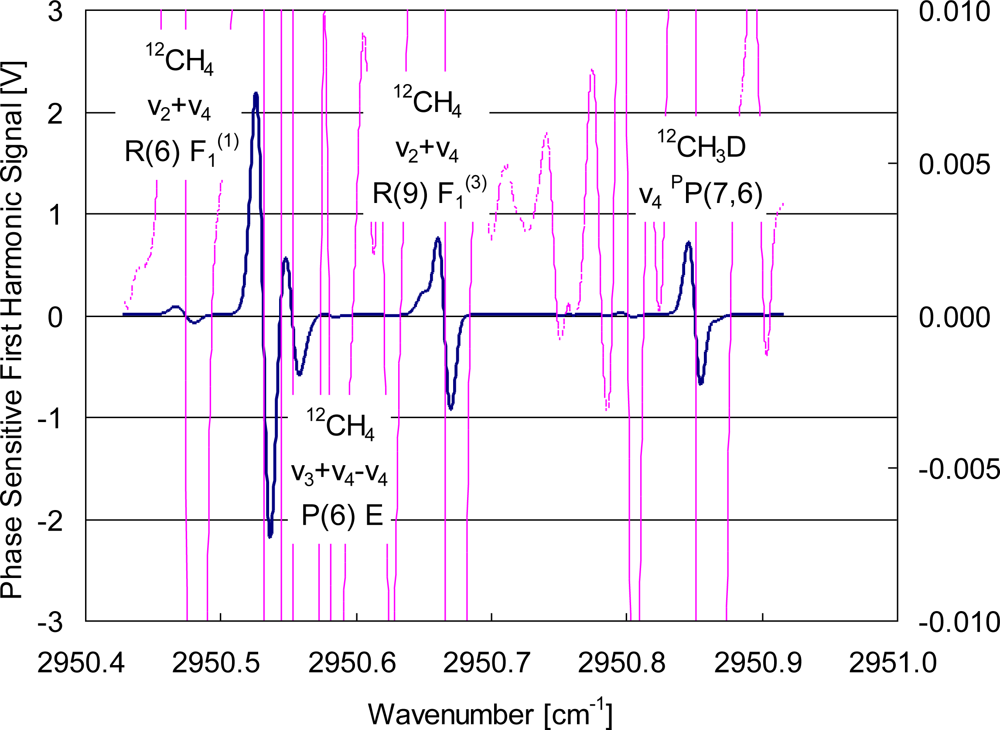
2.2. Absorption Lines for Isotope Ratio Measurement
2.3. Isotope Ratio Determination
2.4. Sample and Standard Gases
3. Results and Discussion
3.1. Sensitivity of the Spectrometer
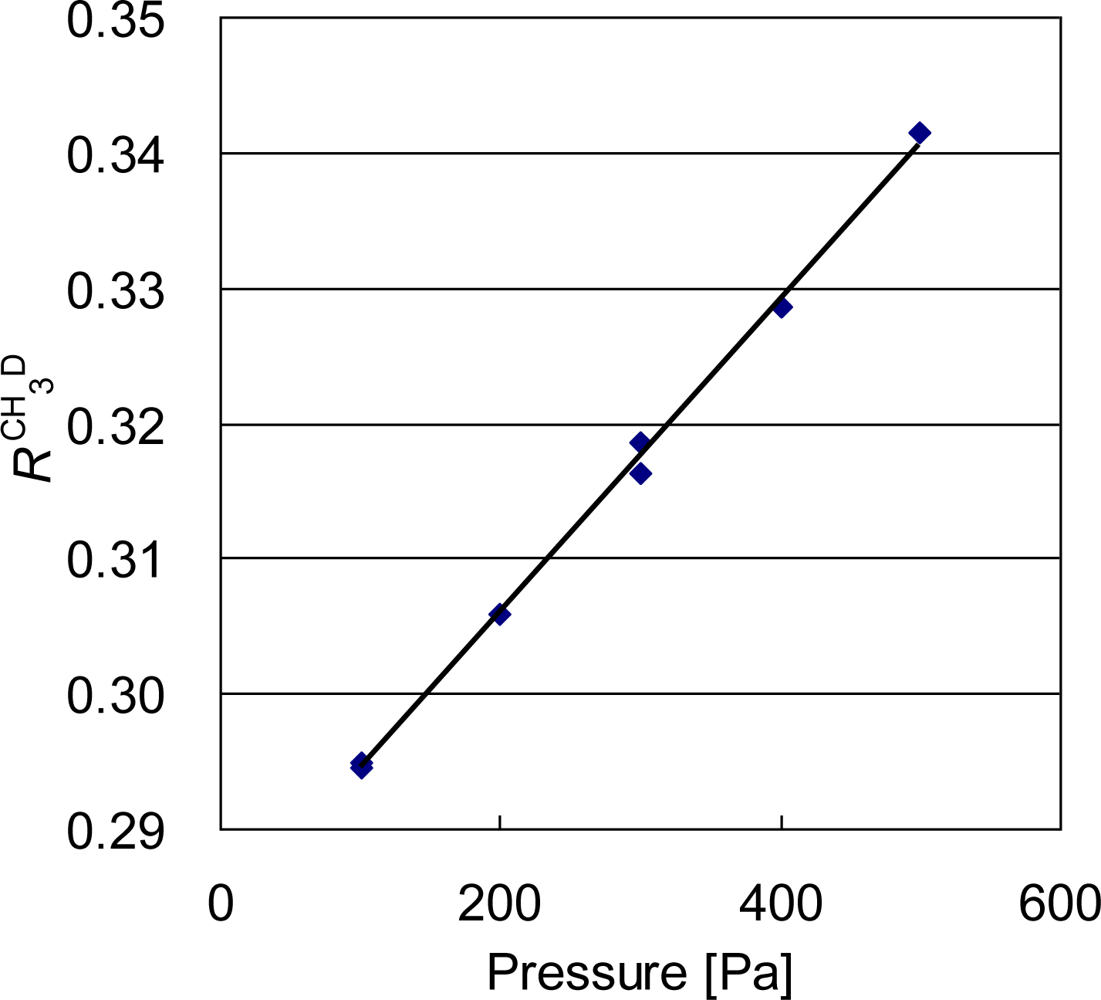
3.2. Pressure Dependence of the Signal Ratio
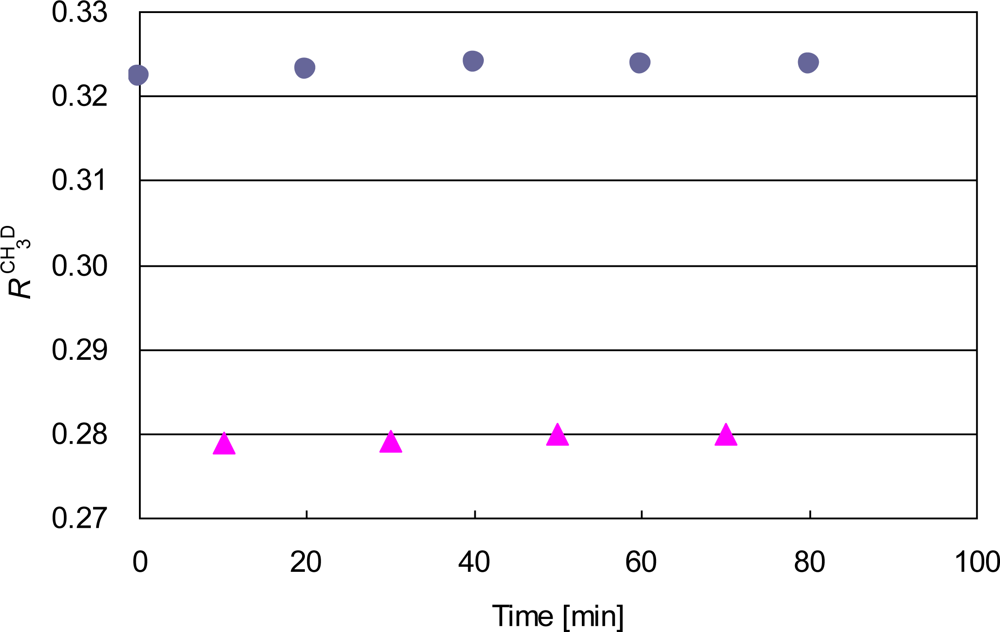
3.3. Precision and Accuracy of the Isotope Ratio Measurement
4. Conclusions
Acknowledgments
References and Notes
- Waechter, H; Sigrist, MW. Mid-infrared spectroscopic determination of isotope ratios of N2O at trace levels using wavelength modulation and balanced path length detection. Appl. Phys. B 2007, 87, 539–546. [Google Scholar]
- Curl, F; Capasso, F; Gmachl, C; Kosterev, AA; McManus, B; Lewickl, R; Pusharsky, M; Wysocki, G; Tittel, FK. Quantum cascade lasers in chemical physics. Chem. Phys. Lett 2010, 487, 1–18. [Google Scholar]
- Sabana, H; Fritsch, T; Onana, MB; Bouba, O; Hering, P; Murtz, M. Simultaneous detection of (NO)-N-14 and (NO)-N-15 using faraday modulation spectroscopy. Appl. Phys. B 2009, 96, 535–544. [Google Scholar]
- Richter, D; Wert, BP; Fried, A; Weibring, P; Walega, JG; White, JWC; Vaughn, BH; Tittel, FK. High-precision CO2 isotopologue spectrometer with a difference-frequency-generation laser source. Opt. Lett 2009, 34, 172–174. [Google Scholar]
- Kerstel, E; Gianfrani, L. Advances in laser-based isotope ratio measurements: Selected applications. Appl. Phys. B 2008, 92, 439–449. [Google Scholar]
- Waechter, H; Mohn, J; Tuzson, B; Emmenegger, L; Sigrist, MW. Determination of N2O isotopomers with quantum cascade laser based absorption spectroscopy. Opt. Express 2008, 16, 9239–9244. [Google Scholar]
- Tuzson, B; Mohn, J; Zeeman, MJ; Werner, RA; Eugster, W; Zahniser, MS; Nelson, DD; McManus, JB; Emmenegger, L. High precision and continuous field measurement of delta C-13 and delta O-18 in carbon dioxide with a cryogen-free QCLAS. Appl. Phys. B 2008, 92, 451–458. [Google Scholar]
- Nelson, DD; McManus, JB; Herndon, SC; Zahniser, MS; Tuzson, B; Emmenegger, L. New method for isotopic ratio measurements of atmospheric carbon dioxide using a 4.3 μm pulsed quantum cascade laser. Appl. Phys. B 2008, 90, 301–309. [Google Scholar]
- Castrillo, A; Casa, G; Gianfrani, L. Oxygen isotope ratio measurements in CO2 by means of a continuous-wave quantum cascade laser at 4.3 μm. Opt. Lett 2007, 32, 3047–3049. [Google Scholar]
- Anzai, K; Sasada, H; Yoshida, N. Best pair of 3.3-μm-band transitions for isotopomer abundance ratio measurements of 13CH4 /12CH4. Jpn. J. Appl. Phys 2007, 46, 1717–1721. [Google Scholar]
- Trudeau, ME; Chen, P; Garcia, GD; Hollberg, LW; Tans, PP. Stable isotopic analysis of atmospheric methane by infrared spectroscopy by use of diode laser difference-frequency generation. Appl. Opt 2006, 45, 4136–4141. [Google Scholar]
- Tadanaga, O; Yanagawa, T; Nishida, Y; Miyazawa, H; Magari, K; Asobe, M; Suzuki, H. Efficient 3-μm difference frequency generation using direct-bonded quasi-phase-matched LiNbO3 ridge waveguides. Appl. Phys. Lett 2006, 88, 061101. [Google Scholar]
- Abe, M; Takahata, K; Sasada, H. Sub-doppler resolution 3.4-μm spectrometer with an efficient difference-frequency-generation source. Opt. Lett 2009, 34, 1744–1746. [Google Scholar]
- Grilli, R; Ciaffoni, L; Hancock, G; Peverall, R; Richie, GAD; Orr-Ewing, AJ. Mid-infrared ethene detection using difference frequency generation in quasi-phase-matched LiNbO3 waveguide. Appl. Opt 2009, 48, 5696–5703. [Google Scholar]
- Magari, K; Yanagawa, T; Tadanaga, O; Nishida, Y; Asobe, M; Suzuki, H. Fine CH4 absorption observation by 3.3 μm difference-frequency generation in quasi-phase-matched LiNbO3 ridge waveguide pumped by fiber-Bragg-grating stabilized single-mode laser diode module. Jpn. J. Appl. Phys 2007, 46, L209–L210. [Google Scholar]
- Richter, D; Weibring, P; Fried, A; Tadanaga, O; Nishida, Y; Asobe, M; Suzuki, H. High-power, tunable difference frequency generation source for absorption spectroscopy on a ridge waveguide periodically poled lithium niobate crystal. Opt. Express 2007, 15, 564–571. [Google Scholar]
- Tsuji, K; Fujikawa, S; Yamada, K; Yoshida, N; Yamamoto, K; Kikugawa, T. Precise measurement of the 13CH4/12CH4 ratio of diluted methane using a near-infrared laser absorption spectrometer. Sens. Actuat. B-Chem 2006, 114, 326–333. [Google Scholar]
- Yamamoto, K; Yoshida, N. High-precision isotopic ratio measurement system for methane 13CH4/12CH4 and 12CH3D/12CH4 by using near-infrared diode laser spectroscopy. Spectrochim. Acta A 2002, 58, 2699–2707. [Google Scholar]
- Uehara, K; Yamamoto, K; Kikugawa, T; Yoshida, N. Isotope analysis of environmental substances by a new laser-spectroscopic method utilizing different pathlengths. Sens. Actuat. B-Chem 2001, 74, 173–178. [Google Scholar]
- Kosterev, AA; Curl, RF; Tittel, FK; Gmachl, C; Capasso, F; Sivco, DL; Baillargeon, JN; Hutchinson, AL; Cho, AY. Methane concentration and isotopic composition measurements with a mid-infrared quantum-cascade laser. Opt. Lett 1999, 24, 1762–1764. [Google Scholar]
- Bergamaschi, P; Harris, GM. Measurements of stable isotope ratios (13CH4/12CH4 and 12CH3D/12CH4) in landfill methane using tunable diode laser absorption spectrometer. Glob. Biogeochem. Cycl 1995, 9, 439–447. [Google Scholar]
- Bergamaschi, P; Schupp, M; Harris, GM. High-precision direct measurements of 13CH4/12CH4 and 12CH3D/12CH4 ratios in atmospheric methane sources by means of a long-path tunable diode-laser absorption spectrometer. Appl. Opt 1994, 33, 7704–7716. [Google Scholar]
- Bomse, DS; Stanton, AC; Silver, JA. Frequency-modulation and wavelength modulation spectroscopies—Comparison of experimental methods using a lead-salt diode-laser. Appl. Opt 1992, 31, 718–731. [Google Scholar]
- Silver, JA. Frequency-modulation spectroscopy for trace species detection—Theory and comparison among experimental methods. Appl. Opt 1992, 31, 707–717. [Google Scholar]
- Weidmann, D; Wysocki, G; Oppenheimer, C; Tittel, FK. Development of a compact quantum cascade laser spectrometer for field measurements of CO2 isotopes. Appl. Phys. B 2005, 80, 255–260. [Google Scholar]
- McManus, JB; Zahniser, MS; Nelson, DD; Williams, LR; Kolb, CE. Infrared laser spectrometer with balanced absorption for measurement of isotopic ratios of carbon gases. Spectrochim. Acta A 2002, 58, 2465–2479. [Google Scholar]
- Rothman, LS; Gordon, IE; Barbe, A; Benner, DC; Bernath, PE; Birk, M; Boudon, V; Brown, LR; Campargue, A; Champion, J-P; Chance, K; Coudert, LH; Dana, V; Devi, VM; Fally, S; Flaud, J-M; Gamache, RR; Goldman, A; Jacquemart, D; Kleiner, I; Lacome, N; Lafferty, WJ; Mandin, J-Y; Massie, ST; Mikhailenko, SN; Miller, CE; Moazzen-Ahmadi, N; Naumenko, OV; Nikitin, AV; Orphal, J; Perevalov, VI; Perrin, A; Predoi-Cross, A; Rinsland, CP; Rotger, M; Simecková, M; Smith, MAH; Sung, K; Tashkun, SA; Tennyson, J; Toth, RA; Vandaele, AC; Vander Auwera, J. The HITRAN 2008 molecular spectroscopic database. J. Quant. Spectrosc. Radiat. Transfer 2009, 110, 533–572. [Google Scholar]
- Handbook of Stable Isotope Analytical Techniques, 1st ed; de Groot, PA (Ed.) Elsevier: Amsterdam, The Netherlands, 2004.


| Assignment | Wavenumber [cm−1] | Line intensity @296 K [cm−1/(molecule·cm−2) ] | Lower-level energy [cm−1] |
|---|---|---|---|
| 12CH4 2ν2 P(14) F1(1) | 2950.4819 | 2.826 × 10⁻²⁴ | 1095.6320 |
| *12CH4 ν2 + ν4 R(6) F1(1) | 2950.5318 | 1.354 × 10⁻²² | 219.9411 |
| 12CH4ν3 + ν4 − ν4 P(6) E | 2950.5519 | 2.914 × 10⁻²³ | 1521.2847 |
| 12CH4ν2 + ν3 − ν2 P(5) E | 2950.5596 | 4.464 × 10⁻²⁴ | 1692.8063 |
| 12CH4ν2 + ν4 R(6) E | 2950.5775 | 8.566 × 10⁻²⁵ | 219.9133 |
| 12CH4ν3 + ν4 − ν4 P(11) F2(1) | 2950.6175 | 5.102 × 10⁻²⁵ | 1935.4170 |
| 12CH4ν3 + ν4 − ν4 P(9) A2(2) | 2950.6428 | 1.415 × 10⁻²⁴ | 1773.7814 |
| 12CH3D ν4 pP (8,2) | 2950.6489 | 6.712 × 10⁻²⁴ | 284.5492 |
| 12CH4ν2 + ν4 R(9) F1(3) | 2950.6601 | 4.011 × 10⁻²³ | 470.8548 |
| 12CH3D 2ν5 rQ (9,1) | 2950.7784 | 1.872 × 10⁻²⁵ | 350.1516 |
| 12CH4ν2 + ν4 R(9) F1(1) | 2950.7982 | 5.009 × 10⁻²⁵ | 470.7167 |
| 12CH4ν3 + ν4 − ν4 P(12) A2(1) | 2950.8021 | 2.272 × 10⁻²⁵ | 2101.1899 |
| *12CH3D ν4 PP (7,6) | 2950.8508 | 2.734 × 10⁻²³ | 266.3169 |
| 12CH4ν3 + ν4 − ν4 P(9) F2(5) | 2950.8548 | 2.280 × 10⁻²⁵ | 1775.9617 |
| 12CH4ν1 + ν4 − ν4 R(7) F2(3) | 2950.8627 | 1.447 × 10⁻²⁴ | 1599.2841 |
© 2010 by the authors licensee MDPI, Basel, Switzerland. This article is an open access article distributed under the terms and conditions of the Creative Commons Attribution license (http://creativecommons.org/licenses/by/3.0/).
Share and Cite
Tsuji, K.; Teshima, H.; Sasada, H.; Yoshida, N. An Efficient and Compact Difference-Frequency-Generation Spectrometer and Its Application to 12CH3D/12CH4 Isotope Ratio Measurements. Sensors 2010, 10, 6612-6622. https://doi.org/10.3390/s100706612
Tsuji K, Teshima H, Sasada H, Yoshida N. An Efficient and Compact Difference-Frequency-Generation Spectrometer and Its Application to 12CH3D/12CH4 Isotope Ratio Measurements. Sensors. 2010; 10(7):6612-6622. https://doi.org/10.3390/s100706612
Chicago/Turabian StyleTsuji, Kiyoshi, Hiroaki Teshima, Hiroyuki Sasada, and Naohiro Yoshida. 2010. "An Efficient and Compact Difference-Frequency-Generation Spectrometer and Its Application to 12CH3D/12CH4 Isotope Ratio Measurements" Sensors 10, no. 7: 6612-6622. https://doi.org/10.3390/s100706612